Embed Size (px)
Citation preview

The Global Economy
Business Cycle Indicators
© NYU Stern School of Business

Bloomberg calendar
• Why do we look at this stuff?
http://www.bloomberg.com/markets/ecalendar/index.html

Plan of attack
• Bloomberg calendar • Business cycle overview
• Pictures
• Forecasting
• Good indicators (the “cross-correlation function”)
• Forecasting revisited
• What have we learned?

Business cycle overview
Indicators Monetary Policy
Current Conditions
Theory: AS & AD
Future Conditions
Statistical Analysis

US GDP
Source: BEA via FRED.

US GDP growth (year-on-year)
Source: BEA via FRED.

Components of US GDP growth
Source: BEA via FRED.
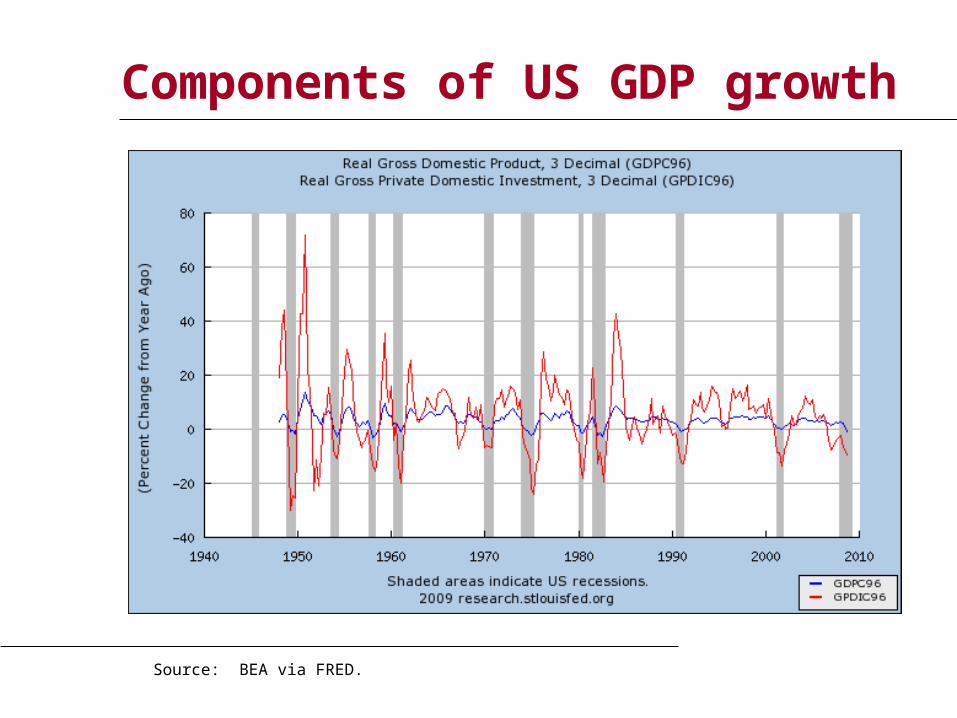
Components of US GDP growth
Source: BEA via FRED.

Employment (month-to-month change)
Source: BLS.
-100
0-5
000
500
Tho
usa
nds
1990 1992 1994 1996 1998 2000 2002 2004 2006 2008
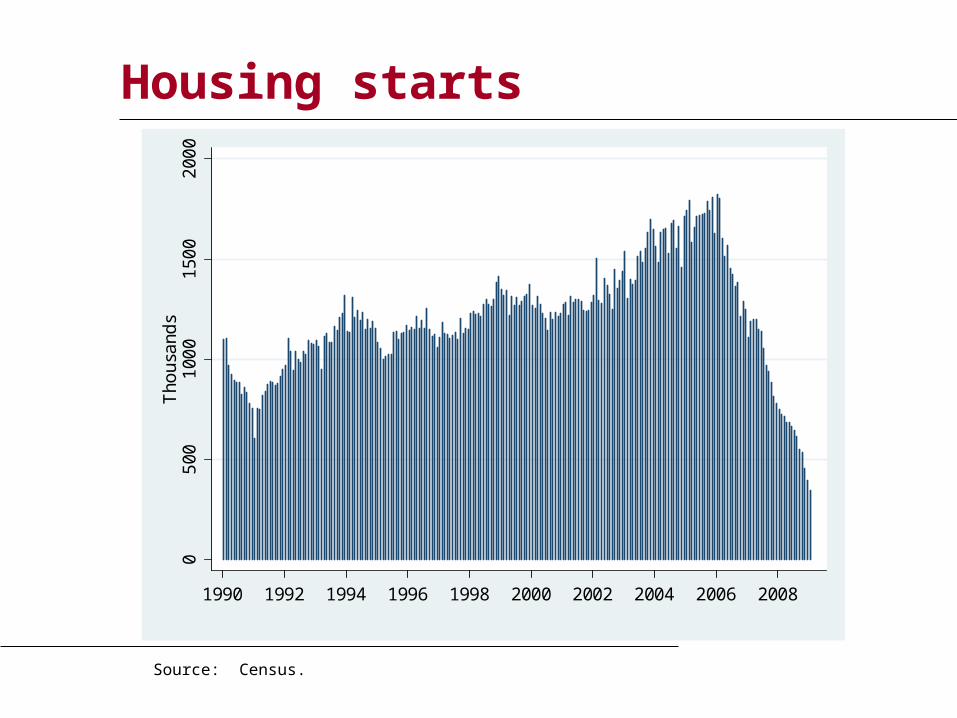
Housing starts
Source: Census.
05
001
000
150
02
000
Tho
usa
nds
1990 1992 1994 1996 1998 2000 2002 2004 2006 2008
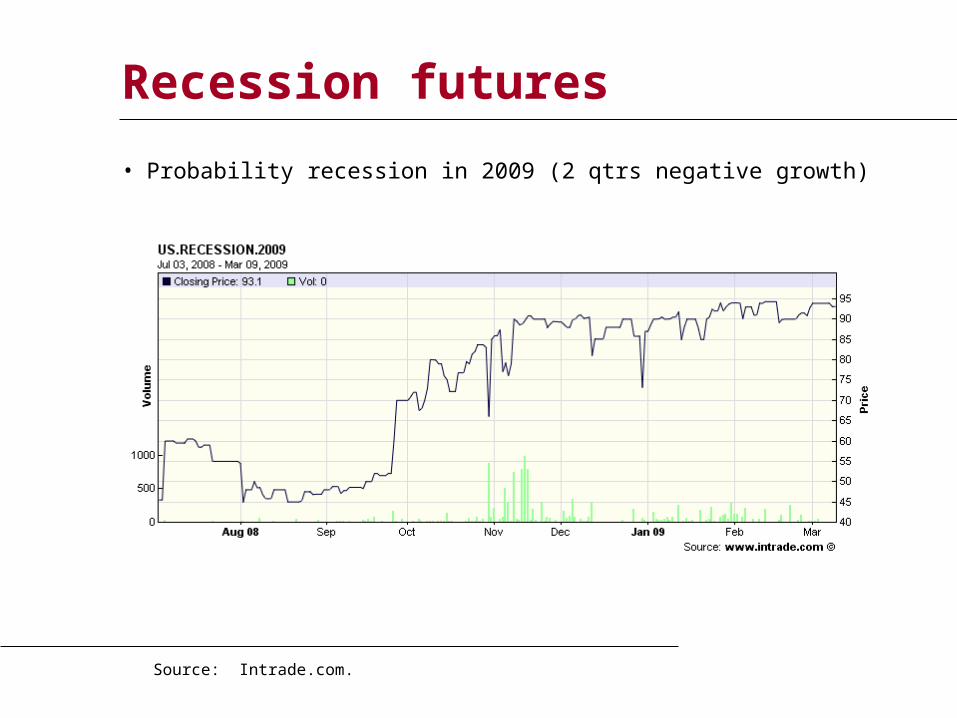
Recession futures
• Probability recession in 2009 (2 qtrs negative growth)
Source: Intrade.com.
Forecasting
• Can we forecast future economic conditions?
– Use information about the past & present to predict the future
• Basic idea: use patterns in the data
– In the past, “this” was followed by “that”
Forecasting: example
• Example: growth in industrial production (“IP”)
γt,t+k = log(IPt+k/IPt)/k = k-period growth rate in IP
• Why? How?

Forecasting: regressions
• Reminder: we’re forecasting
γt,t+k = log(IPt+k/IPt)/k = k-period growth rate in IP
[set k=12 months?]
• Estimate the regression
γt,t+k = a + b xt + residual
xt is an “indicator” of your choice
• Standard software produces estimates of a and b
• Note timing!!

Forecasting: fancy regressions
• Basic regression
γt,t+k = a + b xt + residual
– γt,t+k is what we’re trying to forecast
– xt is an “indicator” of your choice
• Variations – Use more than one x
– Add lags of x
– Add lags of γ
– Whatever works!
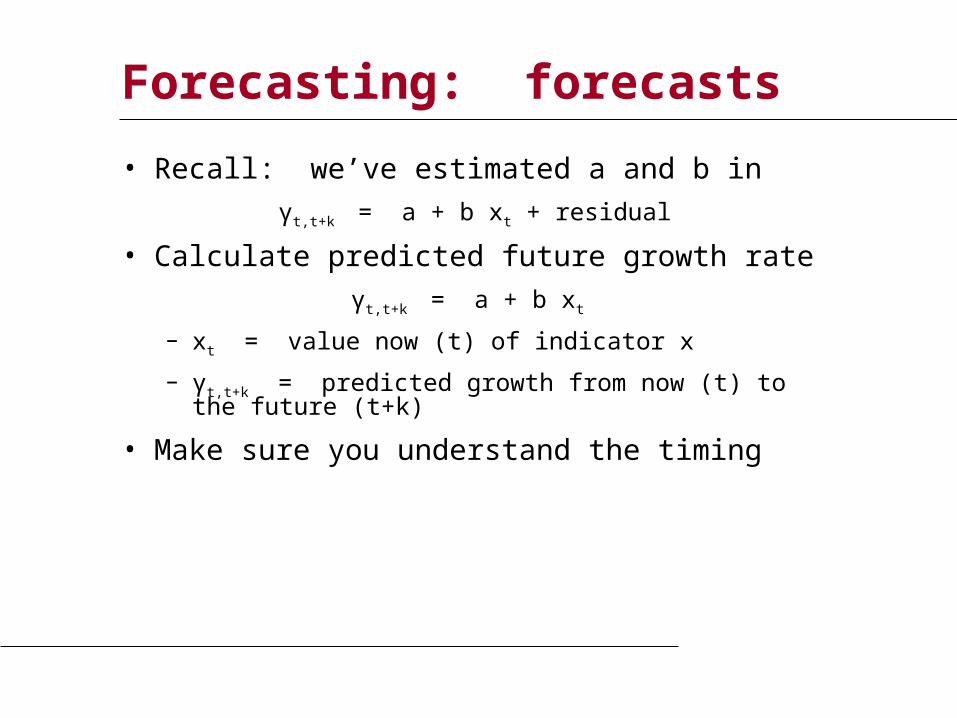
Forecasting: forecasts
• Recall: we’ve estimated a and b in
γt,t+k = a + b xt + residual
• Calculate predicted future growth rate
γt,t+k = a + b xt
– xt = value now (t) of indicator x
– γt,t+k = predicted growth from now (t) to the future (t+k)
• Make sure you understand the timing

Identifying good indicators
• What would you suggest? Why?

Identifying good indicators
• How do you find good indicators?
– Forecasting requires indicators that lead what you’re forecasting
– Ask friends, read reports, look at “cross-correlation function”

Identifying good indicators
Leads IP Lags IP
-1.0
0-0
.50
0.0
00
.50
1.0
0
-1.0
0-0
.50
0.0
00
.50
1.0
0C
ross
-Cor
rela
tion
with
IP
-20 -10 0 10 20Lag in Months Relative to Industrial Production
Nonfarm EmploymentCorrelations for Random Indicator X

Identifying good indicators
• Cross-correlation function (“ccf”)
– Correlations between two variables at different times
ccf(k) = Corr(xt,yt-k)
[plot this against k]
– If k<0: x leads y [or y lags x]
– If k>0: x lags y [or y leads x]

Identifying good indicators
• Pictures: plot ccf(k) v k
– y = IP growth
– x = indicator
– Does indicator lead or lag IP growth?

Identifying good indicators
• Mechanics of ccf calculations: see spreadsheet
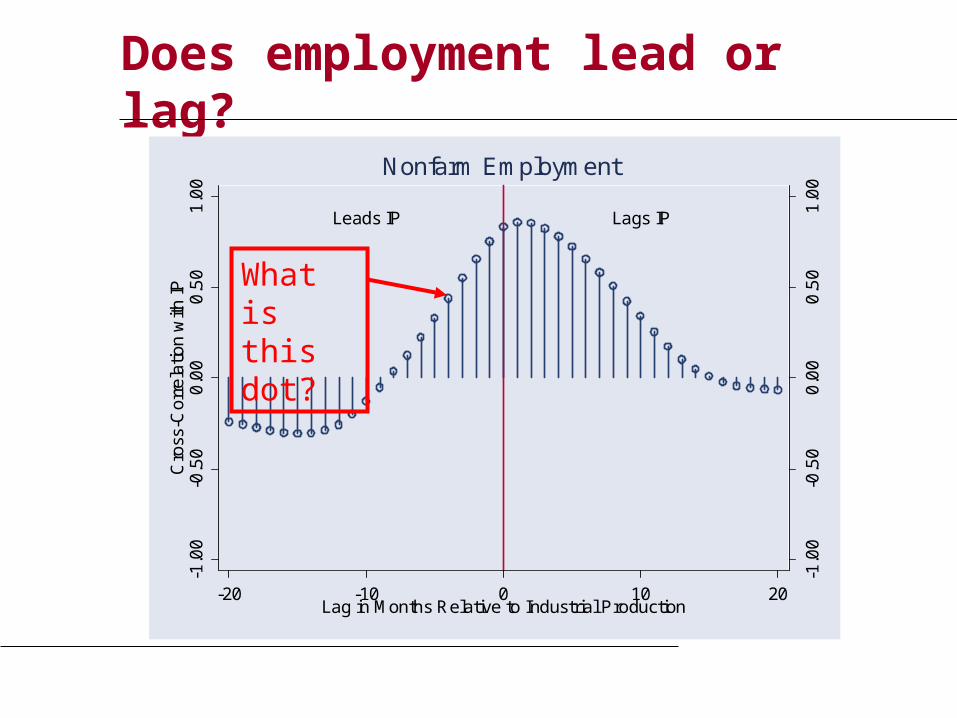
Does employment lead or lag?
Leads IP Lags IP
-1.0
0-0
.50
0.0
00
.50
1.0
0
-1.0
0-0
.50
0.0
00
.50
1.0
0C
ross
-Cor
rela
tion
with
IP
-20 -10 0 10 20Lag in Months Relative to Industrial Production
Nonfarm Employment
What is this dot?

Computing cross-correlations
Reminder: • ccf(k) = corr[x(t),y(t-k)]
For k = 0: • ccf(0) = corr[x(t),y(t)]
Use data marked • Red for x• Blue for y
Date x(t) y(t)
1 2.43 8.47
2 1.19 2.29
3 0.13 7.36
4 0.56 6.39
5 0.38 6.02
6 0.96 0.22
7 1.87 3.60

Computing cross-correlations
Reminder: • ccf(k) = corr[x(t),y(t-k)]
For k = +1: • ccf(1) = corr[x(t),y(t-1)] • Means: x lags y
Use data marked • Red for x• Blue for y
Date x(t) y(t)
1 2.43 8.47
2 1.19 2.29
3 0.13 7.36
4 0.56 6.39
5 0.38 6.02
6 0.96 0.22
7 1.87 3.60

Computing cross-correlations
Reminder: • ccf(k) = corr[x(t),y(t-k)]
For k = –1: • ccf(-1) =
corr[x(t),y(t+1)] • Means: y lags x
Use data marked • Red for x• Blue for y
Date x(t) y(t)
1 2.43 8.47
2 1.19 2.29
3 0.13 7.36
4 0.56 6.39
5 0.38 6.02
6 0.96 0.22
7 1.87 3.60
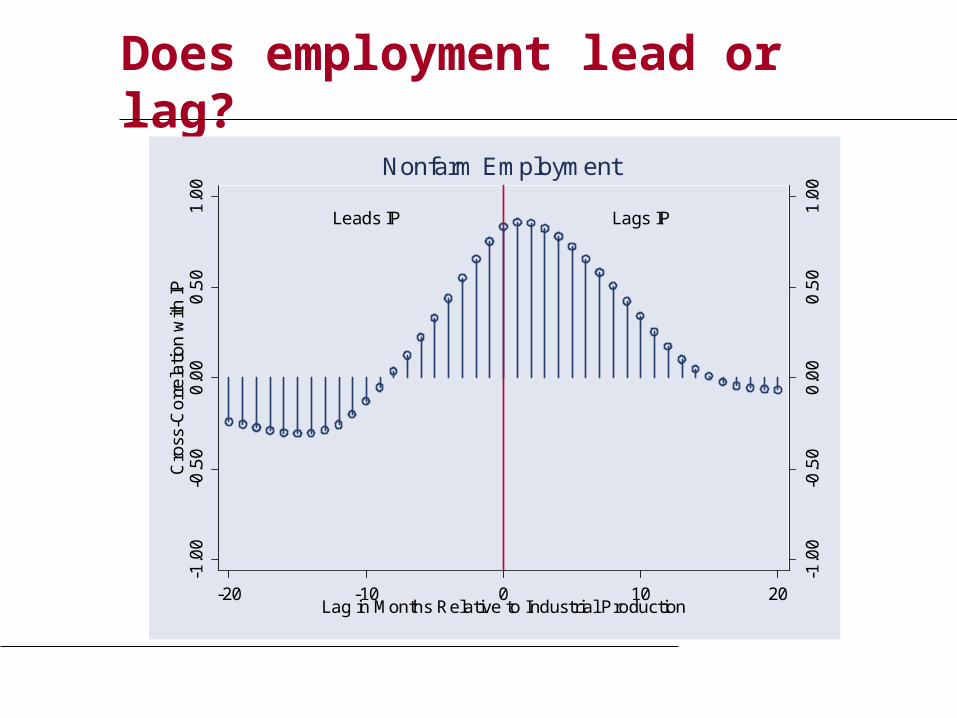
Does employment lead or lag?
Leads IP Lags IP
-1.0
0-0
.50
0.0
00
.50
1.0
0
-1.0
0-0
.50
0.0
00
.50
1.0
0C
ross
-Cor
rela
tion
with
IP
-20 -10 0 10 20Lag in Months Relative to Industrial Production
Nonfarm Employment

Unemployment?
Leads IP Lags IP
-1.0
0-0
.50
0.0
00
.50
1.0
0
-1.0
0-0
.50
0.0
00
.50
1.0
0C
ross
-Cor
rela
tion
with
IP
-20 -10 0 10 20Lag in Months Relative to IP
Unemployment Rate

New claims for un ins?
Leads IP Lags IP
-1.0
0-0
.50
0.0
00
.50
1.0
0
-1.0
0-0
.50
0.0
00
.50
1.0
0C
ross
-Cor
rela
tion
with
IP
-20 -10 0 10 20Lag in Months Relative to IP
Unemployment: New Claims

Housing starts?
Leads IP Lags IP
-1.0
0-0
.50
0.0
00
.50
1.0
0
-1.0
0-0
.50
0.0
00
.50
1.0
0C
ross
-Cor
rela
tion
with
IP
-20 -10 0 10 20Lag in Months Relative to Industrial Production
Housing Starts

Building permits?
Leads IP Lags IP
-1.0
0-0
.50
0.0
00
.50
1.0
0
-1.0
0-0
.50
0.0
00
.50
1.0
0C
ross
-Cor
rela
tion
with
IP
-20 -10 0 10 20Lag in Months Relative to Industrial Production
Building Permits

Consumer sentiment?
Leads IP Lags IP
-1.0
0-0
.50
0.0
00
.50
1.0
0
-1.0
0-0
.50
0.0
00
.50
1.0
0C
ross
-Cor
rela
tion
with
IP
-20 -10 0 10 20Lag in Months Relative to Industrial Production
Consumer Sentiment

S&P 500 index?
Leads IP Lags IP
-1.0
0-0
.50
0.0
00
.50
1.0
0
-1.0
0-0
.50
0.0
00
.50
1.0
0C
ross
-Cor
rela
tion
with
Indu
stri
al P
rodu
ctio
n
-20 -10 0 10 20Lag in Months Relative to Industrial Production
S&P 500 Index

Yield spread?
Leads IP Lags IP
-1.0
0-0
.50
0.0
00
.50
1.0
0
-1.0
0-0
.50
0.0
00
.50
1.0
0C
ross
-Cor
rela
tion
with
Indu
stri
al P
rodu
ctio
n
-20 -10 0 10 20Lag Relative to IP
Yield Spread (10y - Fed Funds)
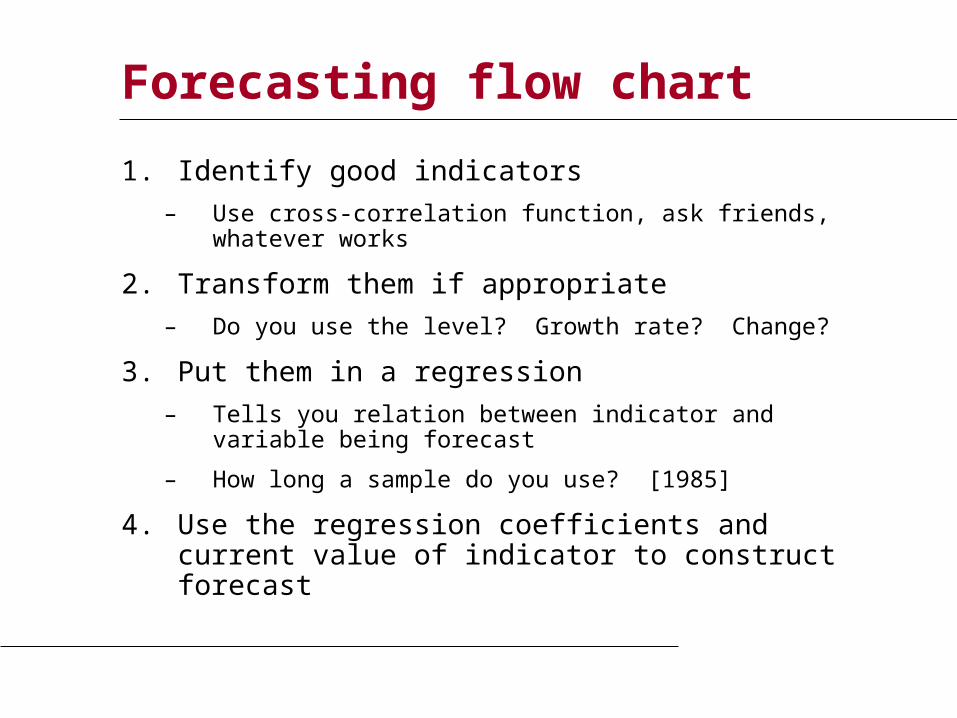
Forecasting flow chart
1. Identify good indicators
– Use cross-correlation function, ask friends, whatever works
2. Transform them if appropriate
– Do you use the level? Growth rate? Change?
3. Put them in a regression
– Tells you relation between indicator and variable being forecast
– How long a sample do you use? [1985]
4. Use the regression coefficients and current value of indicator to construct forecast

How well do we do?
• Forecasts have content
– Typical R2 > 0, < 0.50
– Most of what happens is not predicted
• Therefore: have a contingency plan

What have we learned?
Takeaways
• Good indicators tell us something about the future
• Even the best forecasts leave lots of uncertainty
• Useful tools:
– Regressions
– Cross-correlation function

Enjoy the break
• See you in a couple weeks