Embed Size (px)
Citation preview
The Global Economic Outlook
Tim Quinlan, EconomistApril 14, 2010
2Economics
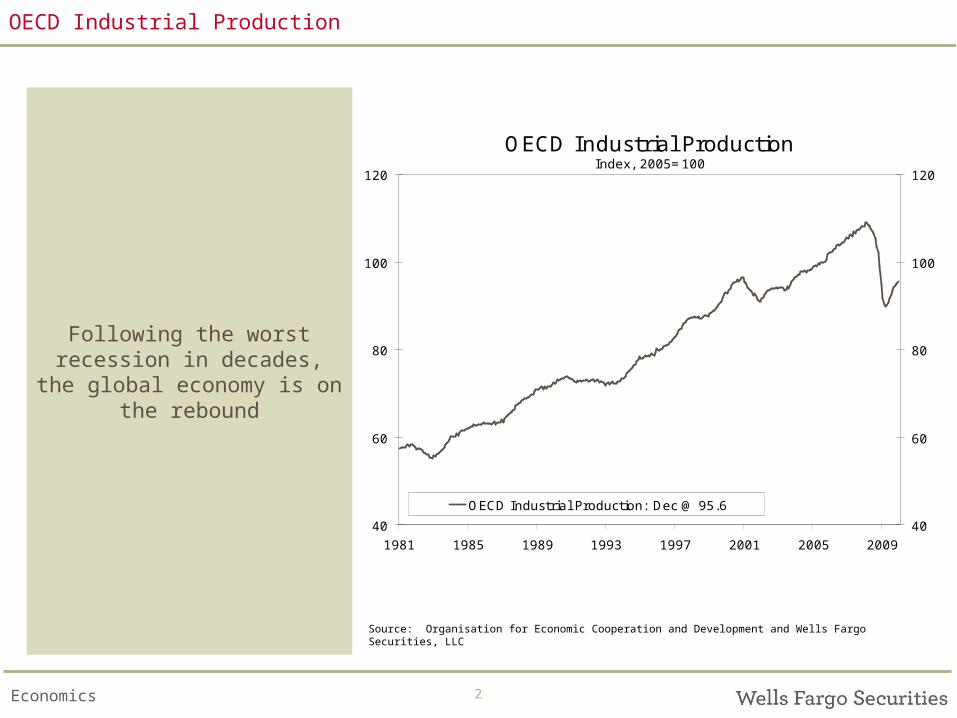
OECD Industrial ProductionIndex, 2005=100
40
60
80
100
120
1981 1985 1989 1993 1997 2001 2005 2009
40
60
80
100
120
OECD Industrial Production: Dec @ 95.6
OECD Industrial Production
Following the worst recession in decades, the global economy is on the
rebound
Source: Organisation for Economic Cooperation and Development and Wells Fargo Securities, LLC
3Economics
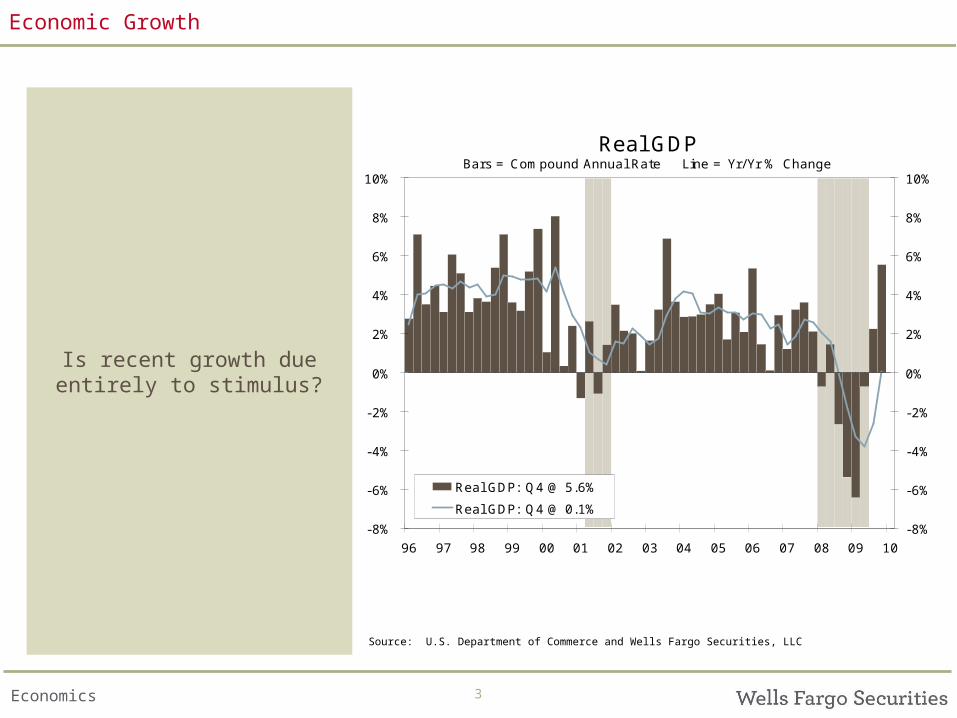
Real GDPBars = Compound Annual Rate Line = Yr/Yr % Change
-8%
-6%
-4%
-2%
0%
2%
4%
6%
8%
10%
96 97 98 99 00 01 02 03 04 05 06 07 08 09 10
-8%
-6%
-4%
-2%
0%
2%
4%
6%
8%
10%
Real GDP: Q4 @ 5.6%
Real GDP: Q4 @ 0.1%
Economic Growth
Is recent growth due entirely to stimulus?
Source: U.S. Department of Commerce and Wells Fargo Securities, LLC
4Economics
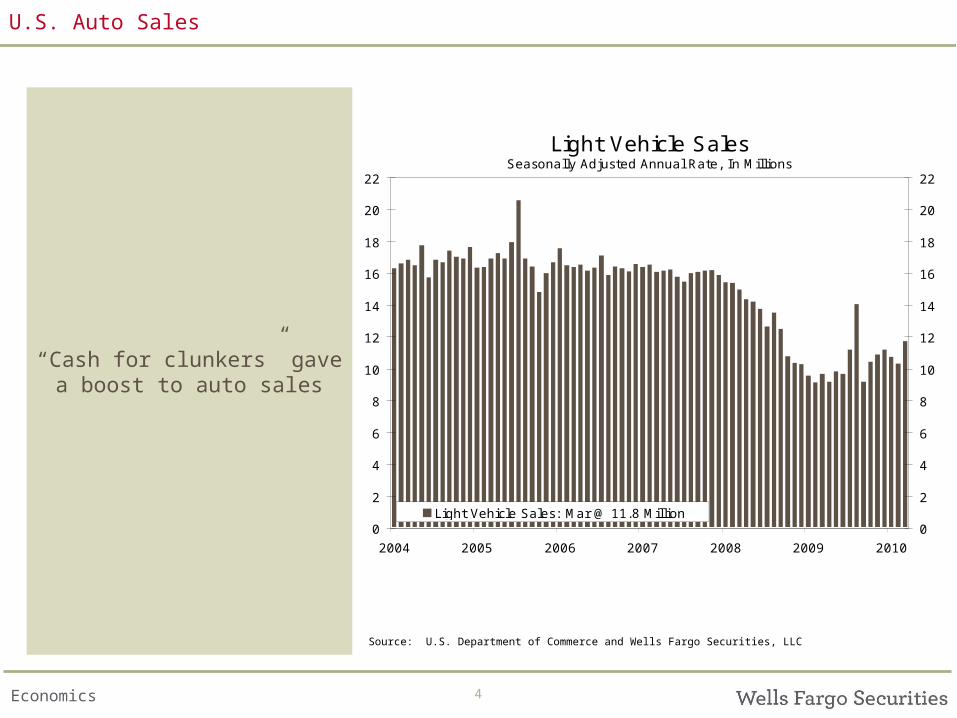
Light Vehicle SalesSeasonally Adjusted Annual Rate, In Millions
0
2
4
6
8
10
12
14
16
18
20
22
2004 2005 2006 2007 2008 2009 2010
0
2
4
6
8
10
12
14
16
18
20
22
Light Vehicle Sales: Mar @ 11.8 Million
U.S. Auto Sales
“Cash for clunkers” gave a boost to auto sales
Source: U.S. Department of Commerce and Wells Fargo Securities, LLC
5Economics
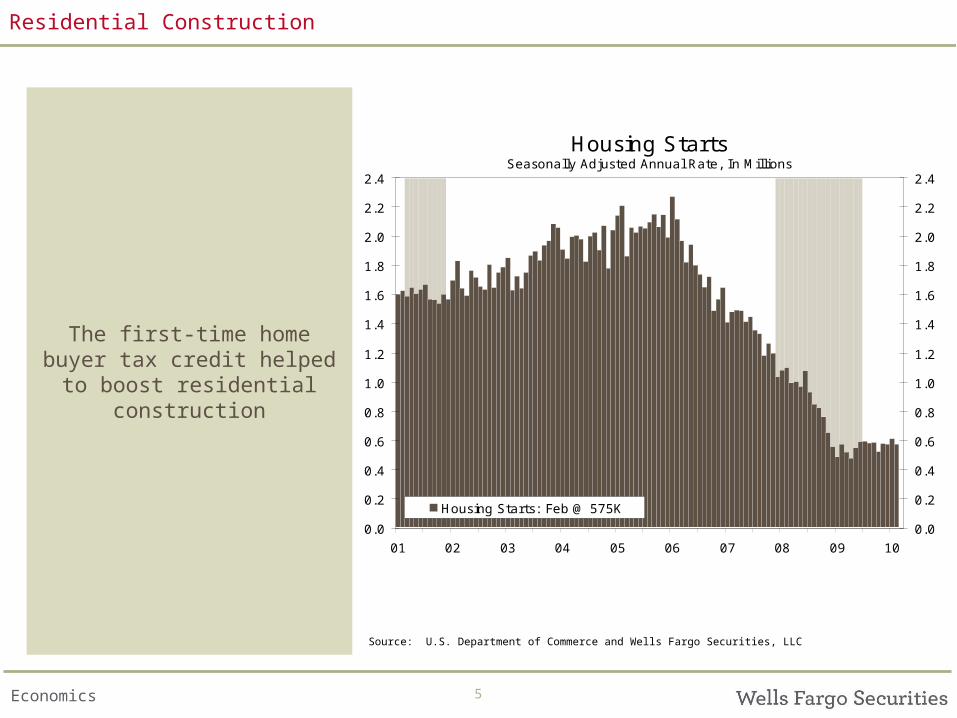
Housing Starts Seasonally Adjusted Annual Rate, In Millions
0.0
0.2
0.4
0.6
0.8
1.0
1.2
1.4
1.6
1.8
2.0
2.2
2.4
01 02 03 04 05 06 07 08 09 10
0.0
0.2
0.4
0.6
0.8
1.0
1.2
1.4
1.6
1.8
2.0
2.2
2.4
Housing Starts: Feb @ 575K
Residential Construction
The first-time home buyer tax credit helped to boost residential construction
Source: U.S. Department of Commerce and Wells Fargo Securities, LLC
6Economics
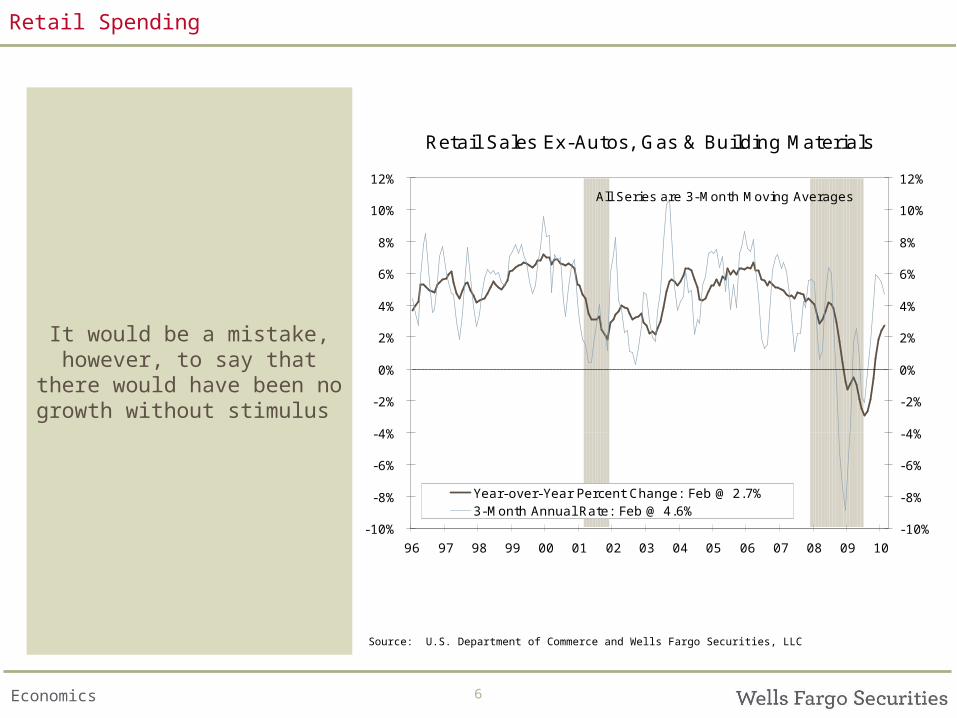
Retail Sales Ex-Autos, Gas & Building Materials
-10%
-8%
-6%
-4%
-2%
0%
2%
4%
6%
8%
10%
12%
96 97 98 99 00 01 02 03 04 05 06 07 08 09 10
-10%
-8%
-6%
-4%
-2%
0%
2%
4%
6%
8%
10%
12%
Year-over-Year Percent Change: Feb @ 2.7%3-Month Annual Rate: Feb @ 4.6%
All Series are 3-Month Moving Averages
Retail Spending
It would be a mistake, however, to say that there
would have been no growth without stimulus
Source: U.S. Department of Commerce and Wells Fargo Securities, LLC
7Economics
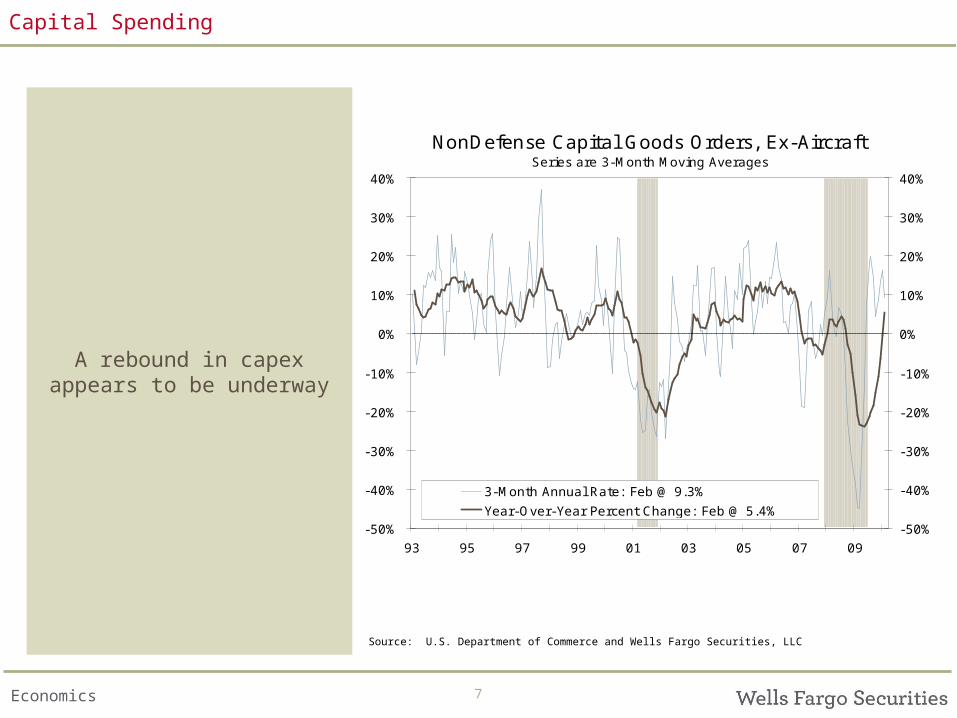
NonDefense Capital Goods Orders, Ex-AircraftSeries are 3-Month Moving Averages
-50%
-40%
-30%
-20%
-10%
0%
10%
20%
30%
40%
93 95 97 99 01 03 05 07 09
-50%
-40%
-30%
-20%
-10%
0%
10%
20%
30%
40%
3-Month Annual Rate: Feb @ 9.3%
Year-Over-Year Percent Change: Feb @ 5.4%
Capital Spending
A rebound in capex appears to be underway
Source: U.S. Department of Commerce and Wells Fargo Securities, LLC
8Economics
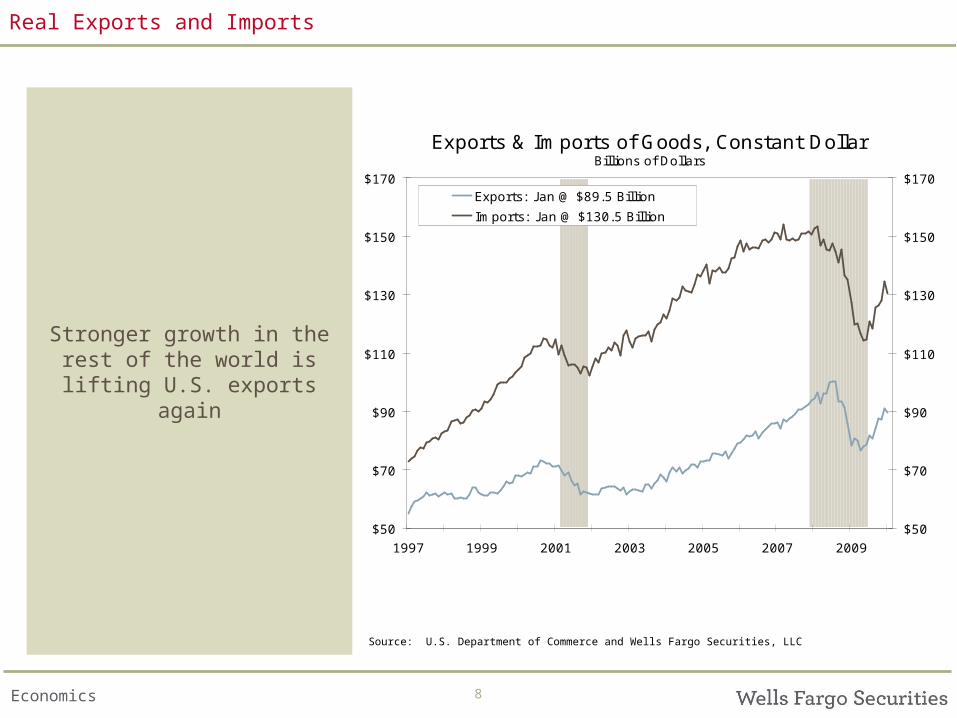
Exports & Imports of Goods, Constant Dollar Billions of Dollars
$50
$70
$90
$110
$130
$150
$170
1997 1999 2001 2003 2005 2007 2009
$50
$70
$90
$110
$130
$150
$170Exports: J an @ $89.5 Billion
Imports: J an @ $130.5 Billion
Real Exports and Imports
Stronger growth in the rest of the world is lifting U.S.
exports again
Source: U.S. Department of Commerce and Wells Fargo Securities, LLC
9Economics
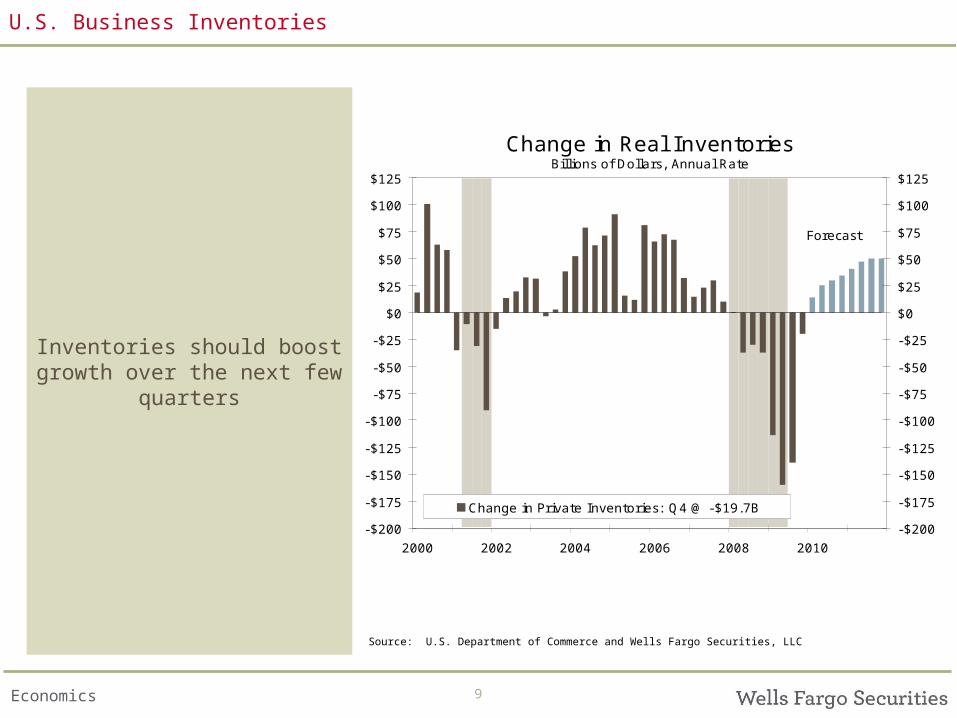
Change in Real Inventories Billions of Dollars, Annual Rate
-$200
-$175
-$150
-$125
-$100
-$75
-$50
-$25
$0
$25
$50
$75
$100
$125
2000 2002 2004 2006 2008 2010
-$200
-$175
-$150
-$125
-$100
-$75
-$50
-$25
$0
$25
$50
$75
$100
$125
Change in Private Inventories: Q4 @ -$19.7B
Forecast
U.S. Business Inventories
Inventories should boost growth over the next few
quarters
Source: U.S. Department of Commerce and Wells Fargo Securities, LLC
10Economics
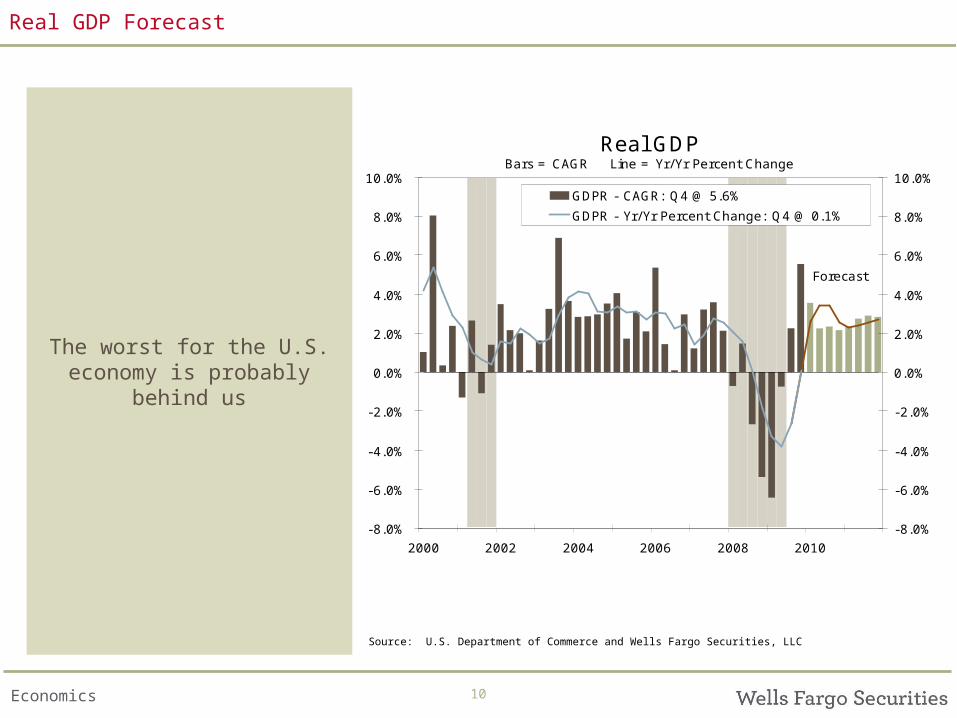
Real GDP Bars = CAGR Line = Yr/Yr Percent Change
-8.0%
-6.0%
-4.0%
-2.0%
0.0%
2.0%
4.0%
6.0%
8.0%
10.0%
2000 2002 2004 2006 2008 2010
-8.0%
-6.0%
-4.0%
-2.0%
0.0%
2.0%
4.0%
6.0%
8.0%
10.0%GDPR - CAGR: Q4 @ 5.6%
GDPR - Yr/Yr Percent Change: Q4 @ 0.1%
Forecast
Real GDP Forecast
The worst for the U.S. economy is probably behind
us
Source: U.S. Department of Commerce and Wells Fargo Securities, LLC
11Economics
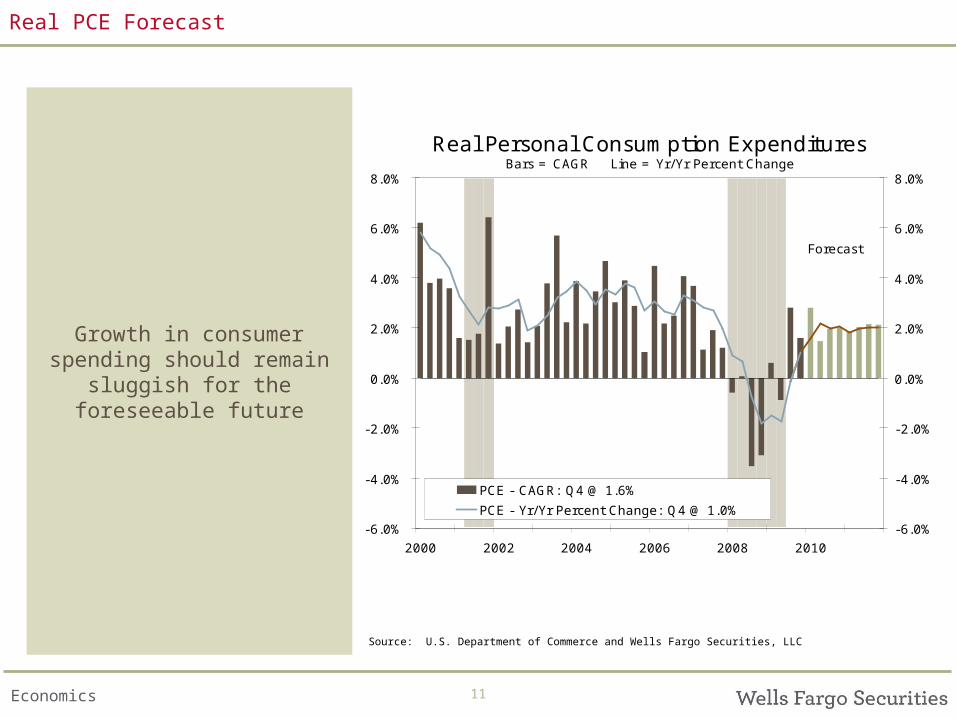
Real Personal Consumption ExpendituresBars = CAGR Line = Yr/Yr Percent Change
-6.0%
-4.0%
-2.0%
0.0%
2.0%
4.0%
6.0%
8.0%
2000 2002 2004 2006 2008 2010
-6.0%
-4.0%
-2.0%
0.0%
2.0%
4.0%
6.0%
8.0%
PCE - CAGR: Q4 @ 1.6%
PCE - Yr/Yr Percent Change: Q4 @ 1.0%
Forecast
Real PCE Forecast
Growth in consumer spending should remain
sluggish for the foreseeable future
Source: U.S. Department of Commerce and Wells Fargo Securities, LLC
12Economics
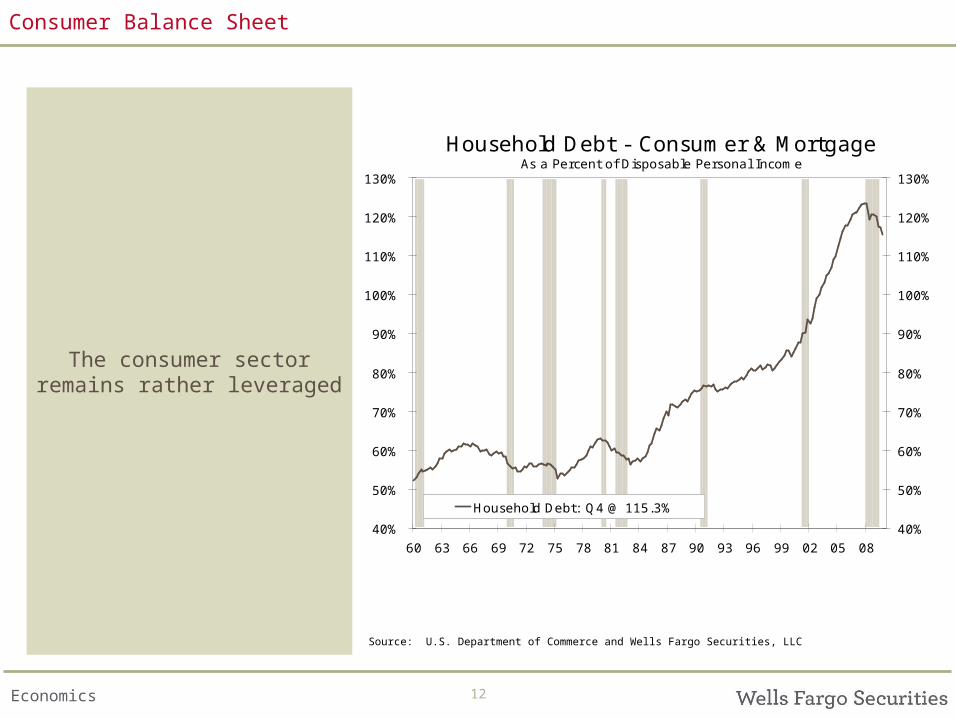
Household Debt - Consumer & MortgageAs a Percent of Disposable Personal Income
40%
50%
60%
70%
80%
90%
100%
110%
120%
130%
60 63 66 69 72 75 78 81 84 87 90 93 96 99 02 05 08
40%
50%
60%
70%
80%
90%
100%
110%
120%
130%
Household Debt: Q4 @ 115.3%
Consumer Balance Sheet
The consumer sector remains rather leveraged
Source: U.S. Department of Commerce and Wells Fargo Securities, LLC
13Economics
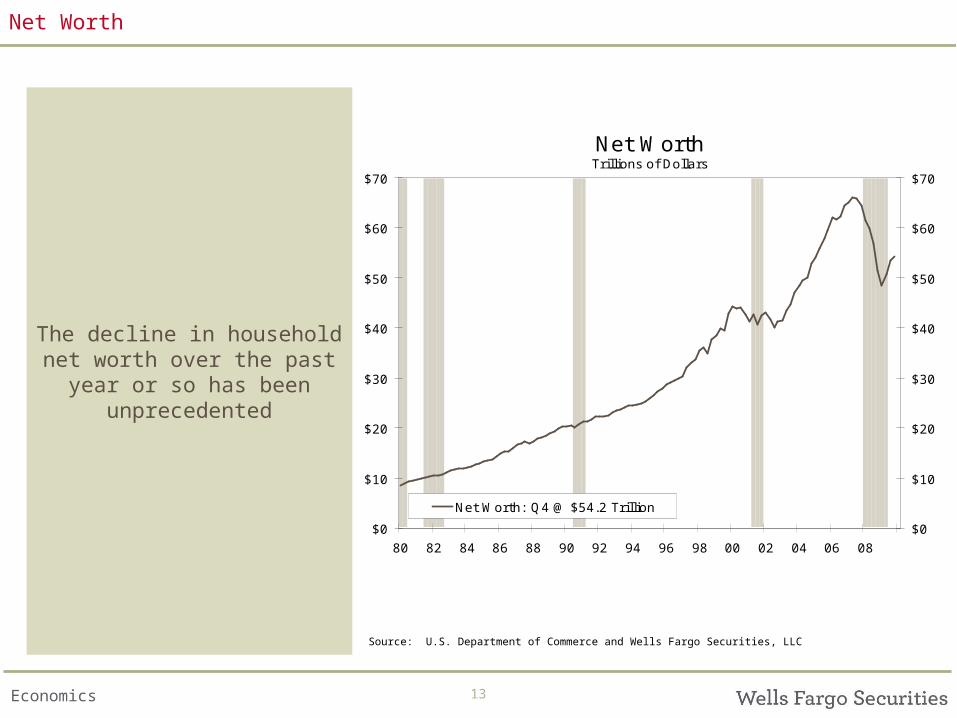
Net WorthTrillions of Dollars
$0
$10
$20
$30
$40
$50
$60
$70
80 82 84 86 88 90 92 94 96 98 00 02 04 06 08
$0
$10
$20
$30
$40
$50
$60
$70
Net Worth: Q4 @ $54.2 Trillion
Net Worth
The decline in household net worth over the past year
or so has been unprecedented
Source: U.S. Department of Commerce and Wells Fargo Securities, LLC
14Economics
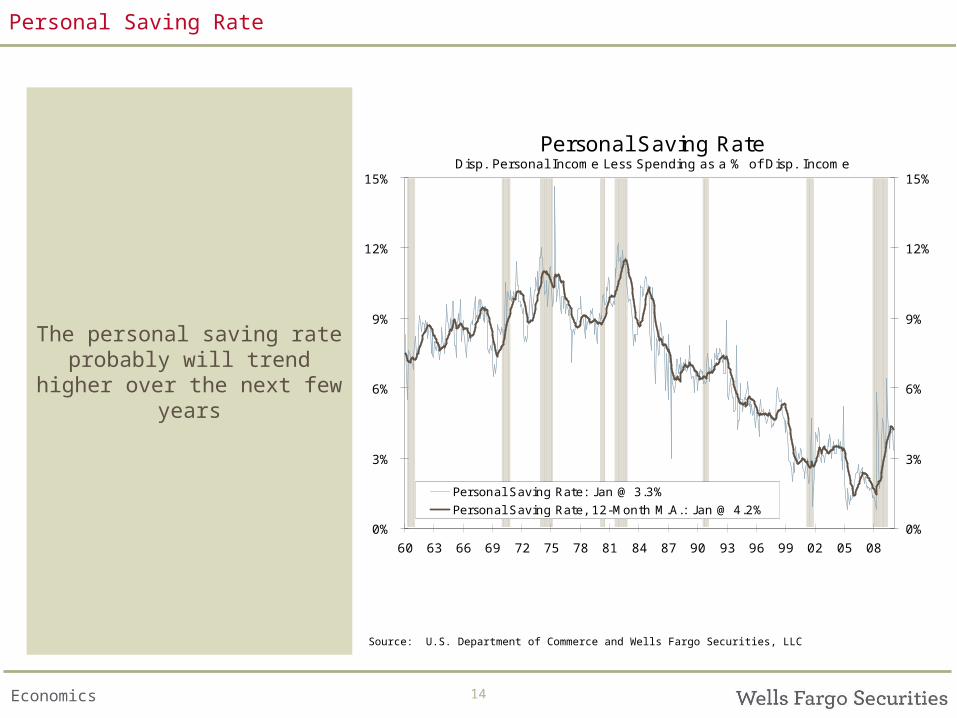
Personal Saving Rate Disp. Personal Income Less Spending as a % of Disp. Income
0%
3%
6%
9%
12%
15%
60 63 66 69 72 75 78 81 84 87 90 93 96 99 02 05 08
0%
3%
6%
9%
12%
15%
Personal Saving Rate: J an @ 3.3%
Personal Saving Rate, 12-Month M.A.: J an @ 4.2%
Personal Saving Rate
The personal saving rate probably will trend higher
over the next few years
Source: U.S. Department of Commerce and Wells Fargo Securities, LLC
15Economics
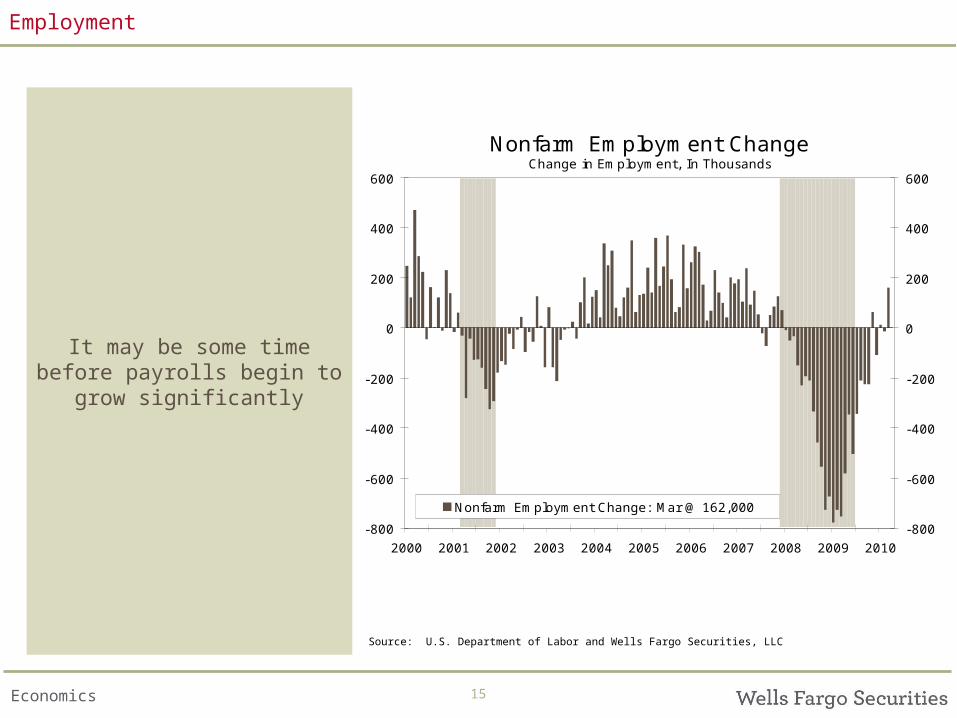
Nonfarm Employment ChangeChange in Employment, In Thousands
-800
-600
-400
-200
0
200
400
600
2000 2001 2002 2003 2004 2005 2006 2007 2008 2009 2010
-800
-600
-400
-200
0
200
400
600
Nonfarm Employment Change: Mar @ 162,000
Employment
It may be some time before payrolls begin to grow
significantly
Source: U.S. Department of Labor and Wells Fargo Securities, LLC
16Economics
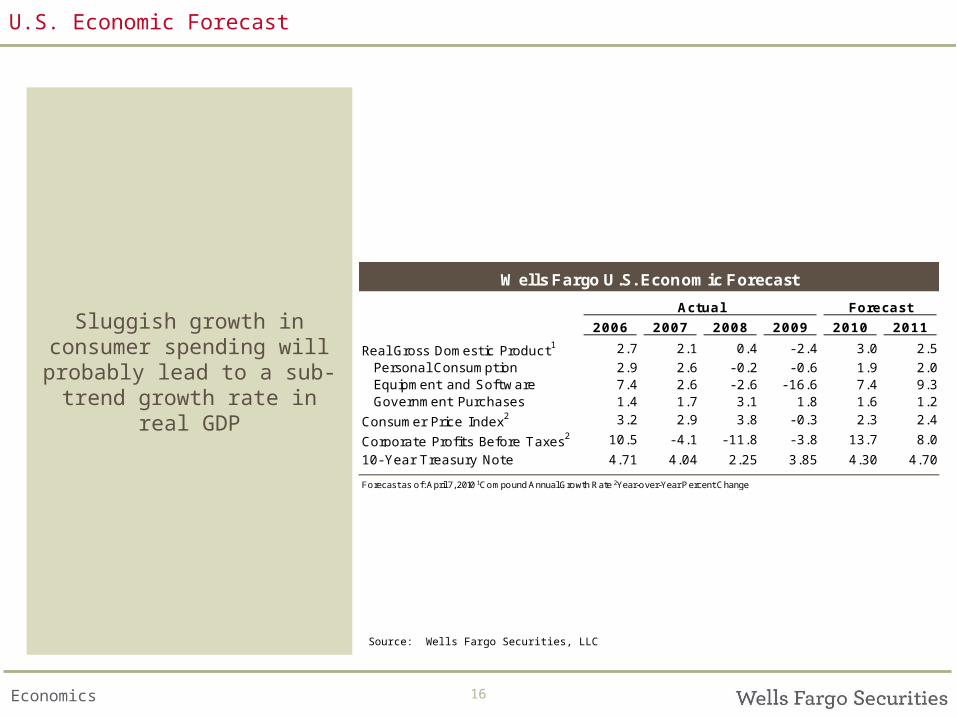
Wells Fargo U.S. Economic Forecast
Actual Forecast
2006 2007 2008 2009 2010 2011
Real Gross Domestic Product1 2.7 2.1 0.4 - 2.4 3.0 2.5
Personal Consumption 2.9 2.6 - 0.2 - 0.6 1.9 2.0Equipment and Software 7.4 2.6 - 2.6 - 16.6 7.4 9.3Government Purchases 1.4 1.7 3.1 1.8 1.6 1.2
Consumer Price Index2 3.2 2.9 3.8 - 0.3 2.3 2.4
Corporate Profits Before Taxes2 10.5 - 4.1 - 11.8 - 3.8 13.7 8.0
10- Year Treasury Note 4.71 4.04 2.25 3.85 4.30 4.70
Forecast as of: April 7, 2010 1Compound Annual Growth Rate 2Year-over-Year P ercent Change
U.S. Economic Forecast
Sluggish growth in consumer spending will
probably lead to a sub-trend growth rate in real GDP
Source: Wells Fargo Securities, LLC
17Economics
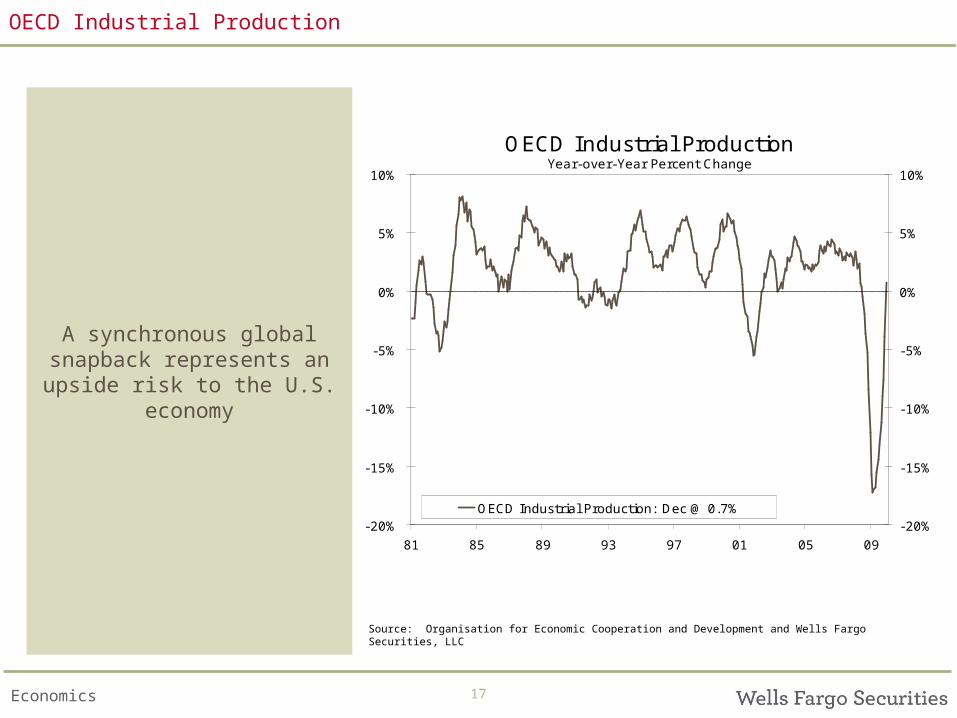
OECD Industrial ProductionYear-over-Year Percent Change
-20%
-15%
-10%
-5%
0%
5%
10%
81 85 89 93 97 01 05 09
-20%
-15%
-10%
-5%
0%
5%
10%
OECD Industrial Production: Dec @ 0.7%
OECD Industrial Production
A synchronous global snapback represents an upside risk to the U.S.
economy
Source: Organisation for Economic Cooperation and Development and Wells Fargo Securities, LLC
18Economics
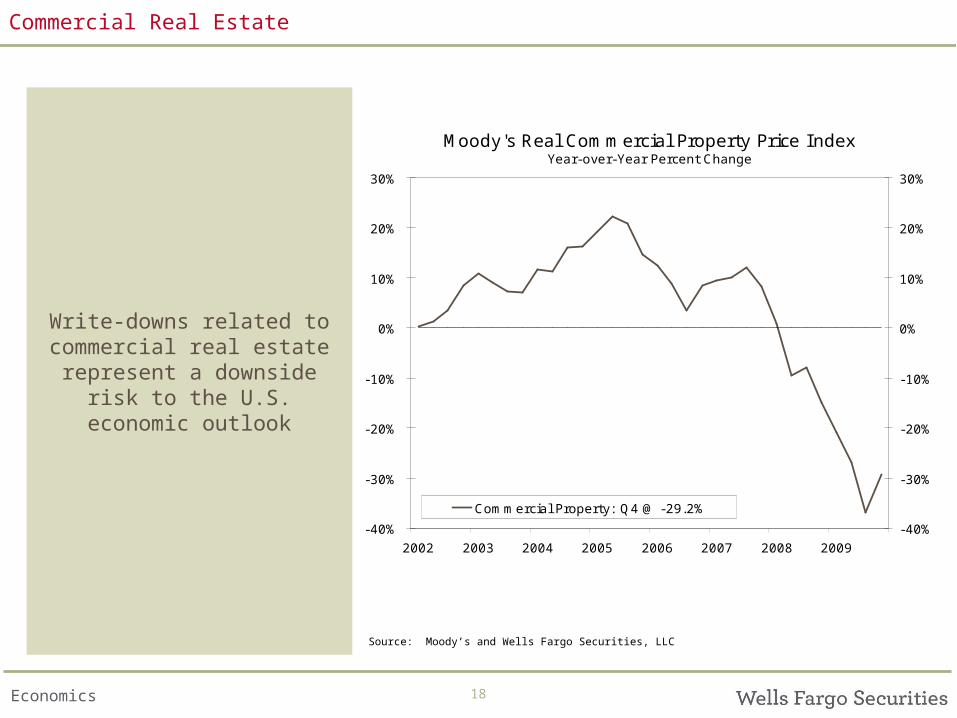
Moody's Real Commercial Property Price I ndexYear-over-Year Percent Change
-40%
-30%
-20%
-10%
0%
10%
20%
30%
2002 2003 2004 2005 2006 2007 2008 2009
-40%
-30%
-20%
-10%
0%
10%
20%
30%
Commercial Property: Q4 @ -29.2%
Commercial Real Estate
Write-downs related to commercial real estate
represent a downside risk to the U.S. economic
outlook
Source: Moody’s and Wells Fargo Securities, LLC
19Economics
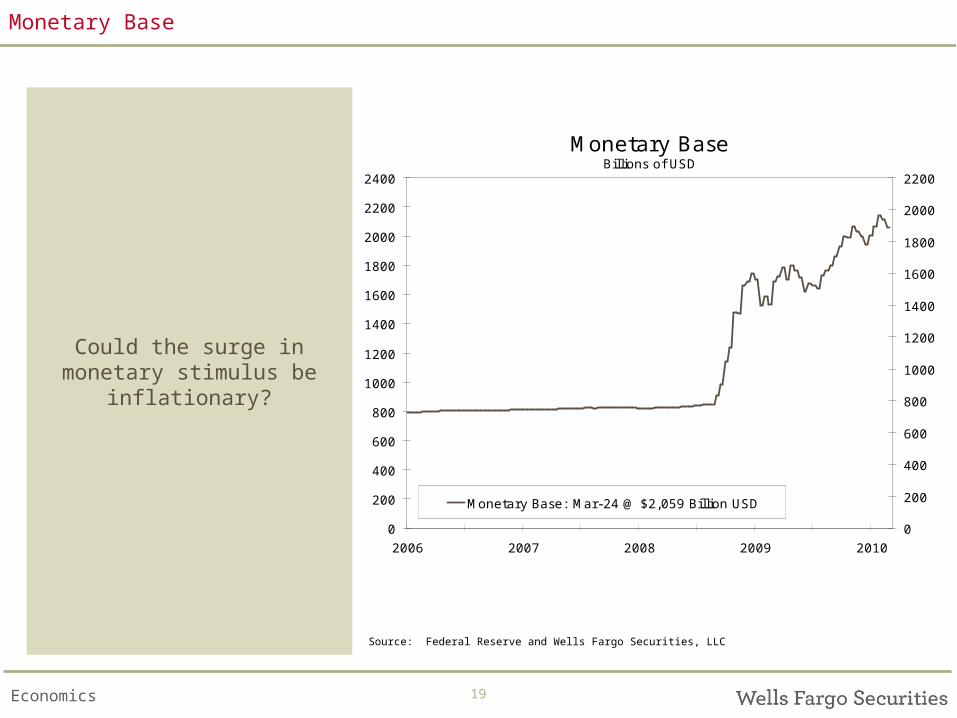
Monetary BaseBillions of USD
0
200
400
600
800
1000
1200
1400
1600
1800
2000
2200
2400
2006 2007 2008 2009 2010
0
200
400
600
800
1000
1200
1400
1600
1800
2000
2200
Monetary Base: Mar-24 @ $2,059 Billion USD
Monetary Base
Could the surge in monetary stimulus be
inflationary?
Source: Federal Reserve and Wells Fargo Securities, LLC
20Economics
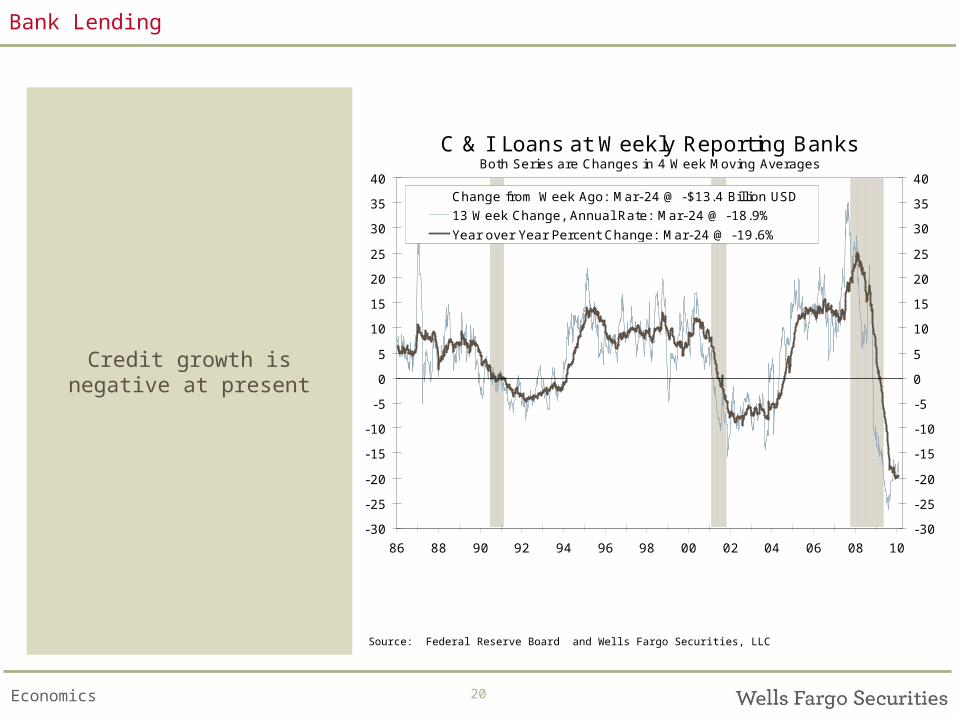
C & I Loans at Weekly Reporting BanksBoth Series are Changes in 4 Week Moving Averages
-30
-25
-20
-15
-10
-5
0
5
10
15
20
25
30
35
40
86 88 90 92 94 96 98 00 02 04 06 08 10
-30
-25
-20
-15
-10
-5
0
5
10
15
20
25
30
35
40Change from Week Ago: Mar-24 @ -$13.4 Billion USD
13 Week Change, Annual Rate: Mar-24 @ -18.9%
Year over Year Percent Change: Mar-24 @ -19.6%
Bank Lending
Credit growth is negative at present
Source: Federal Reserve Board and Wells Fargo Securities, LLC
21Economics
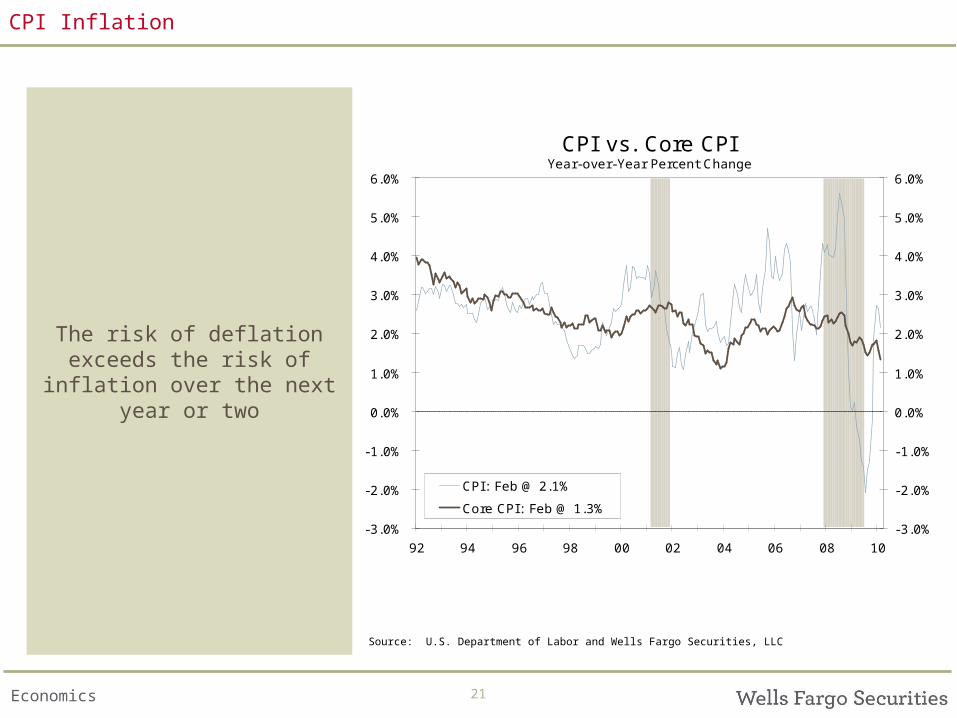
CPI vs. Core CPIYear-over-Year Percent Change
-3.0%
-2.0%
-1.0%
0.0%
1.0%
2.0%
3.0%
4.0%
5.0%
6.0%
92 94 96 98 00 02 04 06 08 10
-3.0%
-2.0%
-1.0%
0.0%
1.0%
2.0%
3.0%
4.0%
5.0%
6.0%
CPI: Feb @ 2.1%
Core CPI: Feb @ 1.3%
CPI Inflation
The risk of deflation exceeds the risk of inflation over the next year or two
Source: U.S. Department of Labor and Wells Fargo Securities, LLC
22Economics
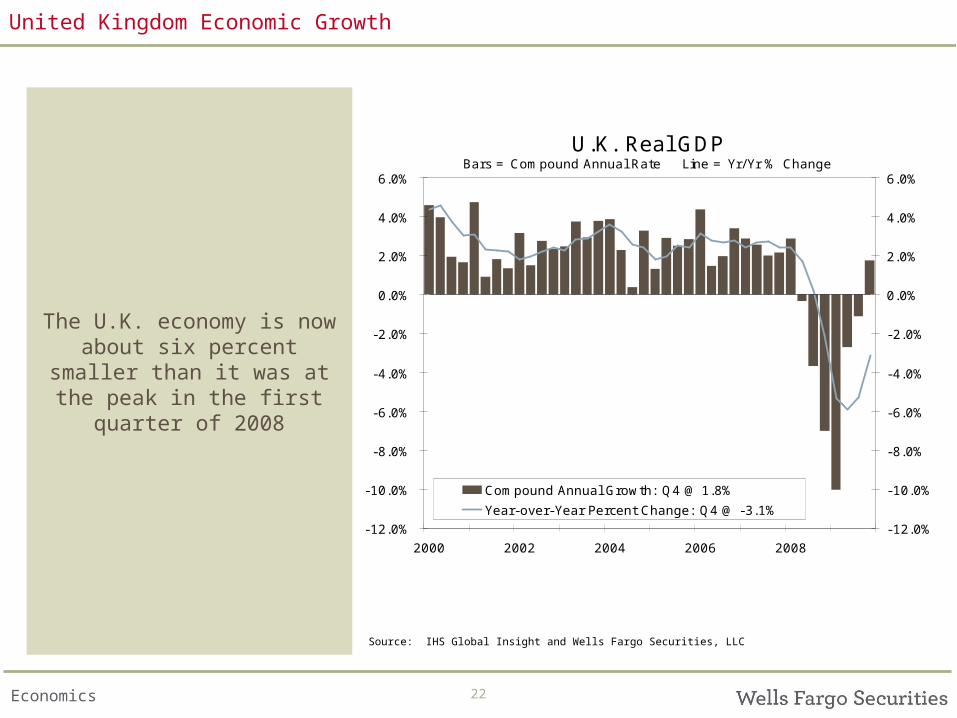
U.K. Real GDPBars = Compound Annual Rate Line = Yr/Yr % Change
-12.0%
-10.0%
-8.0%
-6.0%
-4.0%
-2.0%
0.0%
2.0%
4.0%
6.0%
2000 2002 2004 2006 2008
-12.0%
-10.0%
-8.0%
-6.0%
-4.0%
-2.0%
0.0%
2.0%
4.0%
6.0%
Compound Annual Growth: Q4 @ 1.8%
Year-over-Year Percent Change: Q4 @ -3.1%
United Kingdom Economic Growth
The U.K. economy is now about six percent smaller than it was at the peak in the first quarter of 2008
Source: IHS Global Insight and Wells Fargo Securities, LLC
23Economics
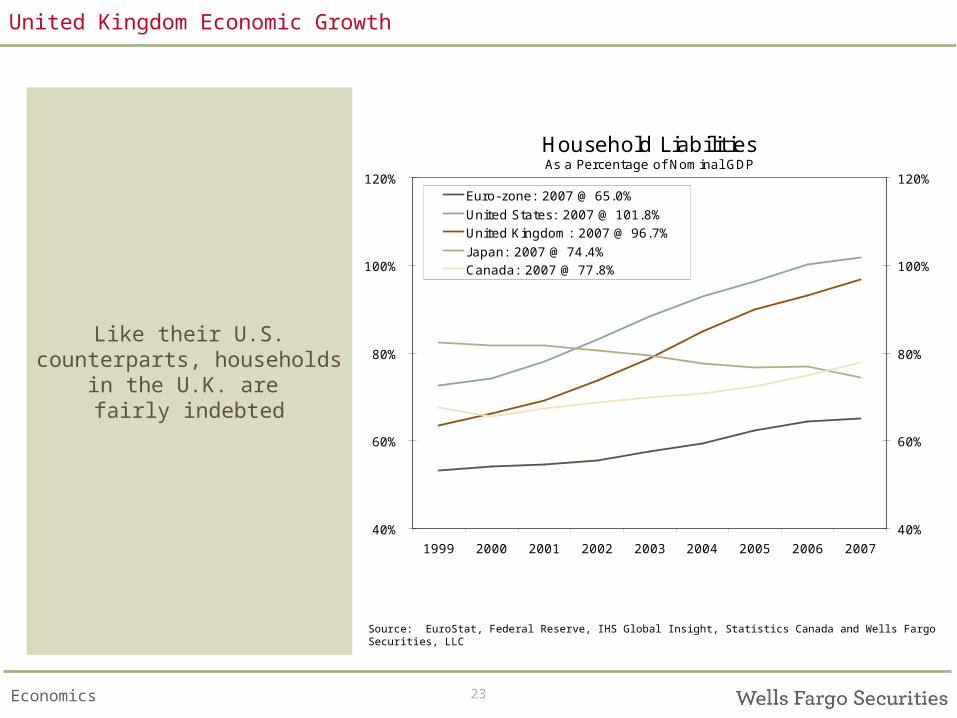
Household LiabilitiesAs a Percentage of Nominal GDP
40%
60%
80%
100%
120%
1999 2000 2001 2002 2003 2004 2005 2006 2007
40%
60%
80%
100%
120%Euro-zone: 2007 @ 65.0%
United States: 2007 @ 101.8%United Kingdom: 2007 @ 96.7%
J apan: 2007 @ 74.4%Canada: 2007 @ 77.8%
United Kingdom Economic Growth
Like their U.S. counterparts, households in
the U.K. are fairly indebted
Source: EuroStat, Federal Reserve, IHS Global Insight, Statistics Canada and Wells Fargo Securities, LLC
24Economics
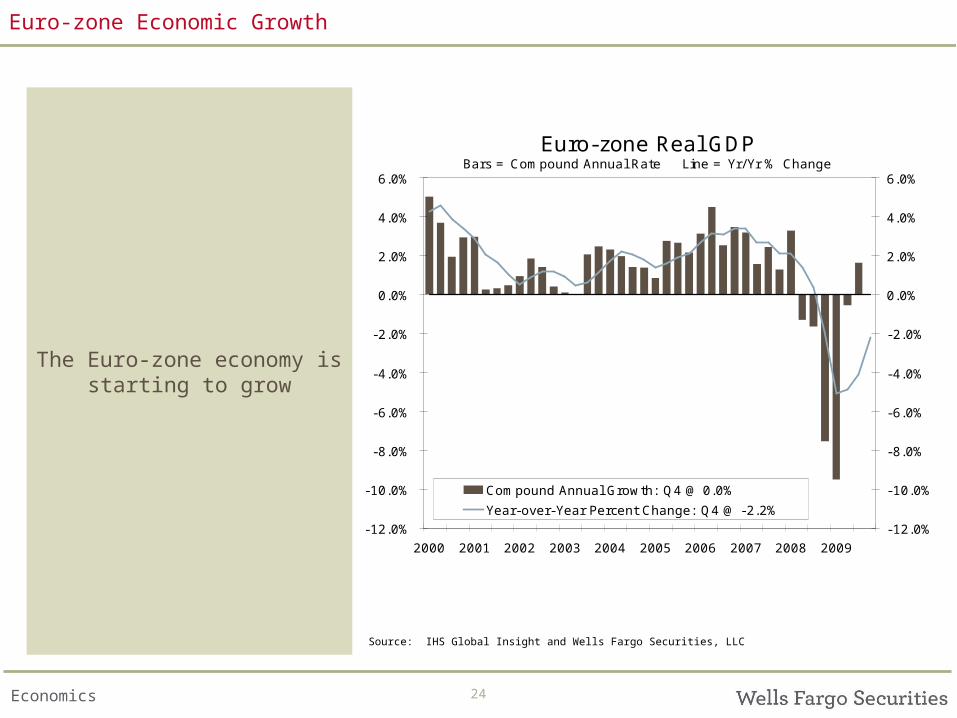
Euro-zone Real GDPBars = Compound Annual Rate Line = Yr/Yr % Change
-12.0%
-10.0%
-8.0%
-6.0%
-4.0%
-2.0%
0.0%
2.0%
4.0%
6.0%
2000 2001 2002 2003 2004 2005 2006 2007 2008 2009
-12.0%
-10.0%
-8.0%
-6.0%
-4.0%
-2.0%
0.0%
2.0%
4.0%
6.0%
Compound Annual Growth: Q4 @ 0.0%
Year-over-Year Percent Change: Q4 @ -2.2%
Euro-zone Economic Growth
The Euro-zone economy is starting to grow
Source: IHS Global Insight and Wells Fargo Securities, LLC
25Economics
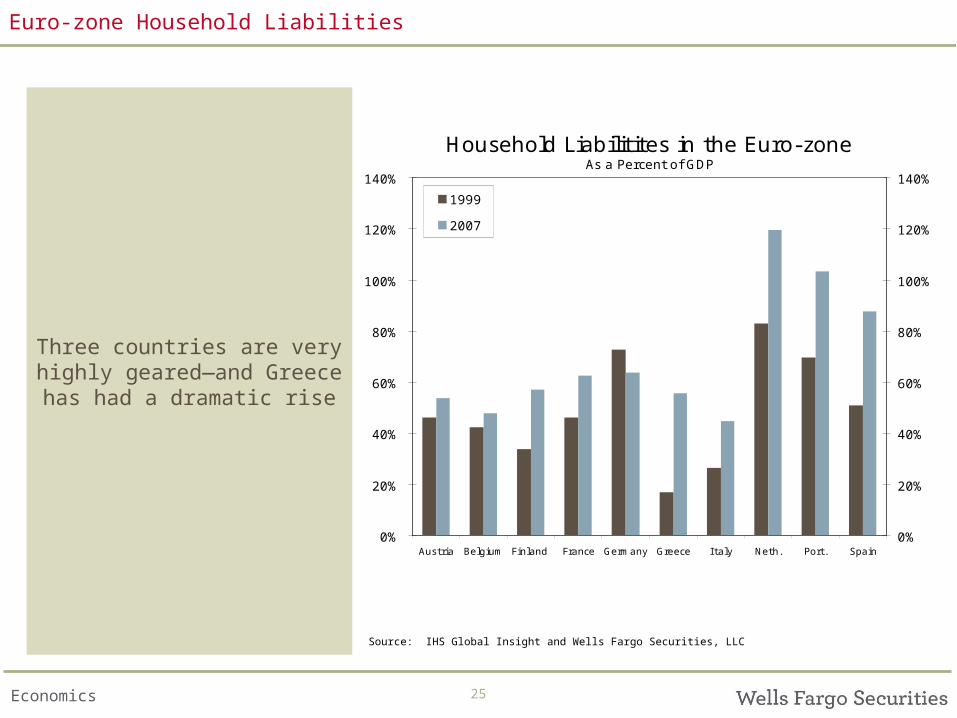
Household Liabilitites in the Euro-zoneAs a Percent of GDP
0%
20%
40%
60%
80%
100%
120%
140%
Austria Belgium Finland France Germany Greece I taly Neth. Port. Spain0%
20%
40%
60%
80%
100%
120%
140%
1999
2007
Euro-zone Household Liabilities
Three countries are very highly geared—and Greece
has had a dramatic rise
Source: IHS Global Insight and Wells Fargo Securities, LLC
26Economics
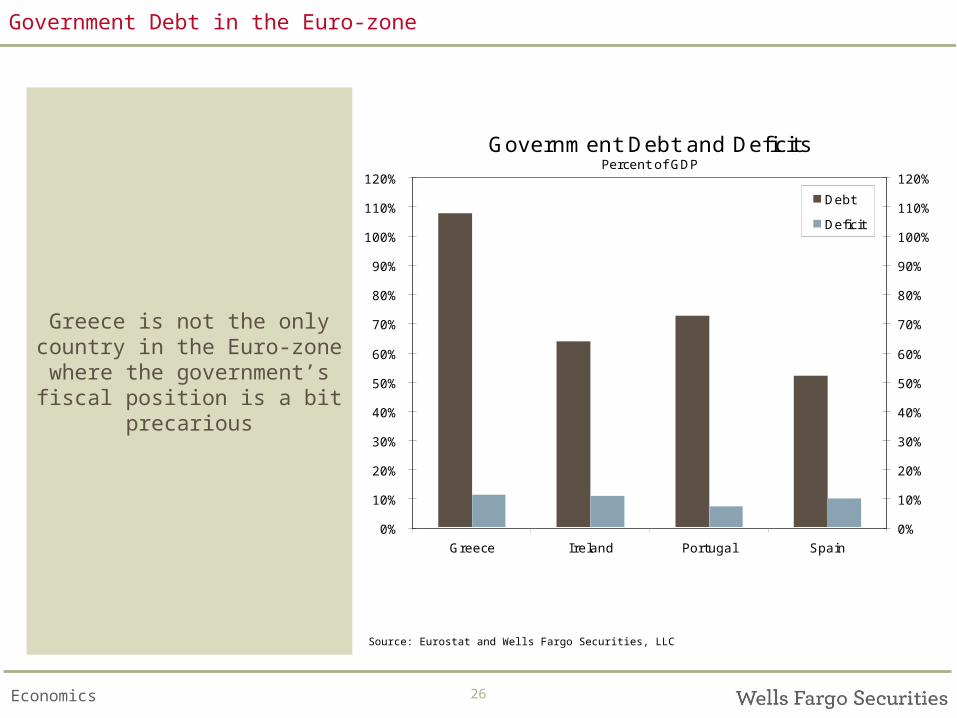
Government Debt and DeficitsPercent of GDP
0%
10%
20%
30%
40%
50%
60%
70%
80%
90%
100%
110%
120%
Greece Ireland Portugal Spain
0%
10%
20%
30%
40%
50%
60%
70%
80%
90%
100%
110%
120%
Debt
Deficit
Government Debt in the Euro-zone
Greece is not the only country in the Euro-zone where the government’s
fiscal position is a bit precarious
Source: Eurostat and Wells Fargo Securities, LLC
27Economics
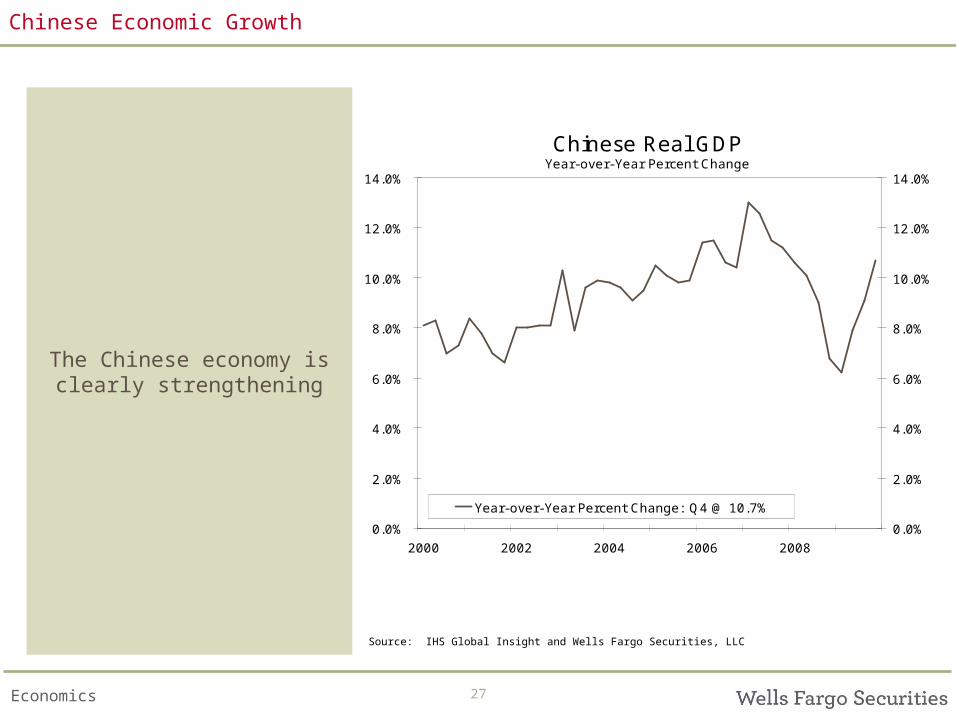
Chinese Real GDPYear-over-Year Percent Change
0.0%
2.0%
4.0%
6.0%
8.0%
10.0%
12.0%
14.0%
2000 2002 2004 2006 2008
0.0%
2.0%
4.0%
6.0%
8.0%
10.0%
12.0%
14.0%
Year-over-Year Percent Change: Q4 @ 10.7%
Chinese Economic Growth
The Chinese economy is clearly strengthening
Source: IHS Global Insight and Wells Fargo Securities, LLC
28Economics
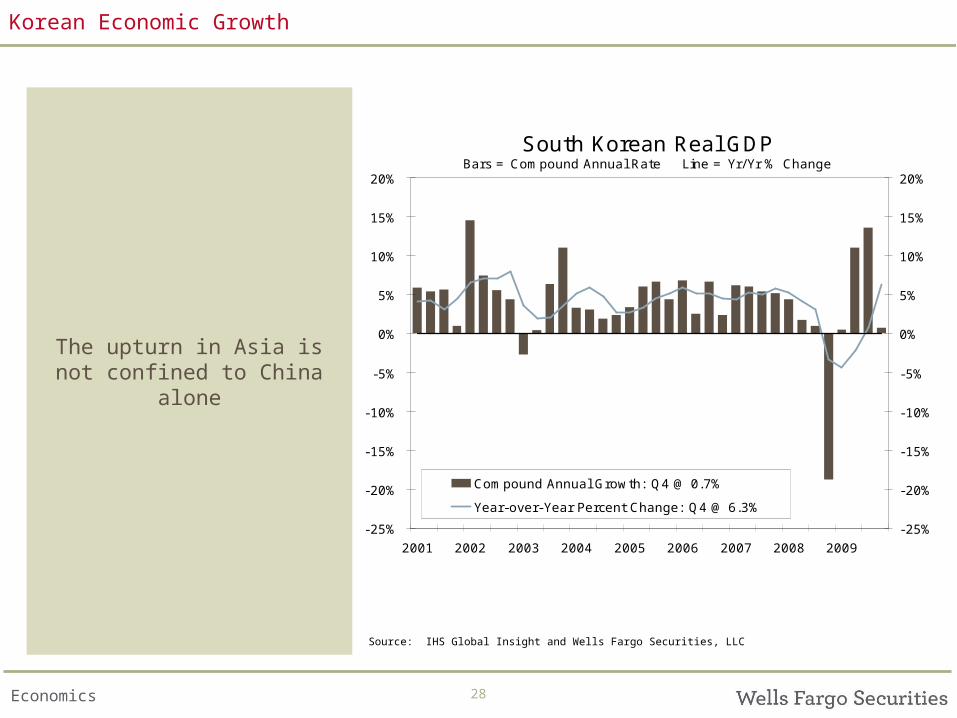
South Korean Real GDPBars = Compound Annual Rate Line = Yr/Yr % Change
-25%
-20%
-15%
-10%
-5%
0%
5%
10%
15%
20%
2001 2002 2003 2004 2005 2006 2007 2008 2009
-25%
-20%
-15%
-10%
-5%
0%
5%
10%
15%
20%
Compound Annual Growth: Q4 @ 0.7%
Year-over-Year Percent Change: Q4 @ 6.3%
Korean Economic Growth
The upturn in Asia is not confined to China alone
Source: IHS Global Insight and Wells Fargo Securities, LLC
29Economics
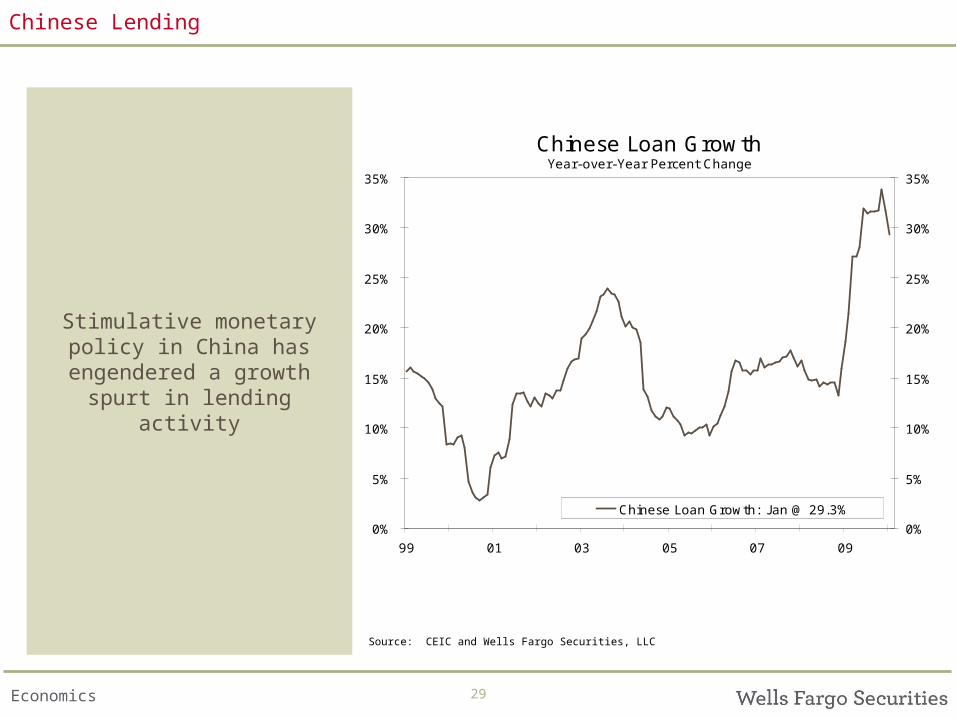
Chinese Loan GrowthYear-over-Year Percent Change
0%
5%
10%
15%
20%
25%
30%
35%
99 01 03 05 07 09
0%
5%
10%
15%
20%
25%
30%
35%
Chinese Loan Growth: J an @ 29.3%
Chinese Lending
Stimulative monetary policy in China has engendered a
growth spurt in lending activity
Source: CEIC and Wells Fargo Securities, LLC
30Economics
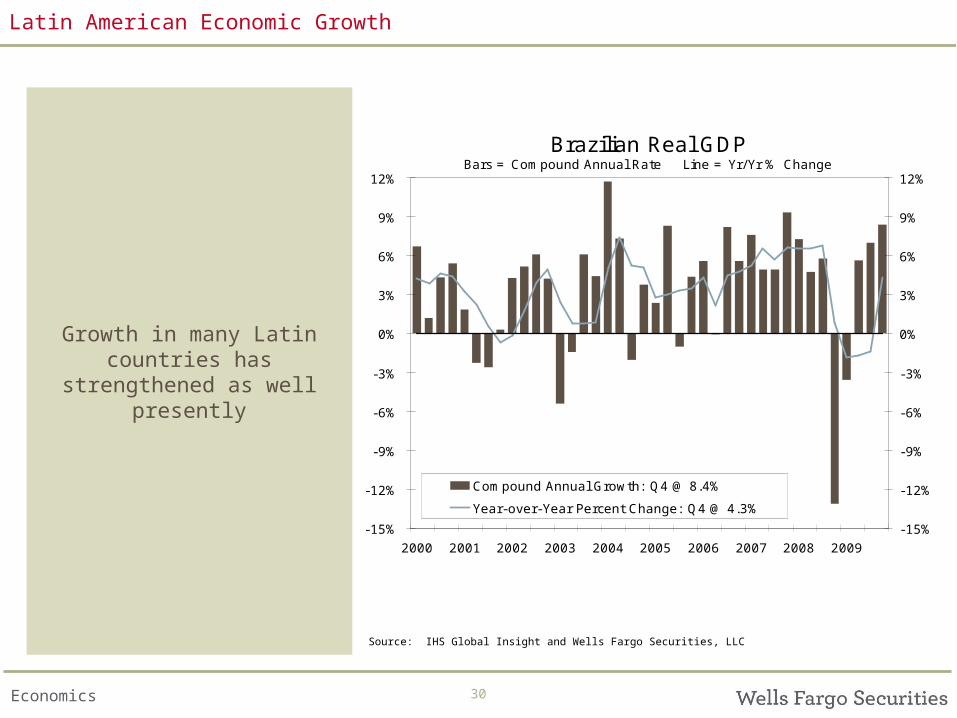
Brazilian Real GDPBars = Compound Annual Rate Line = Yr/Yr % Change
-15%
-12%
-9%
-6%
-3%
0%
3%
6%
9%
12%
2000 2001 2002 2003 2004 2005 2006 2007 2008 2009
-15%
-12%
-9%
-6%
-3%
0%
3%
6%
9%
12%
Compound Annual Growth: Q4 @ 8.4%
Year-over-Year Percent Change: Q4 @ 4.3%
Latin American Economic Growth
Growth in many Latin countries has strengthened
as well presently
Source: IHS Global Insight and Wells Fargo Securities, LLC
31Economics
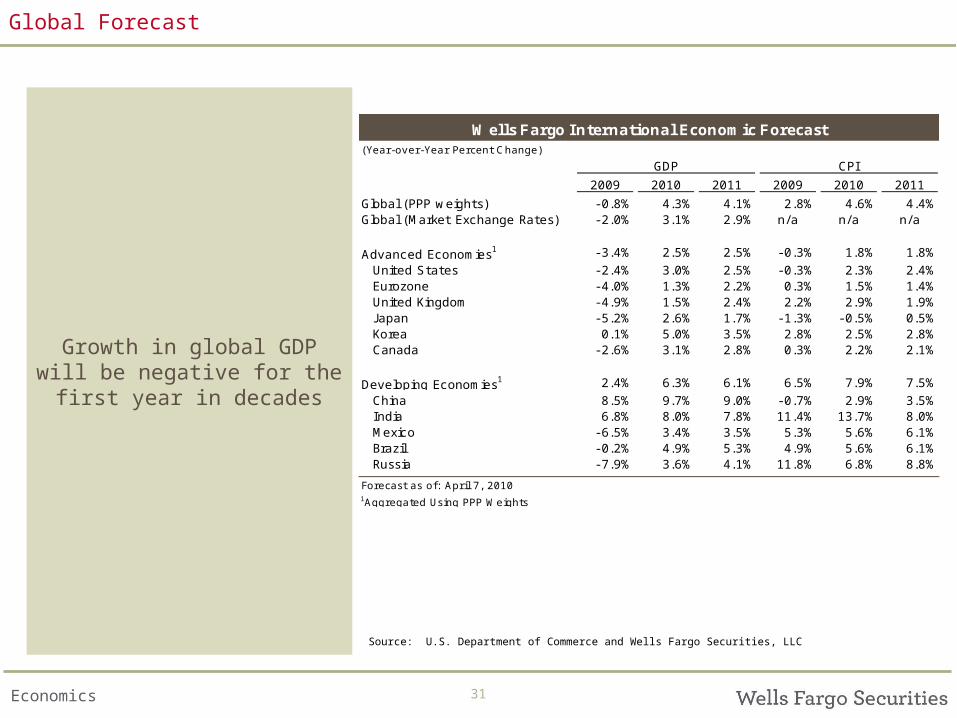
Wells Fargo International Economic Forecast(Year-over-Year Percent Change)
GDP CPI
2009 2010 2011 2009 2010 2011
Global (PPP weights) - 0.8% 4.3% 4.1% 2.8% 4.6% 4.4%Global (Market Exchange Rates) - 2.0% 3.1% 2.9% n/a n/a n/a
Advanced Economies1 - 3.4% 2.5% 2.5% - 0.3% 1.8% 1.8%
United States - 2.4% 3.0% 2.5% - 0.3% 2.3% 2.4%Eurozone - 4.0% 1.3% 2.2% 0.3% 1.5% 1.4%United Kingdom - 4.9% 1.5% 2.4% 2.2% 2.9% 1.9%J apan - 5.2% 2.6% 1.7% - 1.3% - 0.5% 0.5%Korea 0.1% 5.0% 3.5% 2.8% 2.5% 2.8%Canada - 2.6% 3.1% 2.8% 0.3% 2.2% 2.1%
Developing Economies1 2.4% 6.3% 6.1% 6.5% 7.9% 7.5%
China 8.5% 9.7% 9.0% - 0.7% 2.9% 3.5%India 6.8% 8.0% 7.8% 11.4% 13.7% 8.0%Mexico - 6.5% 3.4% 3.5% 5.3% 5.6% 6.1%Brazil - 0.2% 4.9% 5.3% 4.9% 5.6% 6.1%Russia - 7.9% 3.6% 4.1% 11.8% 6.8% 8.8%
Forecast as of: April 7, 20101Aggregated Using PPP Weights
Global Forecast
Growth in global GDP will be negative for the first
year in decades
Source: U.S. Department of Commerce and Wells Fargo Securities, LLC
32Economics
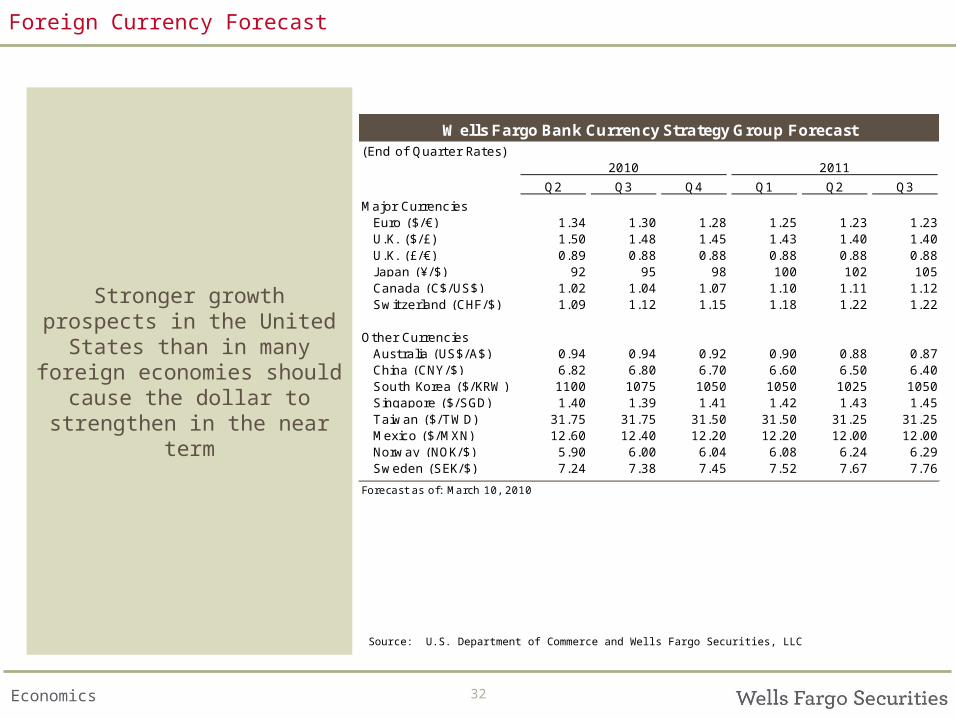
Wells Fargo Bank Currency Strategy Group Forecast(End of Quarter Rates)
2010 2011
Q2 Q3 Q4 Q1 Q2 Q3
Major CurrenciesEuro ($/€) 1.34 1.30 1.28 1.25 1.23 1.23U.K. ($/£) 1.50 1.48 1.45 1.43 1.40 1.40U.K. (£/€) 0.89 0.88 0.88 0.88 0.88 0.88J apan (¥/$) 92 95 98 100 102 105Canada (C$/US$) 1.02 1.04 1.07 1.10 1.11 1.12Switzerland (CHF/$) 1.09 1.12 1.15 1.18 1.22 1.22
Other CurrenciesAustralia (US$/A$) 0.94 0.94 0.92 0.90 0.88 0.87China (CNY/$) 6.82 6.80 6.70 6.60 6.50 6.40South Korea ($/KRW) 1100 1075 1050 1050 1025 1050Singapore ($/SGD) 1.40 1.39 1.41 1.42 1.43 1.45Taiwan ($/TWD) 31.75 31.75 31.50 31.50 31.25 31.25Mexico ($/MXN) 12.60 12.40 12.20 12.20 12.00 12.00Norway (NOK/$) 5.90 6.00 6.04 6.08 6.24 6.29Sweden (SEK/$) 7.24 7.38 7.45 7.52 7.67 7.76
Forecast as of: March 10, 2010
Foreign Currency Forecast
Stronger growth prospects in the United States than in
many foreign economies should cause the dollar to
strengthen in the near term
Source: U.S. Department of Commerce and Wells Fargo Securities, LLC
33Economics
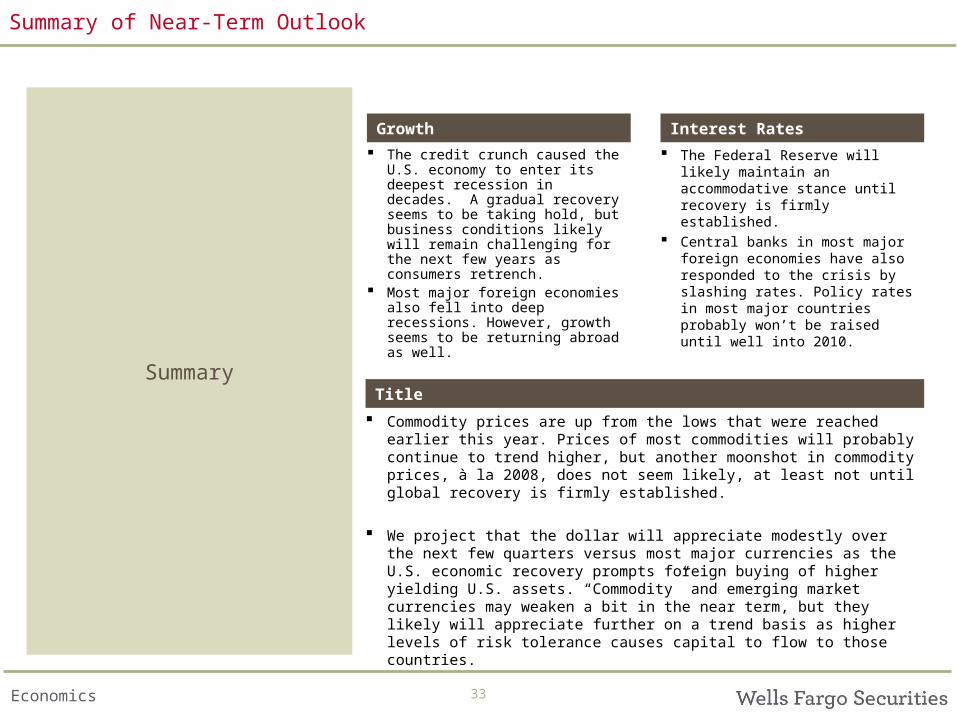
The credit crunch caused the U.S. economy to enter its deepest recession in decades. A gradual recovery seems to be taking hold, but business conditions likely will remain challenging for the next few years as consumers retrench.
Most major foreign economies also fell into deep recessions. However, growth seems to be returning abroad as well.
Commodity prices are up from the lows that were reached earlier this year. Prices of most commodities will probably continue to trend higher, but another moonshot in commodity prices, à la 2008, does not seem likely, at least not until global recovery is firmly established.
We project that the dollar will appreciate modestly over the next few quarters versus most major currencies as the U.S. economic recovery prompts foreign buying of higher yielding U.S. assets. “Commodity” and emerging market currencies may weaken a bit in the near term, but they likely will appreciate further on a trend basis as higher levels of risk tolerance causes capital to flow to those countries.
The Federal Reserve will likely maintain an accommodative stance until recovery is firmly established.
Central banks in most major foreign economies have also responded to the crisis by slashing rates. Policy rates in most major countries probably won’t be raised until well into 2010.
Title
Growth Interest Rates
Insert slide callout
Summary of Near-Term Outlook
Summary
34Economics
Diane Schumaker-KriegGlobal Head of Research & Economics
Wells Fargo Securities, LLC Economics Group
John E. Silvia, Ph.D.Chief Economist
[email protected] U.S. Macro Economy Real Estate
U.S. Macro Economy
U.S. Macro Economy
[email protected] Global Economies
Mark VitnerSenior Economist
Jay H. Bryson, Ph.D.Global Economist
Scott Anderson, Ph.D. Senior Economist
Eugenio Aleman, Ph.D. Senior Economist
[email protected] U.S. Macro Economy
[email protected] U.S. Macro Economy Business Investment
U.S. Macro Economy
[email protected] Global Economies Business Investment
Ed KashmarekEconomist
Tim QuinlanEconomist
Kim WhelanEconomic Analyst
Yasmine KamaruddinEconomic Analyst
[email protected] U.S. Macro Economy Financial Services
[email protected] Quantitative Macro-
Economic Modeling
[email protected] U.S. Consumer Real Estate
[email protected] Real Estate Retail & Automotive
Sam BullardEconomist
Anika KhanEconomist
Azhar IqbalEconometrician
Adam G. YorkEconomist
Wells Fargo Securities Economics Group publications are produced by Wells Fargo Securities, LLC, a U.S broker-dealer registered with the U.S. Securities and Exchange Commission, the Financial Industry Regulatory Authority, and the Securities Investor Protection Corp. Wells Fargo Securities, LLC, distributes these publications directly and through subsidiaries including, but not limited to, Wells Fargo & Company, Wachovia Bank N.A., Wells Fargo Bank N.A, Wells Fargo Advisors, LLC, and Wells Fargo Securities International Limited. The information and opinions herein are for general information use only. Wells Fargo Securities, LLC does not guarantee their accuracy or completeness, nor does Wells Fargo Securities, LLC assume any liability for any loss that may result from the reliance by any person upon any such information or opinions. Such information and opinions are subject to change without notice, are for general information only and are not intended as an offer or solicitation with respect to the purchase or sales of any security or as personalized investment advice. Wells Fargo Securities, LLC is a separate legal entity and distinct from affiliated banks and is a wholly owned subsidiary of Wells Fargo & Company © 2010 Wells Fargo Securities, LLC.
SECURITIES: NOT FDIC-INSURED/NOT BANK-GUARANTEED/MAY LOSE VALUE