Embed Size (px)
Citation preview

The Global Economic Outlook:
Stronger growth ahead, but more risks
Paris, 19th November 2013 11h00 Paris time
Pier Carlo Padoan
Deputy Secretary-General and Chief Economist

OECD Economic Outlook: key messages
1. Global growth should pick up if major risks do not materialise.
2. Downside risks prevail. Negative spillovers from emerging economies could be stronger than before.
3. Emerging economies need to address vulnerabilities to improve resilience and tackle the slowdown in potential growth.
4. The United States should avoid fiscal brinkmanship.
5. The euro area must repair the banking system and rebalance demand to reduce unemployment.
6. In Japan, all three “arrows” of the government’s strategy should be implemented fully.
2
Global growth should pick up if major risks do not materialise…
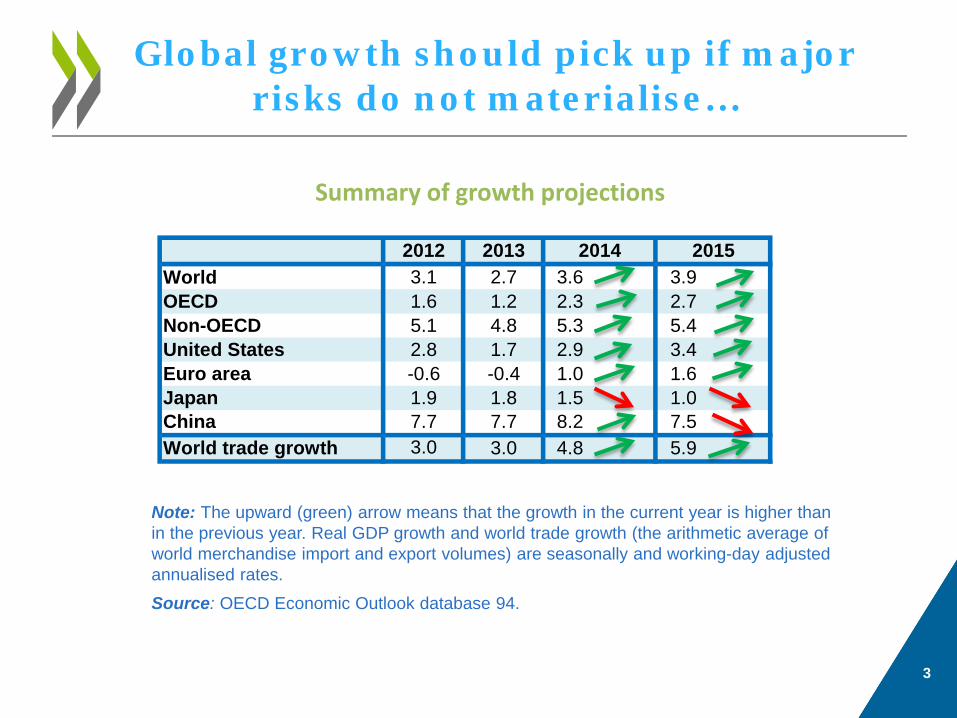
Summary of growth projections
3
Note: The upward (green) arrow means that the growth in the current year is higher than in the previous year. Real GDP growth and world trade growth (the arithmetic average of world merchandise import and export volumes) are seasonally and working-day adjusted annualised rates.
Source: OECD Economic Outlook database 94.
2012 2013World 3.1 2.7 3.6 3.9OECD 1.6 1.2 2.3 2.7Non-OECD 5.1 4.8 5.3 5.4United States 2.8 1.7 2.9 3.4Euro area -0.6 -0.4 1.0 1.6Japan 1.9 1.8 1.5 1.0China 7.7 7.7 8.2 7.5World trade growth 3.0 3.0 4.8 5.9
2014 2015
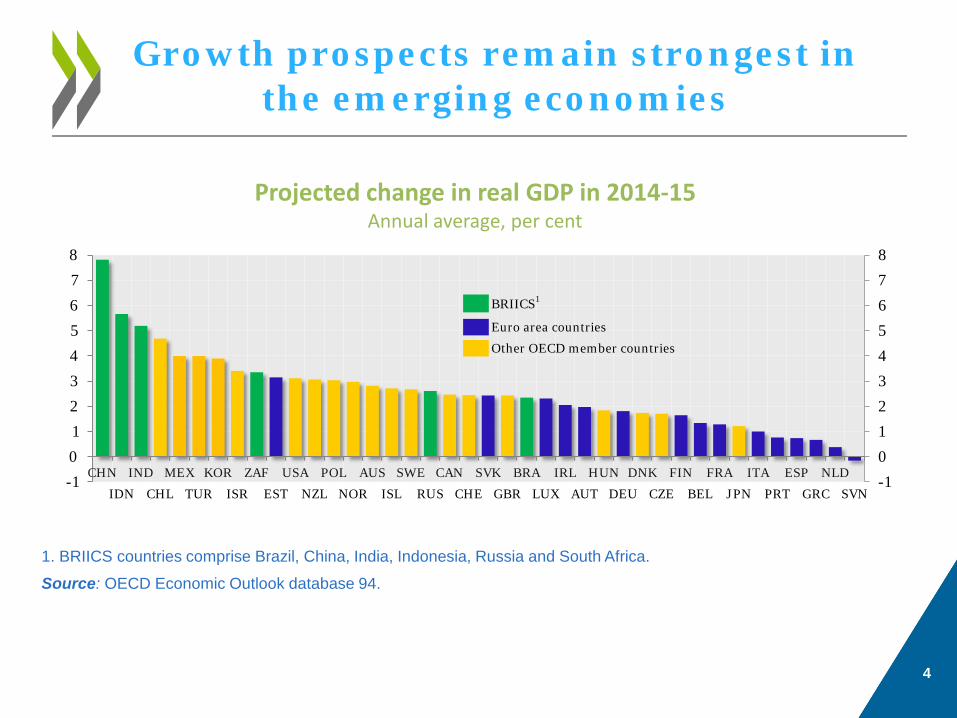
Growth prospects remain strongest in the emerging economies
Projected change in real GDP in 2014-15 Annual average, per cent
1. BRIICS countries comprise Brazil, China, India, Indonesia, Russia and South Africa.
Source: OECD Economic Outlook database 94.
4
CHN IND MEX KOR ZAF USA POL AUS SWE CAN SVK BRA IRL HUN DNK FIN FRA ITA ESP NLD-1
0
1
2
3
4
5
6
7
8
-1
0
1
2
3
4
5
6
7
8
IDN CHL TUR ISR EST NZL NOR ISL RUS CHE GBR LUX AUT DEU CZE BEL JPN PRT GRC SVN
BRIICS1
Euro area countries
Other OECD member countries

… but the outlook is somewhat less positive than it appeared in May…
Growth forecast almost unchanged for the OECD…
… but significantly weaker for many emerging economies with the exception of China.
Comparison of growth projections from May and November Economic Outlooks
1. BRIICS countries comprise Brazil, China, India, Indonesia, Russia and South Africa.
Source: OECD Economic Outlook database 93 & 94. 5
1
2
3
1
2
3
2011 2012 2013 2014
OECD
May 2013 Outlook
November 2013 Outlook
4
6
8
4
6
8
2011 2012 2013 2014
BRIICS1
May 2013 OutlookNovember 2013 Outlook

… with forecast revisions varying across countries
Change in 2014 real GDP growth projection between May and November Economic Outlooks Percentage points
1. BRIICS countries comprise Brazil, China, India, Indonesia, Russia and South Africa. Source: OECD Economic Outlook database 93 & 94.
6
INDESTBRAZAFRUSSVNCHLNLDTURAUSIDNFIN
DEUCHNNORCZE
KORSWEDNKSVKISR
-2.0 -1.5 -1.0 -0.5 0.0 0.5 1.0
AUTIRLBELISL
CANUSA
MEXESPJPNITA
NZLCHEFRAPRTPOLLUX
HUNGRCGBR
BRIICS1
Euro area countries
Other OECD member countries
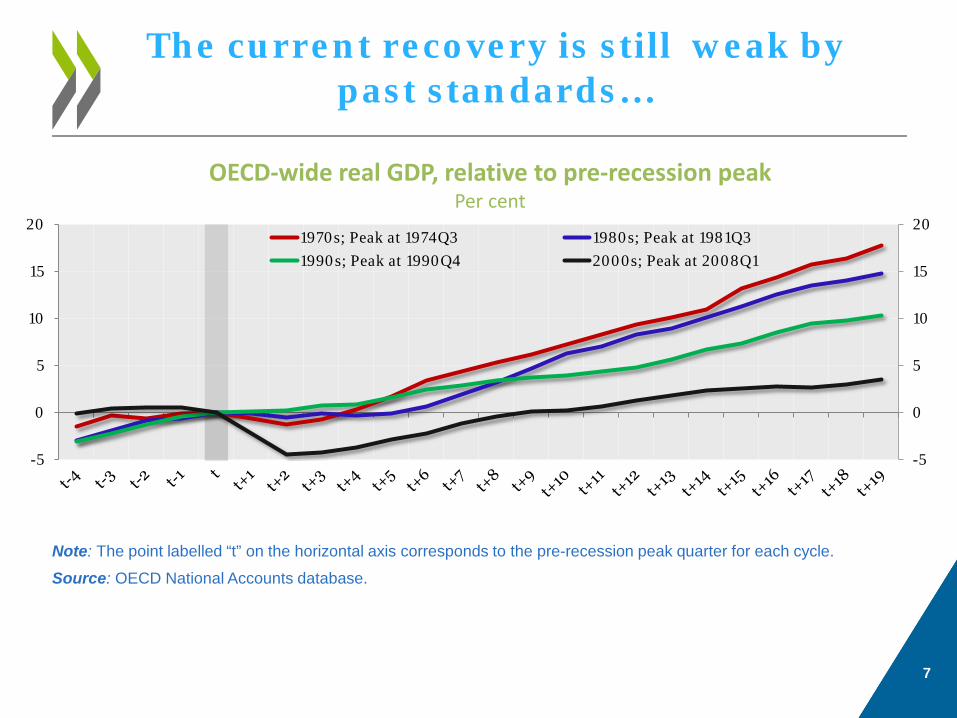
The current recovery is still weak by past standards…
Note: The point labelled “t” on the horizontal axis corresponds to the pre-recession peak quarter for each cycle.
Source: OECD National Accounts database.
OECD-wide real GDP, relative to pre-recession peak Per cent
7
-5
0
5
10
15
20
-5
0
5
10
15
201970s; Peak at 1974Q3 1980s; Peak at 1981Q31990s; Peak at 1990Q4 2000s; Peak at 2008Q1
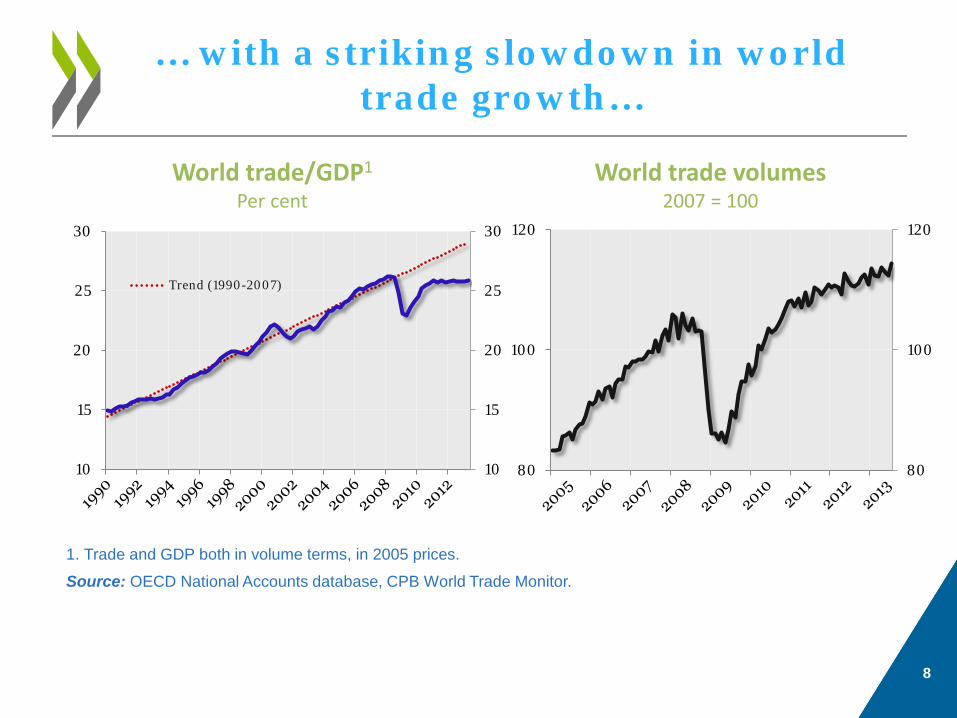
… with a striking slowdown in world trade growth…
1. Trade and GDP both in volume terms, in 2005 prices.
Source: OECD National Accounts database, CPB World Trade Monitor.
World trade/GDP1
Per cent World trade volumes
2007 = 100
8
80
100
120
80
100
120
10
15
20
25
30
10
15
20
25
30
Trend (1990-2007)

… which also reflects particular weakness in investment…
OECD-wide fixed investment Volume, 2007 = 100
Note: Fixed investment values are the weighted average of OECD member countries, where the weights are GDP measured at 2005 PPP USD.
Source: OECD Economic Outlook 94 database, OECD Foreign Direct Investment (FDI) Statistics.
World FDI flows Index of USD values, 2007 = 100
9
75
80
85
90
95
100
105
75
80
85
90
95
100
105
0
20
40
60
80
100
120
0
20
40
60
80
100
120

… credit has lagged in the major economies…
Bank loans to non-financial private sector 2007 = 100
10
80
85
90
95
100
105
110
Euro area United States Japan
Note: Major OECD economies is calculated as the weighted average of the indices (2007 = 100) of nominal bank credit to the non-financial private sector for the United States, the euro area and Japan, where the weights are GDP in 2007 measured at USD PPP.
Source: Datastream and European Central Bank.
80
85
90
95
100
105
110
Major OECD economies
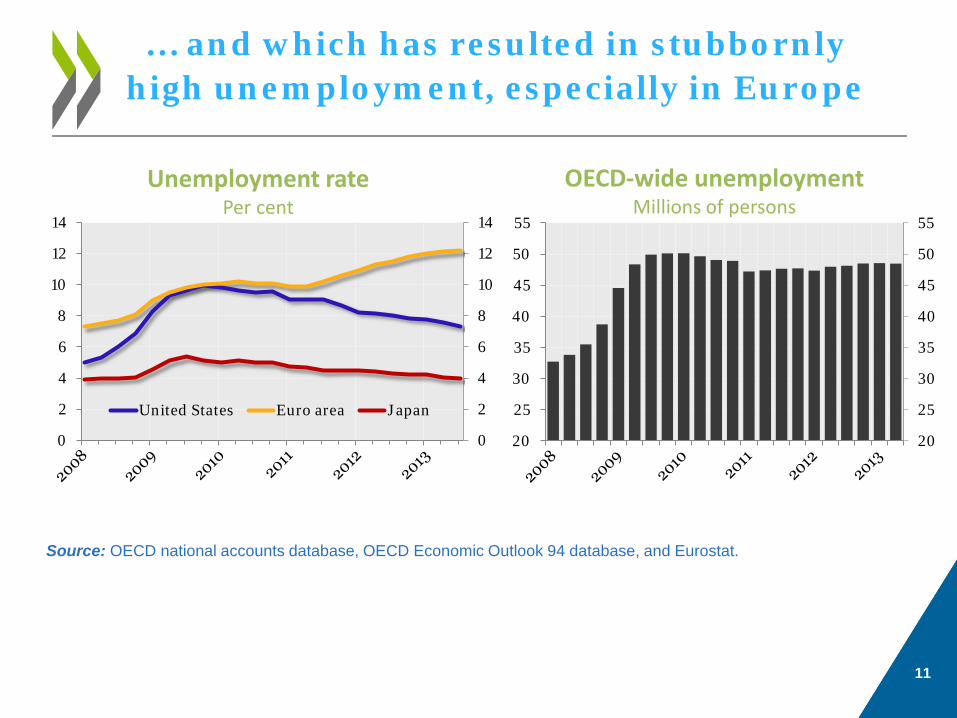
… and which has resulted in stubbornly high unemployment, especially in Europe
Unemployment rate Per cent
Source: OECD national accounts database, OECD Economic Outlook 94 database, and Eurostat.
11
OECD-wide unemployment Millions of persons
20
25
30
35
40
45
50
55
20
25
30
35
40
45
50
55
0
2
4
6
8
10
12
14
0
2
4
6
8
10
12
14
United States Euro area Japan

Recent financial turbulence is one reason for the less positive outlook
• limited impact to date on major OECD economies
• significant effects on some emerging economies
The fallout from the discussion of tapering of asset purchases
by the Federal Reserve in May is the main negative development
since the last Outlook
Emerging market bond index1
May 1, 2013 = 100
1. JP Morgan EMBI+.
Source: OECD Economic Outlook 94 database, Datastream. 12
80
85
90
95
100
105
80
85
90
95
100
105
FOMC delays taper
Bernanke statement on tapering

Emerging economies with large current account deficits were worst-hit
1. Based on daily information from April 30 to November 15, 2013.
Note: Latest 4-quarter period is Q3 2012 – Q2 2013.
Source: OECD Economic Outlook 94 database; Datastream; and IMF Balance of Payments database.
Maximum rise in long-term yields from May 2013
13
BRA
RUS IND
IDN
CHN
ZAF
TUR
MEX
0.0
1.0
2.0
3.0
4.0
5.0
-8 -6 -4 -2 0 2 4Max
imu
m in
crea
se i
n lo
ng-
term
inte
rest
ra
tes¹
, in
% p
ts
Current account balance last 4 quarters, in % of GDP

Downside risks prevail. The recovery path is likely to be turbulent
Significant risks remain from incomplete resolution of fiscal, financial and structural weaknesses since the crisis.
Recent instability was a reminder of how risks can derail the central scenario for growth and employment.
A tapering of US Federal Reserve asset purchases may bring a renewed bout of instability.
Underlying fragilities in all the major economies could be exposed by the realisation of one or more prominent risks.
14

Negative spillovers from emerging economies could be stronger than before
A deeper slowdown in EMEs would have negative feedback effects on advanced economies.
Some advanced economies have tight trade and financial links with EMEs, and would be significantly affected.
First-year impact on growth of a 2% decline in domestic demand in non-OECD countries excluding China
Source: OECD Economic Outlook 94 database; and OECD calculations. 15
-1.0
-0.5
0.0
-1.0
-0.5
0.0
Perc
enta
ge p
oint
s

United States: exit from unconventional monetary policy will be challenging
US monetary policy should remain accommodative, balancing uncertainty about the evolution of demand and employment with the costs of postponing exit.
As growth strengthens, bond purchases should be wound down. When that process is complete, the Federal Reserve should start to raise policy interest rates towards a more neutral stance.
16

... as will dealing with the taper elsewhere
In vulnerable EMEs, the US taper may aggravate policy dilemmas, with a reversal of capital inflows weakening activity.
Where inflation is already high and the central bank’s credibility is in question, interest rates may have to be higher to anchor inflation expectations.
US taper will also put upward pressure on interest rates in advanced countries, notably the euro area. This is another reason why strengthening bank balance sheets is an urgent priority.
17
Addressing the risk of fiscal deadlock in the United States
Polarised politics and the nominal debt ceiling create risks not only for the US but the whole world.
The nominal debt ceiling should be abolished.
Mechanistic and arbitrary short-term consolidation measures should be replaced by a coordinated medium-term plan.
18

If the US debt ceiling were to bind, a new global recession could be triggered
Note: Government consumption reduced by 5% of GDP in 2014. Term premium in long-term interest rates up by 200 b.p. in 2014 in the USA. Equity prices drop by 25% in 2014 in all countries. Short-term interest rates and nominal exchange rates held fixed. Source: OECD Economic Outlook 94 database, and OECD calculations.
Change relative to baseline in first year if debt ceiling were to bind for one year Percentage points
19
-8 -6 -4 -2 0
United States
Euro area
Japan
China
OECD
World
GDP growth 0 1 2 3
UnitedStates
Euro area
Japan
China
Unemployment
-2.0 -1.5 -1.0 -0.5 0.0
United States
Euro area
Japan
China
OECD
Inflation

Japan’s fiscal challenges remain massive…
1. The average measure of consolidation is the difference between the underlying primary balance in 2014 and the average underlying primary balance between 2015 and 2030, except for those countries for which the debt target is only achieved after 2030, in which case the average is calculated up until the year that the debt target is achieved.
Source: OECD calculations.
Consolidation requirements to reduce government debt to 60 per cent of GDP by 20301
Percentage points of GDP
20
-2
0
2
4
6
8
10
12
-2
0
2
4
6
8
10
12

… and must be tackled decisively
• The second planned increase, to 10% in 2015, should go ahead on schedule.
• Any package to soften the growth impact of the tax increases should be focussed on one-time measures with high multipliers.
• A detailed and credible plan to achieve the target of primary balance by 2020 is needed.
• Structural reform to boost growth should be implemented quickly.
The 2014 rise in the consumption
tax is just the first step to
putting public debt on a
sustainable path.
21

Preventing another euro area crisis
The recent ECB rate cut is welcome, but further easing may be required if deflation risks intensify.
The Asset Quality Review and stress tests must be implemented rigorously – and followed up by bank recapitalisation where needed.
Further progress must be made on establishing a fully fledged banking union with an adequate joint fiscal backstop. The date for an effective single bank resolution regime should be brought forward.
22
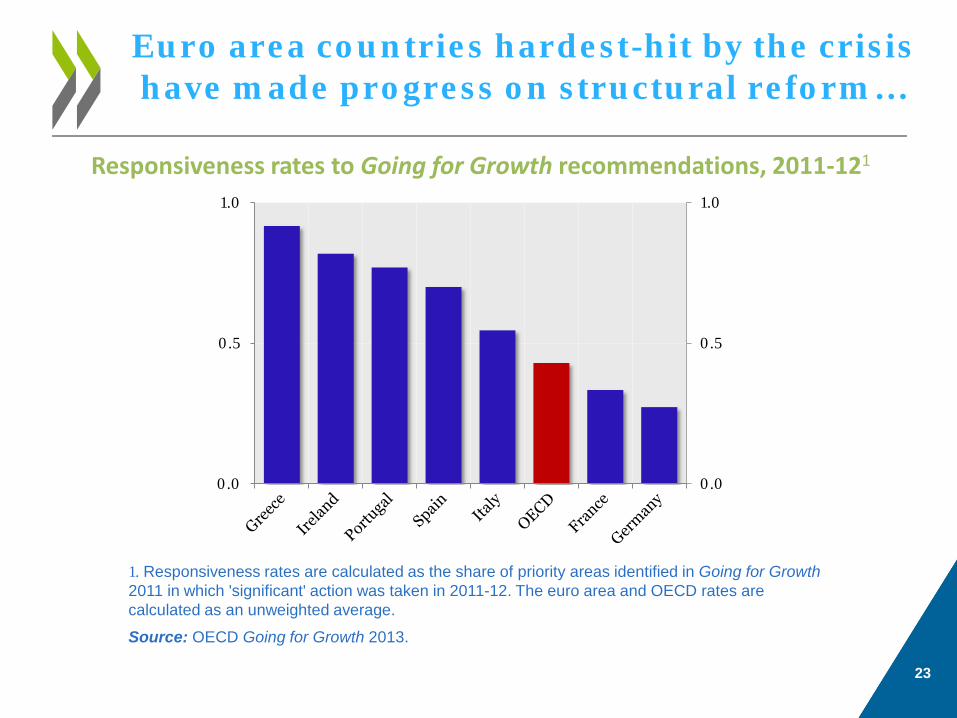
Euro area countries hardest-hit by the crisis have made progress on structural reform…
Responsiveness rates to Going for Growth recommendations, 2011-121
1. Responsiveness rates are calculated as the share of priority areas identified in Going for Growth 2011 in which 'significant' action was taken in 2011-12. The euro area and OECD rates are calculated as an unweighted average.
Source: OECD Going for Growth 2013.
23
0.0
0.5
1.0
0.0
0.5
1.0

…which is assisting with internal rebalancing…
24
Contributions to improvement in net exports since 20081
In per cent of 2008 euro area GDP
1. Change shown is latest 4 quarter period (Q3 2012 – Q2 2013) minus 2008.
Source: OECD Economic Outlook 94 database.
-0.5
0.0
0.5
1.0
1.5
2.0
2.5
3.0
-0.5
0.0
0.5
1.0
1.5
2.0
2.5
3.0
Greece Ireland Italy Portugal Spain
Fall in imports Rise in exports Change in net exports

… although that adjustment needs to be more symmetric
25
Current account balance/GDP Per cent, 4-quarter moving average
Source: OECD national accounts database.
-20
-15
-10
-5
0
5
10
-20
-15
-10
-5
0
5
10
DEU GRC ITA PRT ESP
Summing up
26
The global economy looks set to move beyond its post-crisis sluggishness, but there are still prominent downside risks.
There is no room for complacency. Policy makers should avoid creating turbulence and stand ready to mitigate instability.
Successful growth strategies require a strong commitment to structural reforms in advanced and emerging market economies alike.
• In this respect, the plan announced by the Plenum of the CCP goes in the right direction.
Policy priorities at the international level include trade, investment and financial reform.