Embed Size (px)
DESCRIPTION
The Global Digital Divide and the Effects of Technology Use on Educational Outcomes. Robert W. Fairlie University of California, Santa Cruz Prepared for Adoption of ICT Enabled Information Systems for Agricultural Development Workshop Tokyo, Japan August 24, 2008. Outline. - PowerPoint PPT Presentation
Citation preview

The Global Digital Divide and the Effects
of Technology Use on Educational Outcomes
Robert W. FairlieUniversity of California, Santa Cruz
Prepared for Adoption of ICT Enabled Information Systems for Agricultural Development Workshop
Tokyo, Japan August 24, 2008

Outline
Cross-country differences in computer and Internet use Causes of the Global Digital Divide Disparities in computer and Internet use by race and income in the
United States Causes of the U.S. Digital Divide Consequences of the Digital Divide Educational impacts

The Global Digital Divide
Cross-country differences in Computer and Internet Use International Telecommunications Union data Large disparities across countries

Figure 1Computer Penetration Rates by Country Type (ITU 1995-2004)
0
2
4
6
8
10
12
14
16
18
20
1995 1996 1997 1998 1999 2000 2001 2002 2003 2004
0
10
20
30
40
50
60
Developing
Transition
World
Developed

Figure 2Internet Penetration Rates by Country Type (ITU 1995-2004)
0
2
4
6
8
10
12
14
16
18
20
1995 1996 1997 1998 1999 2000 2001 2002 2003 2004
0
10
20
30
40
50
60
Developing
Transition
World
Developed

Causes of the Global Digital Divide
“ICT Use in the Developing World An Analysis of Differences in Computer and Internet Penetration” (with Menzie D. Chinn)
Regression and decomposition analysis
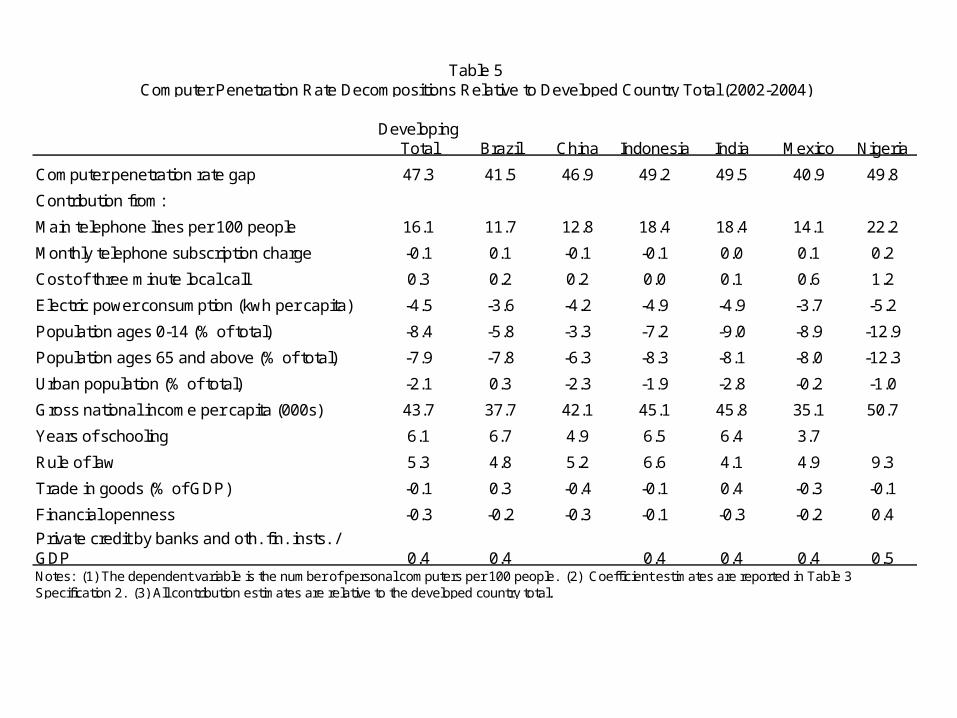
DevelopingTotal Brazil China Indonesia India Mexico Nigeria
Computer penetration rate gap 47.3 41.5 46.9 49.2 49.5 40.9 49.8
Contribution from:
Main telephone lines per 100 people 16.1 11.7 12.8 18.4 18.4 14.1 22.2
Monthly telephone subscription charge -0.1 0.1 -0.1 -0.1 0.0 0.1 0.2
Cost of three minute local call 0.3 0.2 0.2 0.0 0.1 0.6 1.2
Electric power consumption (kwh per capita) -4.5 -3.6 -4.2 -4.9 -4.9 -3.7 -5.2
Population ages 0-14 (% of total) -8.4 -5.8 -3.3 -7.2 -9.0 -8.9 -12.9
Population ages 65 and above (% of total) -7.9 -7.8 -6.3 -8.3 -8.1 -8.0 -12.3
Urban population (% of total) -2.1 0.3 -2.3 -1.9 -2.8 -0.2 -1.0
Gross national income per capita (000s) 43.7 37.7 42.1 45.1 45.8 35.1 50.7
Years of schooling 6.1 6.7 4.9 6.5 6.4 3.7
Rule of law 5.3 4.8 5.2 6.6 4.1 4.9 9.3
Trade in goods (% of GDP) -0.1 0.3 -0.4 -0.1 0.4 -0.3 -0.1
Financial openness -0.3 -0.2 -0.3 -0.1 -0.3 -0.2 0.4
Private credit by banks and oth. fin. insts. / GDP 0.4 0.4 0.4 0.4 0.4 0.5Notes: (1) The dependent variable is the number of personal computers per 100 people. (2) Coefficient estimates are reported in Table 3 Specification 2. (3) All contribution estimates are relative to the developed country total.
Table 5Computer Penetration Rate Decompositions Relative to Developed Country Total (2002-2004)

DevelopingTotal Brazil China Indonesia India Mexico Nigeria
Internet penetration rate gap 42.7 37.2 41.4 43.3 45.2 35.4 46.6
Contribution from:
Main telephone lines per 100 people 4.3 3.2 4.3 5.0 5.0 3.8 6.6
Monthly telephone subscription charge 0.1 -0.2 0.3 0.2 0.0 -0.1 0.5
Cost of three minute local call 0.2 0.1 0.1 0.0 0.0 0.4 0.8
Electric power consumption (kwh per capita) 4.5 3.6 4.2 4.9 4.9 3.7 5.2
Population ages 0-14 (% of total) -7.7 -5.3 -2.7 -6.6 -8.2 -8.1 -12.4
Population ages 65 and above (% of total) 1.6 1.6 -0.6 1.7 1.7 1.7 0.9
Urban population (% of total) 2.1 -0.3 1.5 1.9 2.8 0.2 2.6
Gross national income per capita (000s) 20.6 17.8 24.3 21.3 21.6 16.6 24.3
Years of schooling 4.6 5.0 3.8 4.9 4.7 2.8
Rule of law 9.7 8.8 11.2 12.1 7.5 8.9 16.1
Trade in goods (% of GDP) 0.0 0.0 0.0 0.0 0.0 0.0 0.0
Financial openness -1.2 -1.0 -1.5 -0.5 -1.4 -0.8 -0.8
Private credit by banks and oth. fin. insts. / GDP 6.3 6.0 6.9 6.2 7.1 7.2Notes: (1) The dependent variable is the number of Internet users per 100 people. (2) Coefficient estimates are reported in Table 3 Specification 2. (3) All contribution estimates are relative to the developed country total.
Table 6Internet Penetration Rate Decompositions Relative to Developed Country Total (2002-2004)

Summary
Income, human capital, the youth dependency ratio, telephone density, legal quality and banking sector development are associated with technology penetration rates.
Overall, the factors associated with computer and Internet penetration do not differ substantially between developed and developing countries.
Estimates from Blinder-Oaxaca decompositions reveal that the main factors responsible for low rates of technology penetration rates in developing countries are disparities in income, telephone density, legal quality and human capital.

U.S. Digital Divide
The United States has one of the highest computer and Internet penetration rates in the world,
But, nearly 30 percent of children in the United States do not have access to the Internet in their homes.
Large disparities in access to technology by race and income Disparities will not disappear soon

Home Internet Use by Income LevelCurrent Population Survey, 2007
0
20
40
60
80
100
Under$5000
5,000-9,999 10,000-14,999
15,000-19,999
20,000-24,999
25,000-34,999
35,000-49,999
50,000-74,999
75,000-99,999
100,000-149,999
150,000+

Home Internet Use by RaceCurrent Population Survey, 2007
0
20
40
60
80
100
White Black Native American Asian Latino

Percent of the Population (Ages 18+) Who Use the Internet at Home by Race/EthnicityCurrrent Population Survey, 1997-2007
0%
20%
40%
60%
80%
100%
1997 1998 1999 2000 2001 2002 2003 2004 2005 2006 2007
White non-Latino
Latino
Black

Causes of U.S. Digital Divide
“Explaining Differences in Access to Home Computers and the Internet: A Comparison of Latino Groups to Other Ethnic and Racial Groups”
Current Population Survey, Computer and Internet Use Supplement Decomposition analysis
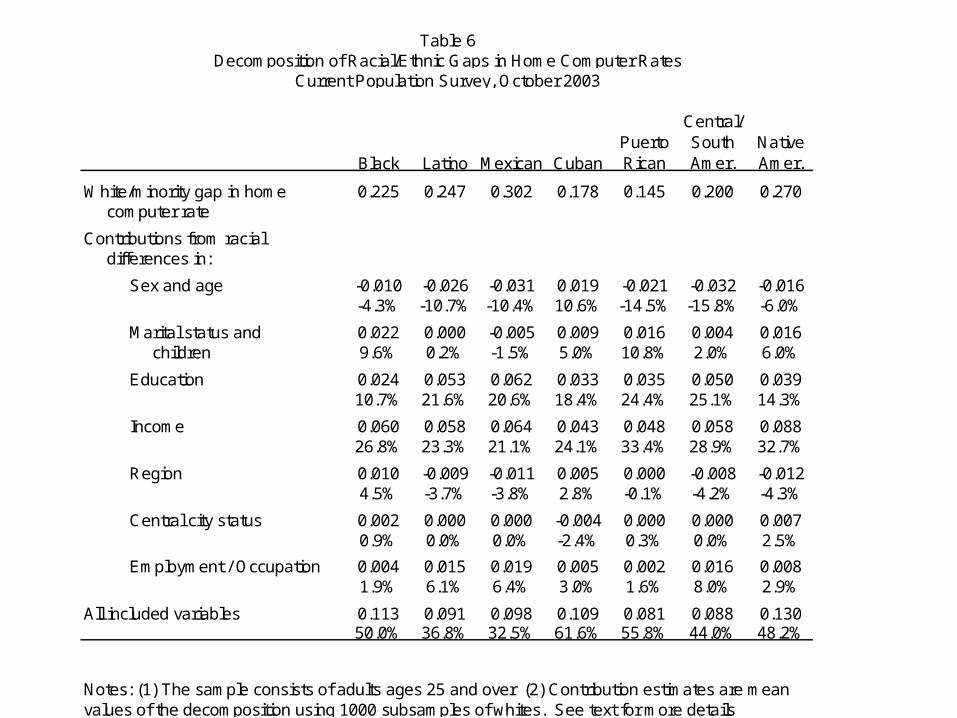
Black Latino Mexican Cuban
Puerto Rican
Central/ South Amer.
Native Amer.
White/minority gap in home 0.225 0.247 0.302 0.178 0.145 0.200 0.270computer rate
Contributions from racialdifferences in:
Sex and age -0.010 -0.026 -0.031 0.019 -0.021 -0.032 -0.016-4.3% -10.7% -10.4% 10.6% -14.5% -15.8% -6.0%
Marital status and 0.022 0.000 -0.005 0.009 0.016 0.004 0.016children 9.6% 0.2% -1.5% 5.0% 10.8% 2.0% 6.0%
Education 0.024 0.053 0.062 0.033 0.035 0.050 0.03910.7% 21.6% 20.6% 18.4% 24.4% 25.1% 14.3%
Income 0.060 0.058 0.064 0.043 0.048 0.058 0.08826.8% 23.3% 21.1% 24.1% 33.4% 28.9% 32.7%
Region 0.010 -0.009 -0.011 0.005 0.000 -0.008 -0.0124.5% -3.7% -3.8% 2.8% -0.1% -4.2% -4.3%
Central city status 0.002 0.000 0.000 -0.004 0.000 0.000 0.0070.9% 0.0% 0.0% -2.4% 0.3% 0.0% 2.5%
Employment / Occupation 0.004 0.015 0.019 0.005 0.002 0.016 0.0081.9% 6.1% 6.4% 3.0% 1.6% 8.0% 2.9%
All included variables 0.113 0.091 0.098 0.109 0.081 0.088 0.13050.0% 36.8% 32.5% 61.6% 55.8% 44.0% 48.2%
Notes: (1) The sample consists of adults ages 25 and over (2) Contribution estimates are mean values of the decomposition using 1000 subsamples of whites. See text for more details
Table 6Decomposition of Racial/Ethnic Gaps in Home Computer Rates
Current Population Survey, October 2003

Summary of Explanations
Differences in income and education are largest factors, but explain only part of the ethnic and racial disparities in home computer and Internet access.
Language is also found to be an important determinant of home computer and Internet access even after controlling for education, family income and immigrant status.
Concerns over privacy on the Internet do not appear to contribute substantially to racial disparities in home Internet access.

Why Do We Care? Potential Consequences of the Digital Divide
Education Labor Market Communications Politics Consumers Health Information Community Involvement Government Emergency Information

Educational Consequences
Computer and Internet use in the nation's schools is ubiquitous. Nearly all instructional classrooms in U.S. public schools have
computers with Internet access, with an average of roughly 4 computers per classroom.
E-rate program provides discounts to schools and libraries for the costs of telecommunications services and equipment ($2 billion per year)
Several state, local government and private programs provide laptop computers to schoolchildren (e.g. Maine, $40 million)
Extensive literature focuses on the effects of computer use in classrooms The increasing reliance on computers and the Internet for classroom
instruction, delivering educational content, and completing homework assignments suggests that disparities in home access to technology or the so-called Digital Divide may have implications for educational inequality.

Educational Consequences
“Home Computers and Educational Outcomes: Evidence from the NLSY97 and CPS,’ (with Daniel Beltran and Kuntal Das)

Goals of Study
Examine whether home computers improve educational outcomes among teenagers
Home computers may improve educational outcomes by making it easier to complete school assignments and "open doors to learning,“ but could create a distraction from playing video games and using the Internet.
Methods: Compare children who do not have home computers to children
who have home computers Use regression models to control for differences in family income,
parental education and household characteristics Use two national datasets (Matched CPS and NLSY9)

High School Graduation Rates for 11th Graders with and without Home Computers Current Population Survey, 2000-04
56.7%
73.3%
0%
20%
40%
60%
80%
100%
Without Access to HomeComputer
With Access to HomeComputer

Difference in High School Graduation Rates for Children with and without Home ComputersCurrent Population Survey, 2000-04
16.6%
8.1%
0%
10%
20%
30%
40%
Raw Difference in Rates Difference Controlling forHousehold Characteristics
(Regression Model)

Difference in High School Graduation Rates for Children with and without Home ComputersNational Longitudinal Survey of Youth, 1997-02
23.5%
6.9%
0%
10%
20%
30%
40%
Raw Difference in Rates Difference Controlling forHousehold Characteristics
(Regression Model)

Additional Methods and Youth Outcomes
Instrumental variables, individual fixed effects Having a home computer:
Increases grade point average by 0.2 points (4.0 scale) Decreases school suspension rate by 25 percent Some evidence that computers decrease criminal activities
Validity test: other similar products have no effects Cable television Dictionary at home Future computer

New Research
Random experiment using free computer giveaway Community College in Northern California Study impact on grades, retention and graduation
Maine laptop program Examine impact on test scores and attendance rates

Policy Implications
Policies should address financial, informational and technical constraints to purchasing and using computers among disadvantaged families
Tax breaks, IDAs or loans for educational computer purchases, training programs, and computer donations.
Laptop programs allowing for home use Increase funding for technology-related programs affecting
disadvantaged groups, such as community technology centers Home computers may become more important in the educational
process as schools are increasingly digitizing content and there is growing momentum for replacing textbooks with CD ROMs or Internet-based materials