Embed Size (px)
Citation preview
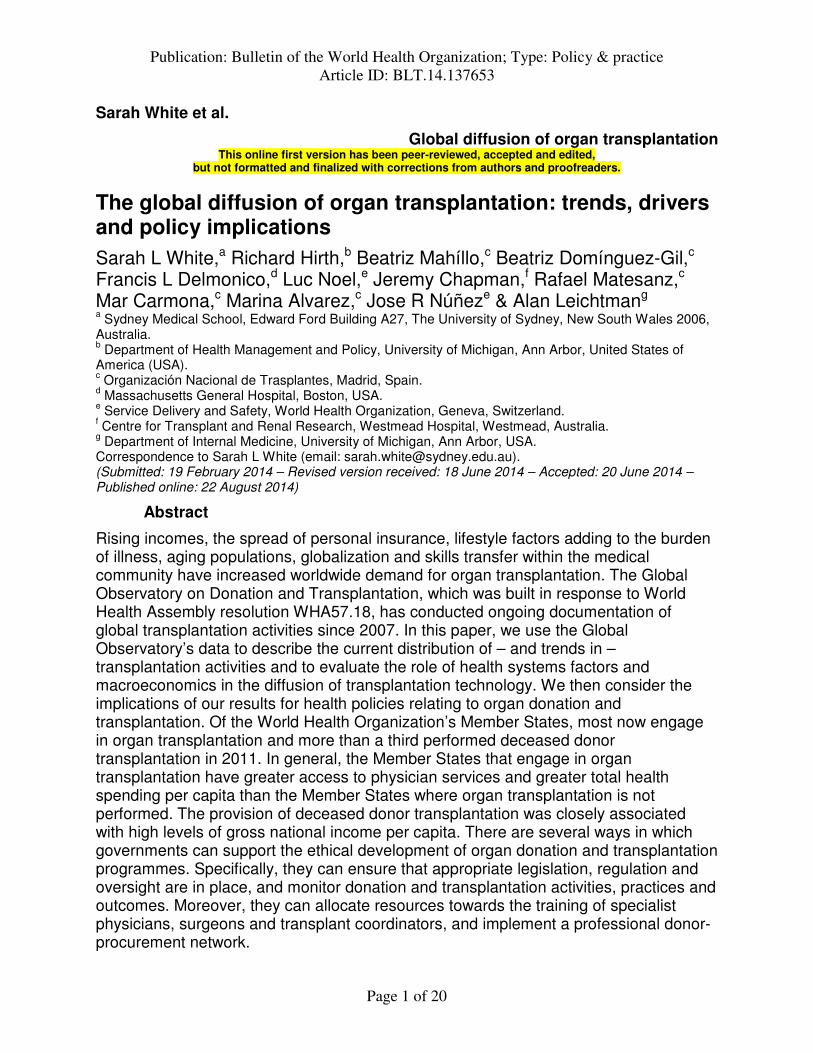
Publication: Bulletin of the World Health Organization; Type: Policy & practice
Article ID: BLT.14.137653
Page 1 of 20
Sarah White et al.
Global diffusion of organ transplantation This online first version has been peer-reviewed, accepted and edited,
but not formatted and finalized with corrections from authors and proofreaders.
The global diffusion of organ transplantation: trends, drivers and policy implications
Sarah L White,a Richard Hirth,b Beatriz Mahíllo,c Beatriz Domínguez-Gil,c Francis L Delmonico,d Luc Noel,e Jeremy Chapman,f Rafael Matesanz,c Mar Carmona,c Marina Alvarez,c Jose R Núñeze & Alan Leichtmang a Sydney Medical School, Edward Ford Building A27, The University of Sydney, New South Wales 2006, Australia. b Department of Health Management and Policy, University of Michigan, Ann Arbor, United States of America (USA). c Organización Nacional de Trasplantes, Madrid, Spain. d Massachusetts General Hospital, Boston, USA. e Service Delivery and Safety, World Health Organization, Geneva, Switzerland. f Centre for Transplant and Renal Research, Westmead Hospital, Westmead, Australia. g Department of Internal Medicine, University of Michigan, Ann Arbor, USA. Correspondence to Sarah L White (email: [email protected]). (Submitted: 19 February 2014 – Revised version received: 18 June 2014 – Accepted: 20 June 2014 – Published online: 22 August 2014)
Abstract
Rising incomes, the spread of personal insurance, lifestyle factors adding to the burden of illness, aging populations, globalization and skills transfer within the medical community have increased worldwide demand for organ transplantation. The Global Observatory on Donation and Transplantation, which was built in response to World Health Assembly resolution WHA57.18, has conducted ongoing documentation of global transplantation activities since 2007. In this paper, we use the Global Observatory’s data to describe the current distribution of – and trends in – transplantation activities and to evaluate the role of health systems factors and macroeconomics in the diffusion of transplantation technology. We then consider the implications of our results for health policies relating to organ donation and transplantation. Of the World Health Organization’s Member States, most now engage in organ transplantation and more than a third performed deceased donor transplantation in 2011. In general, the Member States that engage in organ transplantation have greater access to physician services and greater total health spending per capita than the Member States where organ transplantation is not performed. The provision of deceased donor transplantation was closely associated with high levels of gross national income per capita. There are several ways in which governments can support the ethical development of organ donation and transplantation programmes. Specifically, they can ensure that appropriate legislation, regulation and oversight are in place, and monitor donation and transplantation activities, practices and outcomes. Moreover, they can allocate resources towards the training of specialist physicians, surgeons and transplant coordinators, and implement a professional donor-procurement network.
Publication: Bulletin of the World Health Organization; Type: Policy & practice
Article ID: BLT.14.137653
Page 2 of 20
Introduction In May 2004 the World Health Assembly adopted resolution WHA57.18, in recognition of the
global increase in transplantation activities, the associated risks to patient safety, the trafficking
of organs for transplantation and the trafficking of human beings as sources of such organs. This
resolution urged the World Health Organization’s (WHO’s) Member States to implement
“effective national oversight of the procurement, processing and transplantation of human cells,
tissues and organs” and requested the collection of global data on practices in allogeneic
transplantation and their outcomes.1 In response, the Global Observatory on Donation and
Transplantation was established as an official collaboration between WHO and the Organización
Nacional de Trasplantes.2 In 2011, the Global Observatory contained information on allogenic
donation and transplantation activities for 105 Member States, including records of 112 939 solid
organ transplants performed in 2011.3
In this article, we used Global Observatory data to investigate the current distribution of
global transplantation activities and the temporal trends in rates of solid organ transplantation for
each Global Burden of Disease region.4 We identified the Member States driving these trends
and the health policies that were associated with substantial increases in transplantation activities
between 2006 – i.e. the first year for which the Global Observatory collected comprehensive data
– and 2011. We also evaluated the broad macroeconomic and health system determinants of the
diffusion of the practice of organ transplantation.
International variation in transplantation activities is recognized to be largely unrelated to
the actual distribution of medical need – correlating instead with the resources available for
health-care provision.5,6
In previous studies of countries with established programmes of renal
replacement therapy, the incidence of dialysis and kidney transplantation in a given country has
been found to be significantly associated with that country’s gross domestic product (GDP) per
capita and the percentage of the GDP spent on health care – but not with demographic
characteristics or the underlying risk factor burden.5 These observations are perhaps unsurprising
since, in general, higher income per capita and higher levels of health spending are associated
with greater access to expensive, resource-intensive medical technologies, such as
transplantation.7 However, there are indications that the level of correlation between income per
capita and transplantation activity has diminished over the last few decades. For example, in a
Publication: Bulletin of the World Health Organization; Type: Policy & practice
Article ID: BLT.14.137653
Page 3 of 20
study of the diffusion of kidney transplantation – from 1975 to 1995 – across the countries
belonging to the Organisation for Economic Co-operation and Development, significant
convergence was observed in the number of transplants performed per country but not in GDP
per capita.8 In the present study, therefore, we examined whether income per capita remains a
determinant of the existence and capacity of transplant programmes across the WHO’s Member
States. We also investigated the relationships between transplantation activity and health system
factors including the number of physicians per capita, total health expenditure, public health
expenditure and out-of-pocket payments.
Previous studies on this topic have focused on the number of kidney transplants per
million population per year as the outcome.5,8
However, this approach excludes all countries that
do not currently engage in kidney transplantation and is not ideal for describing countries that
have only recently begun to practise transplantation. We therefore used an alternative method for
evaluating the global diffusion of transplantation technology. This method was based on
categorical levels of health system capacity with respect to solid organ transplantation (Box 1).
The designation of levels of health system capacity – as a framework by which to evaluate the
stage of development of national organ donation and transplantation programmes – was proposed
during the WHO Madrid Consultation in 2010.9 By applying the Global Observatory data to such
a framework, we broadly describe where each Member State stands with respect to the goal of
transplantation self-sufficiency – i.e. the provision of a sufficient number of organs for residents
in need, from within the country or through regional cooperation.10
Trends in transplantation activities Counts for living and deceased donor kidney, liver, pancreas, heart, lung and small bowel
transplants performed between 2006 and 2011 were obtained from the Global Observatory
database.3 Each year, for each of the WHO’s 194 Member States, the Global Observatory sends a
standardized questionnaire to a relevant national focal point or a person officially designated by
the relevant Ministry of Health.11
Activity data were available for 105 Member States in 2011,
including five – Bhutan, Cameroon, Ethiopia, Fiji and the Maldives – that reported no
transplantation activity. Forward interpolation was used from year to year to minimize missing
data. The 10 Member States reporting the highest absolute numbers of living donor transplants in
2011 were the United States of America (n = 6020), India (n = 5482), Turkey (n = 3044), Mexico
Publication: Bulletin of the World Health Organization; Type: Policy & practice
Article ID: BLT.14.137653
Page 4 of 20
(n = 1894), Egypt (n = 1867), Japan (n = 1850), Brazil (n = 1748), Republic of Korea (n = 1620),
Islamic Republic of Iran (n = 1545) and the United Kingdom of Great Britain and Northern
Ireland (n = 1063). The 10 Member States with the highest deceased donor transplant numbers
were the United States (n = 23 368), China (n = 6806), Brazil (n = 5097), France (n = 4634),
Germany (n = 4064), Spain (n = 3886), the United Kingdom (n = 3048), Italy (n = 3020), Canada
(n = 1738) and Poland (n = 1446).
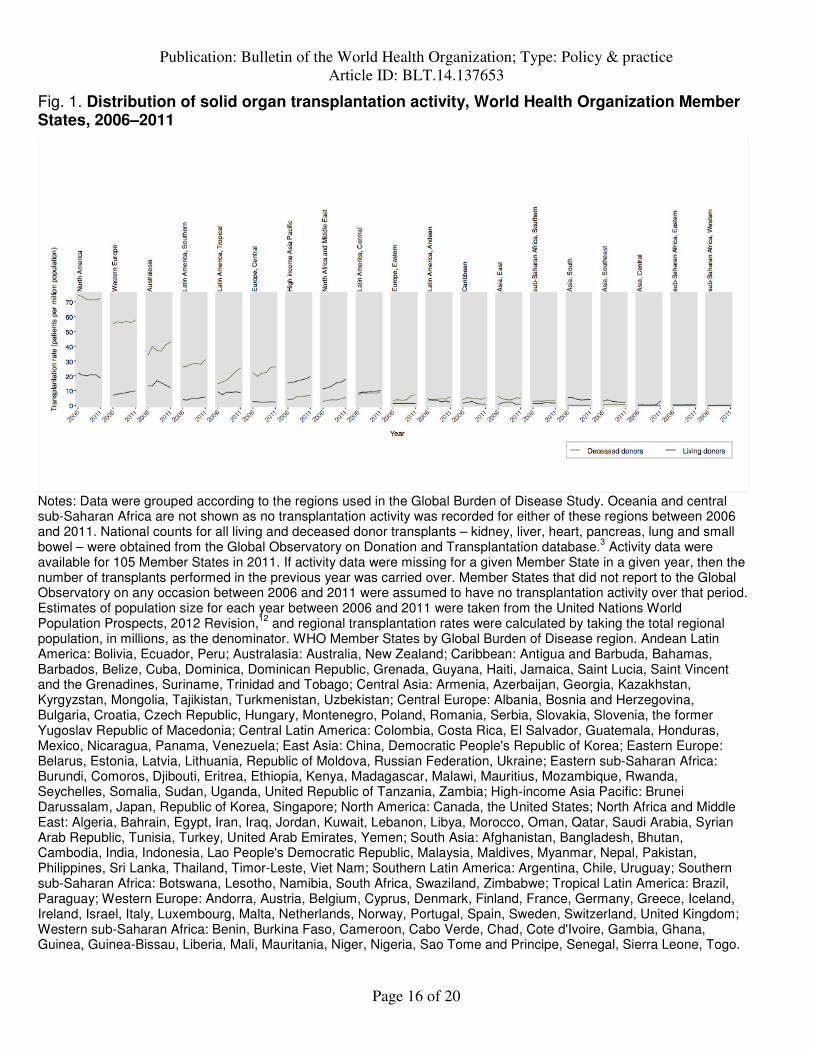
Fig. 1 shows the distribution of solid organ transplantation activities across regions
specified by the Global Burden of Disease study. Both living and deceased donor transplantation
activity increased in north Africa and the Middle East between 2006 and 2011 (Fig. 1). These
regional increases were driven predominantly – in the case of deceased donor transplantation –
by activities in the Islamic Republic of Iran and Turkey, and – in the case of living donor
transplantation – by activities in Jordan and Saudi Arabia.13
Turkey experienced large increases
in transplantation activity following the establishment of its National Coordination Centre in
2001. The establishment of this Centre brought Turkish organ procurement and transplantation
under the control of the national Ministry of Health and reoriented donation and transplantation
around hospital-based transplant coordinators.14
Similar reforms to systems for donor
identification, management and organ recovery in the Republic of Korea15
were probably
important contributors to the increases in transplantation activity also observed for the high-
income Asia Pacific region between 2006 and 2011.
In Australasia, the rate of deceased donor transplantation increased after 2008, coinciding
with the establishment of an official authority responsible for the national coordination of
donation and transplantation systems.16
In tropical Latin America and central Europe, increasing
rates of deceased donor transplantation were driven predominantly by the trends in Brazil and
Croatia, respectively. The rate of deceased donor transplantation in Brazil increased after 2005,
when the Ministry of Health established that all hospitals with more than 80 beds should have an
internal donation and transplantation commission.17
In Croatia, the rate of deceased donor
transplantation increased more than 10-fold in the decade ending in 2011 as the result of several
reforms – including the appointment of hospital and national transplant coordinators, the
introduction of reimbursement for donor hospitals, public awareness campaigns, participation in
cross-border organ sharing through Eurotransplant, and updated legislation.18
Publication: Bulletin of the World Health Organization; Type: Policy & practice
Article ID: BLT.14.137653
Page 5 of 20
The centralization of the coordination of organ donation and transplantation under an
officially recognized authority, the reorientation of organ recovery around transplant
coordinators and the systematization of donor identification and organ recovery are all key
components of the frequently cited “Spanish Model” of organ donation and transplantation.19,20
The successful implementation of these policies by a diverse range of countries – and the impact
on rates of deceased donor transplantation between 2006 and 2011 – are evidence of the potential
effectiveness and reproducibility of the Spanish Model.
Declining rates of living donor transplantation were observed in south Asia and south-
east Asia, where these trends were largely driven by reduced activity in Pakistan and the
Philippines, respectively. The declining rate of deceased donor transplantation observed in east
Asia was driven by reduced activity in China. Pakistan signed into law the Ordinance on Human
Cell and Tissue Transplantation in 2010, thus criminalizing organ sales.21
The Philippines
implemented an expanded anti-human trafficking law in 2009.21
Parallel efforts to curb
transplant tourism by major exporters of recipients have also influenced these trends.22
In China,
declining rates of deceased donor transplantation coincided with a shift away from donation by
executed prisoners, the implementation of laws limiting transplant tourism, and the closure of
transplant programmes that failed to comply with new regulations.23
China is now in the process
of implementing a new national programme of deceased donor transplantation that is based on a
network of hospital-based organ procurement organizations, with oversight from national
committees accountable to the Ministry of Health.24
Global diffusion As at 31 December, 2011, the Global Observatory had recorded activity of at least one organ
transplant in 100 Member States, including deceased donor transplantation activity in 69
Member States in the year 2011. Another 11 Member States – Bahrain, Bosnia and Herzegovina,
Honduras, Iraq, Jamaica, Kazakhstan, Montenegro, Serbia, Trinidad and Tobago, Ukraine and
Viet Nam – were identified, via expert review or literature and web-based searches, as currently
being engaged in transplantation activity. Therefore, most (57%) of the WHO’s Member States
were engaged in some level of organ transplantation activity between 2006 and 2011, and over a
third (36%) reported deceased donor transplantation activity in 2011.
Publication: Bulletin of the World Health Organization; Type: Policy & practice
Article ID: BLT.14.137653
Page 6 of 20
Major geographical disparities in access to transplantation persist: 62% of the 112 939
solid organ transplants reported in 2011 were performed in high-income Member States, while
only 28%, 9% and less than 1% were performed in upper-middle-, lower-middle- and low-
income Member States, respectively. It is, however, noteworthy that, although the majority of
organ transplantation takes place in high-income Member States, the practice of organ
transplantation has now diffused across all income strata and has reached the populations of low-
income Member States including Bangladesh, Kenya, Kyrgyzstan, Myanmar, Nepal and
Tajikistan.
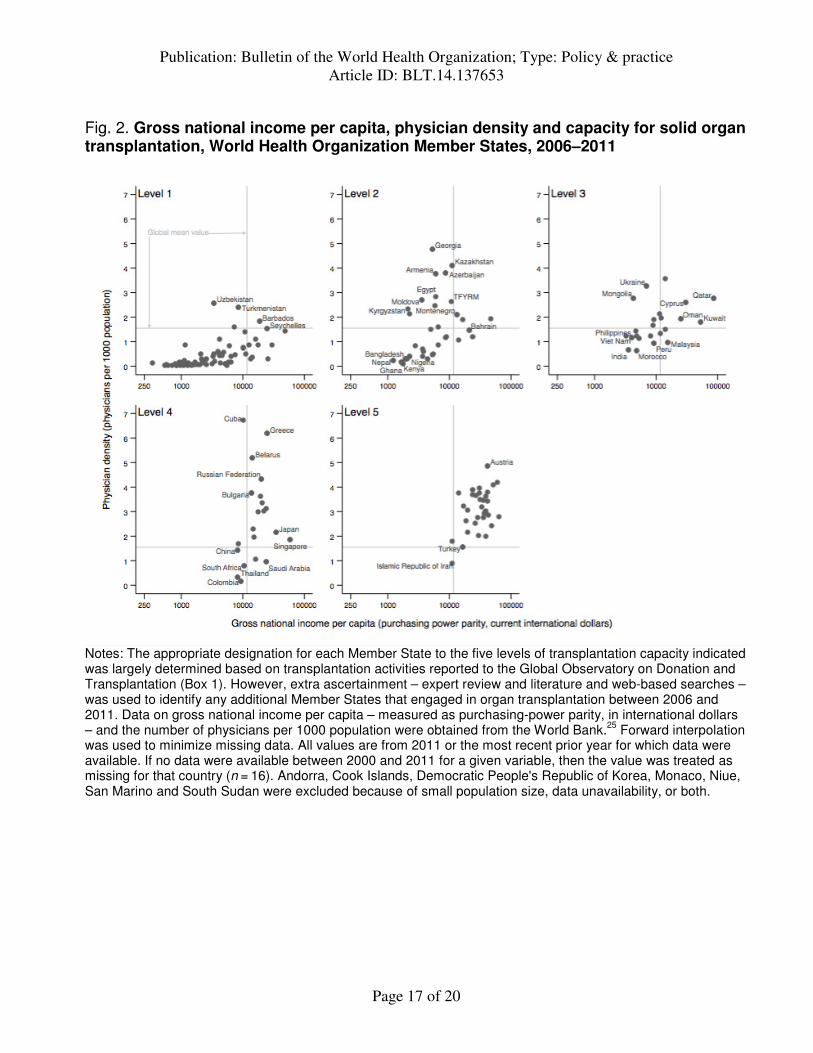
Macroeconomic and health system factors We divided Member States into five levels depending on their transplantation capacity, with
levels 1 and 5 representing Member States with the lowest and highest transplantation capacities,
respectively (Box 1). Fig. 2 shows, for each level of transplantation capacity, the correlation
between gross national income per capita – measured, in terms of purchasing power parity, in
international dollars – and physician-to-population ratio. For the majority of the 76 Member
States not reporting any transplantation activity – i.e. those assigned to level 1 – gross national
income per capita and physician-to-population ratio were generally below the global mean
values, of 12 000 International dollars and 1.5 physicians per 1000 population, respectively.
Level 2 Member States (n = 34), defined as having one or more centres providing living kidney
transplantation, tended to have higher per capita income and notably higher physician-to-patient
ratios compared with level 1 Member States. Exceptions included Bangladesh, Ghana, Kenya,
Nepal, Nigeria, Pakistan and Sudan. The 23 Member States that were assigned to level 3, based
on deceased donor transplantation activity, tended to have higher per capita incomes than level 2
Member States. Most level 4 Member States (n = 21) had per capita incomes and physician-to-
population ratios above the global means – the exceptions being China, Colombia, Thailand and
South Africa. Thirty-two of the 33 Member States assigned to level 5 had two or more
physicians per thousand population and gross national incomes that exceeded 12 000
international dollars per capita – the only exception was the Islamic Republic of Iran. In logistic
regression analyses of these data, higher physician-to-population ratio – but not higher gross
national income per capita – was found to be significantly associated with the existence of any
transplantation activity (Table 1). Among the Member States with any transplantation activity,
Publication: Bulletin of the World Health Organization; Type: Policy & practice
Article ID: BLT.14.137653
Page 7 of 20
however, the existence of deceased donor transplantation activity was found to be significantly
associated with higher gross national income per capita, but not with higher physician-to-
population ratio (Table 1).
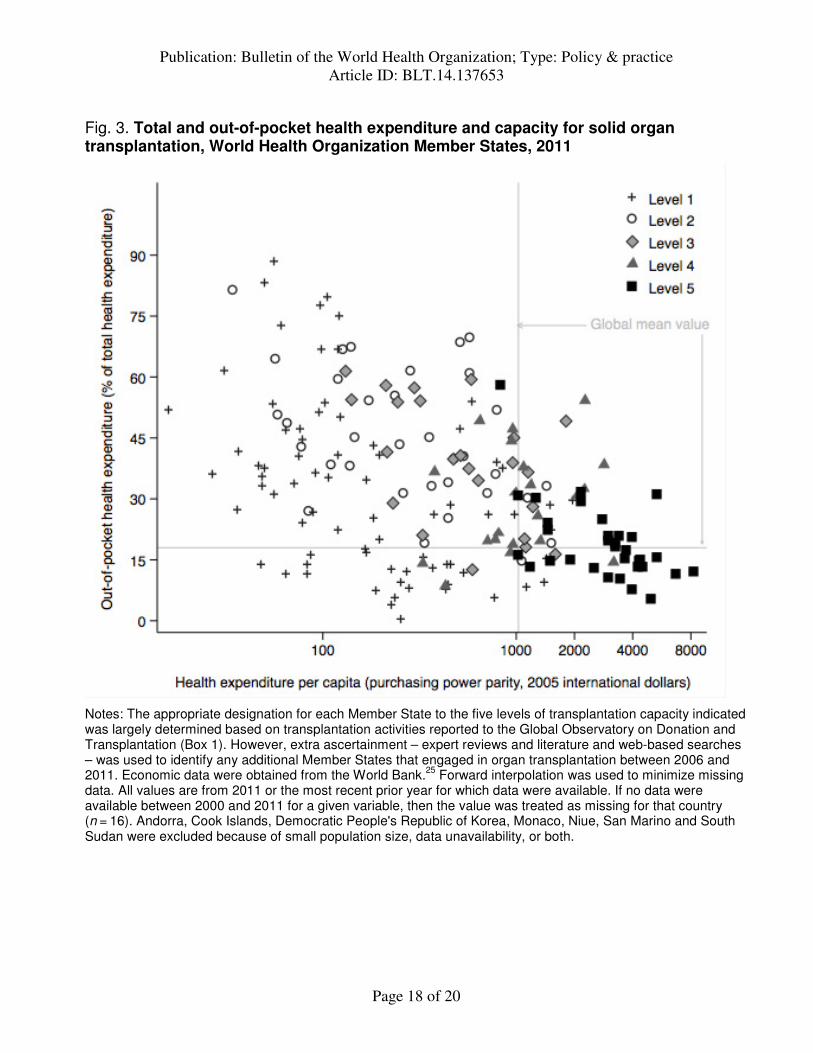
Fig. 3 shows the relationships between out-of-pocket expenditure on health, total health
expenditure per capita and level of transplantation capacity. Member States with the highest level
of transplantation capacity – i.e. those assigned to level 5 – tended to have relatively high total
health expenditures and relatively low out-of-pocket expenditures. Member States that had no
transplantation activity, or living donor transplantation activity only, tended to have below-
average health expenditures – but showed no clear trend with respect to out-of-pocket
expenditures. Logistic regression confirmed that there was no significant association between the
existence of transplantation activity in a Member State and the magnitude of out-of-pocket
expenditures (Table 1). In contrast, after adjusting for out-of-pocket expenditure, higher total
health expenditure per capita was associated with a significant increase in the likelihood of any
transplantation activity and with a nonsignificant increase in the likelihood of having initiated
deceased donor transplantation (Table 1).
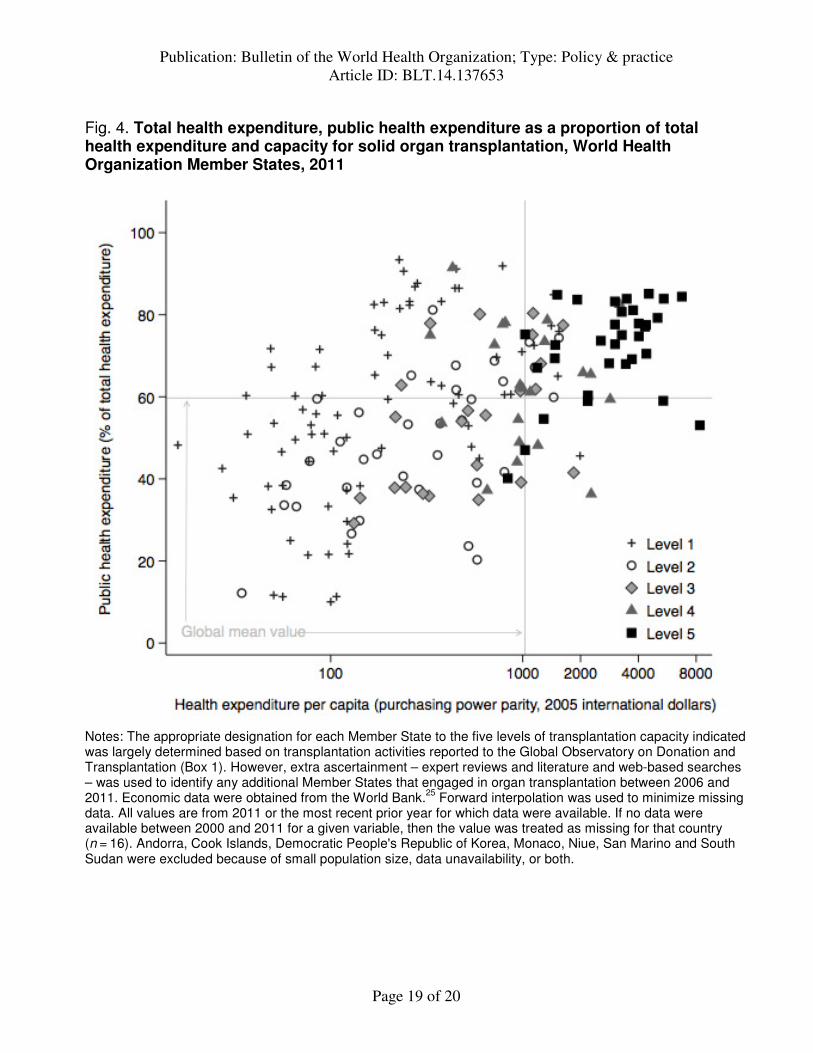
Fig. 4 shows the relationships between the proportions of total health expenditure
accounted for by public funds, total health expenditure per capita and level of transplantation
capacity. Member States with the highest level of transplantation capacity tended to have
relatively high proportions of their health expenditures accounted for by public funds and
relatively high health expenditures per capita. However, there was no evidence of an association
between the existence of transplantation activity in a Member State and public health
expenditure as a percentage of total expenditure. This observation is consistent with previous
findings that showed that total health expenditure – but not the public share of health-care
expenditure – was independently associated with international variation in rates of treatment for
end-stage kidney disease.5 These findings probably reflect diversity in the extent to which the
private sector participates in the delivery of renal replacement therapy.
Overall, our observations indicate that, in general, transplanting Member States have
relatively high health expenditures per capita and populations with relatively good access to
physician services – two factors that are likely to indicate a minimum standard of available
tertiary care. Notable outliers to this observation included the former Soviet countries of central
Publication: Bulletin of the World Health Organization; Type: Policy & practice
Article ID: BLT.14.137653
Page 8 of 20
Asia and eastern Europe, where physician to population ratios are high yet transplantation
capacities are relatively low. Low physician wages, informal payments and negative public
attitudes towards organ donation and transplantation potentially contribute to this
observation.26,27
The situation in this region has begun to improve, however. The north-west
region of the Russian Federation recently introduced a transplant coordination model that is
having a positive impact on the region’s organ donation and transplantation trends.26
Armenia,
Belarus, Georgia, Kazakhstan, the Republic of Moldova and Tajikistan have also taken steps
towards modernizing their organ procurement and transplant systems.28
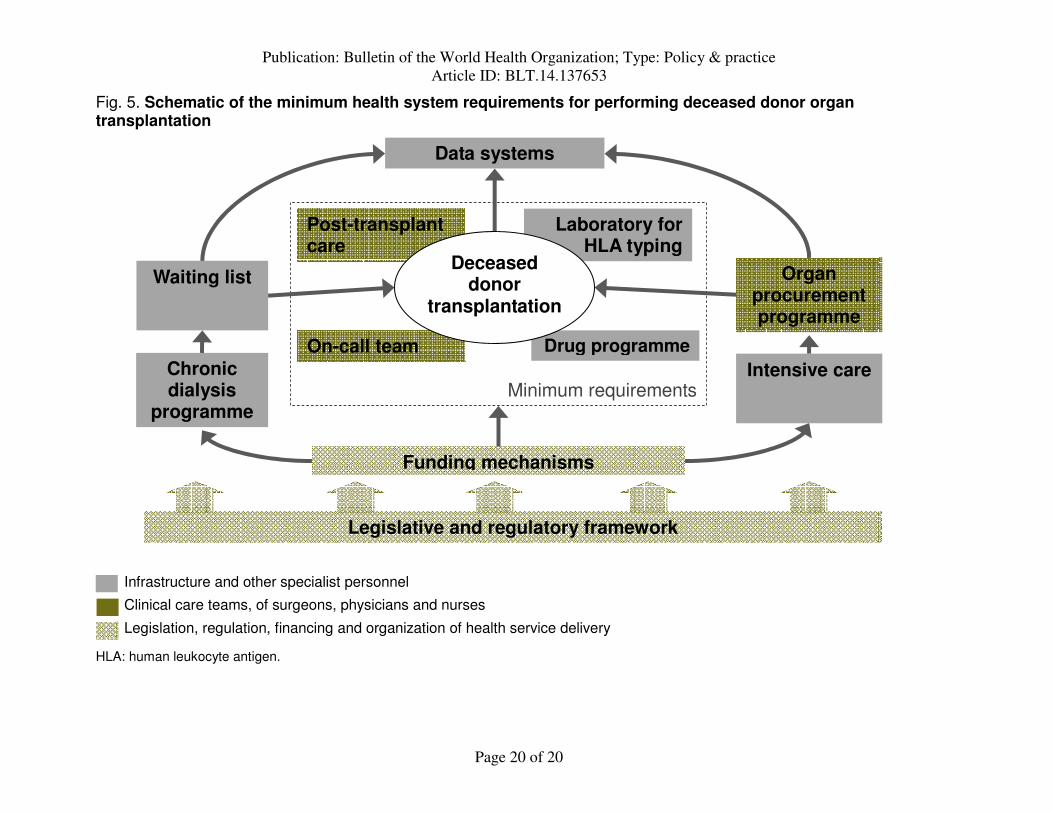
We also observed that, among transplanting countries, provision of deceased donor
transplantation remains significantly associated with gross national income per capita. This
reflects the extra resources and organization needed to support deceased donor transplantation,
including the requirements for a waiting list and allocation system, an organ procurement
programme, an on-call transplantation team and relevant intensive-care resources (Fig. 5).29
For
many low- and middle-income countries, the costs of post-transplantation care and ongoing
immunosuppression present a substantial additional barrier to the development of greater
transplantation capacity.
Lastly, it is worth reflecting on the observation that a substantial proportion of global
transplantation activity takes place in countries where out-of-pocket expenditure on health-care
services exceed the global mean. In this context, the initiation and development of organ
transplantation are likely to be driven by rising purchasing power and the attendant demand for
health care of higher quality by the sector of the population who can afford it. Achieving equity,
transparency and ethical practice in the provision of organ transplantation – especially in a
setting of low economic and health system development and high out-of-pocket expenditures –
will require the implementation of appropriate regulatory frameworks and oversight.
Policy implications Our analysis of the global diffusion of transplantation capacity indicates that, in general,
transplanting and non-transplanting Member States are currently differentiated on the basis of
physician-to-population ratios and health expenditure per capita – but not by gross national
income per capita. Although affluent countries are the earliest adopters of new medical
technologies, the availability of such technologies gradually becomes less dependent on
Publication: Bulletin of the World Health Organization; Type: Policy & practice
Article ID: BLT.14.137653
Page 9 of 20
economic factors over time.8 Rising incomes, the spread of health insurance, lifestyle factors
adding to the burden of illness and aging populations have increased demand for the treatment of
end-stage organ failure in low- and middle-income countries. In addition, actors in the public and
private health sectors may have an interest in increasing the supply of transplant services in low-
and middle-income countries, and linkages to facilitate skills transfer across the international
medical community have been actively contributing to the development of local transplantation
capacities. For these and other reasons, the practice of organ transplantation has now diffused
across all income strata. Therefore, it is appropriate for ministries of health in all jurisdictions –
including low- and middle-income countries – to develop policies with respect to organ donation
and transplantation. An immediate requirement is a legal framework to protect donors and
recipients and to regulate medical practice. The next step is the development of specialist
surgeons, physicians and nurses.
The transition from a transplantation programme that only involves living donor
transplantation to one that includes deceased donor transplantation remains linked with income
per capita. Deceased donor transplantation can only proceed where there is a legal framework in
place for the declaration of death and the lawful removal of organs from deceased persons for the
purpose of transplantation. The elements of a comprehensive national transplantation programme
include: (i) a legal framework and regulatory oversight, (ii) an adequately resourced deceased
donor programme, (iii) a waiting list of candidates who are allocated organs irrespective of
gender, ethnicity or social status, (iv) an ethical living donor programme; and (v) clinical
practices consistent with international standards.29
For countries seeking to increase rates of
deceased donor transplantation, the key reforms of the Spanish Model – i.e. centralized
coordination, orientation of organ recovery around transplant coordinators and systematization of
donor identification and organ recovery – have been effective in a diverse range of countries
(Box 2). For small countries, the development of organ donation and transplantation capacity is
also likely to need regional cooperation.
Finally, in presenting overall regional trends, we have not commented on intraregional
variation in transplantation activities or on the spatial, socioeconomic, racial and gender
disparities in access to transplantation that exist within individual Member States. As the
diffusion of the practice of transplantation continues, equity of access will be a major challenge.
Catch-up growth, market integration, increased personal income and savings and
Publication: Bulletin of the World Health Organization; Type: Policy & practice
Article ID: BLT.14.137653
Page 10 of 20
epidemiological and demographic transitions – all of which have combined to increase the
burden of organ failure in developing countries while simultaneously increasing the wealth of
upper-income households – have the potential both to increase demand for transplantation and to
exacerbate inequities in access within low- and middle-income countries.30
With the integration
of organ donation and transplantation into national health systems, governments are accountable
for establishing programmes in which the opportunity to benefit from transplantation is shared
equally across the population.29
Legislation, regulatory oversight and the monitoring and
transparent reporting of organ donation and transplantation practices through national registries
are key to this accountability.
Competing interests:
None declared.
References
1. Resolution WHA57.18. Human organ and tissue transplantation. In: Fifty-seventh World Health Assembly, Resolutions and decisions, annexes. Geneva, 17-22 May, 2004. Geneva: World Health Organization; 2004.
2. Matesanz R, Mahillo B, Alvarez M, Carmona M. Global observatory and database on donation and transplantation: world overview on transplantation activities. Transplant Proc. 2009 Jul-Aug;41(6):2297–301. http://dx.doi.org/10.1016/j.transproceed.2009.05.004 PMID:19715901
3. Organ donation and transplantation activities, 2011 [internet]. Madrid: Global Observatory on Donation and Transplantation; 2012. Available from: http://www.transplant-observatory.org [cited 2014 Jul 8].
4. Murray CJ, Ezzati M, Flaxman AD, Lim S, Lozano R, Michaud C, et al. GBD 2010: design, definitions, and metrics. Lancet. 2012 Dec 15;380(9859):2063–6. http://dx.doi.org/10.1016/S0140-6736(12)61899-6 PMID:23245602
5. Caskey FJ, Kramer A, Elliott RF, Stel VS, Covic A, Cusumano A, et al. Global variation in renal replacement therapy for end-stage renal disease. Nephrol Dial Transplant. 2011 Aug;26(8):2604–10. http://dx.doi.org/10.1093/ndt/gfq781 PMID:21245131
6. White SL, Chadban SJ, Jan S, Chapman JR, Cass A. How can we achieve global equity in provision of renal replacement therapy? Bull World Health Organ. 2008 Mar;86(3):229–37. http://dx.doi.org/10.2471/BLT.07.041715 PMID:18368211
7. Lázaro P, Fitch K; Organization for Economic Cooperation and Development. The distribution of “big ticket” medical technologies in OECD countries. Int J Technol Assess Health Care. 1995;11(3):552–70. http://dx.doi.org/10.1017/S0266462300008722 PMID:7591552
Publication: Bulletin of the World Health Organization; Type: Policy & practice
Article ID: BLT.14.137653
Page 11 of 20
8. Slade EP, Anderson GF. The relationship between per capita income and diffusion of medical technologies. Health Policy. 2001 Oct;58(1):1–14. http://dx.doi.org/10.1016/S0168-8510(01)00151-8 PMID:11518598
9. Report of the Madrid Consultation: Part 2: Reports from the working groups. Transplantation. 2011 Jun 15;91 Suppl 11:S67–114. http://dx.doi.org/10.1097/01.tp.0000399134.59371.56 PMID:21633284
10. The Madrid resolution on organ donation and transplantation: national responsibility in meeting the needs of patients, guided by the WHO principles. Transplantation. 2011 Jun 15;91 Suppl 11:S29–31. PMID:21633281
11. Mahillo B, Carmona M, Álvarez M, Noel L, Matesanz R. Global Database on Donation and Transplantation: goals, methods and critical issues (www.transplant-observatory.org). Transplant Rev (Orlando). 2013 Apr;27(2):57–60. http://dx.doi.org/10.1016/j.trre.2013.01.001 PMID:23477800
12. World Population Prospects. The 2010 Revision. New York: Department of Economic and Social Affairs, Population Division, United Nations; 2011.
13. Abboud O. Incidence, prevalence, and treatment of end-stage renal disease in the Middle East. Ethn Dis. 2006;16(2) Suppl 2:S2–2, 4. PMID:16774000
14. Tokalak I, Karakayali H, Moray G, Bilgin N, Haberal M. Coordinating organ transplantation in Turkey: effects of the National Coordination Center. Prog Transplant. 2005 Sep;15(3):283–5. PMID:16252636
15. Min SI, Kim SY, Park YJ, Min SK, Kim YS, Ahn C, et al. Trends in deceased organ donation and utilization in Korea: 2000–2009. J Korean Med Sci. 2010 Aug;25(8):1122–7. http://dx.doi.org/10.3346/jkms.2010.25.8.1122 PMID:20676320
16. Australian Organ and Tissue Donation and Transplantation Authority Act 2008 (Document No.122). Canberra: Department of Health and Ageing; 2008. Available from: http://www.comlaw.gov.au/Details/C2008A00122 [cited 2014 Jul 8].
17. Medina-Pestana JO, Galante NZ, Tedesco-Silva H Jr, Harada KM, Garcia VD, Abbud-Filho M, et al. Kidney transplantation in Brazil and its geographic disparity. J Bras Nefrol. 2011;33(4):472-84. PMID:22189813
18. Živčić-Ćosić S, Bušić M, Župan Ž, Pelčić G, Anušić Juričić M, Jurčić Ž, et al. Development of the Croatian model of organ donation and transplantation. Croat Med J. 2013 Feb;54(1):65–70. http://dx.doi.org/10.3325/cmj.2013.54.65 PMID:23444248
19. Matesanz R, Miranda B. A decade of continuous improvement in cadaveric organ donation: the Spanish model. J Nephrol. 2002 Jan-Feb;15(1):22–8. PMID:11936422
20. Matesanz R, Domínguez-Gil B, Coll E, de la Rosa G, Marazuela R. Spanish experience as a leading country: what kind of measures were taken? Transpl Int.
Publication: Bulletin of the World Health Organization; Type: Policy & practice
Article ID: BLT.14.137653
Page 12 of 20
2011 Apr;24(4):333–43. http://dx.doi.org/10.1111/j.1432-2277.2010.01204.x PMID:21210863
21. Danovitch GM, Chapman J, Capron AM, Levin A, Abbud-Filho M, Al Mousawi M, et al. Organ trafficking and transplant tourism: the role of global professional ethical standards-the 2008 Declaration of Istanbul. Transplantation. 2013 Jun 15;95(11):1306–12. http://dx.doi.org/10.1097/TP.0b013e318295ee7d PMID:23644753
22. Padilla B, Danovitch GM, Lavee J. Impact of legal measures prevent transplant tourism: the interrelated experience of The Philippines and Israel. Med Health Care Philos. 2013 Nov;16(4):915–9. http://dx.doi.org/10.1007/s11019-013-9473-5 PMID:23456634
23. Huang J, Mao Y, Millis JM. Government policy and organ transplantation in China. Lancet. 2008 Dec 6;372(9654):1937–8. http://dx.doi.org/10.1016/S0140-6736(08)61359-8 PMID:18930537
24. Huang J, Wang H, Fan ST, Zhao B, Zhang Z, Hao L, et al. The national program for deceased organ donation in China. Transplantation. 2013 Jul 15;96(1):5–9. http://dx.doi.org/10.1097/TP.0b013e3182985491 PMID:23743728
25. World Development Indicators [internet]. Washington: The World Bank; 2013. Available from: http://data.worldbank.org/indicator [cited 2013 Feb 19].
26. Reznik ON, Bagnenko SF, Loginov IV, Pogrebnichenko IV, Kechaeva NV, Fedotov VA, et al. Transplant coordination in Russia: first experience. Transplant Proc. 2008 May;40(4):1014–7. http://dx.doi.org/10.1016/j.transproceed.2008.03.054 PMID:18555103
27. Rechel B, McKee M. Health reform in central and eastern Europe and the former Soviet Union. Lancet. 2009 Oct 3;374(9696):1186–95. http://dx.doi.org/10.1016/S0140-6736(09)61334-9 PMID:19801097
28. 2nd Consultation of Tissue and Organ Transplantation for the Newly Independent States. Copenhagen: World Health Organization Regional Office for Europe; 2009.
29. Delmonico FL, Domínguez-Gil B, Matesanz R, Noel L. A call for government accountability to achieve national self-sufficiency in organ donation and transplantation. Lancet. 2011 Oct 15;378(9800):1414–8. http://dx.doi.org/10.1016/S0140-6736(11)61486-4 PMID:22000137
30. Capital for the Future: Saving and investment in an interdependent world. Washington: The World Bank; 2013.
Publication: Bulletin of the World Health Organization; Type: Policy & practice
Article ID: BLT.14.137653
Page 13 of 20
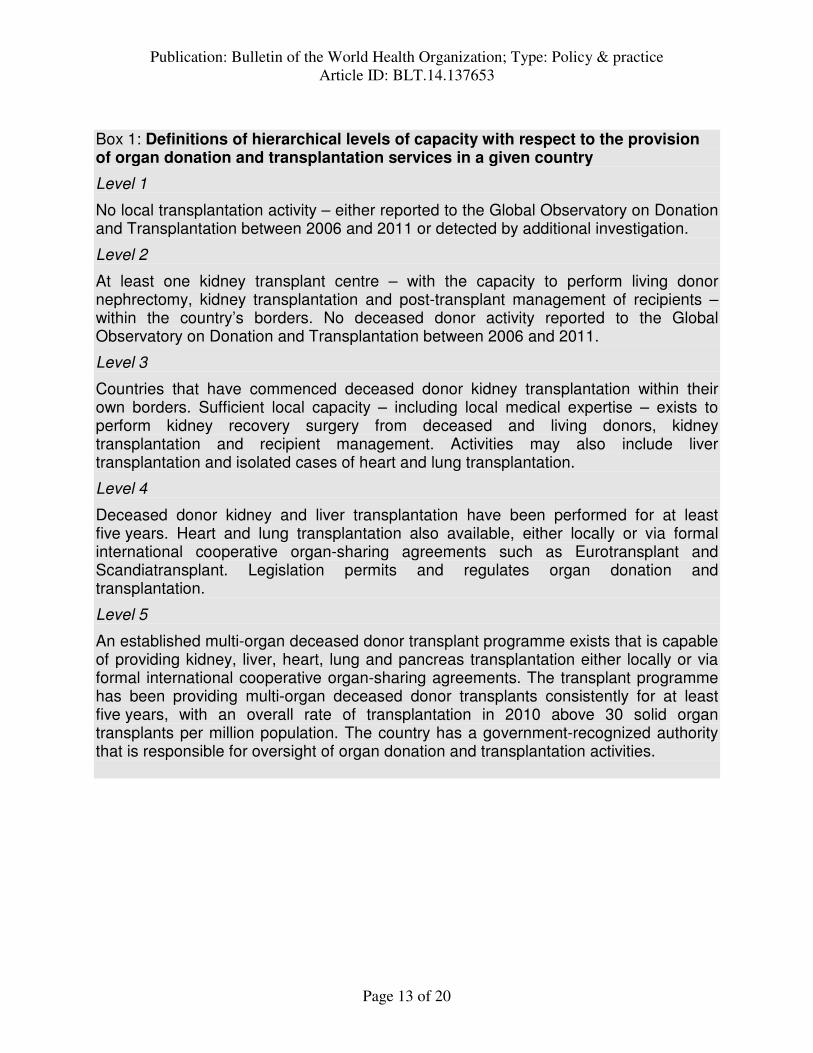
Box 1: Definitions of hierarchical levels of capacity with respect to the provision of organ donation and transplantation services in a given country
Level 1
No local transplantation activity – either reported to the Global Observatory on Donation and Transplantation between 2006 and 2011 or detected by additional investigation.
Level 2
At least one kidney transplant centre – with the capacity to perform living donor nephrectomy, kidney transplantation and post-transplant management of recipients – within the country’s borders. No deceased donor activity reported to the Global Observatory on Donation and Transplantation between 2006 and 2011.
Level 3
Countries that have commenced deceased donor kidney transplantation within their own borders. Sufficient local capacity – including local medical expertise – exists to perform kidney recovery surgery from deceased and living donors, kidney transplantation and recipient management. Activities may also include liver transplantation and isolated cases of heart and lung transplantation.
Level 4
Deceased donor kidney and liver transplantation have been performed for at least five years. Heart and lung transplantation also available, either locally or via formal international cooperative organ-sharing agreements such as Eurotransplant and Scandiatransplant. Legislation permits and regulates organ donation and transplantation.
Level 5
An established multi-organ deceased donor transplant programme exists that is capable of providing kidney, liver, heart, lung and pancreas transplantation either locally or via formal international cooperative organ-sharing agreements. The transplant programme has been providing multi-organ deceased donor transplants consistently for at least five years, with an overall rate of transplantation in 2010 above 30 solid organ transplants per million population. The country has a government-recognized authority that is responsible for oversight of organ donation and transplantation activities.
Publication: Bulletin of the World Health Organization; Type: Policy & practice
Article ID: BLT.14.137653
Page 14 of 20
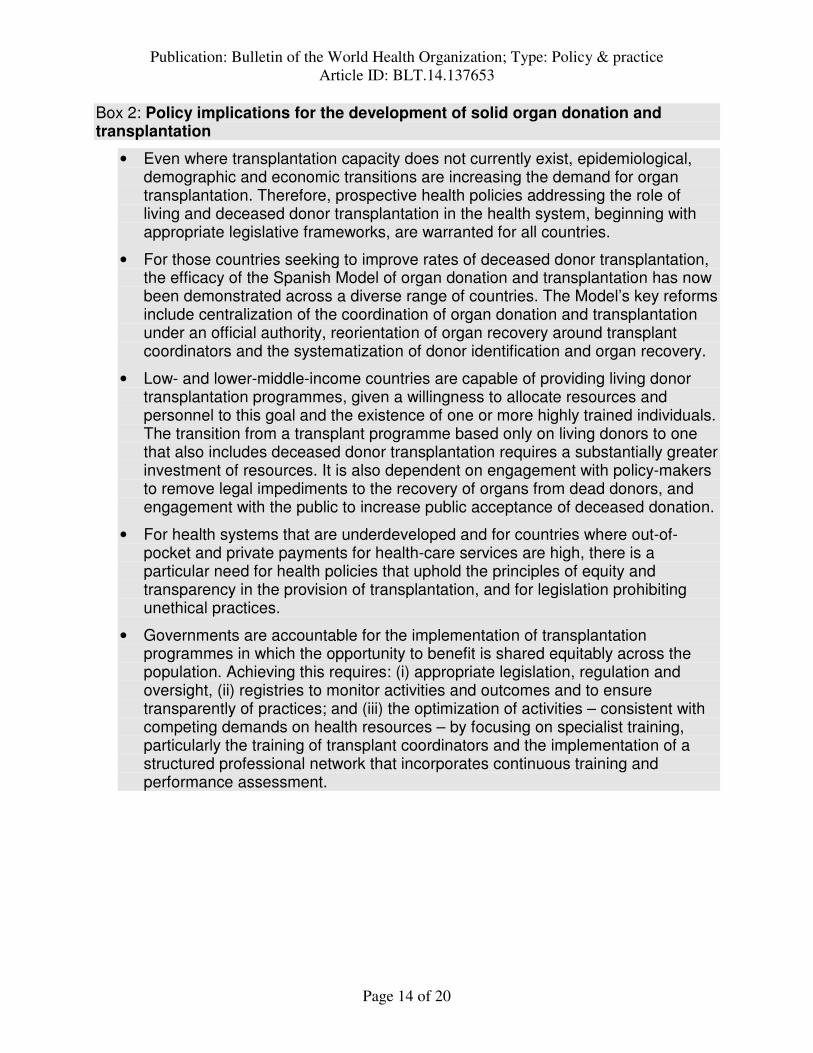
Box 2: Policy implications for the development of solid organ donation and transplantation
• Even where transplantation capacity does not currently exist, epidemiological, demographic and economic transitions are increasing the demand for organ transplantation. Therefore, prospective health policies addressing the role of living and deceased donor transplantation in the health system, beginning with appropriate legislative frameworks, are warranted for all countries.
• For those countries seeking to improve rates of deceased donor transplantation, the efficacy of the Spanish Model of organ donation and transplantation has now been demonstrated across a diverse range of countries. The Model’s key reforms include centralization of the coordination of organ donation and transplantation under an official authority, reorientation of organ recovery around transplant coordinators and the systematization of donor identification and organ recovery.
• Low- and lower-middle-income countries are capable of providing living donor transplantation programmes, given a willingness to allocate resources and personnel to this goal and the existence of one or more highly trained individuals. The transition from a transplant programme based only on living donors to one that also includes deceased donor transplantation requires a substantially greater investment of resources. It is also dependent on engagement with policy-makers to remove legal impediments to the recovery of organs from dead donors, and engagement with the public to increase public acceptance of deceased donation.
• For health systems that are underdeveloped and for countries where out-of-pocket and private payments for health-care services are high, there is a particular need for health policies that uphold the principles of equity and transparency in the provision of transplantation, and for legislation prohibiting unethical practices.
• Governments are accountable for the implementation of transplantation programmes in which the opportunity to benefit is shared equitably across the population. Achieving this requires: (i) appropriate legislation, regulation and oversight, (ii) registries to monitor activities and outcomes and to ensure transparently of practices; and (iii) the optimization of activities – consistent with competing demands on health resources – by focusing on specialist training, particularly the training of transplant coordinators and the implementation of a structured professional network that incorporates continuous training and performance assessment.
Publication: Bulletin of the World Health Organization; Type: Policy & practice
Article ID: BLT.14.137653
Page 15 of 20
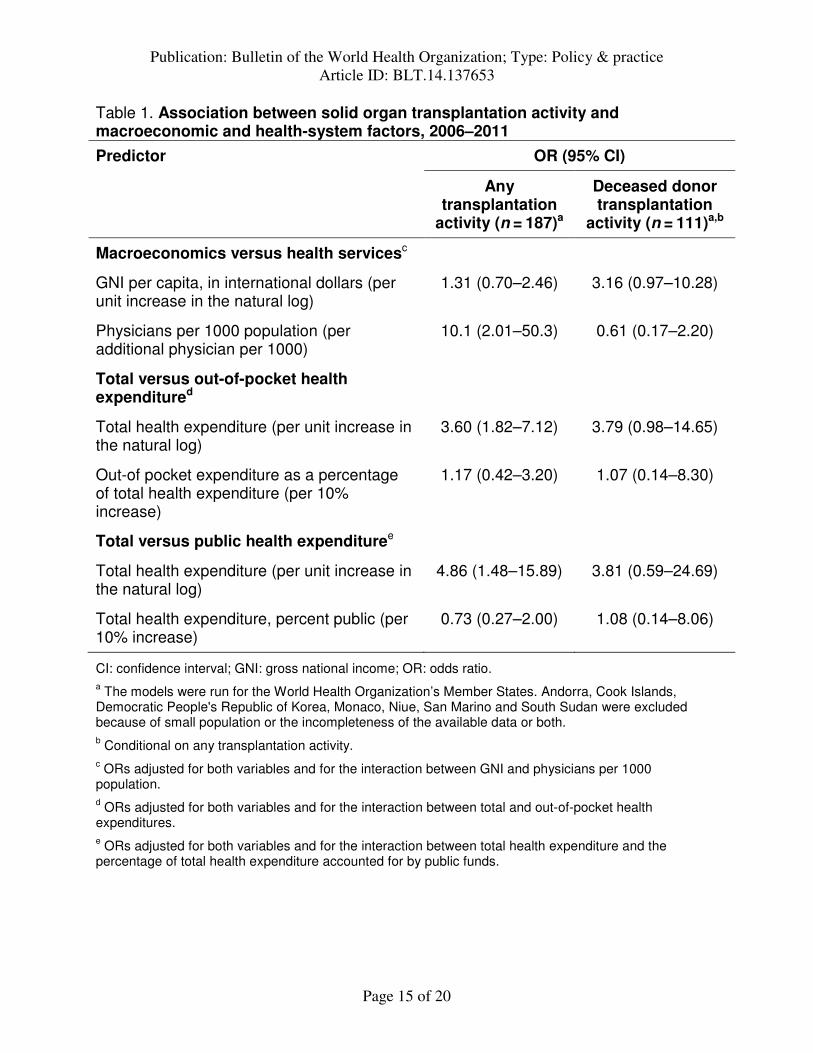
Table 1. Association between solid organ transplantation activity and macroeconomic and health-system factors, 2006–2011
Predictor OR (95% CI)
Any transplantation
activity (n = 187)a
Deceased donor transplantation
activity (n = 111)a,b
Macroeconomics versus health servicesc
GNI per capita, in international dollars (per unit increase in the natural log)
1.31 (0.70–2.46) 3.16 (0.97–10.28)
Physicians per 1000 population (per additional physician per 1000)
10.1 (2.01–50.3) 0.61 (0.17–2.20)
Total versus out-of-pocket health expenditured
Total health expenditure (per unit increase in the natural log)
3.60 (1.82–7.12) 3.79 (0.98–14.65)
Out-of pocket expenditure as a percentage of total health expenditure (per 10% increase)
1.17 (0.42–3.20) 1.07 (0.14–8.30)
Total versus public health expendituree
Total health expenditure (per unit increase in the natural log)
4.86 (1.48–15.89) 3.81 (0.59–24.69)
Total health expenditure, percent public (per 10% increase)
0.73 (0.27–2.00) 1.08 (0.14–8.06)
CI: confidence interval; GNI: gross national income; OR: odds ratio. a The models were run for the World Health Organization’s Member States. Andorra, Cook Islands, Democratic People's Republic of Korea, Monaco, Niue, San Marino and South Sudan were excluded because of small population or the incompleteness of the available data or both. b Conditional on any transplantation activity. c ORs adjusted for both variables and for the interaction between GNI and physicians per 1000 population. d ORs adjusted for both variables and for the interaction between total and out-of-pocket health expenditures. e ORs adjusted for both variables and for the interaction between total health expenditure and the percentage of total health expenditure accounted for by public funds.
Publication: Bulletin of the World Health Organization; Type: Policy & practice
Article ID: BLT.14.137653
Page 16 of 20
Fig. 1. Distribution of solid organ transplantation activity, World Health Organization Member States, 2006–2011
Notes: Data were grouped according to the regions used in the Global Burden of Disease Study. Oceania and central sub-Saharan Africa are not shown as no transplantation activity was recorded for either of these regions between 2006 and 2011. National counts for all living and deceased donor transplants – kidney, liver, heart, pancreas, lung and small bowel – were obtained from the Global Observatory on Donation and Transplantation database.3 Activity data were available for 105 Member States in 2011. If activity data were missing for a given Member State in a given year, then the number of transplants performed in the previous year was carried over. Member States that did not report to the Global Observatory on any occasion between 2006 and 2011 were assumed to have no transplantation activity over that period. Estimates of population size for each year between 2006 and 2011 were taken from the United Nations World Population Prospects, 2012 Revision,12 and regional transplantation rates were calculated by taking the total regional population, in millions, as the denominator. WHO Member States by Global Burden of Disease region. Andean Latin America: Bolivia, Ecuador, Peru; Australasia: Australia, New Zealand; Caribbean: Antigua and Barbuda, Bahamas, Barbados, Belize, Cuba, Dominica, Dominican Republic, Grenada, Guyana, Haiti, Jamaica, Saint Lucia, Saint Vincent and the Grenadines, Suriname, Trinidad and Tobago; Central Asia: Armenia, Azerbaijan, Georgia, Kazakhstan, Kyrgyzstan, Mongolia, Tajikistan, Turkmenistan, Uzbekistan; Central Europe: Albania, Bosnia and Herzegovina, Bulgaria, Croatia, Czech Republic, Hungary, Montenegro, Poland, Romania, Serbia, Slovakia, Slovenia, the former Yugoslav Republic of Macedonia; Central Latin America: Colombia, Costa Rica, El Salvador, Guatemala, Honduras, Mexico, Nicaragua, Panama, Venezuela; East Asia: China, Democratic People's Republic of Korea; Eastern Europe: Belarus, Estonia, Latvia, Lithuania, Republic of Moldova, Russian Federation, Ukraine; Eastern sub-Saharan Africa: Burundi, Comoros, Djibouti, Eritrea, Ethiopia, Kenya, Madagascar, Malawi, Mauritius, Mozambique, Rwanda, Seychelles, Somalia, Sudan, Uganda, United Republic of Tanzania, Zambia; High-income Asia Pacific: Brunei Darussalam, Japan, Republic of Korea, Singapore; North America: Canada, the United States; North Africa and Middle East: Algeria, Bahrain, Egypt, Iran, Iraq, Jordan, Kuwait, Lebanon, Libya, Morocco, Oman, Qatar, Saudi Arabia, Syrian Arab Republic, Tunisia, Turkey, United Arab Emirates, Yemen; South Asia: Afghanistan, Bangladesh, Bhutan, Cambodia, India, Indonesia, Lao People's Democratic Republic, Malaysia, Maldives, Myanmar, Nepal, Pakistan, Philippines, Sri Lanka, Thailand, Timor-Leste, Viet Nam; Southern Latin America: Argentina, Chile, Uruguay; Southern sub-Saharan Africa: Botswana, Lesotho, Namibia, South Africa, Swaziland, Zimbabwe; Tropical Latin America: Brazil, Paraguay; Western Europe: Andorra, Austria, Belgium, Cyprus, Denmark, Finland, France, Germany, Greece, Iceland, Ireland, Israel, Italy, Luxembourg, Malta, Netherlands, Norway, Portugal, Spain, Sweden, Switzerland, United Kingdom; Western sub-Saharan Africa: Benin, Burkina Faso, Cameroon, Cabo Verde, Chad, Cote d'Ivoire, Gambia, Ghana, Guinea, Guinea-Bissau, Liberia, Mali, Mauritania, Niger, Nigeria, Sao Tome and Principe, Senegal, Sierra Leone, Togo.
Publication: Bulletin of the World Health Organization; Type: Policy & practice
Article ID: BLT.14.137653
Page 17 of 20
Fig. 2. Gross national income per capita, physician density and capacity for solid organ transplantation, World Health Organization Member States, 2006–2011
Notes: The appropriate designation for each Member State to the five levels of transplantation capacity indicated was largely determined based on transplantation activities reported to the Global Observatory on Donation and Transplantation (Box 1). However, extra ascertainment – expert review and literature and web-based searches – was used to identify any additional Member States that engaged in organ transplantation between 2006 and 2011. Data on gross national income per capita – measured as purchasing-power parity, in international dollars – and the number of physicians per 1000 population were obtained from the World Bank.25 Forward interpolation was used to minimize missing data. All values are from 2011 or the most recent prior year for which data were available. If no data were available between 2000 and 2011 for a given variable, then the value was treated as missing for that country (n = 16). Andorra, Cook Islands, Democratic People's Republic of Korea, Monaco, Niue, San Marino and South Sudan were excluded because of small population size, data unavailability, or both.
Publication: Bulletin of the World Health Organization; Type: Policy & practice
Article ID: BLT.14.137653
Page 18 of 20
Fig. 3. Total and out-of-pocket health expenditure and capacity for solid organ transplantation, World Health Organization Member States, 2011
Notes: The appropriate designation for each Member State to the five levels of transplantation capacity indicated was largely determined based on transplantation activities reported to the Global Observatory on Donation and Transplantation (Box 1). However, extra ascertainment – expert reviews and literature and web-based searches – was used to identify any additional Member States that engaged in organ transplantation between 2006 and 2011. Economic data were obtained from the World Bank.25 Forward interpolation was used to minimize missing data. All values are from 2011 or the most recent prior year for which data were available. If no data were available between 2000 and 2011 for a given variable, then the value was treated as missing for that country (n = 16). Andorra, Cook Islands, Democratic People's Republic of Korea, Monaco, Niue, San Marino and South Sudan were excluded because of small population size, data unavailability, or both.
Publication: Bulletin of the World Health Organization; Type: Policy & practice
Article ID: BLT.14.137653
Page 19 of 20
Fig. 4. Total health expenditure, public health expenditure as a proportion of total health expenditure and capacity for solid organ transplantation, World Health Organization Member States, 2011
Notes: The appropriate designation for each Member State to the five levels of transplantation capacity indicated was largely determined based on transplantation activities reported to the Global Observatory on Donation and Transplantation (Box 1). However, extra ascertainment – expert reviews and literature and web-based searches – was used to identify any additional Member States that engaged in organ transplantation between 2006 and 2011. Economic data were obtained from the World Bank.25 Forward interpolation was used to minimize missing data. All values are from 2011 or the most recent prior year for which data were available. If no data were available between 2000 and 2011 for a given variable, then the value was treated as missing for that country (n = 16). Andorra, Cook Islands, Democratic People's Republic of Korea, Monaco, Niue, San Marino and South Sudan were excluded because of small population size, data unavailability, or both.
Publication: Bulletin of the World Health Organization; Type: Policy & practice
Article ID: BLT.14.137653
Page 20 of 20
Fig. 5. Schematic of the minimum health system requirements for performing deceased donor organ transplantation
HLA: human leukocyte antigen.
Data systems
Chronic dialysis
programme
Intensive care
Organ procurement programme
Waiting list
Laboratory for HLA typing
Drug programme On-call team
Post-transplant care
Funding mechanisms
Minimum requirements
Clinical care teams, of surgeons, physicians and nurses
Legislation, regulation, financing and organization of health service delivery
Infrastructure and other specialist personnel
Legislative and regulatory framework
Deceased donor
transplantation


![Final organ transplantation [compatibility mode]](https://img.pdfslide.us/doc/110x75/55c5b3f9bb61eb12048b45b0/final-organ-transplantation-compatibility-mode.jpg)