Embed Size (px)
Citation preview
The Global Competitiveness Report 2014–2015 | 3
CHAPTER 1.1
The Global Competitiveness Index 2014–2015: Accelerating a Robust Recovery to Create Productive Jobs and Support Inclusive GrowthXAVIER SALA-I-MARTÍN
BEÑAT BILBAO-OSORIO
ATTILIO DI BATTISTA
MARGARETA DRZENIEK HANOUZ
CAROLINE GALVAN
THIERRY GEIGER
World Economic Forum
This new edition of The Global Competitiveness Report is launched at a time when the world seems to be finally emerging from the worst financial and economic crisis of the past 80 years and returning to a pre-crisis situation: large interest rate spreads for public debt in hard-hit countries are falling; banking systems seem more robust, even if financial reform has not yet been completed; and access to credit, while still limited, is slowly recovering.
Overall, growth prospects in advanced economies are better than they have been in recent years, albeit very unevenly distributed. The recovery in the United States seems to be comfortably grounded with strong output and employment figures. Japan’s economy, while still needing to translate Abenomics into stronger private demand, seems to be waking up after two decades of stagnation. In Europe the picture is more mixed, with many countries now recording stronger growth and returning to trend growth rates, while some others continue to suffer from weak growth driven by protracted internal demand, high unemployment, and financial fragmentation. Emerging economies are forecasted to grow more modestly than they did in the past. After several years of doing very well and leading global growth, their performance may be affected by a changing environment characterized by greater difficulty accessing capital as well as lower prices for the commodities that fueled past growth—a trend that is also likely to affect many developing economies.
To a large extent, the improvement of the global economic outlook has been the result of bold monetary policies carried out by the Federal Reserve and Central Banks in countries such as the United Kingdom and Japan to substantially expand the amount of money available in the economy. As the economic situation improves, a normalization of monetary policy with a tightening of the financial conditions for both advanced and, most notably, emerging economies could jeopardize the rather positive forecast, especially if productivity-enhancing investment levels do not manage to pick up. Investment and the recovery more broadly will also be influenced by the fact that low inflation, or even deflation, in key advanced economies remains a tangible risk that could derail recovery because real interest rates may rise, increasing the burden of public debt and leading to a stagnation of consumption and investment rates.
In addition, in recent months, a strained geopolitical situation has emerged. Tensions in Ukraine with implications for the relationship between Russia and much of the Western world, as well as between China and Japan, have become more evident. Although the implications of these tensions have not yet fully materialized, they could cause a great deal of disruption in the highly interdependent, global macroeconomic outlook. Finally, one of the legacies of the economic crisis is the acceleration of income inequality in many
© 2014 World Economic Forum
1.1: The Global Competitiveness Index 2014–2015
4 | The Global Competitiveness Report 2014–2015
countries, which can cause important economic and social tensions if not properly addressed.
Against this backdrop, it is clear that this is no time to be complacent. The risks to the global economic outlook remain very real. Past measures, mainly based on expansionary monetary policies, have helped to temporarily avoid a deeper recession and set the foundations for the global recovery in the short term. However, ensuring sustained growth in the long run will depend not on monetary policies, but on boosting the level of productivity of economies. In order to achieve higher levels of productivity, new actions in terms of engaging in much-needed structural reform and productivity-enhancing investments are required. These measures are not only important, as they have always been, but they are also becoming urgent if we are to solidify and accelerate the recovery to create new opportunities and new jobs for larger segments of the population.
For more than three decades, the World Economic Forum’s annual Global Competitiveness Report has studied and benchmarked the many factors underpinning national competitiveness. From the onset, the goal has been to provide insight and stimulate discussion among all stakeholders about the best strategies and policies to help countries to overcome the obstacles to improving competitiveness. In the current economic context, this work is a critical reminder of the importance of sound structural economic fundamentals for sustained growth.
Since 2005, the World Economic Forum has based its competitiveness analysis on the Global Competitiveness Index (GCI), a comprehensive tool that measures the microeconomic and macroeconomic foundations of national competitiveness.1 Recognizing that competitiveness may also be analyzed at other geographical levels, the Forum—through its Global Agenda Council on Competitiveness—has engaged in a parallel strand of work to analyze the drivers of competitiveness at the level of the city. Box 1 presents some of the main conclusions of this work.
In addition, in order to better place the discussion of competitiveness into a societal and environmental context, the Forum has begun exploring the complex relationship between competitiveness and sustainability as measured by its social and environmental dimension. The work carried out to date on these important aspects of human and economic development is described in Chapter 1.2 of this Report.
The final objective of the Forum’s work in this area is to inform a series of structured multi-stakeholder dialogues that can raise awareness and rally support geared toward the transformation of countries, regions, or cities to assist them to become more competitive, offer enhanced opportunities, and raise prosperity.
THE 12 PILLARS OF COMPETITIVENESSWe define competitiveness as the set of institutions, policies, and factors that determine the level of productivity of a country. The level of productivity, in turn, sets the level of prosperity that can be reached by an economy. The productivity level also determines the rates of return obtained by investments in an economy, which in turn are the fundamental drivers of its growth rates. In other words, a more competitive economy is one that is likely to grow faster over time.
The concept of competitiveness thus involves static and dynamic components. Although the productivity of a country determines its ability to sustain a high level of income, it is also one of the central determinants of its return on investment, which is one of the key factors explaining an economy’s growth potential.
Many determinants drive productivity and competitiveness. Understanding the factors behind this process has occupied the minds of economists for hundreds of years, engendering theories ranging from Adam Smith’s focus on specialization and the division of labor to neoclassical economists’ emphasis on investment in physical capital and infrastructure,2 and, more recently, to interest in other mechanisms such as education and training, technological progress, macroeconomic stability, good governance, firm sophistication, and market efficiency, among others. While all of these factors are likely to be important for competitiveness and growth, they are not mutually exclusive—two or more of them can be significant at the same time, and in fact that is what has been shown in the economic literature.3
This open-endedness is captured within the GCI by including a weighted average of many different components, each measuring a different aspect of competitiveness. In addition, Appendix A assesses statistically the robustness of the GCI as an appropriate estimate of the level of productivity and competitiveness of an economy.
The components are grouped into 12 pillars of competitiveness:
First pillar: InstitutionsThe institutional environment is determined by the legal and administrative framework within which individuals, firms, and governments interact to generate wealth. The importance of a sound and fair institutional environment has become all the more apparent during the recent economic and financial crisis and is especially crucial for further solidifying the fragile recovery, given the increasing role played by the state at the international level and for the economies of many countries.
The quality of institutions has a strong bearing on competitiveness and growth.4 It influences investment decisions and the organization of production and plays a key role in the ways in which societies distribute the
© 2014 World Economic Forum
The Global Competitiveness Report 2014–2015 | 5
1.1: The Global Competitiveness Index 2014–2015
by the Global Agenda Council on Competitiveness
More than ever, cities are the lifeblood of the global economy. Increasingly they determine the wealth of nations, which is why the World Economic Forum’s Global Agenda Council on Competitiveness has recently published a study on the competitiveness of cities.1 “Competitiveness” hinges on the productivity of the city—that is, its ability to use available inputs efficiently to drive sustainable economic growth and prosperity.
Never before has the world urbanized at the speed and scale that it is doing today. As of 2010, for the first time in history, over half the world’s population lives in cities. Urban dwellers already account for over 80 percent of global GDP. According to the United Nations,2 globally, an additional 2.5 billion people will move to urban areas by 2050. For the foreseeable future, rapid urbanization will be an almost-exclusively non-Western affair: 94 percent of those who will move to cities in the next few decades will come from the developing world. McKinsey Global Institute estimates that, by 2025, the developing world’s top 443 cities will account for close to half of global GDP growth and 18 percent of global GDP.3 These cities will contain the bulk of about 1 billion new middle-class consumers.
Through 33 case studies of cities around the world—including cities with different endowments, at different stages of development, and with different levels of success—the Forum’s study extracts key lessons for city competitiveness and offers the following checklist of four items, which constitute a “what-to-reform, how-to-reform” agenda:
• First, think institutions—the decision-making framework of the city. Leadership and vision—a clear, far-sighted view of where cities should head, and a single-minded practi-cal will to ensure they get there—show the power of city leaders as CEOs.
• Second, think of the regulatory framework for the city’s business climate. “Getting the basics right”—which involves stable and prudent fiscal policies, including efficient and simple taxation; a flexible labor market; openness to trade and foreign investment; simple and transparent business regulation—is the primary lesson for good public policy, at both national and municipal levels. Cities should develop their own foreign economic policies on trade, foreign investment, tourism, and attracting for-eign talent, and go global as far as they can.
• Third, think “hard connectivity”—the city’s core physical infrastructure. Cities need a mix of planning and organic growth, which are complements of one another, not substitutes for each other. Manhattan is a great example, given both its street grid and the organic expansion it has experienced over the past two centuries.
• Fourth, think “soft connectivity”—the city’s social capital. Education is the ultimate soft connectivity. US cities such as Boston, Pittsburgh, and St. Louis have escaped post-industrial decline and specialized in knowledge-intensive niches by capitalizing on their strengths in education. Next, cities need to facilitate digital infrastructure to sup-port human-computing interfaces that empower indi-viduals. And making cities more liveable—improving the quality of urban life—must become a higher priority for upper-middle-income and high-income cities.
The study also draws a set of concluding observations that need to be taken into account when engaging in reform process: First, successful cities are those that are flexible and adapt quickly to changing conditions. That observation is borne out by the case studies of successful cities in the study. The alternative is to get stuck in mono-industrial, mono-cultural decline. Second, the right mix of priorities requires tailoring to specific conditions and stages of city development. Most obviously, priorities for a Western city with a stable population, facing sluggish growth, unemployment, and an aging population will be quite different from those of an emerging-market city with lower income levels, high growth potential, a quickly expanding population, and big gaps in infrastructure. And finally, reforms at the municipal level are usually more feasible than at the national level, even when the same reforms seem impossible in national capitals. Urbanization trends enlarge these possibilities. Cities should grasp this opportunity, experiment with new rules, and put reforms on a fast track.
Notes
1 The World Economic Forum’s Global Agenda Council on Competitiveness seeks to raise awareness of the importance of competitiveness for economic growth and to identify ways countries can systematically transform their economies. It monitors key trends, identifies global risks, charts relationships, addresses gaps in knowledge and recommends ways to address global challenges (see http://www3.weforum.org/docs/GAC/2014/WEF_GAC_CompetitivenessOfCities_Report_2014.pdf). Members of the Global Agenda Council on Competitiveness (2012–2014) are: Razeen Sally, Visiting Associate Professor, Lee Kuan Yew School of Public Policy, National University of Singapore, Singapore (Chair); Clément Gignac, Chief Economist and Senior Vice-President, Industrial Alliance Insurance and Financial Services, Canada (Vice Chair); Deborah L. Wince-Smith, President, Council on Competitiveness, USA (Vice Chair); Orlando Ayala, Chairman, Emerging Markets, Microsoft Corporation, USA; Jon Azua, President and Chief Executive Officer, Enovatinglab, Spain; Catalina Crane, High Presidential Adviser for Public and Private Affairs, Office of the President of Colombia, Colombia; Mohamed El Dahshan, Regional Economist, African Development Bank; Janamitra Devan, Independent Adviser, Strategy and Leadership, USA; Gao Changlin, Deputy Director-General, Exchange, Development and Service Center for Science and Technology (STTC), People’s Republic of China; Amina Ghanem, Executive Director, Egyptian National Competitiveness Council, Egypt; Arancha Gonzalez Laya, Executive Director, International Trade Centre (ITC), Geneva; Ghassan Hasbani, Chief Executive Officer, Graycoats, Lebanon; Marie-Gabrielle Ineichen-Fleisch, State Secretary for Economic Affairs of Switzerland; Kevin X. Murphy, President and Chief Executive Officer, J.E. Austin Associates (JAA), USA; Arvind Panagariya, Jagdish Bhagwati Professor of Indian Political Economy, School of International and Public Affairs (SIPA), Columbia University, USA; Xavier Sala-i-Martin, Professor, Economics Department, Columbia University, USA; Tong Jiadong, Vice-President, Nankai University, People’s Republic of China; and Jose Antonio Torre Medina, Director, Urbanism and Infrastructure, Monterrey Institute of Technology and Higher Education (ITESM), Mexico.
2 United Nations 2014.
3 Dobbs et al. 2012, p. 5.
Box 1: The competitiveness of cities: A taxonomy of drivers and success factors
© 2014 World Economic Forum
1.1: The Global Competitiveness Index 2014–2015
6 | The Global Competitiveness Report 2014–2015
benefits and bear the costs of development strategies and policies. For example, owners of land, corporate shares, or intellectual property are unwilling to invest in the improvement and upkeep of their property if their rights as owners are not protected.5
The role of institutions goes beyond the legal framework. Government attitudes toward markets and freedoms and the efficiency of its operations are also very important: excessive bureaucracy and red tape,6 overregulation, corruption, dishonesty in dealing with public contracts, lack of transparency and trustworthiness, inability to provide appropriate services for the business sector, and political dependence of the judicial system impose significant economic costs to businesses and slow the process of economic development.
In addition, the proper management of public finances is critical for ensuring trust in the national business environment. Indicators capturing the quality of government management of public finances are therefore included here to complement the measures of macroeconomic stability captured in pillar 3.
Although the economic literature has focused mainly on public institutions, private institutions are also an important element in the process of creating wealth. The global financial crisis, along with numerous corporate scandals, has highlighted the relevance of accounting and reporting standards and transparency for preventing fraud and mismanagement, ensuring good governance, and maintaining investor and consumer confidence. An economy is well served by businesses that are run honestly, where managers abide by strong ethical practices in their dealings with the government, other firms, and the public at large.7 Private-sector transparency is indispensable to business; it can be brought about through the use of standards as well as auditing and accounting practices that ensure access to information in a timely manner.8
Second pillar: InfrastructureExtensive and efficient infrastructure is critical for ensuring the effective functioning of the economy, as it is an important factor in determining the location of economic activity and the kinds of activities or sectors that can develop within a country. Well-developed infrastructure reduces the effect of distance between regions, integrating the national market and connecting it at low cost to markets in other countries and regions. In addition, the quality and extensiveness of infrastructure networks significantly impact economic growth and reduce income inequalities and poverty in a variety of ways.9 A well-developed transport and communications infrastructure network is a prerequisite for the access of less-developed communities to core economic activities and services.
Effective modes of transport—including quality roads, railroads, ports, and air transport—enable entrepreneurs to get their goods and services to market in a secure and timely manner and facilitate the movement of workers to the most suitable jobs. Economies also depend on electricity supplies that are free from interruptions and shortages so that businesses and factories can work unimpeded. Finally, a solid and extensive telecommunications network allows for a rapid and free flow of information, which increases overall economic efficiency by helping to ensure that businesses can communicate and decisions are made by economic actors taking into account all available relevant information.
Third pillar: Macroeconomic environmentThe stability of the macroeconomic environment is important for business and, therefore, is significant for the overall competitiveness of a country.10 Although it is certainly true that macroeconomic stability alone cannot increase the productivity of a nation, it is also recognized that macroeconomic disarray harms the economy, as we have seen in recent years, conspicuously in the European context. The government cannot provide services efficiently if it has to make high-interest payments on its past debts. Running fiscal deficits limits the government’s future ability to react to business cycles. Firms cannot operate efficiently when inflation rates are out of hand. In sum, the economy cannot grow in a sustainable manner unless the macro environment is stable. Macroeconomic stability captured the attention of the public most recently when some advanced economies, notably the United States and some European countries, needed to take urgent action to prevent macroeconomic instability when their public debt reached unsustainable levels in the wake of the global financial crisis.
It is important to note that this pillar evaluates the stability of the macroeconomic environment, so it does not directly take into account the way in which public accounts are managed by the government. This qualitative dimension is captured in the institutions pillar described above.
Fourth pillar: Health and primary educationA healthy workforce is vital to a country’s competitiveness and productivity. Workers who are ill cannot function to their potential and will be less productive. Poor health leads to significant costs to business, as sick workers are often absent or operate at lower levels of efficiency. Investment in the provision of health services is thus critical for clear economic, as well as moral, considerations.11
In addition to health, this pillar takes into account the quantity and quality of the basic education received by the population, which is increasingly important in today’s
© 2014 World Economic Forum
The Global Competitiveness Report 2014–2015 | 7
1.1: The Global Competitiveness Index 2014–2015
economy. Basic education increases the efficiency of each individual worker. Moreover, often workers who have received little formal education can carry out only simple manual tasks and find it much more difficult to adapt to more advanced production processes and techniques, and therefore they contribute less to devising or executing innovations. In other words, lack of basic education can become a constraint on business development, with firms finding it difficult to move up the value chain by producing more sophisticated or value-intensive products.
Fifth pillar: Higher education and trainingQuality higher education and training is crucial for economies that want to move up the value chain beyond simple production processes and products.12 In particular, today’s globalizing economy requires countries to nurture pools of well-educated workers who are able to perform complex tasks and adapt rapidly to their changing environment and the evolving needs of the production system. This pillar measures secondary and tertiary enrollment rates as well as the quality of education as evaluated by business leaders. The extent of staff training is also taken into consideration because of the importance of vocational and continuous on-the-job training—which is neglected in many economies—for ensuring a constant upgrading of workers’ skills.
Sixth pillar: Goods market efficiencyCountries with efficient goods markets are well positioned to produce the right mix of products and services given their particular supply-and-demand conditions, as well as to ensure that these goods can be most effectively traded in the economy. Healthy market competition, both domestic and foreign, is important in driving market efficiency, and thus business productivity, by ensuring that the most efficient firms, producing goods demanded by the market, are those that thrive. The best possible environment for the exchange of goods requires a minimum of government intervention that impedes business activity. For example, competitiveness is hindered by distortionary or burdensome taxes and by restrictive and discriminatory rules on foreign direct investment (FDI)—which limit foreign ownership—as well as on international trade. The recent economic crisis has highlighted the high degree of interdependence of economies worldwide and the degree to which growth depends on open markets. Protectionist measures are counterproductive as they reduce aggregate economic activity.
Market efficiency also depends on demand conditions such as customer orientation and buyer sophistication. For cultural or historical reasons, customers may be more demanding in some countries than in others. This can create an important competitive advantage, as it forces companies to be more innovative
and customer-oriented and thus imposes the discipline necessary for efficiency to be achieved in the market.
Seventh pillar: Labor market efficiencyThe efficiency and flexibility of the labor market are critical for ensuring that workers are allocated to their most effective use in the economy and provided with incentives to give their best effort in their jobs. Labor markets must therefore have the flexibility to shift workers from one economic activity to another rapidly and at low cost, and to allow for wage fluctuations without much social disruption.13 The importance of the latter has been dramatically highlighted by events in Arab countries, where rigid labor markets were an important cause of high youth unemployment. Youth unemployment continues to be high in a number of European countries as well, where important barriers to entry into the labor market remain in place.
Efficient labor markets must also ensure clear strong incentives for employees and efforts to promote meritocracy at the workplace, and they must provide equity in the business environment between women and men. Taken together these factors have a positive effect on worker performance and the attractiveness of the country for talent, two aspects that are growing more important as talent shortages loom on the horizon.
Eighth pillar: Financial market developmentThe financial and economic crisis has highlighted the central role of a sound and well-functioning financial sector for economic activities. An efficient financial sector allocates the resources saved by a nation’s citizens, as well as those entering the economy from abroad, to their most productive uses. It channels resources to those entrepreneurial or investment projects with the highest expected rates of return rather than to the politically connected. A thorough and proper assessment of risk is therefore a key ingredient of a sound financial market.
Business investment is also critical to productivity. Therefore economies require sophisticated financial markets that can make capital available for private-sector investment from such sources as loans from a sound banking sector, well-regulated securities exchanges, venture capital, and other financial products. In order to fulfill all those functions, the banking sector needs to be trustworthy and transparent, and—as has been made so clear recently—financial markets need appropriate regulation to protect investors and other actors in the economy at large.
Ninth pillar: Technological readinessIn today’s globalized world, technology is increasingly essential for firms to compete and prosper. The technological readiness pillar measures the agility with which an economy adopts existing technologies to
© 2014 World Economic Forum
1.1: The Global Competitiveness Index 2014–2015
8 | The Global Competitiveness Report 2014–2015
enhance the productivity of its industries, with specific emphasis on its capacity to fully leverage information and communication technologies (ICTs) in daily activities and production processes for increased efficiency and enabling innovation for competitiveness.14 ICTs have evolved into the “general purpose technology” of our time,15 given their critical spillovers to other economic sectors and their role as industry-wide enabling infrastructure. Therefore ICT access and usage are key enablers of countries’ overall technological readiness.
Whether the technology used has or has not been developed within national borders is irrelevant for its ability to enhance productivity. The central point is that the firms operating in the country need to have access to advanced products and blueprints and the ability to absorb and use them. Among the main sources of foreign technology, FDI often plays a key role, especially for countries at a less advanced stage of technological development. It is important to note that, in this context, the level of technology available to firms in a country needs to be distinguished from the country’s ability to conduct blue-sky research and develop new technologies for innovation that expand the frontiers of knowledge. That is why we separate technological readiness from innovation, captured in the 12th pillar, described below.
Tenth pillar: Market sizeThe size of the market affects productivity since large markets allow firms to exploit economies of scale. Traditionally, the markets available to firms have been constrained by national borders. In the era of globalization, international markets have become a substitute for domestic markets, especially for small countries. Vast empirical evidence shows that trade openness is positively associated with growth. Even if some recent research casts doubts on the robustness of this relationship, there is a general sense that trade has a positive effect on growth, especially for countries with small domestic markets.16
Thus exports can be thought of as a substitute for domestic demand in determining the size of the market for the firms of a country.17 By including both domestic and foreign markets in our measure of market size, we give credit to export-driven economies and geographic areas (such as the European Union) that are divided into many countries but have a single common market.
Eleventh pillar: Business sophisticationThere is no doubt that sophisticated business practices are conducive to higher efficiency in the production of goods and services. Business sophistication concerns two elements that are intricately linked: the quality of a country’s overall business networks and the quality of individual firms’ operations and strategies. These factors are especially important for countries at an advanced
stage of development when, to a large extent, the more basic sources of productivity improvements have been exhausted. The quality of a country’s business networks and supporting industries, as measured by the quantity and quality of local suppliers and the extent of their interaction, is important for a variety of reasons. When companies and suppliers from a particular sector are interconnected in geographically proximate groups, called clusters, efficiency is heightened, greater opportunities for innovation in processes and products are created, and barriers to entry for new firms are reduced. Individual firms’ advanced operations and strategies (branding, marketing, distribution, advanced production processes, and the production of unique and sophisticated products) spill over into the economy and lead to sophisticated and modern business processes across the country’s business sectors.
Twelfth pillar: InnovationInnovation can emerge from new technological and non-technological knowledge. Non-technological innovations are closely related to the know-how, skills, and working conditions that are embedded in organizations and are therefore largely covered by the eleventh pillar of the GCI. The final pillar of competitiveness focuses on technological innovation. Although substantial gains can be obtained by improving institutions, building infrastructure, reducing macroeconomic instability, or improving human capital, all these factors eventually run into diminishing returns. The same is true for the efficiency of the labor, financial, and goods markets. In the long run, standards of living can be largely enhanced by technological innovation. Technological breakthroughs have been at the basis of many of the productivity gains that our economies have historically experienced. These range from the industrial revolution in the 18th century and the invention of the steam engine and the generation of electricity to the more recent digital revolution. The latter is not only transforming the way things are being done, but also opening a wider range of new possibilities in terms of products and services. Innovation is particularly important for economies as they approach the frontiers of knowledge, and the possibility of generating more value by merely integrating and adapting exogenous technologies tends to disappear.18
Although less-advanced countries can still improve their productivity by adopting existing technologies or making incremental improvements in other areas, for those that have reached the innovation stage of development this is no longer sufficient for increasing productivity. Firms in these countries must design and develop cutting-edge products and processes to maintain a competitive edge and move toward even higher value-added activities. This progression requires an environment that is conducive to innovative activity and supported by both the public and the private
© 2014 World Economic Forum
The Global Competitiveness Report 2014–2015 | 9
1.1: The Global Competitiveness Index 2014–2015
sectors. In particular, it means sufficient investment in research and development (R&D), especially by the private sector; the presence of high-quality scientific research institutions that can generate the basic knowledge needed to build the new technologies; extensive collaboration in research and technological developments between universities and industry; and the protection of intellectual property, in addition to high levels of competition and access to venture capital and financing that are analyzed in other pillars of the Index. In light of the recent sluggish recovery and rising fiscal pressures faced by advanced economies, it is important that public and private sectors resist pressures to cut back on the R&D spending that will be so critical for sustainable growth into the future.
The interrelation of the 12 pillarsAlthough we report the results of the 12 pillars of competitiveness separately, it is important to keep in mind that they are not independent: they tend to reinforce each other, and a weakness in one area often has a negative impact in others. For example, a strong innovation capacity (pillar 12) will be very difficult to achieve without a healthy, well-educated and trained workforce (pillars 4 and 5) that is adept at absorbing new
technologies (pillar 9), and without sufficient financing (pillar 8) for R&D or an efficient goods market that makes it possible to take new innovations to market (pillar 6). Although the pillars are aggregated into a single index, measures are reported for the 12 pillars separately because such details provide a sense of the specific areas in which a particular country needs to improve.
Appendix B describes the exact composition of the GCI and the technical details of its construction.
STAGES OF DEVELOPMENT AND THE WEIGHTED INDEXWhile all of the pillars described above will matter to a certain extent for all economies, it is clear that they will affect different economies in different ways: the best way for Cambodia to improve its competitiveness is not the same as the best way for France to do so. This is because Cambodia and France are in different stages of development: as countries move along the development path, wages tend to increase and, in order to sustain this higher income, labor productivity must improve.
In line with well-known economic theory of stages of development, the GCI assumes that, in the first stage, the economy is factor-driven and countries compete based on their factor endowments—primarily
Pillar 5. Higher education
and training
Pillar 6. Goods market efficiency
Pillar 7. Labor market efficiency
Pillar 8. Financial market
development
Pillar 9. Technological readiness
Pillar 10. Market size
Pillar 11. Business sophistication
Pillar 12. Innovation
Pillar 1. Institutions
Pillar 2. Infrastructure
Pillar 3. Macroeconomic environment
Pillar 4. Health and primary education
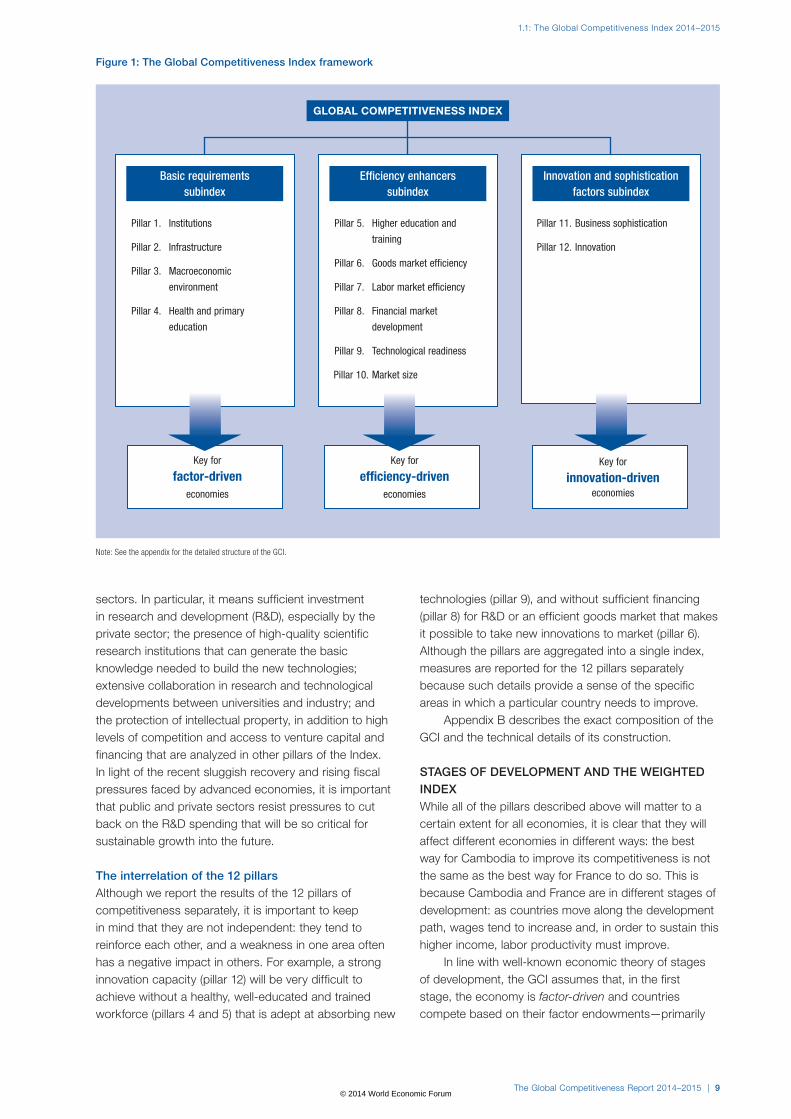
Figure 1: The Global Competitiveness Index framework
Key for
factor-driveneconomies
Key for
efficiency-driveneconomies
Key for
innovation-driveneconomies
Pillar 1. Institutions
Pillar 2. Infrastructure
Pillar 3. Macroeconomic
environment
Pillar 4. Health and primary
education
Pillar 11. Business sophistication
Pillar 12. Innovation
Pillar 5. Higher education and
training
Pillar 6. Goods market efficiency
Pillar 7. Labor market efficiency
Pillar 8. Financial market
development
Pillar 9. Technological readiness
Pillar 10. Market size
Basic requirements subindex
Efficiency enhancers subindex
Innovation and sophistication factors subindex
Note: See the appendix for the detailed structure of the GCI.
GLOBAL COMPETITIVENESS INDEX
© 2014 World Economic Forum
1.1: The Global Competitiveness Index 2014–2015
10 | The Global Competitiveness Report 2014–2015
unskilled labor and natural resources.19 Companies compete on the basis of price and sell basic products or commodities, with their low productivity reflected in low wages. Maintaining competitiveness at this stage of development hinges primarily on well-functioning public and private institutions (pillar 1), a well-developed infrastructure (pillar 2), a stable macroeconomic environment (pillar 3), and a healthy workforce that has received at least a basic education (pillar 4).
As a country becomes more competitive, productivity will increase and wages will rise with advancing development. Countries will then move into the efficiency-driven stage of development, when they must begin to develop more efficient production processes and increase product quality because wages have risen and they cannot increase prices. At this point, competitiveness is increasingly driven by higher education and training (pillar 5), efficient goods markets (pillar 6), well-functioning labor markets (pillar 7), developed financial markets (pillar 8), the ability to harness the benefits of existing technologies (pillar 9), and a large domestic or foreign market (pillar 10).
Finally, as countries move into the innovation-driven stage, wages will have risen by so much that they are able to sustain those higher wages and the associated standard of living only if their businesses are able to compete with new and unique products. At this stage, companies must compete by producing new and different goods using the most sophisticated production processes (pillar 11) and by innovating new ones (pillar 12).
The GCI takes the stages of development into account by attributing higher relative weights to those pillars that are more relevant for an economy given its particular stage of development. That is, although all 12 pillars matter to a certain extent for all countries, the relative importance of each one depends on a country’s particular stage of development. To implement this concept, the pillars are organized into three subindexes, each critical to a particular stage of development.
The basic requirements subindex groups those pillars most critical for countries in the factor-driven stage. The efficiency enhancers subindex includes
those pillars critical for countries in the efficiency-driven stage. And the innovation and sophistication factors subindex includes the pillars critical to countries in the innovation-driven stage. The three subindexes are shown in Figure 1.
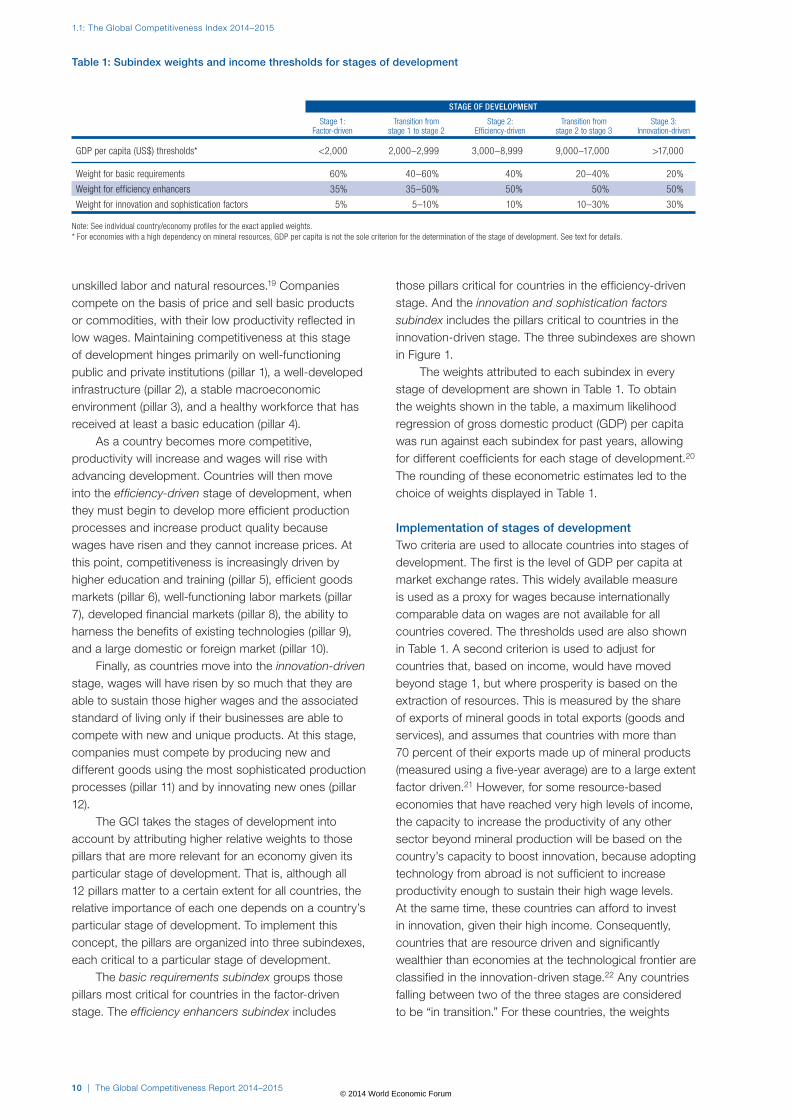
The weights attributed to each subindex in every stage of development are shown in Table 1. To obtain the weights shown in the table, a maximum likelihood regression of gross domestic product (GDP) per capita was run against each subindex for past years, allowing for different coefficients for each stage of development.20 The rounding of these econometric estimates led to the choice of weights displayed in Table 1.
Implementation of stages of developmentTwo criteria are used to allocate countries into stages of development. The first is the level of GDP per capita at market exchange rates. This widely available measure is used as a proxy for wages because internationally comparable data on wages are not available for all countries covered. The thresholds used are also shown in Table 1. A second criterion is used to adjust for countries that, based on income, would have moved beyond stage 1, but where prosperity is based on the extraction of resources. This is measured by the share of exports of mineral goods in total exports (goods and services), and assumes that countries with more than 70 percent of their exports made up of mineral products (measured using a five-year average) are to a large extent factor driven.21 However, for some resource-based economies that have reached very high levels of income, the capacity to increase the productivity of any other sector beyond mineral production will be based on the country’s capacity to boost innovation, because adopting technology from abroad is not sufficient to increase productivity enough to sustain their high wage levels. At the same time, these countries can afford to invest in innovation, given their high income. Consequently, countries that are resource driven and significantly wealthier than economies at the technological frontier are classified in the innovation-driven stage.22 Any countries falling between two of the three stages are considered to be “in transition.” For these countries, the weights
Table 1: Subindex weights and income thresholds for stages of development
STAGE OF DEVELOPMENT
Stage 1: Transition from Stage 2: Transition from Stage 3: Factor-driven stage 1 to stage 2 Efficiency-driven stage 2 to stage 3 Innovation-driven
GDP per capita (US$) thresholds* <2,000 2,000–2,999 3,000–8,999 9,000–17,000 >17,000
Weight for basic requirements 60% 40–60% 40% 20–40% 20%
Weight for efficiency enhancers 35% 35–50% 50% 50% 50%
Weight for innovation and sophistication factors 5% 5–10% 10% 10–30% 30%
Note: See individual country/economy profiles for the exact applied weights.* For economies with a high dependency on mineral resources, GDP per capita is not the sole criterion for the determination of the stage of development. See text for details.
© 2014 World Economic Forum
The Global Competitiveness Report 2014–2015 | 11
1.1: The Global Competitiveness Index 2014–2015
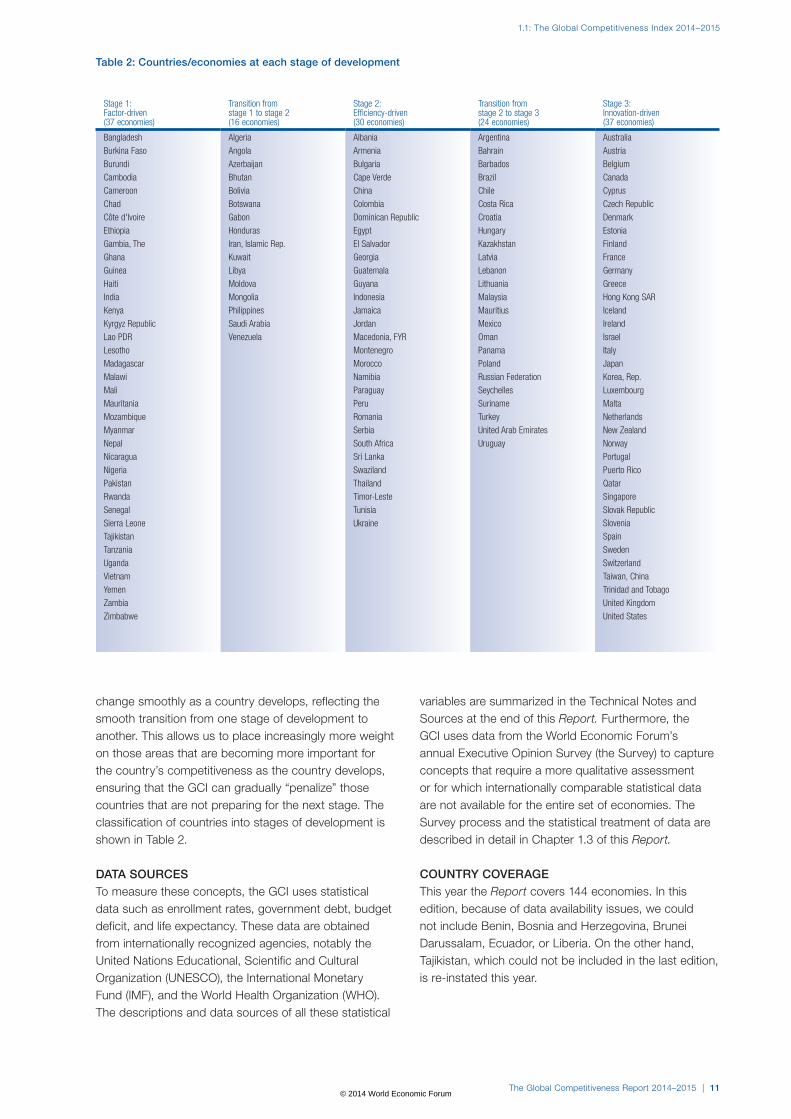
change smoothly as a country develops, reflecting the smooth transition from one stage of development to another. This allows us to place increasingly more weight on those areas that are becoming more important for the country’s competitiveness as the country develops, ensuring that the GCI can gradually “penalize” those countries that are not preparing for the next stage. The classification of countries into stages of development is shown in Table 2.
DATA SOURCESTo measure these concepts, the GCI uses statistical data such as enrollment rates, government debt, budget deficit, and life expectancy. These data are obtained from internationally recognized agencies, notably the United Nations Educational, Scientific and Cultural Organization (UNESCO), the International Monetary Fund (IMF), and the World Health Organization (WHO). The descriptions and data sources of all these statistical
variables are summarized in the Technical Notes and Sources at the end of this Report. Furthermore, the GCI uses data from the World Economic Forum’s annual Executive Opinion Survey (the Survey) to capture concepts that require a more qualitative assessment or for which internationally comparable statistical data are not available for the entire set of economies. The Survey process and the statistical treatment of data are described in detail in Chapter 1.3 of this Report.
COUNTRY COVERAGEThis year the Report covers 144 economies. In this edition, because of data availability issues, we could not include Benin, Bosnia and Herzegovina, Brunei Darussalam, Ecuador, or Liberia. On the other hand, Tajikistan, which could not be included in the last edition, is re-instated this year.
Table 2: Countries/economies at each stage of development
Stage 1: Factor-driven (37 economies)
Transition from stage 1 to stage 2 (16 economies)
Stage 2: Efficiency-driven (30 economies)
Transition from stage 2 to stage 3 (24 economies)
Stage 3: Innovation-driven (37 economies)
Bangladesh Algeria Albania Argentina Australia
Burkina Faso Angola Armenia Bahrain Austria
Burundi Azerbaijan Bulgaria Barbados Belgium
Cambodia Bhutan Cape Verde Brazil Canada
Cameroon Bolivia China Chile Cyprus
Chad Botswana Colombia Costa Rica Czech Republic
Côte d'Ivoire Gabon Dominican Republic Croatia Denmark
Ethiopia Honduras Egypt Hungary Estonia
Gambia, The Iran, Islamic Rep. El Salvador Kazakhstan Finland
Ghana Kuwait Georgia Latvia France
Guinea Libya Guatemala Lebanon Germany
Haiti Moldova Guyana Lithuania Greece
India Mongolia Indonesia Malaysia Hong Kong SAR
Kenya Philippines Jamaica Mauritius Iceland
Kyrgyz Republic Saudi Arabia Jordan Mexico Ireland
Lao PDR Venezuela Macedonia, FYR Oman Israel
Lesotho Montenegro Panama Italy
Madagascar Morocco Poland Japan
Malawi Namibia Russian Federation Korea, Rep.
Mali Paraguay Seychelles Luxembourg
Mauritania Peru Suriname Malta
Mozambique Romania Turkey Netherlands
Myanmar Serbia United Arab Emirates New Zealand
Nepal South Africa Uruguay Norway
Nicaragua Sri Lanka Portugal
Nigeria Swaziland Puerto Rico
Pakistan Thailand Qatar
Rwanda Timor-Leste Singapore
Senegal Tunisia Slovak Republic
Sierra Leone Ukraine Slovenia
Tajikistan Spain
Tanzania Sweden
Uganda Switzerland
Vietnam Taiwan, China
Yemen Trinidad and Tobago
Zambia United Kingdom
Zimbabwe United States
© 2014 World Economic Forum
1.1: The Global Competitiveness Index 2014–2015
12 | The Global Competitiveness Report 2014–2015
REVIEW OF THE GLOBAL COMPETITIVENESS INDEXThe Global Competitiveness Index has been used as an important tool by policymakers of many countries over the years. Since its first publication in 2005, the Index has become widely recognized as one of the key assessments of global competitiveness as defined by the World Economic Forum.
As we approach the 10th anniversary of its creation, and in order to keep the GCI at the cutting edge of thinking and research, the World Economic Forum has engaged in a review of the Index. This two-year process will gather insights from high-level experts in academia along with practitioners and business leaders to identify the improvements needed to capture the evolving nature of the drivers of competitiveness. Since the start of this process in September 2013, the Forum has made progress in evaluating the nature of the adjustments that should be made and identifying potential new measures to be included in the Index. This progress has been possible thanks to the insights gathered in a series of workshops and sessions that took place at the Forum’s Annual Meeting in Davos in January 2014 and in an expert workshop that took place in Geneva in June 2014. Further events are planned to continue this review.
With this endeavor, the Forum aims to remain at the forefront of the effort to provide policymakers and business and civil society leaders with a relevant tool that can measure and benchmark the drivers of competitiveness and prosperity in an economy, and that can stimulate a constructive dialogue to catalyze the needed reforms and productive investments.
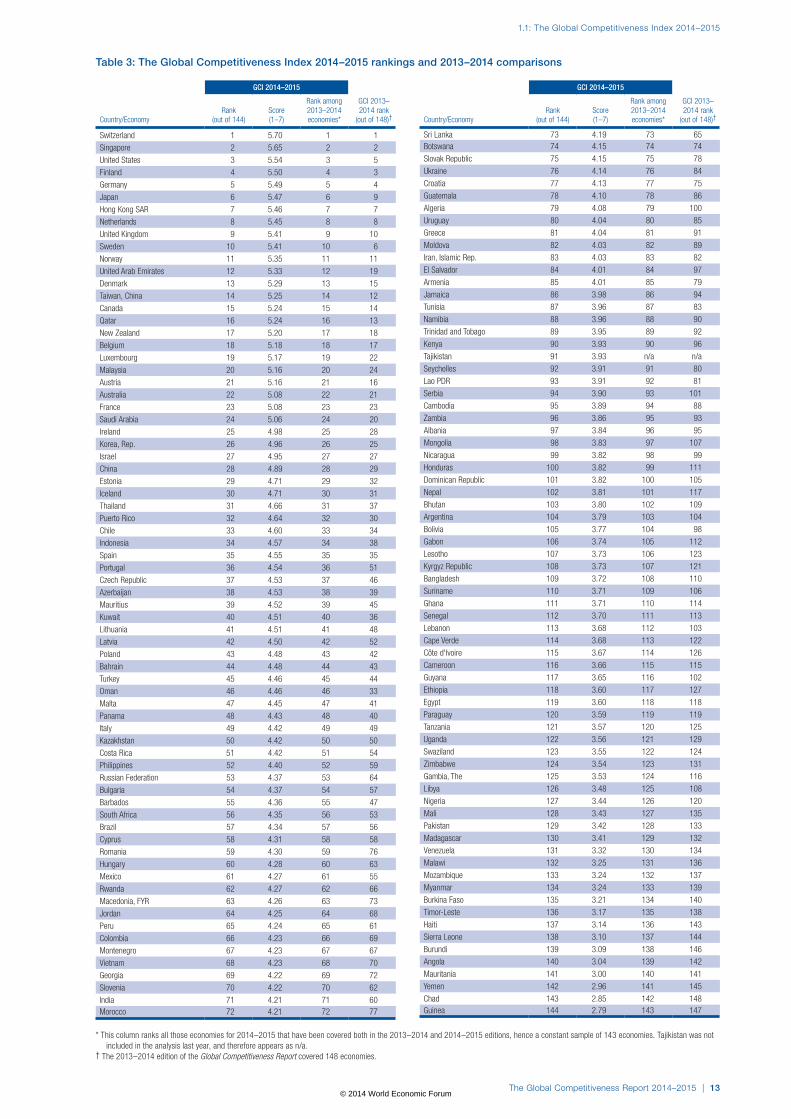
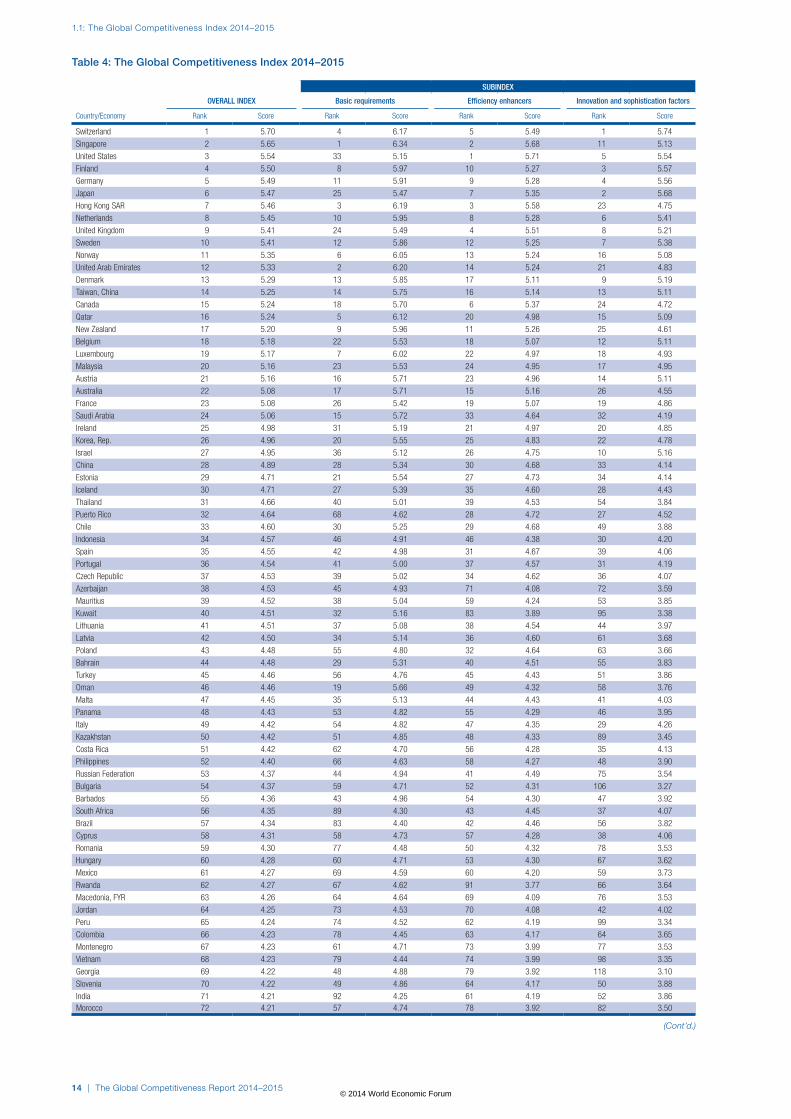
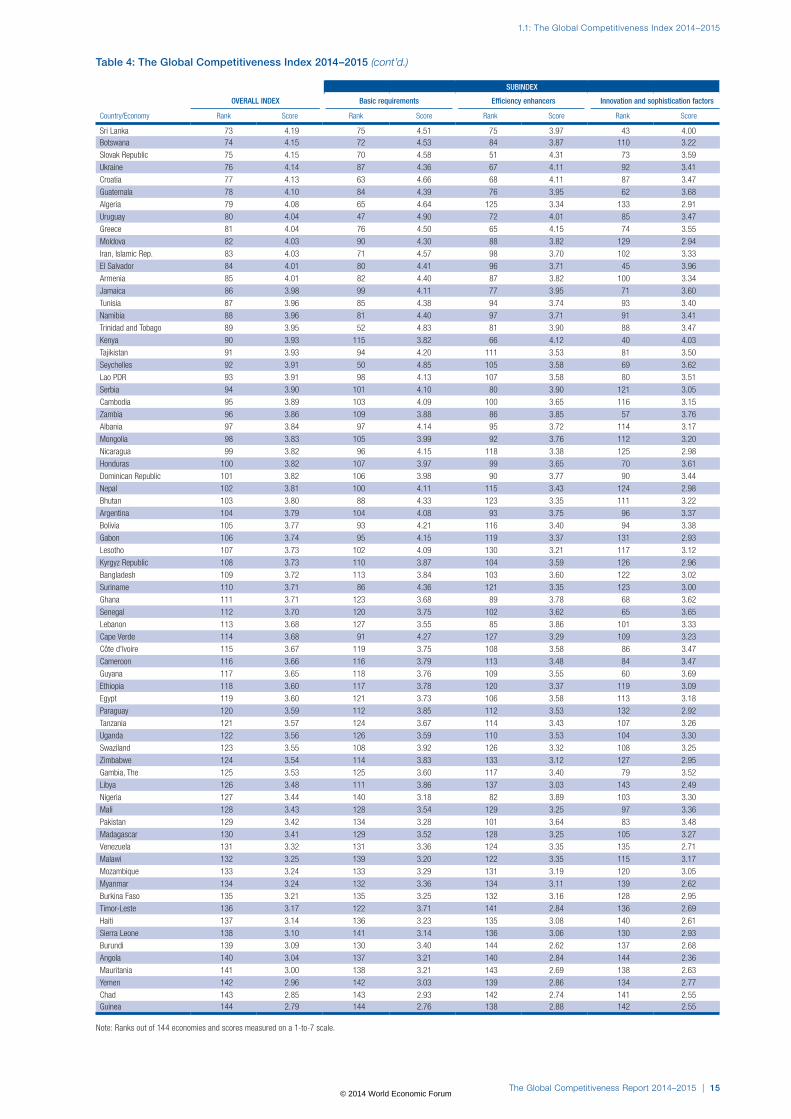
THE GLOBAL COMPETITIVENESS INDEX 2014–2015 RANKINGSTables 3 through 7 provide the detailed rankings of this year’s GCI. The following sections discuss the findings of the GCI 2014–2015 for the top performers globally, as well as for a number of selected economies in each of the five following regions: Europe and Eurasia; Asia and the Pacific; Latin America and the Caribbean, the Middle East and North Africa, and sub-Saharan Africa.23
Top 10The top of the rankings continues to be dominated by highly advanced Western economies and several Asian tigers. For the sixth consecutive year Switzerland leads the top 10, and again this year Singapore ranks as the second-most competitive economy in the world. Overall, the rankings at the top have remained rather stable, although it is worth noting the significant progress made by the United States, which climbs to 3rd place this year, and Japan, which rises three ranks to 6th position.
Switzerland tops the Global Competitiveness Index again this year, keeping its 1st place for six years in a row. Its performance is stable since last year and
remarkably consistent across the board: the country ranks in the top 10 of eight pillars. Switzerland’s top-notch academic institutions, high spending on R&D, and strong cooperation between the academic and business worlds contribute to making it a top innovator. Switzerland boasts the highest number of Patent Cooperation Treaty applications per capita in the world. The sophistication of companies that operate at the highest end of the value chain constitutes another notable strength (2nd). Productivity is further enhanced by an excellent education system and a business sector that offers excellent on-the-job-training opportunities. The labor market balances employee protection with flexibility and the country’s business needs (1st). Public institutions are among the most effective and transparent in the world (7th), ensuring a level playing field and enhancing business confidence. Competitiveness is also buttressed by excellent infrastructure and connectivity (5th) and highly developed financial markets (11th). Finally, Switzerland’s macroeconomic environment is among the most stable in the world (12th) at a time when many European countries continue to struggle in this area. A potential threat to Switzerland’s competitive edge might be the increasing difficulties faced by businesses and research institutions in finding the talent they need to preserve their outstanding capacity to innovate. Since 2012, the country has dropped from 14th to 24th on the indicator measuring the availability of engineers and scientists. Respondents to the Executive Opinion Survey 2014 cited the difficulty of finding qualified workers as the single most problematic factor for doing business in the country. The recent acceptance by Swiss citizens of an initiative aimed at limiting the ability of European Union (EU) workers to immigrate by reintroducing quotas could exacerbate the problem and erode Switzerland’s competitiveness advantage.
Singapore ranks 2nd overall for the fourth consecutive year, owing to an outstanding and stable performance across all the dimensions of the GCI. Again this year, Singapore is the only economy to feature in the top 3 in seven out of the 12 pillars; it also appears in the top 10 of two other pillars. Singapore tops the goods market efficiency pillar and places 2nd in the labor market efficiency and financial market development pillars. Furthermore, the city-state boasts one of the world’s best institutional frameworks (3rd), even though it loses the top spot to New Zealand in that category of the Index. Singapore possesses world-class infrastructure (2nd), with excellent roads, ports, and air transport facilities. Its economy can also rely on a sound macroeconomic environment and fiscal management (15th)—its budget surplus amounted to 6.9 percent of GDP in 2013. Singapore’s competitiveness is further enhanced by its strong focus on education, which has translated into a steady improvement of its ranking in the higher education and training pillar, where it comes in
© 2014 World Economic Forum
The Global Competitiveness Report 2014–2015 | 13
1.1: The Global Competitiveness Index 2014–2015
GCI 2014–2015
Country/EconomyRank
(out of 144)Score (1–7)
Rank among 2013–2014 economies*
GCI 2013–2014 rank
(out of 148)†
Switzerland 1 5.70 1 1
Singapore 2 5.65 2 2
United States 3 5.54 3 5
Finland 4 5.50 4 3
Germany 5 5.49 5 4
Japan 6 5.47 6 9
Hong Kong SAR 7 5.46 7 7
Netherlands 8 5.45 8 8
United Kingdom 9 5.41 9 10
Sweden 10 5.41 10 6
Norway 11 5.35 11 11
United Arab Emirates 12 5.33 12 19
Denmark 13 5.29 13 15
Taiwan, China 14 5.25 14 12
Canada 15 5.24 15 14
Qatar 16 5.24 16 13
New Zealand 17 5.20 17 18
Belgium 18 5.18 18 17
Luxembourg 19 5.17 19 22
Malaysia 20 5.16 20 24
Austria 21 5.16 21 16
Australia 22 5.08 22 21
France 23 5.08 23 23
Saudi Arabia 24 5.06 24 20
Ireland 25 4.98 25 28
Korea, Rep. 26 4.96 26 25
Israel 27 4.95 27 27
China 28 4.89 28 29
Estonia 29 4.71 29 32
Iceland 30 4.71 30 31
Thailand 31 4.66 31 37
Puerto Rico 32 4.64 32 30
Chile 33 4.60 33 34
Indonesia 34 4.57 34 38
Spain 35 4.55 35 35
Portugal 36 4.54 36 51
Czech Republic 37 4.53 37 46
Azerbaijan 38 4.53 38 39
Mauritius 39 4.52 39 45
Kuwait 40 4.51 40 36
Lithuania 41 4.51 41 48
Latvia 42 4.50 42 52
Poland 43 4.48 43 42
Bahrain 44 4.48 44 43
Turkey 45 4.46 45 44
Oman 46 4.46 46 33
Malta 47 4.45 47 41
Panama 48 4.43 48 40
Italy 49 4.42 49 49
Kazakhstan 50 4.42 50 50
Costa Rica 51 4.42 51 54
Philippines 52 4.40 52 59
Russian Federation 53 4.37 53 64
Bulgaria 54 4.37 54 57
Barbados 55 4.36 55 47
South Africa 56 4.35 56 53
Brazil 57 4.34 57 56
Cyprus 58 4.31 58 58
Romania 59 4.30 59 76
Hungary 60 4.28 60 63
Mexico 61 4.27 61 55
Rwanda 62 4.27 62 66
Macedonia, FYR 63 4.26 63 73
Jordan 64 4.25 64 68
Peru 65 4.24 65 61
Colombia 66 4.23 66 69
Montenegro 67 4.23 67 67
Vietnam 68 4.23 68 70
Georgia 69 4.22 69 72
Slovenia 70 4.22 70 62
India 71 4.21 71 60Morocco 72 4.21 72 77
Table 3: The Global Competitiveness Index 2014–2015 rankings and 2013–2014 comparisons
GCI 2014–2015
Country/EconomyRank
(out of 144)Score (1–7)
Rank among 2013–2014 economies*
GCI 2013–2014 rank
(out of 148)†
Sri Lanka 73 4.19 73 65Botswana 74 4.15 74 74
Slovak Republic 75 4.15 75 78
Ukraine 76 4.14 76 84
Croatia 77 4.13 77 75
Guatemala 78 4.10 78 86
Algeria 79 4.08 79 100
Uruguay 80 4.04 80 85
Greece 81 4.04 81 91
Moldova 82 4.03 82 89
Iran, Islamic Rep. 83 4.03 83 82
El Salvador 84 4.01 84 97
Armenia 85 4.01 85 79
Jamaica 86 3.98 86 94
Tunisia 87 3.96 87 83
Namibia 88 3.96 88 90
Trinidad and Tobago 89 3.95 89 92
Kenya 90 3.93 90 96
Tajikistan 91 3.93 n/a n/a
Seychelles 92 3.91 91 80
Lao PDR 93 3.91 92 81
Serbia 94 3.90 93 101
Cambodia 95 3.89 94 88
Zambia 96 3.86 95 93
Albania 97 3.84 96 95
Mongolia 98 3.83 97 107
Nicaragua 99 3.82 98 99
Honduras 100 3.82 99 111
Dominican Republic 101 3.82 100 105
Nepal 102 3.81 101 117
Bhutan 103 3.80 102 109
Argentina 104 3.79 103 104
Bolivia 105 3.77 104 98
Gabon 106 3.74 105 112
Lesotho 107 3.73 106 123
Kyrgyz Republic 108 3.73 107 121
Bangladesh 109 3.72 108 110
Suriname 110 3.71 109 106
Ghana 111 3.71 110 114
Senegal 112 3.70 111 113
Lebanon 113 3.68 112 103
Cape Verde 114 3.68 113 122
Côte d'Ivoire 115 3.67 114 126
Cameroon 116 3.66 115 115
Guyana 117 3.65 116 102
Ethiopia 118 3.60 117 127
Egypt 119 3.60 118 118
Paraguay 120 3.59 119 119
Tanzania 121 3.57 120 125
Uganda 122 3.56 121 129
Swaziland 123 3.55 122 124
Zimbabwe 124 3.54 123 131
Gambia, The 125 3.53 124 116
Libya 126 3.48 125 108
Nigeria 127 3.44 126 120
Mali 128 3.43 127 135
Pakistan 129 3.42 128 133
Madagascar 130 3.41 129 132
Venezuela 131 3.32 130 134
Malawi 132 3.25 131 136
Mozambique 133 3.24 132 137
Myanmar 134 3.24 133 139
Burkina Faso 135 3.21 134 140
Timor-Leste 136 3.17 135 138
Haiti 137 3.14 136 143
Sierra Leone 138 3.10 137 144
Burundi 139 3.09 138 146
Angola 140 3.04 139 142
Mauritania 141 3.00 140 141
Yemen 142 2.96 141 145
Chad 143 2.85 142 148Guinea 144 2.79 143 147
* This column ranks all those economies for 2014–2015 that have been covered both in the 2013–2014 and 2014–2015 editions, hence a constant sample of 143 economies. Tajikistan was not included in the analysis last year, and therefore appears as n/a.
† The 2013–2014 edition of the Global Competitiveness Report covered 148 economies.
© 2014 World Economic Forum
1.1: The Global Competitiveness Index 2014–2015
14 | The Global Competitiveness Report 2014–2015
SUBINDEX
OVERALL INDEX Basic requirements Efficiency enhancers Innovation and sophistication factors
Country/Economy Rank Score Rank Score Rank Score Rank Score
Switzerland 1 5.70 4 6.17 5 5.49 1 5.74
Singapore 2 5.65 1 6.34 2 5.68 11 5.13
United States 3 5.54 33 5.15 1 5.71 5 5.54
Finland 4 5.50 8 5.97 10 5.27 3 5.57
Germany 5 5.49 11 5.91 9 5.28 4 5.56
Japan 6 5.47 25 5.47 7 5.35 2 5.68
Hong Kong SAR 7 5.46 3 6.19 3 5.58 23 4.75
Netherlands 8 5.45 10 5.95 8 5.28 6 5.41
United Kingdom 9 5.41 24 5.49 4 5.51 8 5.21
Sweden 10 5.41 12 5.86 12 5.25 7 5.38
Norway 11 5.35 6 6.05 13 5.24 16 5.08
United Arab Emirates 12 5.33 2 6.20 14 5.24 21 4.83
Denmark 13 5.29 13 5.85 17 5.11 9 5.19
Taiwan, China 14 5.25 14 5.75 16 5.14 13 5.11
Canada 15 5.24 18 5.70 6 5.37 24 4.72
Qatar 16 5.24 5 6.12 20 4.98 15 5.09
New Zealand 17 5.20 9 5.96 11 5.26 25 4.61
Belgium 18 5.18 22 5.53 18 5.07 12 5.11
Luxembourg 19 5.17 7 6.02 22 4.97 18 4.93
Malaysia 20 5.16 23 5.53 24 4.95 17 4.95
Austria 21 5.16 16 5.71 23 4.96 14 5.11
Australia 22 5.08 17 5.71 15 5.16 26 4.55
France 23 5.08 26 5.42 19 5.07 19 4.86
Saudi Arabia 24 5.06 15 5.72 33 4.64 32 4.19
Ireland 25 4.98 31 5.19 21 4.97 20 4.85
Korea, Rep. 26 4.96 20 5.55 25 4.83 22 4.78
Israel 27 4.95 36 5.12 26 4.75 10 5.16
China 28 4.89 28 5.34 30 4.68 33 4.14
Estonia 29 4.71 21 5.54 27 4.73 34 4.14
Iceland 30 4.71 27 5.39 35 4.60 28 4.43
Thailand 31 4.66 40 5.01 39 4.53 54 3.84
Puerto Rico 32 4.64 68 4.62 28 4.72 27 4.52
Chile 33 4.60 30 5.25 29 4.68 49 3.88
Indonesia 34 4.57 46 4.91 46 4.38 30 4.20
Spain 35 4.55 42 4.98 31 4.67 39 4.06
Portugal 36 4.54 41 5.00 37 4.57 31 4.19
Czech Republic 37 4.53 39 5.02 34 4.62 36 4.07
Azerbaijan 38 4.53 45 4.93 71 4.08 72 3.59
Mauritius 39 4.52 38 5.04 59 4.24 53 3.85
Kuwait 40 4.51 32 5.16 83 3.89 95 3.38
Lithuania 41 4.51 37 5.08 38 4.54 44 3.97
Latvia 42 4.50 34 5.14 36 4.60 61 3.68
Poland 43 4.48 55 4.80 32 4.64 63 3.66
Bahrain 44 4.48 29 5.31 40 4.51 55 3.83
Turkey 45 4.46 56 4.76 45 4.43 51 3.86
Oman 46 4.46 19 5.66 49 4.32 58 3.76
Malta 47 4.45 35 5.13 44 4.43 41 4.03
Panama 48 4.43 53 4.82 55 4.29 46 3.95
Italy 49 4.42 54 4.82 47 4.35 29 4.26
Kazakhstan 50 4.42 51 4.85 48 4.33 89 3.45
Costa Rica 51 4.42 62 4.70 56 4.28 35 4.13
Philippines 52 4.40 66 4.63 58 4.27 48 3.90
Russian Federation 53 4.37 44 4.94 41 4.49 75 3.54
Bulgaria 54 4.37 59 4.71 52 4.31 106 3.27
Barbados 55 4.36 43 4.96 54 4.30 47 3.92
South Africa 56 4.35 89 4.30 43 4.45 37 4.07
Brazil 57 4.34 83 4.40 42 4.46 56 3.82
Cyprus 58 4.31 58 4.73 57 4.28 38 4.06
Romania 59 4.30 77 4.48 50 4.32 78 3.53
Hungary 60 4.28 60 4.71 53 4.30 67 3.62
Mexico 61 4.27 69 4.59 60 4.20 59 3.73
Rwanda 62 4.27 67 4.62 91 3.77 66 3.64
Macedonia, FYR 63 4.26 64 4.64 69 4.09 76 3.53
Jordan 64 4.25 73 4.53 70 4.08 42 4.02
Peru 65 4.24 74 4.52 62 4.19 99 3.34
Colombia 66 4.23 78 4.45 63 4.17 64 3.65
Montenegro 67 4.23 61 4.71 73 3.99 77 3.53
Vietnam 68 4.23 79 4.44 74 3.99 98 3.35
Georgia 69 4.22 48 4.88 79 3.92 118 3.10
Slovenia 70 4.22 49 4.86 64 4.17 50 3.88
India 71 4.21 92 4.25 61 4.19 52 3.86Morocco 72 4.21 57 4.74 78 3.92 82 3.50
Table 4: The Global Competitiveness Index 2014–2015
(Cont’d.)
© 2014 World Economic Forum
The Global Competitiveness Report 2014–2015 | 15
1.1: The Global Competitiveness Index 2014–2015
Table 4: The Global Competitiveness Index 2014–2015 (cont’d.)
SUBINDEX
OVERALL INDEX Basic requirements Efficiency enhancers Innovation and sophistication factors
Country/Economy Rank Score Rank Score Rank Score Rank Score
Sri Lanka 73 4.19 75 4.51 75 3.97 43 4.00Botswana 74 4.15 72 4.53 84 3.87 110 3.22
Slovak Republic 75 4.15 70 4.58 51 4.31 73 3.59
Ukraine 76 4.14 87 4.36 67 4.11 92 3.41
Croatia 77 4.13 63 4.66 68 4.11 87 3.47
Guatemala 78 4.10 84 4.39 76 3.95 62 3.68
Algeria 79 4.08 65 4.64 125 3.34 133 2.91
Uruguay 80 4.04 47 4.90 72 4.01 85 3.47
Greece 81 4.04 76 4.50 65 4.15 74 3.55
Moldova 82 4.03 90 4.30 88 3.82 129 2.94
Iran, Islamic Rep. 83 4.03 71 4.57 98 3.70 102 3.33
El Salvador 84 4.01 80 4.41 96 3.71 45 3.96
Armenia 85 4.01 82 4.40 87 3.82 100 3.34
Jamaica 86 3.98 99 4.11 77 3.95 71 3.60
Tunisia 87 3.96 85 4.38 94 3.74 93 3.40
Namibia 88 3.96 81 4.40 97 3.71 91 3.41
Trinidad and Tobago 89 3.95 52 4.83 81 3.90 88 3.47
Kenya 90 3.93 115 3.82 66 4.12 40 4.03
Tajikistan 91 3.93 94 4.20 111 3.53 81 3.50
Seychelles 92 3.91 50 4.85 105 3.58 69 3.62
Lao PDR 93 3.91 98 4.13 107 3.58 80 3.51
Serbia 94 3.90 101 4.10 80 3.90 121 3.05
Cambodia 95 3.89 103 4.09 100 3.65 116 3.15
Zambia 96 3.86 109 3.88 86 3.85 57 3.76
Albania 97 3.84 97 4.14 95 3.72 114 3.17
Mongolia 98 3.83 105 3.99 92 3.76 112 3.20
Nicaragua 99 3.82 96 4.15 118 3.38 125 2.98
Honduras 100 3.82 107 3.97 99 3.65 70 3.61
Dominican Republic 101 3.82 106 3.98 90 3.77 90 3.44
Nepal 102 3.81 100 4.11 115 3.43 124 2.98
Bhutan 103 3.80 88 4.33 123 3.35 111 3.22
Argentina 104 3.79 104 4.08 93 3.75 96 3.37
Bolivia 105 3.77 93 4.21 116 3.40 94 3.38
Gabon 106 3.74 95 4.15 119 3.37 131 2.93
Lesotho 107 3.73 102 4.09 130 3.21 117 3.12
Kyrgyz Republic 108 3.73 110 3.87 104 3.59 126 2.96
Bangladesh 109 3.72 113 3.84 103 3.60 122 3.02
Suriname 110 3.71 86 4.36 121 3.35 123 3.00
Ghana 111 3.71 123 3.68 89 3.78 68 3.62
Senegal 112 3.70 120 3.75 102 3.62 65 3.65
Lebanon 113 3.68 127 3.55 85 3.86 101 3.33
Cape Verde 114 3.68 91 4.27 127 3.29 109 3.23
Côte d'Ivoire 115 3.67 119 3.75 108 3.58 86 3.47
Cameroon 116 3.66 116 3.79 113 3.48 84 3.47
Guyana 117 3.65 118 3.76 109 3.55 60 3.69
Ethiopia 118 3.60 117 3.78 120 3.37 119 3.09
Egypt 119 3.60 121 3.73 106 3.58 113 3.18
Paraguay 120 3.59 112 3.85 112 3.53 132 2.92
Tanzania 121 3.57 124 3.67 114 3.43 107 3.26
Uganda 122 3.56 126 3.59 110 3.53 104 3.30
Swaziland 123 3.55 108 3.92 126 3.32 108 3.25
Zimbabwe 124 3.54 114 3.83 133 3.12 127 2.95
Gambia, The 125 3.53 125 3.60 117 3.40 79 3.52
Libya 126 3.48 111 3.86 137 3.03 143 2.49
Nigeria 127 3.44 140 3.18 82 3.89 103 3.30
Mali 128 3.43 128 3.54 129 3.25 97 3.36
Pakistan 129 3.42 134 3.28 101 3.64 83 3.48
Madagascar 130 3.41 129 3.52 128 3.25 105 3.27
Venezuela 131 3.32 131 3.36 124 3.35 135 2.71
Malawi 132 3.25 139 3.20 122 3.35 115 3.17
Mozambique 133 3.24 133 3.29 131 3.19 120 3.05
Myanmar 134 3.24 132 3.36 134 3.11 139 2.62
Burkina Faso 135 3.21 135 3.25 132 3.16 128 2.95
Timor-Leste 136 3.17 122 3.71 141 2.84 136 2.69
Haiti 137 3.14 136 3.23 135 3.08 140 2.61
Sierra Leone 138 3.10 141 3.14 136 3.06 130 2.93
Burundi 139 3.09 130 3.40 144 2.62 137 2.68
Angola 140 3.04 137 3.21 140 2.84 144 2.36
Mauritania 141 3.00 138 3.21 143 2.69 138 2.63
Yemen 142 2.96 142 3.03 139 2.86 134 2.77
Chad 143 2.85 143 2.93 142 2.74 141 2.55Guinea 144 2.79 144 2.76 138 2.88 142 2.55
Note: Ranks out of 144 economies and scores measured on a 1-to-7 scale.
© 2014 World Economic Forum
1.1: The Global Competitiveness Index 2014–2015
16 | The Global Competitiveness Report 2014–2015
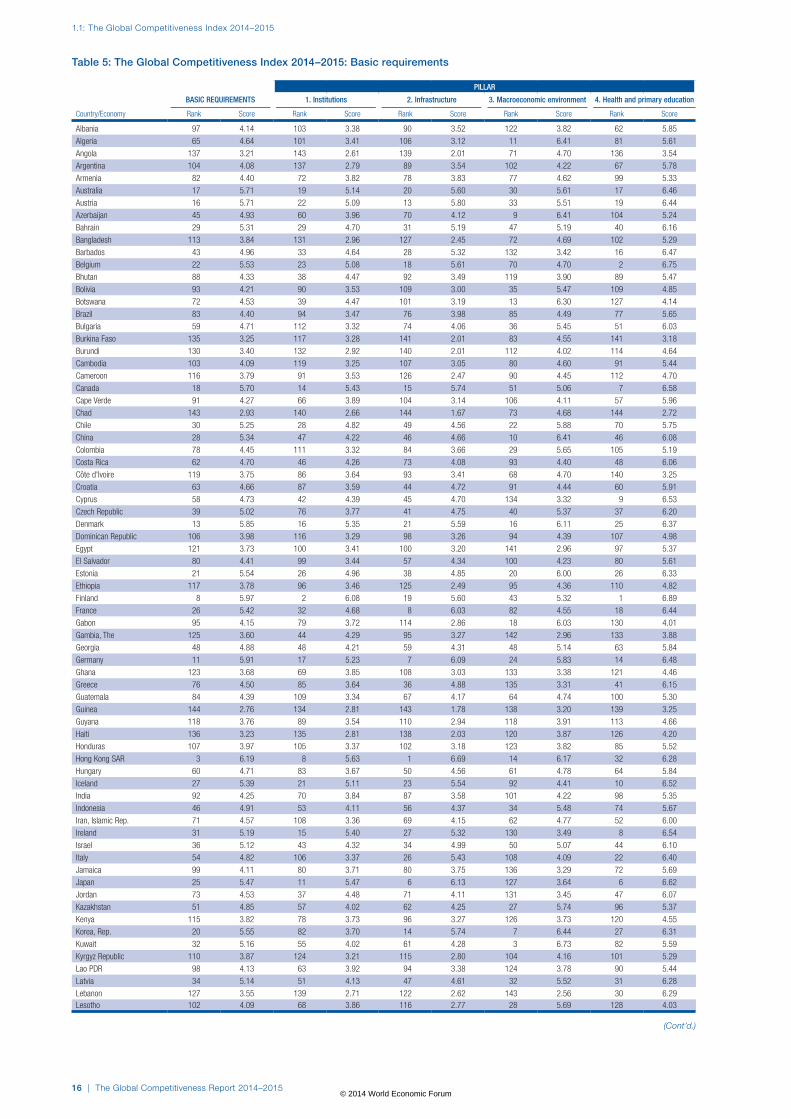
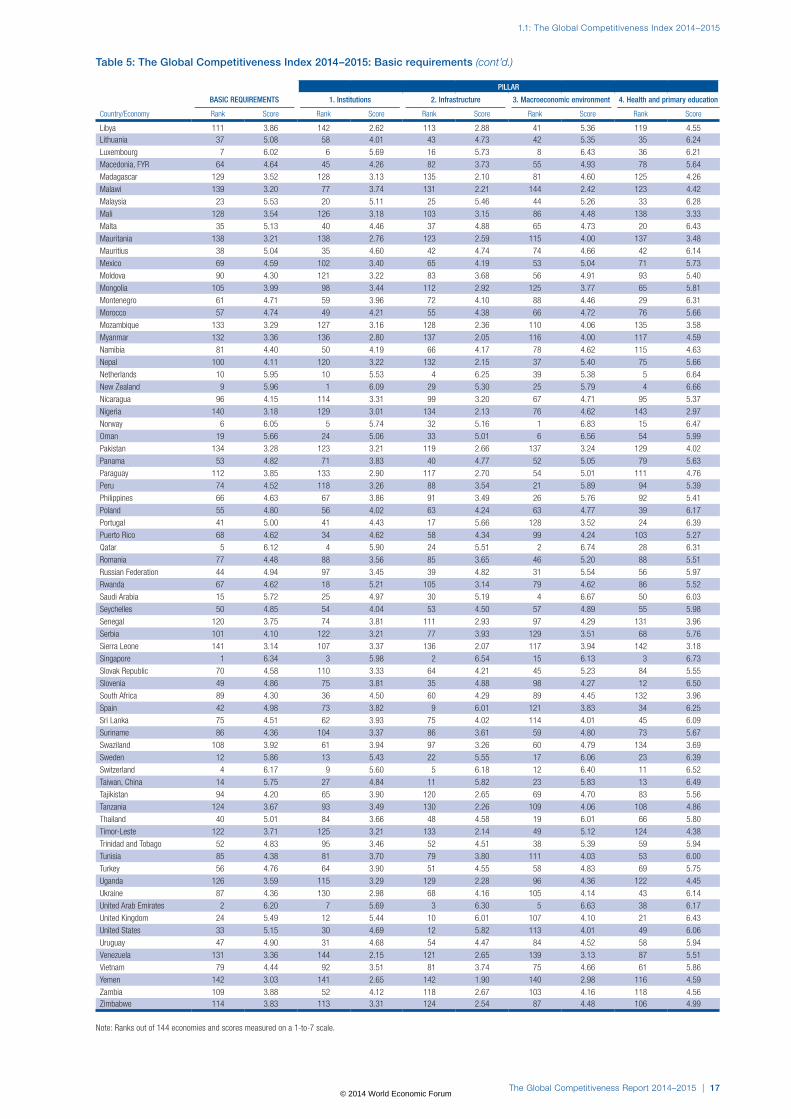
Table 5: The Global Competitiveness Index 2014–2015: Basic requirements
PILLAR
BASIC REQUIREMENTS 1. Institutions 2. Infrastructure 3. Macroeconomic environment 4. Health and primary education
Country/Economy Rank Score Rank Score Rank Score Rank Score Rank Score
Albania 97 4.14 103 3.38 90 3.52 122 3.82 62 5.85
Algeria 65 4.64 101 3.41 106 3.12 11 6.41 81 5.61
Angola 137 3.21 143 2.61 139 2.01 71 4.70 136 3.54
Argentina 104 4.08 137 2.79 89 3.54 102 4.22 67 5.78
Armenia 82 4.40 72 3.82 78 3.83 77 4.62 99 5.33
Australia 17 5.71 19 5.14 20 5.60 30 5.61 17 6.46
Austria 16 5.71 22 5.09 13 5.80 33 5.51 19 6.44
Azerbaijan 45 4.93 60 3.96 70 4.12 9 6.41 104 5.24
Bahrain 29 5.31 29 4.70 31 5.19 47 5.19 40 6.16
Bangladesh 113 3.84 131 2.96 127 2.45 72 4.69 102 5.29
Barbados 43 4.96 33 4.64 28 5.32 132 3.42 16 6.47
Belgium 22 5.53 23 5.08 18 5.61 70 4.70 2 6.75
Bhutan 88 4.33 38 4.47 92 3.49 119 3.90 89 5.47
Bolivia 93 4.21 90 3.53 109 3.00 35 5.47 109 4.85
Botswana 72 4.53 39 4.47 101 3.19 13 6.30 127 4.14
Brazil 83 4.40 94 3.47 76 3.98 85 4.49 77 5.65
Bulgaria 59 4.71 112 3.32 74 4.06 36 5.45 51 6.03
Burkina Faso 135 3.25 117 3.28 141 2.01 83 4.55 141 3.18
Burundi 130 3.40 132 2.92 140 2.01 112 4.02 114 4.64
Cambodia 103 4.09 119 3.25 107 3.05 80 4.60 91 5.44
Cameroon 116 3.79 91 3.53 126 2.47 90 4.45 112 4.70
Canada 18 5.70 14 5.43 15 5.74 51 5.06 7 6.58
Cape Verde 91 4.27 66 3.89 104 3.14 106 4.11 57 5.96
Chad 143 2.93 140 2.66 144 1.67 73 4.68 144 2.72
Chile 30 5.25 28 4.82 49 4.56 22 5.88 70 5.75
China 28 5.34 47 4.22 46 4.66 10 6.41 46 6.08
Colombia 78 4.45 111 3.32 84 3.66 29 5.65 105 5.19
Costa Rica 62 4.70 46 4.26 73 4.08 93 4.40 48 6.06
Côte d'Ivoire 119 3.75 86 3.64 93 3.41 68 4.70 140 3.25
Croatia 63 4.66 87 3.59 44 4.72 91 4.44 60 5.91
Cyprus 58 4.73 42 4.39 45 4.70 134 3.32 9 6.53
Czech Republic 39 5.02 76 3.77 41 4.75 40 5.37 37 6.20
Denmark 13 5.85 16 5.35 21 5.59 16 6.11 25 6.37
Dominican Republic 106 3.98 116 3.29 98 3.26 94 4.39 107 4.98
Egypt 121 3.73 100 3.41 100 3.20 141 2.96 97 5.37
El Salvador 80 4.41 99 3.44 57 4.34 100 4.23 80 5.61
Estonia 21 5.54 26 4.96 38 4.85 20 6.00 26 6.33
Ethiopia 117 3.78 96 3.46 125 2.49 95 4.36 110 4.82
Finland 8 5.97 2 6.08 19 5.60 43 5.32 1 6.89
France 26 5.42 32 4.68 8 6.03 82 4.55 18 6.44
Gabon 95 4.15 79 3.72 114 2.86 18 6.03 130 4.01
Gambia, The 125 3.60 44 4.29 95 3.27 142 2.96 133 3.88
Georgia 48 4.88 48 4.21 59 4.31 48 5.14 63 5.84
Germany 11 5.91 17 5.23 7 6.09 24 5.83 14 6.48
Ghana 123 3.68 69 3.85 108 3.03 133 3.38 121 4.46
Greece 76 4.50 85 3.64 36 4.88 135 3.31 41 6.15
Guatemala 84 4.39 109 3.34 67 4.17 64 4.74 100 5.30
Guinea 144 2.76 134 2.81 143 1.78 138 3.20 139 3.25
Guyana 118 3.76 89 3.54 110 2.94 118 3.91 113 4.66
Haiti 136 3.23 135 2.81 138 2.03 120 3.87 126 4.20
Honduras 107 3.97 105 3.37 102 3.18 123 3.82 85 5.52
Hong Kong SAR 3 6.19 8 5.63 1 6.69 14 6.17 32 6.28
Hungary 60 4.71 83 3.67 50 4.56 61 4.78 64 5.84
Iceland 27 5.39 21 5.11 23 5.54 92 4.41 10 6.52
India 92 4.25 70 3.84 87 3.58 101 4.22 98 5.35
Indonesia 46 4.91 53 4.11 56 4.37 34 5.48 74 5.67
Iran, Islamic Rep. 71 4.57 108 3.36 69 4.15 62 4.77 52 6.00
Ireland 31 5.19 15 5.40 27 5.32 130 3.49 8 6.54
Israel 36 5.12 43 4.32 34 4.99 50 5.07 44 6.10
Italy 54 4.82 106 3.37 26 5.43 108 4.09 22 6.40
Jamaica 99 4.11 80 3.71 80 3.75 136 3.29 72 5.69
Japan 25 5.47 11 5.47 6 6.13 127 3.64 6 6.62
Jordan 73 4.53 37 4.48 71 4.11 131 3.45 47 6.07
Kazakhstan 51 4.85 57 4.02 62 4.25 27 5.74 96 5.37
Kenya 115 3.82 78 3.73 96 3.27 126 3.73 120 4.55
Korea, Rep. 20 5.55 82 3.70 14 5.74 7 6.44 27 6.31
Kuwait 32 5.16 55 4.02 61 4.28 3 6.73 82 5.59
Kyrgyz Republic 110 3.87 124 3.21 115 2.80 104 4.16 101 5.29
Lao PDR 98 4.13 63 3.92 94 3.38 124 3.78 90 5.44
Latvia 34 5.14 51 4.13 47 4.61 32 5.52 31 6.28
Lebanon 127 3.55 139 2.71 122 2.62 143 2.56 30 6.29Lesotho 102 4.09 68 3.86 116 2.77 28 5.69 128 4.03
(Cont’d.)
© 2014 World Economic Forum
The Global Competitiveness Report 2014–2015 | 17
1.1: The Global Competitiveness Index 2014–2015
Table 5: The Global Competitiveness Index 2014–2015: Basic requirements (cont’d.)
PILLAR
BASIC REQUIREMENTS 1. Institutions 2. Infrastructure 3. Macroeconomic environment 4. Health and primary education
Country/Economy Rank Score Rank Score Rank Score Rank Score Rank Score
Libya 111 3.86 142 2.62 113 2.88 41 5.36 119 4.55Lithuania 37 5.08 58 4.01 43 4.73 42 5.35 35 6.24
Luxembourg 7 6.02 6 5.69 16 5.73 8 6.43 36 6.21
Macedonia, FYR 64 4.64 45 4.26 82 3.73 55 4.93 78 5.64
Madagascar 129 3.52 128 3.13 135 2.10 81 4.60 125 4.26
Malawi 139 3.20 77 3.74 131 2.21 144 2.42 123 4.42
Malaysia 23 5.53 20 5.11 25 5.46 44 5.26 33 6.28
Mali 128 3.54 126 3.18 103 3.15 86 4.48 138 3.33
Malta 35 5.13 40 4.46 37 4.88 65 4.73 20 6.43
Mauritania 138 3.21 138 2.76 123 2.59 115 4.00 137 3.48
Mauritius 38 5.04 35 4.60 42 4.74 74 4.66 42 6.14
Mexico 69 4.59 102 3.40 65 4.19 53 5.04 71 5.73
Moldova 90 4.30 121 3.22 83 3.68 56 4.91 93 5.40
Mongolia 105 3.99 98 3.44 112 2.92 125 3.77 65 5.81
Montenegro 61 4.71 59 3.96 72 4.10 88 4.46 29 6.31
Morocco 57 4.74 49 4.21 55 4.38 66 4.72 76 5.66
Mozambique 133 3.29 127 3.16 128 2.36 110 4.06 135 3.58
Myanmar 132 3.36 136 2.80 137 2.05 116 4.00 117 4.59
Namibia 81 4.40 50 4.19 66 4.17 78 4.62 115 4.63
Nepal 100 4.11 120 3.22 132 2.15 37 5.40 75 5.66
Netherlands 10 5.95 10 5.53 4 6.25 39 5.38 5 6.64
New Zealand 9 5.96 1 6.09 29 5.30 25 5.79 4 6.66
Nicaragua 96 4.15 114 3.31 99 3.20 67 4.71 95 5.37
Nigeria 140 3.18 129 3.01 134 2.13 76 4.62 143 2.97
Norway 6 6.05 5 5.74 32 5.16 1 6.83 15 6.47
Oman 19 5.66 24 5.06 33 5.01 6 6.56 54 5.99
Pakistan 134 3.28 123 3.21 119 2.66 137 3.24 129 4.02
Panama 53 4.82 71 3.83 40 4.77 52 5.05 79 5.63
Paraguay 112 3.85 133 2.90 117 2.70 54 5.01 111 4.76
Peru 74 4.52 118 3.26 88 3.54 21 5.89 94 5.39
Philippines 66 4.63 67 3.86 91 3.49 26 5.76 92 5.41
Poland 55 4.80 56 4.02 63 4.24 63 4.77 39 6.17
Portugal 41 5.00 41 4.43 17 5.66 128 3.52 24 6.39
Puerto Rico 68 4.62 34 4.62 58 4.34 99 4.24 103 5.27
Qatar 5 6.12 4 5.90 24 5.51 2 6.74 28 6.31
Romania 77 4.48 88 3.56 85 3.65 46 5.20 88 5.51
Russian Federation 44 4.94 97 3.45 39 4.82 31 5.54 56 5.97
Rwanda 67 4.62 18 5.21 105 3.14 79 4.62 86 5.52
Saudi Arabia 15 5.72 25 4.97 30 5.19 4 6.67 50 6.03
Seychelles 50 4.85 54 4.04 53 4.50 57 4.89 55 5.98
Senegal 120 3.75 74 3.81 111 2.93 97 4.29 131 3.96
Serbia 101 4.10 122 3.21 77 3.93 129 3.51 68 5.76
Sierra Leone 141 3.14 107 3.37 136 2.07 117 3.94 142 3.18
Singapore 1 6.34 3 5.98 2 6.54 15 6.13 3 6.73
Slovak Republic 70 4.58 110 3.33 64 4.21 45 5.23 84 5.55
Slovenia 49 4.86 75 3.81 35 4.88 98 4.27 12 6.50
South Africa 89 4.30 36 4.50 60 4.29 89 4.45 132 3.96
Spain 42 4.98 73 3.82 9 6.01 121 3.83 34 6.25
Sri Lanka 75 4.51 62 3.93 75 4.02 114 4.01 45 6.09
Suriname 86 4.36 104 3.37 86 3.61 59 4.80 73 5.67
Swaziland 108 3.92 61 3.94 97 3.26 60 4.79 134 3.69
Sweden 12 5.86 13 5.43 22 5.55 17 6.06 23 6.39
Switzerland 4 6.17 9 5.60 5 6.18 12 6.40 11 6.52
Taiwan, China 14 5.75 27 4.84 11 5.82 23 5.83 13 6.49
Tajikistan 94 4.20 65 3.90 120 2.65 69 4.70 83 5.56
Tanzania 124 3.67 93 3.49 130 2.26 109 4.06 108 4.86
Thailand 40 5.01 84 3.66 48 4.58 19 6.01 66 5.80
Timor-Leste 122 3.71 125 3.21 133 2.14 49 5.12 124 4.38
Trinidad and Tobago 52 4.83 95 3.46 52 4.51 38 5.39 59 5.94
Tunisia 85 4.38 81 3.70 79 3.80 111 4.03 53 6.00
Turkey 56 4.76 64 3.90 51 4.55 58 4.83 69 5.75
Uganda 126 3.59 115 3.29 129 2.28 96 4.36 122 4.45
Ukraine 87 4.36 130 2.98 68 4.16 105 4.14 43 6.14
United Arab Emirates 2 6.20 7 5.69 3 6.30 5 6.63 38 6.17
United Kingdom 24 5.49 12 5.44 10 6.01 107 4.10 21 6.43
United States 33 5.15 30 4.69 12 5.82 113 4.01 49 6.06
Uruguay 47 4.90 31 4.68 54 4.47 84 4.52 58 5.94
Venezuela 131 3.36 144 2.15 121 2.65 139 3.13 87 5.51
Vietnam 79 4.44 92 3.51 81 3.74 75 4.66 61 5.86
Yemen 142 3.03 141 2.65 142 1.90 140 2.98 116 4.59
Zambia 109 3.88 52 4.12 118 2.67 103 4.16 118 4.56Zimbabwe 114 3.83 113 3.31 124 2.54 87 4.48 106 4.99
Note: Ranks out of 144 economies and scores measured on a 1-to-7 scale.
© 2014 World Economic Forum
1.1: The Global Competitiveness Index 2014–2015
18 | The Global Competitiveness Report 2014–2015
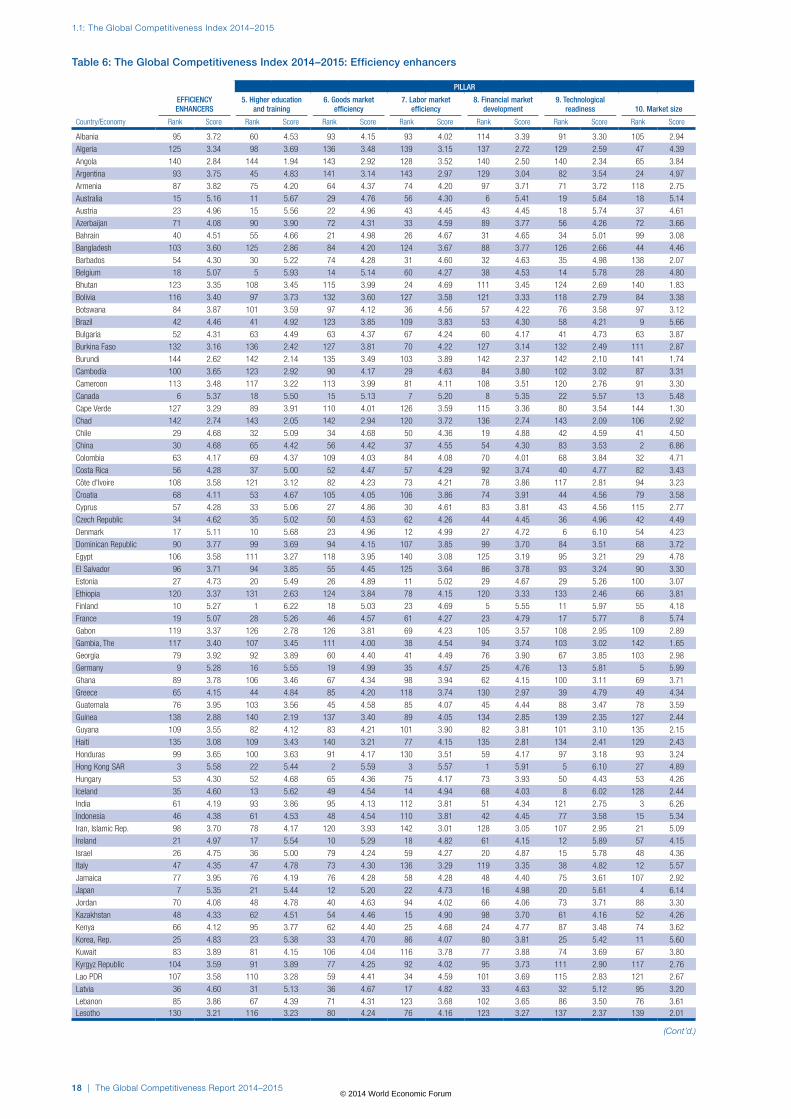
Table 6: The Global Competitiveness Index 2014–2015: Efficiency enhancers
PILLAR
EFFICIENCY ENHANCERS
5. Higher education and training
6. Goods market efficiency
7. Labor market efficiency
8. Financial market development
9. Technological readiness 10. Market size
Country/Economy Rank Score Rank Score Rank Score Rank Score Rank Score Rank Score Rank Score
Albania 95 3.72 60 4.53 93 4.15 93 4.02 114 3.39 91 3.30 105 2.94
Algeria 125 3.34 98 3.69 136 3.48 139 3.15 137 2.72 129 2.59 47 4.39
Angola 140 2.84 144 1.94 143 2.92 128 3.52 140 2.50 140 2.34 65 3.84
Argentina 93 3.75 45 4.83 141 3.14 143 2.97 129 3.04 82 3.54 24 4.97
Armenia 87 3.82 75 4.20 64 4.37 74 4.20 97 3.71 71 3.72 118 2.75
Australia 15 5.16 11 5.67 29 4.76 56 4.30 6 5.41 19 5.64 18 5.14
Austria 23 4.96 15 5.56 22 4.96 43 4.45 43 4.45 18 5.74 37 4.61
Azerbaijan 71 4.08 90 3.90 72 4.31 33 4.59 89 3.77 56 4.26 72 3.66
Bahrain 40 4.51 55 4.66 21 4.98 26 4.67 31 4.65 34 5.01 99 3.08
Bangladesh 103 3.60 125 2.86 84 4.20 124 3.67 88 3.77 126 2.66 44 4.46
Barbados 54 4.30 30 5.22 74 4.28 31 4.60 32 4.63 35 4.98 138 2.07
Belgium 18 5.07 5 5.93 14 5.14 60 4.27 38 4.53 14 5.78 28 4.80
Bhutan 123 3.35 108 3.45 115 3.99 24 4.69 111 3.45 124 2.69 140 1.83
Bolivia 116 3.40 97 3.73 132 3.60 127 3.58 121 3.33 118 2.79 84 3.38
Botswana 84 3.87 101 3.59 97 4.12 36 4.56 57 4.22 76 3.58 97 3.12
Brazil 42 4.46 41 4.92 123 3.85 109 3.83 53 4.30 58 4.21 9 5.66
Bulgaria 52 4.31 63 4.49 63 4.37 67 4.24 60 4.17 41 4.73 63 3.87
Burkina Faso 132 3.16 136 2.42 127 3.81 70 4.22 127 3.14 132 2.49 111 2.87
Burundi 144 2.62 142 2.14 135 3.49 103 3.89 142 2.37 142 2.10 141 1.74
Cambodia 100 3.65 123 2.92 90 4.17 29 4.63 84 3.80 102 3.02 87 3.31
Cameroon 113 3.48 117 3.22 113 3.99 81 4.11 108 3.51 120 2.76 91 3.30
Canada 6 5.37 18 5.50 15 5.13 7 5.20 8 5.35 22 5.57 13 5.48
Cape Verde 127 3.29 89 3.91 110 4.01 126 3.59 115 3.36 80 3.54 144 1.30
Chad 142 2.74 143 2.05 142 2.94 120 3.72 136 2.74 143 2.09 106 2.92
Chile 29 4.68 32 5.09 34 4.68 50 4.36 19 4.88 42 4.59 41 4.50
China 30 4.68 65 4.42 56 4.42 37 4.55 54 4.30 83 3.53 2 6.86
Colombia 63 4.17 69 4.37 109 4.03 84 4.08 70 4.01 68 3.84 32 4.71
Costa Rica 56 4.28 37 5.00 52 4.47 57 4.29 92 3.74 40 4.77 82 3.43
Côte d'Ivoire 108 3.58 121 3.12 82 4.23 73 4.21 78 3.86 117 2.81 94 3.23
Croatia 68 4.11 53 4.67 105 4.05 106 3.86 74 3.91 44 4.56 79 3.58
Cyprus 57 4.28 33 5.06 27 4.86 30 4.61 83 3.81 43 4.56 115 2.77
Czech Republic 34 4.62 35 5.02 50 4.53 62 4.26 44 4.45 36 4.96 42 4.49
Denmark 17 5.11 10 5.68 23 4.96 12 4.99 27 4.72 6 6.10 54 4.23
Dominican Republic 90 3.77 99 3.69 94 4.15 107 3.85 99 3.70 84 3.51 68 3.72
Egypt 106 3.58 111 3.27 118 3.95 140 3.08 125 3.19 95 3.21 29 4.78
El Salvador 96 3.71 94 3.85 55 4.45 125 3.64 86 3.78 93 3.24 90 3.30
Estonia 27 4.73 20 5.49 26 4.89 11 5.02 29 4.67 29 5.26 100 3.07
Ethiopia 120 3.37 131 2.63 124 3.84 78 4.15 120 3.33 133 2.46 66 3.81
Finland 10 5.27 1 6.22 18 5.03 23 4.69 5 5.55 11 5.97 55 4.18
France 19 5.07 28 5.26 46 4.57 61 4.27 23 4.79 17 5.77 8 5.74
Gabon 119 3.37 126 2.78 126 3.81 69 4.23 105 3.57 108 2.95 109 2.89
Gambia, The 117 3.40 107 3.45 111 4.00 38 4.54 94 3.74 103 3.02 142 1.65
Georgia 79 3.92 92 3.89 60 4.40 41 4.49 76 3.90 67 3.85 103 2.98
Germany 9 5.28 16 5.55 19 4.99 35 4.57 25 4.76 13 5.81 5 5.99
Ghana 89 3.78 106 3.46 67 4.34 98 3.94 62 4.15 100 3.11 69 3.71
Greece 65 4.15 44 4.84 85 4.20 118 3.74 130 2.97 39 4.79 49 4.34
Guatemala 76 3.95 103 3.56 45 4.58 85 4.07 45 4.44 88 3.47 78 3.59
Guinea 138 2.88 140 2.19 137 3.40 89 4.05 134 2.85 139 2.35 127 2.44
Guyana 109 3.55 82 4.12 83 4.21 101 3.90 82 3.81 101 3.10 135 2.15
Haiti 135 3.08 109 3.43 140 3.21 77 4.15 135 2.81 134 2.41 129 2.43
Honduras 99 3.65 100 3.63 91 4.17 130 3.51 59 4.17 97 3.18 93 3.24
Hong Kong SAR 3 5.58 22 5.44 2 5.59 3 5.57 1 5.91 5 6.10 27 4.89
Hungary 53 4.30 52 4.68 65 4.36 75 4.17 73 3.93 50 4.43 53 4.26
Iceland 35 4.60 13 5.62 49 4.54 14 4.94 68 4.03 8 6.02 128 2.44
India 61 4.19 93 3.86 95 4.13 112 3.81 51 4.34 121 2.75 3 6.26
Indonesia 46 4.38 61 4.53 48 4.54 110 3.81 42 4.45 77 3.58 15 5.34
Iran, Islamic Rep. 98 3.70 78 4.17 120 3.93 142 3.01 128 3.05 107 2.95 21 5.09
Ireland 21 4.97 17 5.54 10 5.29 18 4.82 61 4.15 12 5.89 57 4.15
Israel 26 4.75 36 5.00 79 4.24 59 4.27 20 4.87 15 5.78 48 4.36
Italy 47 4.35 47 4.78 73 4.30 136 3.29 119 3.35 38 4.82 12 5.57
Jamaica 77 3.95 76 4.19 76 4.28 58 4.28 48 4.40 75 3.61 107 2.92
Japan 7 5.35 21 5.44 12 5.20 22 4.73 16 4.98 20 5.61 4 6.14
Jordan 70 4.08 48 4.78 40 4.63 94 4.02 66 4.06 73 3.71 88 3.30
Kazakhstan 48 4.33 62 4.51 54 4.46 15 4.90 98 3.70 61 4.16 52 4.26
Kenya 66 4.12 95 3.77 62 4.40 25 4.68 24 4.77 87 3.48 74 3.62
Korea, Rep. 25 4.83 23 5.38 33 4.70 86 4.07 80 3.81 25 5.42 11 5.60
Kuwait 83 3.89 81 4.15 106 4.04 116 3.78 77 3.88 74 3.69 67 3.80
Kyrgyz Republic 104 3.59 91 3.89 77 4.25 92 4.02 95 3.73 111 2.90 117 2.76
Lao PDR 107 3.58 110 3.28 59 4.41 34 4.59 101 3.69 115 2.83 121 2.67
Latvia 36 4.60 31 5.13 36 4.67 17 4.82 33 4.63 32 5.12 95 3.20
Lebanon 85 3.86 67 4.39 71 4.31 123 3.68 102 3.65 86 3.50 76 3.61Lesotho 130 3.21 116 3.23 80 4.24 76 4.16 123 3.27 137 2.37 139 2.01
(Cont’d.)
© 2014 World Economic Forum
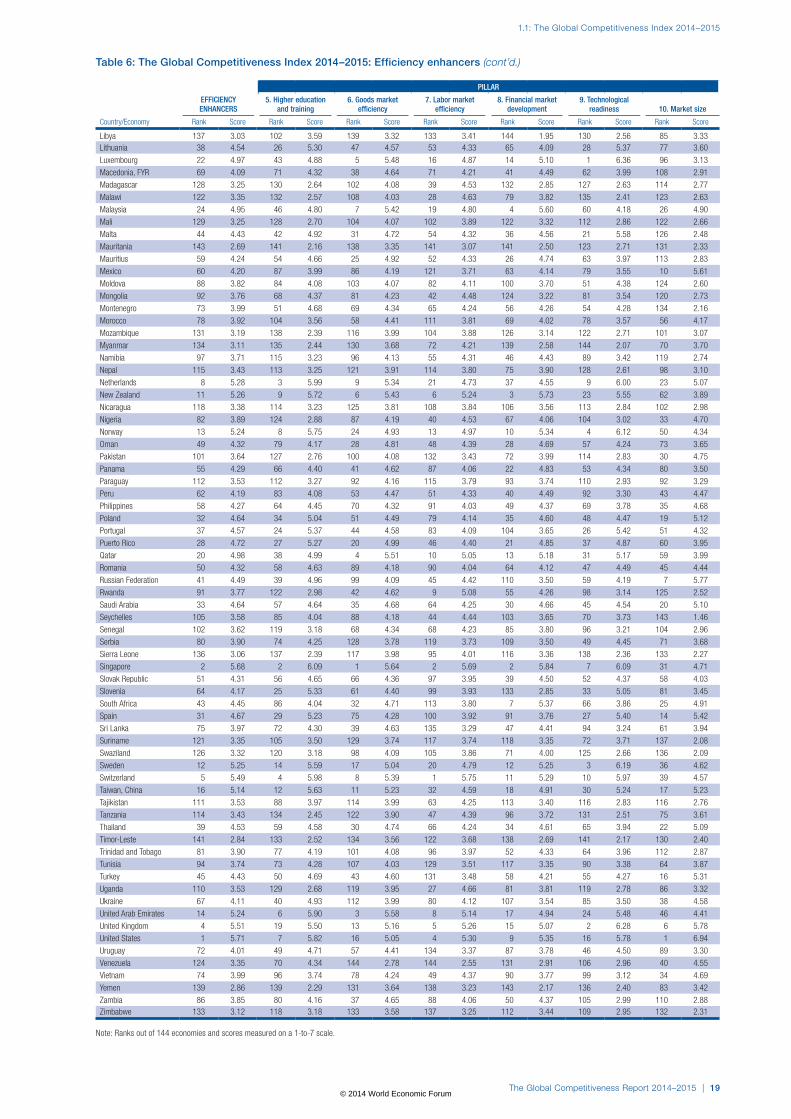
The Global Competitiveness Report 2014–2015 | 19
1.1: The Global Competitiveness Index 2014–2015
Table 6: The Global Competitiveness Index 2014–2015: Efficiency enhancers (cont’d.)
PILLAR
EFFICIENCY ENHANCERS
5. Higher education and training
6. Goods market efficiency
7. Labor market efficiency
8. Financial market development
9. Technological readiness 10. Market size
Country/Economy Rank Score Rank Score Rank Score Rank Score Rank Score Rank Score Rank Score
Libya 137 3.03 102 3.59 139 3.32 133 3.41 144 1.95 130 2.56 85 3.33Lithuania 38 4.54 26 5.30 47 4.57 53 4.33 65 4.09 28 5.37 77 3.60
Luxembourg 22 4.97 43 4.88 5 5.48 16 4.87 14 5.10 1 6.36 96 3.13
Macedonia, FYR 69 4.09 71 4.32 38 4.64 71 4.21 41 4.49 62 3.99 108 2.91
Madagascar 128 3.25 130 2.64 102 4.08 39 4.53 132 2.85 127 2.63 114 2.77
Malawi 122 3.35 132 2.57 108 4.03 28 4.63 79 3.82 135 2.41 123 2.63
Malaysia 24 4.95 46 4.80 7 5.42 19 4.80 4 5.60 60 4.18 26 4.90
Mali 129 3.25 128 2.70 104 4.07 102 3.89 122 3.32 112 2.86 122 2.66
Malta 44 4.43 42 4.92 31 4.72 54 4.32 36 4.56 21 5.58 126 2.48
Mauritania 143 2.69 141 2.16 138 3.35 141 3.07 141 2.50 123 2.71 131 2.33
Mauritius 59 4.24 54 4.66 25 4.92 52 4.33 26 4.74 63 3.97 113 2.83
Mexico 60 4.20 87 3.99 86 4.19 121 3.71 63 4.14 79 3.55 10 5.61
Moldova 88 3.82 84 4.08 103 4.07 82 4.11 100 3.70 51 4.38 124 2.60
Mongolia 92 3.76 68 4.37 81 4.23 42 4.48 124 3.22 81 3.54 120 2.73
Montenegro 73 3.99 51 4.68 69 4.34 65 4.24 56 4.26 54 4.28 134 2.16
Morocco 78 3.92 104 3.56 58 4.41 111 3.81 69 4.02 78 3.57 56 4.17
Mozambique 131 3.19 138 2.39 116 3.99 104 3.88 126 3.14 122 2.71 101 3.07
Myanmar 134 3.11 135 2.44 130 3.68 72 4.21 139 2.58 144 2.07 70 3.70
Namibia 97 3.71 115 3.23 96 4.13 55 4.31 46 4.43 89 3.42 119 2.74
Nepal 115 3.43 113 3.25 121 3.91 114 3.80 75 3.90 128 2.61 98 3.10
Netherlands 8 5.28 3 5.99 9 5.34 21 4.73 37 4.55 9 6.00 23 5.07
New Zealand 11 5.26 9 5.72 6 5.43 6 5.24 3 5.73 23 5.55 62 3.89
Nicaragua 118 3.38 114 3.23 125 3.81 108 3.84 106 3.56 113 2.84 102 2.98
Nigeria 82 3.89 124 2.88 87 4.19 40 4.53 67 4.06 104 3.02 33 4.70
Norway 13 5.24 8 5.75 24 4.93 13 4.97 10 5.34 4 6.12 50 4.34
Oman 49 4.32 79 4.17 28 4.81 48 4.39 28 4.69 57 4.24 73 3.65
Pakistan 101 3.64 127 2.76 100 4.08 132 3.43 72 3.99 114 2.83 30 4.75
Panama 55 4.29 66 4.40 41 4.62 87 4.06 22 4.83 53 4.34 80 3.50
Paraguay 112 3.53 112 3.27 92 4.16 115 3.79 93 3.74 110 2.93 92 3.29
Peru 62 4.19 83 4.08 53 4.47 51 4.33 40 4.49 92 3.30 43 4.47
Philippines 58 4.27 64 4.45 70 4.32 91 4.03 49 4.37 69 3.78 35 4.68
Poland 32 4.64 34 5.04 51 4.49 79 4.14 35 4.60 48 4.47 19 5.12
Portugal 37 4.57 24 5.37 44 4.58 83 4.09 104 3.65 26 5.42 51 4.32
Puerto Rico 28 4.72 27 5.27 20 4.99 46 4.40 21 4.85 37 4.87 60 3.95
Qatar 20 4.98 38 4.99 4 5.51 10 5.05 13 5.18 31 5.17 59 3.99
Romania 50 4.32 58 4.63 89 4.18 90 4.04 64 4.12 47 4.49 45 4.44
Russian Federation 41 4.49 39 4.96 99 4.09 45 4.42 110 3.50 59 4.19 7 5.77
Rwanda 91 3.77 122 2.98 42 4.62 9 5.08 55 4.26 98 3.14 125 2.52
Saudi Arabia 33 4.64 57 4.64 35 4.68 64 4.25 30 4.66 45 4.54 20 5.10
Seychelles 105 3.58 85 4.04 88 4.18 44 4.44 103 3.65 70 3.73 143 1.46
Senegal 102 3.62 119 3.18 68 4.34 68 4.23 85 3.80 96 3.21 104 2.96
Serbia 80 3.90 74 4.25 128 3.78 119 3.73 109 3.50 49 4.45 71 3.68
Sierra Leone 136 3.06 137 2.39 117 3.98 95 4.01 116 3.36 138 2.36 133 2.27
Singapore 2 5.68 2 6.09 1 5.64 2 5.69 2 5.84 7 6.09 31 4.71
Slovak Republic 51 4.31 56 4.65 66 4.36 97 3.95 39 4.50 52 4.37 58 4.03
Slovenia 64 4.17 25 5.33 61 4.40 99 3.93 133 2.85 33 5.05 81 3.45
South Africa 43 4.45 86 4.04 32 4.71 113 3.80 7 5.37 66 3.86 25 4.91
Spain 31 4.67 29 5.23 75 4.28 100 3.92 91 3.76 27 5.40 14 5.42
Sri Lanka 75 3.97 72 4.30 39 4.63 135 3.29 47 4.41 94 3.24 61 3.94
Suriname 121 3.35 105 3.50 129 3.74 117 3.74 118 3.35 72 3.71 137 2.08
Swaziland 126 3.32 120 3.18 98 4.09 105 3.86 71 4.00 125 2.66 136 2.09
Sweden 12 5.25 14 5.59 17 5.04 20 4.79 12 5.25 3 6.19 36 4.62
Switzerland 5 5.49 4 5.98 8 5.39 1 5.75 11 5.29 10 5.97 39 4.57
Taiwan, China 16 5.14 12 5.63 11 5.23 32 4.59 18 4.91 30 5.24 17 5.23
Tajikistan 111 3.53 88 3.97 114 3.99 63 4.25 113 3.40 116 2.83 116 2.76
Tanzania 114 3.43 134 2.45 122 3.90 47 4.39 96 3.72 131 2.51 75 3.61
Thailand 39 4.53 59 4.58 30 4.74 66 4.24 34 4.61 65 3.94 22 5.09
Timor-Leste 141 2.84 133 2.52 134 3.56 122 3.68 138 2.69 141 2.17 130 2.40
Trinidad and Tobago 81 3.90 77 4.19 101 4.08 96 3.97 52 4.33 64 3.96 112 2.87
Tunisia 94 3.74 73 4.28 107 4.03 129 3.51 117 3.35 90 3.38 64 3.87
Turkey 45 4.43 50 4.69 43 4.60 131 3.48 58 4.21 55 4.27 16 5.31
Uganda 110 3.53 129 2.68 119 3.95 27 4.66 81 3.81 119 2.78 86 3.32
Ukraine 67 4.11 40 4.93 112 3.99 80 4.12 107 3.54 85 3.50 38 4.58
United Arab Emirates 14 5.24 6 5.90 3 5.58 8 5.14 17 4.94 24 5.48 46 4.41
United Kingdom 4 5.51 19 5.50 13 5.16 5 5.26 15 5.07 2 6.28 6 5.78
United States 1 5.71 7 5.82 16 5.05 4 5.30 9 5.35 16 5.78 1 6.94
Uruguay 72 4.01 49 4.71 57 4.41 134 3.37 87 3.78 46 4.50 89 3.30
Venezuela 124 3.35 70 4.34 144 2.78 144 2.55 131 2.91 106 2.96 40 4.55
Vietnam 74 3.99 96 3.74 78 4.24 49 4.37 90 3.77 99 3.12 34 4.69
Yemen 139 2.86 139 2.29 131 3.64 138 3.23 143 2.17 136 2.40 83 3.42
Zambia 86 3.85 80 4.16 37 4.65 88 4.06 50 4.37 105 2.99 110 2.88Zimbabwe 133 3.12 118 3.18 133 3.58 137 3.25 112 3.44 109 2.95 132 2.31
Note: Ranks out of 144 economies and scores measured on a 1-to-7 scale.
© 2014 World Economic Forum
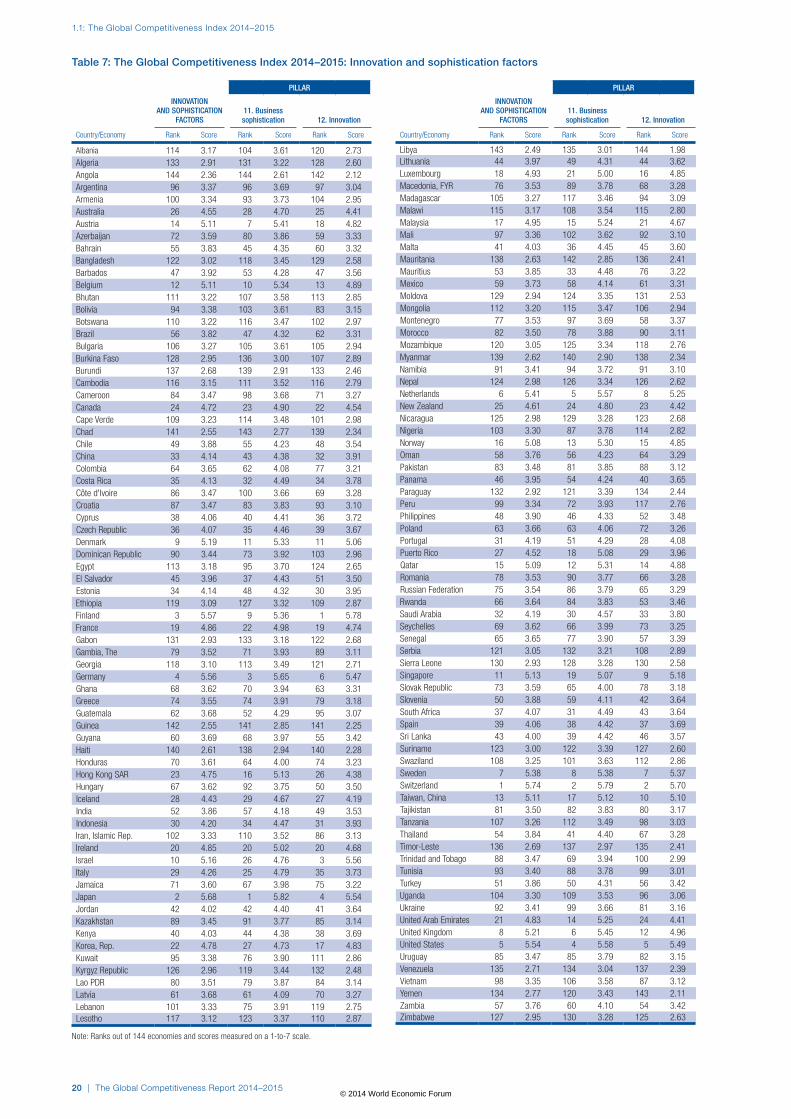
1.1: The Global Competitiveness Index 2014–2015
20 | The Global Competitiveness Report 2014–2015
PILLAR
INNOVATION AND SOPHISTICATION
FACTORS11. Business sophistication 12. Innovation
Country/Economy Rank Score Rank Score Rank Score
Albania 114 3.17 104 3.61 120 2.73Algeria 133 2.91 131 3.22 128 2.60Angola 144 2.36 144 2.61 142 2.12Argentina 96 3.37 96 3.69 97 3.04Armenia 100 3.34 93 3.73 104 2.95Australia 26 4.55 28 4.70 25 4.41Austria 14 5.11 7 5.41 18 4.82Azerbaijan 72 3.59 80 3.86 59 3.33Bahrain 55 3.83 45 4.35 60 3.32Bangladesh 122 3.02 118 3.45 129 2.58Barbados 47 3.92 53 4.28 47 3.56Belgium 12 5.11 10 5.34 13 4.89Bhutan 111 3.22 107 3.58 113 2.85Bolivia 94 3.38 103 3.61 83 3.15Botswana 110 3.22 116 3.47 102 2.97Brazil 56 3.82 47 4.32 62 3.31Bulgaria 106 3.27 105 3.61 105 2.94Burkina Faso 128 2.95 136 3.00 107 2.89Burundi 137 2.68 139 2.91 133 2.46Cambodia 116 3.15 111 3.52 116 2.79Cameroon 84 3.47 98 3.68 71 3.27Canada 24 4.72 23 4.90 22 4.54Cape Verde 109 3.23 114 3.48 101 2.98Chad 141 2.55 143 2.77 139 2.34Chile 49 3.88 55 4.23 48 3.54China 33 4.14 43 4.38 32 3.91Colombia 64 3.65 62 4.08 77 3.21Costa Rica 35 4.13 32 4.49 34 3.78Côte d'Ivoire 86 3.47 100 3.66 69 3.28Croatia 87 3.47 83 3.83 93 3.10Cyprus 38 4.06 40 4.41 36 3.72Czech Republic 36 4.07 35 4.46 39 3.67Denmark 9 5.19 11 5.33 11 5.06Dominican Republic 90 3.44 73 3.92 103 2.96Egypt 113 3.18 95 3.70 124 2.65El Salvador 45 3.96 37 4.43 51 3.50Estonia 34 4.14 48 4.32 30 3.95Ethiopia 119 3.09 127 3.32 109 2.87Finland 3 5.57 9 5.36 1 5.78France 19 4.86 22 4.98 19 4.74Gabon 131 2.93 133 3.18 122 2.68Gambia, The 79 3.52 71 3.93 89 3.11Georgia 118 3.10 113 3.49 121 2.71Germany 4 5.56 3 5.65 6 5.47Ghana 68 3.62 70 3.94 63 3.31Greece 74 3.55 74 3.91 79 3.18Guatemala 62 3.68 52 4.29 95 3.07Guinea 142 2.55 141 2.85 141 2.25Guyana 60 3.69 68 3.97 55 3.42Haiti 140 2.61 138 2.94 140 2.28Honduras 70 3.61 64 4.00 74 3.23Hong Kong SAR 23 4.75 16 5.13 26 4.38Hungary 67 3.62 92 3.75 50 3.50Iceland 28 4.43 29 4.67 27 4.19India 52 3.86 57 4.18 49 3.53Indonesia 30 4.20 34 4.47 31 3.93Iran, Islamic Rep. 102 3.33 110 3.52 86 3.13Ireland 20 4.85 20 5.02 20 4.68Israel 10 5.16 26 4.76 3 5.56Italy 29 4.26 25 4.79 35 3.73Jamaica 71 3.60 67 3.98 75 3.22Japan 2 5.68 1 5.82 4 5.54Jordan 42 4.02 42 4.40 41 3.64Kazakhstan 89 3.45 91 3.77 85 3.14Kenya 40 4.03 44 4.38 38 3.69Korea, Rep. 22 4.78 27 4.73 17 4.83Kuwait 95 3.38 76 3.90 111 2.86Kyrgyz Republic 126 2.96 119 3.44 132 2.48Lao PDR 80 3.51 79 3.87 84 3.14Latvia 61 3.68 61 4.09 70 3.27Lebanon 101 3.33 75 3.91 119 2.75Lesotho 117 3.12 123 3.37 110 2.87
Table 7: The Global Competitiveness Index 2014–2015: Innovation and sophistication factors
PILLAR
INNOVATION AND SOPHISTICATION
FACTORS11. Business sophistication 12. Innovation
Country/Economy Rank Score Rank Score Rank Score
Libya 143 2.49 135 3.01 144 1.98Lithuania 44 3.97 49 4.31 44 3.62Luxembourg 18 4.93 21 5.00 16 4.85Macedonia, FYR 76 3.53 89 3.78 68 3.28Madagascar 105 3.27 117 3.46 94 3.09Malawi 115 3.17 108 3.54 115 2.80Malaysia 17 4.95 15 5.24 21 4.67Mali 97 3.36 102 3.62 92 3.10Malta 41 4.03 36 4.45 45 3.60Mauritania 138 2.63 142 2.85 136 2.41Mauritius 53 3.85 33 4.48 76 3.22Mexico 59 3.73 58 4.14 61 3.31Moldova 129 2.94 124 3.35 131 2.53Mongolia 112 3.20 115 3.47 106 2.94Montenegro 77 3.53 97 3.69 58 3.37Morocco 82 3.50 78 3.88 90 3.11Mozambique 120 3.05 125 3.34 118 2.76Myanmar 139 2.62 140 2.90 138 2.34Namibia 91 3.41 94 3.72 91 3.10Nepal 124 2.98 126 3.34 126 2.62Netherlands 6 5.41 5 5.57 8 5.25New Zealand 25 4.61 24 4.80 23 4.42Nicaragua 125 2.98 129 3.28 123 2.68Nigeria 103 3.30 87 3.78 114 2.82Norway 16 5.08 13 5.30 15 4.85Oman 58 3.76 56 4.23 64 3.29Pakistan 83 3.48 81 3.85 88 3.12Panama 46 3.95 54 4.24 40 3.65Paraguay 132 2.92 121 3.39 134 2.44Peru 99 3.34 72 3.93 117 2.76Philippines 48 3.90 46 4.33 52 3.48Poland 63 3.66 63 4.06 72 3.26Portugal 31 4.19 51 4.29 28 4.08Puerto Rico 27 4.52 18 5.08 29 3.96Qatar 15 5.09 12 5.31 14 4.88Romania 78 3.53 90 3.77 66 3.28Russian Federation 75 3.54 86 3.79 65 3.29Rwanda 66 3.64 84 3.83 53 3.46Saudi Arabia 32 4.19 30 4.57 33 3.80Seychelles 69 3.62 66 3.99 73 3.25Senegal 65 3.65 77 3.90 57 3.39Serbia 121 3.05 132 3.21 108 2.89Sierra Leone 130 2.93 128 3.28 130 2.58Singapore 11 5.13 19 5.07 9 5.18Slovak Republic 73 3.59 65 4.00 78 3.18Slovenia 50 3.88 59 4.11 42 3.64South Africa 37 4.07 31 4.49 43 3.64Spain 39 4.06 38 4.42 37 3.69Sri Lanka 43 4.00 39 4.42 46 3.57Suriname 123 3.00 122 3.39 127 2.60Swaziland 108 3.25 101 3.63 112 2.86Sweden 7 5.38 8 5.38 7 5.37Switzerland 1 5.74 2 5.79 2 5.70Taiwan, China 13 5.11 17 5.12 10 5.10Tajikistan 81 3.50 82 3.83 80 3.17Tanzania 107 3.26 112 3.49 98 3.03Thailand 54 3.84 41 4.40 67 3.28Timor-Leste 136 2.69 137 2.97 135 2.41Trinidad and Tobago 88 3.47 69 3.94 100 2.99Tunisia 93 3.40 88 3.78 99 3.01Turkey 51 3.86 50 4.31 56 3.42Uganda 104 3.30 109 3.53 96 3.06Ukraine 92 3.41 99 3.66 81 3.16United Arab Emirates 21 4.83 14 5.25 24 4.41United Kingdom 8 5.21 6 5.45 12 4.96United States 5 5.54 4 5.58 5 5.49Uruguay 85 3.47 85 3.79 82 3.15Venezuela 135 2.71 134 3.04 137 2.39Vietnam 98 3.35 106 3.58 87 3.12Yemen 134 2.77 120 3.43 143 2.11Zambia 57 3.76 60 4.10 54 3.42Zimbabwe 127 2.95 130 3.28 125 2.63
Note: Ranks out of 144 economies and scores measured on a 1-to-7 scale.
© 2014 World Economic Forum
The Global Competitiveness Report 2014–2015 | 21
1.1: The Global Competitiveness Index 2014–2015
2nd, behind Finland. Singapore’s private sector is also fairly sophisticated (19th) and becoming more innovative (9th), although room for improvement exists in both areas, especially as these are the keys to Singapore’s future prosperity.
The United States goes up in the rankings for a second year in a row and regains the 3rd position on the back of improvements in a number of areas, including some aspects of the institutional framework (up from 35th to 30th), and more positive perceptions regarding business sophistication (from 6th to 4th) and innovation (from 7th to 5th). As it recovers from the crisis, the United States can build on the many structural features that make its economy extremely productive. US companies are highly sophisticated and innovative, and they are supported by an excellent university system that collaborates admirably with the business sector in R&D. Combined with flexible labor markets and the scale opportunities afforded by the sheer size of its domestic economy—the largest in the world by far—these qualities make the United States very competitive. On the other hand, some weaknesses in particular areas remain to be addressed. The business community continues to be rather critical, with trust in politicians still somewhat weak (48th), concerns about favoritism of government officials (47th), and a general perception that the government spends its resources relatively wastefully (73rd). The macroeconomic environment remains the country’s greatest area of weakness (113th), although the fiscal deficit continues to narrow and public debt is slightly lower for the first time since the crisis.
Finland continues to exhibit a strong performance across all the analyzed dimensions, despite its drop of one place to 4th position. This decline is mainly driven by a slight deterioration of its macroeconomic conditions (43rd), which has led some rating agencies to downgrade the outlook of this Nordic economy. More precisely, Finland suffers from higher, though still manageable, deficit and public debt level, and its savings rate has slightly decreased. Nevertheless, the country continues to boast well-functioning and highly transparent public institutions (1st), at the very top in many of the indicators included in this category, and high-quality infrastructure (19th). The functioning of its products market is also good (18th), financial development is very high (5th), and the country manages to use its existing talent efficiently (7th) despite some persistent rigidities in its labor market, most notably in terms of wage determination (143rd), which is regarded as one of the most problematic factors for doing business. Its biggest competitiveness strength lies in its capacity to innovate, where the country leads the world rankings (1st). Very high public and private investments in R&D (3rd), with very strong linkages between universities and industry (1st) coupled with an excellent education and training system (1st) and one of the highest levels
of technological readiness (11th) drive this outstanding result.
Germany drops one place to 5th position this year. The small drop is the result of some concerns about institutions and infrastructure and is only partially balanced out by improvements in the country’s macroeconomic environment and financial development. Moreover, Germany’s education system is assessed less positively than it was in previous years (16th, down from 3rd) because the indicator measuring the country’s tertiary enrollment rate became available. Overall, Germany weathered the global economic crisis of recent years quite well thanks at least partly to its main competitiveness strengths, which include highly sophisticated businesses (3rd) and an innovation ecosystem that is conducive to high levels of R&D innovation (6th). Companies spend heavily on R&D (5th) and can rely on an institutional framework, including collaboration with universities (10th) and research labs (8th), to support their innovation efforts. Innovation is also supported because companies, which are predominantly medium-sized, often operate in niche markets and are located in close geographical proximity to each other (3rd on cluster development). This fosters the exchange of learning among businesses and facilitates the development of new goods and services. High-quality infrastructure (7th) and excellent on-the-job training (6th) complement these strengths. The top-notch German on-the-job training system ensures that technical skills for companies are widely available and that skills match the needs of businesses. Germany’s economy could be more competitive if its labor markets were made even more efficient. In recent years, labor market efficiency has improved markedly, rising from the 53rd position in 2012 to 35th this year. However, some recent decisions, such as the introduction of a minimum wage, could reverse this positive trend. In the context of declining population growth, a more holistic approach to immigration and more incentives for women to remain in the labor market are going to be crucial for the country to ensure a supply of talent. Last but not least, continued efforts toward strengthening its fiscal situation will be key to reducing the country’s high public debt (118th).
Up three places to reach 6th position overall, Japan posts the largest improvement of the top 10 economies, thanks to small improvements across the board. Japan continues to enjoy a major competitive edge in business sophistication (1st for the sixth consecutive year) and in innovation (4th, up one position). High R&D spending (2nd), excellent availability of talent (3rd), world-class research institutions (7th), and a high capacity to innovate (7th) are among Japan’s strengths. Indeed, in terms of innovation output, these strengths pay off: the country has the second-highest number of patent applications per capita in the world. Further, companies operate at the highest end of the value chain, producing
© 2014 World Economic Forum
1.1: The Global Competitiveness Index 2014–2015
22 | The Global Competitiveness Report 2014–2015
high-value-added goods and services. However, the country’s overall competitive performance continues to be dragged down by severe macroeconomic challenges (127th). For the past five years, its budget deficit has been hovering around 10 percent of GDP, one of the highest ratios in the world, while public debt now represents more than 240 percent of the country’s GDP. At least the country’s battle against deflation has started bearing fruit: prices in 2013 increased for the first time in five years—by a low 0.4 percent. Another area of concern is the situation in the labor market (22nd). Japan ranks 133rd in the indicator capturing the ease of hiring and firing workers. In addition, the participation of women in the labor force (88th) is one of the lowest among OECD members.
Featured in the top 10 since 2012, Hong Kong SAR retains its 7th position. It tops the infrastructure pillar, reflecting the outstanding quality of its facilities across all modes of transportation. The economy also continues to dominate the financial market development pillar, owing to the high level of efficiency, trustworthiness, and stability of its system. As in the case of Singapore, the dynamism and efficiency of Hong Kong’s goods market (2nd) and labor market (3rd) further contribute to its excellent overall positioning. Hong Kong is also one of the most open economies in the world. In order to enhance its competitiveness, Hong Kong must improve on higher education (22nd) and innovation (26th, down three places this year). In the latter category, the quality of its research institutions (32nd, down one) and the limited availability of scientists and engineers (36th, down four) remain the two key issues to be addressed. In building a truly innovation-driven economy, Hong Kong can rely on its high degree of technological readiness (5th).
As in the last edition, the Netherlands retains its 8th place this year and depicts a stable competitiveness profile. Overall, the country continues to depict a set of important competitiveness strengths that allow its economy to remain highly productive. An excellent education and training system (3rd), coupled with a strong adoption of technology (9th), including ICTs (8th), and an excellent innovation capacity (8th) result in highly sophisticated businesses (5th) that manage to compete at the very high end of international value chains. In addition, efficient institutions (10th), world-class infrastructure (4th), and highly competitive (5th) and open products markets (6th) complete the impressive list of the country’s assets. Notwithstanding these strengths, the otherwise excellent Dutch performance is somewhat hindered by some persistent rigidities in its labor market, especially in terms of hiring and firing practices (123rd) and wage determination (135th)—these rigidities are regarded as the most problematic factor for doing business in the country. Furthermore, the current weaknesses of its financial system (80th), which are a
consequence of the housing bubble, have made access to credit (48th) more difficult.
The United Kingdom climbs one spot to the 9th place. Overall, the country improves its performance thanks to gains derived from lower levels of fiscal deficit and public debt. In addition to these more favorable macroeconomic conditions, the United Kingdom continues to benefit from an efficient labor market (5th) and a high level of financial development (15th), despite the recent difficulties in parts of its banking system (89th) and the fact that the difficult access to loans (82nd) remains the most problematic factor for doing business in the country. In addition, the country benefits from an ICT uptake that is one of the highest in the world (2nd) and that, coupled with a highly competitive (5th) and large market (6th), allows for highly sophisticated (6th) and innovative (12th) businesses to spring up and develop. In addition to continuing to improve its macroeconomic conditions (107th), the country should look into effective ways to raise the overall quality of its education system (23rd), most notably in the areas of mathematics and science (63rd), which will be crucial to continue fostering innovation in the country.
Sweden, despite a rather stable competitiveness profile across all areas, falls four places this year to round up the top 10 rankings. Overall the country boasts important strengths across the board, with strong institutions (13th) that are regarded as transparent and efficient, excellent infrastructure (22nd), and healthy macroeconomic conditions (17th) that include low levels of fiscal deficit and public debt, allowing the country to maintain its triple-A rating throughout the recent financial and economic crisis. Moreover, and perhaps more importantly, Sweden has managed to create the right set of conditions for innovation and unsurprisingly scores very high in many of the dimensions that are key to creating a knowledge-based society. More precisely, the Swedish education and training system (14th) is of high quality and seems to deliver the right set of skills for an innovation-based economy; ICT adoption (3rd) is among the highest in the world; and, in terms of innovation capacity (6th), firms are among the best performing. In addition, the country has also formed highly competitive markets (21st), which produce the right set of incentives to quickly transform those knowledge assets into new products and services with higher value-added. Going forward, the country should address its labor market regulations (59th) and the potential distortions that a high tax rate system (119th) may create, as these two elements are considered the two most problematic factors for doing business in the country.
Europe and EurasiaSix European countries are ranked among the top 10 most competitive economies, while at the same time, many countries in Southern and Central and
© 2014 World Economic Forum
The Global Competitiveness Report 2014–2015 | 23
1.1: The Global Competitiveness Index 2014–2015
Eastern Europe—such as Portugal, Italy, Bulgaria, Romania, and Greece—score relatively low, ranking 36th, 49th, 54th, 59th, and 81st, respectively. This wide-ranging performance highlights the persistence of a competitiveness divide in Europe between a highly competitive Northern Europe and a less competitive Southern and Eastern Europe. A more nuanced analysis of the results also reveals that a new divide seems to be emerging among those countries whose competitiveness is currently lagging. This new divide appears to be between those economies that are adopting and implementing the reforms necessary to become more competitive—these include countries such as Greece and Portugal that are now improving in the overall rankings—and some other economies, such as France and Italy, which are not recording much progress.
Denmark improves by two positions to reach 13th place on the back of a slight rebound in the assessment of its institutions and financial markets as well as more favorable macroeconomic conditions, which together have allowed the country to close the European Commission’s formal procedure that assesses excessive deficits. Similar to its Nordic neighbors, Denmark continues to benefit a well-functioning and highly transparent institutional framework (16th). The country also continues to receive a first-rate assessment for its higher education and training system (10th), which has provided the Danish workforce with the skills needed to adapt rapidly to a changing environment and has laid the ground for high levels of technological adoption and innovation. A continued strong focus on education would allow the workforce to maintain the skill levels needed to provide the basis for sustained innovation-led growth. A marked difference from the other Nordic countries relates to labor market flexibility, where Denmark (12th) continues to distinguish itself as having one of the most efficient labor markets internationally, with flexible regulations; strong labor-employer relations; and a very high percentage of women in the labor force.
Despite the drop of one position that leads to Belgium’s 18th place in the rankings, the country has slightly improved its competitiveness score thanks to a better macroeconomic performance with a lower public deficit, which remains below 3 percent of its GDP. Furthermore, in addition to boasting an outstanding education and training system (5th)—with excellent math and science education (3rd), top-notch management schools (2nd), and a strong propensity for on-the-job training (4th)—the country benefits from a high level of technological adoption (15th) and highly sophisticated (10th) and innovative (13th) businesses that carry out their activities in a market characterized by high competition (6th) and an environment that facilitates new business creation. Notwithstanding these strengths, some concerns remain about the efficiency of Belgium’s government (64th); its regulatory burden (130th); its
highly distortionary tax system (126th), which reduces incentives to work (141st); and the cost of the country’s public debt—which is close to 100 percent of GDP.
Following the completion of its EU-IMF–supported program, this year Ireland experiences a slight rebound and climbs by three places to reach the 25th position, which reflects its financial market recovery. Yet its macroeconomic situation remains difficult at a low 130th place, characterized by a high budget deficit (although down from the historic highs of four years ago) and high government debt. Despite these economic woes, the country features strong foundations for its long-run competitiveness: the functioning of its goods and labor markets, ranked 10th and 18th respectively, is solid, and its business culture is highly sophisticated and innovative (ranked 20th for both); this is buttressed by excellent technological adoption (12th). In addition, equipped with its excellent health and primary education system (8th) and strong higher education and training (17th), the country can draw on a well-educated workforce, although the high levels of emigration in recent years—particularly of its young population—suggests that fewer young people will be available in the future.
France retains its 23rd position after dropping for four consecutive years. The government has promised a “competitiveness shock” and is considering a number of business-friendly measures, including a simplification of administrative procedures, in order to revive growth and reduce the country’s stubbornly high level of unemployment. Traditionally a black spot, the situation of France’s labor market has improved markedly over the year (61st, up 10), thanks to increased flexibility, although it still remains a challenge (107th, up nine). By contrast, the fiscal situation—the second area of major concern—continues to deteriorate (82nd, down nine). The small reduction in the budget deficit is accompanied by an increase in public debt and a downgrading of France’s creditworthiness. The country retains a number of clear competitive advantages, however. Its infrastructure is still among the best in the world. France also obtains good marks for the quality and quantity of education at all levels, and it boasts a high degree of technological adoption (17th). In addition, the country’s business culture is highly professional and sophisticated (22nd). These three strengths contribute to creating a relatively conducive ecosystem for innovation (19th). However, on this dimension, France trails Germany, the United Kingdom, and the Scandinavian countries by a significant margin.
Estonia remains the best performing country in Eastern Europe and improves by three places to reach 29th overall. The country boasts a solid competitiveness profile with strong, transparent, and efficient institutions (26th); a solid macroeconomic environment (20th); and high levels of education and training (20th). Its labor market is also more efficient than in most countries in the
© 2014 World Economic Forum
1.1: The Global Competitiveness Index 2014–2015
24 | The Global Competitiveness Report 2014–2015
region (11th). To further strengthen its competitiveness, Estonia should focus on strengthening innovation (30th) and business sophistication (48th) in order to ensure that product and process innovation continues to enhance the country’s productivity. Further investment in infrastructure (38th) would also be warranted, as transport infrastructure in particular is not yet up to Western European standards (58th).
Iceland moves up one place to 30th position this year, the result of an improving macroeconomic situation and an easing of financial concerns. Despite its significant difficulties in these areas in recent years, Iceland continues to benefit from a number of clear competitiveness strengths in moving toward a more sustainable economic situation. These include the country’s top-notch education system at all levels, its 10th and 13th ranks in the health and primary education and higher education and training pillars, respectively, coupled with a relatively innovative business sector (27th) that is highly adept at adopting new technologies for productivity enhancements (8th). Business activity is further supported by an efficient labor market (14th) and well-developed infrastructure (23rd).
Spain remains stable at 35th place. The important reform program the country has embarked on has resulted in curbing the high budget deficit of past years, although it remains high (128th); improving the robustness of the financial sector (85th); cutting red tape to foster entrepreneurship (99th); and enhancing flexibility (120th) in the labor market, although much remains to be addressed. However, a weakening in the perceived functioning of institutions, notably with worse scores in terms of corruption (80th) and government efficiency (105th), offsets these improvements in the GCI. Overall, as in past years, Spain continues to benefit from excellent transport infrastructure (6th), high levels of connectivity (18th), and a large share of the population that pursues higher education (8th) who—should the quality of the education system improve (88th)—could provide a skillful labor force able to contribute to the structural change the country requires. Notwithstanding these strengths and improvements in certain areas, Spain continues to suffer from poor access to loans (132nd), a rigid labor market (120th), difficulty in attracting (103rd) and retaining talent (107th), and an insufficient capacity to innovate (60th)—the result of low R&D investments (52nd) and weak university-industry collaborations (57th).
After falling in the rankings for several years, Portugal decisively inverts this trend and climbs 15 positions to reach 36th place. The ambitious reform program the country has adopted seems to have started paying off as gains appear across the board, most notably in areas related to the functioning of the goods market: Portugal now has less red tape to start a business (5th), and its labor market shows
increased flexibility, although more remains to be done (119th). In addition to these improvements, the country can continue to leverage its world-class transport infrastructure (18th) and highly educated labor force (29th). At the same time, Portugal should not be complacent and should continue with a full implementation of its reform program in order to keep addressing some of its persistent macroeconomic concerns (128th) caused by high levels of deficit (107th) and public debt (138th); strengthening its financial sector (104th) so that credit can start flowing (108th); further increasing the flexibility of its labor market; and raising the quality of education (40th) and innovation capacity (37th) to support the economic transformation of the country.
The Czech Republic advances by nine places this year to attain 37th position, improving in half of the pillars and thus reversing a five-year downward trend. Institutions (76th) improve by 10 places, although from very low levels for some indicators, and major concerns remain about corruption and undue influence (with public trust in politicians ranked an extremely low 138th). The country’s economic recovery is also reflected in a sounder macroeconomic environment—the budget deficit fell below the 3 percent mark, leading to a closing of the European Commission’s excessive government procedure—and an improvement in borrowing conditions in the financial market (up to 40th in financial market efficiency). Our data also point to improvements in health and primary education, thanks to a higher primary enrollment rate, as well as gradual improvements in the labor market (62nd), albeit from low levels. More specifically, although cooperation in labor-employer relations and the flexibility of wage determination are perceived more favorably (52nd and 43rd, respectively) than in last year’s edition, regulations are rigid (121st) and the country’s capacity to attract and retain talent remains limited. Likewise, the share of women in the labor force remains comparatively low. Going forward, the Czech Republic needs to explore ways to transition to a knowledge economy in view of its stage of development: compared with other economies at the same stage, technological readiness remains low (36th) and Czech businesses—although doing comparatively well in a regional context—are less sophisticated and innovative than other economies in the European Union. The country’s competitiveness would be further enhanced by improvements to its higher education system, where the Czech Republic, at rank 35, features among the 10 lowest ranked EU economies.
Poland maintains its positioning overall and comes in at 43rd place. The improvements Poland has made in institutions, infrastructure, and education and its increased flexibility in labor market efficiency are steps in the right direction to boost the country’s competitiveness. Continued structural reforms geared
© 2014 World Economic Forum
The Global Competitiveness Report 2014–2015 | 25
1.1: The Global Competitiveness Index 2014–2015
toward strengthening its innovation and knowledge-driven economy will be necessary for Poland to sustain its growth going forward. The country can build on a fairly well educated population, well-developed financial markets, and a market that is by far the largest in the region. Transport infrastructure, however, despite notable improvements, remains weak (78th) by European standards. Some aspects of institutions, such as the burden of its regulations (117th), its rather inefficient legal framework for settling business disputes (118th), and difficulties in obtaining information on government decisions for business (110th) also need to be addressed on a priority basis. And as the country slowly emerges from the economic slowdown of 2012 and 2013, Poland should focus on further improving labor market efficiency and strengthening business sophistication (63rd) as well as on its business sector’s capacity for innovation (72nd). To bolster its innovative capacity, the next set of reforms should focus on reinforcing its innovation ecosystem in close collaboration with the private sector to enable a sustainable growth path for the country.
With a stable score, Italy retains 49th position, despite a deterioration in the functioning of its institutions (106th) and with a poor assessment on government efficiency (143rd), continued macroeconomic concerns that result from the large public debt, and a very rigid labor market (136th) that hinders employment creation. Overall, Italian companies—most notably small and medium-sized enterprises (SMEs)—continue to suffer from weak access to financing (139th) that, coupled with a high tax rate (134th), affects their investment capacity. In addition, as already mentioned, the labor market remains very rigid (136th) and unable to make an efficient use of the country’s talent (130th). The reform program currently being designed, if implemented properly, should help in addressing some of these weaknesses and allow Italy to leverage its competitiveness strengths, which lie in its sophisticated business community (25th) with a good potential to innovate (39th) and its large and diversified market (12th) that should allow for important economies of scale and scope.
The Russian Federation is placed at 53rd position this year with some improvements related to the efficiency of goods markets (in particular domestic competition), ICT use, and business sophistication—although this arguably reflects some positive developments that took place before the Ukraine conflict started. At the time of writing, the Russian economy continues to face many deeply rooted challenges that will have to be addressed for the country to strengthen its competitiveness. Russia’s weak and inefficient institutional framework (97th) remains its Achilles heel and will require a major overhaul in order to eradicate corruption and favoritism (92nd) and re-establish trust in the independence of the judiciary (109th). Diversification of the economy will need reinforcing the very small
SME sector as well as continued progress toward a stronger and more stable financial system (110th). These challenges prevent Russia from taking advantage of its competitiveness strengths, which are based on a well-educated population, fairly high levels of ICT use (47th), and its solid potential for innovation (65th). Going forward, the reverberations of the Ukraine conflict—such as sanctions and potential disruptions to the gas trade—could affect the country’s competitiveness. These implications could be especially serious given the reliance of the education and innovation sectors on public funding, which will become more scarce than it has been in previous years and for accessing technology developed abroad.
Ukraine moves up from 84th to 76th position, arguably reflecting expectations associated with its transition to a new government following the Euromaidan protests. The conflict in the eastern part of the country and in Crimea did not affect the results of the exercise in a substantial way, because it was still localized at the time when the Survey was conducted, yet it will most likely affect the country’s competitiveness going forward. The improvements in the GCI reflect more positive perceptions of institutions and the efficiency of markets. Other improvements reflect better educational outcomes, seen in a higher primary enrollment rate and more ICT use by individuals and business. At the time of writing, restoring peace in Eastern Ukraine is undoubtedly the country’s highest priority. However, far-reaching reforms will be necessary in order to put economic growth on a sustainable footing. These include an overhaul of the institutional framework (130th), along with measures to reduce the dominance of large companies in domestic markets (129th) and to make markets more competitive (125th) and hence more efficient (112th). A strengthening of financial markets would further help stabilize the economy and enable Ukraine to better take advantage of its numerous competitiveness strengths, such as its well-educated population and its market size, which is fairly large in the European context.
The most recent addition to the EU family, Croatia, is the second best performing country in Southeastern Europe at 77th place overall. The country boasts solid infrastructure (44th), especially in roads and electricity, and benefits from relatively high levels of education and training (53rd), although the quality of its education needs to be improved (55th). Companies and individuals use ICTs fairly widely in regional comparison (40th), and the country is open to foreign trade, with low tariffs and well-functioning customs procedures. Going forward, Croatia will need to continue strengthening its institutional framework (87th) and foster the efficiency of its market for goods and services. According to business executives, domestic markets are dominated by few firms and taxation is burdensome, even if low by international comparison. The country will also need to
© 2014 World Economic Forum
1.1: The Global Competitiveness Index 2014–2015
26 | The Global Competitiveness Report 2014–2015
focus on strengthening its macroeconomic environment, which remains burdened by a fairly high budget deficit. As Croatia will move into the innovation-driven stage of development in the coming years, it will need to start putting measures into place that incentivize and enable companies to innovate more. Currently, its businesses’ capacity for innovation is low according to business executives, although research institutes are assessed more favorably (53rd) and the country’s patenting rate is moderately strong (36th).
Following the recovery that started last year, Greece advances 10 spots to reach 81st place. Improvements in the functioning of its goods market (85th) with enhanced levels of competition (71st) and more flexible labor markets (although they remain rather rigid, 117th), along with a better macroeconomic performance with a sharp reduction in the budget deficit, have resulted in this more positive outlook despite its very high levels of government debt. All this suggests that the implemented reforms are starting to pay off. Notwithstanding this better performance, Greece continues to face important challenges that need to be addressed in order to continue improving its competitiveness. More precisely, the functioning of its institutions remains weak and it achieves a poor evaluation for government efficiency (129th), its financial market (130th) has not yet recovered from the recent financial crisis, there are concerns about the soundness of its banks (141st), and access to financing (136th) remains the most problematic factor for doing business in the country. Moreover, in order to support a structural change of the Greek economy so that it can move toward more productive, knowledge-based activities, it will need to boost its innovation capacity (109th). That will require improvements in the quality of its education system (111th) as well as higher investments in knowledge-generating activities, such as R&D (114th).
Asia and the PacificThe competitiveness landscape in the Asia and the Pacific region remains one of stark contrasts. The region is home to three of the 10 most competitive economies in the world: Singapore, Japan, and Hong Kong SAR. A further three economies are featured in the top 20: Taiwan (China), New Zealand, and Malaysia (20th), which is the best ranked of Emerging and Developing Asian nations. At 28th, China stands some 40 places ahead of India, the other regional economic giant. At the other end of the regional spectrum, five countries rank below the 100th mark, although encouragingly they are all progressing to different degrees: Nepal (102nd, up 15 places), Bhutan (103rd, up six), Bangladesh (109th, up one), Myanmar (134th, up five), and Timor-Leste (136th, up two). The competitiveness gap between South Asian and Southeast Asian nations runs deeper than before. The five largest Southeast Asian economies (ASEAN-5)
all feature in the top half of the rankings, and all of them have made strides in this edition: Malaysia gains four places, Thailand is up six, Indonesia four, the Philippines seven, and Vietnam advances two places. Since 2009, they have improved their group performance in every edition. In South Asia, among the region’s six countries covered by the GCI, only India features in the top half of the rankings. Since 2009, the average GCI score of the South Asian Association for Regional Cooperation (SAARC) countries has stagnated.
Because of the region’s diversity, the challenges vary enormously, but a few common priorities can be identified. For the most advanced economies, such as Japan, the Republic of Korea, and Taiwan (China), one common challenge is the rigidity of their labor markets. They must also set up an ecosystem that is better at creating truly disruptive innovations. For countries such as Malaysia, the goal is to transform the economy to become more knowledge-driven in order to avoid the middle-income trap. In China, more reforms and liberalization are needed to improve market efficiency, increase competition, and encourage a more optimal allocation of financial resources. In most emerging Asian economies, common challenges include addressing the huge infrastructure deficit and improving regional connectivity; reducing red tape, which will promote economic formality and entrepreneurship and reduce pervasive and deep-rooted corruption; and improving market efficiency by phasing out distortionary measures. As the region’s poorest economies—such as India and Myanmar—are transitioning away from agriculture and developing a manufacturing base, they will need to create a sound and stable institutional framework for local and foreign investors and improve connectivity.
Taiwan (China) ranks 14th, dropping two places despite maintaining its score. The third of the Asian Tigers, behind Singapore and Hong Kong SAR, its performance has been very stable over the past six years. Notable strengths include its capacity to innovate (10th, down two), its highly efficient goods markets (11th), its world-class infrastructure (11th), and strong higher education (12th). In order to enhance its competitiveness, Taiwan will need to further strengthen its institutional framework (27th), whose quality is undermined by some inefficiency within the government (29th) and various forms of corruption (31st), and will also need to address some inefficiencies and rigidities in its labor market (32nd). As elsewhere in Asia, encouraging and facilitating the participation of women in the workforce (89th) would contribute to enhancing competitiveness.
New Zealand advances one rank to 17th place—its best rank since the introduction of the current GCI methodology. Among the highlights, the country is ranked 1st in the institutions pillar and features in the top 10 of five more pillars. In particular, New Zealand ranks third in the financial market development pillar. It boasts
© 2014 World Economic Forum
The Global Competitiveness Report 2014–2015 | 27
1.1: The Global Competitiveness Index 2014–2015
an excellent education system (9th), while the efficiency of its goods (6th) and labor (6th) markets is among the highest in the world.
Australia (22nd) follows an opposite trend. Since reaching its best rank—15th—in 2009, Australia has been dropping continuously in the rankings. However, although not outstanding, the country’s performance is remarkably consistent across the board. It ranks no lower than 30th in 11 of the 12 pillars of the GCI. It achieves its best rank in the financial market development pillar, advancing one position to 6th place. In particular, the soundness of its banking sector is especially strong (3rd, behind Canada and New Zealand). The country also posts gains in higher education and training, climbing to 11th position. Australia’s macroeconomic situation has deteriorated slightly (30th, down five places), owing mainly to the small increase of the budget deficit. Australia’s public debt-to-GDP ratio, though rising, is the fourth lowest among OECD countries. Overall, the quality of Australia’s public institutions is excellent (22nd) but tarnished by the 124th position it obtains for the extent of red tape. The main area of concern remains the labor market. Australia ranks 136th for the rigidity of its hiring and firing practices and 132nd for the rigidity of its wage setting. Indeed, as part of our Executive Opinion Survey, Australian businesses, year after year, have named the restrictive labor regulations the most problematic factor for doing business in their country by a wide margin.
Continuing its upward trend, Malaysia makes its way into the top 20 for the first time since the current GCI methodology was introduced in 2006. The country remains the highest ranked among the developing Asian economies. Malaysia advances nine positions in the institutions pillar, which largely drives this year’s progress. It ranks no lower than 60th in any of the 12 pillars of the GCI. It ranks an outstanding 4th in the financial market development pillar, which reflects its efforts to position itself as the leading center of global Islamic finance. And it ranks 7th in the efficiency of its goods and services markets and a business-friendly institutional framework (29th). In a region plagued by corruption and red tape, Malaysia stands out as one of the very few countries that have been relatively successful at tackling these two issues, as part of its economic and government transformation programs. The country, for instance, ranks an impressive 4th for the burden of government regulation, although its score differential with the leader in this area, Singapore, remains large. Malaysia ranks a satisfactory 26th in the ethics and corruption component of the Index, but room for improvement remains. Furthermore, Malaysia ranks 11th for the quality of its transport infrastructure, a remarkable feat in this part of the world, where insufficient infrastructure and poor connectivity are major obstacles to development for many countries.
Finally, Malaysia’s private sector is highly sophisticated (15th) and already innovative (21st). All this bodes well for a country that aims to become a high-income, knowledge-based economy by the end of the decade. Amid this largely positive assessment, the government budget deficit, which represented 4.6 percent of GDP in 2013 (102nd); the low level of female participation in the workforce (119th); and the still comparatively low technological readiness (60th) stand out as some of Malaysia’s major competitive challenges.
After exiting the top 20 last year, the Republic of Korea (26th) drops one more position. Its performance remains uneven across the different dimensions of the Index. The country loses further ground in two of the three areas in which historically it has performed poorly. It now ranks 82nd (down eight places) in the institutions pillar and 86th (also down eight) in the labor market efficiency category. Although stable, the financial market development pillar remains a sore point (80th, up one), preventing Korea from closing the competitiveness gap with the three other Asian Tigers. On a brighter note, Korea possesses a remarkably sound macroeconomic environment (7th, second only to Norway among OECD countries). The country also boasts excellent infrastructure (14th), and enrollment rates at all levels of education are among the highest in the world. These factors, combined with the country’s high degree of technological adoption (25th) and relatively strong business sophistication (27th), contribute to explaining its remarkable capacity for innovation (17th).
Up one position, China ranks 28th. The country continues to lead the BRICS economies by a wide margin—well ahead of Russia (53rd), South Africa (56th), Brazil (57th), and India (71st). Small gains in most pillars of the GCI contribute to creating a more conducive ecosystem for entrepreneurship and innovation: higher education and training (65th, up five); business sophistication (43rd, up two); and the technological readiness pillar, which constitutes China’s weakest showing in the GCI, (83rd, up two). Problems endure in the critically important financial sector (54th), the assessment of which is weakened by the relative fragility of the banking industry. Access to loans remains very difficult for a large number of SMEs. The functioning of the market (56th, up five) is also improving, but various limiting measures and barriers to entry, along with investment rules, greatly limit competition. China is becoming more innovative (32nd), but it is not yet an innovation powerhouse. There is very little change in the assessment of the country’s governance structures (47th). Government efficiency is improving (now 31st), but corruption (66th), security concerns (68th, up seven), and low levels of accountability (80th, up two) and lack of transparency (43rd) continue to weaken the institutional framework. The macroeconomic situation remains favorable (10th): inflation is below 3 percent;
© 2014 World Economic Forum
1.1: The Global Competitiveness Index 2014–2015
28 | The Global Competitiveness Report 2014–2015
budget deficit has been reduced; and public debt-to-GDP ratio, at 22.4 percent, is among the lowest in the world. The gross savings rate amounts to a staggering 50 percent of GDP. This rate is probably too high in light of the need for China to rebalance its economy away from investment and toward more consumption. Despite the persistence of bottlenecks, the country also boasts good transport infrastructure and connectivity (21st), thanks to decades of massive investments. Trends are largely positive, but now is not the time for China to be complacent. The country is no longer an inexpensive location for labor-intensive activities and is losing manufacturing jobs to less-developed countries and even to some more advanced economies. China must now create the high-value jobs that will sustain the increasing standards of living.
Despite its prolonged political crisis, Thailand advances six places to 31st position. The country moves up 12 places in the macroeconomic environment pillar and now ranks 19th, its best showing among the 12 pillars. In 2013, Thailand almost balanced its budget and reduced inflation to 2 percent. Public debt remained stable and the savings rate was high. Thailand continues to do well in the financial development (34th) and improves its already strong showing in the market efficiency pillar (30th, up four). However, market competition remains limited by a number of barriers to entry, especially those affecting foreign investments. Considerable challenges remain in other areas: first and foremost these relate to governance. Political and policy instability, excessive red tape, pervasive corruption, security concerns, and high uncertainty around property rights protection seriously undermine the institutional framework (93rd in the public institutions subpillar, down eight). In most of these areas, Thailand ranks below the 100th mark. In particular, the level of trust in politicians is among the lowest in the world (129th). Another concern is the mediocre quality of education at all levels (87th, down nine) and the still low level of technological readiness pillar (65th), although Thailand shows marked improvement in this area (up 13). It must be noted that all the data used in our assessment were collected before the most recent developments—including the military coup of May 2014—took place.
Up four notches to 34th place, Indonesia, Southeast Asia’s largest country, continues its progression in the overall rankings. This improvement in competitiveness will probably contribute to sustaining the country’s impressive momentum—its GDP grew by 5.8 percent annually since 2004—under the new leadership. That said, Indonesia’s overall performance remains uneven. Infrastructure and connectivity continue to improve: up five places from last year and 20 places since 2011, Indonesia now ranks 56th in the related GCI pillar. The quality of public and private governance is strengthening: Indonesia is up 14 places to 53rd
as a result of improvement in 18 of the 21 indicators composing this pillar. In particular, Indonesia ranks a remarkable 36th place for government efficiency. Corruption remains prevalent (87th) but has been receding for several years. The macroeconomic situation deteriorated between 2012 and 2013 on the back of a higher deficit, but remains satisfactory (34th, down eight). The situation of its labor market (110th, down seven) remains by far the weakest aspect, owing to rigidities in terms of wage setting and hiring and firing procedures—for instance, the World Bank estimates that, on average, the cost associated with making a worker redundant is equivalent to 58 weeks of salary (139th). Furthermore, the participation of women in the workforce remains low (112th). Another area of concern is public health (99th). The incidence of communicable diseases and the infant mortality rate are among the highest outside sub-Saharan Africa. Turning to the more sophisticated drivers of competitiveness, Indonesia’s technological readiness is lagging (77th). In particular, the use of ICTs by the population at large remains comparatively low (94th, down 10).
Up seven places, the Philippines (52nd) continues its upward trend. The country’s gain of 33 places since 2010 is the largest over that period among all countries studied. The results suggest that the reforms of the past four years have bolstered the country’s economic fundamentals. The trends across most of the 12 pillars are positive, and in some cases truly remarkable. In the institutions pillar (67th), the Philippines has leapfrogged some 50 places since 2010. In particular, there are signs that the efforts made against corruption have started bearing fruit: in terms of ethics and corruption, the country has moved from 135th in 2010 to 81st this year. The recent success of the government in tackling some of the most pressing structural issues provides evidence that bold reforms can yield positive results relatively quickly. A similar pattern is observed in terms of government efficiency (69th) and the protection of property rights (63rd). Finally, the Philippines has made significant strides in terms of technological adoption (69th, up eight). The country is one of the best digitally connected developing Asian nations, close behind Malaysia (60th) and Thailand (65th). The same cannot be said of infrastructure, however, which remains poor (91st), especially with respect to airport (108th) and seaport (101st) infrastructure. The situation is just as worrisome in the labor market, which suffers from rigidities and inefficiencies: the Philippines ranks a mediocre 91st in this dimension and almost no progress has been made since 2010. Finally, security remains an issue (89th), in particular in terms of costs that the threat of terrorism imposes on businesses (110th).
Continuing on its downward trend and losing 11 places, India ranks 71st. The country’s new government faces the challenge of improving competitiveness and
© 2014 World Economic Forum
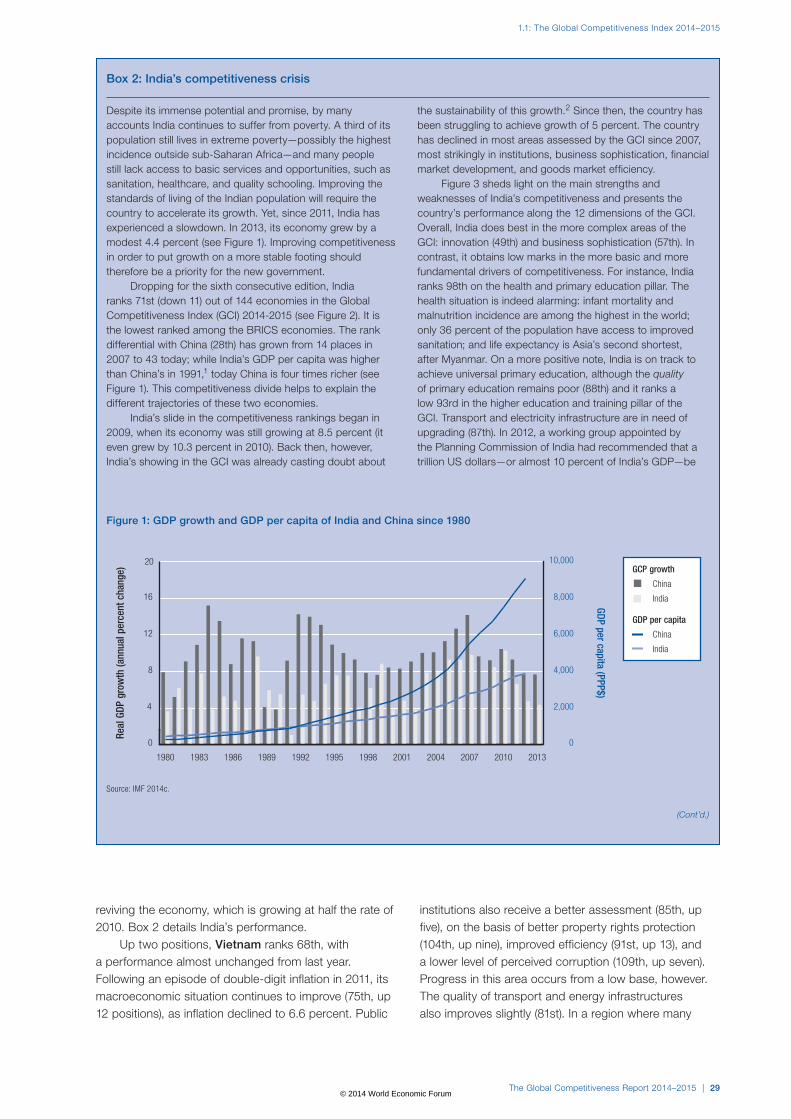
The Global Competitiveness Report 2014–2015 | 29
1.1: The Global Competitiveness Index 2014–2015
reviving the economy, which is growing at half the rate of 2010. Box 2 details India’s performance.
Up two positions, Vietnam ranks 68th, with a performance almost unchanged from last year. Following an episode of double-digit inflation in 2011, its macroeconomic situation continues to improve (75th, up 12 positions), as inflation declined to 6.6 percent. Public
institutions also receive a better assessment (85th, up five), on the basis of better property rights protection (104th, up nine), improved efficiency (91st, up 13), and a lower level of perceived corruption (109th, up seven). Progress in this area occurs from a low base, however. The quality of transport and energy infrastructures also improves slightly (81st). In a region where many
Box 2: India’s competitiveness crisis
Despite its immense potential and promise, by many accounts India continues to suffer from poverty. A third of its population still lives in extreme poverty—possibly the highest incidence outside sub-Saharan Africa—and many people still lack access to basic services and opportunities, such as sanitation, healthcare, and quality schooling. Improving the standards of living of the Indian population will require the country to accelerate its growth. Yet, since 2011, India has experienced a slowdown. In 2013, its economy grew by a modest 4.4 percent (see Figure 1). Improving competitiveness in order to put growth on a more stable footing should therefore be a priority for the new government.
Dropping for the sixth consecutive edition, India ranks 71st (down 11) out of 144 economies in the Global Competitiveness Index (GCI) 2014-2015 (see Figure 2). It is the lowest ranked among the BRICS economies. The rank differential with China (28th) has grown from 14 places in 2007 to 43 today; while India’s GDP per capita was higher than China’s in 1991,1 today China is four times richer (see Figure 1). This competitiveness divide helps to explain the different trajectories of these two economies.
India’s slide in the competitiveness rankings began in 2009, when its economy was still growing at 8.5 percent (it even grew by 10.3 percent in 2010). Back then, however, India’s showing in the GCI was already casting doubt about
the sustainability of this growth.2 Since then, the country has been struggling to achieve growth of 5 percent. The country has declined in most areas assessed by the GCI since 2007, most strikingly in institutions, business sophistication, financial market development, and goods market efficiency.
Figure 3 sheds light on the main strengths and weaknesses of India’s competitiveness and presents the country’s performance along the 12 dimensions of the GCI. Overall, India does best in the more complex areas of the GCI: innovation (49th) and business sophistication (57th). In contrast, it obtains low marks in the more basic and more fundamental drivers of competitiveness. For instance, India ranks 98th on the health and primary education pillar. The health situation is indeed alarming: infant mortality and malnutrition incidence are among the highest in the world; only 36 percent of the population have access to improved sanitation; and life expectancy is Asia’s second shortest, after Myanmar. On a more positive note, India is on track to achieve universal primary education, although the quality of primary education remains poor (88th) and it ranks a low 93rd in the higher education and training pillar of the GCI. Transport and electricity infrastructure are in need of upgrading (87th). In 2012, a working group appointed by the Planning Commission of India had recommended that a trillion US dollars—or almost 10 percent of India’s GDP—be
(Cont’d.)
Figure 1: GDP growth and GDP per capita of India and China since 1980
Source: IMF 2014c.
0
4
8
12
16
20
0
2,000
4,000
6,000
8,000
10,000
201320102007200420011998199519921989198619831980
Real
GDP
gro
wth
(ann
ual p
erce
nt c
hang
e)
GDP per capita (PPP$)
GCP growth
China
India
GDP per capita
China
India
© 2014 World Economic Forum
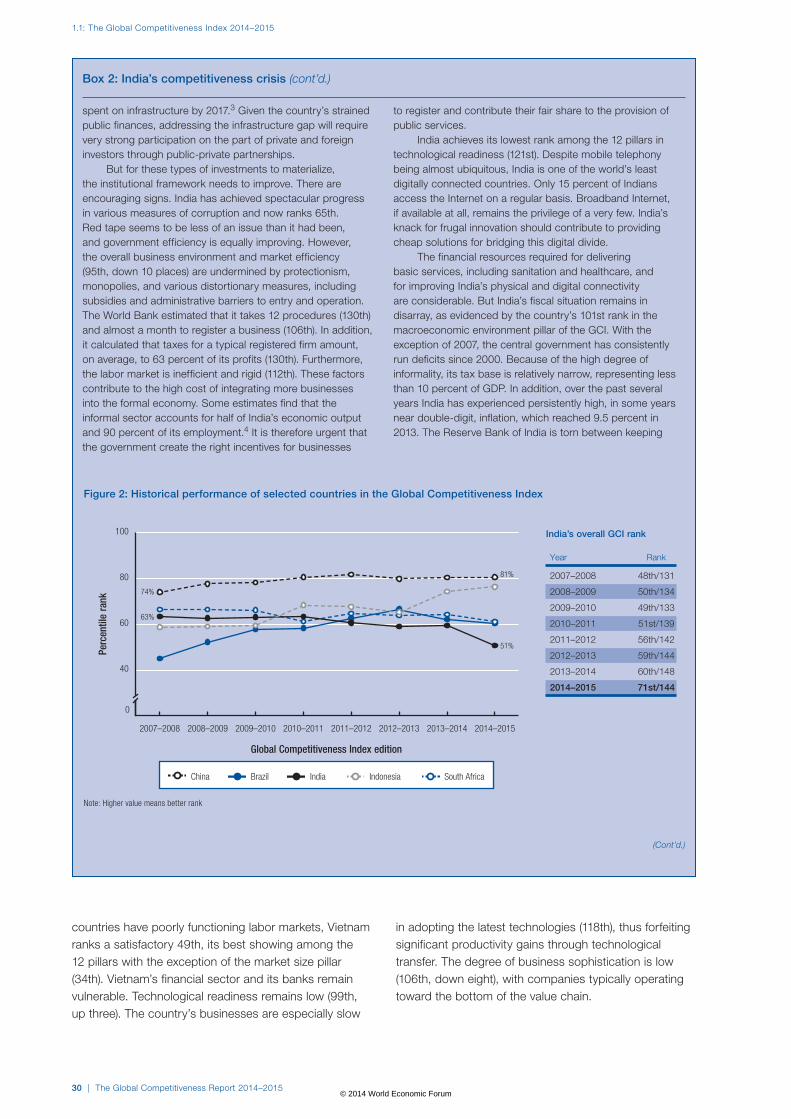
1.1: The Global Competitiveness Index 2014–2015
30 | The Global Competitiveness Report 2014–2015
(Cont’d.)
Box 2: India’s competitiveness crisis (cont’d.)
spent on infrastructure by 2017.3 Given the country’s strained public finances, addressing the infrastructure gap will require very strong participation on the part of private and foreign investors through public-private partnerships.
But for these types of investments to materialize, the institutional framework needs to improve. There are encouraging signs. India has achieved spectacular progress in various measures of corruption and now ranks 65th. Red tape seems to be less of an issue than it had been, and government efficiency is equally improving. However, the overall business environment and market efficiency (95th, down 10 places) are undermined by protectionism, monopolies, and various distortionary measures, including subsidies and administrative barriers to entry and operation. The World Bank estimated that it takes 12 procedures (130th) and almost a month to register a business (106th). In addition, it calculated that taxes for a typical registered firm amount, on average, to 63 percent of its profits (130th). Furthermore, the labor market is inefficient and rigid (112th). These factors contribute to the high cost of integrating more businesses into the formal economy. Some estimates find that the informal sector accounts for half of India’s economic output and 90 percent of its employment.4 It is therefore urgent that the government create the right incentives for businesses
to register and contribute their fair share to the provision of public services.
India achieves its lowest rank among the 12 pillars in technological readiness (121st). Despite mobile telephony being almost ubiquitous, India is one of the world’s least digitally connected countries. Only 15 percent of Indians access the Internet on a regular basis. Broadband Internet, if available at all, remains the privilege of a very few. India’s knack for frugal innovation should contribute to providing cheap solutions for bridging this digital divide.
The financial resources required for delivering basic services, including sanitation and healthcare, and for improving India’s physical and digital connectivity are considerable. But India’s fiscal situation remains in disarray, as evidenced by the country’s 101st rank in the macroeconomic environment pillar of the GCI. With the exception of 2007, the central government has consistently run deficits since 2000. Because of the high degree of informality, its tax base is relatively narrow, representing less than 10 percent of GDP. In addition, over the past several years India has experienced persistently high, in some years near double-digit, inflation, which reached 9.5 percent in 2013. The Reserve Bank of India is torn between keeping
Figure 2: Historical performance of selected countries in the Global Competitiveness Index
Note: Higher value means better rank
0
40
60
80
74%
63%
81%
51%
100
2014–20152013–20142012–20132011–20122010–20112009–20102008–20092007–2008
Perc
entil
e ra
nk
China Brazil India Indonesia South Africa
Global Competitiveness Index edition
India’s overall GCI rank
Year Rank
2007–2008 48th/131
2008–2009 50th/134
2009–2010 49th/133
2010–2011 51st/139
2011–2012 56th/142
2012–2013 59th/144
2013–2014 60th/148
2014–2015 71st/144
countries have poorly functioning labor markets, Vietnam ranks a satisfactory 49th, its best showing among the 12 pillars with the exception of the market size pillar (34th). Vietnam’s financial sector and its banks remain vulnerable. Technological readiness remains low (99th, up three). The country’s businesses are especially slow
in adopting the latest technologies (118th), thus forfeiting significant productivity gains through technological transfer. The degree of business sophistication is low (106th, down eight), with companies typically operating toward the bottom of the value chain.
© 2014 World Economic Forum
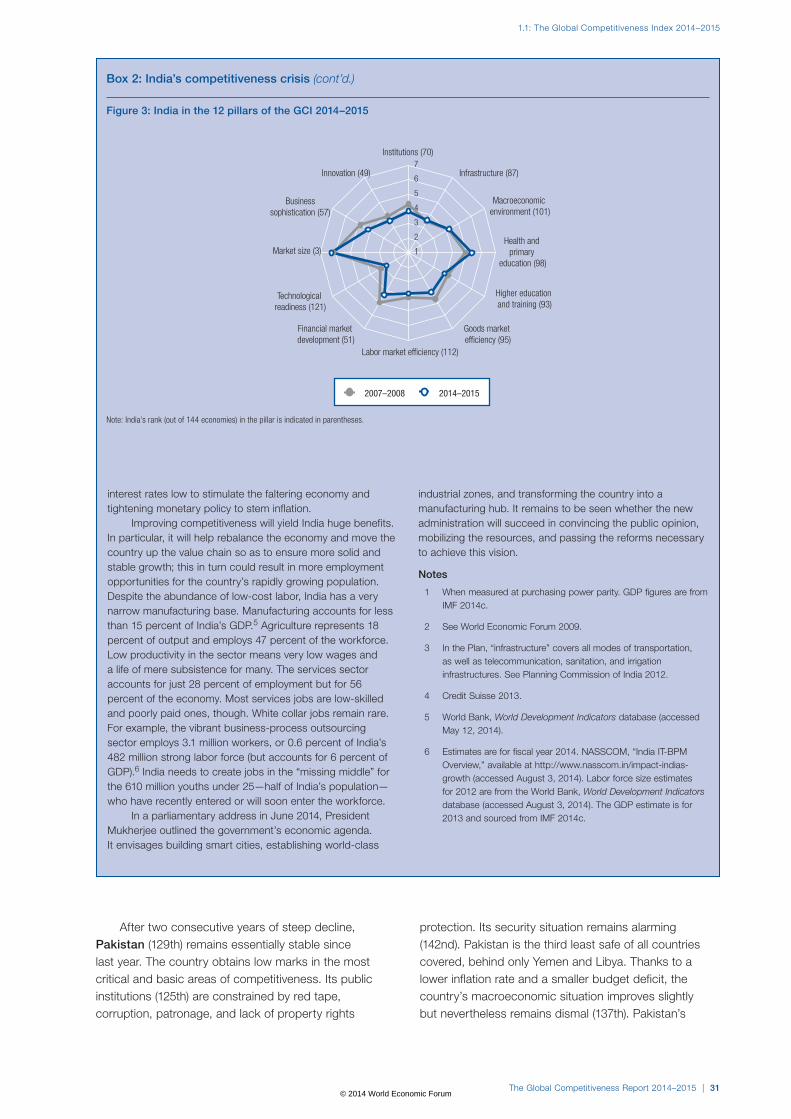
The Global Competitiveness Report 2014–2015 | 31
1.1: The Global Competitiveness Index 2014–2015
After two consecutive years of steep decline, Pakistan (129th) remains essentially stable since last year. The country obtains low marks in the most critical and basic areas of competitiveness. Its public institutions (125th) are constrained by red tape, corruption, patronage, and lack of property rights
protection. Its security situation remains alarming (142nd). Pakistan is the third least safe of all countries covered, behind only Yemen and Libya. Thanks to a lower inflation rate and a smaller budget deficit, the country’s macroeconomic situation improves slightly but nevertheless remains dismal (137th). Pakistan’s
Box 2: India’s competitiveness crisis (cont’d.)
Note: India’s rank (out of 144 economies) in the pillar is indicated in parentheses.
Figure 3: India in the 12 pillars of the GCI 2014–2015
Institutions (70)
Infrastructure (87)
Macroeconomic environment (101)
Health and primary
education (98)
Higher education and training (93)
Goods market efficiency (95)
Labor market efficiency (112)
Financial market development (51)
Technological readiness (121)
Market size (3)
Business sophistication (57)
Innovation (49)
1
2
3
4
5
6
7
2007–2008 2014–2015
interest rates low to stimulate the faltering economy and tightening monetary policy to stem inflation.
Improving competitiveness will yield India huge benefits. In particular, it will help rebalance the economy and move the country up the value chain so as to ensure more solid and stable growth; this in turn could result in more employment opportunities for the country’s rapidly growing population. Despite the abundance of low-cost labor, India has a very narrow manufacturing base. Manufacturing accounts for less than 15 percent of India’s GDP.5 Agriculture represents 18 percent of output and employs 47 percent of the workforce. Low productivity in the sector means very low wages and a life of mere subsistence for many. The services sector accounts for just 28 percent of employment but for 56 percent of the economy. Most services jobs are low-skilled and poorly paid ones, though. White collar jobs remain rare. For example, the vibrant business-process outsourcing sector employs 3.1 million workers, or 0.6 percent of India’s 482 million strong labor force (but accounts for 6 percent of GDP).6 India needs to create jobs in the “missing middle” for the 610 million youths under 25—half of India’s population—who have recently entered or will soon enter the workforce.
In a parliamentary address in June 2014, President Mukherjee outlined the government’s economic agenda. It envisages building smart cities, establishing world-class
industrial zones, and transforming the country into a manufacturing hub. It remains to be seen whether the new administration will succeed in convincing the public opinion, mobilizing the resources, and passing the reforms necessary to achieve this vision.
Notes
1 When measured at purchasing power parity. GDP figures are from IMF 2014c.
2 See World Economic Forum 2009.
3 In the Plan, “infrastructure” covers all modes of transportation, as well as telecommunication, sanitation, and irrigation infrastructures. See Planning Commission of India 2012.
4 Credit Suisse 2013.
5 World Bank, World Development Indicators database (accessed May 12, 2014).
6 Estimates are for fiscal year 2014. NASSCOM, “India IT-BPM Overview,” available at http://www.nasscom.in/impact-indias-growth (accessed August 3, 2014). Labor force size estimates for 2012 are from the World Bank, World Development Indicators database (accessed August 3, 2014). The GDP estimate is for 2013 and sourced from IMF 2014c.
© 2014 World Economic Forum
1.1: The Global Competitiveness Index 2014–2015
32 | The Global Competitiveness Report 2014–2015
infrastructure (119th)—particularly for electricity (133rd)—is underdeveloped. Moreover, the country’s performance in terms of health and education is among the worst of all the countries covered. Infant mortality (137th) is the highest outside sub-Saharan Africa, and, with one of the lowest enrollment rates in the world (132nd), it is estimated that almost a quarter of children do not go to primary school. Pakistan’s competitiveness is further penalized by the many rigidities and inefficiencies of its labor market (132nd, up six). Female participation in the labor force is the world’s fifth lowest (140th). Finally, the potential of ICTs is not sufficiently leveraged, and access to ICTs remains low (114th). On a slightly more positive note, Pakistan does comparatively better in the more advanced areas captured by the GCI, ranking 72nd in the financial development pillar and 81st on the business sophistication pillar.
Covered for the first time last year, Myanmar advances five places and ranks 134th. After decades of political and economic isolation, the country is going through profound changes. Its government has embarked on an ambitious process of reforms to improve the country’s economic landscape and prospects, notably by leveraging Myanmar’s extraordinary assets. These include an abundance of natural resources, very favorable demographics, and a strategic location in the heart of Asia. Competitiveness is at the core of this strategy. However, Myanmar’s challenges are many and the road to prosperity will be a challenging one. The country ranks beyond the 100th rank in 10 out of the 12 pillars of the GCI, but has improved in 11 of them over the past year.
Latin America and the CaribbeanThe economic deceleration that started in 2012 continued in 2013, with an estimated growth rate for the region below 3 percent. For 2014, growth forecasts are not more optimistic and, according to the IMF,24 the region is poised to grow at only 2.5 percent, below the trend of recent years. Overall, the region continues to suffer from strong headwinds related to weak investments, a fall in exports and commodity prices, and tighter access to finance that, to a large extent, fueled growth in recent years.
Building the economic resilience of the region will depend on its capacity to strengthen the fundamentals of its economy by boosting its level of competitiveness. However, regional productivity continues to be low and trailing other emerging or advanced economies. A lack of sufficient investments in growth-enhancing areas, such as infrastructure, skills development, and innovation, coupled with insufficient and delayed reforms needed to improve business conditions and the allocation of resources, result in a certain inability of the local economies of the region to move toward
more productive sectors and thus, higher levels of competitiveness.
The need to boost competitiveness by undertaking the necessary investments and by fully and efficiently implementing structural reforms has become not only important but also urgent if the region is to be able to consolidate the economic and social gains that many countries have experienced in past years. Becoming more resilient and less affected by external fluctuations will depend on this.
Chile, at 33rd, regains the position it lost last year and remains the most competitive economy in Latin America, with a very stable profile. The country continues to build up its traditional assets, which are related to a strong institutional setup (28th) with low levels of corruption (25th) and an efficient government (21st); solid macroeconomic stability (22nd) with low levels of both public deficit and public debt; and efficient markets, despite some rigidities in its labor market that result from its persistent high redundancy costs (120th). Notwithstanding these strengths, the current economic context—with its potentially strong headwinds that result from the decline in the price of minerals—highlights the need for Chile to diversify its economy by moving toward more knowledge-based activities. In this context, the country still needs to make major efforts to address some of its traditional weaknesses. Important flaws in the country’s education system, notably in terms of its quality (71st)—especially in math and science (99th)—do not provide companies with a workforce that has the necessary skills to upgrade their production or embark on innovative projects; this is regarded as one of the country’s most problematic factors for doing business. This difficulty—together with low innovation investment, especially in the private sector (77th)—results in a poor innovation capacity overall (76th), which could jeopardize Chile’s necessary transition toward a knowledge-based economy.
Panama continues to follow Chile in the regional rankings and once again scores as the most competitive economy in Central America; it is among the top 50 in the world, despite a fall of eight places to 48th position. This drop is driven by a slight deterioration in the perceived functioning of institutions (74th), most notably in terms of their inability to fight corruption (94th) and raise government efficiency (55th); and the poor quality of the education system (83rd) with its inability to provide the right set of skills for an economy that increasingly needs a skilled labor force to sustain the sharp economic growth of past years. This skills shortage is perceived as one of the most problematic factors for doing business in the country, and is likely to remain a severe obstacle to business in the coming years, representing a bottleneck for Panama’s transition toward more knowledge-intensive activities. Notwithstanding these challenges to the economic agenda of the country going forward, Panama
© 2014 World Economic Forum
The Global Competitiveness Report 2014–2015 | 33
1.1: The Global Competitiveness Index 2014–2015
continues to benefit from important competitiveness strengths. As it did last year, Panama boasts impressive infrastructure (40th), with some of the best port (7th) and airport (7th) facilities not only in Latin America but in the world, positioning it as a strong transport hub for the region. Its financial market (22nd) and an assessment of its technological adoption (23rd), especially via foreign multinational corporations setting up in the country, remain strong, and its mobile broadband subscriptions (73rd) are increasing.
As in recent editions, Costa Rica continues to rise in the rankings, improving three positions to take 51st place. Overall, the country depicts a very stable profile, building on its traditional assets, although it does suffer from some persistent weaknesses. In terms of strengths, Costa Rica is fairly well poised to engage in a rapid transition toward more knowledge-based activities. The country boasts one of the best education systems in the region (21st); a fairly high ICT uptake (45th) with a high international Internet bandwidth capacity (36th) and many mobile broadband subscriptions (20th); and a fairly well developed capacity to innovate (36th) and solid access to technology (39th), thanks to the crucial role that FDI and technology transfer (5th) plays in the country. In addition, Costa Rica benefits from fairly strong institutions (46th), despite a strong sense that government spending may not always be directed toward the most productive activities (120th). Notwithstanding these important strengths, the country’s persistent weaknesses hold back its competitiveness. More precisely, its poor transport infrastructure (108th), difficulty in accessing finance either through equity (117th) or loans (118th), and some concerns about its macroeconomic performance and high budget deficit (116th) are all areas the country should address.
Still suffering some of the consequences of the global financial crisis, Barbados falls eight positions in the rankings to 55th place. As in the past, this drop is driven by the persistence of the credit crunch that is regarded as the most problematic factor for doing business in the country and that is severely hindering the capacity of local businesses to finance their activities by raising new equity (91st), loans (101st), or venture capital (101st) to support innovative projects. In addition, concerns about macroeconomic conditions (132nd) persist, as Barbados boasts one of the highest public deficits (140th) in the world, one of the lowest savings rates (136th), and public debt (128th) that is quickly approaching 100 percent of the national GDP. The need to stabilize its macroeconomic outlook and ease the flow of financing toward productive investments will be crucial to allow the country to recover the ground lost since the beginning of the crisis. On a more positive note, Barbados continues to benefit from a fairly skilled labor force thanks to a high-quality education system (15th) and high enrollment rates in secondary (19th) and
tertiary education (42nd); well-functioning institutions (33rd), despite some concern about the government efficiency in managing public spending (57th); and solid infrastructure (28th).
Brazil drops one position and ranks 57th this year. This decline is driven by insufficient progress in addressing its persistent transport infrastructure weaknesses (77th) and a perceived deterioration in the functioning of its institutions (104th), with increased concerns about government efficiency (131st) and corruption (130th). Brazil also exhibits a weaker macroeconomic performance this year (85th), a further tightening of access to financing, and a poor education system (126th) that fails to provide workers with the necessary set of skills for an economy in transition toward more knowledge-based activities. Addressing these weaknesses, for Brazil as for other BRICS economies, will require implementing reforms and engaging in productive investments (see Box 3). This approach is not only important but has become urgent for reinforcing Brazil’s resilience. The country is poised to face strong headwinds related to recent shifts in the global economy, with a drop in the international price of commodities and potential outflows of capital that had come into the country from some advanced economies during the height of the financial crisis. Notwithstanding these challenges, Brazil still benefits from important strengths, especially its large market size and its fairly sophisticated business community (47th), with pockets of innovation excellence (44th) in many research-driven, high-value-added activities.
In spite of the drop of six places, Mexico (61st) has adopted important structural reforms in the past year. This fall in the rankings is driven by a deterioration in the perceived functioning of institutions (102nd); the quality of an education system that does not seem to deliver on the skill set that a changing Mexican economy requires; and its low level of ICT uptake (88th), which is crucial for this transformation. In addition, the results show that the benefits of the many adopted reforms intended to increase the level of competition and efficiency in the functioning of Mexico’s markets have not yet materialized, highlighting the need for effective implementation that should not be delayed. Recently some changes have been observed, notably in the telecommunications market. As more of these results start to become evident, the country will increase its competitiveness edge. In this process of improvement, Mexico can continue counting on its traditional strengths: its relatively stable macroeconomic environment (53rd), its large and deep internal market that allows for important economies of scale (10th), reasonably good transport infrastructure (41st), and a number of sophisticated businesses (58th), which is uncommon for a country at its stage of development.
© 2014 World Economic Forum
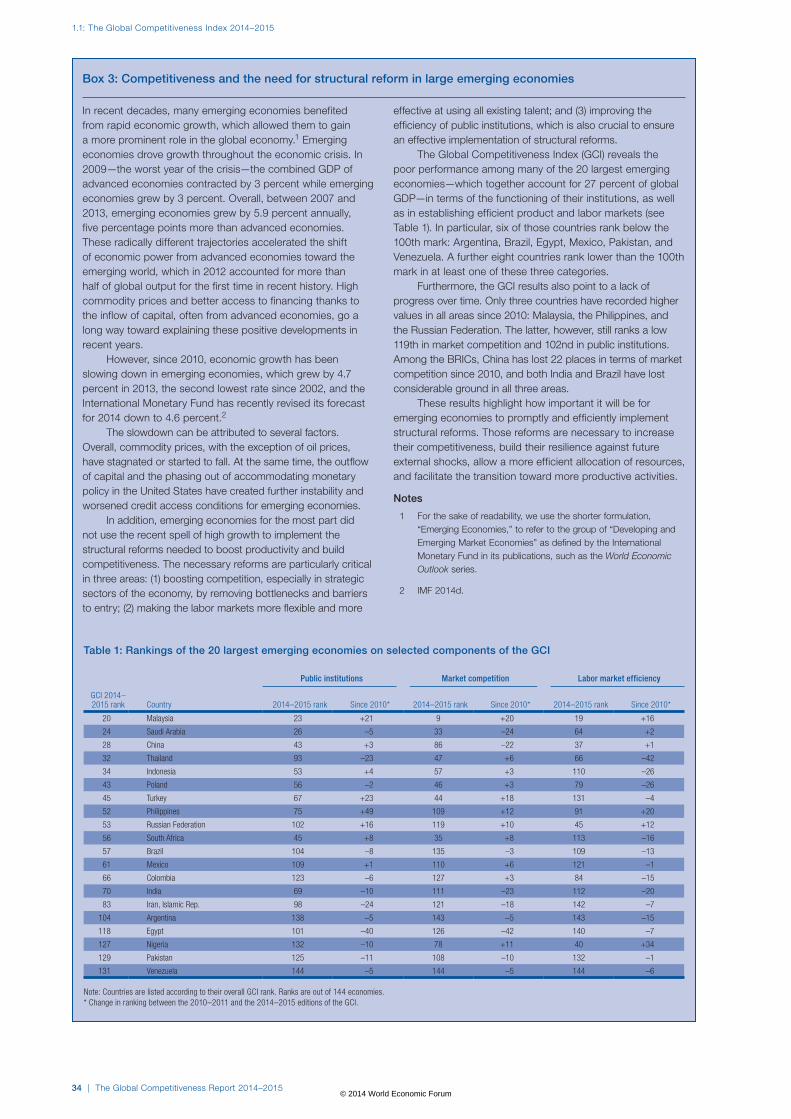
1.1: The Global Competitiveness Index 2014–2015
34 | The Global Competitiveness Report 2014–2015
Box 3: Competitiveness and the need for structural reform in large emerging economies
In recent decades, many emerging economies benefited from rapid economic growth, which allowed them to gain a more prominent role in the global economy.1 Emerging economies drove growth throughout the economic crisis. In 2009—the worst year of the crisis—the combined GDP of advanced economies contracted by 3 percent while emerging economies grew by 3 percent. Overall, between 2007 and 2013, emerging economies grew by 5.9 percent annually, five percentage points more than advanced economies. These radically different trajectories accelerated the shift of economic power from advanced economies toward the emerging world, which in 2012 accounted for more than half of global output for the first time in recent history. High commodity prices and better access to financing thanks to the inflow of capital, often from advanced economies, go a long way toward explaining these positive developments in recent years.
However, since 2010, economic growth has been slowing down in emerging economies, which grew by 4.7 percent in 2013, the second lowest rate since 2002, and the International Monetary Fund has recently revised its forecast for 2014 down to 4.6 percent.2
The slowdown can be attributed to several factors. Overall, commodity prices, with the exception of oil prices, have stagnated or started to fall. At the same time, the outflow of capital and the phasing out of accommodating monetary policy in the United States have created further instability and worsened credit access conditions for emerging economies.
In addition, emerging economies for the most part did not use the recent spell of high growth to implement the structural reforms needed to boost productivity and build competitiveness. The necessary reforms are particularly critical in three areas: (1) boosting competition, especially in strategic sectors of the economy, by removing bottlenecks and barriers to entry; (2) making the labor markets more flexible and more
effective at using all existing talent; and (3) improving the efficiency of public institutions, which is also crucial to ensure an effective implementation of structural reforms.
The Global Competitiveness Index (GCI) reveals the poor performance among many of the 20 largest emerging economies—which together account for 27 percent of global GDP—in terms of the functioning of their institutions, as well as in establishing efficient product and labor markets (see Table 1). In particular, six of those countries rank below the 100th mark: Argentina, Brazil, Egypt, Mexico, Pakistan, and Venezuela. A further eight countries rank lower than the 100th mark in at least one of these three categories.
Furthermore, the GCI results also point to a lack of progress over time. Only three countries have recorded higher values in all areas since 2010: Malaysia, the Philippines, and the Russian Federation. The latter, however, still ranks a low 119th in market competition and 102nd in public institutions. Among the BRICs, China has lost 22 places in terms of market competition since 2010, and both India and Brazil have lost considerable ground in all three areas.
These results highlight how important it will be for emerging economies to promptly and efficiently implement structural reforms. Those reforms are necessary to increase their competitiveness, build their resilience against future external shocks, allow a more efficient allocation of resources, and facilitate the transition toward more productive activities.
Notes
1 For the sake of readability, we use the shorter formulation, “Emerging Economies,” to refer to the group of “Developing and Emerging Market Economies” as defined by the International Monetary Fund in its publications, such as the World Economic Outlook series.
2 IMF 2014d.
Table 1: Rankings of the 20 largest emerging economies on selected components of the GCI
Public institutions Market competition Labor market efficiency
GCI 2014– 2015 rank Country 2014–2015 rank Since 2010* 2014–2015 rank Since 2010* 2014–2015 rank Since 2010*
20 Malaysia 23 +21 9 +20 19 +16
24 Saudi Arabia 26 –5 33 –24 64 +2
28 China 43 +3 86 –22 37 +1
32 Thailand 93 –23 47 +6 66 –42
34 Indonesia 53 +4 57 +3 110 –26
43 Poland 56 –2 46 +3 79 –26
45 Turkey 67 +23 44 +18 131 –4
52 Philippines 75 +49 109 +12 91 +20
53 Russian Federation 102 +16 119 +10 45 +12
56 South Africa 45 +8 35 +8 113 –16
57 Brazil 104 –8 135 –3 109 –13
61 Mexico 109 +1 110 +6 121 –1
66 Colombia 123 –6 127 +3 84 –15
70 India 69 –10 111 –23 112 –20
83 Iran, Islamic Rep. 98 –24 121 –18 142 –7
104 Argentina 138 –5 143 –5 143 –15
118 Egypt 101 –40 126 –42 140 –7
127 Nigeria 132 –10 78 +11 40 +34
129 Pakistan 125 –11 108 –10 132 –1
131 Venezuela 144 –5 144 –5 144 –6
Note: Countries are listed according to their overall GCI rank. Ranks are out of 144 economies.* Change in ranking between the 2010–2011 and the 2014–2015 editions of the GCI.
© 2014 World Economic Forum
The Global Competitiveness Report 2014–2015 | 35
1.1: The Global Competitiveness Index 2014–2015
Despite Peru’s drop of four positions to 65th place, the country continues to be positioned within the top half of the rankings. Concerns about the functioning of its institutions (118th), along with insufficient progress in improving the quality of its education (134th) and technological adoption (92nd), explain this decline, supporting the idea, highlighted last year, of a certain exhaustion of the sources of the country’s competitiveness gains of the past years. Among these gains are a very strong macroeconomic performance (21st) and high levels of efficiency in its goods (53rd), financial (40th), and labor (51st) markets, despite rigidity in hiring and firing practices (130th). Although Peru has recently benefited from strong growth thanks to the rise in the price of minerals, the country should build its resilience by addressing its most long-lasting challenges: it needs to strengthen its public institutions (127th) by increasing government efficiency (116th), fighting corruption (103th), and improving infrastructure (88th). In addition, building up Peru’s capacity to generate and use knowledge and thus diversify its economy toward more productive activities will require raising the quality of education (134th), which is now not capable of providing the skills needed for a changing economy; to boost technology adoption (92nd), including a broader uptake and use of ICTs (101st); and to raise its innovation capacity (117th), which remains low. These actions will require time to develop and bear fruit.
Colombia climbs three positions to reach 66th place. It continues to depict a fairly stable competitiveness profile with results similar to those of previous editions across most dimensions, with two notable exceptions that account for this year’s improved performance. The first is the country’s level of technological adoption (68th), most notably of ICTs (66th). The second is the development of its infrastructure (84th), which remains, nevertheless, the second most problematic factor for doing business in Colombia, after the high level of corruption (123rd). Overall, the country benefits from stable macroeconomic conditions (29th) with a manageable fiscal deficit, low levels of public debt, and inflation that is under control at around 2 percent; financial services that are relatively sophisticated by regional standards (53rd); a large market (32nd); and fairly high levels of education enrollment both at secondary (62nd) and tertiary level (61st), especially when compared with those of other countries in the region. On a less positive note, Colombia continues to suffer from weak institutions (111th) and, as already mentioned, significant levels of corruption (123rd). Despite its improvement, the quality of transport infrastructure is still low (108th). Finally, as is the case for many other countries in the region, Colombia will have to diversify its economy and become less dependent on revenue from mineral resources. In this transformation, the country will need to improve the quality of its
education system (90th), which continues to drop, especially in areas such as mathematics and science (109th); it will also need to build a more robust innovation ecosystem (77th), which will require not only more and better public investment but also a decisive recognition on the part of Colombian firms of the need to innovate by undertaking the right set of investments in areas such as R&D (84th) as well as on-the-job training schemes (73rd) and ICT adoption.
Climbing eight places and establishing itself in the middle range of the rankings this year, Guatemala is positioned at 78th place, following Panama and Costa Rica in the Central American rankings. The country’s rise is led by improvements in its level of competition in the goods market (54th) thanks to the reduction of red tape for new businesses and better infrastructure (67th), although these remain a challenge. Within Central America, El Salvador (84th) continues its ascent, climbing 13 ranks; as does Honduras (100th), which rises 11 positions, while Nicaragua remains stable at 99th position.
In South America, besides Chile and Brazil, the situation remains relatively stable and in need of important changes to improve competitiveness. Uruguay (80th) manages to improve its performance, while Bolivia (105th) loses seven places, unable to consolidate last year’s gain. Paraguay falls one place to 120th position; Argentina (104th) remains stable; and Venezuela (131st) closes the regional rankings, ahead of only Haiti (137th).
Argentina (104th), after several years of falling in the rankings, this year remains stable, albeit at a very low position. One of Argentina’s major concerns is to build its economic resilience in a rapidly changing global economic context characterized by lower commodity prices that can drastically affect the Argentine economy. Overall, the country continues to face adverse macroeconomic conditions (102nd) that affect its access to credit (134th). It also suffers from a weak institutional set up (137th), scoring poorly in terms of corruption (139th), government inefficiency (142nd), and government favoritism (143rd). In addition, inefficiently functioning goods (141st), labor (143rd), and financial (129th) markets continue to hinder the country’s potential, which is enormous thanks to a relatively large market size (24th) with the potential for important economies of scale and scope, its digital readiness (61st), and its high university enrollment (15th) of more than 78 percent. These assets are not being fully utilized amid the negative framework conditions that hamper the potential of the Argentine economy.
Venezuela (131st) continues to be immersed in a deep macroeconomic (139th) and institutional (144th)
crisis. A very unstable macroeconomic environment with high levels of inflation, public debt, and deficit coupled with a weak institutional set up, high levels of corruption,
© 2014 World Economic Forum
1.1: The Global Competitiveness Index 2014–2015
36 | The Global Competitiveness Report 2014–2015
and an inefficient government as well as malfunctioning markets that do not allocate resources effectively result in this poor performance. These deficiencies hinder the country’s capacity to leverage some important assets, such as its relatively well educated population, with a high percentage of the population enrolled in tertiary education (16th), and relatively good ICT penetration with more than half of the population using the Internet (60th).
The Middle East and North AfricaLarge parts of the Middle East and North African region continue to be affected by geopolitical conflict and turbulence. Yet the emphasis has shifted. Some North African economies, such as Egypt and Tunisia, are slowly stabilizing and are starting to focus on economic reform. Structural reforms and improvements to business environments will help restore the still-shaken investor confidence in countries in transition in the region. Other economies, such as Libya and Lebanon, remain affected by conflict or unrest within their own borders or in neighboring countries. At the same time, some small, energy-rich economies continue to perform well in the rankings, building on their resource-driven wealth to undertake structural reforms and invest in competitiveness-enhancing measures. These endeavors will help drive private-sector employment that, in turn, is necessary to provide sufficient numbers of gainful and sustainable jobs for the countries’ populations.
The United Arab Emirates takes the lead in the region, moving up to 12th position this year. To some extent this overall ranking improvement is technical and due to the fact that data on tertiary enrollment are no longer available. At the same time, the country’s successful bid for Expo 2020 and its strong drive toward reforms have anchored many initiatives to enhance competitiveness. These efforts are paying off: its institutional framework, infrastructure, macroeconomic stability, and ICT use have all improved. Overall, the country’s competitiveness reflects the high quality of its infrastructure, where it ranks an excellent 3rd, as well as its highly efficient goods markets (3rd). A strong macroeconomic environment (5th) and some positive aspects of the country’s institutions—such as strong public trust in politicians (3rd) and high government efficiency (5th)—round out the list of competitive advantages. Going forward, putting the country on a more stable development path will require further investment to boost health and educational outcomes (38th on the health and primary education pillar). Raising the bar with respect to education will require not only measures to improve the quality of teaching and the relevance of curricula, but also measures to provide stronger incentives for the population to attend schools at the primary and secondary levels. Last but not least, further promoting the use of ICTs and a stronger focus on R&D and business innovation will be necessary to
diversify the economy and ensure that economic growth is sustainable going into the future.
Qatar falls three places to 16th position. Although the country benefits from high levels of macroeconomic stability and efficient goods and financial markets, as well as high levels of physical security, it will have to step up its efforts to improve a number of areas in order to achieve a more diversified economy. Improving educational outcomes, especially participation in primary and tertiary education; fostering the use of ICTs; and further opening the country up to foreign trade will be necessary to increase productivity in non-hydrocarbon sectors. At a more fundamental level, Qatari businesses would benefit from reduced administrative barriers to set up businesses and from upgrading the transport infrastructure.
Saudi Arabia (24th) loses four positions in this year’s edition, based on a less positive assessment of its quality of education and level of domestic competition. The country will need to enhance competitiveness to further diversify its economy and create sufficient number of jobs for the growing workforce. Overall, its competitiveness benefits from high levels of macroeconomic stability (4th) with low debt and a budget that is consistently in comfortable surplus. The country also benefits from the largest market size among the Gulf Cooperation Council (GCC) economies (20th). Yet Saudi Arabia also faces important challenges going forward. For example, health and education do not meet the standards of other countries at similar income levels (50th). In light of the need to create jobs, further emphasis should be placed on education and labor market reforms. Room for improvement remains in particular with respect to higher education and training (57th), where Saudi Arabia’s assessment has weakened in recent years. Business leaders consider that the quality of education could be improved especially with respect to training in management (78th) and math and science (73rd). Labor market efficiency (64th) could also be improved, and reform in this area will be critical for Saudi Arabia, given the growing number of young people who will enter its labor market over the next several years. More efficient use of talent—in particular, enabling a growing share of educated women to work—and better education outcomes will increase in importance as the country attempts to diversify its economy, which will require a more skilled and educated workforce. Last but not least, although some progress has been recorded recently, the use of the latest technologies such as ICTs can be enhanced further (45th), especially as this is an area where Saudi Arabia continues to trail other GCC economies.
Israel retains the 27th position in this year’s GCI. The country’s main strengths remain its world-class capacity for innovation (3rd), which rests on innovative businesses that benefit from the presence of some of
© 2014 World Economic Forum
The Global Competitiveness Report 2014–2015 | 37
1.1: The Global Competitiveness Index 2014–2015
the world’s best research institutions (3rd), support by the government through public procurement policies (9th), and a favorable financial environment for start-ups (availability of venture capital is assessed at 9th place). Yet for the country’s innovation-driven competitiveness strategy to be successful and viable going into the future, Israel will have to address some basic competitiveness challenges. Israel’s institutions are in need of continued upgrading (43rd) and a stronger focus on raising the bar in education is needed. If not addressed, poor educational outcomes—particularly in math and science (79th) and in primary schools (86th)—could undermine the country’s innovative capacity over the longer term. Room for improvement also remains with respect to the macroeconomic environment (50th), although improvements have taken place between 2012 and 2013 as the fiscal deficit and public debt were reduced. At the time of writing, the security situation in the country is once again fragile, which could potentially affect the country’s economy, although this has not been the case in the recent past.
Jordan moves back up to 64th place, a rank it held two years ago. The improvement mainly reflects a lower budget deficit and some progress made in education and financial market development. The country is faced with a number of social challenges that require the government’s attention: for example, it must address both unemployment among young people (31.3 percent in 2012) and the consequence of the conflict in neighboring Syria, which has brought high numbers of refugees to Jordan. Nevertheless, Jordan has the potential to benefit more from its geographical proximity to GCC economies and Europe, and recent fiscal reforms have created space for shifting spending toward productivity-enhancing measures. The country has a relatively well educated population (48th), vibrant domestic markets (36th), and its stable and rather efficient institutions (37th) are a strong asset in regional comparison. Boosting economic growth over the longer term will require Jordan’s policymakers to address a number of challenges. According to the GCI, there is significant room for improvement in boosting labor market efficiency (94th), and the full potential of ICTs for improving productivity has not yet been fully exploited (90th). Jordan could also benefit from more openness to international trade and investment, which would trigger further efficiency gains in its domestic economy and facilitate the transfer of knowledge and technology. Tariff barriers remain high in international comparison (107th) and regulatory barriers to FDI remain in place (73rd). And although bank financing appears to be more easily available than in many other countries (Jordan comes in at 25th on ease of access to loans), efforts to further stabilize its banking sector should be continued (103rd).
Morocco moves up to 72nd position this year, partially recovering from last year’s drop. A
reduced budget deficit (between 2012 and 2013) and improvements in primary education and innovation support the country’s rise in the rankings. Some aspects of its institutions have improved as well, reflecting Morocco’s relative social and political stability and efforts made over recent years to modernize its business environment, particularly its administrative aspects. Continuing the process of economic diversification, which has already boosted exports and FDI in higher-value-added industries, will be important for the country’s future growth. Building on its competitiveness strengths, such as physical security (39th), some positive aspects of goods markets efficiency (e.g., 32nd on number of procedures to start a business), and a rather solid and efficient banking sector (42nd on soundness of banks), Morocco should continue its successful efforts to address key competitiveness challenges. Necessary measures include boosting education (104th) in terms of both quality and access, and reforming its labor market (111th). With respect to education, making schooling at the secondary and tertiary levels more accessible and attractive to increase enrollment rates in these two segments would ensure that a qualified labor force is available to support economic diversification. In their responses to the Survey, business executives also point out that revising curricula so that skills taught better match the needs of businesses should be a priority. With respect to labor markets, raising the share of women in the labor force would greatly strengthen the talent base available in the country. Last but not least, boosting the use of ICTs among businesses and individuals (84th) would also greatly benefit the country’s competitiveness.
Algeria moves up to 79th position this year. This rise is driven mainly by a sounder macroeconomic environment, which remains the country’s most important competitiveness strength (11th). Yet improvements are also seen in other areas, such as institutions and physical security, albeit from a low level. Some aspects of education also show a positive trend: for example, the quality of education seems to be improving. A major overhaul of the institutional framework and increased focus on the efficiency of the goods, labor, and in particular financial markets will be necessary to put Algeria’s growth on a more sustainable trajectory.
Iran comes in at 83rd, losing one place in comparison to last year’s assessment. The economy is expected to stabilize after two difficult years, mainly driven by external developments. This steadier economic context provides an important opportunity for the country to enhance its competitiveness potential. Iran has to build on its solid macroeconomic positioning, its large market size, and its fairly well educated population. Improvements to its institutional framework and measures to heighten the efficiency of its goods, labor, and financial markets would benefit the country’s
© 2014 World Economic Forum
1.1: The Global Competitiveness Index 2014–2015
38 | The Global Competitiveness Report 2014–2015
competitiveness and provide an important boost to the country’s economic growth in the shorter as well as longer terms.
After dropping for several years in a row, Egypt moves down one place to 119th position in this edition. This assessment points to a certain stabilization in the country following the recent elections. The fragile security situation is improving slightly, although tenacious political and policy instability are undermining the country’s competitiveness and its growth potential going forward. While regaining political stability and investor confidence needs to remain the priority as this Report goes to print, many of the underlying factors that will be decisive for the stability of the country and the cohesion of the society over the medium to longer term are economic in nature. Establishing confidence through a credible and far-reaching reform program is vital to Egypt’s future and to realizing the considerable potential of its large market size and proximity to key global markets. According to the GCI, three areas are of particular importance. First, the macroeconomic environment has deteriorated over recent years to reach 141st position mainly because of a widening fiscal deficit, rising public indebtedness, and persisting inflationary pressures. A credible fiscal consolidation plan, accompanied by structural reforms, will be needed in Egypt. This may prove difficult because of energy subsidies that account for a considerable share of public expenditure. Removing these subsidies may be difficult politically, but there is space for targeting subsidies better in a way that allows for fiscal consolidation while still protecting the most vulnerable. Second, measures to intensify domestic competition (118th) would result in efficiency gains and contribute to energizing the economy by providing access to new entrants. This, in turn, would make the country’s private sector more dynamic, thus fostering the creation of new jobs. And third, making labor markets more flexible (130th) and efficient (139th) would allow the country to increase employment in the medium term and provide new entrants to the labor market with enhanced opportunities.
Sub-Saharan AfricaAmid the economic turmoil that affected advanced economies in recent years, the sub-Saharan African region provided something of a silver lining in an otherwise broadly felt economic downturn. As growth is now modestly returning in advanced economies, sub-Saharan economies carry on registering impressive growth rates of close to 5 percent in 2013—with rising projections for the next two years—below only emerging and developing Asia. Yet important downside risks remain: although inflation has been coming down from the high rates of the past two years thanks to prudent monetary policy and moderating food prices, rising
fiscal deficits—which are most exacerbated in Zambia, Ghana, and Gambia—and a slowdown in emerging markets could dampen growth prospects, particularly in resource-rich economies.
More importantly, more than a decade of consistent high growth has not yet trickled down to all segments of the population. Most economic activity takes place in the informal sector, accounting for more than half of GDP and employing more than 80 percent of the population; only one in two young Africans participates in wage-earning jobs.25 Going forward, the main challenge will therefore be to turn high growth into inclusive growth, touching more of the population. This will require focusing on efforts to transition from still largely agriculture-based economies to higher-value-added activities in order to move the workforce out of agriculture into more productive sectors.26 The urgency of this transition is highlighted by the region’s high population growth. By 2020 more than half of the continent’s population will be below the age of 25.27
Against this backdrop, much remains to be done to lay the foundations for sustainable long-term growth, requiring efforts across many areas. Indeed, more than half of the 20 lowest ranked countries in the GCI are sub-Saharan, and overall the region continues to underperform in many areas of the basic requirements of competitiveness: the infrastructure deficit remains profound, and despite gradual improvements in recent years, health and basic education remains low. Only a handful of sub-Saharan economies—the island states of Mauritius and Seychelles, in addition to Cape Verde—have noteworthy health and education systems. Higher education and training also need to be further developed to provide the skills required for higher-value-added growth. The region’s poor performance across all basic requirements for competitiveness stands in contrast to its comparatively stronger performance in market efficiency, where several of the region’s middle-income economies fare relatively well. Although large regional variations remain in terms of competitiveness—ranging from Mauritius, now a solid 17 places ahead of the second-ranked South Africa, to the lowest ranked Guinea at 144th—efforts to strengthen the very basic requirements for long-term growth will be crucial for sustaining economic growth and making it more inclusive. These efforts will need to emphasize closing the infrastructure deficit and providing the region’s (young) population with the necessary skills to carry out higher-value-added employment.
Mauritius continues its steady upward trend this year, moving up six positions to 39th place and consolidating its lead in the region. Progress is driven by gradual improvements across seven out of the 12 pillars. Overall, the country benefits from relatively strong and transparent public institutions (36th), with clear property rights, strong judicial independence, and an efficient
© 2014 World Economic Forum
The Global Competitiveness Report 2014–2015 | 39
1.1: The Global Competitiveness Index 2014–2015
government (26th). Private institutions are rated as highly accountable (14th), with effective auditing and accounting standards and strong investor protection (12th). The country’s transport infrastructure is well developed by regional standards (42nd), especially in terms of ports, air transport, and roads. In addition, the country this year also records improvements in its electricity and telephony infrastructure (44th). Furthermore, the country’s wide-ranging structural reforms that have taken place since 2006 are bearing fruit, as evidenced by its continuous improvements in the areas of market efficiency: financial markets are comparatively deep (26th), its efficient goods market (25th) is characterized by enabling conditions for both domestic and foreign competition, and its labor market efficiency (52nd) has been improving thanks to increased flexibility (18th). Going forward, as income per capita rises and Mauritius moves up the value chain, more effort will be needed to develop its human capital. Although rising enrollment rates, particularly tertiary enrollment, are laudable (40.32 percent in 2012) and its overall score in the quality of education has been improving, other countries are moving even faster. Improving competitiveness will require additional efforts not only to improve higher education and training (54th) but also to mobilize the country’s talent more efficiently (101st), as evidenced by the low share of women in the labor force (115th).
South Africa continues its downward trend and falls to 56th place this year, third among the BRICS economies. South Africa does well on measures of the quality of its institutions (36th), including intellectual property protection (22nd), property rights (20th), the efficiency of its legal framework in challenging and settling disputes (9th and 15th, respectively), and its top-notch accountability of private institutions (2nd). Furthermore, South Africa’s financial market development remains impressive at 7th place,28 although our data point to more difficulties in all channels of obtaining finance this year. The country also has an efficient market for goods and services (32nd), and it does reasonably well in more complex areas such as business sophistication (31st) and innovation (43rd), benefitting from good scientific research institutions (34th) and strong collaboration between universities and the business sector in innovation (31st). South Africa’s transport infrastructure (32nd) is good by regional standards, although its electricity supply does suffer disruptions (99th). But the country’s strong ties to advanced economies, notably the euro area, has made it more vulnerable to the economic slowdown of those economies. These ties are likely to have contributed to the deterioration of fiscal indicators: its performance in the macroeconomic environment—having dropped sharply in the previous year—remains at 89th. Low scores for the diversion of public funds (96th), the perceived wastefulness of government spending (89th),
and a more general lack of public trust in politicians (90th) remain worrisome, and security (95th) continues to be a major area of concern for doing business. Building a skilled labor force and creating sufficient employment also present considerable challenges. The health of the workforce is ranked 132nd out of 144 economies—as a result of high rates of communicable diseases and poor health indicators more generally. Higher education and training remains insufficient (86th) and labor market efficiency (113th) is affected by extremely rigid hiring and firing practices (143rd), wage inflexibly (139th), and continuing significant tensions in labor-employer relations (144th). Raising education standards and making its labor market more efficient will thus be critical in view of the country’s high unemployment rate of over 20 percent, with its youth unemployment rate estimated at over 50 percent.
Botswana remains stable this year at 74th place, the fourth spot in the region. Among the country’s strengths are its relatively reliable and transparent institutions (39th), with efficient government spending and low levels of corruption, as well as its sound macroeconomic environment (13th), based on balanced fiscal budgets. However, the country’s heavy reliance on diamond mining (which accounts for one-third of GDP and government revenues) renders it vulnerable to fluctuations in demand, as seen during the global crisis. Botswana’s education system presents another area of concern, particularly for a middle-income country in transition to becoming an efficiency-driven economy. Education enrollment rates at all levels remain low by international standards, and the quality of the education system receives mediocre marks. Yet it is clear that by far the biggest obstacle facing Botswana in its efforts to improve its competitiveness remains its health situation: the country registers one of the highest rates of HIV and one of the lowest life expectancies in the world. Furthermore, its goods market must become more efficient (97th) and its infrastructure must be upgraded (101st), as evidenced by the recent electricity shortages. Going forward, combined efforts across all areas will be needed if the country is to reduce its heavy dependence on the mining sector and to set its economy on a more diversified growth path.
Namibia moves up by two places to 88th position. The country continues to benefit from a relatively well functioning institutional environment (50th), with well-protected property rights, an independent judiciary, and a fairly efficient government. The country’s transport infrastructure is also good by regional standards (52nd) and financial markets continue to be reasonably developed (46th). In order to improve its competitiveness, as in much of the region, Namibia must improve its health and education systems. The country ranks a low 118th on the health subpillar, with high infant mortality and low life expectancy—the result, in large part, of its
© 2014 World Economic Forum
1.1: The Global Competitiveness Index 2014–2015
40 | The Global Competitiveness Report 2014–2015
high rates of communicable diseases, although the data point to an improvement this year. However, to move up the value chain and diversify its economy, efforts to build its human resource base will be critical: school enrollment rates remain low compared with other sub-Saharan upper-middle-income countries, and the quality of its education system remains poor (119th). In addition, Namibia could do more to harness new technologies to improve its productivity levels (89th).
Kenya continues its upward trend from last year and moves up by six places to reach 90th place, registering improvements in 11 out of 12 pillars, most notably in the areas of market efficiency. Its economy is supported by financial markets that are well developed (up by seven places to 24th position), an efficient labor market (25th), and an increasingly more efficient goods market (62nd). Reducing the number of days (32 days) and procedures (10, or rank 118) to start a business could further improve the enabling environment for businesses. Following the adoption of the country’s new constitution in 2010, which introduced additional checks and balances on executive power, Kenya has also registered improvements in the institutions pillar (now at 78th, up from 123rd five years ago). These advances are largely driven by more efficient government and reduced corruption. Furthermore, the country’s education system gets relatively good marks for quality (30th) as well as for on-the-job training (31st). On the other hand, Kenya’s overall competitiveness is held back by a number of factors that hinder its long-term economic growth, particularly in view of its transition toward middle-income status: secondary and tertiary enrollment rates are low; infrastructure—particularly telephony and electricity (114th)—does not meet the needs of Kenya as the largest East African economy; weakening fiscal finances are affecting the macroeconomic environment (126th); and health remains an area of serious concern (117th). Finally, the security situation in Kenya also remains worrisome (128th).
Ghana reverses last year’s downward trend and climbs up to 111th this year, largely as the result of slight improvements in its macroeconomic indicators (reversing last year’s trend), although fiscal vulnerabilities persist: the government deficit stood at 10.8 percent of GDP in 2013, more than twice that of two years ago; government debt remains over 60 percent; and inflation is over 11 percent. With regard to strengths, public institutions are characterized by relatively high government efficiency (59th) and strong property rights (54th). In addition, the country’s financial and goods markets are also relatively well developed (62nd and 67th, respectively). On the other hand, Ghana must do much more to develop and deploy talent in the country. Education levels continue to trail international standards at all levels, labor markets are characterized by inefficiencies, and the country is not sufficiently harnessing new technologies for productivity enhancements (ICT adoption rates continue to be very
low). The security situation, at 111th, also remains a concern.
Senegal comes in at 112th this year. Although the country’s institutions (74th) rank still relatively low, our data suggest a steady improvement across a range of indicators, albeit from low levels. Senegal also benefits from relatively efficient goods and labor markets (both at 68th place), red tape to start a business is low even by international comparison (six days and four procedures), and labor-employer relations are reasonably good (57th). Moreover, Senegal hosts relatively good ports (58th), although all other modes of transport require significant upgrading (93rd overall). The country’s competitiveness is further pulled down by the poor health and basic education of its population (131st). Indeed, only three out of four children receive primary education, which is low compared with its middle-income peers, and communicable diseases continue to erode the health of the general population. Higher education and training (119th) are also in need of improvement. These challenges—among others—are prioritized in the country’s new growth strategy, the Plan Sénégal Emergent (PSE).29 In addition, the country’s macroeconomic environment remains challenging and is characterized by a high government deficit of 5.4 percent of GDP.
Côte d’Ivoire reverses its five-year downward trend and climbs to 115th place this year. The quality of its public institutions (86th) has continued to improve since the end of the 2010–11 post-election conflict, although from very low levels and in spite of being dragged down largely by the country’s security situation (107th). Improvements this year also take place on the back of continuing fiscal consolidation and efforts to reduce red tape for the private sector; for example, it now takes eight days to start a business compared with over a month last year. Like many of its sub-Saharan peers, the country has a labor market that is fairly efficient (73rd), a ranking that is primarily driven by its high flexibility (40th). Going forward, however, critical challenges remain. Infrastructure (93rd)—although improving—remains underdeveloped. Moreover, Côte d’Ivoire does not meet basic needs in terms of health and primary education (140th), ranking among the lowest 10 countries worldwide on the related pillar. Only 60 percent of its children are enrolled in primary education, and the burden of communicable diseases—particularly the high incidence of malaria and HIV—weighs heavily on its limited workforce, which also does not fully integrate women (107th). Furthermore, technological adoption is low across private users and the business sector, with only 3 percent of the population using the Internet.
Ethiopia moves up to 118th this year, facing challenges across all pillars despite its recent record growth rates. The functioning of its institutions (96th) receives a weaker assessment across almost all
© 2014 World Economic Forum
The Global Competitiveness Report 2014–2015 | 41
1.1: The Global Competitiveness Index 2014–2015
indicators, including property rights, ethics and corruption, and government efficiency. Furthermore, the country’s goods market (124th) remains inefficient. Ethiopia also requires significant improvements in the areas of infrastructure (125th), higher education and training (131st), and technological readiness (133rd). On a more positive note, this year points to a slight improvement in the country’s labor market, although concerns about the quality of labor-employer relations (97th), hiring and firing practices (78th), and the alignment between pay and productivity (99th) remain. Primary education, with a net enrollment rate of 86 percent, is comparatively good (although the quality of primary education requires improvement), and women account for a high percentage of the country’s labor force.
Tanzania is ranked 121st in this edition. Inflation—although still high at close to 8 percent—returned to single digits this year, although fiscal indicators remain relatively high. In addition, some aspects of its labor market—such as the country’s strong female participation in the labor force (6th) and reasonable redundancy costs—lend themselves to efficiency. On the other hand, the country’s institutions have been deteriorating over the last several years—although government regulation is not seen as overly burdensome (61st), corruption remains high (98th) and policymaking continues to be opaque (111th). Infrastructure in Tanzania is underdeveloped (130th), with poor roads and ports and an unreliable electricity supply (125th). And although primary education enrollment is commendably high, providing universal access, enrollment rates at the secondary and university levels are among the lowest in the world (at 132nd and 134th place, respectively), while the quality of the education system needs upgrading. A related area of concern is the country’s low level of technological readiness (131st), with low uptake of ICTs such as the Internet and mobile telephony. The basic health of its workforce is also a serious concern: the country is ranked 119th in this area, with poor health indicators and high levels of communicable diseases. In regional comparison, the country’s goods market also remains inefficient, characterized by low domestic and foreign competition. In the near-term future, it will be important not to lose sight of these challenges for the country’s long-term competitiveness, as the country is in the final stages of preparing its new constitution as well as holding elections next year.
Zimbabwe ranks 124th this year. Public institutions continue to receive a weak assessment, particularly related to corruption, government favoritism, and the protection of property rights (138th), reducing the incentive for businesses to invest. Despite efforts to improve its macroeconomic environment—including the dollarization of its economy in early 2009, which brought down inflation and interest rates—Zimbabwe still receives a low rank in this pillar (87th), which is characterized by
high government debt, a negative savings rate, and low inflation. Weaknesses in other areas include health (129th in the health subpillar); low education enrollment rates, with only every second child participating in secondary education; and formal markets that continue to function with difficulty, particularly goods and labor markets, which rank 133rd and 137th, respectively.
Nigeria—now Africa’s largest economy—continues its downward trend and falls by seven places to 127th this year, largely on the back of weakened public finances as a result of lower oil exports. Institutions remain weak (129th) with insufficiently protected property rights, high corruption, and undue influence. In addition, the security situation remains dire (139th). Nigeria must continue to upgrade its infrastructure (134th) as well as improve its health and primary education (143rd). Furthermore, the country is not harnessing the latest technologies for productivity enhancements, as demonstrated by its low rates of ICT penetration. On the upside, Nigeria benefits from its relatively large market size (33rd), which bears the potential for significant economies of scale; a relatively efficient labor market (40th) driven by its flexibility (20th); and a solid financial market (67th) following its gradual recovery from the 2009 crisis. However, poor availability and affordability of finance in general and the difficulties in obtaining loans in particular (137th) remain an important bottleneck to economic growth. Ahead of the 2015 election cycle, it will, thus, be critical to keep the ongoing reform momentum to diversify the economy and increase the country’s long-term competitiveness.
Mozambique ranks 133rd this year, with efforts required across many areas to lift its economy onto a sustainable growth and development path, particularly in view of its natural resource potential. The country’s public institutions receive poor marks on the basis of low public trust in politicians, significant red tape faced by companies in their business dealings, and the perceived wastefulness of government spending. Macroeconomic stability is weak (110th) on the back of increased inflation and a high government deficit. Looking ahead, significant reform will be needed to advance the country’s long-term competitiveness, including making critical investments across all modes of infrastructure (128th), establishing a regulatory framework that encourages competition to foster economic diversification, and developing a sound financial market (126th). Also critical, in view of the country’s rapidly growing population and high unemployment, are investing in the healthcare system and primary education (135th) as well as higher education and training (138th).
Angola—the continent’s second biggest oil exporter—ranks 140th overall. As with its oil-exporting peers, its strengths are in its macroeconomic environment and market size, but much remains to be done across the board to build up the country’s
© 2014 World Economic Forum
1.1: The Global Competitiveness Index 2014–2015
42 | The Global Competitiveness Report 2014–2015
competitiveness. Given its favorable fiscal stance, Angola has a unique opportunity to invest revenues in competiveness-enhancing measures. In this context, its poor performance across all governance indicators is worrisome: both public and private institutions are characterized by widespread corruption, and inefficient government spending casts doubt on the country’s ability to spend resource receipts in the most important areas. Furthermore, Angola’s infrastructure is one of the least developed globally (139th), and its population would be well served by improvements in its education and health systems (136th).
CONCLUSIONSThis chapter has presented and analyzed the results of the Global Competitiveness Index 2014–2015, a tool that assesses the competitiveness of 144 economies across all geographies and stages of development. The GCI aims at capturing the complexity of the phenomenon of
national competitiveness, which can be improved only through an array of efforts in different areas that affect the long-term productivity of a country, which is the key driver of economic growth.
In the current economic context of uneven recovery across advanced economies and renewed risks for emerging economies, the current edition of the Report has highlighted the need for more structural reforms and enhanced smart investments in both advanced and emerging economies in order to accelerate robust economic growth, create productive jobs, and boost inclusive growth with more and better opportunities for all segments of the population. At present, the pace of change remains uneven, and more determination and shared commitment among all stakeholders is urgently needed in order to build strategic public-private collaborations. Building this type of collaboration, as the ongoing World Economic Forum’s project on the Competitiveness Lab and the Competitiveness Practices
Raising productivity and competitiveness is crucial to sustaining economic growth and enhancing prosperity in a country. The process requires long-lasting commitment from relevant stakeholders to mobilize resources and provide the effort that can lead to the necessary reforms and productive investments across a vast array of areas.
However, stakeholders’ actions—most notably those originating from the public and private sectors—are not always well coordinated and aligned, so that synergies are often not fully realized and the results of the combined efforts are not maximized. Governments frequently develop policies in areas that are important for competitiveness, such as administrative reform, education, and basic research, yet they do so without considering the specific needs of companies. The impact of these policies is thus reduced. At the same time, the business community does not always sufficiently engage in long-term and often risky investments in areas such as research and development, information and communication technologies, or employees’ skills development strategies. If businesses could be engaged in this way, the positive spill-over effects of their investments could result in higher societal gains.
Fortunately, stakeholders are increasingly acknowledging the need to address this disconnect between public- and private-sector actions. The last few years have seen a growing recognition of the vital importance of supporting the definition and implementation of strategic public-private collaborations that go beyond the individual policies and strategies of governments and businesses.
Public-private collaborations have been common in areas such as infrastructure development because the potential gains that these specific governance structures could bring are significant for both the public and private sectors in terms of both the speed and scope of implementing projects and the particular strengths that each party can bring to bear. The private sector can contribute
its management expertise and resources, and the public sector can contribute its understanding of public needs and resources. Besides the traditional public-private partnerships found in infrastructure, public-private collaborations are becoming more common in initiatives related to other drivers of competitiveness, such as in innovation and education. In addition to speed, potentially better management, and shared resource commitments, these partnerships allow for a better alignment of government-led measures with the needs of private companies. The development of the European Innovation Partnerships, the European Technology Platforms, the Advanced Manufacturing Program in the United States, and the Leading Technology Institutes in the Netherlands are just a few examples of ongoing public-private collaborations in the field of innovation.
Against this backdrop, the World Economic Forum has embarked on an ambitious project to document, analyze, and disseminate some of the most promising examples of effective and efficient public-private collaboration in competitiveness-related areas. From this analysis, a number of key lessons are starting to emerge with regard to the main barriers and success factors that need to be taken into account when designing and implementing these collaborative approaches. More precisely, in order to broker effective collaborations, stakeholders must be able to count on clear targets and evaluation frameworks, the parties must share objectives and build strong and capable institutions to design and implement the projects, and enabling regulatory environments must be in place.
However, and perhaps even more importantly, strong leadership in both the public and private sectors is essential. Clear vision and effective communication is needed to overcome the main obstacle: lack of trust between the parties. Establishing mechanisms and dialogue fora that support a better understanding and can generate enhanced trust between the parties is thus crucial.
Box 4: Building strategic public-private collaborations to boost competitiveness
© 2014 World Economic Forum
The Global Competitiveness Report 2014–2015 | 43
1.1: The Global Competitiveness Index 2014–2015
Collection shows,30 can yield significant results if properly designed and implemented. See Box 4 for more detail.
Since its introduction in 2005, the GCI has been used by a growing number of countries and institutions to benchmark national competitiveness. The clear and intuitive structure of the GCI framework is useful for prioritizing policy reforms because it allows each country to identify strengths and weaknesses of its national competitiveness environment and pinpoint those factors most constraining its economic development. More specifically, the GCI provides a platform for dialogue among government, business, and civil society that can serve as a catalyst for productivity-enhancing actions. Over the years, the GCI has proved to be a very useful tool for advancing competitiveness across countries and for brokering strategic public-private collaborations aimed at boosting national competitiveness.
NOTES 1 The Global Competitiveness Index is based on the result of the
work of Sala-i-Martín and Artadi 2004.
2 Schumpeter 1942; Solow 1956; and Swan 1956.
3 See, for example, Sala-i-Martín et al. 2004 for an extensive list of potential robust determinants of economic growth.
4 See Easterly and Levine 1997; Acemoglu et al. 2001, 2002; Rodrik et al. 2002; and Sala-i-Martín and Subramanian 2003.
5 See de Soto 2000.
6 See de Soto and Abbot 1990.
7 See Shleifer and Vishny 1997; Zingales 1998.
8 See Kaufmann and Vishwanath 2001.
9 See Aschauer 1989; Canning et al. 1994; Gramlich 1994; and Easterly 2002.
10 See Fischer 1993.
11 See Sachs 2001.
12 See Schultz 1961; Lucas 1988; Becker 1993; and Kremer 1993.
13 See Almeida and Carneiro 2009; Amin 2009; and Kaplan 2009 for country studies demonstrating the importance of flexible labor markets for higher employment rates and, therefore, economic performance.
14 See Aghion and Howitt 1992 and Barro and Sala-i-Martín 2003 for a technical exposition of technology-based growth theories.
15 A general purpose technology (GPT), according to Trajtenberg (2005), is one that, in any given period, gives a particular contribution to an overall economy’s growth thanks to its ability to transform the methods of production in a wide array of industries. Examples of GPTs have been the invention of the steam engine and the electric dynamo.
16 See Sachs and Warner 1995; Frenkel and Romer 1999; Rodrik and Rodriguez 1999; Alesina et al. 2005; and Feyrer 2009. The case of the European Union illustrates the importance of the market size for competitiveness. Although the reduction of trade barriers and the harmonization of standards within the European Union have contributed to raising exports within the region, many barriers to a true single market, in particular in services, remain in place and lead to important border effects. Therefore we continue to use the size of the national domestic and foreign market in the Index.
17 This is particularly important in a world in which economic borders are not as clearly delineated as political ones. In other words, when Belgium sells goods to the Netherlands, the national accounts register the transaction as an export (so the Netherlands is a foreign market for Belgium), but when California sells the same kind of output to Nevada, the national accounts register the transaction as domestic (so Nevada is a domestic market for California).
18 See Romer 1990; Grossman and Helpman 1991; and Aghion and Howitt 1992.
19 Probably the most famous theory of stages of development was developed by the American historian W. W. Rostow in the 1960s (see Rostow 1960). Here we adapt Michael Porter’s theory of stages (see Porter 1990). Please see Chapter 1.1 of The Global Competitiveness Report 2007–2008 (Sala-i-Martín et al. 2007) for a complete description of how we have adapted Michael Porter’s theory for the present application.
20 Some restrictions were imposed on the coefficients estimated. For example, the three coefficients for each stage had to add up to one, and all the weights had to be non-negative.
21 In order to capture the resource intensity of the economy, we use as a proxy the exports of mineral products as a share of overall exports according to the sector classification developed by the International Trade Centre in their Trade Performance Index. In addition to crude oil and gas, this category also contains all metal ores and other minerals as well as petroleum products, liquefied gas, coal, and precious stones. The data used cover the years 2009 through 2013. Further information on these data can be found at http://legacy.intracen.org/appli1/TradeCom/Documents/TradeCompMap-Trade%20Performance%20Index-Technical%20Notes-EN.pdf. All countries that with more than 70 percent of their exports made up of mineral products are considered to be to some extent factor driven. The stage of development for these countries is adjusted downward smoothly depending on the exact primary export share. The higher the minerals export share, the stronger the adjustment and the closer the country will move to stage 1. For example, a country that exports 95 percent of mineral exports and that, based on the income criteria, would be in stage 3 will be in transition between stages 1 and 2. The income and primary exports criteria are weighted identically. Stages of development are dictated solely by income for countries that export less than 70 percent minerals. Countries that export only primary products would automatically fall into the factor-driven stage (stage 1).
22 In practice, this applies to countries where the GDP per capita at current market prices has, for the past five years, been above an average of that of economies at the technology frontier. Countries at the technology frontier are the 10 countries with the highest per capita patenting activity according, to Patent Cooperation Treaty data.
23 We have retained the geographical classifications used in past editions of the Report while changing the groupings in the country/economy profiles. The groupings in the profiles are based on IMF data, and use the IMF classifications.
24 IMF 2014a.
25 World Bank 2014.
26 Overall, the agricultural sector in GDP remains high at 25%, accounting for more than 60% of employment on average and for more than 80% in many countries. See AfDB, OECD, and UNDP 2014.
27 IMF 2014b.
28 The Central Bank’s bailout of African Bank Investments on August 11, 2014, is not reflected in the EOS data this year, but might affect the country’s performance in this pillar in the following year.
29 See http://www.gouv.sn/Plan-Senegal-Emergent-PSE.html.
30 The Competitiveness Lab and Competitiveness Practice Repository is a new initiative of the World Economic Forum to orchestrate an informed multi-stakeholder process for better understanding and shaping the competitiveness agenda of a country or region.
© 2014 World Economic Forum
1.1: The Global Competitiveness Index 2014–2015
44 | The Global Competitiveness Report 2014–2015
REFERENCESAcemoglu, D., S. Johnson, and J. Robinson. 2001. “The Colonial
Origins of Comparative Development: An Empirical Investigation.” American Economic Review 91: 1369–401.
———. 2002. “Reversal of Fortune: Geography and Institutions in the Making of the Modern World Distribution of Income.” Quarterly Journal of Economics 117 (4): 1231–94.
AfDB, OECD, and UNDP. 2014. African Economic Outlook 2014: Value Chains and Africa’s Industrialisation. Available at http://www.africaneconomicoutlook.org/en/.
Aghion P. and P. Howitt. 1992. “A Model of Growth through Creative Destruction.” Econometrica LX: 323–51.
Alesina, A., E. Spolaore, and R. Enrico. 2005. “Trade, Growth and the Size of Countries.” In P. Aghion and S. Durlauf, eds., Handbook of Economic Growth, 1st edition, volume 1. Amsterdam: Elsevier. 1499–542.
Almeida, R., and P. Carneiro, 2009. “Enforcement of Labor Regulation and Firm Size.” Journal of Comparative Economics 37 (1): 28–46.
Amin, M. 2009. “Labor Regulation and Employment in India’s Retail Stores.” Journal of Comparative Economics 37 (1): 47–61.
Aschauer, D. A. 1989. “Is Public Expenditure Productive?” Journal of Monetary Economics 23 (2): 117–200.
Barro, R. J. and X. Sala-i-Martín. 2003. Economic Growth, 2nd edition. Cambridge, MA: MIT Press.
Becker, G. S. 1993. Human Capital: A Theoretical and Empirical Analysis, with Special Reference to Education, 3rd edition. Chicago: University of Chicago Press.
Canning, D., M. Fay, and R. Perotti. 1994. “Infrastructure and Economic Growth.” In M. Baldarassi, L. Paganetto, and E. Phelps, eds., International Differences in Growth Rates. New York: MacMillan.
Credit Suisse. 2013. “India’s Better Half: The Informal Economy.” India Market Strategy. July 9. Available at https://www.credit-suisse.com/newsletter/doc/apac/aic2013/20130712_indiamkt.pdf
De Soto, H. 2000. The Mystery of Capital: Why Capitalism Triumphs in the West and Fails Everywhere Else. New York: Basic Books.
De Soto, H. and J. Abbot. 1990. The Other Path: The Economic Answer to Terrorism. New York: Harper Perennial.
Dobbs, R., J. Remes, J. Manyika, C. Roxburgh, S. Smit, and F. Schaer. 2012. Urban World: Cities and the Rise of the Consuming Class. McKinsey Global Institute (MGI), June. McKinsey & Company. Available at http://www.mckinsey.com/insights/urbanization/urban_world_cities_and_the_rise_of_the_consuming_class.
Easterly, W. 2002. The Elusive Quest for Growth. Cambridge, MA: MIT Press.
Easterly W. and R. Levine. 1997. “Africa’s Growth Tragedy: Policies and Ethnic Divisions.” Quarterly Journal of Economics CXII: 1203–50.
Feyrer, J. 2009. “Trade and Income: Exploiting Time Series in Geography.” NBER Working Paper No. 14910. Cambridge, MA: National Bureau of Economic Research.
Fischer, S. 1993. “The Role of Macroeconomic Factors in Growth.” Journal of Monetary Economics 32 (3): 485–512.
Frenkel, J. and D. Romer. 1999. “Does Trade Cause Growth?” American Economic Review 89 (3): 379–99.
Gramlich, E. M. 1994. “Infrastructure Investment: A Review Essay.” Journal of Economic Literature 32 (3): 1176–96.
Grossman, G. and E. Helpman. 1991. Innovation and Growth in the World Economy. Cambridge, MA: MIT Press. Chapters 3 and 4.
IMF (International Monetary Fund). 2014a. World Economic Outlook: Recovery Strengthens, Remains Uneven, April. Washington DC: IMF. Available at http://www.imf.org/external/Pubs/ft/weo/2014/01/.
———. 2014b. Regional Economic Outlook: Sub-Saharan Africa: Fostering Durable and Inclusive Growth, April. Washington DC: IMF. Available at http://www.scribd.com/doc/220088938/IMF-Regional-Economic-Outlook-Sub-Saharan-Africa-Fostering-Durable-and-Inclusive-Growth-April-2014.
———. 2014c. World Economic Outlook Database, April. Available at http://www.imf.org/external/pubs/ft/weo/2014/01/weodata/index.aspx.
———. 2014d. World Economic Outlook: The July 2014 Update. Available at http://www.imf.org/external/pubs/ft/weo/2014/update/02/.
Kaplan, D. 2009. “Job Creation and Labor Reform in Latin America.” Journal of Comparative Economics 37 (1): 91–105.
Kaufmann, D. and T. Vishwanath. 2001. “Toward Transparency: New Approaches and their Application to Financial Markets.” World Bank Observer 16 (1): 41–57.
Kremer, M. 1993. “The O-Ring Theory of Economic Development.” Quarterly Journal of Economics 108 (3): 551–75.
Lucas, R. E. 1988. “On the Mechanics of Economic Development.” Journal of Monetary Economics 22 (1): 3–42.
Planning Commission of India. 2012. Twelfth Five Year Plan 2012–17. Available at http://planningcommission.nic.in/plans/planrel/fiveyr/welcome.html.
Porter, M. 1990. The Competitive Advantage of Nations. New York: The Free Press.
Rodrik, D. and F. Rodriguez. 1999. “Trade Policy and Growth: A Skeptics’ Guide to Cross National Evidence.” NBER Working Paper No. 7081, April. Cambridge, MA: National Bureau of Economic Research.
Rodrik, D., A. Subramanian, and F. Trebbi. 2002. “Institutions Rule: The Primacy of Institutions over Geography and Integration in Economic Development.” Mimeo, Harvard University, October.
Romer, P. 1990. “Endogenous Technological Change.” Journal of Political Economy 98 (October): X71–S102.
Rostow, W. W. 1960. The Stages of Economic Growth, a Non-Communist Manifesto. Cambridge: University Press.
Sachs, J. 2001. Macroeconomics and Health: Investing in Health for Economic Development: Report of the Commission on Macroeconomics and Health. Geneva: World Health Organization.
Sachs, J. and A. Warner. 1995. “Economic Reform and the Process of Economic Integration.” Brookings Papers on Economic Activity 1995 (1): 1–118.
Sala-i-Martín, X. and E. V. Artadi. 2004. “The Global Competitiveness Index.” The Global Competitiveness Report 2004–2005. Hampshire: Palgrave Macmillan. 51–80
Sala-i-Martín X., J. Blanke, M. Drzeniek Hanouz, T. Geiger, I. Mia, and F. Paua. 2007. “The Global Competitiveness Index: Measuring the Productive Potential of Nations.” The Global Competitiveness Report 2007–2008. Hampshire: Palgrave Macmillan. 3–50.
Sala-i-Martín, X., G. Doppelhoffer, and R. Miller. 2004. “Cross-Sectional Growth Regressions: Robustness and Bayesian Model Averaging.” American Economic Review 94 (4) September.
Sala-i-Martín, X. and A. Subramanian. 2003. “Addressing the Natural Resources Curse: An Illustration from Nigeria.” NBER Working Paper No. 9804, June. Cambridge, MA: National Bureau of Economic Research.
Schultz, T. W. 1961. “Investment in Human Capital.” American Economic Review 1 (2): 1–17.
Schumpeter, J. 1942. Capitalism, Socialism and Democracy. New York: Harper & Row; 3rd Edition, 1950.
Shleifer, A. and R. Vishny. 1997, “A Survey of Corporate Governance.” Nobel Symposium on Law and Finance, August, 1995. Journal of Finance 52 (June): 737–83.
Solow, R. 1956. “A Contribution to the Theory of Economic Growth.” Quarterly Journal of Economics 70 (February): 65–94.
© 2014 World Economic Forum
The Global Competitiveness Report 2014–2015 | 45
1.1: The Global Competitiveness Index 2014–2015
Swan, T. W. 1956. “Economic Growth and Capital Accumulation.” Economic Record 32 (2): 334–61.
Trajtenberg, M. 2005. “Innovation Policy for Development: An Overview.” Paper prepared for LAEBA, Second Annual Meeting. November 28–29. Tel Aviv University.
United Nations. 2014. World Urbanization Prospects: The 2014 Revision Highlights. New York: United Nations. Available at http://esa.un.org/unpd/wup/Highlights/WUP2014-Highlights.pdf.
World Bank. 2014. World Development Indicators 2014 database. Available at http://data.worldbank.org/products/wdi.
World Economic Forum. 2009. The India Competitiveness Review 2009. Geneva: World Economic Forum.
———. 2010. The Global Competitiveness Report 2010–2011. Geneva: World Economic Forum.
———. 2011. The Global Competitiveness Report 2011–2012. Geneva: World Economic Forum.
———. 2012a: The Europe 2020 Competitiveness Report: Building a More Competitive Europe, 2012 edition. Geneva: World Economic Forum.
———. 2012b: The Global Information Technology Report 2012. Geneva: World Economic Forum.
———. 2012c. The Global Competitiveness Report 2012–2013. Geneva: World Economic Forum.
———. 2013. The Travel & Tourism Report 2013. Geneva: World Economic Forum.
———. 2014. The Competitiveness of Cities: A Report of the Global Agenda Council on Competitiveness. Available at http://www3.weforum.org/docs/GAC/2014/WEF_GAC_CompetitivenessOfCities_Report_2014.pdf.
Zingales, L. 1998. “Corporate Governance.” In P. Newman, ed., The New Palgrave Dictionary of Economics and the Law. New York: Macmillan.
© 2014 World Economic Forum
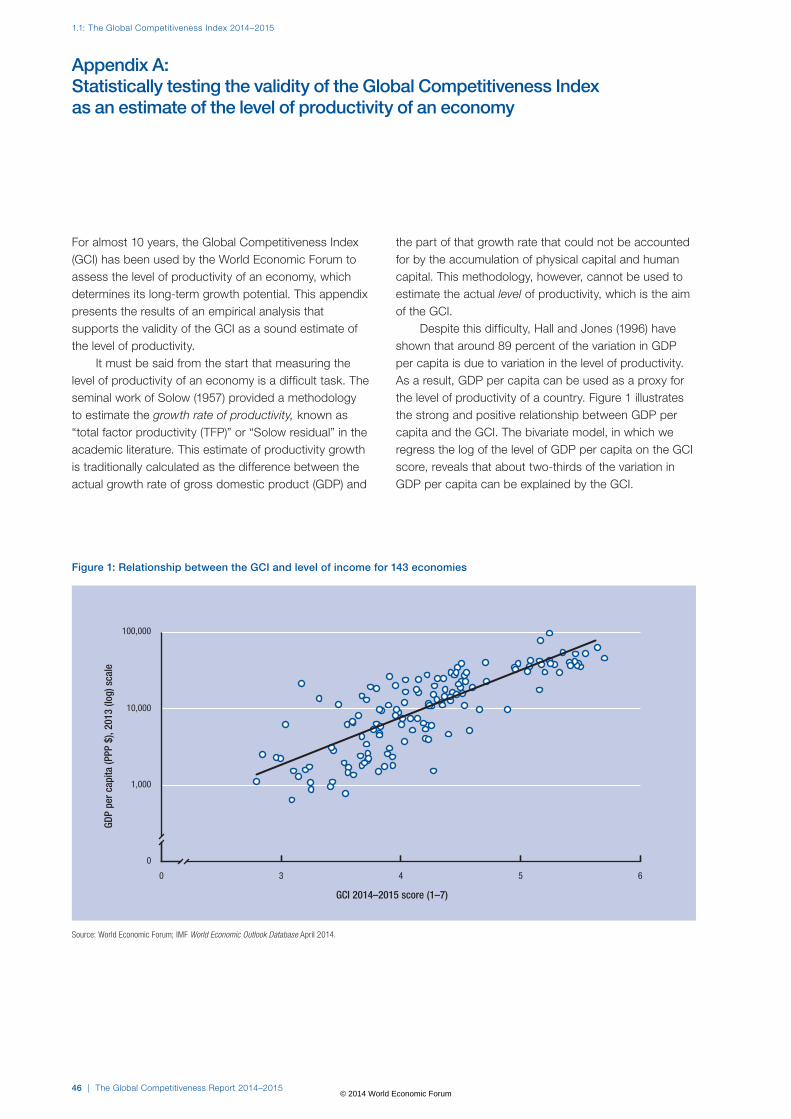
1.1: The Global Competitiveness Index 2014–2015
46 | The Global Competitiveness Report 2014–2015
Appendix A: Statistically testing the validity of the Global Competitiveness Index as an estimate of the level of productivity of an economy
For almost 10 years, the Global Competitiveness Index (GCI) has been used by the World Economic Forum to assess the level of productivity of an economy, which determines its long-term growth potential. This appendix presents the results of an empirical analysis that supports the validity of the GCI as a sound estimate of the level of productivity.
It must be said from the start that measuring the level of productivity of an economy is a difficult task. The seminal work of Solow (1957) provided a methodology to estimate the growth rate of productivity, known as “total factor productivity (TFP)” or “Solow residual” in the academic literature. This estimate of productivity growth is traditionally calculated as the difference between the actual growth rate of gross domestic product (GDP) and
the part of that growth rate that could not be accounted for by the accumulation of physical capital and human capital. This methodology, however, cannot be used to estimate the actual level of productivity, which is the aim of the GCI.
Despite this difficulty, Hall and Jones (1996) have shown that around 89 percent of the variation in GDP per capita is due to variation in the level of productivity. As a result, GDP per capita can be used as a proxy for the level of productivity of a country. Figure 1 illustrates the strong and positive relationship between GDP per capita and the GCI. The bivariate model, in which we regress the log of the level of GDP per capita on the GCI score, reveals that about two-thirds of the variation in GDP per capita can be explained by the GCI.
0 3 4 5 6
0
1,000
10,000
100,000
Figure 1: Relationship between the GCI and level of income for 143 economies
Source: World Economic Forum; IMF World Economic Outlook Database April 2014.
GDP
per c
apita
(PPP
$),
2013
(log
) sca
le
GCI 2014–2015 score (1–7)
© 2014 World Economic Forum
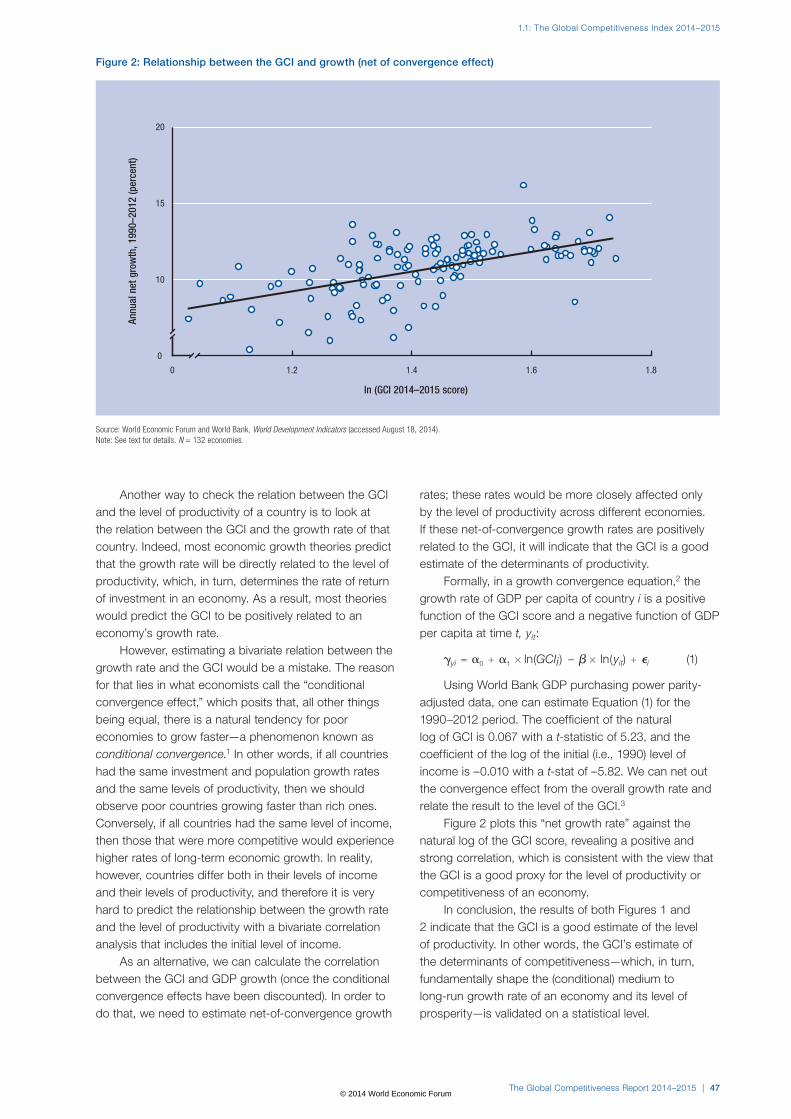
The Global Competitiveness Report 2014–2015 | 47
1.1: The Global Competitiveness Index 2014–2015
Another way to check the relation between the GCI and the level of productivity of a country is to look at the relation between the GCI and the growth rate of that country. Indeed, most economic growth theories predict that the growth rate will be directly related to the level of productivity, which, in turn, determines the rate of return of investment in an economy. As a result, most theories would predict the GCI to be positively related to an economy’s growth rate.
However, estimating a bivariate relation between the growth rate and the GCI would be a mistake. The reason for that lies in what economists call the “conditional convergence effect,” which posits that, all other things being equal, there is a natural tendency for poor economies to grow faster—a phenomenon known as conditional convergence.1 In other words, if all countries had the same investment and population growth rates and the same levels of productivity, then we should observe poor countries growing faster than rich ones. Conversely, if all countries had the same level of income, then those that were more competitive would experience higher rates of long-term economic growth. In reality, however, countries differ both in their levels of income and their levels of productivity, and therefore it is very hard to predict the relationship between the growth rate and the level of productivity with a bivariate correlation analysis that includes the initial level of income.
As an alternative, we can calculate the correlation between the GCI and GDP growth (once the conditional convergence effects have been discounted). In order to do that, we need to estimate net-of-convergence growth
rates; these rates would be more closely affected only by the level of productivity across different economies. If these net-of-convergence growth rates are positively related to the GCI, it will indicate that the GCI is a good estimate of the determinants of productivity.
Formally, in a growth convergence equation,2 the growth rate of GDP per capita of country i is a positive function of the GCI score and a negative function of GDP per capita at time t, yit :
gyi 5 a0 1 a1 3 ln (GCIi) – b 3 ln (yit) 1 ei (1)
Using World Bank GDP purchasing power parity-adjusted data, one can estimate Equation (1) for the 1990–2012 period. The coefficient of the natural log of GCI is 0.067 with a t-statistic of 5.23, and the coefficient of the log of the initial (i.e., 1990) level of income is –0.010 with a t-stat of –5.82. We can net out the convergence effect from the overall growth rate and relate the result to the level of the GCI.3
Figure 2 plots this “net growth rate” against the natural log of the GCI score, revealing a positive and strong correlation, which is consistent with the view that the GCI is a good proxy for the level of productivity or competitiveness of an economy.
In conclusion, the results of both Figures 1 and 2 indicate that the GCI is a good estimate of the level of productivity. In other words, the GCI’s estimate of the determinants of competitiveness—which, in turn, fundamentally shape the (conditional) medium to long-run growth rate of an economy and its level of prosperity—is validated on a statistical level.
0 1.2 1.4 1.6 1.8
0
10
15
20
Figure 2: Relationship between the GCI and growth (net of convergence effect)
Annu
al n
et g
row
th, 1
990–
2012
(per
cent
)
ln (GCI 2014–2015 score)
Source: World Economic Forum and World Bank, World Development Indicators (accessed August 18, 2014).Note: See text for details. N = 132 economies.
© 2014 World Economic Forum
1.1: The Global Competitiveness Index 2014–2015
48 | The Global Competitiveness Report 2014–2015
NOTES 1 The reason that poor economies do not grow systematically faster
is that “other things are not equal.” Among those other things that are not equal, we find the level of productivity or competitiveness, as defined by the World Economic Forum.
2 A growth convergence equation can be derived, for example, from the basic neoclassical growth theory as seen in Barro and Sala-i-Martín (2004).
3 This is done by adding the term b × ln (yit) from both sides of Equation (1) and using the b estimated in Equation (1). GDP per capita in constant 2011 international dollars were used for the computation.
REFERENCESBarro, R. and X. Sala-i-Martín. 2004. Economic Growth, 2nd edition.
Cambridge: MIT Press.
Hall, R. and C. Jones. 1999. “Why Do Some Countries Produce So Much More Output Per Worker than Others?” The Quarterly Journal of Economics 114 (1): 83–116.
IMF (International Monetary Fund). 2014. World Economic Outlook Database, April. Available at http://www.imf.org/external/pubs/ft/weo/2014/01/weodata/index.aspx.
Solow, R. 1957. “Technical Change and the Aggregate Production Function.” Review of Economics and Statistics 39 (3): 312–20.
World Bank. 2014. World Development Indicators 2014 database. Available at http://data.worldbank.org/products/wdi.
© 2014 World Economic Forum
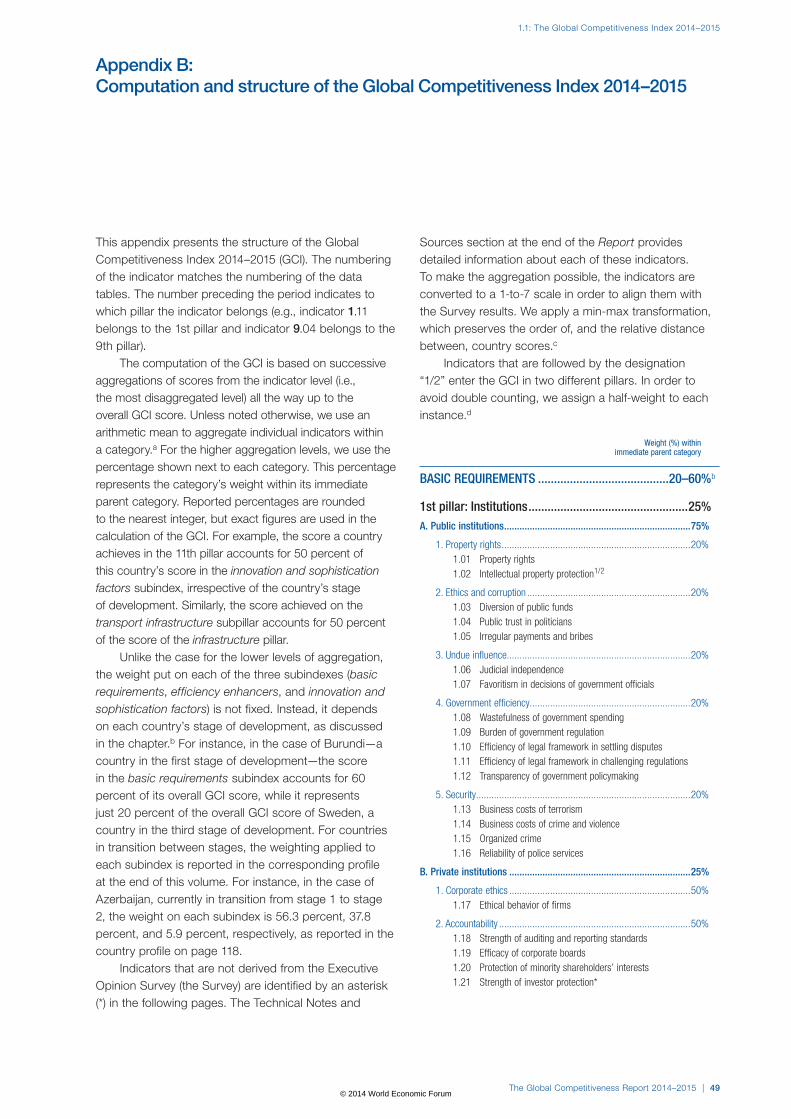
The Global Competitiveness Report 2014–2015 | 49
1.1: The Global Competitiveness Index 2014–2015
Appendix B: Computation and structure of the Global Competitiveness Index 2014–2015
This appendix presents the structure of the Global Competitiveness Index 2014–2015 (GCI). The numbering of the indicator matches the numbering of the data tables. The number preceding the period indicates to which pillar the indicator belongs (e.g., indicator 1.11 belongs to the 1st pillar and indicator 9.04 belongs to the 9th pillar).
The computation of the GCI is based on successive aggregations of scores from the indicator level (i.e., the most disaggregated level) all the way up to the overall GCI score. Unless noted otherwise, we use an arithmetic mean to aggregate individual indicators within a category.a For the higher aggregation levels, we use the percentage shown next to each category. This percentage represents the category’s weight within its immediate parent category. Reported percentages are rounded to the nearest integer, but exact figures are used in the calculation of the GCI. For example, the score a country achieves in the 11th pillar accounts for 50 percent of this country’s score in the innovation and sophistication factors subindex, irrespective of the country’s stage of development. Similarly, the score achieved on the transport infrastructure subpillar accounts for 50 percent of the score of the infrastructure pillar.
Unlike the case for the lower levels of aggregation, the weight put on each of the three subindexes (basic requirements, efficiency enhancers, and innovation and sophistication factors) is not fixed. Instead, it depends on each country’s stage of development, as discussed in the chapter.b For instance, in the case of Burundi—a country in the first stage of development—the score in the basic requirements subindex accounts for 60 percent of its overall GCI score, while it represents just 20 percent of the overall GCI score of Sweden, a country in the third stage of development. For countries in transition between stages, the weighting applied to each subindex is reported in the corresponding profile at the end of this volume. For instance, in the case of Azerbaijan, currently in transition from stage 1 to stage 2, the weight on each subindex is 56.3 percent, 37.8 percent, and 5.9 percent, respectively, as reported in the country profile on page 118.
Indicators that are not derived from the Executive Opinion Survey (the Survey) are identified by an asterisk (*) in the following pages. The Technical Notes and
Sources section at the end of the Report provides detailed information about each of these indicators. To make the aggregation possible, the indicators are converted to a 1-to-7 scale in order to align them with the Survey results. We apply a min-max transformation, which preserves the order of, and the relative distance between, country scores.c
Indicators that are followed by the designation “1/2” enter the GCI in two different pillars. In order to avoid double counting, we assign a half-weight to each instance.d
Weight (%) within immediate parent category
BASIC REQUIREMENTS .........................................20–60% b
1st pillar: Institutions ..................................................25%A. Public institutions .........................................................................75%
1. Property rights ..........................................................................20% 1.01 Property rights 1.02 Intellectual property protection 1/2
2. Ethics and corruption ................................................................20% 1.03 Diversion of public funds 1.04 Public trust in politicians 1.05 Irregular payments and bribes
3. Undue influence........................................................................20% 1.06 Judicial independence 1.07 Favoritism in decisions of government officials
4. Government efficiency ...............................................................20% 1.08 Wastefulness of government spending 1.09 Burden of government regulation 1.10 Efficiency of legal framework in settling disputes 1.11 Efficiency of legal framework in challenging regulations 1.12 Transparency of government policymaking
5. Security ....................................................................................20% 1.13 Business costs of terrorism 1.14 Business costs of crime and violence 1.15 Organized crime 1.16 Reliability of police services
B. Private institutions .......................................................................25%
1. Corporate ethics .......................................................................50% 1.17 Ethical behavior of firms
2. Accountability ...........................................................................50% 1.18 Strength of auditing and reporting standards 1.19 Efficacy of corporate boards 1.20 Protection of minority shareholders’ interests 1.21 Strength of investor protection*
© 2014 World Economic Forum
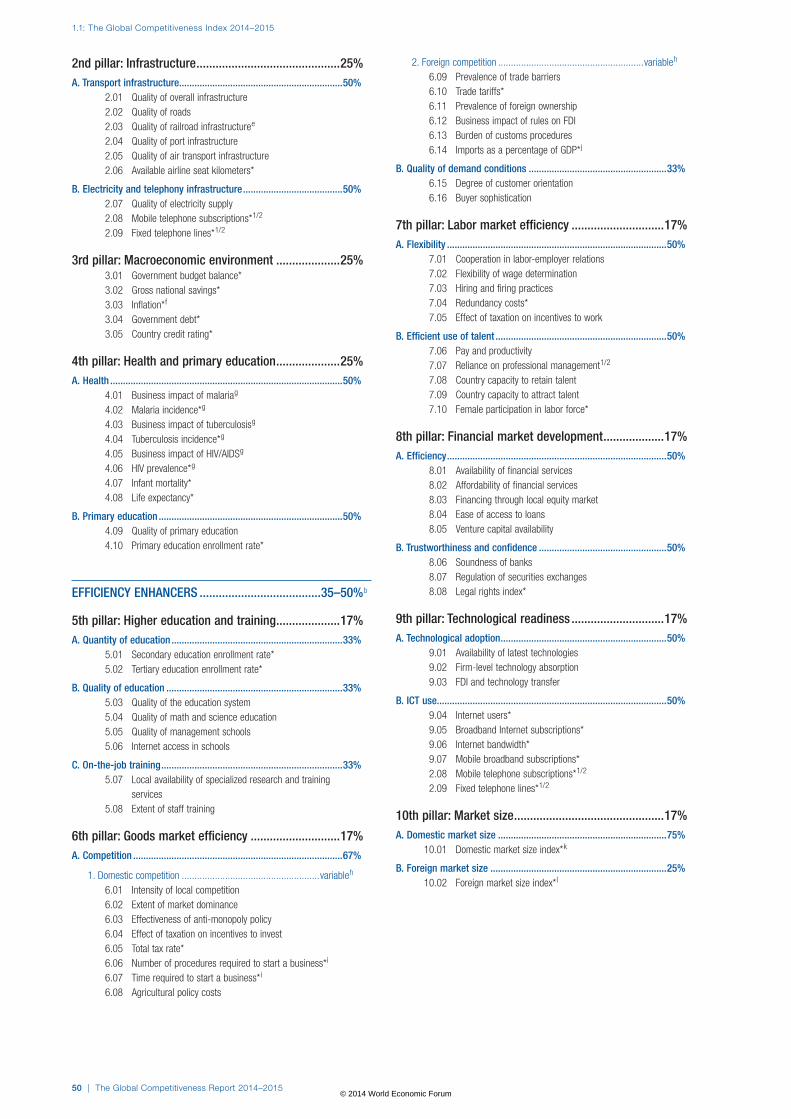
1.1: The Global Competitiveness Index 2014–2015
50 | The Global Competitiveness Report 2014–2015
2nd pillar: Infrastructure .............................................25%A. Transport infrastructure................................................................50%
2.01 Quality of overall infrastructure 2.02 Quality of roads 2.03 Quality of railroad infrastructure e
2.04 Quality of port infrastructure 2.05 Quality of air transport infrastructure 2.06 Available airline seat kilometers*
B. Electricity and telephony infrastructure .......................................50% 2.07 Quality of electricity supply 2.08 Mobile telephone subscriptions* 1/2
2.09 Fixed telephone lines* 1/2
3rd pillar: Macroeconomic environment ....................25% 3.01 Government budget balance* 3.02 Gross national savings* 3.03 Inflation* f
3.04 Government debt* 3.05 Country credit rating*
4th pillar: Health and primary education ....................25%A. Health ...........................................................................................50%
4.01 Business impact of malaria g
4.02 Malaria incidence* g
4.03 Business impact of tuberculosis g
4.04 Tuberculosis incidence* g
4.05 Business impact of HIV/AIDS g
4.06 HIV prevalence* g
4.07 Infant mortality* 4.08 Life expectancy*
B. Primary education ........................................................................50% 4.09 Quality of primary education 4.10 Primary education enrollment rate*
EFFICIENCY ENHANCERS ......................................35–50% b
5th pillar: Higher education and training ....................17%A. Quantity of education ...................................................................33%
5.01 Secondary education enrollment rate* 5.02 Tertiary education enrollment rate*
B. Quality of education .....................................................................33% 5.03 Quality of the education system 5.04 Quality of math and science education 5.05 Quality of management schools 5.06 Internet access in schools
C. On-the-job training .......................................................................33% 5.07 Local availability of specialized research and training
services 5.08 Extent of staff training
6th pillar: Goods market efficiency ............................17%A. Competition ..................................................................................67%
1. Domestic competition ......................................................variable h
6.01 Intensity of local competition 6.02 Extent of market dominance 6.03 Effectiveness of anti-monopoly policy 6.04 Effect of taxation on incentives to invest 6.05 Total tax rate* 6.06 Number of procedures required to start a business* i
6.07 Time required to start a business* i
6.08 Agricultural policy costs
2. Foreign competition .........................................................variable h
6.09 Prevalence of trade barriers 6.10 Trade tariffs* 6.11 Prevalence of foreign ownership 6.12 Business impact of rules on FDI 6.13 Burden of customs procedures 6.14 Imports as a percentage of GDP* j
B. Quality of demand conditions ......................................................33% 6.15 Degree of customer orientation 6.16 Buyer sophistication
7th pillar: Labor market efficiency .............................17%A. Flexibility ......................................................................................50%
7.01 Cooperation in labor-employer relations 7.02 Flexibility of wage determination 7.03 Hiring and firing practices 7.04 Redundancy costs* 7.05 Effect of taxation on incentives to work
B. Efficient use of talent ...................................................................50% 7.06 Pay and productivity 7.07 Reliance on professional management 1/2
7.08 Country capacity to retain talent 7.09 Country capacity to attract talent 7.10 Female participation in labor force*
8th pillar: Financial market development ...................17%A. Efficiency ......................................................................................50%
8.01 Availability of financial services 8.02 Affordability of financial services 8.03 Financing through local equity market 8.04 Ease of access to loans 8.05 Venture capital availability
B. Trustworthiness and confidence ..................................................50% 8.06 Soundness of banks 8.07 Regulation of securities exchanges 8.08 Legal rights index*
9th pillar: Technological readiness .............................17%A. Technological adoption .................................................................50%
9.01 Availability of latest technologies 9.02 Firm-level technology absorption 9.03 FDI and technology transfer
B. ICT use..........................................................................................50% 9.04 Internet users* 9.05 Broadband Internet subscriptions* 9.06 Internet bandwidth* 9.07 Mobile broadband subscriptions* 2.08 Mobile telephone subscriptions* 1/2
2.09 Fixed telephone lines* 1/2
10th pillar: Market size ...............................................17%A. Domestic market size ..................................................................75%
10.01 Domestic market size index* k
B. Foreign market size .....................................................................25% 10.02 Foreign market size index* l
© 2014 World Economic Forum
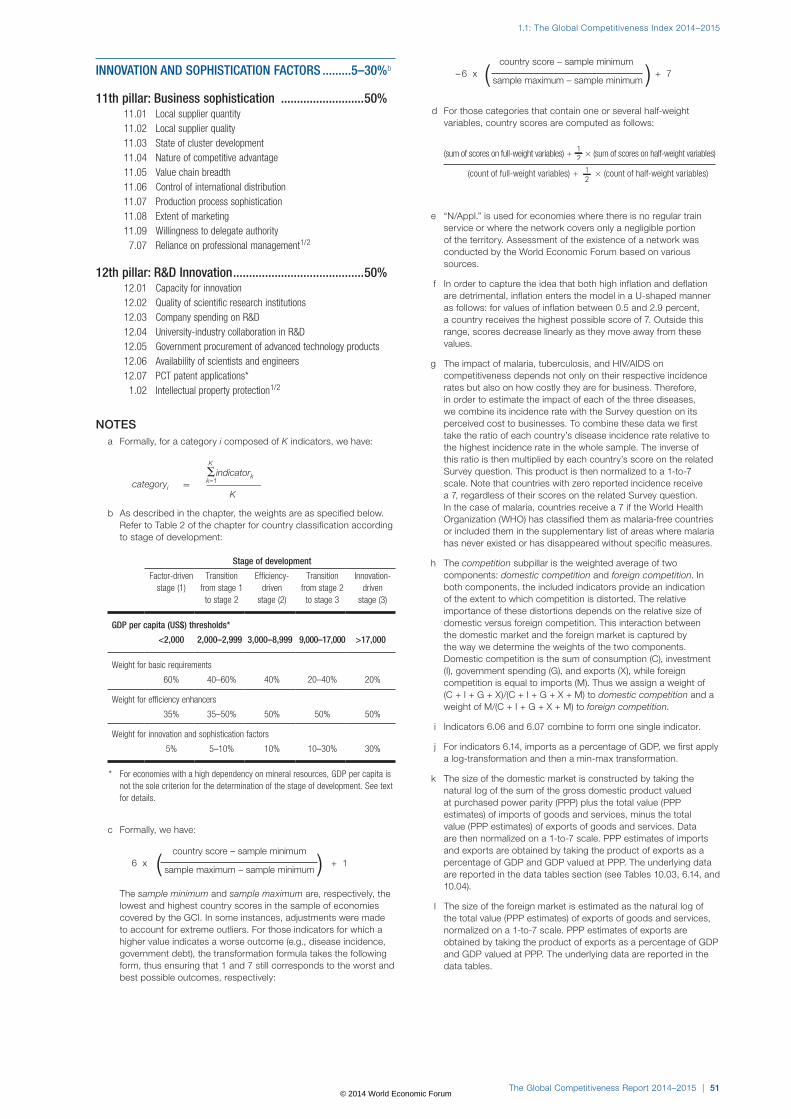
The Global Competitiveness Report 2014–2015 | 51
1.1: The Global Competitiveness Index 2014–2015
INNOVATION AND SOPHISTICATION FACTORS .........5–30% b
11th pillar: Business sophistication ..........................50% 11.01 Local supplier quantity 11.02 Local supplier quality 11.03 State of cluster development 11.04 Nature of competitive advantage 11.05 Value chain breadth 11.06 Control of international distribution 11.07 Production process sophistication 11.08 Extent of marketing 11.09 Willingness to delegate authority 7.07 Reliance on professional management 1/2
12th pillar: R&D Innovation .........................................50% 12.01 Capacity for innovation 12.02 Quality of scientific research institutions 12.03 Company spending on R&D 12.04 University-industry collaboration in R&D 12.05 Government procurement of advanced technology products 12.06 Availability of scientists and engineers 12.07 PCT patent applications* 1.02 Intellectual property protection 1/2
NOTESa Formally, for a category i composed of K indicators, we have:
categoryiK
�k=1
indicatorkK
�
b As described in the chapter, the weights are as specified below. Refer to Table 2 of the chapter for country classification according to stage of development:
Stage of development
Factor-driven stage (1)
Transition from stage 1
to stage 2
Efficiency-driven
stage (2)
Transition from stage 2
to stage 3
Innovation-driven
stage (3)
GDP per capita (US$) thresholds*
<2,000 2,000–2,999 3,000–8,999 9,000–17,000 >17,000
Weight for basic requirements
60% 40–60% 40% 20–40% 20%
Weight for efficiency enhancers
35% 35–50% 50% 50% 50%
Weight for innovation and sophistication factors
5% 5–10% 10% 10–30% 30%
* For economies with a high dependency on mineral resources, GDP per capita is not the sole criterion for the determination of the stage of development. See text for details.
c Formally, we have:
6 x country score – sample minimum
+ 1 ( sample maximum – sample minimum ) The sample minimum and sample maximum are, respectively, the
lowest and highest country scores in the sample of economies covered by the GCI. In some instances, adjustments were made to account for extreme outliers. For those indicators for which a higher value indicates a worse outcome (e.g., disease incidence, government debt), the transformation formula takes the following form, thus ensuring that 1 and 7 still corresponds to the worst and best possible outcomes, respectively:
– 6 x country score – sample minimum
+ 7 ( sample maximum – sample minimum )
d For those categories that contain one or several half-weight variables, country scores are computed as follows:
(sum of scores on full-weight variables) 1 3 (sum of scores on half-weight variables)
(count of full-weight variables) 1 3 (count of half-weight variables)
e “N/Appl.” is used for economies where there is no regular train service or where the network covers only a negligible portion of the territory. Assessment of the existence of a network was conducted by the World Economic Forum based on various sources.
f In order to capture the idea that both high inflation and deflation are detrimental, inflation enters the model in a U-shaped manner as follows: for values of inflation between 0.5 and 2.9 percent, a country receives the highest possible score of 7. Outside this range, scores decrease linearly as they move away from these values.
g The impact of malaria, tuberculosis, and HIV/AIDS on competitiveness depends not only on their respective incidence rates but also on how costly they are for business. Therefore, in order to estimate the impact of each of the three diseases, we combine its incidence rate with the Survey question on its perceived cost to businesses. To combine these data we first take the ratio of each country’s disease incidence rate relative to the highest incidence rate in the whole sample. The inverse of this ratio is then multiplied by each country’s score on the related Survey question. This product is then normalized to a 1-to-7 scale. Note that countries with zero reported incidence receive a 7, regardless of their scores on the related Survey question. In the case of malaria, countries receive a 7 if the World Health Organization (WHO) has classified them as malaria-free countries or included them in the supplementary list of areas where malaria has never existed or has disappeared without specific measures.
h The competition subpillar is the weighted average of two components: domestic competition and foreign competition. In both components, the included indicators provide an indication of the extent to which competition is distorted. The relative importance of these distortions depends on the relative size of domestic versus foreign competition. This interaction between the domestic market and the foreign market is captured by the way we determine the weights of the two components. Domestic competition is the sum of consumption (C), investment (I), government spending (G), and exports (X), while foreign competition is equal to imports (M). Thus we assign a weight of (C + I + G + X)/(C + I + G + X + M) to domestic competition and a weight of M/(C + I + G + X + M) to foreign competition.
i Indicators 6.06 and 6.07 combine to form one single indicator.
j For indicators 6.14, imports as a percentage of GDP, we first apply a log-transformation and then a min-max transformation.
k The size of the domestic market is constructed by taking the natural log of the sum of the gross domestic product valued at purchased power parity (PPP) plus the total value (PPP estimates) of imports of goods and services, minus the total value (PPP estimates) of exports of goods and services. Data are then normalized on a 1-to-7 scale. PPP estimates of imports and exports are obtained by taking the product of exports as a percentage of GDP and GDP valued at PPP. The underlying data are reported in the data tables section (see Tables 10.03, 6.14, and 10.04).
l The size of the foreign market is estimated as the natural log of the total value (PPP estimates) of exports of goods and services, normalized on a 1-to-7 scale. PPP estimates of exports are obtained by taking the product of exports as a percentage of GDP and GDP valued at PPP. The underlying data are reported in the data tables.
© 2014 World Economic Forum