Embed Size (px)
Citation preview
ADM was at the center of two large global price-fixingconspiracies. Buyers were overcharged $116 to $378 mil-lion in the United States. Market structure and corporatemanagement style facilitated these cartels. The criminalprosecutions and defendants’ legal strategies were bothlaudatory, but civil plaintiffs were short-changed. ADMhas undergone severe management restructuring, but theeffectiveness of apprehending global cartels with nationallegal enforcement is questionable. © 1998 John Wiley &Sons, Inc.
The development of extensive industry case studiesfrom court records was the first empirical methodutilized by the new branch of economics called in-dustrial organization (IO). Beginning in the early1930s, Chamberlin, Mason, and other Harvardeconomists encouraged their students to verify theusefulness of the emerging Structure–Conduct–Performance (SCP) paradigm by exploiting the typ-ically extensive court records generated by majorfederal antitrust cases. Most of these early industrystudies dealt with questions of monopolization or
mergers. By the mid 1950s, as several of these caseswere revisited by the second generation of IO econ-omists, considerable disenchantment had set in be-cause the hoped for generalizations from cross-in-dustry comparisons were not forthcoming. Whilecase studies never disappeared from the IO litera-ture, they tended to be reserved for certain narrowapplications such as explanations of structure–behavior relationships, the evolution of industrytrade practices, and legal-economic studies.
There appears to be a resurgence of interest incase studies in the mid 1990s among empirical IOeconomists. Partly, this trend may be due to thereappraisal of the usefulness of the conjecturalvariation (NEIO) studies that comprised a substan-tial share of the empirical IO work of the late1980s. NEIO models can only distinguish betweenindustries composed of price taking firms and thosethat set prices; the models do not identify the deter-minants of the price–cost gap, and thus are not use-ful in practical competition-policy settings.1
Another reason for the renewed attention beinggiven case studies may be the magisterial study ofthe food industries given in Sutton’s2 book. Like theearlier SCP tradition, Sutton engages in a cross-sec-tional comparison of industry histories in order toconfirm a maintained hypothesis. However, his
Correspondence to: John Connor, 1145 Krannert Building, Depart-
ment of Agricultural Economics, Purdue University, West Lafayette,
IN 47907-1145. Purdue Journal Paper No. 15, 838.
• John Connor is Professor, Department of Agricultural Economics at Purdue University.
The Global Citric Acid Conspiracy: Legal-Economic Lessons
•435
•John M. Connor
Agribusiness, Vol. 14, No. 6, 435–452 (1998)© 1998 John Wiley & Sons, Inc. CCC 0742-4477/98/060435-18
choice of industries and method of comparison wasmore strictly guided by formal theory.
The purpose of this article is to present new infor-mation on the world citric acid industry, focusingon the period during which the four of the fivelargest manufacturers have admitted to fixing theproduct’s price worldwide. In particular, I hope todraw a number of lessons for structure-conduct re-lationships, legal strategies, consumer welfare im-pacts, corporate organization, and the effectivenessof the Sherman Act in deterring collusive behavior.a
The Market for Citric Acid
Citric acid is an acidulent, a class of additives thatserve several functions: sterilization, bacteriologi-cal stabilization, flavor fixation, flavor enhance-ment, and standardization of acid levels. Acidulentsmay be chemically extracted from vegetable matter,synthesized, or produced from starches by fermen-tation. Approximately two-thirds of all synthetic orbiotech acidulents are added to foods and bever-ages, and most of the remainder in detergents.b Al-though there are many acidulents, citric acid ac-counts for more than 80 percent of the value of theUS market for acidulents. Citric acid is sold in ei-ther liquid or anhydrous forms. The dry forms con-sist of sodium citrate, potassium citrate, or othersalts of citric acid. Liquid acid is sold mixed withsome water, but prices are always quoted in anhy-drous equivalents. Liquid forms are generally food-grade, usable in beverages and processed foods ofall kinds. Citric salts are ideal for nonfood industri-al uses such as detergents where purity standardsare not as high as for food uses.
The Structure of Production
In the 1980s, US production was a duopoly. Pfizer,Inc. produced citric acid and citric salts in Groton,
Connecticut and a newer plant in Southport, NorthCarolina. Miles Laboratories, headquartered inElkhart, Indiana produced citric acid in its Elkhartand Dayton, Ohio plants. Miles was acquired by thelarge chemical firm Bayer AG of Basel, Switzerlandin the 1980s. Marketing of citric products was han-dled by Bayer’s subsidiary, Haarmann and Reimer.In 1989, Pfizer and Bayer each had equal capacityshares in the US market. Total 1989 US productioncapacity was 280 million pounds. Of this produc-tion, a small amount (17 million pounds or 7% ofproduction) was exported, mostly to Canada. Thedomestically produced supply of about 218 millionpounds was augmented by 65 million pounds of im-ported citric acid and salts (23% of total US sup-ply). In the late 1980s, imports were typically threeor four times larger than exports.
Two large changes in the US citric acid industryoccurred in 1990. First announced in November1987, Cargill began production of citric acid at itsEddyville, Iowa plant in the spring of 1990. Thehighly automated plant had a rated capacity of 55million pounds, which added 17% to existing 1990US capacity. It was the first US citric plant to bebuilt as an integrated unit of a wet corn milling op-eration. Pfizer and Bayer had to purchase sweeten-er feedstock from independent suppliers, a situa-tion that added to their costs of production. Cargillquickly garnered a large and increasing share of theUS market by sharply lowering its offer price andadding to plant capacity in 1991, 1993, and 1995.
The second change in the industry was the entryby acquisition of Archer Daniels Midland Co.(ADM). Just before Cargill opened its Eddyvilleplant, ADM announced its intention to enter intointegrated citric acid production. This was not agreat surprise, because ADM had already made en-try into production of high valued, organic chemi-cals a high strategic priority. Moreover, Cargill andADM had a history of replicating each other’s prod-uct portfolio for several years. What was a surprisewas ADM’s decision to acquire Pfizer’s plants andtechnology rather than to enter de novo.c An-nounced August 1990 and completed in December
Connor
•436
cTen years earlier, takeovers by potential entrants would have trig-
gered rigorous reviews by federal antitrust authorities, and evidence
from marketing plans that the acquiring firm had actively considered
aWhile this study concentrates on citric acid, ADM was also at the
center of a contemporaneous conspiracy to fix the prices of lysine. The
lysine case was recently published3 and will serve as a model for the
present case. Frequent comparisons will be made between lysine and
citric acid.bFacts mentioned in this paper and additional bibliographic citations
can be found in Appendix B of Connor.4 Detailed tables can be found
in Connor.6
1990, the sale included Pfizer’s Southport, NorthCarolina plant (100 million pound capacity).
Thus, in December 1990 the US citric acid indus-try consisted of three domestic producers, ADM,Cargill, and Bayer/Haarmann & Reimer. BecauseADM soon expanded and modernized its acquiredplants, Bayer would soon become the only noninte-grated US manufacturer. In addition, about one-fifth of US demand was satisfied by imports fromthree large suppliers and a dozen small ones. Thethree large importers were Jungbunzlauer of Basel,Switzerland, Hoffmann–La Roche of Basel,Switzerland, and a large number of small Chinesechemical companies. Jungbunzlauer and Rochewere, together with Bayer, the dominant producersin Europe’s large citric acid industry. The Chinesesuppliers were numerous, low-tech, but cheap(partly because of low-cost feedstocks and partlybecause of government subsidies). These three im-porters accounted for almost three-fourths of USimports in the early 1990s. Imports accounted forabout 20% of US consumption in 1989–1991, 15%in 1992–1992, and peaked at 29% in 1994. Con-sumption volumes were growing about 8% p.a.from 1989 to 1995, quite a bit higher than tradesources guessed.
Despite Cargill’s new plant capacity, utilization re-mained at levels close to what are generally consid-ered optimal—85 to 90%—during 1989–1991. Uti-lization reached a level in 1992 that might havesignaled tight supplies, but expansions by bothADM (in 1993) and Cargill (1993 and 1995) soonbrought excess capacity to the US industry in1993–1994. In ADM’s case at least, building plantsat the largest possible scales and consciously creat-ing excess production capacities had long been afeature of its corporate strategy. Excess capacityraises the perception of entry risk by would-be en-trants.
The United States was one of three main produc-tion zones for citric acid in the world. US produc-tion capacity accounted for about one-third of esti-mated global capacity during 1989–1992, but
thereafter began to slip to about 21% by1994–1996. Western Europe had five citric acidmanufacturers during 1989–1996, three of themquite large (Jungbunzlauer, Bayer, and Roche) andtwo relatively small Italian firms. Western Europe’sproduction capacity ranged from 38 to 45% of glob-al capacity throughout the period, with all five pro-ducers expanding their plants or adding new ones.The third major supply area was China. Its citricacid capacity grew by an amazing 23% p.a. during1989–1996; the volume of exports grew even morerapidly, about 35% p.a. Until recently all the Chi-nese manufacturers were government owned orcontrolled and their exports were somewhat coordi-nated. In volume terms, China surpassed the US in-dustry in 1995. However, in value terms, China’soutput is about equal to that of the United Statestoday (1998). In 1989, Chinese companies made17% of the world’s citric acid, up to 28% in 1996.The vast size and rapid expansion of the Chinese in-dustry play a key role in understanding the con-spiracy’s operation.
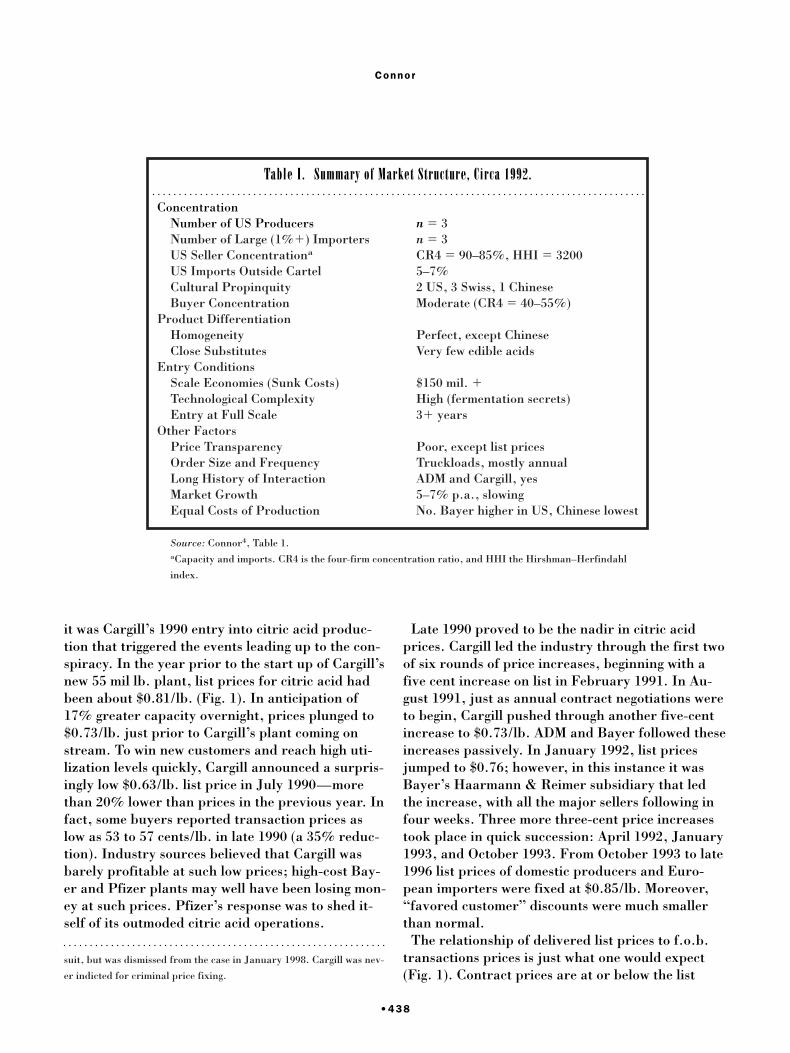
Table I summarizes the market structure charac-teristics of the US citric acid industry. Seller con-centration is high and buyer concentration is low.The product is homogeneous except for the lowergrade acid sold by Chinese manufacturers. Barriersto entry are severe because of capital sunk costs,time lags, and technological secrecy. Transactionsare large, lumpy, and their prices hidden by the na-ture of contracting. Growth was moderate and slow-ing. All these conditions facilitate oligopolistic coor-dination.4 The principal factors discouragingcooperative seller behavior were differences in costsof production and a plurality of business cultures,except those of Cargill and ADM.
The Price-Fixing Conspiracy
Four manufacturers eventually pleaded guilty tofixing the prices and output levels of citric acid inthe United States: Bayer, ADM, Jungbunzlauer,and Roche. The conspiracy also affected Canadaand the European Union, but these cases are stillunder investigation.d Although not legally culpable,
The G loba l C i t r ic Ac id Consp i racy
•437
dCargill was named as a defendant in the federal civil class action
de novo entry would have blocked the merger. ADM’s public announce-
ment in early 1990 made it a blatant potential entrant and, thus, com-
petitively unsuitable even by the relaxed antitrust standards of the
1981–1993 period.
it was Cargill’s 1990 entry into citric acid produc-tion that triggered the events leading up to the con-spiracy. In the year prior to the start up of Cargill’snew 55 mil lb. plant, list prices for citric acid hadbeen about $0.81/lb. (Fig. 1). In anticipation of17% greater capacity overnight, prices plunged to$0.73/lb. just prior to Cargill’s plant coming onstream. To win new customers and reach high uti-lization levels quickly, Cargill announced a surpris-ingly low $0.63/lb. list price in July 1990—morethan 20% lower than prices in the previous year. Infact, some buyers reported transaction prices aslow as 53 to 57 cents/lb. in late 1990 (a 35% reduc-tion). Industry sources believed that Cargill wasbarely profitable at such low prices; high-cost Bay-er and Pfizer plants may well have been losing mon-ey at such prices. Pfizer’s response was to shed it-self of its outmoded citric acid operations.
Late 1990 proved to be the nadir in citric acidprices. Cargill led the industry through the first twoof six rounds of price increases, beginning with afive cent increase on list in February 1991. In Au-gust 1991, just as annual contract negotiations wereto begin, Cargill pushed through another five-centincrease to $0.73/lb. ADM and Bayer followed theseincreases passively. In January 1992, list pricesjumped to $0.76; however, in this instance it wasBayer’s Haarmann & Reimer subsidiary that ledthe increase, with all the major sellers following infour weeks. Three more three-cent price increasestook place in quick succession: April 1992, January1993, and October 1993. From October 1993 to late1996 list prices of domestic producers and Euro-pean importers were fixed at $0.85/lb. Moreover,“favored customer” discounts were much smallerthan normal.
The relationship of delivered list prices to f.o.b.transactions prices is just what one would expect(Fig. 1). Contract prices are at or below the list
Connor
•438
Table I. Summary of Market Structure, Circa 1992.
ConcentrationNumber of US Producers n 5 3Number of Large (1%1) Importers n 5 3US Seller Concentrationa CR4 5 90–85%, HHI 5 3200US Imports Outside Cartel 5–7%Cultural Propinquity 2 US, 3 Swiss, 1 ChineseBuyer Concentration Moderate (CR4 5 40–55%)
Product DifferentiationHomogeneity Perfect, except ChineseClose Substitutes Very few edible acids
Entry ConditionsScale Economies (Sunk Costs) $150 mil. 1Technological Complexity High (fermentation secrets)Entry at Full Scale 31 years
Other FactorsPrice Transparency Poor, except list pricesOrder Size and Frequency Truckloads, mostly annualLong History of Interaction ADM and Cargill, yesMarket Growth 5–7% p.a., slowingEqual Costs of Production No. Bayer higher in US, Chinese lowest
Source: Connor4, Table 1.aCapacity and imports. CR4 is the four-firm concentration ratio, and HHI the Hirshman–Herfindahl
index.
suit, but was dismissed from the case in January 1998. Cargill was nev-
er indicted for criminal price fixing.
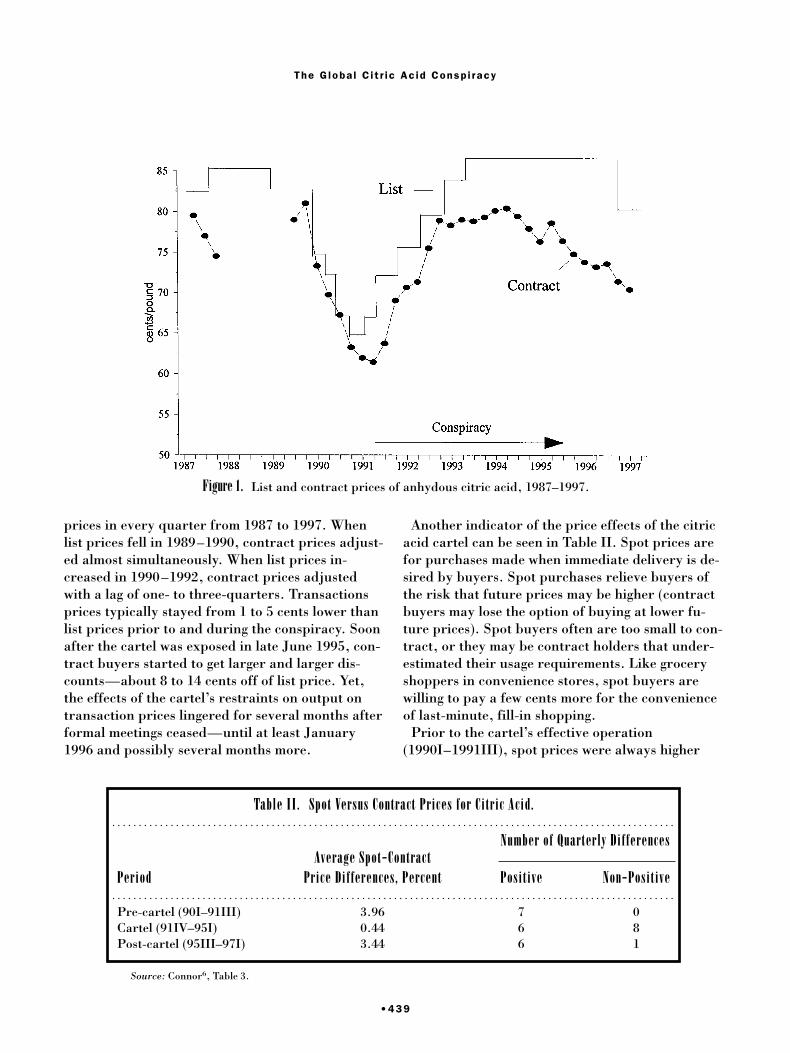
prices in every quarter from 1987 to 1997. Whenlist prices fell in 1989–1990, contract prices adjust-ed almost simultaneously. When list prices in-creased in 1990–1992, contract prices adjustedwith a lag of one- to three-quarters. Transactionsprices typically stayed from 1 to 5 cents lower thanlist prices prior to and during the conspiracy. Soonafter the cartel was exposed in late June 1995, con-tract buyers started to get larger and larger dis-counts—about 8 to 14 cents off of list price. Yet,the effects of the cartel’s restraints on output ontransaction prices lingered for several months afterformal meetings ceased—until at least January1996 and possibly several months more.
Another indicator of the price effects of the citricacid cartel can be seen in Table II. Spot prices arefor purchases made when immediate delivery is de-sired by buyers. Spot purchases relieve buyers ofthe risk that future prices may be higher (contractbuyers may lose the option of buying at lower fu-ture prices). Spot buyers often are too small to con-tract, or they may be contract holders that under-estimated their usage requirements. Like groceryshoppers in convenience stores, spot buyers arewilling to pay a few cents more for the convenienceof last-minute, fill-in shopping.
Prior to the cartel’s effective operation(1990I–1991III), spot prices were always higher
The G loba l C i t r ic Ac id Consp i racy
•439
Figure 1. List and contract prices of anhydous citric acid, 1987–1997.
Table II. Spot Versus Contract Prices for Citric Acid.
Average Spot-ContractNumber of Quarterly Differences
Period Price Differences, Percent Positive Non-Positive
Pre-cartel (90I–91III) 3.96 7 0Cartel (91IV–95I) 0.44 6 8Post-cartel (95III–97I) 3.44 6 1
Source: Connor6, Table 3.
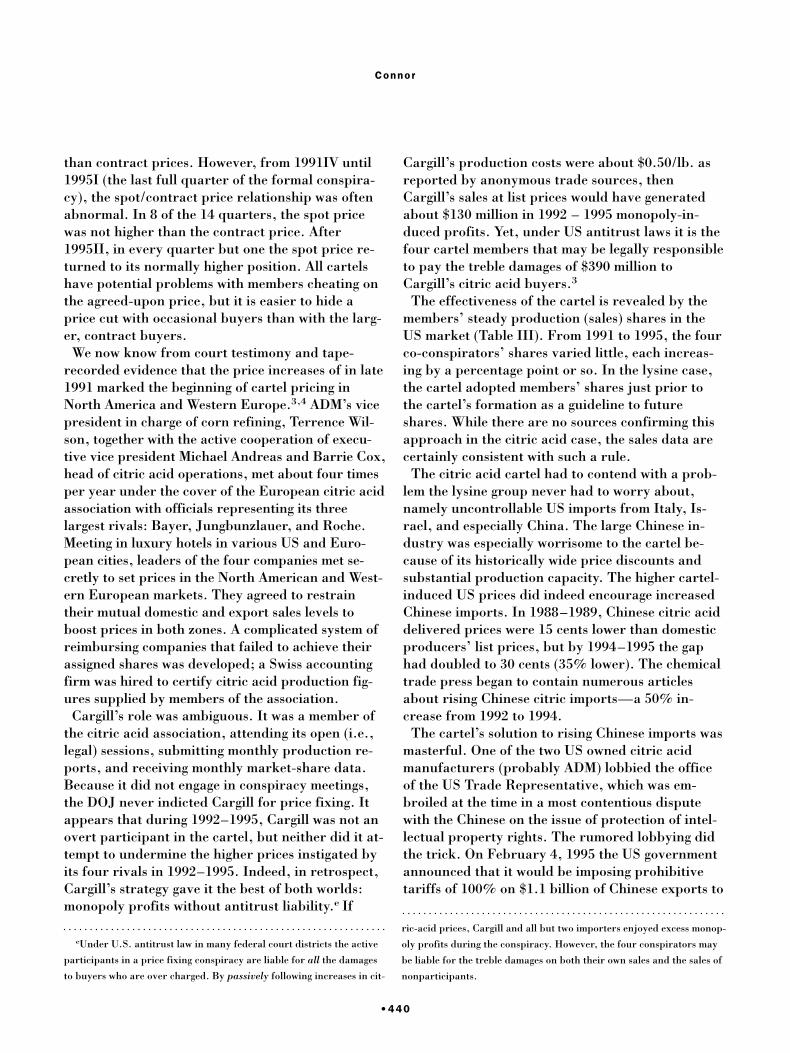
than contract prices. However, from 1991IV until1995I (the last full quarter of the formal conspira-cy), the spot/contract price relationship was oftenabnormal. In 8 of the 14 quarters, the spot pricewas not higher than the contract price. After1995II, in every quarter but one the spot price re-turned to its normally higher position. All cartelshave potential problems with members cheating onthe agreed-upon price, but it is easier to hide aprice cut with occasional buyers than with the larg-er, contract buyers.
We now know from court testimony and tape-recorded evidence that the price increases of in late1991 marked the beginning of cartel pricing inNorth America and Western Europe.3,4 ADM’s vicepresident in charge of corn refining, Terrence Wil-son, together with the active cooperation of execu-tive vice president Michael Andreas and Barrie Cox,head of citric acid operations, met about four timesper year under the cover of the European citric acidassociation with officials representing its threelargest rivals: Bayer, Jungbunzlauer, and Roche.Meeting in luxury hotels in various US and Euro-pean cities, leaders of the four companies met se-cretly to set prices in the North American and West-ern European markets. They agreed to restraintheir mutual domestic and export sales levels toboost prices in both zones. A complicated system ofreimbursing companies that failed to achieve theirassigned shares was developed; a Swiss accountingfirm was hired to certify citric acid production fig-ures supplied by members of the association.
Cargill’s role was ambiguous. It was a member ofthe citric acid association, attending its open (i.e.,legal) sessions, submitting monthly production re-ports, and receiving monthly market-share data.Because it did not engage in conspiracy meetings,the DOJ never indicted Cargill for price fixing. Itappears that during 1992–1995, Cargill was not anovert participant in the cartel, but neither did it at-tempt to undermine the higher prices instigated byits four rivals in 1992–1995. Indeed, in retrospect,Cargill’s strategy gave it the best of both worlds:monopoly profits without antitrust liability.e If
Cargill’s production costs were about $0.50/lb. asreported by anonymous trade sources, thenCargill’s sales at list prices would have generatedabout $130 million in 1992 – 1995 monopoly-in-duced profits. Yet, under US antitrust laws it is thefour cartel members that may be legally responsibleto pay the treble damages of $390 million toCargill’s citric acid buyers.3
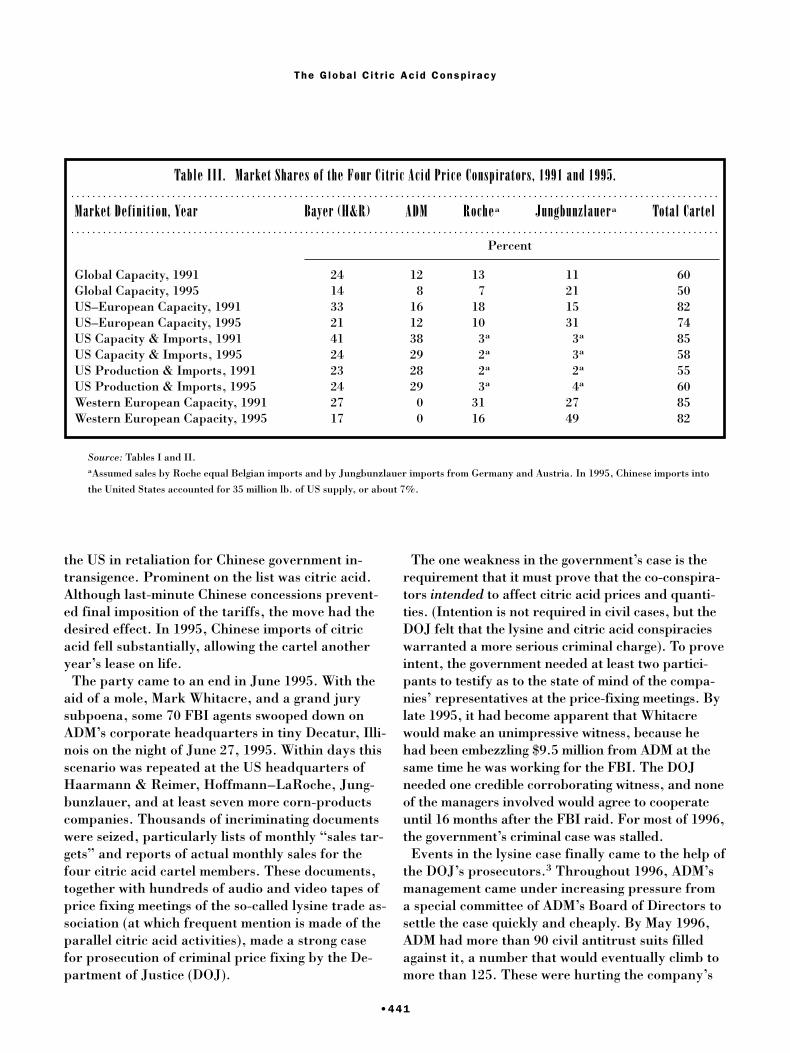
The effectiveness of the cartel is revealed by themembers’ steady production (sales) shares in theUS market (Table III). From 1991 to 1995, the fourco-conspirators’ shares varied little, each increas-ing by a percentage point or so. In the lysine case,the cartel adopted members’ shares just prior tothe cartel’s formation as a guideline to futureshares. While there are no sources confirming thisapproach in the citric acid case, the sales data arecertainly consistent with such a rule.
The citric acid cartel had to contend with a prob-lem the lysine group never had to worry about,namely uncontrollable US imports from Italy, Is-rael, and especially China. The large Chinese in-dustry was especially worrisome to the cartel be-cause of its historically wide price discounts andsubstantial production capacity. The higher cartel-induced US prices did indeed encourage increasedChinese imports. In 1988–1989, Chinese citric aciddelivered prices were 15 cents lower than domesticproducers’ list prices, but by 1994–1995 the gaphad doubled to 30 cents (35% lower). The chemicaltrade press began to contain numerous articlesabout rising Chinese citric imports—a 50% in-crease from 1992 to 1994.
The cartel’s solution to rising Chinese imports wasmasterful. One of the two US owned citric acidmanufacturers (probably ADM) lobbied the officeof the US Trade Representative, which was em-broiled at the time in a most contentious disputewith the Chinese on the issue of protection of intel-lectual property rights. The rumored lobbying didthe trick. On February 4, 1995 the US governmentannounced that it would be imposing prohibitivetariffs of 100% on $1.1 billion of Chinese exports to
Connor
•440
eUnder U.S. antitrust law in many federal court districts the active
participants in a price fixing conspiracy are liable for all the damages
to buyers who are over charged. By passively following increases in cit-
ric-acid prices, Cargill and all but two importers enjoyed excess monop-
oly profits during the conspiracy. However, the four conspirators may
be liable for the treble damages on both their own sales and the sales of
nonparticipants.
the US in retaliation for Chinese government in-transigence. Prominent on the list was citric acid.Although last-minute Chinese concessions prevent-ed final imposition of the tariffs, the move had thedesired effect. In 1995, Chinese imports of citricacid fell substantially, allowing the cartel anotheryear’s lease on life.
The party came to an end in June 1995. With theaid of a mole, Mark Whitacre, and a grand jurysubpoena, some 70 FBI agents swooped down onADM’s corporate headquarters in tiny Decatur, Illi-nois on the night of June 27, 1995. Within days thisscenario was repeated at the US headquarters ofHaarmann & Reimer, Hoffmann–LaRoche, Jung-bunzlauer, and at least seven more corn-productscompanies. Thousands of incriminating documentswere seized, particularly lists of monthly “sales tar-gets” and reports of actual monthly sales for thefour citric acid cartel members. These documents,together with hundreds of audio and video tapes ofprice fixing meetings of the so-called lysine trade as-sociation (at which frequent mention is made of theparallel citric acid activities), made a strong casefor prosecution of criminal price fixing by the De-partment of Justice (DOJ).
The one weakness in the government’s case is therequirement that it must prove that the co-conspira-tors intended to affect citric acid prices and quanti-ties. (Intention is not required in civil cases, but theDOJ felt that the lysine and citric acid conspiracieswarranted a more serious criminal charge). To proveintent, the government needed at least two partici-pants to testify as to the state of mind of the compa-nies’ representatives at the price-fixing meetings. Bylate 1995, it had become apparent that Whitacrewould make an unimpressive witness, because hehad been embezzling $9.5 million from ADM at thesame time he was working for the FBI. The DOJneeded one credible corroborating witness, and noneof the managers involved would agree to cooperateuntil 16 months after the FBI raid. For most of 1996,the government’s criminal case was stalled.
Events in the lysine case finally came to the help ofthe DOJ’s prosecutors.3 Throughout 1996, ADM’smanagement came under increasing pressure froma special committee of ADM’s Board of Directors tosettle the case quickly and cheaply. By May 1996,ADM had more than 90 civil antitrust suits filledagainst it, a number that would eventually climb tomore than 125. These were hurting the company’s
The G loba l C i t r ic Ac id Consp i racy
•441
Table III. Market Shares of the Four Citric Acid Price Conspirators, 1991 and 1995.
Market Definition, Year Bayer (H&R) ADM Rochea Jungbunzlauera Total Cartel
Percent
Global Capacity, 1991 24 12 13 11 60Global Capacity, 1995 14 8 7 21 50US–European Capacity, 1991 33 16 18 15 82US–European Capacity, 1995 21 12 10 31 74US Capacity & Imports, 1991 41 38 3a 3a 85US Capacity & Imports, 1995 24 29 2a 3a 58US Production & Imports, 1991 23 28 2a 2a 55US Production & Imports, 1995 24 29 3a 4a 60Western European Capacity, 1991 27 0 31 27 85Western European Capacity, 1995 17 0 16 49 82
Source: Tables I and II.aAssumed sales by Roche equal Belgian imports and by Jungbunzlauer imports from Germany and Austria. In 1995, Chinese imports into
the United States accounted for 35 million lb. of US supply, or about 7%.
stock value and perhaps some of its operations aswell. Dozens of similar suites were filled againstBayer, Roche, and Jungbunzlauer as well.
A shocking setback for ADM occurred on August27, 1996 when the three largest co-conspirators inthe lysine case agreed to cop a plea. In return forleniency in sentencing, the three companies admit-ted to criminal price fixing, three of their officerspled personally to criminal transgressions, and thethree companies promised to cooperate fully withthe DOJ in its investigation. Now, prosecutors hadall the witnesses they needed in the lysine case.
Criminal Antitrust Fines
Recognizing its precarious legal position, ADM toofinally agreed to plead guilty on October 15, 1996.In return for its cooperation in the citric acid andalleged corn sweeteners cases, ADM also was grant-ed great leniency in the assessment of its $30 milliondollar citric acid fine.f Except for two ADM officersstill facing trial (M. Andreas and T. Wilson), allother ADM officers were granted immunity and be-gan divulging details of the conspiracies to prosecu-tors. The key individual was Barrie Cox, ADM’svice president in charge of citric acid sales and op-erations. His information and pledges to testifyplaced unbearable pressures upon Bayer, Roche,and Jungbunzlauer to settle.
On January 29, 1997, Haarmann & Reimer, theNew Jersey-based subsidiary of Bayer, pleadedguilty to criminal price-fixing in the world citricacid market. Bayer agreed to pay a fine of $50 mil-lion to the US Treasury; although the second largestantitrust fine every paid, Bayer in fact paid lessthan its maximum exposure because it agreed toprovide evidence against Roche and Jungbunz-
lauer.g A DOJ press release characterized the citricacid conspiracy as “one of the largest, if not thelargest, conspiracies ever prosecuted by the De-partment of Justice.” Private antitrust lawyerscalled the new fine structures “a staggering develop-ment for business.”
In addition to the corporate fine, Hans Hartmann,a German citizen and senior executive of Haarmannand Reimer, was arraigned in US District Court inSan Francisco for criminal antitrust conspiracycharges. Hartmann had been an employee of Bayerfor more than 40 years and had served as vice pres-ident and president of H&R for more than adecade. He paid a fine of $150,000 in early 1997.(Ironically, it was Hartmann’s testimony later thatyear that exonerated Cargill from charges against itin the civil citric acid cases).
The final chapter in the criminal phase of the cit-ric acid cartel was closed on March 26, 1997. Thetwo largest US importers of citric acid,Hoffmann–LaRoche and Jungbunzlauer, pleadedguilty. Because they were the last to settle, they re-ceived the harshest fines relative to their size in theUS market, a total of $25 million. Two of their exec-utives pleaded guilty and were each fined $100,000.Clearly, Hartmann together with ADM’s TerranceWilson were the prime movers in the citric acid car-tel. The total corporate fines of $105 million in thecitric acid case were the largest ever assessed. To-gether with the earlier lysine fines of $92.5 million,this signals a new higher level of financial risk forantitrust felons.h
Estimating Overcharges
Calculating the size of monopoly overcharges re-quires accurate information on the size of the rele-
Connor
•442
fThis is why ADM was fined far more heavily for its lysine activities
($70 million) than for its citric acid activities ($30 million) even though
the latter conspiracy caused much more harm to buyers. In fact, DOJ
prosecutors testified in court that under the Federal Sentencing Guide-
lines the fine should have been between $112 and $224 million. In addi-
tion, ADM et al. were promised that the DOJ would cease investigating
potential price fixing in the huge $3 billion corn sweeteners market,
where private plaintiffs claim $1.6 billion in overcharges.
gThe largest antitrust fine ever was $70 million paid by ADM for its
lysine role; ADM also paid $30 million for its citric acid activities. The
$100 million total was nearly seven times the previous record fine and
ten times the so-called “statutory” maximum specified in the Sherman
Act. ADM was the second (Bayer the third) firm to pay a fine calculat-
ed under a relatively new felony sentencing rule based on “twice the
harm caused.”hThe lysine fines were lower because the market was smaller and the
percentage overcharge was lower.
vant market, the length of the conspiracy-effectsperiod, actual selling prices, and the price thatwould have reigned “but-for” the actions of theconspirators. These data are subject to estimationerrors. The two major sources of data on the size ofthe US citric (acid and salts) market are not per-fectly consistent. The last survey of the US interna-tional Trade Commission on the organic chemicalindustry reported that total 1994 sales of the threedomestic manufacturers were 312.3 million lb. thatgenerated f.o.b. manufacturers’ revenues of $251million.5 Net imports of citric products were 54.9million lb. worth $26.8 million at border prices($0.651/lb. for imports and $0.816/lb. for exports).Delivered prices for citric products would raise theprice of imports in the eastern United States to$0.81/lb,; moreover, delivery charges of aboutthree cents per pound for average truckload wouldraise the f.o.b. domestic price from $0.804 to about$0.834 (comfortingly close to the export borderprice).i Thus, the ITC data imply a US buyers’ pur-chase value of $215 million for domestic product(domestic production less export volume) and $89million for imported material or $304 million total.
On the other hand, 1994 consumption estimatesfrom seemingly reliable trade sources indicate amuch higher 440 million lb. level; using deliveredprices US buyers paid $350 million for citric acidand its salts. There being no way to reconcile thetwo sources, we can only present both figures as arange of probable sales. If the competitive price(marginal cost) was $0.60/lb., buyers paid $205 to$378 million in overcharges, or some 21 to 24% ofpurchase value (Table IV). The market size and thisestimated overcharge are both significantly largerthan the lysine case.3
Overcharge estimates are sensitive to a number ofassumptions, most notably the “but-for” price—themarket price that would have been observed hadthere been no cartel. Perhaps $0.60/lb. is too low abut-for price. For the seven months prior to thecartel’s formation, the contract prices for citric
acid ranged from $0.60 to $0.62/lb. Cargill’s newplant was already operating nearly at full capacity,so the period January–June 1991 seems like a rea-sonable one to choose for a pre-cartel equilibrium.However, about 18 months after the conspiracyended, spot transactions prices had drifted onlydown to $0.67 or $0.68/lb., so the post-cartel peri-od prices may hint that production costs had risenor that tacit collusion was being observed in 1997.6
Thus, the but-for price could have been $0.64/lb to$0.68/lb. At $0.68, the overcharges would be re-duced to a bit over half of the estimates made previ-ously (Table IV). Under an array of cost assump-tions, the citric overcharge estimates vary from$161 to $309 million, or 11% to 21% of purchasevalue. For lysine the range was $70 to $166 million,or 13% of sales.
The dates of the conspiracy are also crucial to de-termining the extent of overcharges imposed onbuyers of citric products. In ADM’s plea agreement(whose terms were negotiated with the DOJ prior tofiling with the Court in October 1996) the period isvaguely identified as commencing “at least as earlyas January 1993” and ending June 1995. This claimallowed ADM et al. to assert that the pre-conspira-cy price in December 1992 (hence, arguably thebut-for price) was $0.79/lb. With transaction pricesaveraging around $0.82/lb. and volume sold ofabout 1.3 billion lb., the cartel overcharge would beonly $39 million. Thus, ADM’s share of the market(30%) would imply that treble-damages liability of$35 million—which is exactly what ADM offered topay civil plaintiffs in September 1996! Because civilprocedures do not allow plaintiffs access to DOJfiles and the plea agreement is considered unim-peachable evidence, the members of the federalclass action suit (accounting for two-thirds of pur-chases) had little choice but to accept the settlementoffered by ADM et al.
Mark Whitacre has said that FBI tapes reveal thatin a 1992 Paris meeting of the “lysine association,”Terrance Wilson said that the citric acid conspiracyhad already been going on for some time. In fact,the DOJ indictments later (1997) filed againstADM’s three Swiss coconspirators, the beginningdate for the conspiracy is given to be July 1991.Moreover, it is likely that the price-fixing conspira-cy’s effects on the market lingered well beyond June
The G loba l C i t r ic Ac id Consp i racy
•443
iThe actual transaction prices for citric acid were revealed by the
four defendants to plaintiffs during the pretrial discovery phase. The
transactions prices shown in Figure 1 track the confidential defen-
dants’ prices very well.
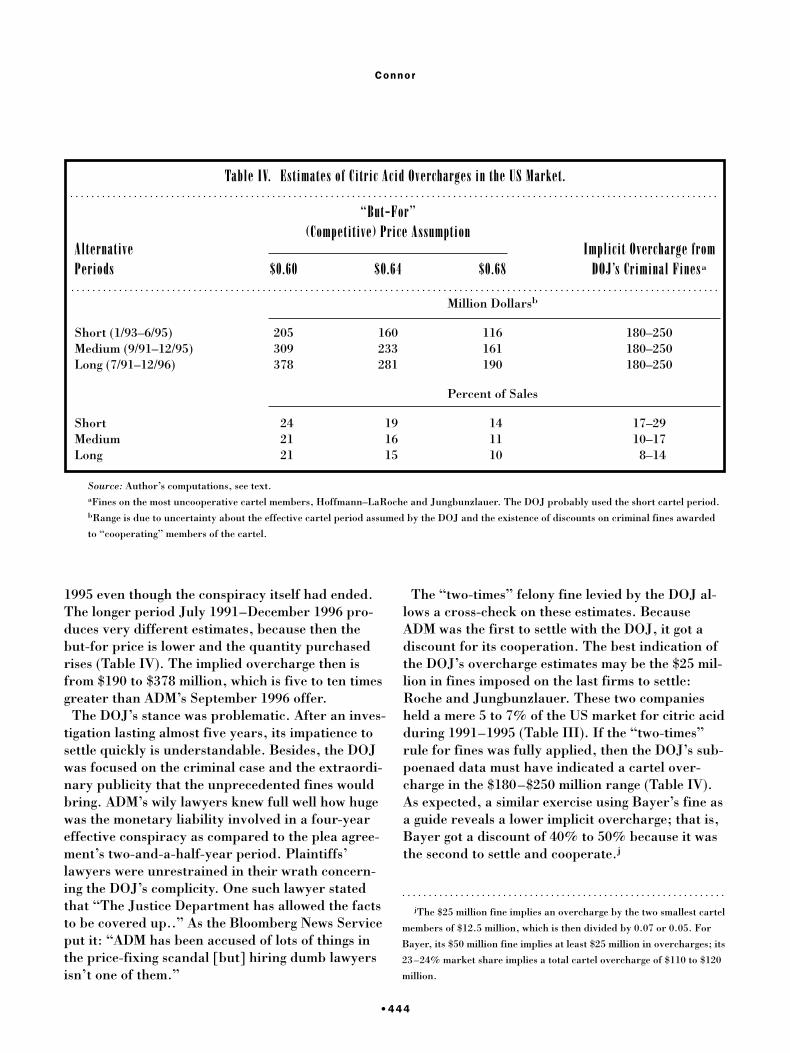
1995 even though the conspiracy itself had ended.The longer period July 1991–December 1996 pro-duces very different estimates, because then thebut-for price is lower and the quantity purchasedrises (Table IV). The implied overcharge then isfrom $190 to $378 million, which is five to ten timesgreater than ADM’s September 1996 offer.
The DOJ’s stance was problematic. After an inves-tigation lasting almost five years, its impatience tosettle quickly is understandable. Besides, the DOJwas focused on the criminal case and the extraordi-nary publicity that the unprecedented fines wouldbring. ADM’s wily lawyers knew full well how hugewas the monetary liability involved in a four-yeareffective conspiracy as compared to the plea agree-ment’s two-and-a-half-year period. Plaintiffs’lawyers were unrestrained in their wrath concern-ing the DOJ’s complicity. One such lawyer statedthat “The Justice Department has allowed the factsto be covered up..” As the Bloomberg News Serviceput it: “ADM has been accused of lots of things inthe price-fixing scandal [but] hiring dumb lawyersisn’t one of them.”
The “two-times” felony fine levied by the DOJ al-lows a cross-check on these estimates. BecauseADM was the first to settle with the DOJ, it got adiscount for its cooperation. The best indication ofthe DOJ’s overcharge estimates may be the $25 mil-lion in fines imposed on the last firms to settle:Roche and Jungbunzlauer. These two companiesheld a mere 5 to 7% of the US market for citric acidduring 1991–1995 (Table III). If the “two-times”rule for fines was fully applied, then the DOJ’s sub-poenaed data must have indicated a cartel over-charge in the $180–$250 million range (Table IV).As expected, a similar exercise using Bayer’s fine asa guide reveals a lower implicit overcharge; that is,Bayer got a discount of 40% to 50% because it wasthe second to settle and cooperate.j
Connor
•444
jThe $25 million fine implies an overcharge by the two smallest cartel
members of $12.5 million, which is then divided by 0.07 or 0.05. For
Bayer, its $50 million fine implies at least $25 million in overcharges; its
23–24% market share implies a total cartel overcharge of $110 to $120
million.
Table IV. Estimates of Citric Acid Overcharges in the US Market.
“But-For”
Alternative(Competitive) Price Assumption
Implicit Overcharge fromPeriods $0.60 $0.64 $0.68 DOJ’s Criminal Finesa
Million Dollarsb
Short (1/93–6/95) 205 160 116 180–250Medium (9/91–12/95) 309 233 161 180–250Long (7/91–12/96) 378 281 190 180–250
Percent of Sales
Short 24 19 14 17–29Medium 21 16 11 10–17Long 21 15 10 8–14
Source: Author’s computations, see text.aFines on the most uncooperative cartel members, Hoffmann–LaRoche and Jungbunzlauer. The DOJ probably used the short cartel period.bRange is due to uncertainty about the effective cartel period assumed by the DOJ and the existence of discounts on criminal fines awarded
to “cooperating” members of the cartel.
The Private Antitrust Settlements
These sorts of estimation exercises are essential tothe recovery of antitrust damages through civil suitsunder the Sherman and Clayton Acts. For civilsuits the burden of proof is on the plaintiffs who areentitled to “treble damages,” that is, triple the val-ue of the monopoly overcharges imposed on directbuyers (Connor 1997). Many hundreds of food,beverage, and chemical companies filed suitsagainst ADM et al. These suits were eventually con-solidated as “multi-district litigation” in US DistrictCourt in San Francisco in the summer of 1996.
ADM made the first move. Without admittingguilt, it offered $35 million to members of the classin October 1996. Later the same month, LaRoche,Jungbunzlauer, and Bayer offered $7.6, $5.7, and$46 million, respectively. The four offers were pro-portional to the companies’ market shares. Lawyersfor the plaintiffs claim that the appropriate over-charge damages were about $400 million, or trebledamages of $1,200 million (of which plaintiffs’lawyers will ask for 25% as fees). Obviously, the de-fendants’ offer of $94 million was a pittance com-pared to what the plaintiffs believed was fair. (Likethe lysine case, defendants were in a rush to settlethe civil case before the size of the criminal fineswas known.)
Plaintiffs are not required to remain in a class ifthey believe the compensation being offered is inad-equate. Indeed, five of the world’s largest buyers ofcitric acid did withdraw from the class. June 1997,Proctor & Gamble, Quaker Oats, Kraft Foods, andSchreiber Foods sued ADM et al. in a private (non-class) suit. In July 1997, the class-action suit’s over-seeing judge approved a slightly reduced, treble-damages amount of $86.2 million, even though thecriminal fines already announced by that time sug-gested far larger compensation ($540 to $750 mil-lion) ought to be paid.
The opt-out firms had their patience amply re-warded. In March 1998, because it is a public com-pany, ADM was forced to reveal that it paid four ofthe opt-out firms a whopping $36 million. Bayer,Roche, and Jungbunzlauer probably paid an addi-tiona $30–$35 million to the four. The four opt-outspurchased about one-third of all US citric acid,thus, their settlement ($68–$74 million) was from
two to three times more generous than what was re-ceived by the members of the federal class less thana year before.
While these settlements resolved the last remain-ing federal suits against the cartel in the UnitedStates, ADM et al. are not yet out of the woods.k Allfour coconspirators face additional government in-vestigations and prosecutions in Canada, Mexico,the European Union, and perhaps additional an-titrust jurisdictions (Connor 1988b). The Canadianfederal case is the most advanced, having been par-tially settled in May 1998.l
International Trade Effects
The operation of the lysine cartel caused strikingchanges in the size and pattern of US lysine exportsand imports.4 Soon after ADM built its huge US ly-sine plant, US exports of lysine jumped from thevirtually nil to about $100 million in 1992, the yearbefore the conspiracy took full effect. During theconspiracy period, exports were flat, but after theconspiracy ended exports shot up by 200% (1997compared to 1992–1995). Import volume was unaf-fected. Even more striking was the change in thepattern of destination countries: the export areas
The G loba l C i t r ic Ac id Consp i racy
•445
kSome state-level suits by indirect buyers of citric acid may still be
ongoing.lADM pleaded guilty to price fixing on exports of lysine and citric
acid to Canada during 1992–1995. The Federal Court of Canada, upon
the recommendation of the Federal Bureau of Competition, fined ADM
Can. $16 million (US $11.04); the fine was 6.4 times the previous
record fine paid in Canada (The Gazette (Montreal) May 28, 1998:E10)
The fine consisted of $9 million for price fixing alone, $5 million for ly-
sine, and $2 million for citric acid. During the conspiracy period total
lysine sales in Canada were $89 million (of which $48 million ADM’s
sales) and citric sales $105 million ($17.3 million ADM’s). The Bureau
of Competition is continuing its three-year investigation against three
other lysine and three citric acid companies with ADM’s cooperation.
On June 12, 1997 investigators for DG-4, the European Commis-
sion’s directorate for competition law, raided the European offices of
ADM and Kyowa Hakko and seized documents related to lysine and cit-
ric acid. The Commission said that Ajinomoto, one of the lysine con-
spirators, is cooperating. Under EU law, cooperating companies can
receive reduced fines. In both Canada and the EU, there were no leaks
of information (unlike the US), but one wonders why the EU was so
slow to react to events.
were clearly being allocated to individual membersof the cartel. Moreover, these territorial allocationswere accompanied by strong price discrimination.
Unlike the lysine cartel, the citric acid cartel didnot control world production. It did account for75% to 85% of sales in North America and WesternEurope, but outside these areas the cartel held lessthan half of consumption of citric acid. Thus, onewould expect trade effects to be quite different inthe citric products case than the lysine case, andthey were.
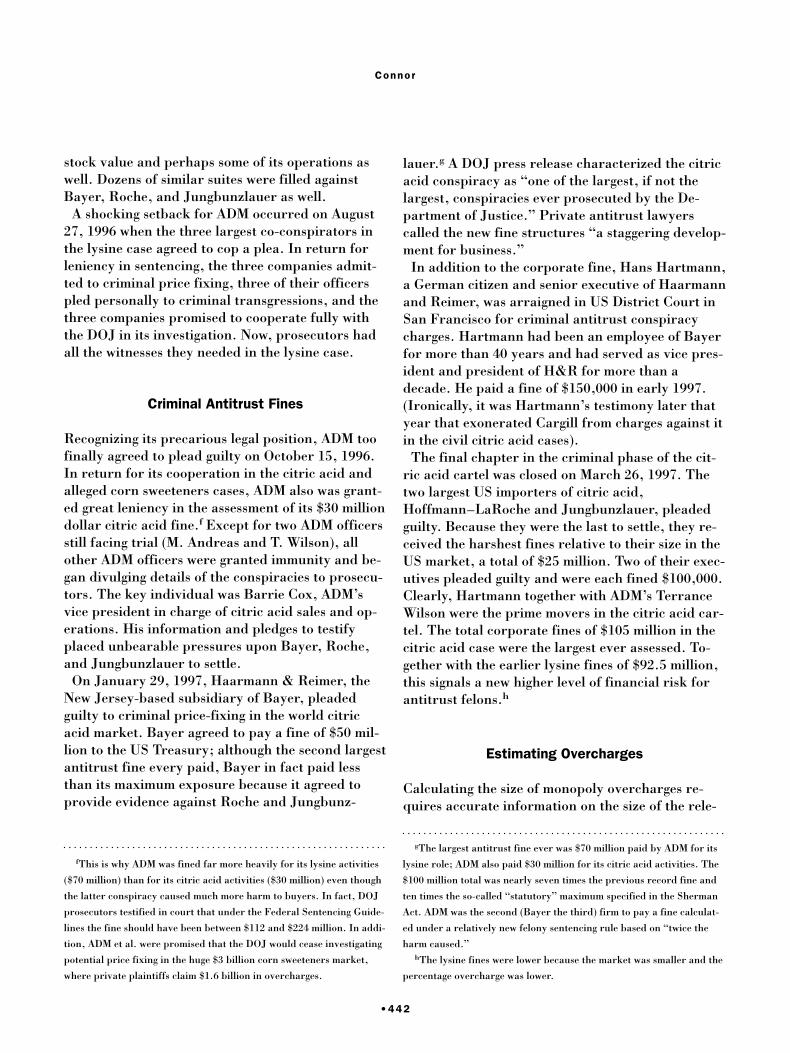
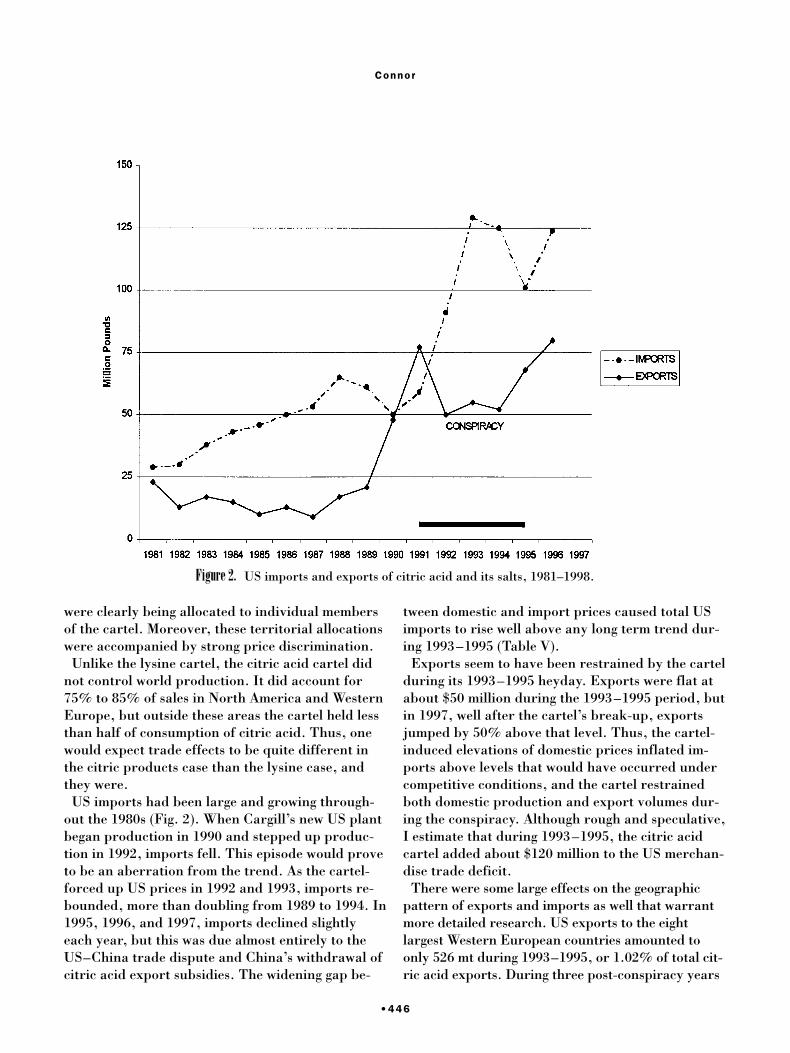
US imports had been large and growing through-out the 1980s (Fig. 2). When Cargill’s new US plantbegan production in 1990 and stepped up produc-tion in 1992, imports fell. This episode would proveto be an aberration from the trend. As the cartel-forced up US prices in 1992 and 1993, imports re-bounded, more than doubling from 1989 to 1994. In1995, 1996, and 1997, imports declined slightlyeach year, but this was due almost entirely to theUS–China trade dispute and China’s withdrawal ofcitric acid export subsidies. The widening gap be-
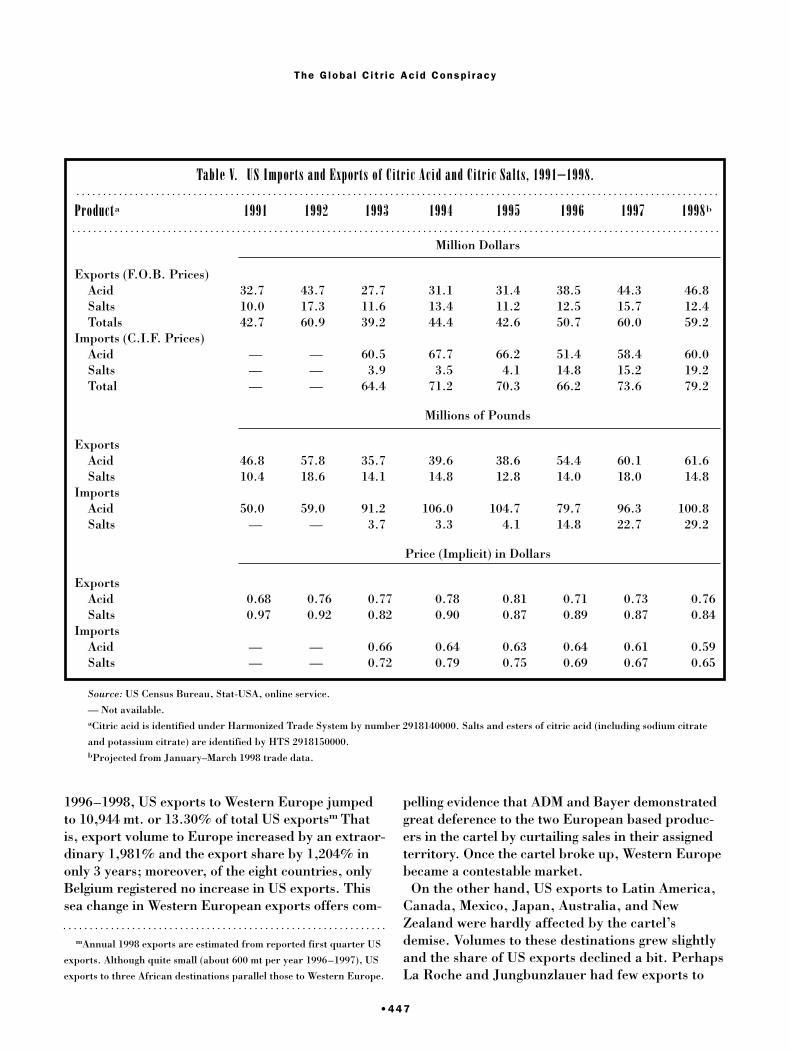
tween domestic and import prices caused total USimports to rise well above any long term trend dur-ing 1993–1995 (Table V).
Exports seem to have been restrained by the cartelduring its 1993–1995 heyday. Exports were flat atabout $50 million during the 1993–1995 period, butin 1997, well after the cartel’s break-up, exportsjumped by 50% above that level. Thus, the cartel-induced elevations of domestic prices inflated im-ports above levels that would have occurred undercompetitive conditions, and the cartel restrainedboth domestic production and export volumes dur-ing the conspiracy. Although rough and speculative,I estimate that during 1993–1995, the citric acidcartel added about $120 million to the US merchan-dise trade deficit.
There were some large effects on the geographicpattern of exports and imports as well that warrantmore detailed research. US exports to the eightlargest Western European countries amounted toonly 526 mt during 1993–1995, or 1.02% of total cit-ric acid exports. During three post-conspiracy years
Connor
•446
Figure 2. US imports and exports of citric acid and its salts, 1981–1998.
1996–1998, US exports to Western Europe jumpedto 10,944 mt. or 13.30% of total US exportsm Thatis, export volume to Europe increased by an extraor-dinary 1,981% and the export share by 1,204% inonly 3 years; moreover, of the eight countries, onlyBelgium registered no increase in US exports. Thissea change in Western European exports offers com-
pelling evidence that ADM and Bayer demonstratedgreat deference to the two European based produc-ers in the cartel by curtailing sales in their assignedterritory. Once the cartel broke up, Western Europebecame a contestable market.
On the other hand, US exports to Latin America,Canada, Mexico, Japan, Australia, and NewZealand were hardly affected by the cartel’sdemise. Volumes to these destinations grew slightlyand the share of US exports declined a bit. PerhapsLa Roche and Jungbunzlauer had few exports to
The G loba l C i t r ic Ac id Consp i racy
•447
mAnnual 1998 exports are estimated from reported first quarter US
exports. Although quite small (about 600 mt per year 1996–1997), US
exports to three African destinations parallel those to Western Europe.
Table V. US Imports and Exports of Citric Acid and Citric Salts, 1991–1998.
Producta 1991 1992 1993 1994 1995 1996 1997 1998b
Million Dollars
Exports (F.O.B. Prices)Acid 32.7 43.7 27.7 31.1 31.4 38.5 44.3 46.8Salts 10.0 17.3 11.6 13.4 11.2 12.5 15.7 12.4Totals 42.7 60.9 39.2 44.4 42.6 50.7 60.0 59.2
Imports (C.I.F. Prices)Acid — — 60.5 67.7 66.2 51.4 58.4 60.0Salts — — 3.9 3.5 4.1 14.8 15.2 19.2Total — — 64.4 71.2 70.3 66.2 73.6 79.2
Millions of Pounds
ExportsAcid 46.8 57.8 35.7 39.6 38.6 54.4 60.1 61.6Salts 10.4 18.6 14.1 14.8 12.8 14.0 18.0 14.8
ImportsAcid 50.0 59.0 91.2 106.0 104.7 79.7 96.3 100.8Salts — — 3.7 3.3 4.1 14.8 22.7 29.2
Price (Implicit) in Dollars
ExportsAcid 0.68 0.76 0.77 0.78 0.81 0.71 0.73 0.76Salts 0.97 0.92 0.82 0.90 0.87 0.89 0.87 0.84
ImportsAcid — — 0.66 0.64 0.63 0.64 0.61 0.59Salts — — 0.72 0.79 0.75 0.69 0.67 0.65
Source: US Census Bureau, Stat-USA, online service.
— Not available.aCitric acid is identified under Harmonized Trade System by number 2918140000. Salts and esters of citric acid (including sodium citrate
and potassium citrate) are identified by HTS 2918150000.bProjected from January–March 1998 trade data.
these countries prior to the cartel’s formation (sotheir reduction in exports during the conspiracywould not noticeably affect US exports), or perhapsthe citric acid cartel held little sway outside NorthAmerica and Europe.
Whether the cartel took further advantage of itsmarket power by pricing discriminately across ex-port destinations is not clear in the citric acid case.During the conspiracy years 1992–1995 average USexport prices were $0.77, $0.78, and $0.81/lb. forcitric acid. Exports to Canada, which absorbed39% to 56% of all such exports, were priced at orbelow the average price (as much as 9% below in1995), a pattern that continues after the cartel’sdemise. As these are border prices and the Canadi-an border was closer to the centroid of US produc-tion that the average ocean port, the two- to four-cent discount on Canadian export may well beexplained by transportation costs. Ignoring verysmall shipments (less than 10 mt p.a.), US exportsto Western Europe were priced very high by thecartel (and by “nonmember” Cargill), about$1.35/lb. or almost double the average price. Afterthe cartel disbanded in 1996–1997, the averageprice to Western European destinations was muchless, $0.86/lb., but still higher than the averageglobal export price of $0.72/lb. Although these av-erages support the idea of price discrimination be-tween Canada and Western Europe, the practicewas not uniform across European destinations. Ex-ports to Mexico, Australia, and New Zealand (alllarge customers) followed the low-priced Canadianpattern, whereas exports to most Latin Americandestinations resemble the Western European (veryhigh to slightly high) pattern of prices. What isclear is that the variation in export prices across ex-port destinations was much less after the cartel’sbreak-up than during the conspiracy period. This isnot, of course, proof of price discrimination, but itis highly suggestive of geographic third-degree pricediscrimination, for which market power is a neces-sary condition.
Corporate Restructuring
As a publicly traded company, ADM is required toreport material developments to its stockholders.
The fallout from the lysine and citric acid conspira-cies has been considerable for ADM’s managementand strategic direction.3,4
After 30 years at the helm, it is difficult to disen-tangle Dwayne Andreas’ managerial style fromADM’s management practices. ADM has a very flatmanagement structure for implementing major de-cisions. The chairman and CEO D. Andreas was thestrategist, visionary, and foreign minister in chargeof building networks business and political favors.ADM President Randall was in charge of manufac-turing operations and investments. Executive VPM. Andreas was in day-to-day charge of everythingelse. These three, together with the president of theappropriate division (T. Wilson for corn products)would make any and all decisions involving morethan a few million dollars. No committees or long-term study groups were generally used. Decisionswere made informally and with no memos. ADMdidn’t believe in having extensive R&D or in-houseexperts; technology was licensed or purchased andconsultants were hired short term as necessary.Vice Presidents like Whitacre had extraordinarymanagerial discretion.
Dwayne Andreas created a tight network of loyalfriends, relatives, mentors, and sycophants that ce-mented his near total control over the company. Heextended this notion to the large, old, well paidBoard of Directors. Prior to the FBI raid, no Boardmembers were thoroughly independent of Andreasor ADM. Suppliers and rivals were enticed intocozy joint ventures. Only customers were seen asexploitable. The company was well known for itstendency to employ “rough tactics.”
Andreas and ADM worked hard at developing ex-ternal networks to support the company’s objec-tives. ADM was an influential member of severalfarm, trade, and lobbying groups. Andreas culti-vated politicians of every stripe through favors toonumerous to mention. ADM sponsors the four polit-ical discussion programs most often watched by thenation’s political elite. Andreas was the most promi-nent icon of Western capitalism in the former SovietUnion. ADM profited more than any other agribusi-ness firm from regulatory interventions in its mar-kets.
ADM has suffered significantly from its convic-tions as a corporate criminal. I estimate that the fi-
Connor
•448
nancial costs alone (fines, settlements, fees) are ap-proaching $350 million. These antitrust expensesaccounted for 70% to 80% of ADM’s after-tax prof-it declines in both FY 1996 and FY 1997. Whilemore antitrust costs are yet to be imposed by theEuropean Commission, they are nothing close to the$2.4 billion loss in stock-market value that the com-pany suffered in the days after the FBI raid. As ifto prove that it is alive and kicking, the new CEO,G. Allan Andreas, has launched a series of spectac-ular acquisitions.
Did the benefits from collusion possibly outweighthe financial costs? Using the upper-end estimatesof cartel-generated profits for lysine ($160 million)and citric acid ($380 million), and applying ADM’smarket shares to those extraordinary profits (50%and 30%, respectively), ADM’s monopoly profits inits US markets were as high as $164 million. Socosts are about double the largest likely US bene-fits. (In legal theory, the cost/benefit ratio shouldbe 5.0.) However, much of ADM’s lysine was soldabroad, some in markets where no antitrust sanc-tions likely to be applied. The international bene-fits may well outweigh ADM’s costs.
The major impacts are in ADM’s managementstructure and reputation. The company has lostseveral capable, if unscrupulous, managers. Since1995, top management has been greatly distractedby legal actions, and this will continue for someyears. Dwayne Andreas, though stripped of his offi-cial titles, still influences ADM’s decisions throughthe remaining pieces of his family-and-friends net-work. The Board, though largely reconstituted, stilldoes not have a majority that is independent ofmanagement. Customers and suppliers have a morenegative view of ADM’s corporate mentality andethics.
Industry Restructuring
Before the new Cargill plant came on stream in mid1990, the two US manufacturers (Pfizer andBayer/H & R) made citric acid from purchaseddextrose or glucose. Cargill’s Eddyville, Iowa plantwas the first to be able to pipe in liquid feedstockdirectly to its citric acid facility. The principal Eu-ropean manufacturers, Roche and Jungbunzlauer
also had plants that were backward-integrated. It islikely that integrated production providedeconomies that reduced costs of production by 5 or10% over the traditional system. Moreover, Pfizerand Bayer/H & R had to buy feedstock from ahighly concentrated US corn refining industry thatmay have been able to raise glucose or dextroseprices from time to time.
When Cargill stepped up its production in late1990 and early 1991, it sent a clear signal to its USrivals when it cut prices by more than 30% that itwas now the low-cost producer of citric acid. Thislesson was not lost on archenemy ADM. Instead ofbuilding a new citric acid facility in Decatur, as ithad announced in early 1990, ADM decided to buyPfizer’s most modern plant and the technologicalexpertise along with it in August 1990. Buyingrather than building saved ADM as much as 3-year’s delay, though it spent a year or 2 moderniz-ing and expanding the North Carolina plant. Thisplant was the largest in the world when brought onstream and is still the largest in North America.James Randall, President of ADM, had a long-standing reputation for building the biggest plantspossible, not only for efficiency reasons, but also todiscourage potential entrants through the creationof excess capacity.
Thus, during the conspiracy period 1992–1995,only Bayer’s Haarmann & Reimer subsidiary wasmanufacturing citric acid from purchased feedstock(supplied by A.E. Staley). That, and the fact thatits Elkhart, Indiana plant was small and quite oldput H&R at a distinct cost disadvantage. In light ofthe fines imposed on Bayer and H&R’s Hans Hart-mann in 1996, it requires no great leap of the imagi-nation to surmise that Hartmann initiated the con-spiracy, with ADM’s Terrance Wilson an eagerpartner. Hartmann, a German businessman withlong experience in European chemical industries,was ideally positioned to approach the big citricacid manufacturers in Vienna and Basel aboutforming a cartel. Bayer was the only manufacturerwith citric plants in both the United States and Eu-rope. H&R’s high costs may have been the proxi-mate cause of the cartel’s formation.
The huge costs of the antitrust cases and the dimprospects for cost competitiveness in the US marketmade Bayer decide to sell its citric acid business. In
The G loba l C i t r ic Ac id Consp i racy
•449
June 1997, 2 years after the FBI raid, Bayer publi-cally offered its worldwide citric acid business forsale. The assets included three US plants (Elkhart,IN; Dayton, OH; and Duluth, MN), one plant inSelby, UK, one wholly-owned plant in Brazil (Mer-cocitrico Fermentacos, SA), and two majority-owned subsidiaries in Mexico (Mexama, SA) andColumbia (Sucromiles, SA). These plants employed1,310 people and had global sales of $293 million in1996. The vast majority of these sales were citricproducts, but a few other food ingredients were in-cluded.
In May 1998, Bayer announced the impending saleof these assets to the huge UK sweeteners firm Tate& Lyle. Tate & Lyle paid only $219 million for sixplants whose book value was $203 million (theElkhart, IN plant was not sold and will be de-stroyed). Why so little for the only citric acid busi-ness that spans more than two continents and thathas a 20% global market share? The UK operationhas a monopoly in the British Isles and is an inte-grated (beet molasses-dextrose) operation, but it isan old plant at about half the optimal size. Thethree Latin American plants will give Tate & Lyle adominant share of that continent’s market for citricacid, but Cargill is building a new, state-of-the-artplant in Brazil that will come on stream in 1999.While those operations are likely to be profitable,the US business is in pretty bad shape. Bayer’sbusiness grew only 1.7% in dollar terms from 1996to 1997, and 1997 pre-tax profits were a mere 2.8%of sales. Nevertheless, Tate & Lyle was the most log-ical buyer because it owns A.E. Staley, the second-ranking US corn refiner. Staley, it will be recalled,supplied Bayer’s US citric operations with theirfeedstock. Moreover, Staley has some experience incitric acid technology through a joint venture withBharat Sugar in India.
Thus, the 1990s has witnessed a complete make-over of the structure of ownership and productionin the US citric acid market. In 1990, the US indus-try was a duopoly, with each company operatingtwo nonintegrated plants of exactly the same size.Pfizer and Bayer each held 40% of the market.
Then, Cargill shook things up with a modern newintegrated plant that quickly reached productioncapacity through low-ball pricing—briefly. ADMtrumped Cargill with a bigger plant, but took a
much more “cooperative” stance in pricing that by1992 turned into a full-blown cartel. The cartel wasonly a brief reprieve for Haarmann & Reimer’s in-ability to compete in the US market, and the car-tel’s unmasking turned it into a debacle. The acqui-sition of H&R’s citric acid assets by Tate &Lyle/A.E. Staley completes the industry’s transfor-mation. The old duopoly of Pfizer and Bayer hasexited, to be replaced by the three leading US cornrefiners: ADM, Cargill, and Staley. Each of thesecorn biotech firms is well positioned to apply themost efficient forms of logistics and fermentationtechnology to citric acid production and marketing.The new triopoly will likely co-exist comfortablywith one another in the citric acid industry, just asthey have done in so many other industries wherethey meet as rivals.
The only optimistic development is the possibilityof increased import competition from China, In-donesia, India and other Asian nations with amplesources of low-cost starch or sugar-industrybyproducts. In the last few years, China’s citricacid producers have been making great strides inmodernizing production. A decade ago, the largestChinese citric plant had a mere 4 million pounds ca-pacity. In the last few years, frequent announce-ments of new joint ventures with capable French,Austrian and Japanese chemical companies haveconfirmed the building of high-tech plants with 22to 44 million-pound capacities. New filtering equip-ment will ensure food-grade citric acid for export tothe most advanced countries. Staley’s new jointventure in India also plans large exports. The1997–1998 Asian currency crises may spur addi-tional exports of favorably priced citric products.
Conclusions
ADM was at the center of at least two concurrentinternational price-fixing conspiracies that hadhuge, and in some ways unprecedented, economicand legal consequences. The present case studydelved deeply into the details of the four-companycitric acid cartel, but the citric acid case reinforcesthe principal conclusions reached from the five-company global lysine story.3,4 There are seven ma-jor conclusions.
Connor
•450
First, the international cartels were able to beformed and to operate undetected for three or fouryears because they were leading firms in highly con-centrated, homogenous-product oligopolies withsubstantial entry barriers into the relevant mar-kets. The lysine cartel controlled more than 95% ofglobal production, and the citric acid cartel ac-counted for 55% to 85% of sales in each of the rele-vant markets (No. America and W. Europe). De-spite the failure of the citric acid cartel to securethe active participation of the newest US manufac-turer, Cargill’s passive or tacit cooperation con-tributed to the cartel’s ability to sustain monopolis-tic US prices. Overcharges imposed on US buyersof lysine and citric acid were at least $116 millionbut could have reached as high as $378 million.Market structure matters.
Second, the effectiveness of the two cartels cameabout in spite of significant differences in geograph-ic location and business cultures. Bayer’s US sub-sidiary doubtless smoothed such differences whenforming the citric acid cartel, but in the lysine casecompanies producing in the United States, France,Italy, Mexico, Japan, Korea, and Indonesia wereapparently able to develop harmonious working re-lationships. Geographic/cultural propinquity maywell facilitate joint profit maximization, but itshould not be regarded as a necessary condition.
Third, corporate restructuring was extensive forADM, the one company among the four co-conspir-ators that must reveal such changes. Two able exec-utives left the company, and two more (D. and M.Andreas) were officially stripped of their duties.ADM’s Board of Directors, once the tool of its pow-erful chairman, now includes at least a few inde-pendent or “outside” directors, but not a majorityas ADM’s major institutional investors have de-manded. Yet, Dwayne Andreas, 80, continues towield an unknown degree of influence on the com-pany’s decisions through his nephew (now CEO)and cronies on the Board. My view is that ADM isat most chastened, not in any sense reformed.Moreover, there is precious little evidence of signifi-cant organizational changes in any of the other sev-en members of the two cartels. Except for Bayer’sexit from citric acid production, industry struc-tures remain much the same today as they were in1992–1995.
Fourth, the private interests of ADM et al. werewell served by their top-flight legal advisors. Giventhe government’s vast storehouse of taped and writ-ten evidence and the prisoners’ dilemma faced by thedefendants, their lawyers’ delays, attacks againstWhitacre’s credibility, and swift settlement of thecivil suits were very effective in minimizing civil dam-ages. Even after ADM’s position became untenablewhen three of the lysine co-conspirators agreed tocop a plea, the cartels’ civil settlements in US courtsamounted to only an estimated $300 million, whereastheir treble-damages liability was at least $450 mil-lion and possibly as high as $1.1 billion.4,n
Fifth, despite some reservations about the way theFBI handled the investigations, the DOJ’s criminalprosecutions were a public relations victory thatwill do much to restore the Department’s reputationfor effective enforcement of price-fixing laws in thecontext of international conspiracies. The imposi-tion of $199 million in criminal fines on eight com-panies ($100 million on ADM alone) and nine topexecutives of those companies together with the at-tendant publicity ought to generate a long-lastingdeterrence effect. Equally important was the newrule applied to ADM and all its citric acid co-con-spirators in calculating the corporate fines; the“two-times the harm caused” rule for felonies givesthe DOJ an important new weapon in large an-titrust cases. Prosecution of these cartels has alert-ed the DOJ and FTC to the existence of many otherinternational commodity cartels, of which guiltypleas and fines were announced in four cases re-cently (sodium gloconate, graphite electrodes, andtwo marine services). However, by focusing almostexclusively on the criminal sanctions for the twocartels, the DOJ may have short changed the pri-vate parties that sought treble damages.
Sixth, private plaintiffs in Sherman Act suits beara heavy evidentiary burden of proof. Congress in-tended that evidence gathered in criminal proceed-ings should be used as evidence in follow-up civilsuits, but the plea agreements negotiated by theDOJ with ADM et al. gave precious little guidanceto civil litigants. The agreements were vague on the
The G loba l C i t r ic Ac id Consp i racy
•451
nI exclude the civil damages paid to shareholders for mismanagement
and failure to divulge material information, which cost ADM $38 mil-
lion.
sizes of the markets, the length of the conspiracies,and the overcharges. Moreover, the size of the“two-times” felony fines that ought to have provid-ed needed information on what private plaintiffsshould demand for compensation in fact masked thedefendants’ true liabilities because of “discounts”given to cooperating companies.
It is clear that direct buyers of lysine and citricacid settled for pennies on the dollar, only 20 to50% of the maximum amount allowed by the Sher-man Act. Because ADM had to reveal the amountsit paid to buyers of citric acid that opted out of thefederal class action suit, we know that these big, pa-tient buyers received from two to three times moredamages (per dollar of acid purchased) than did themembers of the federal class. The fact that lysineand citric acid buyers received settlements totalingabout $245 million sounds impressive (this was thefourth largest nominal amount in history), but inreality ought to have been two to five times more.The putative harshness of the public penalties net-ted out to ADM et al. was overcompensated by thesoftness of the private penalties.
Seventh, the criminal trail that began July 9, 1998in Chicago, Illinois against three former officers ofADM may reveal even more, but much is known al-ready about the fascinating international dimen-sions of the two cartels. Given the high profits thatwere generated, it is impressive how such smallnumbers of managers (a dozen or fewer) meeting a
few times each year could pull off complex alloca-tions of outputs and prices for several large geo-graphic markets around the world. In lysine espe-cially, profits were boosted by finely tunedsecond-or third-degree price discrimination in ex-port markets. In citric acid, the cartel operated de-spite the nonparticipation of one large US producerand substantial US imports from Asia.
Former cartel members are scrambling to cooper-ate with non-US antitrust agencies (ADM in Cana-da, Ajinomoto in EU). However, so far only Cana-da, Mexico, and EU authorities are belatedlyinvestigating the cartels’ activities. It seems thatbuyers outside North American and Western Eu-rope will receive little judicial relief, even thoughmost countries have formal antitrust laws.7 Sharingof information on international cartels among na-tional antitrust agencies has begun only recently,but this is merely a small first step in the type offull-scale cooperation that will be needed to prose-cute such crimes effectively.
Disclaimer
The author has not worked for any party in citricacid litigation. All facts are taken from publicsources. All opinions are the author’s and not neces-sarily those of any party or their lawyers involved inthe legal proceedings described above.
Connor
•452
References
1. Azzedine Azzam and Dale Anderson, Assessing Competitionin Meat Packing: Economic History, Theory, and Evidence,GIPSA-RR 96-6, Grain Inspection, Packers and StockyardsAdministration, USDA, Washington, DC, May 1996.
2. John Sutton, Sunk Costs and Market Structure. MIT Press,Cambridge, MA, 1991.
3. John M. Connor, “The Global Lysine Price-Fixing Conspir-acy of 1992–1995,”Review of Agricultural Economics, 19,158 (1997).
4. John M. Connor, Archer Daniels Midland: Price Fixer tothe World (3rd ed.), Staff Paper 98-10. Department of Agri-cultural Economics, West Lafayette, IN, Purdue University,May, 1998.
5. USITC. Synthetic Organic Chemicals, United States Pro-duction and Sales, 1994, U.S. International Trade Commis-sion, Washington, DC, 1996.
6. John M. Connor, What Can We Learn from the ADM GlobalPrice Conspiracies? Staff Paper 98-14, Department of Agri-cultural Economics, Purdue University, West Lafayette, IN,August, 1998.
7. John M. Connor, “International Convergence of AntitrustLaws and Enforcement,” Review of Antitrust Law and Eco-nomics 28, 17 (1997).