Embed Size (px)
Citation preview
Vol. 265, No, 33, Issue of November 25, pp. 20321-20334,199O Printed in CJ S. A.
The Gibbs-Donnan Near-equilibrium System of Heart* (Received for publication, July 20, 1990)
Takashi Masuda, Geoffrey P. Dobson, and Richard L. Veech From the Laboratoty of Metabolism and Molecular Biology, National Znstitute on Alcohol Abuse and Alcoholism, Rockvile, Marylund 20850
The gradients of the major inorganic ions across the plasma membrane of heart were examined to determine the factors controlling the extent and direction of the changes induced during injury, certain diseases, and electrolyte disturbances. The ionic environment was altered by changing only the concentration of inorganic phosphate, [ZPi]o, from 0 to 1.2 to 5 mM in the Krebs-Henseleit buffer perfusing working rat hearts. Raising [XPi]o from 1.2 to 5 mM resulted in a decrease in total Mg2+ content and calculated free cytosolic [Mg2+] from 0.44 to 0.04 mM, conversion of 4 mmol of MgATP2- to ATP4- and a decrease in measured intracellular [Cl-Ii from 41 to 16 mM. At all levels of [XP&, both the [Na+lj and [K+]i were invariant at about 3 mM and 130 mM, respectively, as was the energy of hydrolysis of the terminal phosphate bond of XATP, AGATpa,.dr, of -13.2 kcal/mol.
The relationship maintained between the ions on both sides of the plasma membrane by the 3Na+/2K+-transporting ATPase (EC 3.6.1.37) and an open K+ channel was:
The energy of the gradients of the other inorganic ions across the plasma membrane, AG[ionlO,i, exhibited three distinctive quanta of energy derived from the prime quantum of AGAT~H~~~ of -13.2 kcal/mol. The second quantum was about one-third of AGATp~,+ or k4.4 kcal/mol and comprised the AG[Na+]+ AG[Mg2+]o,i, and AG[HPOz-lo/i. These results indicated near-equilibrium was achieved by the reactants of the 3Na+/2K+-ATPase, the K+ channel, the Na+-Pi co-transporter, and a postulated net M8+/H2PO; exchanger. The third quantum was one-third of AG[Na+J.,,i or about 21.5 kcal/mol and comprised AG[H+]o/i, AG[HCOg]o/i, and AG[Cl-]o,i. The AG[K+]o/i was 0, indicating near-equilibrium between the chemical energy of [K+]o/i and the E across the plasma membrane of -83 mV.
It is concluded that the gradients of the major inorganic ions across the plasma membrane and the potential across that membrane constitute a Gibbs-Donnan equilibrium system catalyzed by transport enzymes sharing common substrates. The chemical and electrical energies of those gradients are equal in magnitude and opposite in sign to the chemical energy of ATP hydrolysis.
The presence of ionic gradients between an extracellular and an electronegative intracellular phase separated by a selectively permeable membrane is characteristic of the stable, self-regulating state of living cells (1). The energy to establish these gradients, RT ln [ion],J[ion];, is derived from cellular metabolic processes (2). Changing the ionic composition of the external fluid, or damage of tissue by almost any means, results in a stereotypic increase in intracellular [Na+]; (3), loss of intracellular [K+];, increase in intracellular [Cl-];, and swelling of cells (4). Even though the various inorganic ions share common electroneutral intracellular and extracellular fluid phases and a common potential across the plasma mem- brane, the extent and direction of the individual inorganic ion gradients across that membrane differ wideIy. These differ- ences in gradients of inorganic ions may arise from: the coupling of transport to the AG of ATP hydrolysis, the co- transport with another ion whose gradient possesses a differ- ent -AG; exchange with another ion of similar charge and energy; or the singular movement of an ion through an open transmembrane protein channel powered by the E between
* The costs of publication of this article were defrayed in part by the payment of page charges. This article must therefore be hereby marked “adwr~~ernen~” in accordance with 18 USC. Section 1734 solely to indicate this fact.
the intra- and extracellular compartment. The transport of ions between the two aqueous phases is accomplished by proteins with lipophilic domains which form aqueous channels across the lipid plasma membrane and catalyze reactions of four general types.
Trunqort ATPo.ses-These utilize the chemical energy of the hydrolysis of the terminal phosphate of ATP, AGAT~~~~~ of about -13 kcal/mol (5) to move cations across cell mem- branes against their electrochemical gradients. The classic example of this type is the 3N$/2KT-ATPase (6, 7) which catalyzes the movement of 3Na+i-0 while simultaneously moving 2K+0- j in an osmotically and electrically unbalanced “electrogenic” reaction. In the absence of a change of volume or E, such a reaction must be coupled to the movement of another ion to maintain electrical and osmotic neutrality in the two aqueous phases separated by the plasma membrane (8). Differing views have been expressed as to whether the full energy of the hydrolysis of ATP is or is not expressed in the [Na+loll gradient (g-11).
Co-transporters-These utilize the energy of one ionic con- centration gradient across cell membranes, usually RT ln [Na+lO,,, to transport either another ion with the charge of an opposite sign or an uncharged molecule like glucose across the membrane. Examples of this type of reaction in plasma
20321
by guest on May 29, 2018
http://ww
w.jbc.org/
Dow
nloaded from
20322 AG of ATP Hydrolysis and Ion Gradients
membranes are the Na+-glucose or Na+-amino acid co-trans- porters (12). Of particular interest here is the 14%kDa (13) Na+-Pi co-transporter which moves H2PO; and/or HPO:- into heart (14) and most other cells (15) against its electro- chemical gradient. Neither the ionic species of Pi transported nor the stoichiometry of Na’ and H’ involved in the trans- location is yet known (16).
Exchangers-They transfer ions with charge of the same sign across the membrane in exchange for another ion with the same sign. Examples of this type of reaction in plasma membranes are the Na+/H+ exchanger, the 3Na+/Ca2+ ex- changer (17), or the Cl-/nonspecific anion- exchanger. The latter enzyme is a dimer or tetramer of 95 kDa with a trans- membrane hydrophilic domain traversing the membrane mul- tiple times with high activity in red cell (18) and heart (19). It catalyzes the electroneutral exchange of Cl- for a variety of anions such as HCO, or H,PO;.
Zen Channels-These are proteinaceous “pores” traversing the lipid of the plasma membrane which differ from trans- porters mainly by having a more rapid rate of the catalysis of ion transfer of up to lo6 ions/s/channel and no fixed stoichi- ometry of linked substrates transferring energy to the reac- tants other than the electrochemical potential across the membrane of the ion itself. They include the voltage-sensitive Na+ (20) and K’ channels (21) of excitable tissues, Ca2+ channels (22) in excitable and hormone-responsive tissues, and Cl- channels (23-25). Channels have in common the ability to allow ions of a certain charge and size, with greater or lesser specificity (26) to move electrophoretically across the plasma membrane, driven by the electrochemical potential of the ion alone.
Except during an action potential, or when the cell is changing volume, the extent and direction of the ionic gra- dients across plasma membrane resulting from all these varied enzyme transport processes must accommodate themselves to a common intra- and extracellular environment and common cellular energies. This energy, AC, is comprised of: 1) a concentration term made up of the difference between the ionic concentrations in the extracellular fluid and the cytosol facing the plasma membrane, RT In [ion],,,, of the ion trans- ported, and those of its linked transport co-factors; 2) the potential, E, between the outer and intracellular water; 3) the energy of AG of [ ZADP] [ ZPi]/[ ZATP] in cytosol; 4) a stoi- chiometry of net transport reactions which maintain electrical and osmotic neutrality in the system containing impermeant charged ions in both aqueous phases; so that 5) the activity of the free water on both sides of the plasma membrane remains equal and the net pressure, r, between phases re- mains 0.
Changes in cell volume and ion content accompany changes in cellular energy status during many types of injury (2-4, 8, 27). The energy of cellular oxidative metabolism is derived from the conversion of NADH to Hz0 and principally con- served in the energy of the terminal phosphate bond of ATP. The AGATpHydr is generally agreed to be in the range of -12 to -13 kcal/mol in most tissues, based on enzymatic meas- urement of the concentration of metabolites (5) involved in the near-equilibrium reactions catalyzed by glyceraldehyde- 3-phosphate dehydrogenase (EC 1.2.1.12) and 3-phosphoglyc- erate kinase (EC 2.7.2.3) reactions. These reactions are also found to be in near-equilibrium (28) by 31P saturation transfer studies.
Intracellular microelectrode recordings from perfused heart report a potential, E, within the cell of -83 mV (29) relative to extracellular fluid. The energy required to move a mono- valent ion between two phases exhibiting this potential would
be about 1.9 kcal/mol of charge moved, with the sign of that energy dependent upon the valence of the ion moved. In red cells with an E across the membrane of about -9 mV and a low free [Mp”‘]i of 0.15 mM (5, 8), the monovalent ions [Cl-lo/u W+lo/o and [HCO;],,, distribute in accordance with the E across the membrane (30). However, in excitable tissues, E across plasma membrane is in the range of -70 to -90 mV and the free [Mg”‘]i in the range of 0.5 mM. In these cells, the concentration of [Cl-]; is greater than would be expected were [Cl-],,i simply to distribute without linking cofactors, through a Cl- channel, solely in accordance with the difference be- tween intracellular and extracellular water of the electro- chemical potential of [Cl-] alone. These observations led to the conclusion that Cl- was “pumped” (31) into the negative intracellular space cells where it remained even though Cl- was recognized as being among the most kinetically permeant of ions (22). The effect that free [Mg”‘]i would have upon the sum of impermeant intracellular anion charges and the effect of a change in the sum of these charges upon the distribution of [Cl-lo/i, the most permeant ion, was not previously recog- nized.
Less information is available on factors determining the gradients of magnesium and phosphate across plasma mem- brane. Presumably because of their larger size relative to Cl- and K’, ions such as M$+ and H2PO; or HPOi- are thought not to traverse the plasma membrane through channels or protein pores. The smaller Ca2+ ion can traverse plasma or sarcoplasmic membrane via a channel, a Ca’+-ATPase, or a Ca’+/Na+ exchanger (32). Microelectrode studies have estab- lished that M$+ does not distribute across the charged mem- brane of excitable high voltage tissues and is therefore pumped out of the negative interior of cells against its electrochemical gradient (33). However, in contrast to the rapid isotopic exchange of the smaller ions, the kinetics of Mg2+ transport are much slower. Equilibration of isotopically labeled extra- cellular “Mg*+ across isolated frog muscle requires about 300 min (34), similar to the rate of Ca*+ equilibration in unstim- ulated preparations. It is further known that the concentra- tion of free [Mg’+] is usually in the range of 0.5 to 1 mM, both in normal plasma (35) and in the cytosol of most mitochon- drial-containing tissues (36). Scatchard analysis of binding and measurement of changes in citrate/isocitrate ratios (36), shift of 13C NMR spectra of citrate (37), or analogues of EDTA (38) all yield values for free cytosolic [Mg”]; in the 0.5 to 1 mM range. Estimates using intracellular artificial dyes, which are subject to alteration with pH and other metals, yield somewhat higher and more variable values of free [M$+] from 0.2 to 6 mM (39). Strangely, the same free [Mg’]i of 0.5 to 1 mM is found: in liver and kidney cytosol, with a potential of about -35 mV (40); in muscle or brain cytosol (34), with a potential in the range of -70 to -90 mV; and within the mitochondria (41), with potentials across its membrane esti- mated to be -140 to -170 mV (42). This implies that the net enzymatic reactions catalyzing the distribution of free [M$+] across both the plasma and mitochondrial membranes is either insensitive to E or must be linked to other ion move- ments of equal energy but opposite sign and to involve reac- tions which are unbalanced with respect to charge.
The proteins responsible for bringing about M$+ transport are not yet known (43). The postulation of both Na+-Mg2+ co-transport in smooth muscle (44) and M$+/Na+ exchange in cardiac muscle (45) seems, on its face, thermodynamically improbable. At present, four proteins have been cloned from prokaryotes which are involved in Mg2+ uptake (46) by as yet uncharacterized reactions. No proteins have yet been identi- fied catalyzing Mg2+ movement out of cells. Evidence is pre-
by guest on May 29, 2018
http://ww
w.jbc.org/
Dow
nloaded from
AG of ATP Hydrolysis and Ion Gradients 20323
sented here suggesting that the net process of Mg2+ exit from cytosol is energetically similar to the AG of [HPO$-],,i and [Na+lo,,. Our evidence also suggests that the AG of [Mg2+],,i varies with change in intracellular anionic charge and there- fore is linked to changes in the lower AG[Cl-],I; in working perfused rat heart. Our observations would favor a net M$+/ H,PO; exchange perhaps made up of Na+-HPO:- co-trans- port linked to Na’-Mg2’ co-transport rather than Na+/Mg*+ exchange linked to Na’-HPO$- co-transport yielding a net Mg’+-HPO:- co-transport.
Like M$+ movement, Pi movement across plasma mem- brane is slow relative to K’ and Cl- movement. Pi movement across the red cell membrane is catalyzed by dimers or tetra- mers of a 95-kDa glycoprotein, which like most other trans- port proteins, contains a 52-kDa lipophilic domain that trav- erses the membrane multiple times (47). Due to the high activity of the Cl-/nonspecific anion exchanger in red cell, [32P]o//i, like [Cl-lo,r, [H%, and [HCO&, distributes across red cell plasma in near-equilibrium with the E across the membrane (48). Because of a high K,,, of this protein for Pi relative to the physiological concentrations, the rates of Pi equilibration are slower than those of Cl- or HCO,. In all tissues other than red cell, however, [zP&,,; is greater than would be predicted based on the energy of voltage drop, E, across the membrane. In cells containing mitochondria, Pi transport across the plasma membrane is also catalyzed by an enzyme which co-transports Na’ with Pi (49). Evidence is presented here which suggests that the AG of the gradient [Na+],,i is equivalent to the AG of [HPO:-],I, or to the AG of [H,PO;],,, ~1~s the AG of [H+],/i.
Estimation of the concentration of cytosolic [Pi], is not straightforward because of the multiple ionic forms of Pi and because of its sequestration within mitochondria (50-52). Like Mg”, which can move into mitochondrial space (53), Pi can be transported into mitochondria as well as across the plasma membrane. This Pi transport occurs via a highly active 34- kDa mitochondrial H’-Pi co-transporter (54) and the 30-kDa dicarboxylate’-/Pi exchanger (55) both of which have high activities and Km values within the physiological range (56, 57). Cytosolic [I;Pi] can therefore be affected by: transport out of cytosol across plasma membrane; transport out of cytosol into mitochondria; a change in phosphorylation po- tential; or addition of unphysiological concentrations of sub- strates (58). The difficulties in estimating cytosolic [ZP,] can be overcome by taking advantage of the near-equilibrium reactions which allow independent estimation of the cytosolic [ ZATP]/[ ZADP] [ZPi] and [ ZATP]/[ BADP] ratio from the creatine kinase reaction and intracellular pH (5,59). Division of the calculated cytosolic phosphorylation potential by the [ZATP]/[ZADP] will yield estimates of the free cytosolic [ZPi],. It has been found’ that such estimates are in good agreement with 31P NMR estimates of cytosolic [ ZPi].
Administration of high concentrations of external phos- phate has previously been reported to stimulate glycolysis (60, 61) and alter the kinetics of “Pi transport (62) in the non- working perfused heart. This is the first report of the effects of altered [zP& on the distribution of inorganic ions. In contrast, numerous clinical reports suggest an undefined re- lationship existing between hypophosphatemia and magne- sium deficiency (63). While the clinical effects of variations in serum Mg2+ have not been widely recognized (64), defi- ciency of intracellular Mg2+ has long been postulated to exist (65) in a number of common chronic diseases such as essential hypertension (66) and certain forms of vascular disease (67). Hypophosphatemia and hypomagnesemia are reported to oc-
’ R. Jungas, personal communication.
cur in a proportion of alcoholics, particularly with malnutri- tion, ketoacidosis, and rhabdomyolysis (68) or during with- drawal (69, 70).
The purpose of this paper is to define the state of the intra- and extracellular fluids and the energy relationships existing between the energy gradients of the major inorganic ions across plasma membrane to one another and to the phos- phorylation potential. Understanding these relationships should have application in: fluid and electrolyte therapies following surgery or trauma, the dietary treatment of some common diseases, and possibly in the treatment of some rarer genetic disorders of ion transport.
MATERIALS AND METHODS’
Animals-Ad lib&m fed 350- to 500-g male Wistar rats (Charles River Laboratories, Wilmington, MA) were given 80-100 mg/kg body weight of sodium pentobarbital (Sigma) intraperitoneally.
Perfusion-Hearts were removed and perfused in a non-recirculat- ing hemoglobin-free system after the method of Neely et al. (71). Following 15-20 min of preperfusion with a 1.2 mM [ZP& in the nonworking Langendorff mode (72), the isolated hearts performed work against a constant mean aortic pressure of 82-84 mm Hg with a mean left atria1 pressure of 10 cm H,O. The distal end of the pulmonary arterial catheter, which collected the effluent from the coronary sinus and the right ventricular thebesian veins, was placed 3-4 cm below the base of the heart to prevent the right ventricle from generating pressure and performing work. Coronary and aortic flow were measured volumetrically. Heart rate and aortic pressure were continuously monitored by a pressure transducer (Spectramed P23XL, Oxnard, CA) using a polygraph recorder (Gould RS 3400, Cleveland, OH). The details of the perfusion procedure, the compo- sition of the media, and the binding constants used in the calculation of free [Me], free [Ca*+], and the ionic species are given in the Miniprint Supplement.
Calculations-The values of the equilibrium constants used (73- 76) were determined under conditions approximating those in uivo, namely T = 38 “C, ionic strength, Z = 0.25 for intracellular and 0.15 for extracellular fluids. Where binding and acid dissociation constants under these conditions were not available, existing values were cor- rected (Table III, Miniprint), where indicated, for temperature by the van’t Hoff equation (77) (Table I, Equation 4) using published values for AZY (78). Where appropriate, these constants were corrected to the physiologically appropriate ionic strength, Z, with the Debye- Huckel equation (79) using the A (80) and Z3 (81) parameters indicated (Table I,-Equation 3). Throughout this paper, the concentration, indicated bv brackets. in millimoles/liter of fluid, not molalitv. is taken as an-adequate estimate of the activity, y. The notation [ij is used to indicate all of the ionic species present in the solution. The free perfusate [Ca”] and [Mg”+] was calculated (Table I, Equations 5-l to 5-3) from the known acid dissociation constants and binding constants (Table I, Miniprint) and checked with a [Ca”] electrode. Cytosolic free [Me], was estimated from the measured citrate/ isocitrate ratios (36) (Table I, Equation 1). Intracellular pH was calculated from the measured tissue [HCO;] and venous $0, ac- cording to the Henderson-Hasselbalch equation (82) (Table I, Equa- tion 2-i) and the Bunsen solubility equation (Table I, Equation i-2) where cuC0, was taken to be 0.53 ml/ml.’ The values (Table IV) of the ratios -of free cytosolic [NAD’]/[NADH], [ZATP]/[ZADP] [ZP,], and [BATP]/[ZADP] were calculated from measured tissue metabolite concentrations using K,, constants appropriate for the pH and free [M$+] estimated to be present in tissue under the three conditions studied (Miniprint Supplement, Table III). The ionic species present in cytosol were calculated from the acid dissociation c&star& and Me-binding constants (Table I, Miniprint) according to the Equations 5-l to 5-6 (Table I). Free cvtosolic IZP.1. was calculated-(Table I, Equation 10) from the mea&red tissuk contents of the reactants of the appropriate near-equilibrium reactions. The free cytosolic [BADP] was calculated (Table I, Equation 9), on the
’ Portions of this paper (including portions of the “Materials and Methods,” Supplement Tables I-III, and additional references) are presented in miniprint at the end of this paper. Miniprint is easily read with the aid of a standard magnifying glass. Full size photocopies are included in the microfilm edition of the Journal that is available from Waverly Press.
by guest on May 29, 2018
http://ww
w.jbc.org/
Dow
nloaded from
20324 AG of ATP Hydrolysis and Ion Gradients
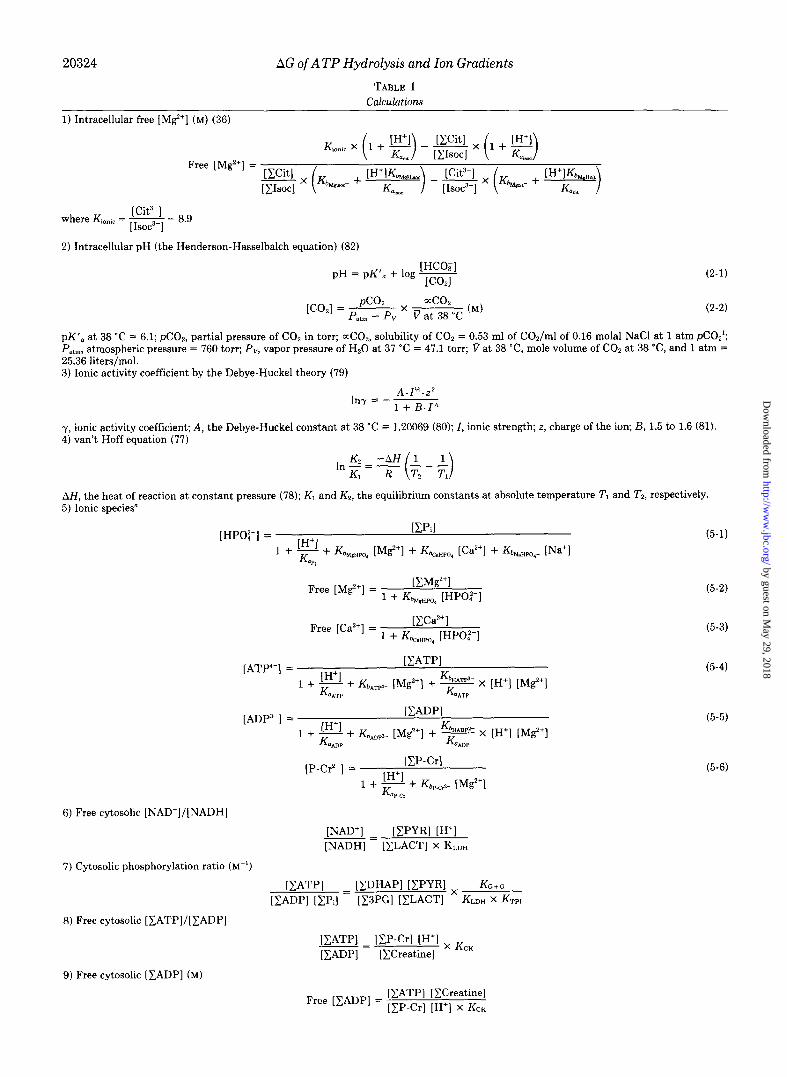
TABLE I Calculations
1) Intracellular free [Me] (M) (36)
Free [Mg”] = EW x Lmocl
where K,,,,, = [Cit.-] - = 8.9 [ Isoc3-]
2) Intracellular pH (the Henderson-Hasselbalch equation) (82)
pH = pK’, + log E 2
[co,] = 3 X p ;tc$c (M) atm ”
(2-l)
(2-V
pK’. at 38 ‘C = 6.1; pCOp, partial pressure of CO, in torr; aCOz, solubility of CO* = 0.53 ml of COJml of 0.16 molal NaCl at 1 atm pCO2; P,,,, atmospheric pressure = 760 torr; Pv, vapor pressure of H,O at 37 “C = 47.1 torr; v at 38 “C, mole volume of CO, at 38 “C, and 1 atm = 25.36 liters/mol. 3) Ionic activity coefficient by the Debye-Huckel theory (79)
A.Z”.z2 lny = -~ 1 + B . Zah
y, ionic activity coefficient; A, the Debye-Huckel constant at 38 ‘C = 1.20069 (80); I, ionic strength; z, charge of the ion; B, I.5 to 1.6 (81). 4) van’t Hoff equation (77)
AH, the heat of reaction at constant pressure (78); K, and K2, the equilibrium constants at absolute temperature T, and Tz, respectively. 5) Ionic species”
[HPO:-] = [CR1
l+[H+l+K (5-l)
KaP$ bluIsHPa, PW+l + I(bCaHPO, [Ca”l + f(6NsHP0,- Wa’l
Free [Mg”] = 1 + K EW’I b,.,gm,l WCI
Free [Ca’+] = 1 + K ECa”l beam, WPWI
[ATP’-] = EATPI
1 + 1H+l -I- KbAe. [Me] + KbHATp?- x [H’] [Mg?] K “ATP K %TP
(5-2)
(5-3)
(5-4)
[ADPa-] = [CADPI W+l KbHAW-
(5-5)
1 + K + Kb,+ PW+l + - x W+l VW+1 %mP
K “ADP
[P-C?] = EP-W
1 + IH’l + Kbpcrz- [Mg”]
(5-Q
K UP Cr
6) Free cytosolic (NAD’]/[NADH]
[NAD’] EP-fRl W’l ---= [NADH] [CLACT] x K~on
7) Cytosolic phosphorylation ratio (M-l)
EATPI [EDHAP] [CPYR] KG+G [CADP] [CPJ = [C3PC] [CLACTI x KLDH X KTPI
8) Free cytosolic [CATP]/[CADP]
EATPI -= ICP-W WI x K [CADPI [CCreatine] CK
9) Free cytosolic [CADP] (M)
[CATP] [CCreatine] Free [CADP1 = [CP-Cr] [H+] X KcK
by guest on May 29, 2018
http://ww
w.jbc.org/
Dow
nloaded from
AG of ATP Hydrolysis and Ion Gradients
TABLE l-continued
20325
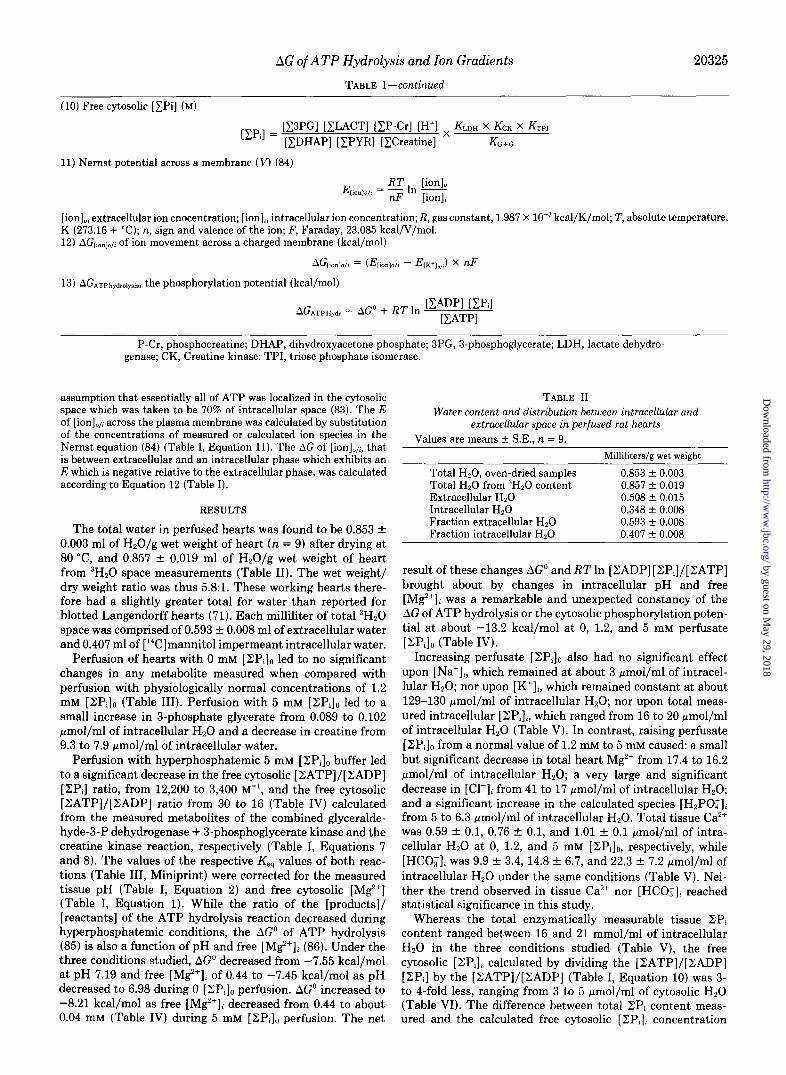
(10) Free cytosolic [CPi] (M)
[cp] = [x3PG] [ZLACT] [EP-Crl [H+l x KLDH x KCK x &PI
[EDHAP] [CPYR] [CCreatine] K 0+0
11) Nernst potential across a membrane (V) (84)
E [ion],
bn~ob = 5 In 7 [lonli
[ion]., extracellular ion cnocentration; [ion]i, intracellular ion concentration; R, gas constant, 1.987 x 10e3 kcal/K/mol; T, absolute temperature, K (273.16 + “C); n, sign and valence of the ion; F, Faraday, 23.085 kcal/V/mol. 12) AG(ionla,, of ion movement across a charged membrane (kcal/mol)
AGM,~, = G%M, - Ew+I,,,) X nF
13) Gmtw~ysis, the phosphorylation potential (kcal/mol)
AG,wPQ~~ = AGo + RT In [CADPI [Cpil [CATPI
P-Cr, phosphocreatine; DHAP, dihydroxyacetone phosphate; 3PG, 3-phosphoglycerate; LDH, lactate dehydro genase; CK, Creatine kinase; TPI, triose phosphate isomerase.
assumption that essentially all of ATP was localized in the cytosolic space which was taken to be 70% of intracellular space (83). The E of [ion],,i across the plasma membrane was calculated by substitution of the concentrations of measured or calculated ion species in the Nernst equation (84) (Table I, Equation 11). The AG of [ion],,,, that is between extracellular and an intracellular phase which exhibits an E which is negative relative to the extracellular phase, was calculated according to Equation 12 (Table I).
RESULTS
The total water in perfused hearts was found to be 0.853 f 0.003 ml of H,O/g wet weight of heart (n = 9) after drying at 80 “C, and 0.857 + 0.019 ml of HzO/g wet weight of heart from 3H,0 space measurements (Table II). The wet weight/ dry weight ratio was thus 5.&l. These working hearts there- fore had a slightly greater total for water than reported for blotted Langendorff hearts (71). Each milliliter of total 3H20 space was comprised of 0.593 f 0.008 ml of extracellular water and 0.407 ml of [‘%]mannitol impermeant intracellular water.
Perfusion of hearts with 0 mM [ZPi]a led to no significant changes in any metabolite measured when compared with perfusion with physiologically normal concentrations of 1.2 mM [ZP& (Table III). Perfusion with 5 mM [ZPi]o led to a small increase in 3-phosphate glycerate from 0.089 to 0.102 pmol/ml of intracellular Hz0 and a decrease in creatine from 9.3 to 7.9 pmol/ml of intracellular water.
Perfusion with hyperphosphatemic 5 mM [ZPi], buffer led to a significant decrease in the free cytosolic [ ZATP]/[ ZADP] [ZPi] ratio, from 12,200 to 3,400 M-l, and the free cytosolic [.ZATP]/[;SADP] ratio from 30 to 16 (Table IV) calculated from the measured metabolites of the combined glyceralde- hyde-3-P dehydrogenase + 3-phosphoglycerate kinase and the creatine kinase reaction, respectively (Table I, Equations 7 and 8). The values of the respective Keq values of both reac- tions (Table III, Miniprint) were corrected for the measured tissue pH (Table I, Equation 2) and free cytosolic [Mg*+] (Table I, Equation 1). While the ratio of the [products]/ [reactants] of the ATP hydrolysis reaction decreased during hyperphosphatemic conditions, the AC’ of ATP hydrolysis (85) is also a function of pH and free [Mg2+], (86). Under the three conditions studied, AGo decreased from -7.55 kcal/mol at pH 7.19 and free [Mg2+li of 0.44 to -7.45 kcal/mol as pH decreased to 6.98 during 0 [ZP,],, perfusion. AGO increased to -8.21 kcal/mol as free [Mg*+]i decreased from 0.44 to about 0.04 mM (Table IV) during 5 mM [XPi], perfusion. The net
TABLE II Water content and distribution between intracellular and
extracellular space in perfused rat hearts Values are means +- SE., n = 9.
Milliliters/g wet weight
Total H20, oven-dried samples 0.853 f 0.003 Total Hz0 from ‘HZ0 content 0.857 * 0.019 Extracellular Hz0 0.508 f 0.015 Intracellular H20 0.348 + 0.008 Fraction extracellular Hz0 0.593 + 0.008 Fraction intracellular Hz0 0.407 + 0.008
result of these changes AGO and RT In [ZADP] [ZPi]/[ZATP] brought about by changes in intracellular pH and free [Mg*+]; was a remarkable and unexpected constancy of the AG of ATP hydrolysis or the cytosolic phosphorylation poten- tial at about -13.2 kcal/mol at 0, 1.2, and 5 mM perfusate [ZPi]o (Table IV).
Increasing perfusate [ZPi]o also had no significant effect upon [Na+]i, which remained at about 3 pmol/ml of intracel- lular H20; nor upon [K+]i, which remained constant at about 129-130 pmol/ml of intracellular H20; nor upon total meas- ured intracellular [ZlPi],, which ranged from 16 to 20 pmol/ml of intracellular HZ0 (Table V). In contrast, raising perfusate [ZPilo from a normal value of 1.2 mM to 5 mM caused: a small but significant decrease in total heart Mg” from 17.4 to 16.2 I.cmol/ml of intracellular H,O; a very large and significant decrease in [Cl-Ii from 41 to 17 Fmol/ml of intracellular H,O; and a significant increase in the calculated species [H,PO;li from 5 to 6.3 pmol/ml of intracellular HzO. Total tissue Ca2+ was 0.59 f 0.1, 0.76 f 0.1, and 1.01 +- 0.1 pmol/ml of intra- cellular H20 at 0, 1.2, and 5 mM [YZPi]o, respectively, while [HCO;], was 9.9 f 3.4, 14.8 + 6.7, and 22.3 + 7.2 pmol/ml of intracellular Hz0 under the same conditions (Table V). Nei- ther the trend observed in tissue Ca2+ nor [HCO;], reached statistical significance in this study.
Whereas the total enzymatically measurable tissue ZPi content ranged between 16 and 21 mmol/ml of intracellular Hz0 in the three conditions studied (Table V), the free cytosolic [ ZPi]i calculated by dividing the [ ZATP]/[ ZZADP] [ZP,] by the [ZATP]/[ZADP] (Table I, Equation 10) was 3- to 4-fold less, ranging from 3 to 5 pmol/ml of cytosolic H,O (Table VI). The difference between total ZPi content meas- ured and the calculated free cytosolic [XP,], concentration
by guest on May 29, 2018
http://ww
w.jbc.org/
Dow
nloaded from
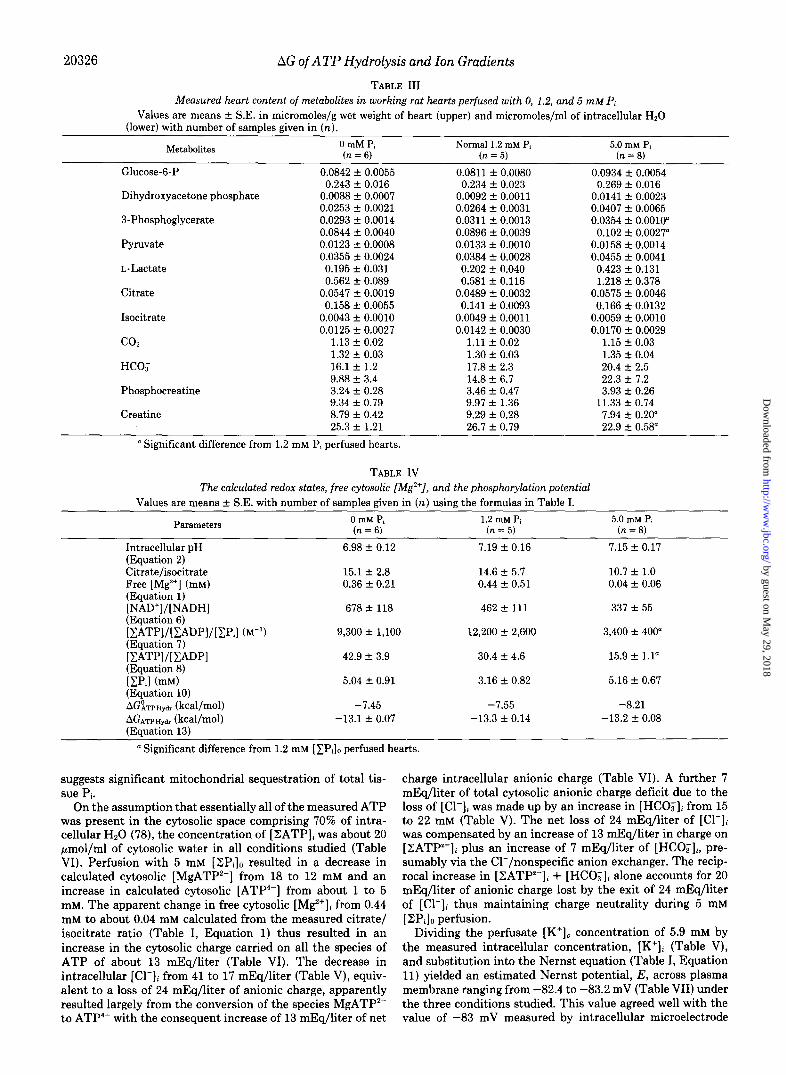
20326 AG of ATP Hydrolysis and Ion Gradients
TABLE III Measured heart content of metabolites in working rat hearts perfused with 0, 1.2, and 5 mM P,
Values are means -+ S.E. in micromoles/g wet weight of heart (upper) and micromoles/ml of intracellular Hz0 (lower) with number of samples given in (n).
Metabolites OmMP, (n = 6)
Glucose-6-P 0.0842 + 0.0055 0.243 + 0.016
Dihydroxyacetone phosphate 0.0088 + 0.0007 0.0253 f 0.0021
3-Phosphoglycerate 0.0293 + 0.0014 0.0844 -+ 0.0040
Pyruvate 0.0123 -+ 0.0008 0.0355 3~ 0.0024
L-Lactate 0.195 * 0.031 0.562 + 0.089
Citrate 0.0547 + 0.0019 0.158 k 0.0055
Isocitrate 0.0043 f 0.0010 0.0125 f 0.0027
co* 1.13 + 0.02 1.32 + 0.03
HCO, 16.1 + 1.2 9.88 + 3.4
Phosphocreatine 3.24 + 0.28 9.34 * 0.79
Creatine 8.79 + 0.42 25.3 + 1.21
’ Significant difference from 1.2 mM Pi perfused hearts.
Normal1.2 DIM P, (n = 5)
0.0811 + 0.0080 0.234 + 0.023
0.0092 + 0.0011 0.0264 f 0.0031 0.0311 + 0.0013 0.0896 + 0.0039 0.0133 + 0.0010 0.0384 f 0.0028 0.202 * 0.040 0.581 + 0.116
0.0489 rt 0.0032 0.141 + 0.0093
0.0049 + 0.0011 0.0142 + 0.0030
1.11 -+ 0.02 1.30 k 0.03 17.8 f 2.3 14.8 f 6.7 3.46 f 0.47 9.97 + 1.36 9.29 f 0.28 26.7 + 0.79
5.0 InM Pi (n = 8)
0.0934 f 0.0054 0.269 zk 0.016
0.0141 + 0.0023 0.0407 + 0.0065 0.0354 t- 0.0010” 0.102 + 0.0027”
0.0158 f 0.0014 0.0455 f 0.0041 0.423 + 0.131 1.218 * 0.378
0.0575 + 0.0046 0.166 + 0.0132
0.0059 f 0.0010 0.0170 f 0.0029
1.15 -c 0.03 1.35 -c 0.04 20.4 f 2.5 22.3 c!c 7.2 3.93 + 0.26
11.33 + 0.74 7.94 + 0.20" 22.9 k 0.58"
TABLE IV The calculated redox states, free cytosolic [Mg’+], and the phosphorylation potential
Values are means + S.E. with number of samples given in (n) using the formulas in Table I.
Parameters
Intracellular nH
OmMP, (n = 6)
6.98 f 0.12
1.2 mM Pi (n = 5)
7.19 + 0.16
5.0 mhi P, (n = 8)
7.15 & 0.17 (Equation 2) Citrate/isocitrate 15.1 * 2.8 Free [Mg*+] (mM) 0.36 + 0.21 (Equation 1) [NAD+]/[NADH] 6782118 (Equation 6) [CA’W/[CAW/LV’iI (M-l) 9,300 + 1,100 (Equation 7) EA’W/[CADPl 42.9 k 3.9 (Equation 8) EPJ CrnM) 5.04 f 0.91 (Equation 10) AG&aydr (kcal/mol) -1.45 AGATP ~ydr (kcal/mol) -13.1 + 0.07 (Equation 13)
’ Significant difference from 1.2 mM [CP,]o perfused hearts.
14.6 -c 5.7 10.7 + 1.0 0.44 +- 0.51 0.04 f 0.06
462 +lll 337 + 55
12,200 + 2,600 3,400 + 400"
30.4 -t 4.6 15.9 f 1.1"
3.16 + 0.82 5.16 + 0.67
-7.55 -8.21 -13.3 f 0.14 -13.2 + 0.08
suggests significant mitochondrial sequestration of total tis- sue Pi.
On the assumption that essentially all of the measured ATP was present in the cytosolic space comprising 70% of intra- cellular Hz0 (78), the concentration of [ZATP]i was about 20 pmol/ml of cytosolic water in all conditions studied (Table VI). Perfusion with 5 mM [ZPi], resulted in a decrease in calculated cytosolic [MgATP*-] from 18 to 12 mM and an increase in calculated cytosolic [ATP4-] from about 1 to 5 mM. The apparent change in free cytosolic [Mg”‘]; from 0.44 mM to about 0.04 mM calculated from the measured citrate/ isocitrate ratio (Table I, Equation 1) thus resulted in an increase in the cytosolic charge carried on all the species of ATP of about 13 mEq/liter (Table VI). The decrease in intracellular [Cl-]; from 41 to 17 mEq/liter (Table V), equiv- alent to a loss of 24 mEq/liter of anionic charge, apparently resulted largely from the conversion of the species MgATP*- to ATP4- with the consequent increase of I3 mEq/liter of net
charge intracellular anionic charge (Table VI). A further 7 mEq/liter of total cytosolic anionic charge deficit due to the loss of [Cl-], was made up by an increase in [HCOT]i from 15 to 22 mM (Table V). The net loss of 24 mEq/liter of [Cl-Ii was compensated by an increase of I3 mEq/liter in charge on [ZATP”-1, plus an increase of 7 mEq/liter of [HCO;];, pre- sumably via the Cl-/nonspecific anion exchanger. The recip- rocal increase in [BATP”J + [HCOz]i alone accounts for 20 mEq/liter of anionic charge lost by the exit of 24 mEq/liter of [Cl-Ii thus maintaining charge neutrality during 5 mM [ ZP& perfusion.
Dividing the perfusate [K*], concentration of 5.9 mM by the measured intracellular concentration, [K+]i (Table V), and substitution into the Nernst equation (Table I, Equation 11) yielded an estimated Nernst potential, E, across plasma membrane ranging from -82.4 to -83.2 mV (Table VII) under the three conditions studied. This value agreed well with the value of -83 mV measured by intracellular microelectrode
by guest on May 29, 2018
http://ww
w.jbc.org/
Dow
nloaded from
AG of ATP Hydrolysis and Ion Gradients
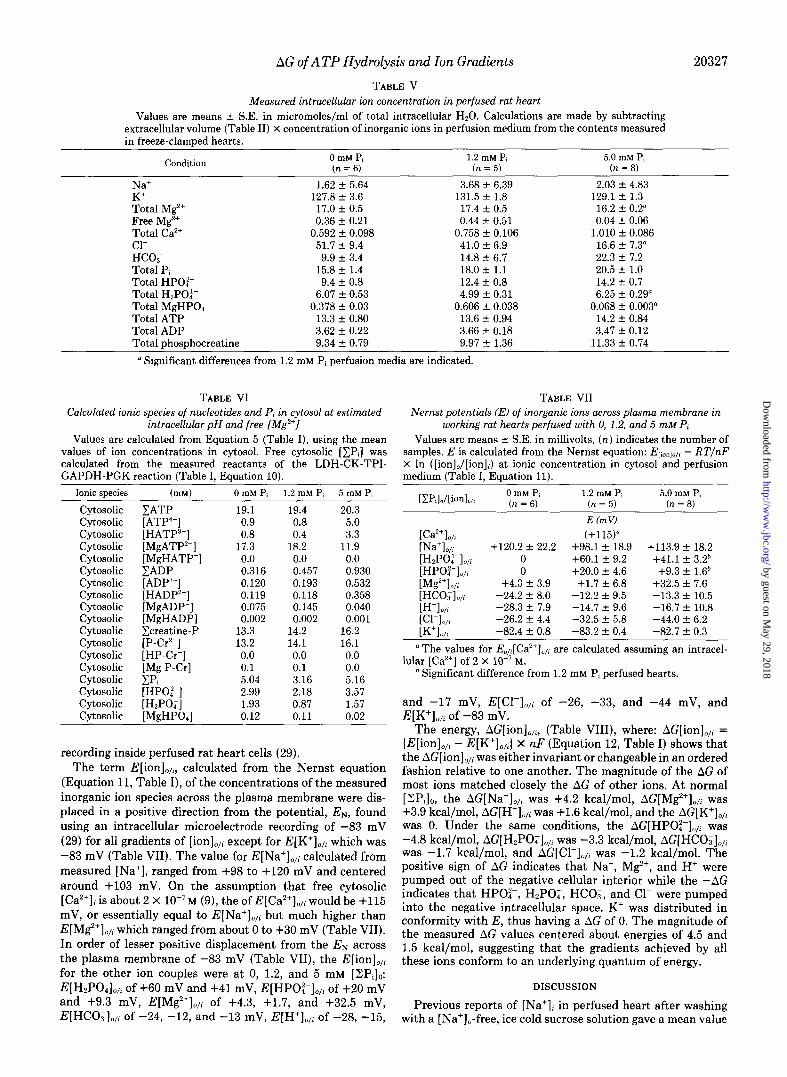
TABLE V
20327
Measured intracellular ion concentration in perfused rat heart Values are means f S.E. in micromoles/ml of total intracellular H,O. Calculations are made by subtracting
extracellular volume (Table II) x concentration of inorganic ions in perfusion medium from the contents measured in freeze-clamped hearts.
Condition OmMP, (n= 6)
1.2 mM P, (n= 5)
5.0 mM P, (n = 8)
Na’ 1.62 + 5.64 K’ 127.8 _C 3.6 Total Mg2+ 17.0 f 0.5 Free M$ 0.36 + 0.21 Total Ca*+ 0.592 f 0.098 cl- 51.7 + 9.4 HCO; 9.9 f 3.4 Total P, 15.8 + 1.4 Total HPO,2- 9.4 + 0.8 Total H,POj- 6.07 + 0.53 Total MgHPO, 0.378 + 0.03 Total ATP 13.3 + 0.80 Total ADP 3.62 + 0.22 Total phosphoc :reatine 9.34 f 0.79
3.68 t 6.39 131.5 + 1.8 17.4 + 0.5 0.44 + 0.51
0.758 + 0.106 41.0 + 6.9 14.8 -t 6.7 18.0 + 1.1 12.4 f 0.8 4.99 + 0.31
0.606 + 0.038 13.6 + 0.94 3.66 + 0.18 9.97 + 1.36
2.03 + 4.83 129.1 + 1.3 16.2 + 0.2” 0.04 + 0.06
1.010 + 0.086 16.6 + 7.3” 22.3 + 7.2 20.5 + 1.0 14.2 rf: 0.7 6.25 + 0.29"
0.068 + 0.003" 14.2 + 0.84 3.47 + 0.12
11.33 f 0.74 ’ Significant differences from 1.2 mM Pi perfusion media are indicated.
TABLE VI Calculated ionic species of nucleotides and P, in cytosol at estimated
intracellular pH and free [Mg’+J Values are calculated from Equation 5 (Table I), using the mean
values of ion concentrations in cytosol. Free cytosolic [CPJ was calculated from the measured reactants of the LDH-CK-TPI- GAPDH-PGK reaction (Table I, Equation 10).
Ionic species bM) OmMPi 1.2 mM P, 5mMP,
Cytosolic CATP 19.1 19.4 20.3 Cytosolic [ATP4-] 0.9 0.8 5.0 Cytosolic [HATP”-] 0.8 0.4 3.3 Cytosolic [MgATP*-] 17.3 18.2 11.9 Cytosolic [MgHATP-] 0.0 0.0 0.0 Cytosolic CADP 0.316 0.457 0.930 Cytosolic [ADPa-] 0.120 0.193 0.532 Cytosolic [HADP*-] 0.119 0.118 0.358 Cytosolic [MgADP-] 0.075 0.145 0.040 Cytosolic [MgHADP] 0.002 0.002 0.001 Cytosolic Ccreatine-P 13.3 14.2 16.2 Cytosolic [P-Cr”-] 13.2 14.1 16.1 Cytosolic [HP-C-] 0.0 0.0 0.0 Cytosolic [Mg P-Cr] 0.1 0.1 0.0 Cytosolic CP1 5.04 3.16 5.16 Cytosolic y-$y; 2.99 2.18 3.57 Cytosolic 1.93 0.87 1.57 Cytosolic [M;HiO,] 0.12 0.11 0.02
recording inside perfused rat heart cells (29). The term E[ion],,;, calculated from the Nernst equation
(Equation 11, Table I), of the concentrations of the measured inorganic ion species across the plasma membrane were dis- placed in a positive direction from the potential, EN, found using an intracellular microelectrode recording of -83 mV (29) for all gradients of [ion],,i except for E[K’],,, which was -83 mV (Table VII). The value for E[Na’],,; calculated from measured [Na+], ranged from +98 to +120 mV and centered around +103 mV. On the assumption that free cytosolic [Ca’+]i is about 2 X 10⁻⁷M (9), the of E[Ca’+],,; would be +115 mV, or essentially equal to E[Na+],,i but much higher than E[Mg2+lo,, which ranged from about 0 to +30 mV (Table VII). In order of lesser positive displacement from the EN across the plasma membrane of -83 mV (Table VII), the E[ion],,, for the other ion couples were at 0, 1.2, and 5 mM [ZPi]o: E[H,PO& of +60 mV and +41 mV, E[HPOz-I,,, of +20 mV and -t-9.3 mV, E[M$‘],,, of +4.3, +1.7, and +32.5 mV, E[HCO&, of -24, -12, and -13 mV, EIH+lo,, of -28, -15,
Nernst potentials (E) of inorganic ions across plasma membrane in TABLE VII
working rat hearts perfused with 0, 1.2, and 5 mM P, Values are means +- S.E. in millivolts, (n) indicates the number of
samples. E is calculated from the Nernst equation: Eli,,),,, = RT/nF x In ([ion]J[ion],) at ionic concentration in cytosol and perfusion medium (Table I, Equation 11).
[~PJJ[ionl.~~ OmMP, 1.2 mM P, 5.0 mM P, (n = 6) (n = 5) (n = 8)
E(mVI
;za"‘+;.,t (+115)" O/L +120.2 + 22.2 +98.1 + 18.9 +113.9 + 18.2
W$&lI~ 0 +60.1 + 9.2 +41.1 + 3.2* 4 O/L 0 +20.0 k 4.6 +9.3 + 1.6'
PW+lo/~ +4.3 r 3.9 +1.7 + 6.8 +32.5 k 7.6 WCO& -24.2 + 8.0 -12.2 + 9.5 -13.3 + 10.5 [H’lo,, -28.3 + 7.9 -14.7 + 9.6 -16.7 + 10.8
t&luil -26.2 k 4.4 -32.5 + 5.8 -44.0 k 6.2
41 -82.4 k 0.8 -83.2 + 0.4 -82.7 + 0.3 ’ The values for E,,,[Ca"],,, are calculated assuming an intracel-
lular [Ca*+] of 2 X 10m7 M. * Significant difference from 1.2 mM Pi perfused hearts.
and -17 mV, E[Cl-I,,, of -26, -33, and -44 mV, and E[K+],/i of -83 mV.
The energy, AG[ion],,,, (Table VIII), where: AG[ion],,i = {E[ion],,, - E[K+],,,] x nF (Equation 12, Table I) shows that the AG[ion],,, was either invariant or changeable in an ordered fashion relative to one another. The magnitude of the AG of most ions matched closely the AG of other ions. At normal [ZPJO, the AG[Na+],,i was +4.2 kcal/mol, AG[Mg”‘],,i was +3.9 kcal/mol, AG[H+],,; was +1.6 kcal/mol, and the AG[K’],,, was 0. Under the same conditions, the AG[HPO:-],i was ~~~8~~/~~~~,~~~H~~~;,~~]-3.3 kcal/mol, AG[HCOF],,i
was -1.2 kcal/mol. The positive sign of Ad indicates tha:Na’, M$+, and H’ were pumped out of the negative cellular interior while the -AG indicates that HPOZ-, H,PO;, HCO,, and Cl- were pumped into the negative intracellular space. K’ was distributed in conformity with E, thus having a AG of 0. The magnitude of the measured AG values centered about energies of 4.5 and 1.5 kcal/mol, suggesting that the gradients achieved by all these ions conform to an underlying quantum of energy.
DISCUSSION
Previous reports of [Na+], in perfused heart after washing with a [Na+lO-free, ice cold sucrose solution gave a mean value
by guest on May 29, 2018
http://ww
w.jbc.org/
Dow
nloaded from
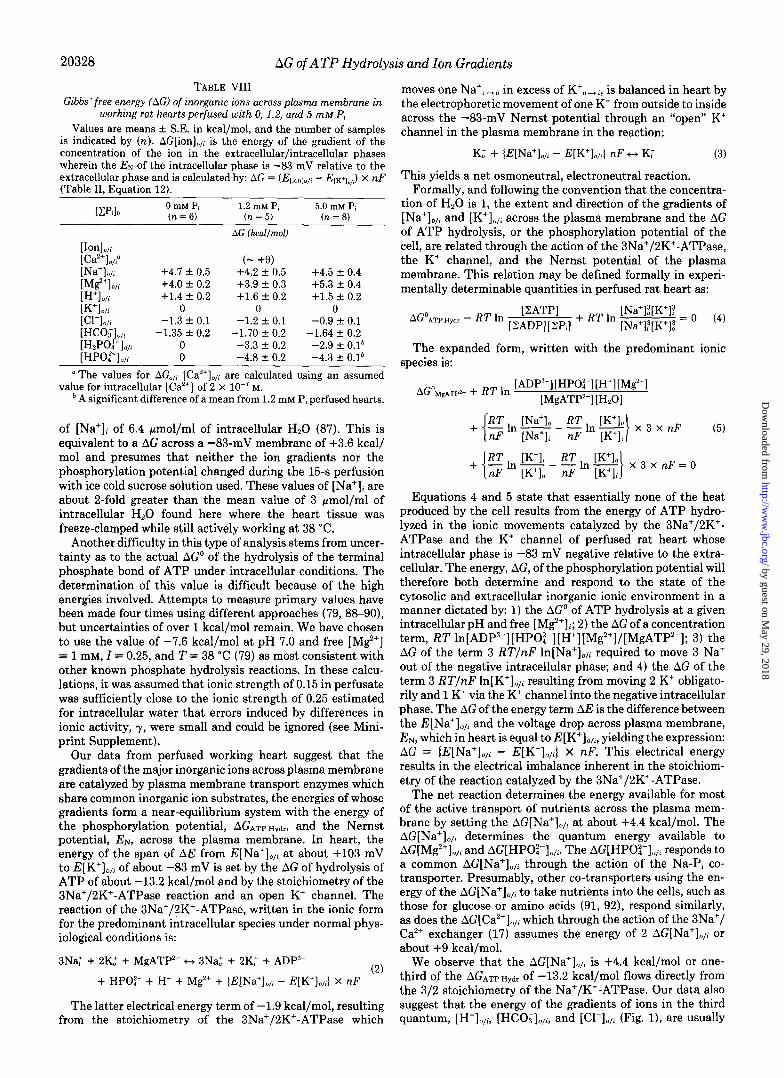
20328 LIG of ATP Hydrolysis and Ion Gradients
TABLE VIII Gibbs’ free energy (AC) of inorganic ions across plasma membrane in
working rat hearts perfused with 0, 1.2, and 5 mM P, Values are means + SE. in kcal/mol, and the number of samples
is indicated by (n). AG[ion],,, is the energy of the gradient of the concentration of the ion in’ the extracellular/intracellular phases wherein the EN of the intracellular chase is -83 mV relative to the extracellular phase and is calculatedby: AG = (Ec,,,~,,, - I&+1,,,) x nF (Table II, Equation 12).
ICP.10 OmMP, 1.2 mM P, 5.0 mM Pi (n = 6) (n = 5) (n = 8)
AG &xl/mol) [IonI,/, ;~a;lOl’ (- +91
OIL -l-4.7 f 0.5 +4.2 + 0.5 +4.5 t 0.4
KP 4 +4.0 +1.4 + f 0.2 0.2 +3.9 +1.6 + f 0.3 0.2 +5.3 +1.5 + + 0.4 0.2
t:lY 41 -1.3 0 + 0.1 -1.2 0 k 0.1 -0.9 0 +- 0.1 WCO&, -1.35 f 0.2 -1.70 f 0.2 -1.64 +- 0.2 U-NWlo,, 0 -3.3 f 0.2 -2.9 f O.lb [HPOflo,, 0 -4.8 + 0.2 -4.3 + O.lb
“The values for AGO,, [Caz+]o,i are calculated using an assumed value for intracellular [Ca’+] of 2 X 10m7 M.
* A significant difference of a mean from 1.2 mM Pi perfused hearts.
of [Na’]; of 6.4 pmol/ml of intracellular Hz0 (87). This is equivalent to a AG across a -83-mV membrane of +3.6 kcal/ mol and presumes that neither the ion gradients nor the phosphorylation potential changed during the 15-s perfusion with ice cold sucrose solution used. These values of [Na+], are about 2-fold greater than the mean value of 3 bmol/ml of intracellular HZ0 found here where the heart tissue was freeze-clamped while still actively working at 38 “C.
Another difficulty in this type of analysis stems from uncer- tainty as to the actual AGO of the hydrolysis of the terminal phosphate bond of ATP under intracellular conditions. The determination of this value is difficult because of the high energies involved. Attempts to measure primary values have been made four times using different approaches (79,88-90), but uncertainties of over 1 kcal/mol remain. We have chosen to use the value of -7.6 kcal/mol at pH 7.0 and free [Me] = 1 mM, I = 0.25, and T = 38 “C (79) as most consistent with other known phosphate hydrolysis reactions. In these calcu- lations, it was assumed that ionic strength of 0.15 in perfusate was sufficiently close to the ionic strength of 0.25 estimated for intracellular water that errors induced by differences in ionic activity, y, were small and could be ignored (see Mini- print Supplement).
Our data from perfused working heart suggest that the gradients of the major inorganic ions across plasma membrane are catalyzed by plasma membrane transport enzymes which share common inorganic ion substrates, the energies of whose gradients form a near-equilibrium system with the energy of the phosphorylation potential, AGATPH~~, and the Nernst potential, EN, across the plasma membrane. In heart, the energy of the span of AE from EINa+lo,, at about +103 mV to E[K+]o/i of about -83 mV is set by the AG of hydrolysis of ATP of about -13.2 kcal/mol and by the stoichiometry of the 3Na+/2K+-ATPase reaction and an open K’ channel. The reaction of the BNa+/ZK+-ATPase, written in the ionic form for the predominant intracellular species under normal phys- iological conditions is:
3Na: + 2K,+ + MgATP*- w 3N$ + 2K: + ADP3- (2)
+ HPO,2- + H’ + Mg2+ + {E[Na+],,, - E[K+],,,) x nF
The latter electrical energy term of -1.9 kcal/mol, resulting from the stoichiometry of the 3Na+/2K+-ATPase which
moves one Na’, .+ D in excess of K’, -, i, is balanced in heart by the electrophoretic movement of one K’ from outside to inside across the -83-mV Nernst potential through an “open” K’ channel in the plasma membrane in the reaction:
K,’ + (E[Na+],,, - EIK’],li} nF ++ K:
This yields a net osmoneutral, electroneutral reaction.
(3)
Formally, and following the convention that the concentra- tion of HZ0 is 1, the extent and direction of the gradients of [Na+],,, and [K+],,,; across the plasma membrane and the AG of ATP hydrolysis, or the phosphorylation potential of the cell, are related through the action of the 3Na+/2K+-ATPase, the K’ channel, and the Nernst potential of the plasma membrane. This relation may be defined formally in experi- mentally determinable quantities in perfused rat heart as:
AG”~~p~ydr - RT In [ ZATP]
[ZADP][BP,] + RT ln [Na%K+lB = o
[Na’lB[K+l,3 c4J
The expanded form, written with the predominant ionic species is:
AGoMgATpz- + RT ln [ADPa- WWI W’l MZ+l [MgATP*-] [H,O]
(5)
Equations 4 and 5 state that essentially none of the heat produced by the cell results from the energy of ATP hydro- lyzed in the ionic movements catalyzed by the 3Na’/2K’- ATPase and the K’ channel of perfused rat heart whose intracellular phase is -83 mV negative relative to the extra- cellular. The energy, AG, of the phosphorylation potential will therefore both determine and respond to the state of the cytosolic and extracellular inorganic ionic environment in a manner dictated by: 1) the AGO of ATP hydrolysis at a given intracellular pH and free [Mg2+],; 2) the AG of a concentration term, RT ln[ADP3-][HPOi-][H+][Mg2+]/[MgATP*-1; 3) the AG of the term 3 RT/nF ln[Na+],,i required to move 3 Na’ out of the negative intracellular phase; and 4) the AG of the term 3 RT/nF ln[K+loll resulting from moving 2 K’ obligato- rily and 1 K+ via the K’ channel into the negative intracellular phase. The AG of the energy term AE is the difference between the E[Na’],,; and the voltage drop across plasma membrane, EN, which in heart is equal to EIK+loli, yielding the expression: AG = (E[Na+],,, - E[K+],,J x nF. This electrical energy results in the electrical imbalance inherent in the stoichiom- etry of the reaction catalyzed by the 3Na+/2K+-ATPase.
The net reaction determines the energy available for most of the active transport of nutrients across the plasma mem- brane by setting the AG[Na+],,i at about +4.4 kcal/mol. The AG[Na+],,, determines the quantum energy available to AG[Mg’Q and AGIHPO:-],,i. The AG[HPOi-],I; responds to a common AG[Na+],,i through the action of the Na-Pi CO- transporter. Presumably, other co-transporters using the en- ergy of the AG[Na+],,; to take nutrients into the cells, such as those for glucose or amino acids (91, 92), respond similarly, as does the AG[Ca’+]+ which through the action of the 3Na’/ Ca*+ exchanger (17) assumes the energy of 2 AG[Na+],,i or about +9 kcal/mol.
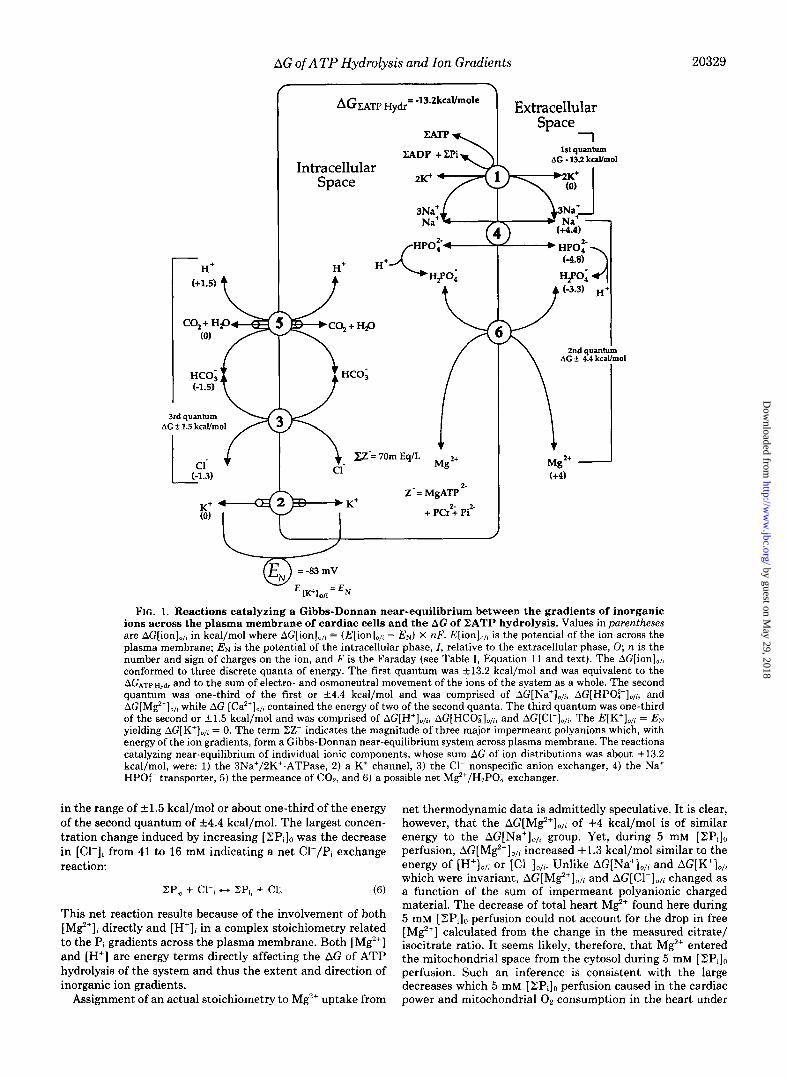
We observe that the AG[Na+],,, is +4.4 kcal/mol or one- third of the AGATPHydr of -13.2 kcal/mol flows directly from the 3/2 stoichiometry of the Na+/K+-ATPase. Our data also suggest that the energy of the gradients of ions in the third quantum, [H’],,,, [HCO&, and [Cl-],,i (Fig. l), are usually
by guest on May 29, 2018
http://ww
w.jbc.org/
Dow
nloaded from
AG of ATP Hydrolysis and Ion Gradients 20329
/ \ Gwr HY~
= -lJ.Pkcal/mole Extracellular
Intracellular Space
1st quantum AG - 132 kcalhol
(+4)
HCO; (-1.5)
3rd quanhrm AG t 1.5 kcallmol
Z - = MgATP 2-
+ PC*‘; Pi’.
FIG. 1. Reactions catalyzing a Gibbs-Donnan near-equilibrium between the gradients of inorganic ions across the plasma membrane of cardiac cells and the AG of ZATP hydrolysis. Values in parentheses are AG[ion],,, in kcal/mol where AG[ion],,, = (E[ion],,, - EN) x IZF. E[ion],,, is the potential of the ion across the plasma membrane; EN is the potential of the intracellular phase, I, relative to the extracellular phase, 0; n is the number and sign of charges on the ion, and F is the Faraday (see Table I, Equation 11 and text). The AG[ion],,, conformed to three discrete quanta of energy. The first quantum was +13.2 kcal/mol and was equivalent to the AGATPHydr and to the sum of electro- and osmoneutral movement of the ions of the system as a whole. The second quantum was one-third of the first or 1-4.4 kcal/mol and was comprised of AG[Na’],,,, AG[HPOf],,,, and AGIMp’flo,, while AG [Ca”],,, contained the energy of two of the second quanta. The third quantum was one-third of the second or +1.5 kcal/mol and was comprised of AG[H’],,,, AG[HCO&,, and AG[Cl-],i. The E[K’],,, = EN yielding AG[K’],,, = 0. The term ZZ- indicates the magnitude of three major impermeant polyanions which, with energy of the ion gradients, form a Gibbs-Donnan near-equilibrium system across plasma membrane. The reactions catalyzing near-equilibrium of individual ionic components, whose sum AG of ion distributions was about +13.2 kcal/mol, were: 1) the 3Na’/BK’-ATPase, 2) a K’ channel, 3) the Cl- nonspecific anion exchanger, 4) the Na’ HPOi- transporter, 5) the permeance of CO,, and 6) a possible net M$‘/HzPO; exchanger.
in the range of f1.5 kcal/mol or about one-third of the energy of the second quantum of f4.4 kcal/mol. The largest concen- tration change induced by increasing [ZPi]o was the decrease in [Cl-], from 41 to 16 mM indicating a net Cl-/Pi exchange reaction:
2P, + cl-, t--f ZP,, + Cl, (6)
This net reaction results because of the involvement of both (Mg2+], directly and [H’]i in a complex stoichiometry related to the Pi gradients across the plasma membrane. Both [MS’] and [H’] are energy terms directly affecting the AG of ATP hydrolysis of the system and thus the extent and direction of inorganic ion gradients.
Assignment of an actual stoichiometry to Mg2+ uptake from
net thermodynamic data is admittedly speculative. It is clear, however, that the AG(Mp’+],, of +4 kcal/mol is of similar energy to the AG[Na+],,; group. Yet, during 5 mM [EPi], perfusion, AG[M$+],/i increased +1.3 kcal/mol similar to the energy of [H’],,, or [Cl-],,,. Unlike AG[Na’],,, and AGIK+lojr which were invariant, AG[M$+],,, and AG[Cl-I,,, changed as a function of the sum of impermeant polyanionic charged material. The decrease of total heart MgZ+ found here during 5 mM [ZPJ, perfusion could not account for the drop in free [Mp] calculated from the change in the measured citrate/ isocitrate ratio. It seems likely, therefore, that M$+ entered the mitochondrial space from the cytosol during 5 mM [ ZP,], perfusion. Such an inference is consistent with the large decreases which 5 mM [ ZPi]” perfusion caused in the cardiac power and mitochondrial O2 consumption in the heart under
by guest on May 29, 2018
http://ww
w.jbc.org/
Dow
nloaded from
20330 AG of ATP Hydrolysis and Ion Gradients
these conditions. A full discussion of these effects will be the subject of another paper.
A series of reactions can be written, in which the net ion movement across a plasma membrane of -83 mV is osmoti- cally and electrically neutral, and in which the net AG of all ion movements is equal in magnitude and opposite in sign to the AGATE Hydr. Such a sequence requires 4 known individual transport reactions linked by common ionic intermediates and one postulated net transport reaction for Mg2+. It de- scribes the extent and direction of the changes observed in heart, in an energetically, osmotically, and electrically bal- anced series of reactions of the form (Fig. 1):
Reaction Mechanism
3Na:+2KZu 3Naz+2K: Na/K-ATPase (7)
Mg:+ + H,POy c) Mg2,f+ H,PO, ?Mg/Pi exchange (8)
2 (Naz + HPO:; c-* Nat+ HPOQ Na-Pi co-transport (9)
3 (HZ + HCO, c) H:+ HCO,) Permeant COP (10)
3 (HCO$ + Cl: c* HCOi, + Cl,) Cl-/anion exchange (11)
Net: 3Na: + 2Kz + M%f + H,PO, + 2HPO:;
+ 3H,f + 3Cl; c* 3Na,+ + 2Kt+ M&
+ H,PO, + 2HPO:; + 3H: + 3C&
(12)
Net AG = +12.6 and +14.1 kcal/mol (Table VIII) and AGATP Hydr = -13.2 and -13.3 kcal/mol (Table IV) at 1.2 and 5 mM [ZPi]i).
These equations define the state of both the extracellular and intracellular fluid across the plasma membrane of living tissue. The extent and direction of the ionic gradients reflect the A&TP Hydr because they are linked to one another by shared substrates in the reactions catalyzed by the membrane transport enzymes. Such a linked near-equilibrium system offers a quantitative explanation of the relationship between the energy status of the cell, pre-eminently represented by AGATPHydr, and the gradients of inorganic ions. It offers an explanation as well of why stereotypic ion movements occur when tissues suffer injury (l-3).
The AG[ion],,, appeared to conform to three distinctive quanta of energy. The first and determinate energy quantum Was the AG.&TPH~~~, which was invariant at -13.2 kcal/mol. The second energy quantum was one-third the AGArp n,& and had AG values around f4.4 kcal/mol. The gradients of [ion],,i exhibiting this energy were comprised of AG[Na’],,i, AG[HPO:-I,;, and AGIMp”]O,/i (Table VIII). Within the an- alytical error of the determination of [Na+]i, AG[Na’],,i was essentially constant at about +4.4 kcal/mol under the three conditions studied. That AG[Na+],,, was one-third of the AGATPHydr results from the stoichiometry of the 3Na+/2K+- ATPase and an open K+ channel or pore and indicates that the substrates of this system are in near-equilibrium with AG~rpn,+ across a plasma membrane separating phases of differing voltage. The AGIHPOi-],,i was found to be -4.8 and -4.3 kcal/mol at 1.2 and 5 mM [ZP& reflecting near-equilib- rium between the substrates of the Na+-Pi co-transporter. The AG[Mg*+],,, was +4 and +3.9 at 0 and 1.2 mM but increased by +1.3 kcal/mol to +5.3 at 5 mM [ZP&. However, the marked increase in AG[M$‘],,, of +1.3 kcal/mol during 5 mM [ZPi]o was equivalent to the addition of the energy of a linked transfer of an ion of the third quantum of energy as well as dependency upon the net [ Zimpermeant anionsli. The concentration of free [Ca2+lu was held constant in this study, and the value of [Ca2+lZ was not determined. If one assumes a generally accepted value for free cytosolic [Ca’+], of about 2
X 10m7 M, then the E[Ca’+],,i across the plasma membrane would be about +115 mV, very similar to E[Na+],,,i, while AG[Ca2+],,i would be about +9 kcal/mol, equivalent to the energy of 2 AG[Na’],,i. The gradient of [Ca*+],/i thus would reflect the action of the 3Naf/lCa2+ exchanger (17) acting across heart plasma membrane in a net electroneutral and osmoneutral manner.
The energy of the third quantum was about one-third of the +4.4 kcal/mol of AG[Na+],,i centering about f1.5 kcal/ mol. This group was comprised of the gradients of singly charged ions: AG[H+],,,, AG[HCO&i, AG[Cl-lo/i. In all cases, the energies of these monoionic gradients were less than the AG of 1.9 kcal/mol required were one monoion to be trans- ferred alone through an open “channel” across a membrane separating an intracellular space with E of -83 mV relative to the outside. The AG[H+],/i was +1.4, +1.6, and +1.5 kcal/ mol at 0, 1.2, and 5 mM [ZPi]o, respectively. Intermediate between the second and third quantum of energy, and reflect- ing the energies of both, was AG[H2PO;],/i of -3.3 to -2.9 kcal/mol at 1.2 and 5 mM [ZPi]o. Thus, AG[H,PO;],/i was equivalent to AG[HPOz& combined with +1.5 kcal/mol of the AG[H+],/i.
The energy of AG[K’],/i was invariant at 0 kcal/mol reflect- ing the action of an open K’ channel, allowing equilibration of K’ with its electrochemical potential phases with E of -83 mV. Such a system linked by common inorganic intermediates offers an energetic advantage over independent ion channels transferring single ions alone. Transfer of a monoion across -83 mV through a membrane channel in an unlinked manner would require 1.9 kcal/mol, whereas linked transfer appears to require only about 1.5 kcal/mol. In heart, the energy of AG[K+],,, is 0, whereas in other lower voltage tissues, [Cl-],; distribution would assume the gradient dictated by E (8).
The self-regulatory nature of the system of linked ionic gradients across plasma membrane is evident from a compar- ison of ((AG[ion],,; at 1.2 mM [ZPi]o) - (AG[ion],,i at 5 mM [ZPi],)]. As the normal energy relationships of the system were distorted, solely by increasing [ZP&, from 1.2 mM to 5 mM, the energy of the other ion gradients responded in an ordered, interdependent manner to maintain the constancy of critical cellular parameters such as EN across plasma mem- brane and the AGATP Hy&. The increase in [ZPi]o from 1.2 to 5 mM resulted in a change of AG[HPOq-I,,,, of -0.5 kcal/mol, from -4.8 to -4.3, and AG[H2PO&, changed -0.4 kcal/mol, from -3.3 to -2.9 kcal/mol. The change in AG[Cl-lo/i, {(-1.3 kcal/mol at 1.2 mM [ZPi],) - (-0.9 kcal/mol at 5 mM [2Pi]o)) = -0.4 kcal/mol, was thus equal in magnitude and sign to the change in the AG of the monovalent [H2PO&, couple of -0.4 kcal/mol. In contrast, the energy in AG[Me] o/i increased -1.4 kcal/mol or about 3 times the decrease in energy of the AG[HPOi-],,i which was diminished by 0.5 kcal/ mol, or that of AG[Cl-],,i and AG[H2PO;],/i which decreased 0.4 kcal/mol. In contrast, AG[HCOz],/i and AG[H’],/i were decreased only +0.06 to +O.l kcal/mol, respectively. The differences in the magnitude of the change from that observed in AG[H,PO;],/i was apparently due to the difference in PI-L,- and pK,,; and the permeance of CO,.
Using a series of 4 known enzymatic reactions and 1 un- defined net reaction gives a thermodynamic description of the state of the cytosol and the extracellular fluid surrounding a living cell, wherein the extent and direction of inorganic ions between phases exhibiting an E are related to the energy of the ATP hydrolysis in such manner that the sum of the electrical, chemical, and pressure energies of the system are 0 (Fig. 1). The energy of the gradients of inorganic ions, the energy of the phosphorylation potential, and the energy of
by guest on May 29, 2018
http://ww
w.jbc.org/
Dow
nloaded from
AG of ATP Hydrolysis and Ion Gradients 20331
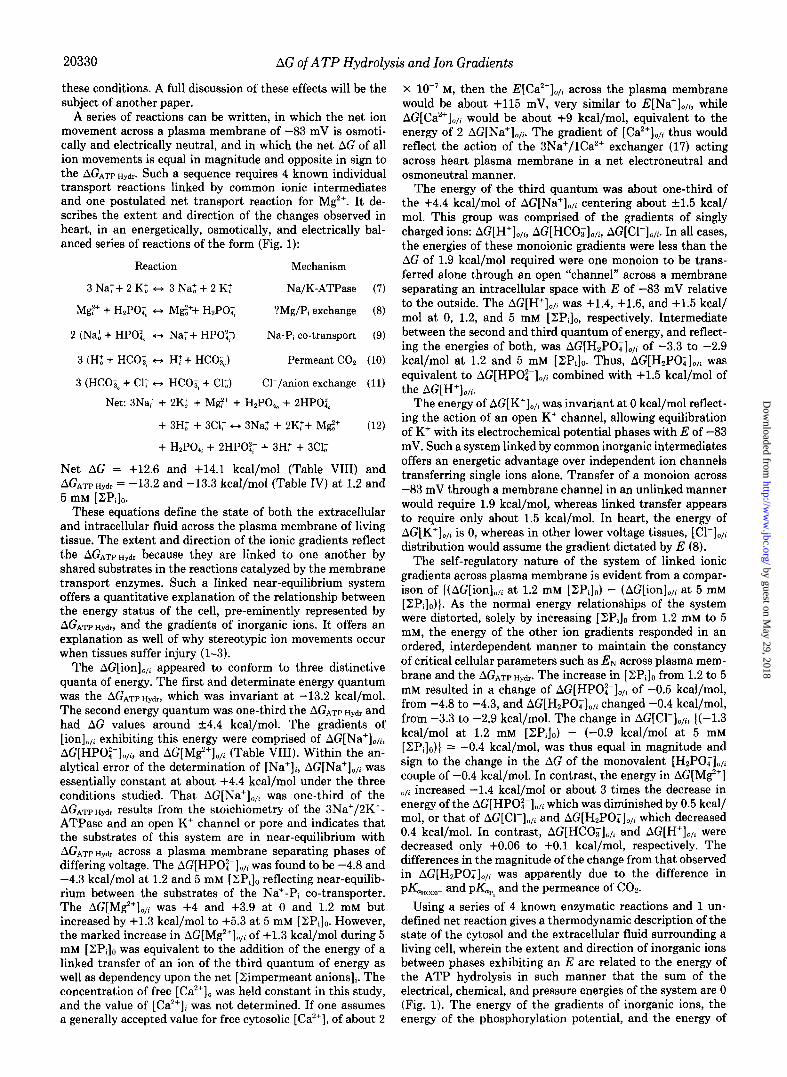
Cellular Donnan FIG. 2. The classical versus the cellular Gibbs-Donnan sys-
tem. In the classical Gibbs-Donnan system, the AG of the term RT ln[K’],,, = -RT ln[Cl-] “1, and both are equal to EN, the Nernst potential between the two phases. The two phases, the intracellular phase I and the extracellular phase 0, remain electrically neutral. The membrane is permeant to all components in the system except the charged ion Z- with the result that chemical, electrical, and pressure energy terms are created whose net AG = 0. In the cellular Gibbs-Donnan system, only RT ln[K’],,, = E. Cl- and all other inorganic anions are pumped into the negative interior and Na+ and all other inorganic cations except K’ are pumped into the positive extracellular phase. The extent and direction of the ion gradients formed depends upon the stoichiometry of the reaction and upon which quantum of energy derived from the hydrolysis of 2ATP is involved. The presence of excess extracellular cations, the energy of whose gradients exceed the energy of transfer between the two phases, EN, and excess intracellular anions whose gradients exceed the energy of transfer into a negative intracellular environment combine with the impermeant polyanionic phosphorylated metabolites, results in the EN between the two phases, and brings the pressure energy, ?r, of the classical Gibbs-Donnan to 0 in the cellular Gibbs-Donnan. The cellular membrane is permeant to no ionic components within the system, but requires that transport across the phospholipid membrane occurs through protein pores traversing the membrane, some of which impose a fixed stoichiometry upon the ion movements catalyzed.
the potential across the plasma membrane constitute a stable and, within limits, a self-regulating system. The forms of energy involved are: the chemical energy of the ion gradients, the voltage difference between the intracellular and extracel- lular phases, the absence of a pressure difference between the phases and the cytosolic phosphorylation potential. Together these energies form a near-equilibrium Gibbs-Donnan system (93-96) wherein the 4 forms of energy are in equilibrium with one another so that the AG of the entire system is 0.
Confusion has arisen in the past because isotopic evidence, reviewed earlier, clearly showed that the plasma membrane is permeable at varying rates to all inorganic ions. Heart cells therefore differ from the classical Gibbs-Donnan equilibrium system in three respects (Fig. 2). A classical Gibbs-Donnan system describes the osmotic, electrical, and ionic concentra- tion gradients which occur when two aqueous phases are separated by a membrane whose physical properties confer free permeance to most ions, but impermeance to at least one charged species. In heart, free permeance to distribute across the membrane in accordance with the energy of EN across the membrane is conferred upon K’ alone (Table VII and VIII). More importantly, the gradients of all of the other inorganic ions have energies which differ from that of the electrical energy across the membrane, EN, because they are linking in varying stoichiometries to the chemical energy, AG, of the hydrolysis of the terminal phosphate of ZATP. The mecha- nism, therefore, creating the Gibbs-Donnan system in heart is in part due to a different mechanism than simple physical impermeability of the membrane in the systems described by Gibbs and Donnan. The mechanism responsible for the achievement of a state, however, is not relevant here, only the
final state which is achieved. As a result of the cations having +AG values relative to EN, there is formed an excess of functionally impermeant cations in the extracellular phase whose sum concentrations are equal and opposite to the functionally impermeant excess anions with -AG values (Table VIII) plus the actually impermeant polyanionic phos- phorylated intermediates (ZZ-, Fig. 1) in the intracellular phase. The result is to make the EN of the intracellular phase negative relative to the extracellular phase and to equalize the pressure energy, a, between the two phases to 0. Viewed in this light, the system in heart, the Nernst potentials of the various ions (Table VII), even though displaced from the Nernst potential across the plasma membrane, EN, are never- theless in near-equilibrium with each other and with the entire Gibbs-Donnan system as a whole (Table VIII).
The potential across the membrane, EN, is thus an inherent characteristic of two aqueous phases containing actual imper- meant material inside and functionally impermeant anions inside and cations outside of a semipermeable membrane. From a thermodynamic point of view, the mechanism confer- ring the property of impermeance upon the various ions need not concern us, only the final state achieved. Yet it is widely held that the potential, E, between extracellular and intracel- lular fluid, at least in part results because the rate of K+ transport into cell is kinetically retarded in comparison to the energy-linked transport of Na+ out of the cell. This inequality of the kinetics of ion movement, or the so-called “pump-leak” hypothesis is thought to be an important factor in determining the magnitude of E across the plasma membrane. This kinetic view of the origin of E has been described in terms of the differential leak rate of ions across a membrane in the Gold- man equation (97).
E = g ln dK+lc, + dNa+L + PCI[C~-L F pKIK+lI + PdNa+L + mWlo
wherein the relative permeability p (98) values of the named ions across squid axon plasma membrane devoid of cytoplasm in centimeters/s were: pk = 1, PNa = 0.04, pcl = 0.45.
While such an equation and the change in p&, from 0.04 at rest to 20 during the action potential gives a useful description of the opening of a previously closed Na+ channel (20), its derivation requires that ion movement be independent of one another (26). Use of an equation requiring the independence of one ion movement from that of another is unlikely to describe data obtained in working perfused rat heart where ion movements appear to be linked to one another and are therefore not independent. The Nernst equation, being based on thermodynamics, requires no assumptions about mecha- nism nor about other components which do not take part in the reaction in question. Our data suggest that an estimate of E based on the Nernst potential for [K+],,i alone agrees with the E measured with intracellular microelectrodes (29) while the Goldman equation does not.
The Goldman equation viewed the resting membrane po- tential as analogous to that of an electrical circuit and at- tempted to describe E between the phases as the result of the differential rates of diffusion of the various ions through open channels. It took no account of either enzymatically catalyzed exchange reactions or those reactions dependent upon ATP as a cofactor. It differs from the situation reported here. Our data suggest that the Nernst equation describes the E across the plasma membrane of the Gibbs-Donnan system found in perfused heart, not the Goldman formulation. Our data sug- gest that [Na+]“, while permeant in a kinetic and isotopic sense nevertheless acts as the principle, but not unique, Donnan active impermeant extracellular cation equalizing the
by guest on May 29, 2018
http://ww
w.jbc.org/
Dow
nloaded from
AG of ATP Hydrolysis and Ion Gradients
osmotic pressure term (99) which would otherwise result from the presence of over 35 mM actually impermeant polyanionic phosphorylated intermediates (Table VI) within the intracel- lular space. Unlike plant or bacterial cell walls, the lipid membranes of animal cells are unable to withstand the pres- sure energy, A, which is an inherent part of the classical Gibbs-Donnan system, and requiring the evolution of trans- port enzymes such as the 3Na+/BK+-ATPase.
The important point is that the entire system of gradients of the major inorganic electrolytes across the plasma mem- brane of perfused rat heart is a Gibbs-Donnan equilibrium system. The AG of the hydrolysis of cytosolic ZATP of -13.2 kcal/mol determines the primary energy quantum of the system and the energy of the chemical concentration gradients of inorganic ions across the plasma membrane fall into two quanta each with synergies which are one-third of the quan- tum from which it is derived (Fig. 1). The AG[K+],,, assumes the EN across the plasma membrane and has a net AG = 0 as does the system as a whole.
By evaluating the energetics of the system as a whole (loo), it is possible to account for, in quantitative terms, the early observations (2, 3) which linked changes in status of cellular energy to changing gradients of the major inorganic ions during injury. This is so because the living cell and its extra- cellular environment constitute a self-regulating (1) thermo- dynamic state wherein the extent and direction of the gra- dients of the major inorganic ions are in near-equilibrium with the cytosolic phosphorylation potential through a series of plasma membrane enzymes linked by common intermedi- ates in two shared environments. The sum of ion movements across the plasma membrane in the isovolumic state must necessarily result in a net reaction which is electrically and osmotically neutral. In such a system, the EN across the plasma membrane is only one of the constitutive energy components required in a Gibbs-Donnan near-equilibrium system. Thus, while all of the metabolic reactions of the cell producing heat cannot be at equilibrium, the energy of the gradients of the major inorganic ions across the plasma mem- brane of cardiac cells, the Nernst potential, EN, between the extracellular and intracellular compartments, and the energy of the hydrolysis of ATP form a linked system whose AG is 0.
Acknowledgment-We wish to thank Dr. James R. Neely, Ph.D., who died November 29, 1988, for teaching T. M. the techniques of heart perfusion.
REFERENCES
1.
2.
3.
4.
5.
6. I. 8. 9.
10.
11. 12.
13. 14.
Bernard, C. (1878) Lecons sur lesphenomenes de le Vie Communs sun Animaux et our Vegetaux, J. B. Bailliere editeur, Paris
Stern, J. R., Eggleston, L. V., Hems, R., and Krebs, H. A. (1949) Biochem. J. 44,410-418
Tabor, H., and Rosenthal, S. M. (1945) Public Health Rep. 60, 401-41s
Manery, J. F., and Salandt, D. Y. (1943) Am. J. Physiol. 138, 499-511
Veech, R. L., Lawson, J. W. R., Cornell, N. W., and Krebs, H. A. (1979) J. Biol. Chem. 254,6538-6547
Skou, J. C. (1964) Proe. Bioph.ys. Mol. Biol. 14, 133-166 Sen, A. K., and Post, R. L. (1964) J. Biol. Chem. 239.345-352 Veech, R. L. (1986) Am. J. Clin. Nutr. 44, 519-551 Tanford, C. (1981) J. Gen. Physiol. 77,223-229 Fiolet, J. W. T., Baartscheer, A., and Schumacher, C. A. (1984)
J. Mol. Cell. Cardiol. 16, 1023-1036 Quistorff, B. (1989) Biochim. Biophys. Acta 1012, 267-271 Wheeler, K. P., and Christensen, H. N. (1967) J. Biol. Chem. 242,3782-3788
Peerce, B. (1988) Prog. Clin. Biol. Res. 252, 73-80 Medina, G., and Illingworth, J. (1980) Biochem. J. 188, 297-
311
15.
16.
17.
18. 19.
20.
21.
22.
23.
24.
25.
26.
27.
28.
29. 30.
31. 32.
33.
34. 35.
36.
37. 38.
39.
40. 41.
42. 43. 44.
45. 46.
47. 48.
49.
50.
51.
52.
53.
54.
55.
Scholnick, P., Lang, D., and Racker, E. (1973) J. Biol. Chem. 248,5175-5182
Wehrle, J. P., and Pedersen, P. L. (1989) J. Membr. Biol. 111, 199-213
Reeves, J. P., and Hale, C. C. (1984) J. Biol. Chem. 259, 7733- 7739
Ho, M. K., and Guidotti, G. (1975) J. Biol. Chem. 250,675-683 Kudrycki, K. E., Newman, P. R., and Shull, G. E. (1990) J. Biol.
Chem. 265,462-471 Hodgkin, A. L., and Katz, B. (1949) J. Physiol. (Land.) 108, 37-77
Hodgkin, A. L., and Huxley, A. F. (1952) J. Physiol. (Lond.) 116,449-472
Hagiwara, S., and Nakajima, S. (1966) J. Gen. Physiol. 49, 793- 806
Hodgkin, A. L., and Horowitz, P. (1959) J. Physiol. (Land.) 148,127-160
Hutter, 0. F., and Noble, D. (1961) J. Physiol. (Lond.) 157, 335-350
Hagiwara, S., and Takahashi, K. (1974) J. Physiol. (Land.) 238, 109-127
Hille, B. (1975) in Membranes (Eisenman, G., ed) Vol. 3, pp. 255-323, Marcel Dekker, New York
Herman, B., Nieminen, A.-L., Gores, G. J., and Lemasters, J. J. (1988) in Integration of Mitochondrial Function (Lemasters, J. J.. Hackenbrock. C. R.. Thurman. R. G.. and Westerhoff. H. V:, eds) pp. 379-391, Plenum Publishing Corp., NY
Sako, E. Y., Kingsley-Hickman, P. B., From, A. H. L., Foker, J. E.. and Uzurbil. K. (1988) J. Biol. Chem. 263, 10600-10607
Kleber, A. G. (1983) Circ. &es. 52, 442-450 Funder, J., and Wieth, J. 0. (1966) Acta Physiol. &and. 68, 234-245
Keynes, R. D. (1963) J. Physiol. (Land.) 169,690-705 Caroni, P., and Carafoli, E. (1983) Eur. J. Biochem. 132,451- 460
Baker, P. F., and Crawford, A. C. (1972) J. Physiol. (Lond.) 227,855-875
Gilbert, D. L. (1960) J. Gen. Physiol. 43, 1103-1118 Walser, M. (1971) in Symposium Znternational sur le Deficit
Magnesium en Pathologic Humaine (Durlach, J., ed) pp. 55-63, SGEVM, Vittel
Veloso, D., Guynn, R. W., Oskarsson, M., and Veech, R. L. (1973) J. Biol. Chem. 248, 4811-4819
Cohen, S. (1983) J. Biol. Chem. 258, 14294-14308 Raiu. B.. Muruhv. E.. Levv. L. A.. Hall. R. D.. and London, R. E: (i98S) Am. J ‘Physiol. 256, &40-d548
Baylor, S. M., Chandler, W. K., and Marshall, M. W. (1982) J. Physiol. (Land.) 331, 105-137
Cornell, N. W. (1980) Anal. Biochem. 102, 326-331 Corkey, B. E., Duszynski, J., Rich, T. L., Matschinsky, B., and
Williamson, J. R. (1986) J. Biol. Chem. 261, 2567-2574 Rottenberg, k. (1979) Methods Enzymol. 55, 547-569 Flatman. P. W. (1984) J. Membr. Biol. 80. 1-14 Shetty, s. S., and Weiss, G. B. (1988) J. Pharmacol. Exp. Ther.
245,112-119 Fry, C. H. (1986) Magnesium 5, 306-316 Snavely, M. D., Florer, J. B., Miller, C. G., and Maguire, M. E.
(1989) J. Bacterial. 171, 4761-4766 Jennings, M. L. (1985) Annu. Reu. Physiol. 47, 519-533 Tenenhouse, H. S., and Striver, C. R. (1975) J. Clin. Znuest. 55, 644-654
Wehrle, J. P., and Pedersen, P. L. (1982) J. Biol. Chem. 257, 9698-9703
Krebs, H. A., and Veech, R. L. (1970) in Pyridine Nucleotide- dependent Dehydrogenuses (Sund, H., ed) pp. 413-438, Sprin- ger-Verlag, Berlin
Klingenberg, M., Heldt, H. W., and Pfaff, E. in The Energy Level and Metabolic Control in Mitochondria (Papa, S., Tager, J. M., Quagliarello, E., and Slater, E. C., eds) pp. 237-259, Adriatica Editrice. Bari
Garlick, P. B., Brown, T. B., Sullivan, R. H., and Ugurbil, K. (1983) J. Mol. Cell. Cardiol. 15, 855-858
Brierly, G. P., Davis, M., and Jung, D. W. (1987) Arch. Biochem. Biophys. 253, 322-332
Bisaccia, F., and Palmieri, F. (1984) Biochim. Biophys. Acta 766,386-394
Saint-Macary, M., Laine, M., and Foucher, B. (1979) Biochem. Biophys. Res. Commun. 113, 170-174
by guest on May 29, 2018
http://ww
w.jbc.org/
Dow
nloaded from
AG of ATP Hydrolysis and Ion Gradients 20333
56.
57. 58.
59.
60. 61. 62.
63. 64.
65.
66.
67.
68.
69.
70.
71.
72.
73.
74.
75.
76.
Lehninger, A. L., and Reynafarge, B. (1981) Curr. Top. Cell. Regul. l&329-341
Wohlrab, H. (1986) Biochim. Biophys. Acta 853, 115-134 Woods, H. F., Eggleston, L. V., and Krebs, H. A. (1970) Biochem. J. 119,501-510
Ugurbil, K., Petein, M., Maidan, R., Michurski, S., and From, A. H. (1986) Biochemistry 25, loo-107
Wu, R., and Racker, E. (1959) J. Biol. Chem. 234, 1029-1035 Hess, B., and Chance, B. (1961) J. Biol. Chem. 236,239-246 Nuutinen, M., and Hassinen, I. (1981) Biochim. Biophys. Acta
637, 481-489 Knochel, J. P. (1977) Arch. Intern. Med. 137, 203-220 Whang, R., and Ryder, K. W. (1990) J. Am. Med. Assoc. 263,
3063-3064 Kruse, H. D., Orent, E. R., and McCollum, E. V. (1932) J. Biol.
Chem. 96,519-539 Altura, B. M., Altura, B. T., Gebrewold, A., Ising, H., and
Gunther, T. (1983) Science 223, 1315-1317 Altura, B. M., and Altura, B. T. (1981) Fed. Proc. 40, 2672-
2679 Territo, M. C., and Tanaka, K. R. (1974) Arch. Intern. Med.
134,445-447 Mendelson, J. H., Ogata, M., and Mello, N. K. (1969) Ann. N.
Y. Acad. Sci. 162,918-933 Wolfe, S. M., and Victor, M. (1969) Ann. N. Y. Acad. Sci. 162, 973-984
Neely, J. R., Liebermeister, H., Battersby, E. J., and Morgan, H. E. (1967) Am. J. Physiol. 212,804-814
Langendorff, 0. (1895) Pflueger’s Arch. Gesamte Physiol. Menschen Tiere 61, 291-332
Veech, R. L., Raijman, L., Dalziel, K., and Krebs, H. A. (1969) Biochem.J. 115,837-842
Williamson, D. H., Lund, P., and Krebs, H. A. (1967) Biochem. J. 103,514-527
Cornell, N. W., Leadbetter, M., and Veech, R. L. (1979) J. Biol. Chem. 254,6522-6527
Lawson, J. W. R., and Veech, R. L. (1979) J. Biol. Chem. 254, 6528-6537
77. van’t Hoff, J. H. (1885) Arch. Neerl. 20, 239-302 78. Phillips, R. C., George, S. J. P., and Rutman, R. J. (1963)
Biochemistry 2,501-508 79. Debye, V. P., and Huckel, E. (1923) Physikalische 2. 24, 185-
206 80. Colin, E., Clarke, W., and Glew, D. N. (1980) J. Chem. Sot.
Faraday Trans. 1 76, 1911-1916 81. Goldberg, R. N., (1981) J. Phys. Chem. Ref. Data 10,671-764 82. Henderson, L. J. (1928) in Blood, a Study of General Physiology,
Silliman Lectures, Yale University Press, New Haven 83. Sommer, J. R., and Jennings, R. B. (1986) in The Heart and
Cardiovascular System (Fozzard, H. A., Haber, E., Jennings, R. B., Katz, A. M., and Morgan, H. E., eds) Vol. 1, pp. 61-100, Raven Press, New York
84. Nernst, W. (1888) 2. Phys. Chem. 3, 613-637 85. Guynn, R. W., and Veech, R. L. (1973) J. Biol. Chem. 248,
6966-6972 86. Alberty, R. A. (1969) J. Biol. Chem. 244,3290-3302 87. Tani, M., and Neely, J. R. (1989) Circ. Res. 65, 1045-1056 88. Benzinger, T., Kitzinger, C., Hems, R., and Burton, K. (1959)
Biochem.J 71,400-407 89. Levintow, L., and Meister, A. (1954) J. Biol. Chem. 209, 265-
280 90. Rosing, J., and Slater, E. C. (1972) Biochim. Biophys. Acta 267,
275-290 91. Van Slvke. D. D., and Mever. G. M. (1913-14) J. Biol. Chem.
16,1~7-i12 ”
92, Schimmasek, H., and Gurok, W. (1965) Biochem. Z. 343,407- 415
93. Ostwald, W. (1890) Z. Physik. Chem. 6, 71-82 94. Donnan, F. G. (1924) Chem. Reu. 1, 73-90 95. Warburg, E. J. (1922) Biochem. J. 16, 307-340 96. Loeb, J. (1922) J. Am. Chem. Sot. 44, 1930-1941 97. Goldman, D. E. (1943) J. Gen. Physiol. 27, 36-60 98. Hodgkin, A. L. (1951) Biol. Reu. 26, 339-409 99. Leaf, A. (1956) Biochem. J. 62, 241-248
100. Gibbs, J. W. (1875-78) Trans. Corm. Acad. Arts Sci. 3,108-248, 343-524,1875-1878
Additional references are found on p. 20334.
by guest on May 29, 2018
http://ww
w.jbc.org/
Dow
nloaded from
AG of ATP Hydrolysis and Ion Gradients
2 10.0
I 050 mM o.oiw mM “.OW
0 154
by guest on May 29, 2018
http://ww
w.jbc.org/
Dow
nloaded from
T Masuda, G P Dobson and R L VeechThe Gibbs-Donnan near-equilibrium system of heart.
1990, 265:20321-20334.J. Biol. Chem.
http://www.jbc.org/content/265/33/20321Access the most updated version of this article at
Alerts:
When a correction for this article is posted•
When this article is cited•
to choose from all of JBC's e-mail alertsClick here
http://www.jbc.org/content/265/33/20321.full.html#ref-list-1
This article cites 0 references, 0 of which can be accessed free at
by guest on May 29, 2018
http://ww
w.jbc.org/
Dow
nloaded from


![Relative Gibbs measures and relative equilibrium measuressiamak.isoperimetric.info/talks/Oaxaca2019.pdf · Summary DLR theorem [Dobrushin, 1968; Lanford and Ruelle, 1969] Equilibrium](https://img.pdfslide.us/doc/110x75/5eab2f9c76932d37a85ce66c/relative-gibbs-measures-and-relative-equilibrium-summary-dlr-theorem-dobrushin.jpg)