Embed Size (px)
Citation preview

The �ght for courses: Documenting the Sciences-po's
course registration system
Jérôme SANTOUL
May 20, 2014
Master EPP PhD Track - Sciences-po ; Polytechnique ; ENSAE
Supervisor: Sidartha Gordon
1

2
Abstract
This master thesis tries to document the course registration process in Sciences-po Paris.
The main goal is to �nd a way to model the actual system that has few equivalents in other
top-level universities in the world. The model should help understand the strategy pro�le
used by the students to prepare their course registration. Two types of data are used: a
survey conducted ex-post to assess the level of success and failure of the students as well as
understanding how they prepare their registration. The other data is a log-�le of the course
registration server, to observe the behaviour of the students in real time.
Résumé: Ce mémoire de master a pour objectif de documenter les inscriptions pédagogiques de
l'IEP de Paris. La �nalité est de formuler un modèle qui puisse représenter de façon plausible le
système actuel, qui n'a que peu d'équivalents dans le monde universitaire. Ce modèle doit aider à
comprendre comment les étudiants établissent des stratégies pour le jour des inscriptions. Deux
types de données sont utilisées dans ce mémoire. Un sondage a été conduit ex-post auprès des
étudiants de 2e année du collège universitaire pour mesurer leur degré de réussite ou d'échec, et
comprendre leur façon de préparer les inscriptions. L'autre ensemble de données est un �chier-
log extrait du serveur des insription pédagogiques, pour observer le comportement des étudiants
en temps réel.
Acknowledgements I would like to thank my supervisor Sidartha Gordon for his constant
support and guidance, as well as Utku Ünver, Scott Kominers and Alfred Galichon for the
precious insights they provided during the redaction of this master dissertation. Hélène Beaujet
and Thibauld Christin have my eternal gratitude for �nding the huge number the typos I made
while writing this dissertation.
CONTENTS 3
Contents
1 Literature review 5
1.1 Stable matching and e�cient matching: . . . . . . . . . . . . . . . . . . . . . . . 5
1.2 The UMBS-like systems: . . . . . . . . . . . . . . . . . . . . . . . . . . . . . . . . 6
1.3 The various STP systems . . . . . . . . . . . . . . . . . . . . . . . . . . . . . . . 7
1.3.1 The Boston Draft Mechanism: . . . . . . . . . . . . . . . . . . . . . . . . 7
1.3.2 The HBS system: . . . . . . . . . . . . . . . . . . . . . . . . . . . . . . . . 8
1.4 The Sciences-po's system: an example of RTA system . . . . . . . . . . . . . . . 9
1.4.1 The course requirements: . . . . . . . . . . . . . . . . . . . . . . . . . . . 10
1.4.2 The registration Day: . . . . . . . . . . . . . . . . . . . . . . . . . . . . . 10
2 Data and Methodology 12
2.1 The server log-�le: . . . . . . . . . . . . . . . . . . . . . . . . . . . . . . . . . . . 12
2.2 The survey: . . . . . . . . . . . . . . . . . . . . . . . . . . . . . . . . . . . . . . . 14
2.2.1 Strategies and preparations for the course registration day: . . . . . . . . 14
2.2.2 The courses strictly preferred: . . . . . . . . . . . . . . . . . . . . . . . . . 14
2.2.3 The compromises and limits: . . . . . . . . . . . . . . . . . . . . . . . . . 15
3 Model and results: 16
3.1 Documenting the data: . . . . . . . . . . . . . . . . . . . . . . . . . . . . . . . . . 16
3.1.1 The survey: . . . . . . . . . . . . . . . . . . . . . . . . . . . . . . . . . . 16
3.1.2 The log-�le: . . . . . . . . . . . . . . . . . . . . . . . . . . . . . . . . . . 18
3.2 Modelling the RTA mechanism: . . . . . . . . . . . . . . . . . . . . . . . . . . . . 25
A Additional activity plots for all 2nd year available lectures 29
B General activity for other registration days 32
C References 35

CONTENTS 4
Introduction :
For universities across the world, ensuring that their students get the courses that they desire
while maintaining equality of treatment is a constant struggle. Many systems have been
designed, involving, bidding, listing and more. Yet none of these systems have (nor will) be
at the same time ex-post pareto e�cient, clear the set of available courses, ensure equality of
equals, and be strategy proof 1. By equality of equals, we mean that students with the same
preferences should get ex-ante the same course allocation outcome.
Most of the actual literature dealing with the issues treats systems based on either bidding
or stated course preference lists.
The �rst system involves giving students at the beginning of the process an equal number of
"credits". During the bidding phase, students will place bids on some courses and the students
that bid the highest get registered in the course at the cost of their bid. The losers get their
credits back for further bidding rounds. I will refer to this type of system as the University of
Michigan Business Course allocation system (UMBS) following the work of Sömnez and Ünver
(2007)2
The second system requires each student to �le a preference list to the administration of the
university. The administration then applies an algorithm using the lists of stated preferences
of the students and attributes courses to them. Many di�erent methods are used to allocate
courses to students using their stated preferences (tiebreaker, �rst preference �rst etc....) I will
refer to this family of allocation systems as the STated Preferences systems (STP).
These many systems all su�er from the same type of weakness: they allow manipulation
by the students/parents/agents. A UMBS student can adapt his strategy and get a better
payo� by overbidding the courses that are generally popular and underbidding courses that
are unpopular 3. This intuition is also behind the manipulations of some of the STP systems:
agents do not order their preferences truthfully and tend to play around the allocation algorithm.
Yet the STP and UMBS type of course allocation systems are not the only one used by
universities. Other families of systems that are much simpler to understand and much more
uncommon are real time registration systems. In these types of systems, used by Sciences-po
Paris and a few other universities (UofT for undergraduates in Arts and Sciences) around the
world, courses are allocated on a "�rst come, �rst served" basis. Because everything happens in
real time, modelling, documenting and analysing these systems is a di�cult undertaking. I will
refer to the system as a Real-Time allocation system (RTA).
1Pathak and Sönmez (2013), "School Admissions Reform in Chicago and England: Comparing Mechanismsby Their Vulnerability to Manipulation", American Economic Review, 103(1): 80-106.
2Tayfun Sönmez & M. Utku Ünver, 2010. "Course Bidding At Business Schools," International EconomicReview, Department of Economics, University of Pennsylvania and Osaka University Institute of Social andEconomic Research Association, vol. 51(1), pages 99-123, 02.
3Abdulkadiro§lu, Atila, and Tayfun Sönmez. 2003. "School Choice: A Mechanism Design Approach ."American Economic Review, 93(3): 729-747

1 LITERATURE REVIEW 5
The following dissertation will be organized in three parts :
• Part 1 presents a summary of the past literature about allocation systems and emphasizes
some intuitions that are useful for analysing RTA systems. A detailed description of the
Sciences-po's course registration procedure is also presented.
• Part 2 describes the available data in detail as well as their strengths as well as their
shortcomings
• Part 3 describes the main results obtained from the data and presents a model to formalize
the RTA systems.
1 Literature review
Before getting into the meat of the RTA systems, a small reminder about market design mech-
anisms, other multi-units allocation systems along with their strengths and weaknesses can be
of use. Some of their characteristics can also be found in RTA mechanism, for RTA presents
features that come from both UMBS and STP systems.
1.1 Stable matching and e�cient matching:
Among the large family of assignment mechanisms, there is a rule that remains constant: no
assignment mechanism has all the following properties at the same time4.
The properties are5
• Strategy-proof: Strategy-proofness means that no individual can manipulate the mecha-
nism to his advantage by misreporting his preference. This incentive-compatibility condi-
tion ensures that agents report truthfully and the allocation chosen by the rule is based on
true preferences.
• Pareto-Optimality: The �nal allocation is pareto optimal
• Non-Bossiness: Non-bossiness means that no individual can change the allocation without
changing his assigned object. This property prevents collusion among agents because if
a mechanism violates this condition, then an agent may be bribed by others in order to
change the allocation without changing his assigned object.
• Equality of Equals: Equality of Equals requires the mechanism to give the same allocation
to two agents who share the same set (or equal sets) of preferences.
4Anna Bogomolnaia and Hervé Moulin, "A Simple Random Assignment Problem with a Unique Solution",Economic Theory, Vol. 19, No. 3 (Apr., 2002), pp. 623-635
5The de�nition of these properties is taken from: Lars Ehlers, "Top Trading with Fixed Tie-Breaking inMarkets with Indivisible Goods", (2012), unpublished at the time of writing.

1 LITERATURE REVIEW 6
Some systems can have several of these properties at once but never all of them. The top
trading cycle algorithm for instance is Pareto-optimal, non bossy and strategy-proof, but relies
in di�erences of initial endowment to works, implying non equality of equals.
An other important property of allocative mechanism is the notion of stability. A
matching is stable if there is no blocking pair of agent that would prefer to be associated
together rather than with their current partners. For one sides matching, such as students
to course matching, the notion of priority and the right for one agent to claim a given course arise.
Of course, it is di�cult for an allocative mechanism to be both stable and e�cient, especially
if it involves a one side matching with priorities. Multiple systems try to deal with these issues
when it comes to allocate courses. Below are a few examples of such mechanisms.
1.2 The UMBS-like systems:
UMBS-like systems are based around some basic principles and the only variation between them
are usually numbers (i.e number of credits given to each students to bid). The example I will
describe in detail is the one used by the Ross' School of Business of the University of Michigan.
The registration follows the following steps6 :
• Students from the same promotion are assigned the same number of points to bid (either
500 or 1000)
• The students have a time window to place as many bids as they wish on any course they are
allowed to register in. Of course, their total points bid cannot exceed their initial number
of points.
• At the end of the time window, courses are allocated to the ones placing bids. If there are
more bidders than seats in a given course, only the n highest bids get a seat.
• If there are more persons placing a bid at the tie breaking value, the seats are allocated
randomly.
Sömnez and Ünver argue that, while the system looks like a market for courses, there is one
major di�erence between the two: in a standard auction, the bids are a tool to measure who
has the biggest claim on a good. Here it is used for both tie-breaking, but also to measure the
student's preferences. This property allows for manipulating the allocation, as stated in the "tip
and tricks" section of the UMBS website7
Q. How do I get into a course?
A. If you bid enough points to make market clear, a seat will be reserved for you in that section
of the course, up to class capacity.
6http://www2.bus.umich.edu/MyiMpact/academics/register/biddingtips7see: http://webuser.bus.umich.edu/Departments/Admissions/AcademicServices/CurrentUpdates/BiddingTipsTricks.htm
1 LITERATURE REVIEW 7
In the end, Sömnez and Ünver have proved that this type of system is not e�cient, because of
the con�icting roles of the bid. Students are encouraged to overbid popular courses and underbid
unpopular courses even if it is their favourite courses. This property of such system is interesting
for further analysing the RTA mechanism. Before this, I will focus on some STP systems in the
coming part.
1.3 The various STP systems
For this section I will focus speci�cally on two di�erent systems. There are many variations of
these systems and going in detail for all of them would be too time consuming. The �rst system
is the Boston mechanism which is widely used in the US to allocate children to schools8. The
other system is more limited in scope: it is the Harvard Business Schools allocation system,
studied in a recent paper9
1.3.1 The Boston Draft Mechanism:
This analysis is based on the paper by Pathak and Sönmez10. The Boston draft is a mechanism
that revolves around the principle of "First choice �rst". Namely, this draft tries to maximize
the number of agents that get their �rst choices. It works in a �nite number of rounds as follows:
• Agents/students/parents submit to the administration an ordered preference list of
items/courses/schools. The list must include at least two entries and is unlimited in length.
• Before the �rst round agents are ordered in priority according to some criteria (academic
results, income, anything that one can imagine)
• In the �rst round, the �rst entry of each list is read (i.e the administration only looks at
the �rst choice of each agent). Each agent is assigned his �rst choice following the priority
order, if there is still room left. If there is no room left, the agent gets nothing and the
administration moves on to the next agent.
• In the ith round, the administration reads the ith choice of the remaining agents and tries
to assign seats one at the time following the order of priority of the agents. Again, if a
choice has no seat left, the administration moves on.
The authors have noted that because some preference lists were sometimes too short, it was not
uncommon in Boston to have children una�ected to a school after all the rounds were completed.
It was also observed that the una�ected children usually had parents that were reporting only a
few extremely popular schools that were �lled up very quickly in the �rst rounds. On the opposite
8Trivia: it is not used in Boston any more since 20059Budish, Eric, and Estelle Cantillon. 2012. "The Multi-unit Assignment Problem: Theory and Evidence from
Course Allocation at Harvard." American Economic Review, 102(5): 2237-7110Pathak, Parag A., and Tayfun Sönmez. 2008. "Leveling the Playing Field: Sincere and Sophisticated Players
in the Boston Mechanism." American Economic Review, 98(4): 1636-52

1 LITERATURE REVIEW 8
side, some parents played the system and actually misreported their preference. Their strategy
is summarized by the following recommendation found in the board of one parents association:
One school choice strategy is to �nd a school you like that is undersubscribed and put it as a top
choice, OR, �nd a school that you like that is popular and put it as a �rst choice and �nd a
school that is less popular for a �safe� second choice.
Because the system punishes you very hard for failing (you are basically forgotten until the
beginning of the next round if your choice has no room left), sincere agents are severely dis-
advantaged compared to parents that play around the system (the authors call them "strategic").
They have demonstrated that, if all agents are strategic, this allocative system is equivalent
to the (Gale and Shapley 1962)11 allocation mechanism. However, since all agents are not
sophisticated in reality, sophisticated agents are weakly better with the allocation of the Boston
mechanism.
This system has some interesting features that one can �nd in an RTA system. Precisely:
• During a round, only the top choice is considered and all the others are ignored.
• Failing to get an allocation early is very detrimental
• Agents that play the system are weakly better than sincere agents
1.3.2 The HBS system:
This analysis is based on the paper by Eric Budish and Estelle Cantillon. 2012 and this part
will present their conclusion:
The HBS system is a draft system that is quite complicated12 Here is a rough presentation
on how the system works:
1. Phase one: stating preferences
(a) One student at a time chooses a single course and adds it to his "Rank-Order List"
(b) Students are then randomly given a priority order.
2. Phase two: allocating seats
(a) During the �rst round (and all subsequent odd rounds) students are taken in ascending
order of priority. Each taken student is given the highest course in his list where there
11Gale, David, and Lloyd Shapley. 1962. �College Admissions and the Stability of Marriage.� American Math-ematical Monthly, 69(1): 9-15.
12So complicated that Havard organizes a "mock registration" session to make sure that every students under-stands how things work.

1 LITERATURE REVIEW 9
is still room left (i.e, if your �rst choice is full, you get your second choice if there is
still room. If no room left in the 2nd choice, try 3rd etc...)
(b) During the second room (and all subsequent even rounds) students are taken in de-
scending order of priority. Allocation follows the same principle as above.
3. Phase three: add and drop (this is not di�erent from any other US university). One can
model this using a random serial dictatorship on the set of courses where there is still room
left.
As the authors have demonstrated both theoretically and empirically that this draft system
is more e�cient (i.e increases the total welfare) than some more classic strategy-proof systems
like the random serial dictatorship.
What they also showed is that some students are playing the system (this was expected) and
that this strategic over sincere play induces losses of welfare in general.
The optimal strategy the authors found for such a game is, again, to lie on your preferences
and place at the top of the Rank-Order list the courses that are popular, leaving the unpopular
(hence easily obtained even in later rounds) at the bottom of the list.
This is a major change compared to the Boston mechanism where the draft punishes you
for placing very popular choices at the top of your list. With the HBS draft, students are
encouraged to "go happy go lucky" with their stated preferences. The draft will not punish you
for not getting your �rst choice in the �rst round, because it will automatically give you your
next highest choice with room left.
The last feature the system presents is the randomized priority order, that one can �nd in
the RTA system that has no �xed criteria to draw priority.
There are many other allocating systems in the world. In the end, I believe that by covering
the UMBS, Boston and HBS mechanisms to allocate the course, we now have a broad view and
lots of tools to understand how the Sciences-po's registration system works.
1.4 The Sciences-po's system: an example of RTA system
In this section, I will present in detail not only the registration process, but also the courses
requirements of the 2nd year undergraduate students. Both of them are very complex to
describe. I advise a reader only interested in the results and the methodology to skip these
descriptions and go to the next part. For those interested in interpreting the results and
understanding all the constraints the analysis is facing, this is a must read.

1 LITERATURE REVIEW 10
1.4.1 The course requirements:
I am focusing on the spring semester of the 2nd year undergraduate students. During this
semester students were asked to take compulsory courses:
• One fundamental module (French: module fondamental) which is in this semester a pair
lecture-tutorial in history. Tutorials are usually in groups between 15 and 25. Lecture can
host up to hundreds of students.
• One seminary in either law, economics or history. A seminary is usually a lecture of up to
30 students and sometimes includes an associated tutorial.
• One seminary in either Sociology or political science. Same format as the other seminaries.
• One cross-�eld seminary: (French "séminaire interdisciplinaire") �ve to choose from. Topics
of courses are such that they cannot enter the other categories. No associated tutorial.
• Two electives: a 2 hours per week course in groups between 20 and 30.
• One artistic workshop: similar format as above. Themes ranging from drama to the art of
speech through jewellery.
I will refer to these courses types as fundamentals, seminaries, electives and workshops re-
spectively in this dissertation. On top of these compulsory courses, students are allowed to take
optional courses. Namely:
• Up to two language courses. Among these courses are e-learning courses (i.e courses with
unlimited capacities).
• One "dead language course", either Greek or Latin.
• Artistic activities (note: these include working for the "Bureau des Arts")
As one can see this abundance of courses format makes the analysis of the system as a whole
very di�cult. Modelling the preferences of the students as a simple ordered list is an idea
that can be challenged. One cannot freely swap courses in di�erent categories. Because of this
isolation between fundamentals, seminars etc. I do consider the market of fundamentals as an
almost completely separated from the other types markets, bar one exception. All these markets
registrations happen the same day. I will get deeper into this process in the next part.
1.4.2 The registration Day:
All the students at Sciences-po face the same system and the same procedure during their
registration. The only di�erence between a graduating students and a fresh �rst year bachelor
student is the course requirement (i.e freedom and/or complexity of choice). I detailed the 2nd
year university college spring semester course requirement in the previous part. Now let us delve

1 LITERATURE REVIEW 11
into the registration process in itself:
The students have a dedicated day for their registration depending on their year and master's
degree they are in. For the spring semester 2014, 2nd year university college students had their
registration on January 8th from noon to 6PM.
During this window of time, students can access a dedicated website, using a special
login and password. Once logged in, a front page acts as a reminder of the students courses
requirements. Hyper-links lead to the di�erent categories of courses available to the students.
Students have to click them and will access a list of all the courses available in the category13.
Students can then click in the list to get to the course's page. In this page, the course's available
conferences are shown. One can tick boxes at the left of a conference and then click on a
button submit to register the course. If a given conference/lecture/tutorial is full, the box
corresponding will be greyed out and replaced with the letter C (stands for "Complet" in French).
Once the registration for a given course is done, the seat is de�nitively attributed to the
student. At any time during the registration window, a student can freely drop a course and
select another one which is not yet full.
As one can see, the registration process involves quite some clicks. One needs to go through
3 di�erent pages (main, category, course) on the website to register in a course and repeat
the operation each time he wants to register in a new course. One can hardly register at two
courses at the same time. Moreover, because when a seat is granted it can only be released at
the discretion of the student (aka, �rst arrived �rst served), the entire registration process turns
into an arms race. The registration time window is up to 6 hours long, yet the majority of the
registrations happen in the �rst 5 minutes after the beginning because of this principle.
Failing to register in a given course is thus very costly for a student. One student has to load
3 webpages to see if a given course is full or not. It means that when a student discovers that
the course he wanted is full, he must restart the entire process for his secondary choice and is
now late for successful students could register in two courses where he could just get one. Time
is of the essence in the registration.
All these facts make me believe that this registration procedure is unlike any system
described in the literature before. There is no clear strategy pro�le for this system : it cannot
be reduced to a preference list. Courses are too varied to have clear preferences and surveys
support this claim. We can separate categories of courses to get real preference lists. However,
since the registration happens for all types at the same times, seeing the Sciences-po's system
as multiple parallel HBS-like STP is not possible either.
13Link to the list of available electives, a similar list appears on the website: http://college.sciences-po.fr/siteparis/enseignements-electifs-semestre-2

2 DATA AND METHODOLOGY 12
In part 3, I will de�ne what I believe is the best approximation model for this system and
will try to justify this representation by the information extrated from data about the course
registration. However, a description of these data should be conducted �rst, which is the point
of the next part.
2 Data and Methodology
The data I managed to obtain to conduct this dissertation are of two types. The �rst type of
data is a survey submitted to the Sciences-po's students at the beginning of the spring semester.
This survey covered students' strategies about the course registration period as well as courses
that were desired but not obtained.
The second type of data was an extract of the log-�le of the courses' registration server.
2.1 The server log-�le:
This �le is an important dataset that includes all the requests sent to the server since September
2013 up to and including the beginning of March 2014. Each line in the master �le contains a
unique request sent by a user to the master server.
Each user is identi�ed by a 10 digits called the PIDM. Students as well as sta� members all
have their own PIDM.
Each course in this database is identi�ed by a unique 6 digits number called the CRN. It is
important to remember that what is considered a "teaching module" for an ordinary student (i.e
combination of lecture and tutorial) is not with the database. Within the �le, a given lecture
at a given time has its own CRN number and all the associated tutorials have their own CRN,
that are di�erent from the one of the main lecture.
A single line in this master �le can be identi�ed with the PIDM of the user at the origin of the
request, the CRN of the course/tutorial/conference the student wants to register in or out and
the time at which the line was created in the log �le. Various other information are available as
well but I do not have a full understanding of it. Precisely, it was impossible to determine if a
line was a registration, a course drop or a failed attempt.
Because the database includes the registrations of all students, not just the 2nd year ones,
the database has been �ltered using a secondary �le. This �le is a database of all registered
students of Sciences-po for the year 2013-2014.
In order to respect the privacy of all students, all information allowing to identify the person
have been removed before any analysis could be made. This included characteristics such as
age, nationality, sex and name. I assumed that the Sciences-po's students are intelligent people
that, when facing a problem such as getting into desired courses, are using their intellectual

2 DATA AND METHODOLOGY 13
skills. I claim without justifying it that these intellectual skills should not be a�ected by sex
or age or any other comparable characteristics. It is a strong assumption that will need to be
veri�ed, however it will require agreements and additional time that I do not have14.
Last but not least, the CRN numbers are mapped to actual courses name and characteristics
using a third �le. This �le encompasses all the courses available to the second year students,
as well as exams. This �le is matched with the master �le using CRN keys. Because of the
complicated structure of the Sciences-po courses, the analysis about optimality will be restricted
to electives, artistic workshops and seminars.
Why such restriction about pareto optimality ? Multiple reasons can be invoked:
First of all, going in details about tutorials requires complementary data that are not available
now (more on this in the survey subsection).
Secondly, choices of elective/workshops and seminars are mostly driven by the module's theme,
because there is only one session available. There is no choice of timing. Same cannot be said
about the lectures and their tutorials. The only choice a student makes when he is registering
for an elective, a seminar or a conference, is a choice of a pair course theme & time schedule.
Thus one can assume (the survey supports this hypothesis) that we can strictly order the courses
by theme preferences for each student.
For fundamentals, this is a much stronger hypothesis. I do not believe one can order the lectures
and conferences on theme only. My hypothesis is not backed up by data, but it is reasonable to
assume that students universally prefer to have a tutorial from 14h45 to 16h45 rather than one
from 19h15 to 21h15.
Of course, the study of such preferences could help a lot the administration to provide a better
o�er of courses. A simple application to smooth demand consists in giving a given lecture,
two (or more) associated tutorials with schedules that are equally preferred on average among
students.
Let us take a lecture on Thursday with two tutorials, one should be on a Monday at 8AM and
the other one on Friday at 7PM (two equally hated schedules for students/anyone). It would
render the registration process smoother than a schedule with one tutorial on Monday 5PM and
the other at Friday 7PM.
However, the timetable of each course is not found within the database provided. One could
recreate the schedules but it would be an entirely new dissertation.
One should remember that when interacting with the course registration website and clicking
"register", the students (or any sta� member that recti�es mistakes etc...) sends a request to the
registration server. Because students usually pick a lecture, an exam and a tutorial at the same
14On an o�-topic note, I do want to remind the reader that the registration process is a stressful one and yieldspeople to do mistakes. To study how students handle mistakes under stress is not a micro economics problem(more a problem for psychology/sociology) but it remains interesting nonetheless

2 DATA AND METHODOLOGY 14
time during registration, it means that the website sends two requests with the same PIDM but
di�erent CRN at the same time to the server.
The �le has many lines that have the same PIDM and same add date. I chose to group lines
with the same PIDM and add date together for connexion analysis. I do however keep these
lines separated when I determine which courses students are registered in.
2.2 The survey:
The survey is a google form sent to all second year students of Sciences-po of the Paris campus
that are not involved in an exchange program. Students in region campus are not included
because of they face a very di�erent o�er of courses they face. The survey is written in French
and covers several aspects of the courses' registration procedures. The survey is divided in two
parts:
2.2.1 Strategies and preparations for the course registration day:
The �rst half of the survey is dedicated to understand how students prepare the course registra-
tion day. It included:
• Questions about the level of detail of the preparation (choose the lecture, or the lecture
and tutorial etc...)
• Questions about the criteria used to pick/plan to pick a course and their relative importance
• Questions about the preferred type of course.
2.2.2 The courses strictly preferred:
The second part of the survey was aimed at gathering enough information to perform a top
trading cycle algorithm with the students and their courses. For each course type (fundamen-
tals, seminars, electives and artistic workshops), students were asked if they got all their "�rst
choices" i.e the course they wanted at the time they desired the most. If for a given course type,
a student answers no, then the student is redirected to a list of all the available courses of the
said type. The student is asked to tick all the courses of the list that he strictly prefers over his
actual course(s).
The only exception was with the fundamental courses. I considered this type to be too di�cult
to examine because each course is a pair of lecture and tutorials. Because of the sheer volume
of available tutorial for a single lecture, it was impossible to have the students point to the
lectures they wanted and keep the entire survey human readable. To compensate, I only asked
the students to say if they had a problem getting the tutorial at the time they wanted or if they
could not get registered in the main lecture at all. The study of the demand for tutorial and
modelling this demand could be a dissertation in itself.
2 DATA AND METHODOLOGY 15
A last section was left at the end of the survey for comments.
2.2.3 The compromises and limits:
This survey su�ers several drawbacks for many di�erent reasons. First of all, as stated in the
paragraph above, one type of course does not have the relevant data to perform a top trading
cycle algorithm on it, for the sake of readability.
Secondly, if a student has more than one course in a given category (eg. electives), and ticks
at least one course in the preferred courses list, there is no way to tell which course is the one
the student wants to drop in favour of the ticked one(s). This is purely a technical limitation
imposed by the google form : it is impossible to mix a scale and a ticking list in the same
question. However, it remains possible to test for multiple combinations of preferences and
apply the top trading cycle on each of them.
Moreover, the survey did not include the language courses at all as well as Latin and Greek.
On the one hand, Greek and Latin are pure outliers and not compulsory courses. The demand
for these two courses is usually low compared to compulsory courses.
On the other hand, language courses at Sciences-po, while not o�cially compulsory are heavily
recommended for students, for an IELTS or equivalent language certi�cation test is required
to be admitted in an English speaking university for the exchange year. These courses are
organized and monitored independently of the other courses. Each semester, the language
department o�ers the same set of courses to every student of the IEP, regardless of their year,
�uency in a given language or degree. Students are then free to register in any of the proposed
course as long as there is no time con�ict and they meet the skill requirement. In concrete
terms, it means that the studied students (2nd year undergraduate) in this dissertation are
competing with all the other students in the IEP. There are way too many parameters entering
the equation and I have no clue on how to approach this issue. Thus it is left out of the board.
Finally, some students in the 2nd year undergraduate cohort are dual degree students that follow
courses in other universities. These are the SMASS (math major coupled with Sciences-po's
Bachelor), the SPIV (philosophy major coupled with Sciences-po's Bachelor) and the SCUBE
(read it S-cube, biology/physics/math major). These students have courses requirements that
are close to the ones of the normal students (they draw in a restricted pool of courses). However,
some of them were able to "bypass" capacity requirements of some courses through direct
intervention of their sta�. These students are not many but they present a potential bias toward
e�ciency of the system, since they were able to get their �rst choices when they should not have
under the normal procedure.
Naturally, the survey did not obtain a 100 % response rate, but with more than 560 responses
for about 900 students targeted, I consider the survey to be a success. While the network of
preferences is not complete, it allows to perform a serious TTC algorithm anyway.

3 MODEL AND RESULTS: 16
3 Model and results:
This part presents the two main contributions of this dissertation :
• To document my data as much as possible in order to provide micro-foundation for the
next sub-section.
• To propose a model that could represent more or less the actual RTA system, and acts as
a starting point for theoretical analysis.
3.1 Documenting the data:
3.1.1 The survey:
Students response to the question on how they prepared their registration were expected:
1. 93% of the students have a precise idea of the courses they want to take, including the
timing of the tutorial and they also have their 2nd choices ready, should something go
wrong.
2. The remaining percents are people who did not bother about the timing of their courses.
3. When choosing a course, the them/title of the course is the most important criteria for
almost all students.
4. Students are more picky when it comes to choose the timing of the tutorials of their electives
and seminars than when choosing tutorials for their fundamentals.
5. A minority of students (40%) do not use the students' magazine15 when choosing their
courses/preparing their list of choices. However, for 39% of students (i.e 63% of the users
of la péniche), it is only a minor criteria.
6. Finally, a large number of students declare they are plying the system. More precisely:
(a) 53% of the students declare to register �rst in the course they think are popular (i.e
�lls quickly)
(b) 21% of the students declare playing "truthfully" i.e they register �rst in the courses
they prefer.
15http://lapeniche.net/

3 MODEL AND RESULTS: 17
(c) The remaining 19% do not bother about it and register in courses following their order
of appearance in the website16 (i.e fundamentals �rst, seminars second, electives third
and workshop last).
One fact is ba�ing: out of the 565 students who responded to the survey, only 96 got all their
�rst choices for every course type (and thus can brag about winning the "Just as Planned"
Prize). Results for students that were partially successful (but got most of their �rst choices)
are summarized below :
Fundamentals? Seminars? Electives? Workshops? Number FractionY Y Y Y 96 (125 w/ 2 major) 17.0% (22.1)N Y Y Y 41 7.26%Y N Y Y 9 1.59%Y Y N Y 28 4.96%Y Y Y N 21 3.72%
Students that were quite successful 195 (224) 34.5% (39.6)
Table 1: Table of success rate for students who performed well
A relatively high percentage of students did not have their �rst choice of fundamental. This
does not mean they did not get in the lecture but rather that they failed to get the tutorial they
wanted.
Some students were very unlucky or late and had courses that were only second choices or
even below (no dual degree included):
Fundamentals 1st choice? Seminars? Electives? Workshops? Number FractionN N N N 61 10.8%Y N N N 14 2.48%N Y N N 42 7.43%N N Y N 25 4.24%N N N Y 44 7.79%
Students very unsuccessful 186 32.9
Table 2: Table of success rate for students who performed poorly
Although the percentage of students falling in the "Not as Planned" category seems quite
high, one should remember that they are likely to be overrepresented because of self selecting bias.
This leaves us with a third of the students who performed well in two categories of courses.
It is also useful to note that some course categories tend to have a higher success rate than others:
16Joke aside, this is the category I belonged to

3 MODEL AND RESULTS: 18
Course type: Global success rate Fraction who got courses they did not plan to take:Fundamentals 40% 20%Seminars 63% 15%Electives 50% 21%Workshops 61% 18%
Table 3: Table of success rate by types of courses
Again, the low success rate for the fundamental courses (lectures+ tutorials) should not be
over-interpreted: since tutorials' group are small, it is extremely di�cult to get in the one
one wants. This contrasts a lot with the interest that students have in fundamentals. When
asked "What type of course type do you value the most?", 53% of the students answered
"fundamentals", 27% the electives and only 13% preferred the seminars. The remaining 7%
showed strong enthusiasm for language courses or Greek.
Why such a di�erence between the success rate of the seminars and the interest in said
seminars? One reason is found within the wording of the question "What type of course do you
value the most?". It appears that 2nd year student believe that the choice of the fundamental
will strongly de�ne their later studies at Sciences-po.
The very high success rate for seminars and workshops leaves room for two hypotheses:
1. Lots of students tend to rush for these types of course and �nd themselves with their �rst
choice of tutorial already full (full of students that rushed to the tutorials) when they are
done with seminars.
2. Students are rushing for tutorials and those �ll up so quickly that a lot of students are left
with less favourable ones.
One statistic that puzzles me is the high number of people that ended up with courses they
did not plan at all to take. Could this indicate a lack of planned 2nd choices? Additional
input on the matter could help. As a �nal remark, one could do additional statistic based on
the preferences of students (success rate of student who prefer seminars vs the one who prefer
fundamentals). I did not do them because of time constraints and the incomplete nature of this
survey. If one could make such type of survey a compulsory part of the undergraduate studies,
it could yield much stronger results.
3.1.2 The log-�le:
Summarizing a survey is rather easy. However, constructing and designing summary statistics
for a log �le of requests was quite a challenge. I tried to �nd a compromise between generality,
readability and ease of representation. Since I was not able to make a di�erence between a

3 MODEL AND RESULTS: 19
request to register in a course and a request to drop a course, I chose to represent the "activity"
of students or the "activity" of a course.17
The general activity of the cohort The term "activity" refers to the number of received
requests during a time interval. To limit redundancy, I sometimes eliminated lines with a du-
plicated PIDM, CRN and time triplet (i.e requests received at the same time, from the same
student and the same course).
Figure 1: The general activity of the server on January 8th 2014
The bottom graph is a regression of the log number of requests vs the log of time. A clear
correlation between the two appears. That supports the idea that the activity on the server
follows either an exponential distribution or a Pareto distribution. The regression parameters
given in the graph are obtained using the following regression equation :
log(”activity”) = log(Cst)− 1
τ× log(t) (1)
One can see that the constant parameter (that represents the number of requests sent during
the �rst minute of the registration process is abnormally large and the characteristic time is
extremely large as well. This suggests that in a fraction of seconds, the activity drops by half.
Pareto's regression equation on the other hand yields:
fP(x) = log(k) + k × log(xmin)− (k + 1) log(x) (2)
17Some regressions have detailed results in the annex.

3 MODEL AND RESULTS: 20
This equation imposes a cumbersome requirement on the coe�cients (namely the constant and
the slope of the curve are linked since xmin is �xed, and the equation does not hold.
Things do become more interesting however when one shortens the length of the time interval:
Figure 2: The general activity of the server on January 8th (5sec interval)
The graph represents the same activity as the graph above, with a shorter time interval. It
shows an interesting phenomenon at the beginning of the registration: there is a warm-up time
during which not all students are connected. What can explain this? A simple reason comes
immediately in mind: not every student is smashing the refresh button to get in the registration
website as soon as possible. Some students are checking their clock which is not an optimal
process. What this implies is that students frenetically smashing their refresh button gain a time
advantage.
For the second log-log regression, I removed all the points that were representing the warm-up
part to diminish the disturbance. The �tting gives better but still unsatisfying results: were are
predicting over 10000 peak activity (there are only one thousand second year students so activity
cannot got over one thousand) and the "activity's half life" is around one second.
The pattern of exponential decrease is not speci�c of the Paris campus nor the 2nd year students.
Most of the other registration days seem to follow the same law (the plots are in the annex)
However, despite its unrealistic �tting results, I will consider that the activity follows an
exponential decrease after the maximum activity is reached.

3 MODEL AND RESULTS: 21
The activity of speci�c courses: The exponential decrease of general activity is not equally
spread over the available courses. Some seminars clearly feature such behaviour while others are
following completely random patterns:
Figure 3: Activity for the tutorial number 55848
The course number 55848 (no course name or teacher name will be communicated in the
dissertation as part of an agreement with Sciences-po) has a peak of activity at the very beginning
of the registration period and very few requests after. On the other hand:
Figure 4: Activity for the tutorial number 55984
the conference number 55984 is heavily requested at the end of the registration procedure,
probably indicating a very low demand: it was probably picked because of the lack of room in
any other conference.

3 MODEL AND RESULTS: 22
The observed patterns are also found with lectures18:
Figure 5: Activity for the lecture number 54137
The scheme above looks like a case study, with the exact same exponential decrease pattern.
However, some other lectures have a "smoother activity". This brings an explanation to the
persistence of activity even after the �rst 10 minutes of the registration window. This is the
manifestation of a not very well know practice of the administration. This practice is nicknamed
"plateau opening". The administration opens up additional seats during the registration window.
Combined with some students dropping some of their course to take other ones, this means that
�lled courses can still reopen during the window. In the survey, people reported to do "lurking"
opened seats during the entire registration window. This behaviour is re�ected in the activity
graphs.
The problem of doubloons: As stated during the data description, I have removed the
triplets with duplicated PIDM, CRN and time. This does a�ect the activity, sometimes by a
large quantitative factor. Here is an example:
This graph shows the activity of the lecture 54137. The activity is not exponentially decreas-
ing suggesting that this course was middle rated by students. Now below is the activity graph
of the same courses with all the duplicated triplets removed:
Qualitatively, there is no major change: the activity is still spread out. Quantitatively, the
lecture appears to include a lot of people in the end whereas with doubloons dropped, only
17 requests remain. This is puzzling and a better understanding on the log-�le mechanisms is
necessary.
18The plots for all lectures are in the annex

3 MODEL AND RESULTS: 23
Figure 6: Activity for tutorial 59408 with duplicates:
Figure 7: Activity for the tutorial 59408 without duplicates :
Time interval between requests: Since the general activity of students follows an exponen-
tial distribution (this is my theory anyway), it implies a lot of things:
• The probability of a student to get into a course during a time interval is linear and
increasing with the length of the said interval: P(”register during dt”) = dtτ
• The probability of getting registered is not a�ected by the presence of other students (in
theory yes, in practice no because of server overloads that disturbs everyone).
• students starts the registration with a number of "course requirements" and try to evacuate
them as fast as possible (similar to radioactive nucleus evacuating extra proton/neutron).
Once they have evacuated their requirements, they leave the process.
3 MODEL AND RESULTS: 24
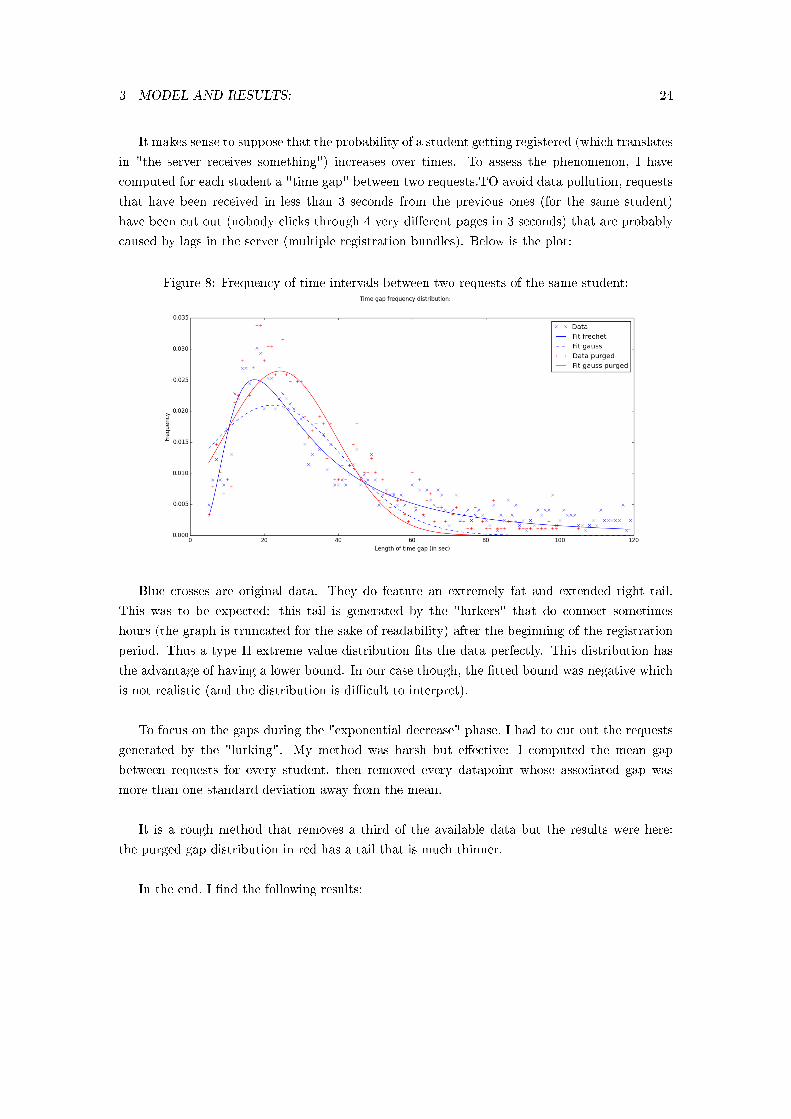
It makes sense to suppose that the probability of a student getting registered (which translates
in "the server receives something") increases over times. To assess the phenomenon, I have
computed for each student a "time gap" between two requests.TO avoid data pollution, requests
that have been received in less than 3 seconds from the previous ones (for the same student)
have been cut out (nobody clicks through 4 very di�erent pages in 3 seconds) that are probably
caused by lags in the server (multiple registration bundles). Below is the plot:
Figure 8: Frequency of time intervals between two requests of the same student:
Blue crosses are original data. They do feature an extremely fat and extended right tail.
This was to be expected: this tail is generated by the "lurkers" that do connect sometimes
hours (the graph is truncated for the sake of readability) after the beginning of the registration
period. Thus a type II extreme value distribution �ts the data perfectly. This distribution has
the advantage of having a lower bound. In our case though, the �tted bound was negative which
is not realistic (and the distribution is di�cult to interpret).
To focus on the gaps during the "exponential decrease" phase, I had to cut out the requests
generated by the "lurking". My method was harsh but e�ective: I computed the mean gap
between requests for every student, then removed every datapoint whose associated gap was
more than one standard deviation away from the mean.
It is a rough method that removes a third of the available data but the results were here:
the purged gap distribution in red has a tail that is much thinner.
In the end, I �nd the following results:

3 MODEL AND RESULTS: 25
Data used mean standard deviation
Original data 22.1435717 19.04684448
Purged Data 24.24396417 15.07888027
The standard deviation must be interpreted carefully for the data is highly skewed. On average,
during the "exponential decrease phase" (or burn phase), it takes 20 seconds for a student to
register in a course. This mean is purely theoretical because of the many accidents and errors
that might occur during the registration process and in�ate the average the gap.
3.2 Modelling the RTA mechanism:
This section presents what I believe is the best way to model the Sciences-po's RTA mechanism.
The properties of such a model are not detailed in the dissertation (it is not its goal) but it gives
a base to conduct further (and more theoretical) research.
Courses:
There are a �nite number Q of di�erent types of courses. Each course Cq can only belong to a
single type of course q. Each course has a capacity kC ∈ [0; 1]. The global capacity of all courses
is thus K ∈ [0; 1]A, where A is the total number of available courses.
Important note about categories: a course from any given category is fully substitutable
with courses from the same category but cannot be substituted with courses from any other
category.
I borrow this hypothesis from Budish and Cantillon 201219 that were working with a
continuum of students normalized to 1; the courses capacities are also normalized to 1. I assume
that the preferences of the students are common knowledge. Since everything is normalized, it
is equivalent to assume that the individual preferences are a private type of each student but
the general distribution of preferences is common knowledge20.
I am assuming that students do not communicate their preferences or choices in advance
to other students. This is absolutely unveri�ed in reality, and there are evidences of this
phenomenon in real life (i.e some students admitted in the survey to coordinate with their
friends to get in the same course). To keep the complexity under check, I ignore this aspect of
the process. One can of course add a cheap talk game in the model to make it look more realistic.
Each student can take at most one seat in a given course and at most mq ≥ 1 in each
category q (m stands for maximum).
19E. Budish and Cantillon, "Multi Unit assignment Problem, the case of the HSB mechanism", AER, 201220This follows from Mas-Colell (1984)

3 MODEL AND RESULTS: 26
Preferences:
Each student s has a set Q sets of ordered preferences for all categories together. I choose this
representation since students have to take courses in every category, at the same time. It is easier
to consider preferences inside a given category. However the ultimate goal for each student is to
get his/her �rst choices in each category and maximizing the global welfare across all categories
of courses. The strict order can be imposed for applying a top trading cycle. However, what I
am trying to do with the data (�nd one instance of trading cycle within one course category)
does not require a strict ordering. I am not aiming at �nding the Pareto-Optimal allocation. I
am aiming at a Pareto improving allocation (I am aiming for better, not best).
Note: The data are too incomplete to support a model featuring this type of preferences. What
the survey contains is the set of preferred courses in each category (this set can be empty). This
is far from an ordered list.
Allocation:
All the N students (noted s) end up at the end of registration day with an allocation of courses
noted as. The only feasible allocation is where the student takes exactly the required number
of courses in each category. The allocation takes place in discrete time periods (lasting about
20-30 sec according to empirical data). During each time period, students can try to register in
any given course of any category. The attempt can succeed or not.
At each period, students are randomly given a priority order.
Strategy:
Each student (i.e player) is trying to maximize his utility by getting his topmost choice on each
course category.
A strategy σ for a student s thus has the following form:
• It is an ordered list of courses. It can have any size.
• The list is �xed at the beginning of the registration window and does not change during
the registration process.
• At the nth period, a student tries to register in the nth course in the list if he is allowed
to. If the nth item in the list is a course that cannot be taken because the student has
reached his maximum number of seats in the course's category, he immediately tries to
register in the next entry in his list (you do not lose a turn because you have met your
course requirements).
• If a student's attempt to register fails, he moves to the next item of the list in the next
period.
To represent the imperfect planning of some student, about a half of the students should play
this game normally and the other half should play it truthfully i.e their ordered list is the exact

3 MODEL AND RESULTS: 27
copy of their preference list.
Lurking:
The lurking phase is modelled as a random serial dictatorship that happens in three phases:
1. Students release some seats in courses they are in
2. Students are randomly given a priority order
3. The serial dictatorship takes place over the set of free seats
Conclusion :
Real time allocation systems are a family of systems that are still not studied in detail for a
number of reasons. Among them are the huge number of parameters that interfere with the
game such as stress and technical di�culties. Nonetheless some properties can be inferred from
these systems:
They lead to an arms race between students, trying by any mean to gain a lead over their
fellows. This arms race translates into and exponential distribution of the activity of students
in the beginning of the process, followed by a a long quest for remaining opened seats. This
exponential distribution allows to build up some statistics over each course, provided one has
su�cient numbers of data points. The half life (time interval after which the activity over one
course is halved) of each course and the average level of activity can be a good proxy for its
popularity ex-ante.
After extensively browsing the literature on multi-unit assignment mechanism, I came to
the conclusion that no system can achieve a "perfect" allocation. Each has advantages and
drawbacks. In the case of Sciences-po, the systems has been proved extremely simple to grasp
for all students. Its major drawback however is its inherent stressful nature. This stress is
further ampli�ed by the technical problems encountered by servers during the "burn phase" of
the registration. Its second drawback is to force student to register in lots of di�erent course
markets (read: course categories) at the same time, forcing students to sacri�ce courses in one
category to have a better chance to get the course they want in another category. I propose the
following change for the 2nd year course registration:
Extend the system already used in the Paris School of International A�airs. Have di�erent
registration times for di�erent course categories (fundamentals and seminars in the morning,
electives and workshops in the afternoon).
Transform the real-time system in a discrete type system: give students 1-3 minutes to tick a
single course in the website and apply for registration. If the number of applicants for a course
exceed the course capacity, the system should randomly select the one who should be accepted
and notify the student about it. Although it will make the registration last longer, it will induce

3 MODEL AND RESULTS: 28
less stress and encourage students to spread out to maximize their chances to get in.
Finally, conduct preliminary surveys about the students �rst choices and publish some results. It
will allow people to realize that some courses are overcrowded and hopefully limit the magnitude
of this rush during the d-day. There is no need to do it fancy, a simple Google form or Doodle
can do the trick.
A ADDITIONAL ACTIVITY PLOTS FOR ALL 2ND YEAR AVAILABLE LECTURES 29
Annex:
A Additional activity plots for all 2nd year available lec-
tures
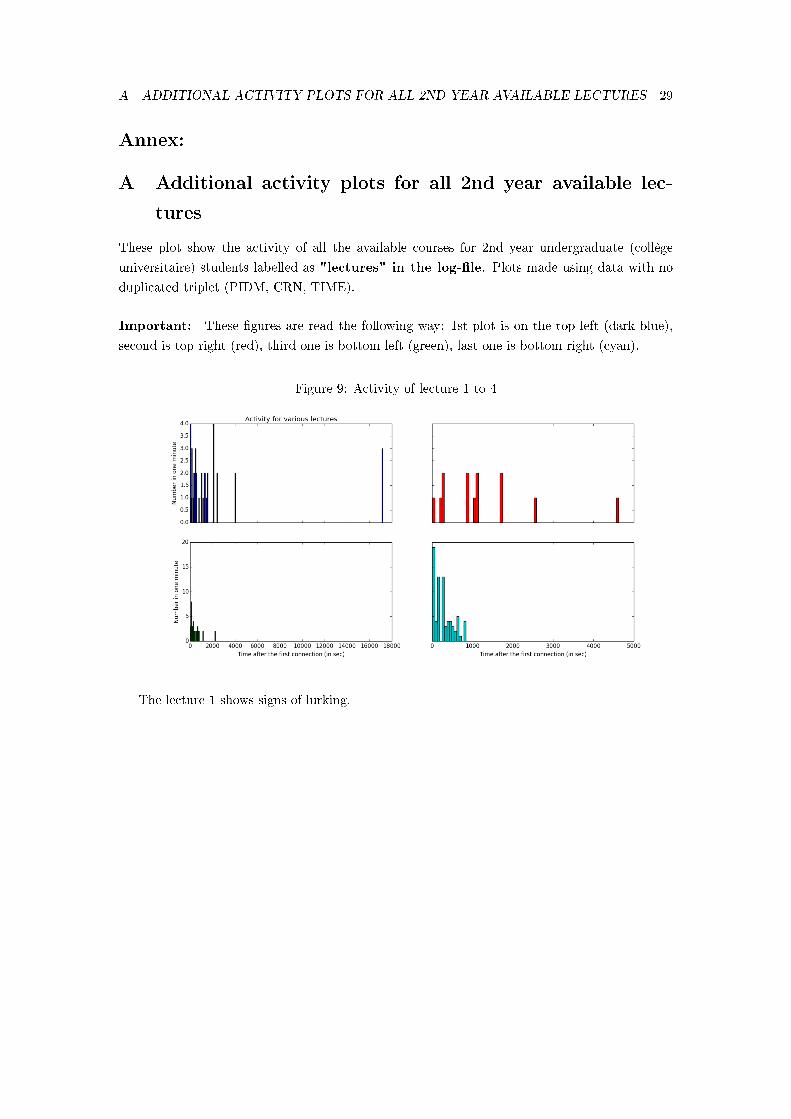
These plot show the activity of all the available courses for 2nd year undergraduate (collège
universitaire) students labelled as "lectures" in the log-�le. Plots made using data with no
duplicated triplet (PIDM, CRN, TIME).
Important: These �gures are read the following way: 1st plot is on the top left (dark blue),
second is top right (red), third one is bottom left (green), last one is bottom right (cyan).
Figure 9: Activity of lecture 1 to 4
The lecture 1 shows signs of lurking.
A ADDITIONAL ACTIVITY PLOTS FOR ALL 2ND YEAR AVAILABLE LECTURES 30
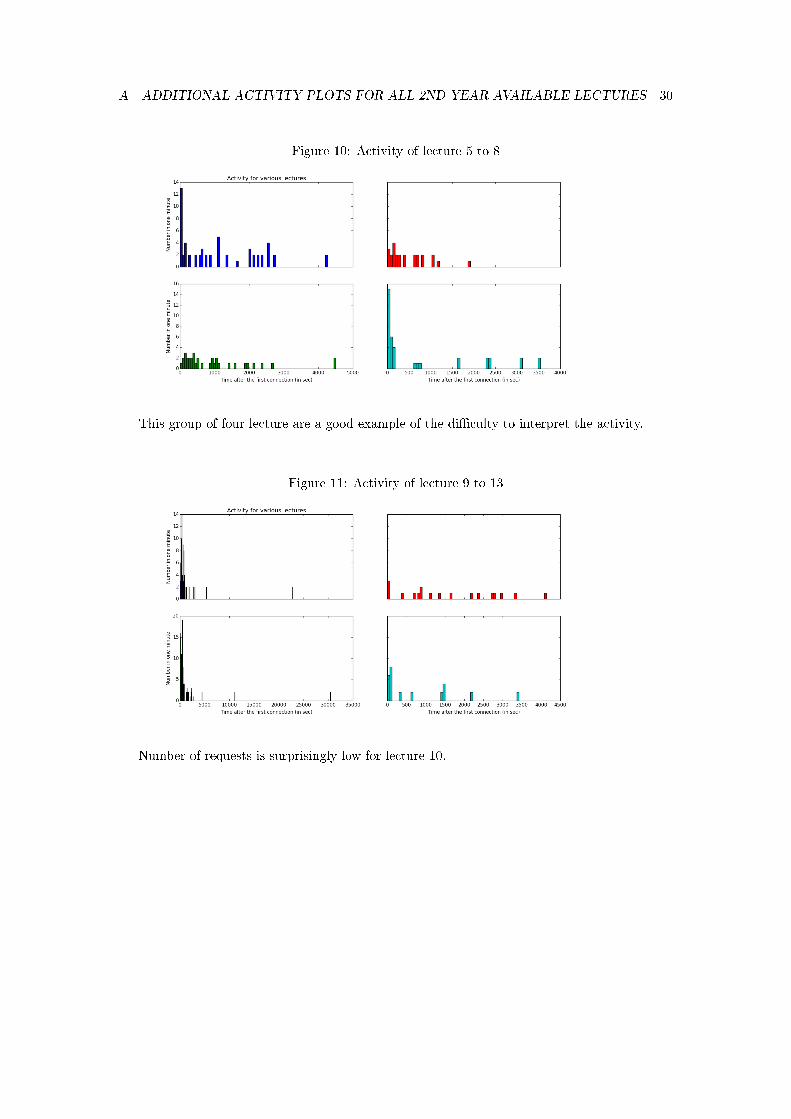
Figure 10: Activity of lecture 5 to 8
This group of four lecture are a good example of the di�culty to interpret the activity.
Figure 11: Activity of lecture 9 to 13
Number of requests is surprisingly low for lecture 10.

A ADDITIONAL ACTIVITY PLOTS FOR ALL 2ND YEAR AVAILABLE LECTURES 31
Figure 12: Activity of lecture 14 to 18
Lecture 18 only has requests during the �rst minute. Keep in mind that there are other re-
quests for the same lecture but for other registration days (e.g the ones for dual degree students).

B GENERAL ACTIVITY FOR OTHER REGISTRATION DAYS 32
B General activity for other registration days
The following plots are constructed using the same method as in the main body of the disserta-
tion. The only di�erence is the use of a scatter plot instead of a bar plot.
Figure 13: General activity for Paris on Jan 6th
OLS Regression Results
==============================================================================
Dep. Variable: y R-squared: 0.660
Model: OLS Adj. R-squared: 0.659
Method: Least Squares F-statistic: 565.0
Date: Mon, 19 May 2014 Prob (F-statistic): 3.82e-70
Time: 18:01:23 Log-Likelihood: -225.97
No. Observations: 293 AIC: 455.9
Df Residuals: 291 BIC: 463.3
Df Model: 1
==============================================================================
coef std err t P>|t| [95.0% Conf. Int.]
------------------------------------------------------------------------------
const 6.4425 0.233 27.695 0.000 5.985 6.900
x1 -0.8265 0.035 -23.769 0.000 -0.895 -0.758
==============================================================================
Omnibus: 1.723 Durbin-Watson: 1.628
Prob(Omnibus): 0.422 Jarque-Bera (JB): 1.799
Skew: -0.178 Prob(JB): 0.407
Kurtosis: 2.856 Cond. No. 51.9
==============================================================================

B GENERAL ACTIVITY FOR OTHER REGISTRATION DAYS 33
Figure 14: General activity for Paris on Jan 7th
OLS Regression Results
==============================================================================
Dep. Variable: y R-squared: 0.857
Model: OLS Adj. R-squared: 0.857
Method: Least Squares F-statistic: 2743.
Date: Mon, 19 May 2014 Prob (F-statistic): 5.05e-195
Time: 17:59:28 Log-Likelihood: -341.57
No. Observations: 458 AIC: 687.1
Df Residuals: 456 BIC: 695.4
Df Model: 1
==============================================================================
coef std err t P>|t| [95.0% Conf. Int.]
------------------------------------------------------------------------------
const 12.2510 0.203 60.293 0.000 11.852 12.650
x1 -1.5341 0.029 -52.374 0.000 -1.592 -1.477
==============================================================================
Omnibus: 9.221 Durbin-Watson: 1.864
Prob(Omnibus): 0.010 Jarque-Bera (JB): 9.318
Skew: -0.348 Prob(JB): 0.00948
Kurtosis: 3.061 Cond. No. 60.2
==============================================================================

B GENERAL ACTIVITY FOR OTHER REGISTRATION DAYS 34
Figure 15: General activity for Reims region Campus on Jan 8th
OLS Regression Results
==============================================================================
Dep. Variable: y R-squared: 0.792
Model: OLS Adj. R-squared: 0.790
Method: Least Squares F-statistic: 343.0
Date: Mon, 19 May 2014 Prob (F-statistic): 1.88e-32
Time: 17:55:32 Log-Likelihood: -81.505
No. Observations: 92 AIC: 167.0
Df Residuals: 90 BIC: 172.1
Df Model: 1
==============================================================================
coef std err t P>|t| [95.0% Conf. Int.]
------------------------------------------------------------------------------
const 10.5568 0.472 22.360 0.000 9.619 11.495
x1 -1.5352 0.083 -18.519 0.000 -1.700 -1.371
==============================================================================
Omnibus: 4.068 Durbin-Watson: 1.092
Prob(Omnibus): 0.131 Jarque-Bera (JB): 4.079
Skew: -0.495 Prob(JB): 0.130
Kurtosis: 2.709 Cond. No. 44.8
==============================================================================

C REFERENCES 35
C References
1. Pathak and Sönmez (2013), "School Admissions Reform in Chicago and England: Com-
paring Mechanisms by Their Vulnerability to Manipulation", American Economic Review,
103(1): 80-106.
2. Tayfun Sönmez & M. Utku Ünver, 2010. "Course Bidding At Business Schools," Interna-
tional Economic Review, Department of Economics, University of Pennsylvania and Osaka
University Institute of Social and Economic Research Association, vol. 51(1), pages 99-123,
02.
3. Abdulkadiro§lu, Atila, and Tayfun Sönmez. 2003. "School Choice: A Mechanism Design
Approach ." American Economic Review, 93(3): 729-747
4. Anna Bogomolnaia and Hervé Moulin, "A Simple Random Assignment Problem with a
Unique Solution", Economic Theory, Vol. 19, No. 3 (Apr., 2002), pp. 623-635
5. Lars Ehlers, "Top Trading with Fixed Tie-Breaking in Markets with Indivisible Goods",
(2012), unpublished at the time of writing
6. Budish, Eric, and Estelle Cantillon. 2012. "The Multi-unit Assignment Problem: Theory
and Evidence from Course Allocation at Harvard." American Economic Review, 102(5):
2237-71
7. Pathak, Parag A., and Tayfun Sönmez. 2008. "Leveling the Playing Field: Sincere and
Sophisticated Players in the Boston Mechanism." American Economic Review, 98(4): 1636-
52
8. Gale, David, and Lloyd Shapley. 1962. �College Admissions and the Stability of Marriage.�
American Mathematical Monthly, 69(1): 9-15.
9. Mas-Colell A. 1984. "On a Theorem of Schmeidler." JME 13(1984): 201-206
10. L.S. Shapley and H. Scarf, 1974, On Cores and Indivisibility. Journal of Mathematical
Economics 1, 2337
11. Michel Balinski & Tayfun Sönmez. 1998. "A Tale of Two Mechanisms: Student Place-
ment." Journal of Economic Theory 84: 73-94
12. Che , Yeon-Koo and Koh, Youngwoo, Decentralized College Admissions (February 20,
2014)21
21Available at SSRN: http://ssrn.com/abstract=2399743 or http://dx.doi.org/10.2139/ssrn.2399743
LIST OF TABLES 36
List of Tables
1 Table of success rate for students who performed well . . . . . . . . . . . . . . . 17
2 Table of success rate for students who performed poorly . . . . . . . . . . . . . . 17
3 Table of success rate by types of courses . . . . . . . . . . . . . . . . . . . . . . . 18
List of Figures
1 The general activity of the server on January 8th 2014 . . . . . . . . . . . . . . . 19
2 The general activity of the server on January 8th (5sec interval) . . . . . . . . . 20
3 Activity for the tutorial number 55848 . . . . . . . . . . . . . . . . . . . . . . . . 21
4 Activity for the tutorial number 55984 . . . . . . . . . . . . . . . . . . . . . . . . 21
5 Activity for the lecture number 54137 . . . . . . . . . . . . . . . . . . . . . . . . 22
6 Activity for tutorial 59408 with duplicates: . . . . . . . . . . . . . . . . . . . . . 23
7 Activity for the tutorial 59408 without duplicates : . . . . . . . . . . . . . . . . . 23
8 Frequency of time intervals between two requests of the same student: . . . . . . 24
9 Activity of lecture 1 to 4 . . . . . . . . . . . . . . . . . . . . . . . . . . . . . . . . 29
10 Activity of lecture 5 to 8 . . . . . . . . . . . . . . . . . . . . . . . . . . . . . . . . 30
11 Activity of lecture 9 to 13 . . . . . . . . . . . . . . . . . . . . . . . . . . . . . . . 30
12 Activity of lecture 14 to 18 . . . . . . . . . . . . . . . . . . . . . . . . . . . . . . 31
13 General activity for Paris on Jan 6th . . . . . . . . . . . . . . . . . . . . . . . . . 32
14 General activity for Paris on Jan 7th . . . . . . . . . . . . . . . . . . . . . . . . . 33
15 General activity for Reims region Campus on Jan 8th . . . . . . . . . . . . . . . 34