Embed Size (px)
Citation preview
145Cityscape: A Journal of Policy Development and Research • Volume 20 Number 2 • 2018U.S. Department of Housing and Urban Development • Office of Policy Development and Research
Cityscape
The Geography of Vacant Housing and Neighborhood Health Disparities After the U.S. Foreclosure CrisisKyungsoon WangGeorgia Institute of Technology
Dan Immergluck Georgia State University
Abstract
• Objectives: We examined the impact of long-term (6 months or more) vacant housingand various durations of vacancy on a variety of health outcomes at the neighbor-hood level across three types of U.S. metropolitan areas (metros): (1) those that haveexperienced consistently strong growth, (2) those that have undergone weak growth,and (3) those hit hardest by the foreclosure crisis.
• Methods: We used hierarchical linear modeling with long-term vacant housing dataderived from the U.S. Postal Service as well as data for health outcomes obtainedfrom the Centers for Disease Control and Prevention to examine the health effects ofresidents who resided in 19,243 neighborhoods (census tracts) in the 50 largest met-ropolitan areas during the housing recovery.
• Results: Neighborhood long-term vacancy is significantly associated with neighborhoodhealth problems in adults, but the association between vacant housing and neighbor-hood health outcomes varies based on the growth trajectory of the metropolitan area.For most health outcome measures, long-term vacancies are more strongly associatedwith poor outcomes in strong-growth and hard-hit metros than in weak-growth metros,but the reverse is true for asthma and mental health. Our findings also suggest that verylong-term (more than 3 years) vacant housing increased significantly after the housingcrisis and was significantly associated with health problems in all three types of metros.
• Conclusions: The differences in the relationship between neighborhood-level long-term housing vacancy and health outcomes across the three types of metros shouldbe considered when addressing community development strategies for decreasing va-cancy rates aimed at improving health outcomes.
This material is based upon work supported by the National Science Foundation under Grant No. 1444745.

146
Wang and Immergluck
The Housing-Health Connection
IntroductionThe Great Recession, the most severe housing market crisis in the United States since the Great Depression, saw mortgage foreclosure of more than 5.5 million homes by the end of 2014 (Carlyle, 2015). In areas with high foreclosure rates, the resulting accumulation of vacant properties generated negative effects on neighborhoods, including decreased property values and increased crime rates (Apgar and Duda, 2005; Immergluck and Smith, 2006; Mallach, 2008; Raleigh and Galster, 2014; Schuetz, Been, and Ellen, 2008). High levels of neighborhood housing vacancies—especially lasting more than several months—have long been a concern to community developers and policymakers (Hollander, 2011; Sternlieb and Indik, 1969).
Although a number of researchers have examined the health effects of foreclosures, few have studied the relationship between vacant housing and health outcomes at the neighborhood (census tract) level within the context of metropolitan areas (metros). Studies of vacant housing and health outcomes are limited to case studies in particular cities or sets of cities (Cohen et al., 2003; Cohen et al., 2000). A need exists to study connections between vacant housing and health that allow for some generalization, yet recognize that these relationships may vary across different types of metros and housing markets. The effects of high levels of neighborhood vacancy on health outcomes may differ across types of metros. For example, vacancies created by new construction may be common in “strong-growth” metros, those induced by population loss may be common in “weak-growth” metros, and those resulting from foreclosure or eviction are prevalent in boom-bust “hard hit” metros affected by the foreclosure crisis of the late 2000s.
This study examines the trajectory of long-term vacant housing from 2011 to 20141 and investi-gates the association between long-term (6 months or more) vacant housing and neighborhood health outcomes in 2014 across three types of U.S. metros. Our definition of long-term vacancy follows Immergluck (2016), who defines it as a property vacant for 6 months or longer and so avoids most transitional vacancies for rent or sale. In this study, we sought to answer two research questions: First, is long-term vacant housing associated with neighborhood health outcomes, and if so does this association vary across different types of metropolitan areas? Second, does the length of vacancy, ranging from relatively shorter duration (6 to 12 months) to very long duration (3 years or longer) matter? That is, do vacancies of different lengths have different effects on health outcomes at the neighborhood level? An examination of the determinants of health outcomes in deteriorated physical environments such as those with boarded-up housing across different cities may help policymakers and planners design effective tools for improving neighborhood health outcomes and decreasing the health inequality associated with vacant housing.
BackgroundAfter the foreclosure crisis, the U.S. housing market exhibited disparities in market recovery and neighborhood health outcomes. The national housing market recovery, examined by trajectories of national vacancy rates and housing values, exhibited geographic disparities, with some metros
1 We examined the trajectory of long-term vacancy after 2011 because the discontinuity in the data source was in 2011. We also selected 2014, when both vacancy and health data were publicly available across the United States, which enabled us to construct a cross-sectional design for regression analyses. Details about the data will be discussed in the data section.

The Geography of Vacant Housing and Neighborhood Health Disparities After the U.S. Foreclosure Crisis
147Cityscape
recovering relatively slowly or worsening whereas others recovered quickly and improved (Immer-gluck, 2016; Wang, 2016). Moreover, low-income and minority groups tended to experience more stress from debt and foreclosure, which worsened health disparities (Houle, 2014; Libman, Fields, and Saegert, 2012; Saegert, Fields, and Libman, 2011).
Uneven housing recovery and health disparities can be explained partly by a process of cumulative causation. Myrdal (1957) asserted that the process of cumulative causation with capital and labor flowing from lagging regions into developed regions tends to generate unbalanced regional growth and disparities. Likewise, the rise in the number of foreclosures led to a great number of vacant properties, which depressed the construction industry and businesses dependent on local con-sumer spending. As a result of high concentrations of vacant homes in neighborhoods, residents may move to other neighborhoods in pursuit of higher-quality services, schools, infrastructure, and jobs. At the same time, amenities and tax bases can deteriorate, leading to further disinvestment in these areas. This vicious cycle of special polarization can lead to greater health inequalities. Given the possibilities of cumulative pressures toward distress, external intervention may be critical to addressing housing and health disparities in some cities.
Neighborhood physical and socioeconomic conditions might lead to negative health outcomes by influencing health behaviors in various ways. For example, although the availability of affordable housing and convenient transportation may improve neighborhood health outcomes, physically deteriorated neighborhoods with substandard housing may erode residential health and well-being (Cohen et al., 2003; Cohen et al., 2000; Krieger and Higgins, 2002; Miles, Coutts, and Mohamadi, 2011; Ross and Mirowsky, 2010). Substandard housing including dampness and mold, deteriorat-ing insulation, lead paint, the presence of rodents, and toxic chemicals can increase the incidence of allergies, headaches, vomiting, asthma, and other respiratory diseases; lung cancer; and mental health problems (Dales et al., 1991; Jacobs et al., 2002; Peat, Dickerson, and Li, 1998; Phipa-tanakul et al., 2000). In addition, neighborhood socioeconomic conditions are also associated with health outcomes. In general, residents with lower incomes, lower levels of education, and fewer economic opportunities are more likely to live in substandard homes and deteriorated neighbor-hoods, which result in multiple health problems that contribute to cumulative health disparities (Houle, 2014; Rugh, Albright, and Massey, 2015; Libman, Fields, and Saegert, 2012; Saegert, Fields, and Libman, 2011).
As many foreclosed homes became vacant in the late 2000s, even in areas that had not previously ex-perienced vacancy problems, and because studies focusing on the relationship between vacant hous-ing and health are scarce, we reviewed studies that explored the relationship between foreclosures and health. The studies provide evidence that a rise in the number of foreclosures has negative effects on residents and neighborhood conditions, including effects on home values, social capital, neighborhood stability, and crime rates (Ellen, Lacoe, and Sharygin, 2013; Immergluck and Smith, 2006; Li and Morrow-Jones, 2010; Ross and Squires, 2011; Schuetz, Been, and Ellen, 2008). Consequently, residents who experienced defaults and foreclosures during the Great Recession also experienced serious physical and mental health degradation (Cannuscio et al., 2012; Libman, Fields, and Saegert, 2012; Pollack and Lynch, 2009), and living in neighborhoods with high levels of such properties is associated with weight gain, hospital visits, and mental health problems such as depression and suicide (Arcaya et al., 2013; Currie and Tekin, 2015; Houle and Light, 2014).

148
Wang and Immergluck
The Housing-Health Connection
The focus of this study is to examine the relationship between long-term vacant housing and neighborhood health outcomes. Similar to foreclosures, vacant properties are associated with decreases in home values and increases in crime, and the longer a home remains vacant in a neigh-borhood, the stronger are such effects (Cui and Walsh, 2015; Han, 2014). Although two studies found negative effects of vacant housing on health outcomes (Cohen et al., 2003; Cohen et al., 2000), none have revealed the effects of longer durations of vacancy on health outcomes, nor have any examined the relationship between vacant housing and neighborhood health problems across the United States following the Great Recession.
Based on the literature concerning vacant and foreclosed homes, we hypothesize that the associa-tion between long-term vacant housing and health outcomes will be amplified in neighborhoods with longer durations of vacant housing. During the mortgage crisis, the accumulation of foreclosed properties varied across different types of metros: traditionally weak markets had persis-tently higher levels of foreclosed properties, and boom-bust markets with initially lower levels of foreclosed homes experienced large declines in home values and large increases in foreclosed prop-erties (Immergluck, 2010). Thus, we hypothesize that, in the aftermath of the foreclosure crisis, a change of vacancy that largely stemmed from foreclosures may affect health outcomes differently across different types of metros.
Data and MethodsWe used long-term vacant housing data collected by the U.S. Postal Service (USPS) and aggregated quarterly to the census tract level by the U.S. Department of Housing and Urban Development (HUD), which provide information on residential vacancies with durations from 3 to 36 months or longer (HUD, 2016).2 Health data were obtained from the Centers for Disease Control and Prevention (CDC) for the 500 largest U.S. cities. The data consisted of 2014 estimates on health outcomes among adults at the census tract level: overall mental health, overall physical health, cancer, coronary heart disease (CHD), diabetes, asthma, arthritis, high blood pressure, stroke, high cholesterol, chronic obstructive pulmonary disease, chronic kidney disease, and missing all teeth. CDC released its 2014 health indicator data for the 500 largest cities, containing about 28,000 census tracts, in December 2016 through the CDC Chronic Data Portal. The primary data source was the CDC 2014 Behavioral Risk Factor Surveillance System, which surveyed adults older than 18 years (CDC, 2017). We pooled the health estimations only for the year 2014.3 The CDC 500-city health indicator datasets and HUD-USPS periodic vacancy datasets enabled us to carry out comparative analyses across the United States. To examine associations between long-term
2 The USPS identifies a vacant address as one to which mail has not been delivered for more than 3 months (GAO, 2011). HUD-USPS data, so named throughout the article, provide counts of “no stat” addresses that are viewed as long-term vacancies but not classified as vacant because they are not habitable. As HUD staff recommended, we excluded no-stat addresses because they could generate significant measurement error.3 The dataset includes 2013 and 2014 model-based small area estimates for 27 measures that are categorized as 5 unhealthy behaviors, 13 health outcomes, and 9 prevention practices. Data sources used in measurements of adults older than 18 include the Behavioral Risk Surveillance System data, U.S. Census Bureau 2010 data, and the American Community Survey (ACS) 2009–2013 and 2010–2014 5-year data (CDC, 2017).

The Geography of Vacant Housing and Neighborhood Health Disparities After the U.S. Foreclosure Crisis
149Cityscape
vacant housing and neighborhood health outcomes in regression analyses, we used the data from the CDC and the HUD-USPS for the year 2014, when both vacancy and health data were available across the United States.
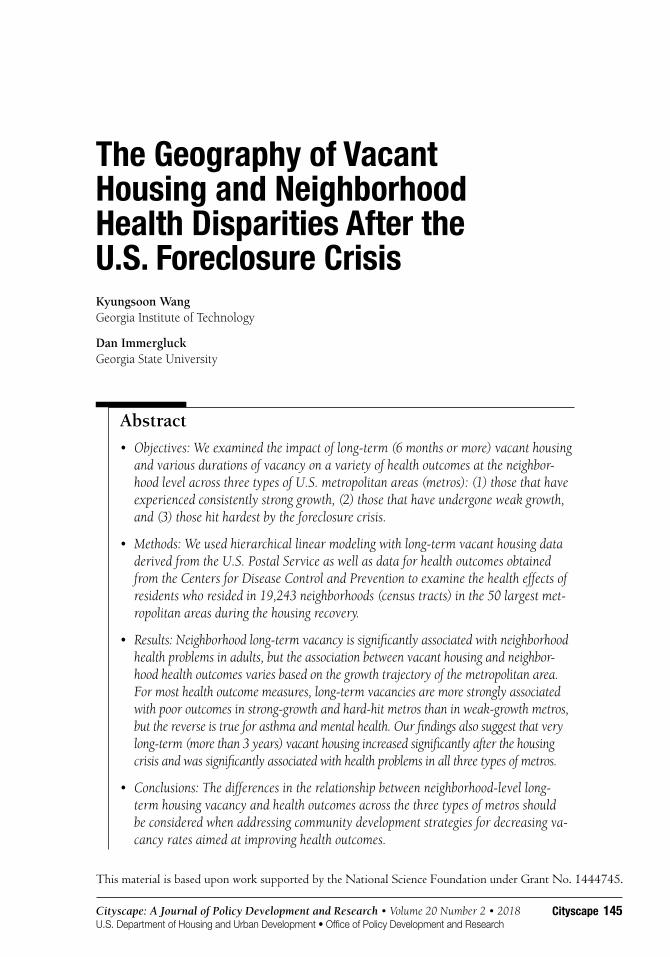
Exhibit 1 illustrates long-term vacancy rates in the second quarter of 2014 for the 50 largest metros and the geographical locations of the CDC 500-city boundaries. We merged the two datasets at the tract level: 2014 HUD-USPS vacancy data for the 50 largest U.S. metros and 2014 CDC health data for 500 cities. As a result, we were able to construct a dataset consisting of 19,243 tracts in 295 U.S. cities in the 50 largest metropolitan areas. Tracts for 205 U.S. cities were excluded from the dataset because they were not in the 50 largest metropolitan areas.
Exhibit 1
The Long-Term Vacancy Rate, 500-City Boundaries, and Three Types of MSAs in the 50 Largest MSAs
CDC = Centers for Disease Control and Prevention. HUD-USPS = data from U.S. Department of Housing and Urban Devel-opment and the U.S. Postal Service. MSA = metropolitan statistical area.Note: As of the second quarter of 2014.
A Simple Typology of the 50 Largest Metropolitan AreasTo measure the relationship between vacant homes and health outcomes across the different types of metros, we constructed a simple typology of large metropolitan areas. We used cluster analysis to categorize the three types of metros representing metropolitan growth and economic development during the recent housing crisis. The four clustering variables included changes in

150
Wang and Immergluck
The Housing-Health Connection
population, Gross Domestic Product (GDP), and home values from 2005 to 2014. The fourth vari-able was changes in the population for the short term, from 2011 to 2014, to assign more weight to population growth because shrinking cities are generally defined as those experiencing popula-tion decline over a relatively short term.4 Using this approach, we classified the 50 largest metros into “strong-growth,” “hard-hit,” or “weak-growth” metros. Then we classified tracts according to the type of metro and found 7,552 tracts in strong-growth metros, 4,017 tracts in hard-hit metros, and 7,405 tracts in weak-growth metros.
Exhibit 1 presents three types of metropolitan areas. Strong-growth metros exhibit high population growth (a mean of 21 percent), strong economic growth (a mean of 9.85 percent in GDP per capita), and moderate levels of home appreciation (a mean of 6.5 percent) from 2005 to 2014, and high short-term population growth (a mean of 6.5 percent) from 2011 to 2014. These metros had lower neighborhood long-term vacancy rates (about 2.3 percent) in the second quarter of 2014. They are in the West (including San Francisco, California; Seattle, Washington; and Portland, Or-egon); in the South (including Houston, Austin, and Dallas, Texas); and in the East (including New York City; Columbus, Ohio; Nashville, Tennessee; and Raleigh, North Carolina). Hard-hit metros include metros with moderate growth in population (16 percent), a decline in GDP per capita (9 percent), and a large deflation of home values (18 percent) from 2005 to 2014, and a moderate short-term growth of population (4.6 percent) from 2011 to 2014. These metros were the hardest hit by the most recent economic shock and had higher vacancy rates (about 2.8 percent) in 2014. They include most California and Florida metros, including Riverside, Sacramento, and San Diego, California, and Miami and Jacksonville, Florida. These hard-hit metros experienced relatively high levels of foreclosures during the mortgage crisis. Weak-growth metros typically experienced low levels of long-term population growth (5.4 percent), modest growth in GDP per capita (2.1 percent), and moderate home value increases (10.3 percent) from 2005 to 2014. They either saw no short-term population growth or lost population. These metros had the highest vacancy rates (about 3.4 percent) in the second quarter of 2014. Weak-growth metros are generally traditional Rust Belt metros, including Baltimore, Maryland; Buffalo, New York; Chicago, Illinois; Cleveland, Ohio; Detroit, Michigan; St. Louis, Missouri; and Philadelphia and Pittsburgh, Pennsylvania.
Long-Term Vacancy in 295 Cities Within the 50 Metropolitan AreasWe constructed variables measuring the number of long-term vacant residential units by various durations of vacancy, including 6 months to 1 year, 1 to 2 years, 2 to 3 years, and 3 years or more, and by year for 295 U.S. cities within the 50 largest metropolitan areas. We break down vacant units further into the three types of metros in appendix A.
Exhibit 2 illustrates the long-term vacant housing trajectories in 295 cities in the three types of metros after the foreclosure crisis. The top panel of exhibit 2 shows that cities experienced gradual decreases in long-term vacancy rates (0.6 percentage point in strong-growth, 1.2 in hard-hit, and 0.6 in weak-growth metros) from 2011 to 2014. The bottom panel of exhibit 2 shows that,
4 Data for the cluster analysis were obtained from ACS 2005 (1-year estimates), ACS 2011 (1-year estimates), ACS 2014 (1-year estimates), ACS 2010–2014 (5-year estimates), and the Bureau of Economic Analysis. The clusters are distinctive groups that show that the value of the silhouette measure of cohesion and separation is more than 0.5 and that analysis of variance results for the three clusters have significantly different means among the four clustering variables (Norusis, 2012).

The Geography of Vacant Housing and Neighborhood Health Disparities After the U.S. Foreclosure Crisis
151Cityscape
Exhibit 2
Changes in Vacancy From the Second Quarter of 2011 to the Second Quarter of 2014 in 295 U.S. Cities
Note: Denominators of both long-term (6 months or more) and very long-term (more than 3 years) are all residential ad-dresses in each tract in the second quarter of each year.
although the number of housing units vacant for less than 3 years gradually declined from 2011 to 2014, vacancies of more than 3 years markedly increased in all three types of metros. The number of properties vacant for longer than 3 years increased by 94.3 percent (61,706 to 119,908 units) in hard-hit metros, by 66.1 percent (180,888 to 300,535 units) in weak-growth metros, and by 64.9 percent (106,877 to 176,197 units) in strong-growth metros. Cities in hard-hit metros exhibited a greater reduction in vacancies over 6 months but did not have higher rates during the 2011-to-2014 period. Cities in weak-growth metros showed the small reductions in vacancies during the housing recovery period, but they consistently had the highest vacancy rates and larger increases in vacancies lasting more than 3 years.
Multivariate AnalysisWe examined the association of long-term vacancies with neighborhood health outcomes in the three types of metropolitan areas using hierarchical linear modeling (HLM), which is commonly used to examine neighborhood characteristics and health outcomes (LeClere, Rogers, and Peters, 1998).

152
Wang and Immergluck
The Housing-Health Connection
Although ordinary least squares regression assumes that all observations are not correlated, HLM allows for correlated observations when lower-level observations are clustered within higher-level groups. In this study, census tracts are used as proxies for neighborhoods clustered within metro areas.
We ran separate metro-tract HLM models in each of the three types of metropolitan areas. Our dependent variables included 13 health indicators. A key predictor variable in each model is the percentage of units that are long-term vacant (that is, those units vacant for 6 months or longer in 2014). This variable is the sum of long-term vacancies divided by the number of residential units in each census tract. Because of the positively skewed nature of long-term vacancy rates, we trans-formed these variables to logarithms. We also took the logarithm of the health indicators because this log-log form generated a good fit for these models. As all variables are in logarithmic form, the coefficients of the log-log models represent the elasticities of health indicators with respect to long-term vacancy (Wooldridge, 2009). That is, the coefficients represent the expected percentage change in the health outcome variable for each 1-percent increase in the vacancy rate.
We ran separate models using various durations of long-term vacancy in 2014, including 6 months to 1 year, 1 to 2 years, 2 to 3 years, and 3 years or more. Census tract-level neighborhood control variables, which were selected based on factors identified in previous research, include percent Af-rican-American, percent Hispanic, percent Asian, percent married households, median age, percent families below poverty, percent persons with less than a high school diploma, percent uninsured households, percent commuting more than 30 minutes, and Median Family Income (Cohen et al., 2003; Cohen et al., 2000; Houle, 2014; Pollack and Lynch, 2009; Ross and Mirowsky, 2001, 2010). Metropolitan-level control variables include changes in population and unemployment rates for the past decade (Cohen et al., 2003; Houle, 2014). To control for location affordability, we include HUD housing and transportation affordability indices of poverty-level households (HUD, 2017).
Results and DiscussionExhibit 3 provides descriptive statistics for the three types of metros. Generally, health problems in cities in weak-growth metros exhibit the highest means (the exceptions were cancer and chronic kidney disease), and the means of hard-hit and strong-growth metros were similar. In all three types of metros, the health problem that has the highest percentage of adults living in cities is high cholesterol, followed by high blood pressure and arthritis. Vacancy rates in the second quarter of 2014 were consistently high in cities in weak-growth metros (4.6 percent), followed by those in hard-hit metros (3.0 percent), and then those in strong-growth metros (2.1 percent) metros. On average, weak-growth metros, which often include cities with declining populations and older industries, contain a higher share of African-Americans than other metros. They also consist of the most disadvantaged populations with higher poverty rates and lower educational attainment, due in part to racial discrimination and segregation.
The results of regressing 13 adult health outcome variables (in logged form) on long-term vacancy rates (in logged form) and the control variables show that the results for the control variables are generally consistent with prior research across the three types of metros (see appendix B). Neighborhoods with lower-income households, more African-Americans, and less–educated, higher-poverty populations are disproportionately exposed to health problems.

The Geography of Vacant Housing and Neighborhood Health Disparities After the U.S. Foreclosure Crisis
153Cityscape
Exhibit 3
Descriptive Statistics (1 of 2)
Variable DescriptionStrong Growth Hard Hit Weak GrowthMean SD Mean SD Mean SD
Neighborhood-level dependent variableHealth outcome (adults aged ≥18 years)a
MHLTH % Mental health not good for days ≥14 days
11.909 3.400 12.530 3.445 13.484 3.893
PHLTH % Physical health not good for ≥14 days
12.141 4.194 12.509 4.247 13.912 4.866
CANCER % Cancer (excluding skin cancer)
5.133 1.566 5.692 2.248 5.367 1.654
CHD % Coronary heart disease
5.281 1.759 5.758 2.294 6.085 2.095
DIABETES % Diagnosed diabetes 10.307 3.846 10.092 3.678 11.744 4.728CASTHMA % Current asthma 9.357 1.840 9.227 1.535 10.296 2.404ARTHRITIS % Arthritis 20.860 5.181 21.892 6.084 23.838 7.087BPHIGH % High blood pressure 29.678 6.732 29.369 7.358 32.048 9.194STROKE % Stroke 2.821 1.185 2.940 1.275 3.421 1.700TEETHLOST % All teeth lost 15.074 7.835 13.944 7.144 17.645 9.511HIGHCHOL % High cholesterol 35.804 4.429 36.324 5.279 36.495 4.598COPD % Chronic obstructive
pulmonary disease 5.734 2.151 6.224 2.242 6.767 2.833
KIDNEY % Chronic kidney disease
2.556 0.697 2.945 0.907 2.853 0.889
Neighborhood-level independent variablesDemographic characteristicsb
BLACK % Black 17.410 23.063 15.483 22.521 27.909 33.571ASIAN % Asian 11.160 14.962 6.012 7.845 7.143 10.299HISPANIC % Hispanic 26.752 23.738 28.736 24.831 22.885 26.625MARRIED % Married households 42.223 16.719 42.975 17.007 36.936 17.727AGE Median age 35.911 6.236 37.013 8.563 35.759 6.675Socioeconomic characteristicsb
POVERTY % Families below poverty level
14.429 12.599 14.472 12.777 18.206 15.034
INCOME Median family income ($10,000)
7.417 4.145 6.968 3.719 6.384 3.739
LOW_EDU % Less than high school education
16.912 13.524 15.092 12.764 18.387 13.914
UNINSURED % Uninsured households
15.405 10.040 15.866 9.609 14.722 8.884
COMMUTE % Workers commuting > 30 minutes
47.133 19.041 37.567 12.282 41.014 15.001
Vacant housingc
VACANCY_6MPLUS_14 % Vacancy (6 months +) in 2Q 2014
2.126 3.400 2.965 3.591 4.571 6.620
VACANCY_6M_1Y % Vacancy (6 months–1 year) in 2Q 2014
0.216 0.653 0.351 0.634 0.421 0.903
VACANCY_1Y_2Y % Vacancy (1–2 years) in 2Q 2014
0.335 0.584 0.634 1.006 0.653 1.214
VACANCY_2Y_3Y % Vacancy (2–3 years) in 2Q 2014
0.263 0.567 0.500 1.160 0.626 1.151
VACANCY_3YPLUS % Vacancy (3 years +) in 2Q 2014
1.327 2.619 1.488 2.157 2.882 4.716

154
Wang and Immergluck
The Housing-Health Connection
Exhibit 3
Descriptive Statistics (2 of 2)
Variable DescriptionStrong Growth Hard Hit Weak GrowthMean SD Mean SD Mean SD
Metropolitan-level independent variablesMacro characteristicsd
POP_CH % Change in population (2005–2014)
13.954 5.936 12.635 2.644 3.615 3.329
UNEMP_CH Change in unemployment rate (2005–2014)
22.616 9.479 40.447 10.100 30.071 14.177
HCOST Housing costs as a percentage of income (type2-poverty level)
115.380 20.821 105.773 13.052 106.728 15.859
TCOST Transportation costs as a percentage of income (type2-poverty level)
50.425 5.137 55.262 4.082 51.193 4.351
N 7,552 4,017 7,4052Q = second quarter. SD = standard deviation. Sources: a CDC (2014); b American Community Survey (ACS) 2011–2015; c 2014 U.S. Department of Housing and Urban De-velopment (HUD)-U.S. Postal Service vacancy data; d HUD Location Affordability Portal, ACS 2005–2009, ACS 2010–2014, Bureau of Economic Analysis
Long-Term (6 Months or More) Vacant Housing and Neighborhood Health Outcomes Exhibit 4 summarizes key results by reporting the coefficients for long-term vacancy. The signifi-cance and magnitude of long-term vacancy varies across the metro types. Long-term (6 months or more) vacancies are significantly and positively associated with 13 adult health problems in strong-growth metros, 13 in hard-hit metros, and 12 in weak-growth metros. Heart-related diseases such as CHD and stroke were most prevalent in adults living in neighborhoods with high vacancy across three types of metros after the recent foreclosure crisis. Among health outcomes, CHD is the health problem most strongly associated with high vacancy rates in strong-growth and hard-hit metros. For example, every 1-percent increase in long-term vacancy rate was associated with 0.0318- and 0.0225-percent increases in the proportion of residents who had CHD in strong-growth and hard-hit metros, respectively. In general, the magnitudes of the associations were high in strong-growth and hard-hit metros and lowest in weak-growth metros (the exceptions being mental health and asthma outcomes). For example, in our models, all else being equal, every 1-percent increase in the long-term vacancy rate was associated with 0.0136- and 0.0109-percent increases in the pro-portion of residents who had overall physical health problems in strong-growth and hard-hit met-ros, respectively, but only a 0.0082-percent increase in weak-growth metros. In addition, all else being equal, every 1-percent increase in the long-term vacancy rate was associated with 0.0171- and 0.0163-percent increases in the proportion of residents who had cancer in strong-growth and hard-hit metros, respectively, but it had no significant association in weak-growth metros.
At first glance, these results may seem counterintuitive. We might have expected that high levels of long-term vacancies would have stronger effects on health outcomes in weak-growth metros.

The Geography of Vacant Housing and Neighborhood Health Disparities After the U.S. Foreclosure Crisis
155Cityscape
Exhibit 4
HLM for Long-Term Vacancy (6 Months or More) and Health in 295 U.S. Cities
Dependent Variable: log (%
Health Outcome)
Independent Variables: log
(% Long-Term
Vacancy)
Strong Growth Hard Hit Weak Growth
EstimatedCoefficient
t-ValueEstimatedCoefficient
t-ValueEstimatedCoefficient
t-Value
% Mental health
% Vacancy (6 months +), 2Q 2014
0.0034 2.330** 0.0050 3.310*** 0.0053 2.410**
% Physical health
% Vacancy (6 months +), 2Q 2014
0.0136 5.620*** 0.0109 4.190*** 0.0082 3.270***
% Cancer % Vacancy (6 months +), 2Q 2014
0.0171 4.120*** 0.0163 3.920*** 0.0039 1.060
% Coronary heart disease (CHD)
% Vacancy (6 months +), 2Q 2014
0.0318 5.830*** 0.0225 8.090*** 0.0127 3.250***
% Diagnosed diabetes
% Vacancy (6 months +), 2Q 2014
0.0197 5.610*** 0.0147 3.890*** 0.0110 4.930***
% Current asthma
% Vacancy (6 months +), 2Q 2014
0.0027 2.610*** 0.0027 3.580*** 0.0031 3.020***
% Arthritis % Vacancy (6 months +), 2Q 2014
0.0160 4.930*** 0.0141 3.400*** 0.0088 5.270***
% High blood pressure
% Vacancy (6 months +), 2Q 2014
0.0149 6.410*** 0.0117 5.010*** 0.0082 4.090***
% Stroke % Vacancy (6 months +), 2Q 2014
0.0284 5.740*** 0.0213 8.440*** 0.0138 4.140***
% All teeth lost % Vacancy (6 months +), 2Q 2014
0.0189 5.100*** 0.0139 7.660*** 0.0093 2.300**
% High cholesterol
% Vacancy (6 months +), 2Q 2014
0.0107 5.280*** 0.0074 3.860*** 0.0059 5.900***
% Chronic obstructive pulmonary disease
% Vacancy (6 months +), 2Q 2014
0.0197 5.800*** 0.0169 8.200*** 0.0098 2.840***
% Chronic kidney disease
% Vacancy (6 months +), 2Q 2014
0.0163 5.720*** 0.0127 7.500*** 0.0078 3.630***
2Q = second quarter. HLM = hierarchical linear modeling.** p < 0.05. *** p < 0.01.
However, these metros already had higher levels of vacancy before the foreclosure crisis and have other regional stressors that may be more influential on health outcomes, such as higher unemployment rates. These results suggest that neighborhoods in metros with historically lower vacancy rates (strong-growth and hard-hit metros) may be more sensitive to vacancy shocks at the neighborhood level, at least in terms of most of the health outcome measured here.

156
Wang and Immergluck
The Housing-Health Connection
Except for asthma and mental health, in weak-growth metros the association between neighbor-hoods with high levels of vacancy and health outcomes were weaker. Of course, asthma and mental health are not trivial health problems. Asthma, in particular, has been the most prevalent chronic disease in residents living in poor housing and deteriorated neighborhoods, currently affecting more than 24 million Americans (NCHS, 2015a, 2015b). In our models, all else being equal, every 1-percent increase in the long-term vacancy rate was associated with a 0.0031-percent increase in the proportion of residents who had asthma in weak-growth metros, but only 0.0027-percent in-creases in strong-growth and hard-hit metros. In addition, every 1-percent increase in the long-term vacancy rate was associated with a 0.0053-percent increase in the proportion of residents who had overall mental health problems in weak-growth metros, but 0.0034- and 0.0050-percent increases in strong-growth and hard-hit metros, respectively. One explanation for this finding is the possible cumulative factors affecting asthma and mental health that are present in weak-growth metros and that may interact with vacancies. These effects are generally small. Nonetheless it appears that long-term neighborhood vacancy in weak-growth metros is modestly associated with asthma and mental health problems.
Hard-hit metros in exhibit 4 also exhibited a significant association between long-term vacant hous-ing and health outcomes. Vacancy is associated with health outcomes in a way that is somewhat similar to that in strong-growth metros, but the coefficients are smaller in magnitude. Two distinct economic variables are associated with neighborhood health outcomes—housing affordability and changes in the unemployment rate at the metropolitan level (see appendix B). Generally, increases in housing costs as a percentage of income at the metro level were negatively associated with neighborhood health problems, indicating that spending more on housing may improve housing conditions and create a healthier environment, particularly in hard-hit metros after the foreclosure crisis. However, extremely low-income households (that is, those below the poverty level) have little to spend on housing, which can have negative spillover effects on health outcomes. This find-ing provides further support for the notion that housing cost burdens can have negative spillover effects onto health outcomes. Another economic condition, rising unemployment at the metropoli-tan level, is associated with neighborhood health problems, particularly in hard-hit metros.
Various Durations of Vacant Housing and Neighborhood Health OutcomesExhibit 5 provides estimation results for the relationship between various durations of long-term vacancy rates and health outcomes across the three types of metropolitan areas. Overall, our results show that very long-term vacant housing (more than 3 years) is significantly associated with health problems across all three types of metros. The coefficients of the very long-term vacancy rate are much larger than for any of the shorter durations, indicating that very long durations of vacancy have a particularly strong association with health problems. Generally, although health outcomes are associated with both shorter and longer durations of vacancy rates in strong-growth metros, health outcomes are also associated with very long durations of vacancy in weak-growth metros. In hard-hit metros, health problems more often occurred in the mid-duration of vacancy (from 1 to 2 years) and/or after very long durations. Because most vacancies in these metros were from recently fore-closed homes, foreclosure processes (that is, foreclosure notice, auction, and redemption or eviction) that lasted 1 to 2 years might have affected neighborhood health. Thus, when properties lie vacant for very long periods, they are strongly associated with health problems across all three types of metros.

The Geography of Vacant Housing and Neighborhood Health Disparities After the U.S. Foreclosure Crisis
157Cityscape
Exhibit 5
HLM for Long-Term Vacant Housing in Various Duration and Health in Three Types of Top 50 Metropolitan Areas (1 of 4)
Dependent Variable: log
(% Health Outcome)
Independent Variables: log
(% Long-Term
Vacancy)
Strong Growth Hard Hit Weak Growth
EstimatedCoefficient
t-ValueEstimatedCoefficient
t-ValueEstimatedCoefficient
t-Value
% Mental health
% Vacancy (1/2–1 yr.), 2Q 2014
0.0022 2.220** 0.0009 0.720 0.0023 2.190**
% Vacancy (1–2 yrs.), 2Q 2014
0.0014 1.170 0.0034 2.990*** 0.0012 1.200
% Vacancy (2–3 yrs.), 2Q 2014
0.0026 2.280** 0.0015 1.130 0.0006 0.500
% Vacancy (> 3 yrs.), 2Q 2014
– 0.0002 – 0.120 0.0012 0.740 0.0031 1.720*
% Physical health
% Vacancy (1/2–1 yr.), 2Q 2014
0.0049 2.630*** 0.0020 1.550 0.0026 1.850*
% Vacancy (1–2 yrs.), 2Q 2014
0.0025 1.750* 0.0054 3.320*** 0.0018 1.700*
% Vacancy (2–3 yrs.), 2Q 2014
0.0049 2.840*** 0.0016 0.900 0.0014 0.990
% Vacancy (> 3 yrs.), 2Q 2014
0.0076 3.400*** 0.0058 1.730* 0.0067 3.420***
% Cancer % Vacancy (1/2–1 yr.), 2Q 2014
0.0027 1.620 0.0043 2.110** 0.0023 1.430
% Vacancy (1–2 yrs.), 2Q 2014
0.0002 0.090 0.0059 1.850* 0.0016 0.670
% Vacancy (2–3 yrs.), 2Q 2014
0.0024 1.720* 0.0042 1.010 0.0012 0.540
% Vacancy (> 3 yrs.), 2Q 2014
0.0016 1.430 0.0076 1.380 0.0029 1.590
% Coronary heart disease (CHD)
% Vacancy (1/2–1 yr.), 2Q 2014
0.0092 2.520** 0.0043 1.890* 0.0029 1.570
% Vacancy (1–2 yrs.), 2Q 2014
0.0051 2.580*** 0.0082 2.370** 0.0023 1.100
% Vacancy (2–3 yrs.), 2Q 2014
0.0110 2.730*** 0.0041 0.990 0.0025 0.970
% Vacancy (> 3 yrs.), 2Q 2014
0.0181 3.710*** 0.0099 1.310 0.0102 3.670***

158
Wang and Immergluck
The Housing-Health Connection
Exhibit 5
HLM for Long-Term Vacant Housing in Various Duration and Health in Three Types of Top 50 Metropolitan Areas (2 of 4)
Dependent Variable: log
(% Health Outcome)
Independent Variables: log
(% Long-Term
Vacancy)
Strong Growth Hard Hit Weak Growth
EstimatedCoefficient
t-ValueEstimatedCoefficient
t-ValueEstimatedCoefficient
t-Value
% Diagnosed diabetes
% Vacancy (1/2–1 yr.), 2Q 2014
0.0056 2.300** 0.0033 1.950* 0.0023 1.890*
% Vacancy (1–2 yrs.), 2Q 2014
0.0019 0.920 0.0043 1.530 0.0001 0.040
% Vacancy (2–3 yrs.), 2Q 2014
0.0081 2.520** 0.0016 0.630 0.0022 1.170
% Vacancy (> 3 yrs.), 2Q 2014
0.0132 3.740*** 0.0099 2.050** 0.0094 5.370***
% Current asthma
% Vacancy (1/2–1 yr.), 2Q 2014
0.0018 2.320** 0.0003 0.410 0.0012 1.900*
% Vacancy (1–2 yrs.), 2Q 2014
0.0007 0.690 0.0011 1.400 0.0009 1.450
% Vacancy (2–3 yrs.), 2Q 2014
0.0008 0.910 0.0006 0.820 0.0004 0.610
% Vacancy (> 3 yrs.), 2Q 2014
0.0011 0.960 0.0017 2.100** 0.0015 1.820*
% Arthritis % Vacancy (1/2–1 yr.), 2Q 2014
0.0074 2.670*** 0.0031 1.900* 0.0027 2.110**
% Vacancy (1–2 yrs.), 2Q 2014
0.0038 2.120** 0.0061 2.240** 0.0034 2.580***
% Vacancy (2–3 yrs.), 2Q 2014
0.0061 2.120** 0.0036 1.090 0.0017 0.910
% Vacancy (> 3 yrs.), 2Q 2014
0.0078 2.190** 0.0070 1.290 0.0043 2.840***
% High blood pressure
% Vacancy (1/2–1 yr.), 2Q 2014
0.0036 1.730* 0.0021 1.470 0.0017 1.740*
% Vacancy (1–2 yrs.), 2Q 2014
0.0020 1.370 0.0038 1.550 0.0015 1.210
% Vacancy (2–3 yrs.), 2Q 2014
0.0049 2.720*** 0.0005 0.250 0.0018 1.050
% Vacancy (> 3 yrs.), 2Q 2014
0.0104 4.480*** 0.0078 2.130** 0.0059 3.460***

The Geography of Vacant Housing and Neighborhood Health Disparities After the U.S. Foreclosure Crisis
159Cityscape
Exhibit 5
HLM for Long-Term Vacant Housing in Various Duration and Health in Three Types of Top 50 Metropolitan Areas (3 of 4)
Dependent Variable: log
(% Health Outcome)
Independent Variables: log
(% Long-Term
Vacancy)
Strong Growth Hard Hit Weak Growth
EstimatedCoefficient
t-ValueEstimatedCoefficient
t-ValueEstimatedCoefficient
t-Value
% Stroke % Vacancy (1/2–1 yr.), 2Q 2014
0.0086 2.730*** 0.0042 1.840* 0.0026 1.370
% Vacancy (1–2 yrs.), 2Q 2014
0.0045 2.070** 0.0058 1.910* 0.0024 1.410
% Vacancy (2–3 yrs.), 2Q 2014
0.0091 2.620*** 0.0031 1.010 0.0017 0.780
% Vacancy (> 3 yrs.), 2Q 2014
0.0171 3.860*** 0.0148 3.420*** 0.0111 4.210***
% All teeth lost
% Vacancy (1/2–1 yr.), 2Q 2014
0.0051 3.000*** 0.0038 2.470** 0.0028 1.470
% Vacancy (1–2 yrs.), 2Q 2014
0.0028 1.720* 0.0055 2.690*** 0.0009 0.460
% Vacancy (2–3 yrs.), 2Q 2014
0.0059 2.390** 0.0019 0.930 0.0007 0.360
% Vacancy (> 3 yrs.), 2Q 2014
0.0099 3.330*** 0.0064 2.960*** 0.0079 2.340**
% High cholesterol
% Vacancy (1/2–1 yr.), 2Q 2014
0.0028 1.870* 0.0013 1.450 0.0009 1.180
% Vacancy (1–2 yrs.), 2Q 2014
0.0023 2.350** 0.0018 1.140 0.0008 0.960
% Vacancy (2–3 yrs.), 2Q 2014
0.0043 2.480** 0.0019 0.950 0.0004 0.320
% Vacancy (> 3 yrs.), 2Q 2014
0.0056 2.560** 0.0046 1.600 0.0046 5.170***
% Chronic obstructive pulmonary disease
% Vacancy (1/2–1 yr.), 2Q 2014
0.0077 2.700*** 0.0034 1.860* 0.0044 2.480**
% Vacancy (1–2 yrs.), 2Q 2014
0.0050 3.250*** 0.0088 3.790*** 0.0037 1.990**
% Vacancy (2–3 yrs.), 2Q 2014
0.0072 2.820*** 0.0033 1.070 0.0018 0.890
% Vacancy (> 3 yrs.), 2Q 2014
0.0093 2.880*** 0.0068 1.490 0.0060 2.320**

160
Wang and Immergluck
The Housing-Health Connection
Exhibit 5
HLM for Long-Term Vacant Housing in Various Duration and Health in Three Types of Top 50 Metropolitan Areas (4 of 4)
Dependent Variable: log
(% Health Outcome)
Independent Variables: log
(% Long-Term
Vacancy)
Strong Growth Hard Hit Weak Growth
EstimatedCoefficient
t-ValueEstimatedCoefficient
t-ValueEstimatedCoefficient
t-Value
% Chronic kidney disease
% Vacancy (1/2–1 yr.), 2Q 2014
0.0056 2.740*** 0.0026 1.860* 0.0014 1.320
% Vacancy (1–2 yrs.), 2Q 2014
0.0015 1.250 0.0032 1.550 0.0005 0.440
% Vacancy (2–3 yrs.), 2Q 2014
0.0062 2.970*** 0.0015 0.750 0.0013 0.850
% Vacancy (> 3 yrs.), 2Q 2014
0.0097 3.890*** 0.0087 2.640*** 0.0070 4.120***
2Q = second quarter. HLM = hierarchical linear modeling.* p < 0.1. ** p < 0.05. *** p < 0.01.
LimitationsDespite its contribution of providing evidence of an association between long-term vacancies and public health across housing markets, this study contains limitations that call for additional research. Because it relies on a cross-sectional design, we cannot conclude that long-term hous-ing vacancy causes these health outcomes. Our study simply indicates an association between long-term vacancy and certain health conditions, controlling for important neighborhood and metropolitan characteristics. Further research should utilize expanded longitudinal data and causal inference methods.
A second limitation of this study is the use of census tracts as proxies for neighborhoods, which might generate biased results because smaller units of neighborhoods, such as block groups, pro-vide more socioeconomically homogeneous data (McKenzie, 2013; Shuler et al., 1992). However, we used census tracts with about 4,000 residents because they are the smallest units in our datasets and because scholars generally agree that census tracts reflect reliable socioeconomic and housing data that are publicly available (Sawichi and Flynn, 1996).
Another limitation of this study is the possibility of omitted variable bias. Although our indepen-dent variables are generally guided by the existing literature, our access to data is limited. For example, we lack details on changes in the quality of the housing stock, which may have deterio-rated more in strong-growth metros than in weak-growth metros. It may be that vacancy is not the proximate driver of the relationships found here, but rather something associated with vacancy that is not accounted for by the various control variables.

The Geography of Vacant Housing and Neighborhood Health Disparities After the U.S. Foreclosure Crisis
161Cityscape
Conclusion and ImplicationsIn this study, we examined how living in areas with high levels of long-term vacant housing is associated with neighborhoods’ health outcomes during the housing market recovery period across metropolitan areas (metros), and how it has disproportionately impacted some metros. For our first research question, our findings suggest that city neighborhoods with high long-term vacancy rates are significantly associated with adult health problems across the cities, but the relationship varies according to the growth trajectories of the metropolitan areas. Although neighborhoods in strong-growth and hard-hit metros are strongly associated with more health problems, those in weak-growth metros have a weaker association with health outcomes, except for mental health and asthma. A change in the vacancy rate in neighborhoods with initially lower levels of vacancies in strong and hard-hit metros may have experienced more shock and stress resulting in more health problems; however, neighborhoods with historically higher vacancy rates in weak-growth metros may have cumulative factors that contribute to asthma and mental health issues that interact with vacancy.
Our findings with regard to the second question suggest that very long-term (more than 3 years) vacant housing is more strongly associated with health problems across all types of metros. Although long-term (6 months or more) vacancy in strong-growth metros is associated with health problems, only the very long-term vacancy is associated with a broad set of health problems in weak-growth regions.
These findings suggest several implications for planners and policymakers attempting to cope with highly concentrated vacant properties in neighborhoods. Generally, cities in weak-growth metros had the highest levels of neighborhood vacancy from 2011 through 2014, but long-term vacancy in these cities, compared with that in cities in strong-growth and hard-hit neighborhoods, had a weaker association with most health problems. (Again, the important exceptions were asthma and mental health.) This finding indicates that historically high levels of vacancies in neighborhoods may be less-significant determinants of poor health and that health outcomes in these metros may be more strongly associated with other regional or neighborhood factors, such as regional economic conditions, neighborhood environmental conditions, housing quality, and other latent variables that may be more salient drivers of health outcomes in weak-growth metros.
At the same time, when looking only at very long-term vacant units, these properties were strongly associated with negative health outcomes in cities in all three types of metros. Moreover, the rela-tionships between these very long-term vacancies and health outcomes were much stronger than for vacancies between 6 and 36 months.
From a public health perspective, these findings suggest that, in weak-growth metros, efforts to reduce vacant properties should focus on those units that have been vacant for more than 3 years. However, in strong-growth and hard-hit metros, it is with good reason that one can expect signifi-cant public health benefits from addressing vacancies of between 6 and 36 months. Although other reasons to reduce vacant units of shorter durations may be valid in cities in weak- growth metros, the health effects are not likely to be significant, except on asthma and mental health outcomes.

162
Wang and Immergluck
The Housing-Health Connection
The second key implication for policy and planning is that very long-term vacancies have the great-est negative impacts on health outcomes across all types of metros, so, from a public health per-spective, addressing these sorts of vacancies should be prioritized. Shorter-duration vacant housing may be more easily purchased and reused by investors or homeowners, whereas very long-term vacancy is a more challenging issue. However, health-focused efforts should generally aim first to reduce the number of very long-term vacancies. When the property may not be salvageable, this focus may entail targeted demolition. At the federal level, HUD and the U.S. Department of Health and Human Services should consider efforts to address these very long-term vacancies. Moreover, local and state health planners should consider community development strategies for decreasing long-term vacancy rates to improve health outcomes.
Appendix AExhibit A-1
Vacant Housing Units and Vacancy Duration in 295 U.S. Cities in Three Types of Metropolitan Areas (1 of 2)Metro-politan Area Type
YearResidential
Address
Residen-tial
Vacancy
Vacancy < 3
Months
Vacancy 3–6
Months
Vacancy 6–12
Months
Vacancy 1–2
Years
Vacancy 2–3
Years
Vacancy 3 +
Years
Strong growth
2Q, 2011 13,899,145 390,470 22,311 37,574 54,284 121,380 48,044 106,877 (2.81%) (0.16%) (0.27%) (0.39%) (0.87%) (0.35%) (0.77%)2Q, 2012 14,634,556 357,218 28,817 26,011 30,791 63,462 82,041 126,096 (2.44%) (0.20%) (0.18%) (0.21%) (0.43%) (0.56%) (0.86%)2Q, 2013 14,729,662 364,170 15,296 23,057 47,117 56,969 46,355 175,376 (2.47%) (0.10%) (0.16%) (0.32%) (0.39%) (0.31%) (1.19%)2Q, 2014 14,873,955 327,538 18,126 18,927 29,901 48,637 35,750 176,197 (2.20%) (0.12%) (0.13%) (0.20%) (0.33%) (0.24%) (1.18%) % change
(2Q 2011– 2Q 2014)
7.0% – 16.1% – 18.8% – 49.6% – 44.9% – 59.9% – 25.6% 64.9%
Hard hit 2Q, 2011 7,804,613 356,760 31,283 45,512 66,888 112,063 39,308 61,706 (4.57%) (0.40%) (0.58%) (0.86%) (1.44%) (0.50%) (0.79%)2Q, 2012 8,248,904 318,794 34,413 31,547 40,310 68,178 68,940 75,406 (3.86%) (0.42%) (0.38%) (0.49%) (0.83%) (0.84%) (0.91%)2Q, 2013 8,281,888 316,347 18,876 30,722 46,097 62,273 45,430 112,949 (3.82%) (0.23%) (0.37%) (0.56%) (0.75%) (0.55%) (1.36%)2Q, 2014 8,333,812 277,465 14,900 24,797 28,042 51,074 38,744 119,908 (3.33%) (0.18%) (0.30%) (0.34%) (0.61%) (0.46%) (1.44%) % change
(2Q 2011– 2Q 2014)
6.8% – 22.2% – 52.4% – 45.5% – 58.1% – 54.4% – 1.4% 94.3%

The Geography of Vacant Housing and Neighborhood Health Disparities After the U.S. Foreclosure Crisis
163Cityscape
Exhibit A-1
Vacant Housing Units and Vacancy Duration in 295 U.S. Cities in Three Types of Metropolitan Areas (2 of 2)Metro-politan Area Type
YearResidential
Address
Residen-tial
Vacancy
Vacancy < 3
Months
Vacancy 3–6
Months
Vacancy 6–12
Months
Vacancy 1–2
Years
Vacancy 2–3
Years
Vacancy 3 +
Years
Weak growth
2Q, 2011 11,718,195 572,529 31,504 46,551 81,443 170,896 61,247 180,888 (4.89%) (0.27%) (0.40%) (0.70%) (1.46%) (0.52%) (1.54%)2Q, 2012 12,343,906 548,121 34,722 39,358 50,814 98,003 123,098 202,126 (4.44%) (0.28%) (0.32%) (0.41%) (0.79%) (1.00%) (1.64%)2Q, 2013 12,388,877 558,141 18,582 33,094 59,543 91,705 73,716 281,501 (4.51%) (0.15%) (0.27%) (0.48%) (0.74%) (0.60%) (2.27%)2Q, 2014 12,453,654 531,138 20,817 27,270 45,375 71,191 65,950 300,535 (4.26%) (0.17%) (0.22%) (0.36%) (0.57%) (0.53%) (2.41%) Percent
change(2Q 2011–
2Q 2014) 6.3% – 7.2% – 33.9% – 41.4% – 44.3% – 58.3% 7.7% 66.1%
2Q = second quarter.
Appendix B
The tables on the following pages present the results of regressing 13 adult health outcome variables on long-term vacancy rates in cities in the three types of large U.S. metropolitan areas—strong growth (exhibit B-1), hard hit (exhibit B-2), and weak growth (exhibit B-3).

164
Wang and Immergluck
The Housing-Health Connection
Exh
ibit
B-1
HLM
for L
ong-
Term
Vac
ant H
ousi
ng a
nd H
ealth
in 2
95 C
ities
in T
op 5
0 U
.S. M
etro
polit
an A
reas
, Str
ong-
Gro
wth
Met
ropo
litan
Are
as
Vari
able
sM
HLT
HP
HLT
HC
AN
CE
RC
HD
DIA
BE
TE
SC
AS
TH
MA
AR
TH
RIT
ISB
PH
IGH
ST
RO
KE
TE
ET
H-
LOS
TH
IGH
CH
OL
CO
PD
KID
NE
Y
Fix
ed e
ffec
tsLe
vel 1
: cen
sus
trac
t(In
terc
ept)
1.10
97*
1.51
59**
2.75
06**
3.00
8**
3.44
56**
1.64
14**
*4.
2534
***
3.90
24**
*2.
0102
*2.
4066
*5.
0162
***
1.81
52*
0.84
82B
LAC
K0.
0014
***
0.00
27**
*– 0
.000
9**
0.00
2***
0.00
81**
*0.
0024
***
0.00
24**
*0.
0052
***
0.00
74**
*0.
0053
***
0.00
05**
*0.
0010
***
0.00
44**
*A
SIA
N–
0.00
39**
*– 0
.004
7***
– 0.
0071
***–
0.0
08**
*– 0
.002
7***
– 0.
0037
***–
0.0
067*
**–
0.00
29**
*– 0
.006
5***
– 0.
0032
***–
0.0
018*
**–
0.00
88**
*– 0
.004
5***
HIS
PAN
IC–
0.00
11**
*0.
0005
– 0.
0024
***–
0.0
01*
0.00
30**
*– 0
.002
0***
– 0.
0014
***
0.00
02**
*– 0
.001
0***
– 0.
0004
0.00
04**
– 0.
0040
***
0.00
11**
*M
AR
RIE
D0.
0005
***
0.00
21**
*0.
0029
***
0.00
3***
0.00
36**
*0.
0002
0.00
38**
*0.
0021
***
0.00
22**
*0.
0004
0.00
18**
*0.
0031
***
0.00
19**
*A
GE
– 0.
0059
***
0.01
21**
*0.
0340
***
0.03
7***
0.02
84**
*– 0
.002
7***
0.02
79**
*0.
0228
***
0.03
15**
*– 0
.000
20.
0163
***
0.01
94**
*0.
0239
***
PO
VE
RTY
0.00
37**
*0.
0065
***
0.00
060.
006*
**0.
0054
***
0.00
26**
*0.
0036
***
0.00
41**
*0.
0070
***
0.00
57**
*0.
0024
***
0.00
71**
*0.
0037
***
INC
OM
E–
0.02
37**
*– 0
.027
2***
– 0.
0087
***–
0.0
23**
*– 0
.020
3***
– 0.
0102
***–
0.0
179*
**–
0.00
62**
*– 0
.025
7***
– 0.
0478
***–
0.0
028*
*–
0.03
70**
*– 0
.013
5***
LOW
-ED
U0.
0087
***
0.01
16**
*– 0
.000
40.
009*
**0.
0093
***
0.00
50**
*0.
0047
***
0.00
29**
*0.
0112
***
0.01
64**
*0.
0018
***
0.01
27**
*0.
0059
***
UN
INS
UR
ED0.
0025
***
0.00
27**
*– 0
.002
2***
0.00
10.
0015
*0.
0004
0.00
070.
0004
0.00
080.
0036
***
0.00
050.
0027
***–
0.0
006
CO
MM
UTE
0.00
08**
*0.
0002
– 0.
0011
***–
0.0
02**
*– 0
.000
20.
0003
*–
0.00
04–
0.00
07*
– 0.
0011
***
0.00
02–
0.00
05**
– 0.
0005
**–
0.00
08**
*VA
CA
NC
Y_
6MP
LUS
0.00
34**
0.01
36**
*0.
0171
***
0.03
2***
0.01
97**
*0.
0027
***
0.01
60**
*0.
0149
***
0.02
84**
*0.
0189
***
0.01
07**
*0.
0197
***
0.01
63**
*
Leve
l 2: m
etro
pol
itan
area
PO
P_C
H–
0.01
65**
*– 0
.024
1***
– 0.
0241
**–
0.03
5***
– 0.
0268
**–
0.01
59**
*– 0
.036
0***
– 0.
0208
**–
0.03
13**
*– 0
.021
8*–
0.01
88**
*– 0
.021
8**
– 0.
0145
*U
NE
MP
_CH
0.00
210.
0043
0.00
630.
013
0.00
760.
0001
0.01
23**
0.00
200.
0116
*0.
0075
0.00
450.
0050
– 0.
0029
HC
OS
T0.
0001
– 0.
0033
– 0.
0067
*–
0.01
2**
– 0.
0108
**–
0.00
07–
0.01
32**
*– 0
.008
4**
– 0.
0106
**–
0.00
92**
– 0.
0075
***–
0.0
065*
– 0.
0041
TCO
ST
0.03
16**
*0.
0174
– 0.
0225
– 0.
021
– 0.
0226
0.01
84**
– 0.
0106
– 0.
0065
– 0.
0179
0.02
34–
0.02
10**
0.00
23–
0.00
33R
and
om
Eff
ects
Leve
l 10.
0054
***
0.01
07**
*0.
0281
***
0.03
78**
*0.
0207
***
0.00
25**
*0.
0202
***
0.01
27**
*0.
0320
***
0.01
91**
*0.
0062
***
0.02
34**
*0.
0146
***
Leve
l 2
inte
rcep
t0.
0066
***
0.00
65**
0.02
17**
*0.
0301
**0.
0223
**0.
0042
***
0.00
96**
0.01
69**
0.01
73**
0.03
13**
*0.
0069
**0.
0154
**0.
0163
**
Mo
del
fit
AIC
– 17
,652
– 12
,456
– 5,
213
– 2,
958
– 7,
453
– 23
,442
– 7,
687
– 11
,160
– 4,
233
– 8,
063
– 16
,573
– 6,
558
– 10
,150
BIC
– 17
,632
– 12
,435
– 5,
192
– 2,
938
– 7,
432
– 23
,422
– 7,
667
– 11
,140
– 4,
213
– 8,
043
– 16
,553
– 6,
538
– 10
,129
Num
ber
of
ob
serv
atio
nsLe
vel 1
: ce
nsus
trac
t7,
552
7,55
27,
552
7,55
27,
552
7,55
27,
552
7,55
27,
552
7,55
27,
552
7,55
27,
552
Leve
l 2:
met
rop
oli-
tan
area
15
15
15
15
15
15
15
15
15
15
15
15
15
AIC
= A
kaik
e in
form
atio
n cr
iterio
n. B
IC =
Bay
sian
info
rmat
ion
crite
rion.
HLM
= h
iera
rchi
cal l
inea
r m
odel
ing.
* p
< 0
.1. *
* p
< 0
.05.
***
p <
0.0
1.N
otes
: Lon
g-te
rm v
acan
t is
hous
ing
that
is v
acan
t for
mor
e th
an 6
mon
ths.
All
depe
nden
t var
iabl
es a
re in
nat
ural
log
form
.

The Geography of Vacant Housing and Neighborhood Health Disparities After the U.S. Foreclosure Crisis
165Cityscape
Exh
ibit
B-2
HLM
for
Long
-Ter
m V
acan
t H
ousi
ng a
nd H
ealth
in 2
95 C
ities
in T
op 5
0 U
.S. M
etro
pol
itan
Are
as, H
ard
-Hit
Met
rop
olita
n A
reas
Vari
able
sM
HLT
HP
HLT
HC
AN
CE
RC
HD
DIA
BE
TE
SC
AS
TH
MA
AR
TH
RIT
ISB
PH
IGH
ST
RO
KE
TE
ET
H-
LOS
TH
IGH
CH
OL
CO
PD
KID
NE
Y
Fix
ed e
ffec
tsLe
vel 1
: cen
sus
trac
t(In
terc
ept)
2.57
17**
*1.
3496
0.31
930.
3078
0.86
051.
8702
***
2.03
09*
2.06
76**
*– 0
.916
82.
8613
***
3.20
04**
*1.
2358
0.39
86B
LAC
K0.
0016
***
0.00
26**
*– 0
.001
9**
0.00
120.
0076
***
0.00
24**
*0.
0016
**0.
0048
***
0.00
66**
*0.
0045
***
0.00
020.
0009
0.00
38**
*A
SIA
N–
0.00
31**
*– 0
.004
6***
– 0.
0079
***–
0.0
090*
**–
0.00
23–
0.00
30**
*– 0
.006
5***
– 0.
0033
***–
0.0
072*
**–
0.00
40**
*– 0
.002
1***
– 0.
0085
***–
0.0
047*
**H
ISPA
NIC
– 0.
0014
***
0.00
00–
0.00
31**
*– 0
.001
3***
0.00
38**
*– 0
.001
7***
– 0.
0019
***
0.00
00–
0.00
12**
*– 0
.001
0*–
0.00
01–
0.00
47**
*0.
0016
***
MA
RR
IED
0.00
010.
0014
***
0.00
17**
*0.
0017
**0.
0021
***–
0.0
001
0.00
23**
*0.
0010
**0.
0011
*0.
0001
0.00
11**
*0.
0019
***
0.00
11**
AG
E–
0.00
69**
*0.
0105
***
0.02
91**
*0.
0328
***
0.02
48**
*– 0
.002
7***
0.02
40**
*0.
0205
***
0.02
78**
*0.
0005
0.01
38**
*0.
0169
***
0.02
13**
*P
OV
ER
TY0.
0038
***
0.00
64**
*0.
0002
0.00
54**
*0.
0051
***
0.00
27**
*0.
0035
***
0.00
40**
*0.
0063
***
0.00
52**
*0.
0024
***
0.00
70**
*0.
0031
***
INC
OM
E–
0.01
99**
*– 0
.025
6***
– 0.
0058
**–
0.01
91**
*– 0
.016
4***
– 0.
0084
***–
0.0
132*
**–
0.00
29*
– 0.
0242
***–
0.0
487*
**0.
0002
– 0.
0334
***–
0.0
123*
**LO
W-E
DU
0.00
81**
*0.
0111
***
0.00
030.
0094
***
0.00
84**
*0.
0046
***
0.00
50**
*0.
0032
***
0.01
14**
*0.
0167
***
0.00
20**
*0.
0122
***
0.00
64**
*U
NIN
SU
RED
0.00
33**
*0.
0029
***–
0.0
034*
**–
0.00
070.
0007
0.00
05**
– 0.
0003
– 0.
0004
– 0.
0007
0.00
48**
*– 0
.000
10.
0022
***–
0.0
017*
*C
OM
MU
TE0.
0005
**0.
0005
0.00
00–
0.00
030.
0007
0.00
020.
0007
*0.
0001
– 0.
0003
– 0.
0005
0.00
030.
0003
0.00
00VA
CA
NC
Y_
6MP
LUS
0.00
50**
*0.
0109
***
0.01
63**
*0.
0225
***
0.01
47**
*0.
0027
***
0.01
41**
*0.
0117
***
0.02
13**
*0.
0139
***
0.00
74**
*0.
0169
***
0.01
27**
*
Leve
l 2: m
etro
pol
itan
area
PO
P_C
H–
0.01
03–
0.01
43–
0.02
74–
0.03
11–
0.02
290.
0030
– 0.
0193
– 0.
0298
**–
0.01
950.
0170
– 0.
0151
– 0.
0122
– 0.
0035
UN
EM
P_C
H0.
0113
***
0.01
74**
*0.
0171
***
0.02
07**
0.01
62**
*0.
0031
0.01
87**
*0.
0134
***
0.01
63**
0.00
82*
0.00
98**
0.02
24**
*0.
0149
***
HC
OS
T–
0.00
26–
0.00
63*
– 0.
0055
– 0.
0092
*–
0.00
68*
– 0.
0003
– 0.
0083
**–
0.00
63**
*– 0
.005
7–
0.00
89**
– 0.
0047
*–
0.00
95*
– 0.
0094
***
TCO
ST
0.00
080.
0119
0.01
250.
0112
0.00
730.
0048
0.00
760.
0156
*0.
0165
– 0.
0004
0.00
090.
0027
0.00
18R
and
om
Eff
ects
Leve
l 10.
0055
***
0.01
05**
*0.
0318
***
0.04
04**
*0.
0218
***
0.00
18**
*0.
0214
***
0.01
32**
*0.
0334
***
0.01
69**
*0.
0065
***
0.02
20**
*0.
0150
***
Leve
l 2
inte
rcep
t0.
0043
**0.
0206
**0.
0128
*0.
0423
*0.
0170
**0.
0047
**0.
0197
**0.
0039
0.03
04**
0.01
50**
0.01
15**
0.03
39**
0.00
83**
Mo
del
fit
AIC
– 9,
202
– 6,
572
– 2,
179
– 1,
204
– 3,
648
– 13
,580
– 3,
709
– 5,
705
– 1,
968
– 4,
682
– 8,
480
– 3,
612
– 5,
165
BIC
– 9,
187
– 6,
558
– 2,
165
– 1,
191
– 3,
634
– 13
,566
–
3,69
5 –
5,69
1 –
1,95
4 –
4,66
9 –
8,46
6 –
3,59
9 –
5,15
1 N
umb
er o
f o
bse
rvat
ions
Leve
l 1:
cens
us tr
act
4,01
74,
017
4,01
74,
017
4,01
74,
017
4,01
74,
017
4,01
74,
017
4,01
74,
017
4,01
7
Leve
l 2:
met
rop
oli-
tan
area
12
12
12
12
12
12
12
12
12
12
12
12
12
AIC
= A
kaik
e in
form
atio
n cr
iterio
n. B
IC =
Bay
sian
info
rmat
ion
crite
rion.
HLM
= h
iera
rchi
cal l
inea
r m
odel
ing.
* p
< 0
.1. *
* p
< 0
.05.
***
p <
0.0
1.N
otes
: Lon
g-te
rm v
acan
t is
hous
ing
that
is v
acan
t for
mor
e th
an 6
mon
ths.
All
depe
nden
t var
iabl
es a
re in
nat
ural
log
form
.

166
Wang and Immergluck
The Housing-Health Connection
Exh
ibit
B-3
HLM
for L
ong-
Term
Vac
ant H
ousi
ng a
nd H
ealth
in 2
95 C
ities
in T
op 5
0 U
.S. M
etro
polit
an A
reas
, Wea
k-G
row
th M
etro
polit
an A
reas
Vari
able
sM
HLT
HP
HLT
HC
AN
CE
RC
HD
DIA
BE
TE
SC
AS
TH
MA
AR
TH
RIT
ISB
PH
IGH
ST
RO
KE
TE
ET
H-
LOS
TH
IGH
CH
OL
CO
PD
KID
NE
Y
Fix
ed e
ffec
tsLe
vel 1
: cen
sus
trac
t(In
terc
ept)
2.43
80**
*2.
4662
***
0.02
100.
3059
1.12
752.
2641
**1.
2970
2.09
24**
– 0.
0363
1.84
08*
3.05
63**
*– 0
.294
9–
0.86
39B
LAC
K0.
0012
***
0.00
26**
*– 0
.001
0***
0.00
16**
*0.
0077
***
0.00
24**
*0.
0022
***
0.00
49**
*0.
0067
***
0.00
40**
*0.
0003
***
0.00
09**
*0.
0046
***
AS
IAN
– 0.
0039
***–
0.0
046*
**–
0.00
71**
*– 0
.006
3***
– 0.
0012
– 0.
0029
***–
0.0
066*
**–
0.00
17**
*– 0
.003
5***
– 0.
0022
***–
0.0
017*
**–
0.00
78**
*– 0
.002
8***
HIS
PAN
IC–
0.00
13**
*0.
0002
– 0.
0035
***–
0.0
018*
**0.
0031
***–
0.0
017*
**–
0.00
17**
*0.
0002
– 0.
0014
***–
0.0
011*
*0.
0000
– 0.
0043
***
0.00
15**
*M
AR
RIE
D0.
0002
0.00
17**
*0.
0036
***
0.00
29**
*0.
0028
***–
0.0
001
0.00
37**
*0.
0019
***
0.00
16**
*– 0
.000
10.
0017
***
0.00
28**
*0.
0015
***
AG
E–
0.00
53**
*0.
0103
***
0.02
74**
*0.
0297
***
0.02
34**
*– 0
.002
6***
0.02
19**
*0.
0181
***
0.02
62**
*0.
0002
0.01
27**
*0.
0156
***
0.02
00**
*P
OV
ER
TY0.
0034
***
0.00
59**
*0.
0009
**0.
0052
***
0.00
50**
*0.
0024
***
0.00
35**
*0.
0036
***
0.00
64**
*0.
0043
***
0.00
23**
*0.
0066
***
0.00
33**
*IN
CO
ME
– 0.
0250
***–
0.0
309*
**–
0.00
84**
*– 0
.023
0***
– 0.
0213
***–
0.0
092*
**–
0.01
69**
*– 0
.006
6***
– 0.
0271
***–
0.0
500*
**–
0.00
33**
– 0.
0388
***–
0.0
134*
**LO
W-E
DU
0.00
90**
*0.
0115
***
0.00
13**
*0.
0103
***
0.00
88**
*0.
0053
***
0.00
56**
*0.
0030
***
0.01
17**
*0.
0161
***
0.00
23**
*0.
0137
***
0.00
67**
*U
NIN
SU
RED
0.00
25**
*0.
0017
***–
0.0
034*
**–
0.00
19**
0.00
000.
0003
– 0.
0011
– 0.
0005
– 0.
0013
*0.
0029
***–
0.0
006
0.00
10–
0.00
21**
*C
OM
MU
TE0.
0006
**0.
0006
*0.
0004
0.00
020.
0002
0.00
000.
0006
– 0.
0004
– 0.
0001
– 0.
0004
0.00
030.
0004
– 0.
0001
VAC
AN
CY
_ 6M
PLU
S0.
0053
**0.
0082
***
0.00
390.
0127
***
0.01
10**
*0.
0031
***
0.00
88**
*0.
0082
***
0.01
38**
*0.
0093
**0.
0059
***
0.00
98**
*0.
0078
***
Leve
l 2: m
etro
pol
itan
area
PO
P_C
H–
0.00
61–
0.01
89**
– 0.
0407
**–
0.05
28**
*– 0
.037
7**
0.00
50–
0.04
00**
– 0.
0357
***–
0.0
422*
**0.
0041
– 0.
0225
**–
0.03
70**
– 0.
0353
***
UN
EM
P_C
H–
0.00
09–
0.00
020.
0018
– 0.
0005
– 0.
0016
– 0.
0035
– 0.
0032
– 0.
0001
0.00
25–
0.00
86*
0.00
08–
0.00
44–
0.00
09H
CO
ST
0.00
15–
0.00
40–
0.00
19–
0.00
51–
0.00
530.
0031
– 0.
0025
– 0.
0033
– 0.
0049
0.00
25–
0.00
310.
0027
0.00
02TC
OS
T0.
0021
– 0.
0013
0.01
930.
0177
0.01
17–
0.00
290.
0264
0.01
770.
0093
0.01
450.
0060
0.02
750.
0193
Ran
do
m E
ffec
tsLe
vel 1
0.00
57**
*0.
0107
***
0.02
40**
*0.
0320
***
0.01
90**
*0.
0021
***
0.01
67**
*0.
0110
***
0.02
85**
*0.
0186
***
0.00
59**
*0.
0206
***
0.01
27**
*Le
vel 2
in
terc
ept
0.00
48**
*0.
0061
**0.
0236
**0.
0129
**0.
0217
***
0.01
09**
*0.
0217
***
0.01
24**
*0.
0120
***
0.01
46**
*0.
0107
***
0.01
76**
0.01
15**
Mo
del
fit
AIC
– 16
,759
– 12
,070
– 6,
138
– 4,
064
– 7,
821
– 24
,246
– 8,
801
– 11
,915
– 4,
948
– 8,
014
– 16
,438
– 7,
274
– 10
,808
BIC
– 16
,729
– 12
,038
– 6,
107
– 4,
032
– 7,
789
– 24
,215
– 8,
771
– 11
,883
– 4,
917
– 7,
984
– 16
,407
– 7,
242
– 10
,776
Num
ber
of
ob
serv
atio
nsLe
vel 1
: ce
nsus
trac
t7,
405
7,40
57,
405
7,40
57,
405
7,40
57,
405
7,40
57,
405
7,40
57,
405
7,40
57,
405
Leve
l 2:
met
rop
oli-
tan
area
22
22
22
22
22
22
22
22
22
22
22
22
22
AIC
= A
kaik
e in
form
atio
n cr
iterio
n. B
IC =
Bay
sian
info
rmat
ion
crite
rion.
HLM
= h
iera
rchi
cal l
inea
r m
odel
ing.
* p
< 0
.1. *
* p
< 0
.05.
***
p <
0.0
1.N
otes
: Lon
g-te
rm v
acan
t is
hous
ing
that
is v
acan
t for
mor
e th
an 6
mon
ths.
All
depe
nden
t var
iabl
es a
re in
nat
ural
log
form
.

The Geography of Vacant Housing and Neighborhood Health Disparities After the U.S. Foreclosure Crisis
167Cityscape
Acknowledgments
The authors thank the editors and five anonymous reviewers for their valuable comments and suggestions.
Authors
Kyungsoon Wang is a researcher graduated from the School of City and Regional Planning at the Georgia Institute of Technology.
Dan Immergluck is a professor in the Urban Studies Institute at Georgia State University.
References
Apgar, William C., and Mark Duda. 2005. Collateral Damage: The Municipal Impact of Today’s Mortgage Foreclosure Boom. Minneapolis: Homeownership Preservation Foundation. http://www.communityprogress.net/filebin/pdf/nvpc_trnsfr/Apgar_Duda_collateraldamage.pdf.
Arcaya, Mariana, M. Maria Glymour, Prabal Chakrabarti, Nicholas A. Christakis, Ichro Kawachi, and S.V. Subramanian. 2013. “Effects of Proximate Foreclosed Properties on Individuals’ Weight Gain in Massachusetts, 1987–2008,” American Journal of Public Health 103 (9): e50–e56.
Cannuscio, Carolyn C., Dawn E. Alley, Jose A. Pagán, Beth Soldo, Sarah Krasny, Michelle Shardell, David A. Asch, and Terri H. Lipman. 2012. “Housing Strain, Mortgage Foreclosure, and Health,” Nursing Outlook 60 (3): 134–142.
Carlyle, Erin. 2015. “2014 Foreclosure Filings Hit Lowest Level Since 2006, RealtyTrac Says,” Forbes, January 15. https://www.forbes.com/sites/erincarlyle/2015/01/15/foreclosure-filings-drop-by-18-in-2014-hit-lowest-level-since-2006-realtytrac-says/#462927c48e56.
Centers for Disease Control and Prevention (CDC). 2017. “500Cities: Local Data for Better Health.” https://www.cdc.gov/500cities/.
Cohen, Deborah A., Karen Mason, Ariane Bedimo, Richard Scribner, Victoria Basolo, and Thomas A. Farley. 2003. “Neighborhood Physical Conditions and Health,” American Journal of Public Health 93 (3): 467–471.
Cohen, Deborah A., Suzanne Spear, Richard Scribner, Patty Kissinger, Karen Mason, and John Wildgen. 2000. “Broken Windows and the Risk of Gonorrhea,” American Journal of Public Health 90 (2): 230–236.
Cui, Lin, and Randall Walsh. 2015. “Foreclosure, Vacancy and Crime,” Journal of Urban Economics 87: 72–84.
Currie, Janet, and Erdal Tekin. 2015. “Is There a Link Between Foreclosure and Health?” American Economic Journal: Economic Policy 7 (1): 63–94.

168
Wang and Immergluck
The Housing-Health Connection
Dales, Robert E., Harry Zwanenburg, Richard Burnett, and Claire A. Franklin. 1991. “Respiratory Health Effects of Home Dampness and Molds Among Canadian Children,” American Journal of Epidemiology 134: 196–203.
Ellen, Ingrid Gould, Johanna Lacoe, and Claudia Ayanna Sharygin. 2013. “Do Foreclosures Cause Crime?” Journal of Urban Economics 74 (C) 59–70.
U.S. Government Accountability Office (GAO). 2011. Vacant Properties: Growing Number Increases Communities’ Costs and Challenges. Washington, DC. https://www.gao.gov/assets/590/586089.pdf.
Han, Hye-Sung. 2014. “The Impact of Abandoned Properties on Nearby Housing Prices,” Housing Policy Debate 24: 311–334.
Hollander, Justin B. 2011. Sunburnt Cities: The Great Recession, Depopulation and Urban Planning in the American Sunbelt. London: Routledge.
Houle, Jason N. 2014. “Mental Health in the Foreclosure Crisis,” Social Science & Medicine 118C: 1–8.
Houle, Jason N., and Michael T. Light. 2014. “The Home Foreclosure Crisis and Rising Suicide Rates, 2005 to 2010,” American Journal of Public Health 104 (6): 1073–1079.
U.S. Department of Housing and Urban Development (HUD). 2017. “Location Affordability Portal.” http://www.locationaffordability.info/lai.aspx.
———. 2016. “HUD Aggregated USPS Administrative Data on Address Vacancies.” huduser.gov/portal/datasets/usps.html.
Immergluck, Dan. 2016. “Examining Changes in Long-Term Neighborhood Housing Vacancy Dur-ing the 2011 to 2014 U.S. National Recovery,” Journal of Urban Affairs 38 (5): 607–622.
———. 2010. “Neighborhoods in the Wake of the Debacle: Intrametropolitan Patterns of Fore-closed Properties,” Urban Affairs Review 46: 3–36.
Immergluck, Dan, and Geoff Smith. 2006. “The External Costs of Foreclosure: The Impact of Single-Family Mortgage Foreclosures on Property Values,” Housing Policy Debate 17 (1): 57–79.
Jacobs, David E., Robert P. Clickner, Joey Y. Zhou, Susan M. Viet, David A. Marker, John W. Rog-ers, Darryl C. Zeldin, Pamela Broene, and Warren Friedman. 2002. “The Prevalence of Lead-Based Paint Hazards in U.S. Housing,” Environmental Health Perspectives 110 (10): A599–606.
Krieger, James, and Donna L. Higgins. 2002. “Housing and Health: Time Again for Public Health Action,” American Journal of Public Health: 230–236.
LeClere, Felicia B., Richard G. Rogers, and Kimberley D. Peters. 1998. “Neighborhood Social Con-text and Racial Differences in Women’s Heart Disease Mortality,” Journal of Health Social Behavior 39 (2): 91–107.
Li, Yanmei, and Hazel A. Morrow-Jones. 2010. “The Impact of Residential Mortgage Foreclosure on Neighborhood Change and Succession,” Journal of Planning Education and Research 30 (1): 22–39.

The Geography of Vacant Housing and Neighborhood Health Disparities After the U.S. Foreclosure Crisis
169Cityscape
Libman, Kimberly, Desiree Fields, and Susan Saegert. 2012. “Housing and Health: A Social Eco-logical Perspective on the US Foreclosure Crisis,” Housing, Theory and Society 29 (1): 1–24.
Mallach, Alan. 2008. How To Spend $3.93 Billion: Stabilizing Neighborhoods by Addressing Foreclosed and Abandoned Properties. Discussion paper. Philadelphia: Federal Reserve Bank of Philadelphia. https://www.philadelphiafed.org/-/media/community-development/publications/discussion-papers/DiscussionPapers_Mallach_10_08_final.pdf.
McKenzie, Brian S. 2013. “Neighborhood Access to Transit by Race, Ethnicity, and Poverty in Portland, OR,” City & Community 12 (2): 134–155.
Miles, Rebecca, Christopher Coutts, and Asal Mohamadi. 2011. “Neighborhood Urban Form, Social Environment, and Depression,” Journal of Urban Health 89 (1): 1–18.
Myrdal, Gunner. 1957. Economic Theory and Underdeveloped Region. London: Duckworth.
National Center for Health Statistics (NCHS). 2015a. “Summary Health Statistics for U.S. Adult: National Health Interview Survey, 2015.” https://ftp.cdc.gov/pub/Health_Statistics/NCHS/NHIS/SHS/2015_SHS_Table_A-2.pdf.
———. 2015b. “Summary Health Statistics for U.S. Children: National Health Interview Survey, 2015.” https://ftp.cdc.gov/pub/Health_Statistics/NCHS/NHIS/SHS/2015_SHS_Table_C-1.pdf.
Norusis, Marija J. 2011. IBM SPSS Statistics 19 Guide to Data Analysis. Boston: Addison-Wesley.
Peat, Jennifer K., J. Dickerson, and Janet Li. 1998. “Effects of Damp and Mold in the Home on Respiratory Health: A Review of the Literature,” Allergy 53: 120–128.
Phipatanakul, Wanda, Peyton A. Eggleston, E.C. Wright, and Robert A. Wood. 2000. “The Rela-tionship of Mouse Allergen Exposure to Mouse Sensitization and Asthma Morbidity in Inner-City Children With Asthma,” Journal of Allergy Clinical Immunology 106: 1075–1080.
Pollack, Craig Evan, and Julia Lynch. 2009. “Health Status of People Undergoing Foreclosure in the Philadelphia Region,” American Journal of Public Health 99: 1833–1839.
Raleigh, Erica, and George Galster . 2014. “Neighborhood Disinvestment, Abandonment, and Crime Dynamics,” Journal of Urban Affairs 37 (4): 367–396.
Ross, Catherine E., and John Mirowsky. 2010. “Gender and the Health Benefits of Education,” The Sociological Quarterly 51 (1): 1–19.
———. 2001. “Neighborhood Disadvantage, Disorder, and Health,” Journal of Health and Social Behavior 42 (3): 258–276.
Ross, Lauren M., and Gregory D. Squires. 2011. “The Personal Costs of Subprime Lending and the Foreclosure Crisis: A Matter of Trust, Insecurity, and Institutional Deception,” Social Science Quarterly 92 (1): 140–163.
Rugh, Jacob S., Len Albright, and Douglas S. Massey. 2015. “Race, Space, and Cumulative Disad-vantage: A Case Study of the Subprime Lending Collapse,” Social Problems 62 (2): 186–218.

170
Wang and Immergluck
The Housing-Health Connection
Saegert, Susan, Desiree Fields, and Kimberly Libman. 2011. “Mortgage Foreclosure and Health Disparities: Serial Displacement as Asset Extraction in African American Populations,” Journal of Urban Health 88 (3): 390–402.
Sawichi, David S., and Patrice Flynn. 1996. “Neighborhood Indicators: A Review of the Literature and an Assessment of Conceptual and Methodological Issues,” Journal of the American Planning Association 62 (2): 165–184.
Schuetz, Jenny, Vicki Been, and Ingrid Gould Ellen. 2008. “Neighboring Effects of Concentrated Mortgage Foreclosures,” Journal of Housing Economics 17 (4): 306–319.
Shuler, Jill R., Robert B. Kent, and Charles B. Monroe. 1992. “Neighborhood Gentrification: A Discriminant Analysis of a Historic District in Cleveland, Ohio,” Urban Geography 13: 49–67.
Sternlieb, George, and Bernard Indik. 1969. “Housing Vacancy Analysis,” Land Economics 45 (1): 117–121.
Wang, Kyungsoon. 2016. “The Characteristics of Resilient Neighborhood Housing Markets During and After the U.S. Housing Crisis.” Ph.D. diss., School of City and Regional Planning, Georgia Institute of Technology.
Wooldridge, Jeffrey M. 2009. Introductory Econometrics: A Modern Approach. 4th ed. Mason, OH: South-Western Cengage Learning.


![rajswasthya.nic.inrajswasthya.nic.in/251 dt 19.04.2015 RUHS 2014 MO POSTING...I / 2015/2 s / 04/2015 VACANT POS] VACANT POS] VACANT POST VACANT POST VACANT POST VACANT POST VACANT](https://img.pdfslide.us/doc/110x75/5ab992577f8b9aa6018e0de9/dt-19042015-ruhs-2014-mo-postingi-20152-s-042015-vacant-pos-vacant-pos.jpg)