Embed Size (px)
Citation preview
The Geography of UK International Trade
Henry G. Overman and L. Alan Winters
January 2004
Abstract This paper examines how the geography of UK international trade has changed since the UK’s accession to the European Economic Community using a newly constructed data set that gives a detailed breakdown of the UK’s imports and exports by both port of entry and exit and commodity. Our results suggest that between 1970 and 1992 overall imports and exports re-orientated in favour of ports located nearer to the continent. The vast majority of individual commodities also saw a similar re-orientation. Keywords: UK trade, EEC, economic geography JEL Classification: F15, F14, R12 This paper was produced as part of the Centre’s Globalisation Programme. The Centre for Economic Performance is financed by the Economic and Social Research Council. Acknowledgements We are grateful to Sandra Bulli and Andrea Molinari for research assistance and to Natasha Ward for logistical assistance. Financial support from the ESRC (grant number L138251028) is gratefully acknowledged. Henry G. Overman is a member of the Centre for Economic Performance Globalisation Programme and a lecturer in Economic Geography in the department of Geography and Environment at the London School of Economics. He is also affiliated with the Centre for Economic Policy Research's International Trade Programme. Email: [email protected] Alan Winters is Professor of Economics at Sussex University and a Senior Research Associate in the Globalisation Programme at the Centre for Economic Performance, London School of Economics. Published by Centre for Economic Performance London School of Economics and Political Science Houghton Street London WC2A 2AE All rights reserved. No part of this publication may be reproduced, stored in a retrieval system or transmitted in any form or by any means without the prior permission in writing of the publisher nor be issued to the public or circulated in any form other than that in which it is published. Requests for permission to reproduce any article or part of the Working Paper should be sent to the editor at the above address. H. G. Overman and L. A. Winters, submitted 2004 ISBN 0 7530 1707 5 Individual copy price: £5
2
1. Introduction
This paper is concerned with the geography of UK international trade. It describes which
ports the UK uses to import and export goods. To an international trade economist such
questions on the ‘how’ of trade are interesting, but have traditionally been seen as of second
order importance compared to questions relating to the ‘why’ of trade. Economic geographers
have traditionally been more interested in the ‘how’, but after a brief flurry of activity in the
late 1980’s and 1990’s have moved on to other issues. When we started the work that forms
the basis of this paper we were interested in economic geography, but of production, not
trade. We wanted to assess whether the UK’s accession to the European Economic
Community (EEC) had affected the economic geography of UK manufacturing. To do this,
we needed information on how accession changed the ease of export market access and the
degree of import competition faced by firms located in different areas of the UK. To construct
these measures we assembled a dataset of UK exports and imports by port with these flows
disaggregated into quite detailed commodities. As we worked with this data, we began to
realise that the changes in the geography of UK trade were interesting in and of themselves.
In addition, our newly constructed data allowed us to consider aspects of these changes that
had not been considered in the existing literature. This paper describes these changes over the
period 1970 to 1992.
Before presenting our results, we briefly consider why one might be interested in the
geography of trade. The first reason relates to the initial aim of our analysis: Where imports
enter and exports leave the country influence the internal economic geography of the country.
Such ideas have a long history in economic geography tracing back to the work of Harris
(1954) on market potential and Hirschman (1958) and Myrdal (1957) on cumulative growth
processes. This theoretical framework provides the foundation for empirical work by Bröcker
and Peschel (1988) and Chisholm (1995) on the spatial impacts of economic integration.
These economic geography impacts have also been the focus of the recent ‘New Economic
Geography’ literature predominantly associated with urban and international economists, see
Fujita, Krugman and Venables (1999), Fujita and Thisse (2002), Neary (2001) and Baldwin,
Forslid, Martin, Ottaviano, Robert-Nicoud (2003) for overviews. The analysis of this New

3
Economic Geography literature formalises ideas about the impact of trade from the older
literature predominantly associated with economic geographers.
The second reason to focus on the geography of trade across ports is that the location and
efficiency of ports play an important role in determining transaction costs between locations
and these transaction costs in turn help determine trade patterns. The analysis of the former
issue (the determinants of shipping costs) by students of maritime economics has generally
been separated from the analysis of the latter issue (the impact of transaction costs on trade)
by international trade economists. More recently, however, international trade economists
have begun to reconsider the determinants of transactions costs and the impacts on trade
flows. For an example of earlier work, see Moneta (1959). The more recent literature is
summarised in Limao and Venables (2001). Although our paper does not talk directly to the
determinants of transaction costs, it clearly relates to this strand of literature in its focus on the
changing geography of trade across different ports as changes in port technologies and closer
EEC integration change UK transactions costs with rest of the world.
A third reason for considering the port-structure of trade relates to infrastructure planning and
investment. To the extent that the structure can be explained and predicted it can contribute to
efficient and appropriate investment programmes.
The rest of this paper is structured as follows. Section 2 outlines the port data that we use for
our analysis. That section also surveys existing data sets and the findings of previous studies.
Section 3 describes how the geography of trade has changed over the period 1970 to 1992 for
both aggregate trade and for individual commodities. Finally, section 4 offers some brief
conclusions.
2. Data
The port data set
The main international trade data that underpin our analysis describe UK trade by port and
commodity from 1970 to 1992. The dataset was specially constructed from official sources
4
for the present exercise and, to our knowledge, these sources have never been exploited
before at this level of detail. Data on UK trade by port have been published in a variety of
locations and formats since 1970: the Annual Statement of Trade, Vol. V, (HM Customs and
Excise), 1970-75; Statistics of Trade through United Kingdom Ports, (HM Customs and
Excise), 1976-80; on micro fiche, 1981-87, and then electronically for 1988-92 via the
commercial data suppliers, Business Trade Statistics Ltd. The format and structure varies by
publication (for example the data are sometimes presented by port, sometimes by commodity)
and the classifications evolve from The Standard International Trade Classification (Revised)
- SITC(R) - through SITC(2R) and (3R) to the Harmonised System (HS, 1988). In addition to
classifying goods differently, the classifications also have rather different coverage of goods –
e.g. variations in the treatment of non-monetary gold, tax-free cars, and parcel post. We have
attempted to correct for these evolutions as well as to convert the data to a common
classification. The latter process requires a certain amount of approximation, which in most
cases must be based on the structure of UK total trade rather than that of specific ports. Data
are not available by port for trade with the European Union after 1992 because under the
Single Market Programme these flows were treated as internal European trade and are
recorded via VAT returns rather than by Customs and Excise at the port.
The data on trade flows prior to 1977 are available only at 2-digit (Division) level of the
SITC(R). Thus for time series consistency all subsequent data were converted to this basis.
The most disaggregated continuous series that could be constructed was at the Division (2-
digit) level of the SITC(R), which distinguishes 56 headings, of which we have to drop one
(35, gas and electricity) and combine one pair into a single heading (33 and 52 - petroleum
products and chemicals deriving from petroleum - which become inextricably entwined in the
later classifications). Table 2 in section 3 provides a list of the 54 commodity headings that
we use. At this level no volume or deflator data are available, so all data are in value terms.
Given the high rates of inflation over much of the period this renders intertemporal absolute
comparisons virtually meaningless, but for the purposes of this paper using ports’ shares in
total exports or imports of a commodity is sufficient.
The source data contain three major unexplained omissions: export data for 1983, both export
and import data for 1987, and export data for HS chapters 84-99 for 1989-90. We searched
extensively for these omitted data, but ultimately to no avail. We were, however, able to
5
locate alternative sources for the last set of omissions and thus to complete the series for
1989-90 – see Molinari and Winters (2003). Over the period 1970-92 data are reported for
about 120 ports at some point of time. However, the coverage changes through time and there
is a fairly continuous process of re-combination of ports into local groups, as the geographical
responsibilities of individual customs offices evolved. In most cases we solve these problems
by aggregating ports into groups that are invariant over time, but there remain a number of
minor inconsistencies. We find the documentation of the later data far inferior and less precise
than that of the earlier years, so some of the definitions rely on inference. We do not believe
that we have introduced any errors, however. For example, Avonmouth was included in
Bristol for 1970-73, the two ports were separated for 1974-80 and after 1980 Bristol
disappears as an explicit entry and we take it implicitly to be included in Avonmouth. Overall
we are able to compile reasonably consistent data on 92 ports or local groups of ports over
1970-92.
The data have been subject to a number of consistency checks as they have been prepared,
including some checking against independent sources. Unfortunately a number of
implausibilities remain, mostly, we suspect, in the allocation of trade across ports, since data
on trade by commodity have been subjected to extensive use and consideration by other
researchers. The most serious remaining mystery is the sharp change in the share of exports of
engineering goods (SITC(R) Section 7) passing through Heathrow in 1991. We have been
unable to explain this or to find a plausible way of adjusting the data.
Comparison to other port data
What can we learn about the geography of UK trade from this data set that we did not already
know from existing studies? Chisholm (1995) reports results from two sets of studies. The
first set is related to the changing nature of port hinterlands and forelands.1 In a series of
studies, Hoare (1977, 1985, 1986, 1988) studies these changes using data on the proportion of
regional imports and exports that are routed through ports in the same region. This work was
updated by Chisholm (1992). Chisholm reports Hoare’s results2 as showing that “if we take
1 Hinterlands are the areas that account for imports routed through the port in question. Forelands are the areas that route their exports through the port. 2 We use Chisholm’s (1992) presentation of Hoare’s earlier results because footnote 1 on page 563 of Chisholm (1992) suggests that there is an error in Hoare’s original paper.

6
the standard region as the geographical unit of analysis, then in 1964, the tonnage of [firm]
exports routed through a port in the same standard region accounted for 63% of the total; by
1978 the proportion had fallen to 48%” [Chisholm 1992, p563]. Chisholm’s results for 1986,
while not directly comparable, suggest that “the rapid reduction in the strength of local
linkages seems to have abated in the period 1978-86” [Chisholm 1992, p563]. The second set
of studies, reported in Chisholm (1992, 1995), focuses on patterns of bilateral trade between
UK regions and different world regions (EEC, Scandinavian and Baltic etc). Results from
these studies suggest that “there is little evidence to suggest that the regions which are nearest
to Europe systematically trade with our neighbours on a scale greater than the national
average” [Chisholm 1995, p. 130] although there is some evidence of a re-orientation of trade
towards ports in regions nearer to the continent.
In comparison with the data used in these studies our data has one weakness: we do not know
the origin and destination of individual ports’ imports and exports. However, it has two key
off-setting strengths, which allow us to complement these earlier studies. First, our data is
disaggregated by commodity whereas other data is usually very aggregate. For example,
Chisholm (1995) has to consider manufacturing as a single group. Second our data reports the
value of trade whereas the findings in both Chisholm (1992, 1995) and Hoare (1977, 1985,
1986, 1988) are based on tonnage.3
3. Changes in the Geography of UK Trade
Our main focus is in the changing geography of UK trade following the UK’s accession to the
EEC in 1973. The post-accession re-orientation of UK trade by source/destination is well-
known and needs no rehearsal here – see, among many others, Winters (1984), or Begg et al
(2003). The fact that this was associated with a re-orientation by port is not so well-known,
and it is this phenomenon that we examine in this paper.
The basic series cover exports and imports for 54 2-digit commodity groups, 92 ports and 21
(exports) or 22 (imports) years. We begin our investigation of the geography of UK trade by
3 Chisholm (1995) does report some results based on values, but still using the very aggregate classification of trade by type.

7
considering patterns for aggregate trade. We distinguish between total imports and exports for
all commodities (excluding gas and electricity) and total imports and exports in
manufacturing – SITC(R) 5 to 8. For the sake of descriptive convenience in the preliminary
work we group ports into nine regions, loosely based on those used by Chisholm (1992,
1995). The nine groups are: Thames and Kent (THAKE), Haven and East Anglia (HAVEA),
Sussex and Hampshire (SUHAM), South South West and Cornwall (SSWCO), North East-
Humber (NEHUM), East Scotland (ESCOT), Rest of sea ports (RESTP), London Airports
(AIRLO) and Other Airports (AIROT). Full definitions are given in the appendix. The
grouping is more finely disaggregated around the South East, because we might expect any
changes related to the impacts of accession to be more nuanced for ports located closer to the
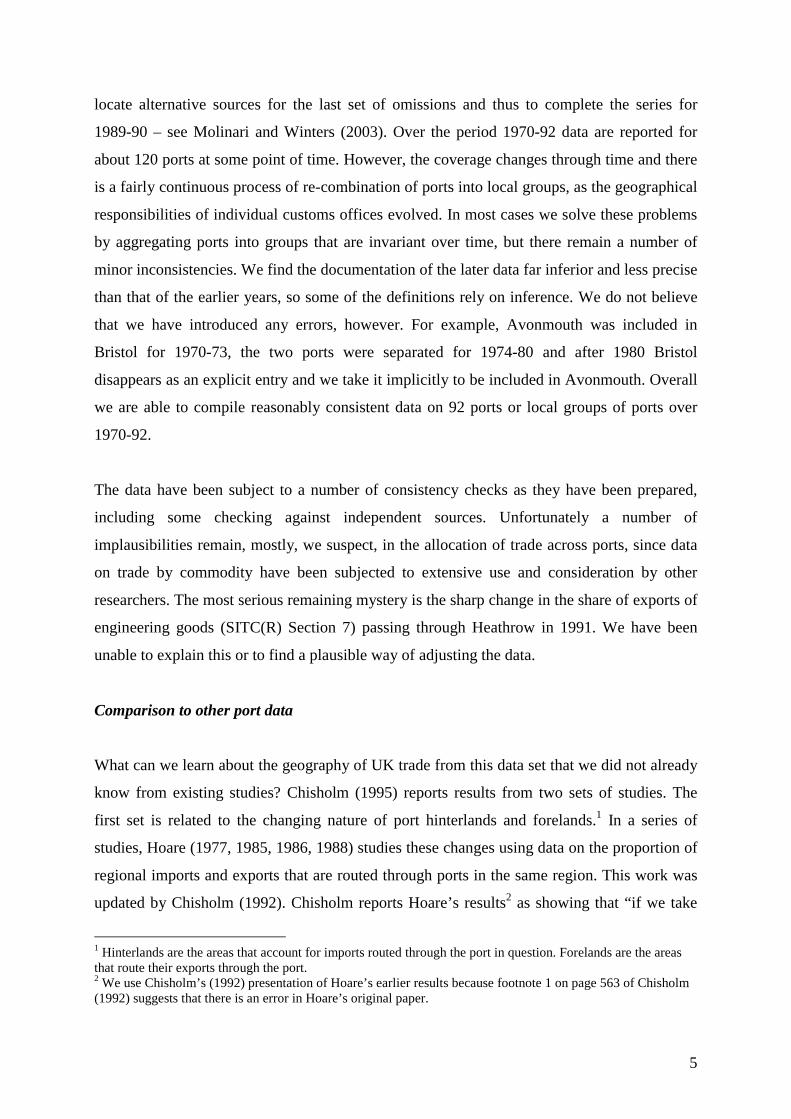
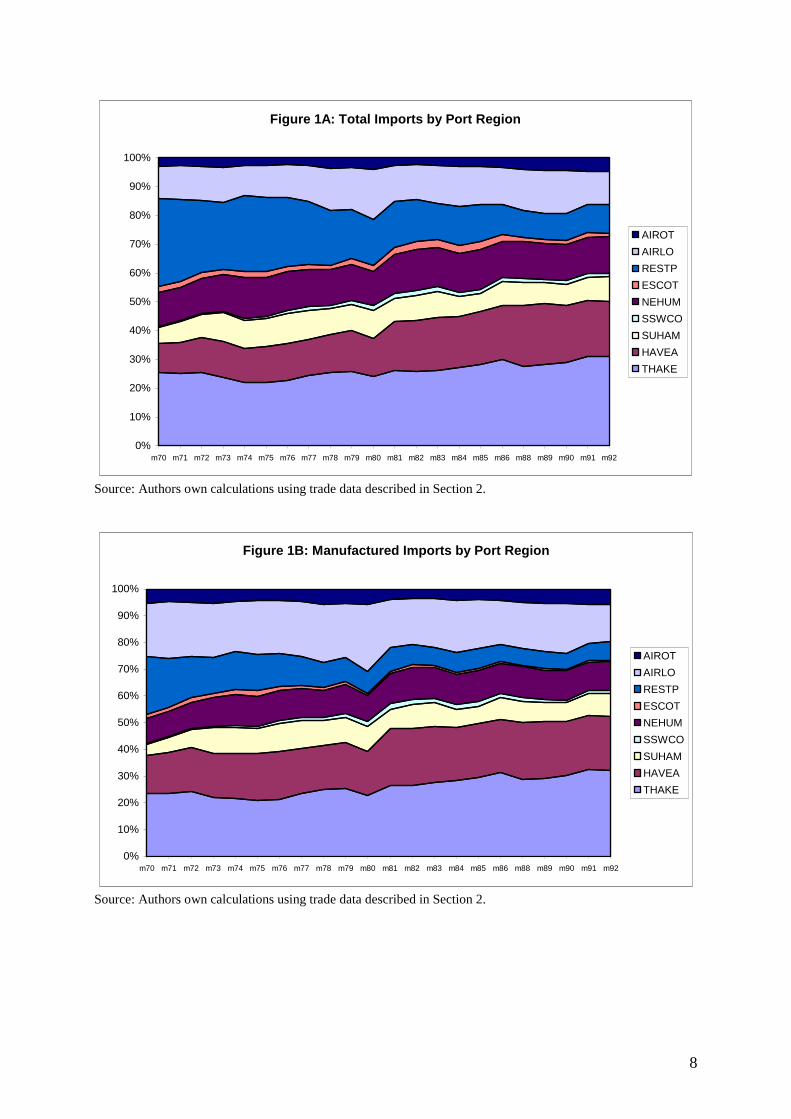
continent. Figures 1A to 1D give the breakdown of UK exports and imports in total4 and for
manufactures across these port groups. These figures illustrate two key characteristics of the
changing geography of UK trade. First, the growing share for the upper two segments
(AIROT and AIRLO) clearly capture the growing importance of air transportation in the
value of British trade. Second, we can see the gradual re-orientation of trade towards the
South East port groups – roughly speaking the lower the segment the closer the port groups to
the South East corner of Britain. Between 1970 and 1992, the ports in the South of the
country (THAKE, HAVEA, SUHAM and SSWCO) see their share in total imports increase
by almost 20 percentage points, growing from 41% of total imports in 1970 to 60% of total
imports in 1992. Changes in shares of manufactured imports are very similar (from 42% to
62%). The re-orientation of total exports is not as marked. The ports in the south of the
country see their share in total exports rise from 46% in 1970 to 56% in 1992. The re-
orientation is stronger for manufacturing exports than for total exports. Southern ports see
their share of total manufacturing exports rise from 47% to 58%. The major difference
between total and manufacturing exports is the large share of ports in the ESCOT group in
total exports particularly between 1979 and 1986. This is due solely to exports of oil. These
have always been routed through ESCOT ports and during this period they expanded rapidly
to account for nearly 15% of the value of visible exports as the world price of oil peaked. In
summary, the general picture for both exports and imports is of a re-orientation to ports in the
southern part of the country. As discussed above, Chisholm (1992, 1995) finds signs of a
similar reorientation.
4 Strictly of SITC(R) 0-8; i.e. omitting Section 9 ‘Commodities not elsewhere classified’.
8
Figure 1A: Total Imports by Port Region
0%
10%
20%
30%
40%
50%
60%
70%
80%
90%
100%
m70 m71 m72 m73 m74 m75 m76 m77 m78 m79 m80 m81 m82 m83 m84 m85 m86 m88 m89 m90 m91 m92
AIROT
AIRLO
RESTP
ESCOT
NEHUM
SSWCO
SUHAM
HAVEA
THAKE
Source: Authors own calculations using trade data described in Section 2.
Figure 1B: Manufactured Imports by Port Region
0%
10%
20%
30%
40%
50%
60%
70%
80%
90%
100%
m70 m71 m72 m73 m74 m75 m76 m77 m78 m79 m80 m81 m82 m83 m84 m85 m86 m88 m89 m90 m91 m92
AIROT
AIRLO
RESTP
ESCOT
NEHUM
SSWCO
SUHAM
HAVEA
THAKE
Source: Authors own calculations using trade data described in Section 2.
9
Figure 1C: Total Exports by Port Region
0%
10%
20%
30%
40%
50%
60%
70%
80%
90%
100%
x70 x71 x72 x73 x74 x75 x76 x77 x78 x79 x80 x81 x82 x84 x85 x86 x88 x89 x90 x91 x92
AIROT
AIRLO
RESTP
ESCOT
NEHUM
SSWCO
SUHAM
HAVEA
THAKE
Source: Authors own calculations using trade data described in Section 2.
Figure 1D: Manufactured Exports by Port Region
0%
10%
20%
30%
40%
50%
60%
70%
80%
90%
100%
x70 x71 x72 x73 x74 x75 x76 x77 x78 x79 x80 x81 x82 x84 x85 x86 x88 x89 x90 x91 x92
AIROT
AIRLO
RESTP
ESCOT
NEHUM
SSWCO
SUHAM
HAVEA
THAKE
Source: Authors own calculations using trade data described in Section 2. One possibility is that this changing geography of trade is driven by changes in the
concentration of trade across ports. For example, as transportation technologies have changed
it is perfectly conceivable that trade should have concentrated (or otherwise), and if it has, one
would expect changes in its geographical spread. To examine this possibility we calculated

10
two indices, the 5-port concentration ratio (C5) and the Herfindhal index, that capture the
extent to which trade is concentrated in particular ports. C5 is calculated as the sum of shares
of the top five ports at each period in time. The Herfindahl is the sum of squared shares with
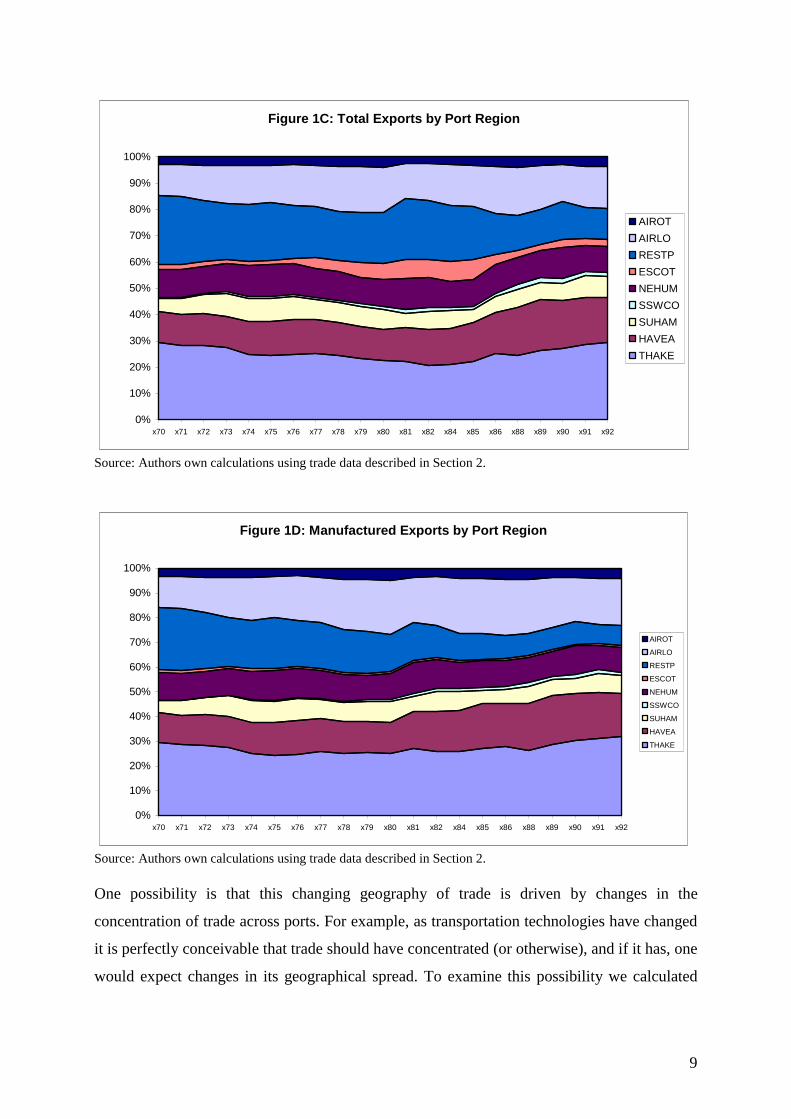
the summation taken over all ports rather than just the top five. Results for both indices show
that there is relatively little evidence of strong changes in concentration for aggregate trade.
Figures 2A and 2B report the Herfindahl indices for exports and imports respectively. Both
graphs report the index for total trade (total of commodities 00 to 89) and the unweighted
mean of the indices for each 2-digit category. The C5 indices, not reported here tell, much the
same story. Two results emerge from the concentration indices. First, concentration falls
somewhat over the sample period, but not monotonically. Concentration fell during the 1970s
and then actually stabilised or rose gradually over the rest of our sample. The former may
reflect accession, but given that it starts in 1970 (or before – we cannot tell), it probably does
not. For both imports and exports the increases in concentration in the second half of the
period are not enough to offset the falls seen at the start of the period. Second, the unweighted
mean of 2 digit indices is considerably higher than the index for overall concentration. This
reflects the fact that although most commodities are more concentrated than aggregate trade
they are concentrated on different ports. This, in turn, could reflect either that ports are
relatively specialised or that production of commodities is concentrated, but in different
places, and firms use local ports.
Figure 2A: Herfindahl Concentration Indices Imports
00.020.040.060.08
0.10.120.140.160.18
70 71 72 73 74 75 76 77 78 79 80 81 82 83 84 85 86 88 89 90 91 92
00-89
mean
Source: Authors own calculations using trade data described in Section 2.
11
Figure 2B: Herfindahl Concentration Indices Exports
00.020.040.060.080.1
0.120.140.160.180.2
70 71 72 73 74 75 76 77 78 79 80 81 82 84 85 86 88 89 90 91 92
00-89
mean
Source: Authors own calculations using trade data described in Section 2. Although the C5 indices have changed rather little, the ports within the top five have evolved
through time – gravitating a little towards the South East. Tables 1A and 1B report the top
five ports in 1970 and 1992 for manufactured trade imports and exports. Calculations for total
trade, not reported here, give similar outcomes.
Table 1A: Top five ports for imports (% share manufactured imports)
1970 1992 Heathrow Airport 18.3% Dover 19.7% London 18.3% Heathrow Airport 13.2% Liverpool 8.2% Felixstowe 12.8% Harwich 7.6% Southampton 6.6% Felixstowe 5.2% London 5.3% Source: Authors own calculations using trade data described in Section 2. Table 1B: Top five ports for exports (% share manufactured exports)
1970 1992 London 26.2% Dover 19.6% Liverpool 16.0% Heathrow Airport 17.7% Heathrow Airport 12.0% Felixstowe 11.5% Harwich 6.9% London 6.9% Hull 5.8% Southampton 4.7% Source: Authors own calculations using trade data described in Section 2.
12
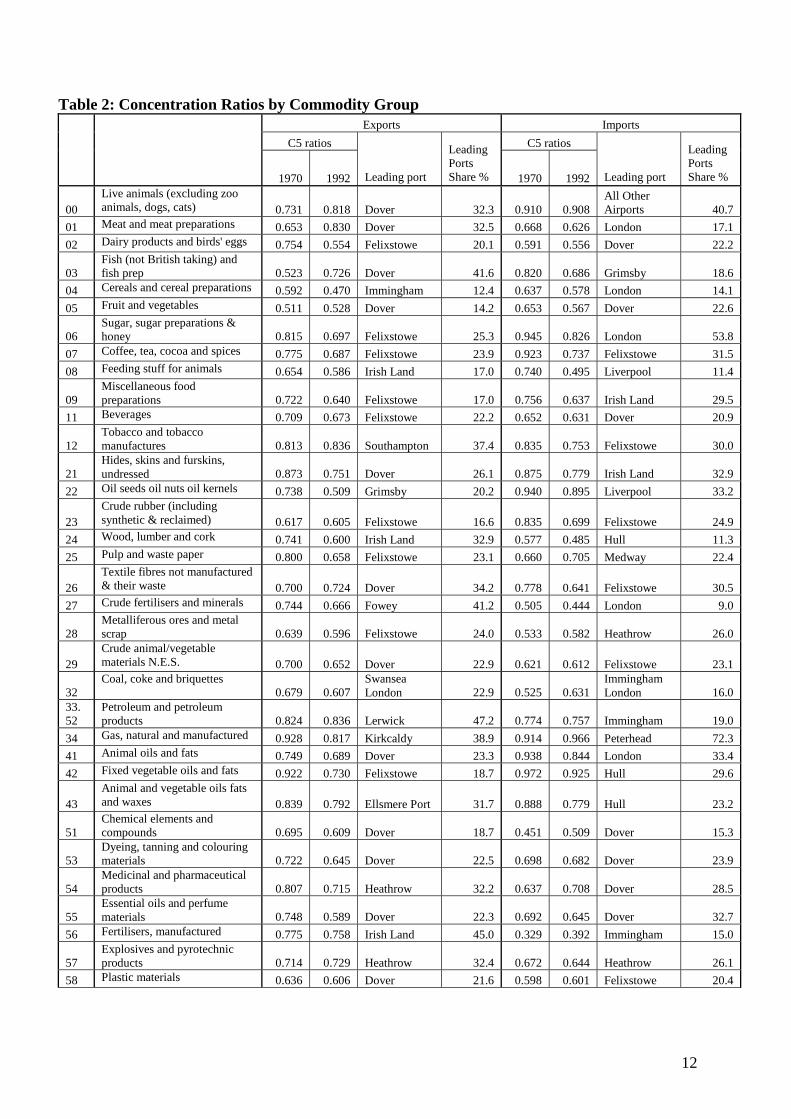
Table 2: Concentration Ratios by Commodity Group Exports Imports
C5 ratios C5 ratios
1970 1992 Leading port
Leading Ports Share % 1970 1992 Leading port
Leading Ports Share %
00 Live animals (excluding zoo animals, dogs, cats) 0.731 0.818 Dover 32.3 0.910 0.908
All Other Airports 40.7
01 Meat and meat preparations 0.653 0.830 Dover 32.5 0.668 0.626 London 17.1
02 Dairy products and birds' eggs 0.754 0.554 Felixstowe 20.1 0.591 0.556 Dover 22.2
03 Fish (not British taking) and fish prep 0.523 0.726 Dover 41.6 0.820 0.686 Grimsby 18.6
04 Cereals and cereal preparations 0.592 0.470 Immingham 12.4 0.637 0.578 London 14.1
05 Fruit and vegetables 0.511 0.528 Dover 14.2 0.653 0.567 Dover 22.6
06 Sugar, sugar preparations & honey 0.815 0.697 Felixstowe 25.3 0.945 0.826 London 53.8
07 Coffee, tea, cocoa and spices 0.775 0.687 Felixstowe 23.9 0.923 0.737 Felixstowe 31.5
08 Feeding stuff for animals 0.654 0.586 Irish Land 17.0 0.740 0.495 Liverpool 11.4
09 Miscellaneous food preparations 0.722 0.640 Felixstowe 17.0 0.756 0.637 Irish Land 29.5
11 Beverages 0.709 0.673 Felixstowe 22.2 0.652 0.631 Dover 20.9
12 Tobacco and tobacco manufactures 0.813 0.836 Southampton 37.4 0.835 0.753 Felixstowe 30.0
21 Hides, skins and furskins, undressed 0.873 0.751 Dover 26.1 0.875 0.779 Irish Land 32.9
22 Oil seeds oil nuts oil kernels 0.738 0.509 Grimsby 20.2 0.940 0.895 Liverpool 33.2
23 Crude rubber (including synthetic & reclaimed) 0.617 0.605 Felixstowe 16.6 0.835 0.699 Felixstowe 24.9
24 Wood, lumber and cork 0.741 0.600 Irish Land 32.9 0.577 0.485 Hull 11.3
25 Pulp and waste paper 0.800 0.658 Felixstowe 23.1 0.660 0.705 Medway 22.4
26 Textile fibres not manufactured & their waste 0.700 0.724 Dover 34.2 0.778 0.641 Felixstowe 30.5
27 Crude fertilisers and minerals 0.744 0.666 Fowey 41.2 0.505 0.444 London 9.0
28 Metalliferous ores and metal scrap 0.639 0.596 Felixstowe 24.0 0.533 0.582 Heathrow 26.0
29 Crude animal/vegetable materials N.E.S. 0.700 0.652 Dover 22.9 0.621 0.612 Felixstowe 23.1
32 Coal, coke and briquettes
0.679 0.607 Swansea London 22.9 0.525 0.631
Immingham London 16.0
33. 52
Petroleum and petroleum products 0.824 0.836 Lerwick 47.2 0.774 0.757 Immingham 19.0
34 Gas, natural and manufactured 0.928 0.817 Kirkcaldy 38.9 0.914 0.966 Peterhead 72.3
41 Animal oils and fats 0.749 0.689 Dover 23.3 0.938 0.844 London 33.4
42 Fixed vegetable oils and fats 0.922 0.730 Felixstowe 18.7 0.972 0.925 Hull 29.6
43 Animal and vegetable oils fats and waxes 0.839 0.792 Ellsmere Port 31.7 0.888 0.779 Hull 23.2
51 Chemical elements and compounds 0.695 0.609 Dover 18.7 0.451 0.509 Dover 15.3
53 Dyeing, tanning and colouring materials 0.722 0.645 Dover 22.5 0.698 0.682 Dover 23.9
54 Medicinal and pharmaceutical products 0.807 0.715 Heathrow 32.2 0.637 0.708 Dover 28.5
55 Essential oils and perfume materials 0.748 0.589 Dover 22.3 0.692 0.645 Dover 32.7
56 Fertilisers, manufactured 0.775 0.758 Irish Land 45.0 0.329 0.392 Immingham 15.0
57 Explosives and pyrotechnic products 0.714 0.729 Heathrow 32.4 0.672 0.644 Heathrow 26.1
58 Plastic materials 0.636 0.606 Dover 21.6 0.598 0.601 Felixstowe 20.4

13
59 Chemical materials and products, N.E.S. 0.754 0.590 Felixstowe 19.7 0.583 0.543 Dover 19.8
61 Leather, leather manufactures, N.E.S. 0.740 0.767 Heathrow 28.9 0.740 0.720 Dover 32.6
62 Rubber manufactures, N.E.S. 0.667 0.599 Dover 20.8 0.491 0.569 Dover 21.1
63 Cork and wood manufactures (excluding furniture) 0.644 0.547 Felixstowe 15.0 0.682 0.564 London 22.9
64 Paper, paperbound, and manufactures thereof 0.659 0.607 Dover 19.3 0.689 0.609 Felixstowe 15.5
65 Textile yarn, fabrics, made-up articles 0.633 0.627 Dover 30.1 0.595 0.604 Dover 34.8
66 Non- metallic mineral manufactures, N.E.S. 0.890 0.805 Heathrow 58.8 0.913 0.858 Dover 26.5
67 Iron and steel 0.546 0.464 Felixstowe 11.3 0.520 0.493 Dover 11.3
68 Non-ferrous metals 0.762 0.664 Dover 23.3 0.693 0.595 Heathrow 14.5
69 Manufactures of metal, N.E.S. 0.698 0.552 Dover 21.1 0.581 0.571 Dover 27.2
71 Machinery, other than electric 0.651 0.633 Dover 22.0 0.557 0.612 Dover 21.1
72 Electrical machinery, apparatus and appliances 0.764 0.627 Heathrow 26.6 0.672 0.691 Heathrow 27.5
73 Transport equipment 0.652 0.640 London 19.4 0.620 0.553 Medway 14.4
81 Sanitary, plumbing, heating and lighting fixtures 0.708 0.645 Dover 22.9 0.608 0.603 Dover 35.2
82 Furniture 0.732 0.630 Dover 25.4 0.812 0.740 Dover 35.0
83 Travel goods, handbags and similar articles 0.752 0.678 Dover 26.7 0.777 0.834 Felixstowe 28.8
84 Clothing 0.710 0.644 Dover 39.4 0.780 0.762 Dover 27.0
85 Footwear, gaiters and the like 0.733 0.679 Dover 23.9 0.646 0.745 Dover 35.5
86 Professional, scientific and controlling instruments 0.777 0.720 Heathrow 32.8 0.753 0.740 Heathrow 33.2
89 Miscellaneous manufactured articles, N.E.S. 0.770 0.717 Heathrow 31.9 0.790 0.745 Heathrow 25.9
Aggregations: 00-86
aggregates 0.646 0.561 0.536 0.534
weighted means 0.721 0.663 0.705 0.668
unweighted means 0.091 0.090 0.143 0.127 Source: Authors own calculations using trade data described in Section 2.
Table 2 explores the concentration data for individual commodity groups. It gives C5 ratios
for 1970 and 1992 – showing for both exports and imports the declines in concentration - and
also, for 1992, the leading port and its share of trade in the commodity. The leading ports data
illustrate a number of interesting features. First, the dominance of Dover (top in 23 out of 54
commodities for exports and 19 for imports), followed by Felixstowe (12 and 8) and
Heathrow (7 and 6). Among manufactures, only five of the 54 entries is not one of these three,
and only one commodity (56 Fertilizers) lists any port outside the south east. Among
primaries (a broad group in the trade classifications including processed foods and materials)
a much wider spread set of ports is represented.
14
Second, whereas for manufacturers the same port is listed for exports and imports 15 out of
27 times, this is true for only 3 commodities in the primaries set. In some cases we suspect
that this reflects special needs – e.g. Heathrow for electrical and electronic equipment (72),
scientific instruments (86) and miscellaneous manufacturers (89) all with high value to weight
ratios; in others the cause is probably the general dominance of Dover in RO-RO trade and
Felixstowe in container traffic. Manufactures lend themselves to intra-industry trade – trade in
similar goods – and so the same port will do for both flows. For primaries, two factors may lie
behind the dissimilarity in ports: it is possible that exports and imports classified in the same
2-digit category are still very different and thus require different port facilities. Alternatively
the differences may reflect different comparative advantages in these sub-groups in different
regions of the UK – e.g. for, oil seeds etc (22), surpluses in eastern England and deficits in
western England.
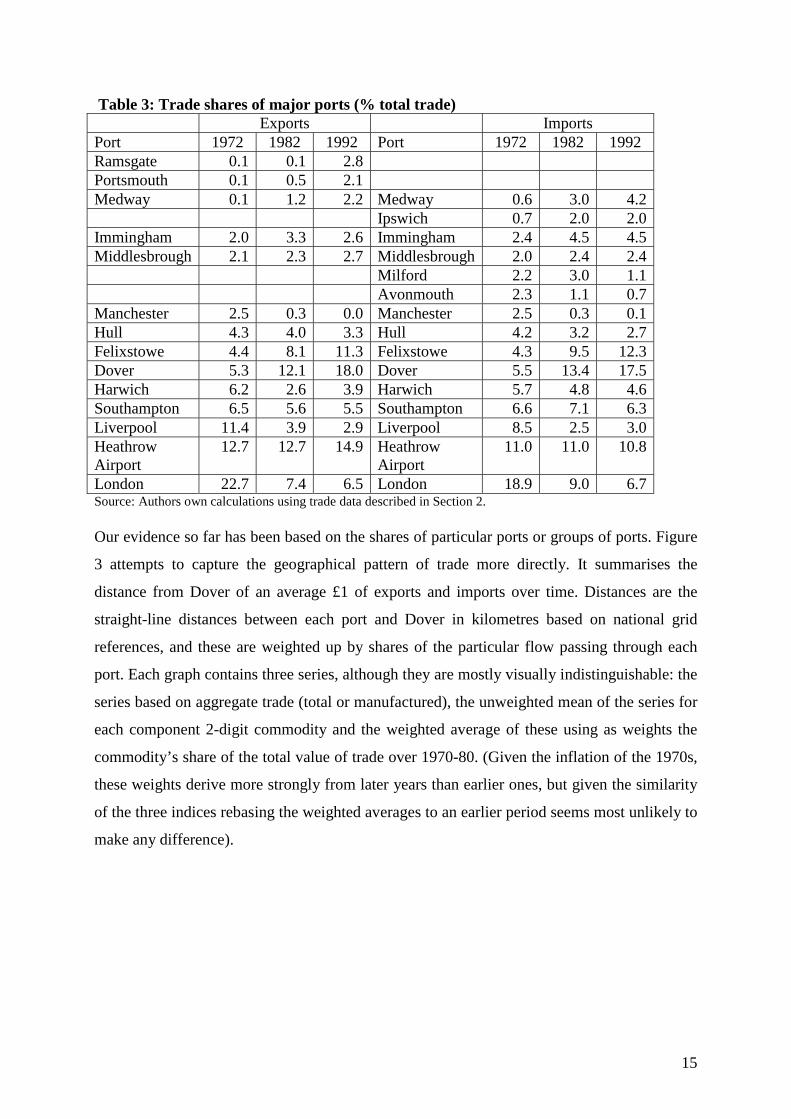
Focusing on port shares in overall trade instead of port rankings, the general re-orientation
towards the South East becomes more apparent. Table 3 presents port shares in total exports
and imports for all major ports in three years: 1972, 1982 and 1992.5 Ports are ranked by their
share in total exports in 1972. Several features stand out when we take Tables 1 and 3
together. First the rise of Dover as a major trading port and the corresponding decline of
Liverpool. Dover, saw its share in both imports and exports increase more than three-fold
over the twenty year period, while Liverpool saw a decline of similar magnitude.
Interestingly, the contrast between the relative performance of London and Felixstowe
suggests that port location alone is not sufficient to explain the changing geography of UK
trade. Felixstowe and London are both major specialist deep-sea ports, both located in the
south of England. But while Felixstowe saw its role rising, London saw a marked decline in
its role. As discussed further in Chisholm (1995) such contrasts suggest an important role for
additional factors other than location, such as port efficiency, in determining port outcomes.
Among those explaining the contrast between Felixstowe and London was that the former
was outside the National Dock Labour Scheme and the latter inside. This scheme was a highly
restrictive labour agreement which, until its abolition, reduced productivity and stifled
innovation in member ports.
5 Major ports are defined as having a share of 2% or over in total exports or imports in either 1972 or 1992.
15
Table 3: Trade shares of major ports (% total trade) Exports Imports Port 1972 1982 1992 Port 1972 1982 1992 Ramsgate 0.1 0.1 2.8 Portsmouth 0.1 0.5 2.1 Medway 0.1 1.2 2.2 Medway 0.6 3.0 4.2 Ipswich 0.7 2.0 2.0 Immingham 2.0 3.3 2.6 Immingham 2.4 4.5 4.5 Middlesbrough 2.1 2.3 2.7 Middlesbrough 2.0 2.4 2.4 Milford 2.2 3.0 1.1 Avonmouth 2.3 1.1 0.7 Manchester 2.5 0.3 0.0 Manchester 2.5 0.3 0.1 Hull 4.3 4.0 3.3 Hull 4.2 3.2 2.7 Felixstowe 4.4 8.1 11.3 Felixstowe 4.3 9.5 12.3 Dover 5.3 12.1 18.0 Dover 5.5 13.4 17.5 Harwich 6.2 2.6 3.9 Harwich 5.7 4.8 4.6 Southampton 6.5 5.6 5.5 Southampton 6.6 7.1 6.3 Liverpool 11.4 3.9 2.9 Liverpool 8.5 2.5 3.0 Heathrow Airport
12.7 12.7 14.9 Heathrow Airport
11.0 11.0 10.8
London 22.7 7.4 6.5 London 18.9 9.0 6.7 Source: Authors own calculations using trade data described in Section 2. Our evidence so far has been based on the shares of particular ports or groups of ports. Figure
3 attempts to capture the geographical pattern of trade more directly. It summarises the
distance from Dover of an average £1 of exports and imports over time. Distances are the
straight-line distances between each port and Dover in kilometres based on national grid
references, and these are weighted up by shares of the particular flow passing through each
port. Each graph contains three series, although they are mostly visually indistinguishable: the
series based on aggregate trade (total or manufactured), the unweighted mean of the series for
each component 2-digit commodity and the weighted average of these using as weights the
commodity’s share of the total value of trade over 1970-80. (Given the inflation of the 1970s,
these weights derive more strongly from later years than earlier ones, but given the similarity
of the three indices rebasing the weighted averages to an earlier period seems most unlikely to
make any difference).

16
Figure 3A: Distance from Dover, Total Imports
0
50
100
150
200
250
300
70 71 72 73 74 75 76 77 78 79 80 81 82 83 84 85 86 88 89 90 91 92
Km
aggregates wted means unwted means
Source: Authors own calculations using trade data described in Section 2.
Figure 3B: Distance from Dover, Manufactured Imports
0
50
100
150
200
250
70 71 72 73 74 75 76 77 78 79 80 81 82 83 84 85 86 88 89 90 91 92
Km
aggregates wted means unwted means
Source: Authors own calculations using trade data described in Section 2.

17
Figure 3C: Distance from Dover, Total Exports
0
50
100
150
200
250
300
350
70 71 72 73 74 75 76 77 78 79 80 81 82 84 85 86 88 89 90 91 92
Km
aggregates wted means unwted means
Source: Authors own calculations using trade data described in Section 2.
Figure 3D: Distance from Dover, Manufactured Exports
0
50
100
150
200
250
70 71 72 73 74 75 76 77 78 79 80 81 82 84 85 86 88 89 90 91 92
Km
aggregates wted means unwted means
Source: Authors own calculations using trade data described in Section 2. Figure 3 eloquently captures the gravitation of UK trade towards the ports of the South East,
especially in manufactures, where the mean distance from Dover falls by around 35% for
exports and 25% for imports. The only obvious surprise in figure 3C is the sudden increase in
distance for total exports over 1979-86. As for our earlier results on port group shares this is
due solely to exports of oil.
18
We now repeat the ‘distance from Dover’ analysis using individual commodity data instead of
aggregated trade data. Table 4 reports the distance from Dover for each commodity for both
imports and exports. The table reports results for 1972, 1982 and 1992 and for the percentage
change between 1972 and 1992. The mean distance for each commodity is calculated exactly
as above for overall trade. The bottom three rows give the distance from Dover for aggregated
trade, and also report weighted and unweighted commodity means (as plotted in Figures 3A
to 3D above).
Several features are worth noting. First, as we might expect from table 2, manufacturers
(SITC(R) categories 51-89) are typically ‘closer to Dover’ than non-manufacturers: the
differences are statistically significantly at 5% and remain so, except for exports in 1972, even
if we exclude the fuels data (SITC(R) 3) which are rather special. Second, the distances from
Dover are positively correlated both through time for each flow (imports and exports) and for
each year between flows: the correlation co-efficients exceed 0.55 in all cases except where
imports in 1972 are involved for which they are somewhat lower. Third, a clear majority of
commodities, 43 out of 54, see a re-orientation towards Dover for both imports and exports.
Table 4 reports the ten commodities that show the largest re-orientation towards Dover. The
commodities showing these largest re-orientations are somewhat mixed. For exports, we find
three chemicals industries, three ‘animal’ industries and two textiles industries in the top 10.
For imports, we find four textile industries, but no particular pattern with regard to the
remaining six industries.

19
Table 3: Distance from Dover by Commodity Exports Imports
1972 1982 1992 % change 1972-92
1972
1982 1992 % change 1972-92
00 Live animals (excluding zoo animals, dogs, cats) 208 154 112 -46.4 437 376 318 -27.2 01 Meat and meat preparations 100 65 65 -35.4 209 188 158 -24.0 02 Dairy products and birds' eggs 247 256 198 -20.0 257 233 171 -33.4 03 Fish (not British taking) and fish prep 337 232 156 -53.7 238 217 222 -6.5 04 Cereals and cereal preparations 224 250 190 -15.1 322 251 188 -41.7 05 Fruit and vegetables 245 227 182 -25.6 182 152 122 -33.3 06 Sugar, sugar preparations & honey 220 219 158 -28.0 290 210 192 -33.8 07 Coffee, tea, cocoa and spices 201 188 172 -14.3 252 221 156 -38.2 08 Feeding stuff for animals 263 205 157 -40.4 292 318 272 -7.1 09 Miscellaneous food preparations 215 198 170 -21.0 214 175 154 -28.0 11 Beverages 435 334 267 -38.6 138 140 156 12.4 12 Tobacco and tobacco manufactures 151 173 204 35.1 320 230 158 -50.5 21 Hides, skins and furskins, undressed 125 101 126 1.2 157 122 166 5.9 22 Oil seeds oil nuts oil kernels 196 219 346 76.0 290 247 222 -23.5 23 Crude rubber (including synthetic & reclaimed) 263 198 155 -41.0 263 198 159 -39.4 24 Wood, lumber and cork 209 516 197 -5.9 267 262 274 2.5 25 Pulp and waste paper 144 129 158 9.2 285 253 323 13.4 26 Textile fibres not manufactured & their waste 268 159 109 -59.4 320 206 155 -51.6 27 Crude fertilisers and minerals 367 346 317 -13.5 331 310 300 -9.3 28 Metalliferous ores and metal scrap 227 209 216 -4.8 307 241 235 -23.5 29 Crude animal/vegetable materials N.E.S. 176 170 129 -27.2 195 149 123 -36.9 32 Coal, coke and briquettes 364 366 380 4.3 284 361 317 11.7 33.52 Petroleum and petroleum products 282 758 718 154.7 313 320 321 2.6 34 Gas, natural and manufactured 376 599 597 58.7 145 692 625 331.2 41 Animal oils and fats 313 229 187 -40.1 321 290 207 -35.5 42 Fixed vegetable oils and fats 235 244 178 -24.4 313 266 247 -20.8 43 Animal and vegetable oils fats and waxes 274 247 288 5.2 352 225 237 -32.8 51 Chemical elements and compounds 272 253 186 -31.5 241 216 195 -19.1 53 Dyeing, tanning and colouring materials 238 169 142 -40.2 201 128 132 -34.0 54 Medicinal and pharmaceutical products 182 159 124 -32.1 156 104 118 -24.6 55 Essential oils and perfume materials 187 177 140 -24.9 140 140 125 -10.8 56 Fertilisers, manufactured 304 345 264 -13.1 335 293 316 -5.9 57 Explosives and pyrotechnic products 347 249 115 -66.8 317 177 126 -60.3 58 Plastic materials 249 192 143 -42.6 190 149 142 -25.5 59 Chemical materials and products, N.E.S. 250 205 145 -42.0 226 175 154 -32.0 61 Leather, leather manufactures, N.E.S. 171 129 114 -33.2 257 124 94 -63.5 62 Rubber manufactures, N.E.S. 231 187 148 -36.2 188 168 133 -29.5 63 Cork and wood manufactures (excluding furniture) 166 177 194 17.3 225 182 190 -15.4 64 Paper, paperbound, and manufactures thereof 211 181 150 -28.9 213 184 175 -17.9 65 Textile yarn, fabrics, made-up articles 246 170 121 -50.7 217 143 107 -50.7 66 Non- metallic mineral manufactures, N.E.S. 150 154 140 -6.6 127 137 126 -1.5 67 Iron and steel 352 280 239 -32.1 285 249 223 -21.8 68 Non-ferrous metals 190 142 134 -29.4 268 176 176 -34.4 69 Manufactures of metal, N.E.S. 248 183 169 -31.6 208 154 140 -32.6 71 Machinery, other than electric 228 170 138 -39.7 207 155 177 -14.4 72 Electrical machinery, apparatus and appliances 196 160 154 -21.8 177 155 156 -12.1 73 Transport equipment 211 176 158 -25.1 149 169 147 -1.5 81 Sanitary, plumbing, heating and lighting fixtures 230 173 137 -40.3 177 129 109 -38.6 82 Furniture 167 144 108 -35.5 122 110 93 -23.5 83 Travel goods, handbags and similar articles 192 155 124 -35.8 168 126 118 -29.7 84 Clothing 199 162 137 -31.3 188 146 118 -37.2 85 Footwear, gaiters and the like 193 203 126 -34.5 151 98 104 -31.0 86 Professional, scientific and controlling instruments 163 136 133 -18.2 161 145 147 -8.4 89 Miscellaneous manufactured articles, N.E.S. 175 137 117 -33.0 149 139 127 -15.1 Aggregations: aggregates 224 298 186 -17.2 229 200 169 -26.0 weighted means 226 222 194 -14.5 226 201 190 -9.4 unweighted means 232 222 187 -19.7 238 208 189 -25.7
20
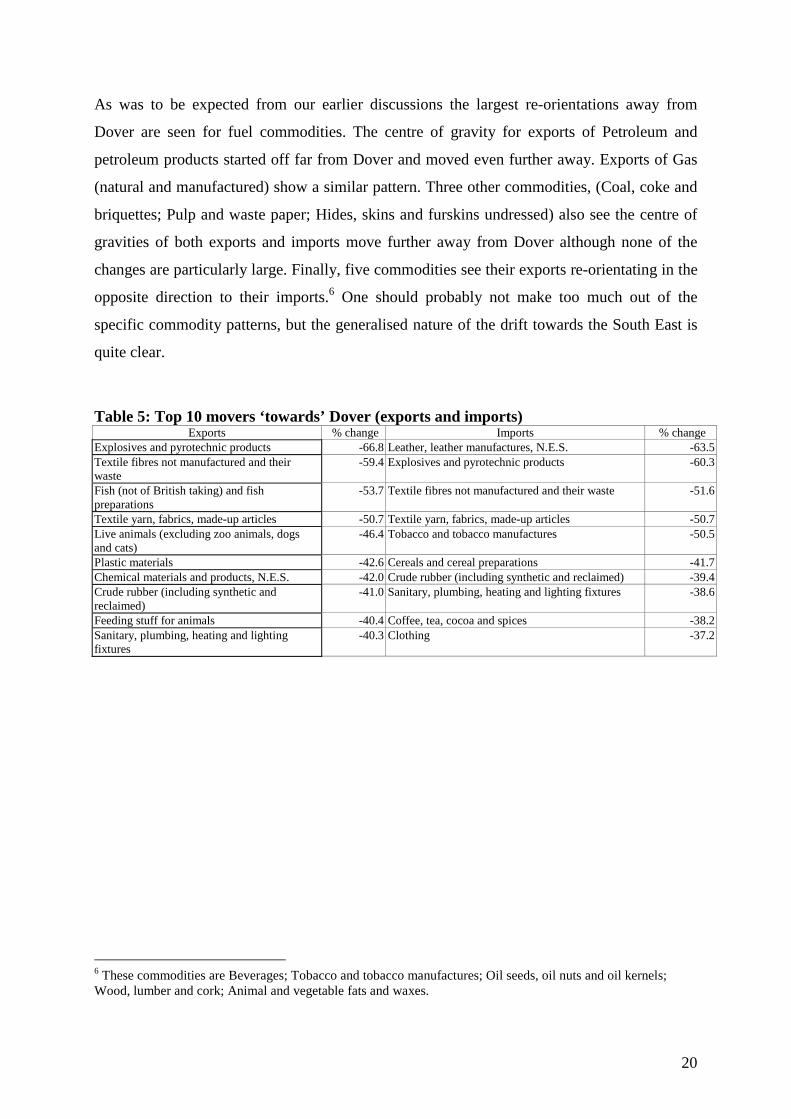
As was to be expected from our earlier discussions the largest re-orientations away from
Dover are seen for fuel commodities. The centre of gravity for exports of Petroleum and
petroleum products started off far from Dover and moved even further away. Exports of Gas
(natural and manufactured) show a similar pattern. Three other commodities, (Coal, coke and
briquettes; Pulp and waste paper; Hides, skins and furskins undressed) also see the centre of
gravities of both exports and imports move further away from Dover although none of the
changes are particularly large. Finally, five commodities see their exports re-orientating in the
opposite direction to their imports.6 One should probably not make too much out of the
specific commodity patterns, but the generalised nature of the drift towards the South East is
quite clear.
Table 5: Top 10 movers ‘towards’ Dover (exports and imports)
Exports % change Imports % change Explosives and pyrotechnic products -66.8 Leather, leather manufactures, N.E.S. -63.5 Textile fibres not manufactured and their waste
-59.4 Explosives and pyrotechnic products -60.3
Fish (not of British taking) and fish preparations
-53.7 Textile fibres not manufactured and their waste -51.6
Textile yarn, fabrics, made-up articles -50.7 Textile yarn, fabrics, made-up articles -50.7 Live animals (excluding zoo animals, dogs and cats)
-46.4 Tobacco and tobacco manufactures -50.5
Plastic materials -42.6 Cereals and cereal preparations -41.7 Chemical materials and products, N.E.S. -42.0 Crude rubber (including synthetic and reclaimed) -39.4 Crude rubber (including synthetic and reclaimed)
-41.0 Sanitary, plumbing, heating and lighting fixtures -38.6
Feeding stuff for animals -40.4 Coffee, tea, cocoa and spices -38.2 Sanitary, plumbing, heating and lighting fixtures
-40.3 Clothing -37.2
6 These commodities are Beverages; Tobacco and tobacco manufactures; Oil seeds, oil nuts and oil kernels; Wood, lumber and cork; Animal and vegetable fats and waxes.

21
4. Conclusions
This paper has described a new dataset of British international trade by port of entry or exit
and commodity. It offers more detail in both dimensions than has been seen before, although
at the expense of losing the data on the country partners involved. In our preliminary results,
we have quantified and confirmed a number of tendencies that have been of interest to
geographers and economists:
the increasing share of air transport in UK trade
the declining port concentration of UK trade
the dominance of Dover, Felixstowe and Heathrow Airport in manufacturers trade, and
the general gradual drift towards trading more through the ports on the South East of
Britain.
The last is our particular focus of interest, being related, we hypothesise to UK accession to
the European Economic Community in 1973. In Overman and Winters (2003) we start to
explore the implications of this re-orientation for the location of British industry. In the
evidence that we present in this paper, we see the re-orientation clearly in terms of both the
main ports used for different commodity trades and the centres of gravity of different trade
flows over the period 1970 to 1992.
22
References Baldwin, R., Forslid, R., Martin, P, Ottaviano, G.M, and F. Robert-Nicoud (2003): Economic Geography and Public Policy, Princeton University Press. Begg, D., O. Blanchard, D. Coyle, J. Frankel, F. Giavazzi, R. Portes, P Seabright, A. Venables, L. A. Winters and C. Wyplosz(2003): The Consequences of Saying No: An Independent Report into the Economic Consequences of the UK Saying No to the Euro, Britain in Europe, London. Bröcker, J. and K. Peschel (1988): “Trade” in W. Molle and R. Cappelin (eds.) Regional Impact of Community Policies in Europe, Avebury, Aldershot. Central Statistical Office (1971): Standard Industrial Classification, National and International, CSO, London Chisholm (1992): “Britain, the European Community, and the centralisation of production: Theory and evidence, freight movements”, Environment and Planning A, 24(4) 551-570. Chisholm, M. (1995): Britain on the Edge of Europe, Routledge, London. Department of Industry (1980): Input-Output Tables for the United Kingdom, Business Monitor, PA 1004, HMSO, London Fujita, M., Krugman, P. and Venables, A (1999): The Spatial Economy, MIT Press, Cambridge, Mass. Fujita, M. and Thisse, J. (2002): Economics of Agglomeration: Cities, Industrial Location and Regional Growth, Cambridge University Press, Cambridge. Harris, C. (1954): “The market as a factor on the localization of industry in the United States”. Annals of the Association of the American Geographers, 64, 315-48. Hirschman, A. O. (1958): The Strategy of Development, Yale University Press, New Haven. Hoare, G (1977): “The geography of British exports”, Environment and Planning A, 9, 121-136. Hoare, G (1985): “Great Britain and her exports: an exploratory regional analysis”, Tijdschrift voor Economische en Sociale Geografie, LXXVI , 9-21. Hoare, G (1986): “British ports and their export hinterlands: a rapidly changing geography”, Geografiska Analler B, 68, 29-40. Hoare, G (1988): “Geographical aspects of British overseas trade: a framework and a review”, Environment and Planning A, 20, 1345-1364.
23
Limao, N. & Venables, A. J. (2001): “Infrastructure, geographical disadvantage, transport costs and trade”, World Bank Economic Review, 15, 451-479. Molinari, A. and L. A. Winters (2003): “UK international trade by port and commodity”, processed University of Sussex. Moneta, C. (1959): “The estimation of transport costs in international trade” Journal of Political Economy, 67, 41-58. Myrdal, G. (1957): Economic Theory and Underdeveloped Regions, Duckworth, London. Neary, J. P. (2001): “Of hype and hyperbolas: Introducing the New Economic Geography”, Journal of Economic Literature, 39(2), 536-561. Overman, H. G. and L. A. Winters (2003): “Trade shocks and industrial location: The impact of EEC accession on the UK”, Centre for Economic Performance Discussion Paper #588. Winters, L. A. (1984): “British imports of manufactures and the Common Market”, Oxford Economic Papers, 36(1), 103-118.
24
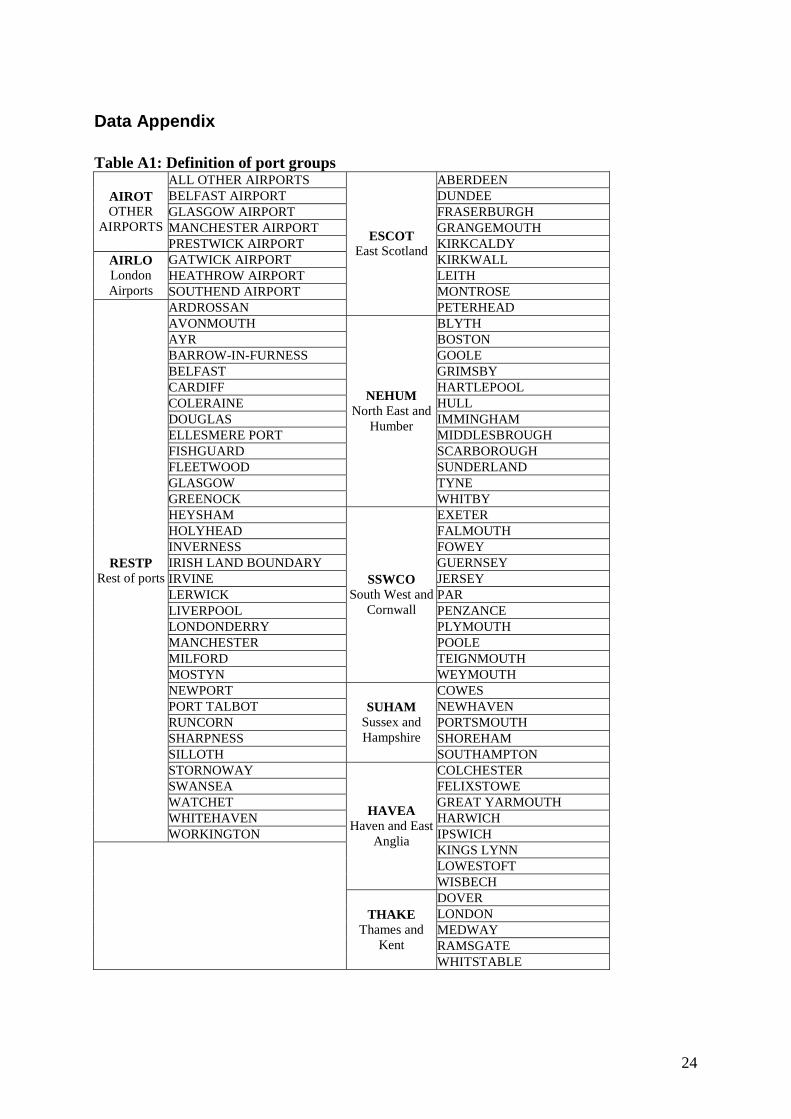
Data Appendix Table A1: Definition of port groups
ALL OTHER AIRPORTS ABERDEEN BELFAST AIRPORT DUNDEE GLASGOW AIRPORT FRASERBURGH MANCHESTER AIRPORT GRANGEMOUTH
AIROT OTHER
AIRPORTS PRESTWICK AIRPORT KIRKCALDY GATWICK AIRPORT KIRKWALL HEATHROW AIRPORT LEITH
AIRLO London Airports SOUTHEND AIRPORT MONTROSE
ARDROSSAN
ESCOT East Scotland
PETERHEAD AVONMOUTH BLYTH AYR BOSTON BARROW-IN-FURNESS GOOLE BELFAST GRIMSBY CARDIFF HARTLEPOOL COLERAINE HULL DOUGLAS IMMINGHAM ELLESMERE PORT MIDDLESBROUGH FISHGUARD SCARBOROUGH FLEETWOOD SUNDERLAND GLASGOW TYNE GREENOCK
NEHUM North East and
Humber
WHITBY HEYSHAM EXETER HOLYHEAD FALMOUTH INVERNESS FOWEY IRISH LAND BOUNDARY GUERNSEY IRVINE JERSEY LERWICK PAR LIVERPOOL PENZANCE LONDONDERRY PLYMOUTH MANCHESTER POOLE MILFORD TEIGNMOUTH MOSTYN
SSWCO South West and
Cornwall
WEYMOUTH NEWPORT COWES PORT TALBOT NEWHAVEN RUNCORN PORTSMOUTH SHARPNESS SHOREHAM SILLOTH
SUHAM Sussex and Hampshire
SOUTHAMPTON STORNOWAY COLCHESTER SWANSEA FELIXSTOWE WATCHET GREAT YARMOUTH WHITEHAVEN HARWICH
RESTP Rest of ports
WORKINGTON IPSWICH KINGS LYNN LOWESTOFT
HAVEA Haven and East
Anglia
WISBECH DOVER LONDON MEDWAY RAMSGATE
THAKE
Thames and Kent
WHITSTABLE
CENTRE FOR ECONOMIC PERFORMANCE Recent Discussion Papers
605 Stephen Machin
Stephen Wood Looking for HRM/Union Substitution: Evidence from British Workplaces
604 Maarten Goos Alan Manning
Lousy and Lovely Jobs: the Rising Polarization of Work in Britain
603 Nan-Kuang Chen Hsiao-Lei Chu
Collateral Value and Forbearance Lending
602 Ricardo Peccei Helen Bewley Howard Gospel Paul Willman
Is it Good To Talk? Information Disclosure and Organisational Performance in the UK Incorporating evidence submitted on the DTI discussion paper ‘High Performance Workplaces – Informing and Consulting Employees’
601 Andy Charlwood The Anatomy of Union Decline in Britain 1990-1998
600 Christopher A. Pissarides Unemployment in Britain: A European Success Story
599 Stephen Bond Dietmar Harhoff John Van Reenen
Corporate R&D and Productivity in Germany and the United Kingdom
598 Michael Storper Anthony J. Venables
Buzz: Face-to-Face Contact and the Urban Economy
597 Stephen Gibbons Alan Manning
The Incidence of UK Housing Benefit: Evidence from the 1990s Reforms
596 Paul Gregg Maria Gutiérrez-Domènech Jane Waldfogel
The Employment of Married Mothers in Great Britain: 1974-2000
595 Stephen Bond Dietmar Harhoff John Van Reenen
Investment, R&D and Financial Constraints in Britain and Germany
594 Andrew B. Bernard Stephen Redding Peter K. Schott
Product Choice and Product Switching
593 Anthony J. Venables Spatial Disparities in Developing Countries: Cities, Regions and International Trade
592 Sylvie Charlot Gilles Duranton
Communication Externalities in Cities
591 Paul Willman Alex Bryson Rafael Gomez
Why Do Voice Regimes Differ?
590 Marco Manacorda Child Labor and the Labor Supply of Other Household Members: Evidence from 1920 America
589 Alex Bryson Rafael Gomez
Why Have Workers Stopped Joining Unions?
588 Henry G. Overman L. Alan Winters
Trade Shocks and Industrial Location: the Impact of EEC Accession on the UK
587 Pierre-Philippe Combes Henry G. Overman
The Spatial Distribution of Economic Activities in the European Union
586 Henry G. Overman Can We Learn Anything from Economic Geography Proper?
585 A. B. Bernard J. Bradford Jensen P. K. Schott
Falling Trade Costs, Heterogeneous Firms and Industry Dynamics
584 A. B. Bernard J. Bradford Jensen P. K. Schott
Survival of the Best Fit: Exposure to Low-Wage Countries and the (Uneven) Growth of U.S. Manufacturing Plants
583 S. Wood S. Moore
Reviewing the Statutory Union Recognition (ERA 1999)
582 T. Kirchmaier Corporate Restructuring and Firm Performance of British and German Non-Financial Firms
581 C. Dougherty Why Is the Rate of Return to Schooling Higher for Women than for Men?
To order a discussion paper, please contact the Publications Unit
Tel 020 7955 7673 Fax 020 7955 7595 Email [email protected] Web site http://cep.lse.ac.uk