Embed Size (px)
Citation preview

To appear in Enceladus and the Icy Moons of Saturn (P. M. Schenk et al., eds.). University of
Arizona Press, Tucson, AZ.
1
The Geochemistry of Enceladus: Composition and Controls
C. R. Glein
Southwest Research Institute
F. Postberg
University of Heidelberg
S. D. Vance
NASA Jet Propulsion Laboratory/California Institute of Technology ___________________________________________________________________________
Enceladus is the first world beyond Earth for which we have clear observational data concerning the
composition of an extant ocean. The abundances of chemical species in the plume of Enceladus, which is
sourced by the ocean, provide valuable constraints on the temperature, major ion composition, pH, and
reduction-oxidation (redox) chemistry of its ocean. The pressure profile is determined by the internal structure
of the moon, which also constrains temperatures in Enceladus’ rocky core. The data indicate that the ocean is a
relatively alkaline and reduced solution of dissolved sodium, chloride, and bicarbonate/carbonate ions just
below the freezing point of pure water. Observations of silica nanoparticles and molecular hydrogen from
Enceladus can be explained in terms of hydrothermal sources. We present a model in which the dissolution of
quartz in hot water yields high concentrations of silica, and reduced rocks tidally heated in the presence of water
supply abundant hydrogen. Future studies should seek to address many of the geochemical questions raised by
the Cassini era of Enceladus exploration.
1. ENCELADUS AS A GATEWAY TO
EXTRATERRESTRIAL OCEANOGRAPHY
Numerous lines of evidence made possible by the Cassini-Huygens mission (Porco et
al., 2006; 2014; Spencer et al., 2006; Collins and Goodman, 2007; Nimmo et al., 2007;
Zolotov, 2007; Glein et al., 2008; Schmidt et al., 2008; Tobie et al., 2008; Postberg et al.,
2009; 2011; Waite et al., 2009; 2017; Glein and Shock, 2010; Ingersoll and Pankine, 2010;
Patthoff and Kattenhorn, 2011; Běhounková et al., 2012; Matson et al., 2012; Iess et al.,
2014; Bouquet et al., 2015; Hsu et al., 2015; McKinnon, 2015; Travis and Schubert, 2015;
Beuthe et al., 2016; Čadek et al., 2016; Ingersoll and Nakajima, 2016; Kite and Rubin, 2016;
Nakajima and Ingersoll, 2016; Thomas et al., 2016; Choblet et al., 2017; see chapters by
Hemingway et al. and Spencer et al. in this volume) support the paradigm that Saturn’s moon,
Enceladus, has a global subsurface ocean of liquid water, which erupts into space forming a
south polar plume of gases and ice grains. From a geochemical perspective, what is most
remarkable about Enceladus is that its plume provides access to the chemical composition of
its ocean. The ease of obtaining constraints on the geochemistry of the subsurface of
Enceladus is unprecedented in the field of planetary science, where detailed information on
composition usually necessitates landers.
Why might one be interested in the geochemistry of Enceladus? First, it is of broad
interest because the composition of the environment imposes boundary conditions on the
possible origin, evolution, and persistence of life (McKay et al., 2008). Second, the
accessibility of its ocean enables Enceladus to serve as a model for the geochemistry of
oceans inside other icy worlds, such as Ganymede (Vance et al., 2014), Callisto, Mimas,
Dione, Titan (Glein, 2015), Triton (Shock and McKinnon, 1993), and Pluto (Neveu et al.,
2015). Third, knowledge of the geochemistry of Enceladus allows us to frame the subject of
aqueous geochemistry in a more universal context. This will help us to better understand the
processes that led to similarities and differences in the observed compositions of water-
bearing bodies across the solar system, including Earth (Lowenstein et al., 2014; German and
To appear in Enceladus and the Icy Moons of Saturn (P. M. Schenk et al., eds.). University of
Arizona Press, Tucson, AZ.
2
Seyfried, 2014), Mars (Ehlmann et al., 2013; Niles et al., 2013), carbonaceous chondrite
parent bodies (Brearley, 2006), Ceres (Zolotov, 2017), and Europa (Vance et al., 2016).
Fourth, this is new science; the thrill of exploration motivates the burgeoning field of
extraterrestrial chemical oceanography.
In this chapter, we examine key aspects of the geochemistry of Enceladus. The
chapter contains a mixture of review material and more refined interpretations. We begin
with an overview of the relevant observational data (see section 2). Then, we organize our
discussion of Enceladean geochemistry into two parts: marine geochemistry (see section 3)
and hydrothermal geochemistry (see section 4). Fig. 1 shows the locations of these types of
geochemistry with respect to the vertical structure of Enceladus. In reality, the boundaries
may not be sharp. Our goals in these discussions are (1) to introduce some of the basic
concepts of geochemistry that are useful for interpreting chemical data from Enceladus, and
(2) to present initial models for the compositions of the ocean and suspected hydrothermal
fluids. We conclude this chapter with a set of critical questions to take us from Cassini to the
next era of exploration (see section 5).
Fig. 1. The two general categories of geochemical processes shown in a schematic cross
section of Enceladus.
2. CONSTRAINTS FROM PLUME COMPOSITION
Because the plume of Enceladus is sourced from a liquid water ocean (see section 1),
the plume’s composition can provide insights into the geochemistry of Enceladus’ ocean and
deeper hydrothermal fluids. The Cosmic Dust Analyzer (CDA) and the Ion and Neutral Mass
Spectrometer (INMS) were the primary instruments onboard the Cassini spacecraft that
measured the composition of the plume (see the chapter by Postberg et al. in this volume). In
situ measurements were performed when the spacecraft flew through the plume, or sampled
Saturn’s E ring which is maintained by the delivery of plume materials (Haff et al., 1983; see
the chapter by Kempf et al. in this volume).
The CDA instrument discovered that the plume contains three compositionally
distinct populations of ice grains (Postberg et al., 2008). One type (called type III) is rich in
salts (Postberg et al., 2009; 2011). The largest mass line in CDA spectra of these grains is
from Na+; and smaller mass lines from K
+, and sodium clusters with OH
−, Cl
−, and/or CO3
−2
have been reported (Postberg et al., 2009). The salt-rich ice grains are thought to form by
flash freezing of ocean water. The large abundance of Na in these grains is indicative of
extensive water-rock interaction (Zolotov, 2007), consistent with the presence of a rocky core
To appear in Enceladus and the Icy Moons of Saturn (P. M. Schenk et al., eds.). University of
Arizona Press, Tucson, AZ.
3
with a low density (Iess et al., 2014; McKinnon, 2015; see the chapter by Hemingway et al. in
this volume), resulting from silicate hydration.
Postberg et al. (2009) used a laser to generate gaseous ions from solutions containing
NaCl and NaHCO3 or Na2CO3. Laser ionization in the laboratory was meant to serve as a
proxy for impact ionization in the CDA instrument. It was found that CDA spectra of salt-
rich ice grains can be reproduced from solutions containing 0.05-0.2 mol NaCl per kg H2O
and 2-5 times more chloride than bicarbonate or carbonate (throughout this chapter, molality
(mol/kg H2O) is the preferred unit for the concentrations of aqueous species). There is
currently ambiguity as to whether HCO3− or CO3
−2 is predominant in the ocean source of the
plume, because solutions containing either of these species are able to reproduce a mass peak
attributed to (Na2CO3)Na+ (Postberg et al., 2009). The salt composition derived by Postberg
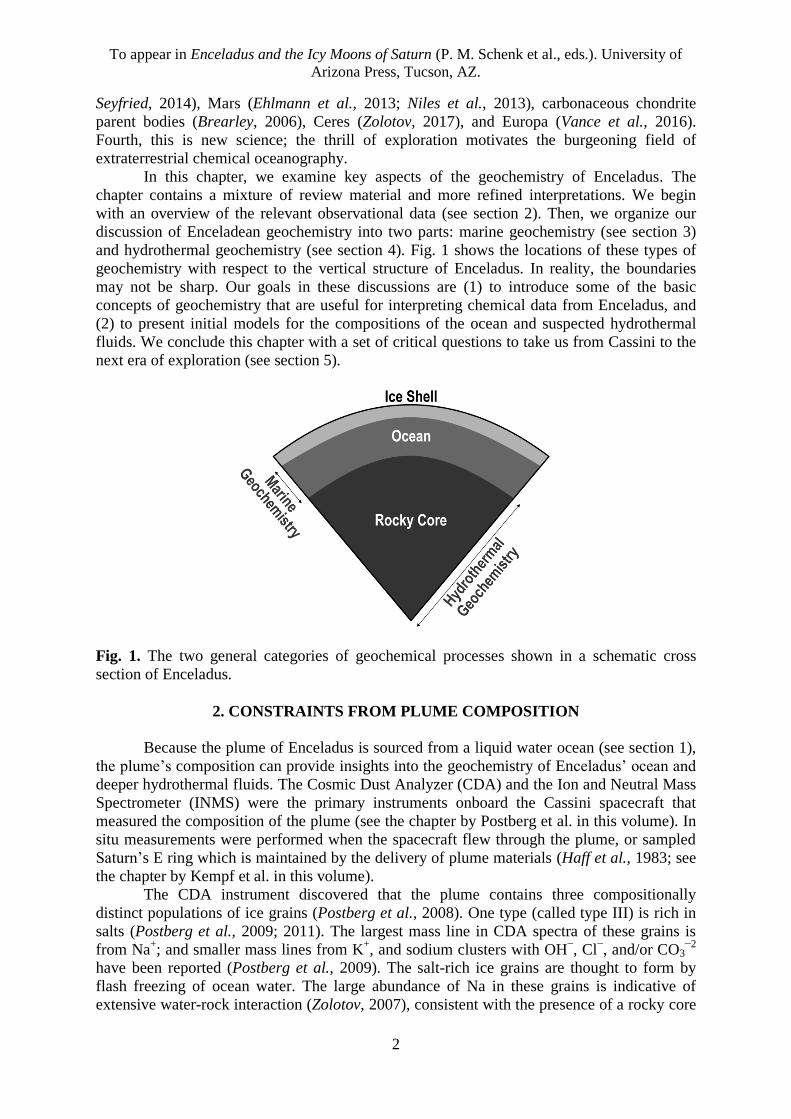
et al. (2009) is summarized in Table 1.
TABLE 1. Major composition of salt-rich ice grains in Enceladus’ plume *.
Constituent Concentration (mol/kg H2O)
NaCl 0.05-0.2
NaHCO3 + Na2CO3 0.01-0.1
KCl (0.5-2)×10-3
* Data from Postberg et al. (2009; 2011).
The CDA instrument detected silicon-rich, nanometer-scale particles escaping from
the Saturnian system, during the approach of the spacecraft to Saturn (Kempf et al., 2005).
These particles are thought to originate as inclusions in E ring ice grains, and to be released
from the grains by plasma sputtering erosion (Hsu et al., 2011). Therefore, their source is
inferred to be the plume of Enceladus. The Si-rich stream particles are poor in metal cations,
which implies that they are composed of nearly pure silica (SiO2). It is difficult to determine
the concentration of silica in ocean-derived ice grains, as silica was not measured in the
plume or E ring. The current best estimate is an SiO2 concentration of ~150-3900 ppm by
mass, based on the dynamical modeling of Hsu et al. (2015).
INMS made measurements of gas molecules in the plume, using both closed and open
source modes of operation. The former mode provides greater sensitivity, but some species
undergo chemical reactions inside the instrument before they are able to reach the detector. In
open source mode, collisions and thus chemical reactions of plume materials are minimized.
The initial set of closed source data revealed that the most abundant plume constituent is
water vapor (Waite et al., 2006), consistent with observations by the Ultraviolet Imaging
Spectrograph (UVIS; Hansen et al., 2006). Subsequent INMS measurements showed that the
detected composition depends on the flyby velocity, indicative of reactions of certain plume
materials (e.g., organic compounds) induced by high-energy impacts of ice grains on the
walls of the instrument (Waite et al., 2009).
The final set of measurements, made in open source mode, provide the most reliable
discrimination between the true composition vs. the impact-modified composition (Waite et
al., 2017). These data indicate the presence of H2O, H2, and CO2. The identification of CO2 in
the plume gas is further supported by observations of CO2 in the tiger stripes region on the
surface of Enceladus by the Visible and Infrared Mapping Spectrometer (VIMS; Brown et al.,
2006). No mass 28 species were detected in open source mode, consistent with the lack of
detection of CO (Hansen et al., 2008) and N2 (Hansen et al., 2011) by UVIS. However, a
mass 28 species was detected using the closed source (Waite et al., 2006; 2009).
To appear in Enceladus and the Icy Moons of Saturn (P. M. Schenk et al., eds.). University of
Arizona Press, Tucson, AZ.
4
The discrepancy between the open and closed source data with regards to the
detection of mass 28 (Waite et al., 2017) implies that a closed source detection may be
considered tentative if an open source measurement was not made. Two major species fall
into this category: NH3 and CH4. Observations of NH3 on Enceladus’ surface are presently
equivocal (Brown et al., 2006; Hendrix et al., 2010), but the discovery of N+ in Saturn’s inner
magnetosphere by the Cassini Plasma Spectrometer (CAPS) suggests that plume NH3 may be
the parent species (Smith et al., 2008; see the chapter by Postberg et al. in this volume). This
supports the identification of NH3 in the plume. For CH4, we are not aware of any additional
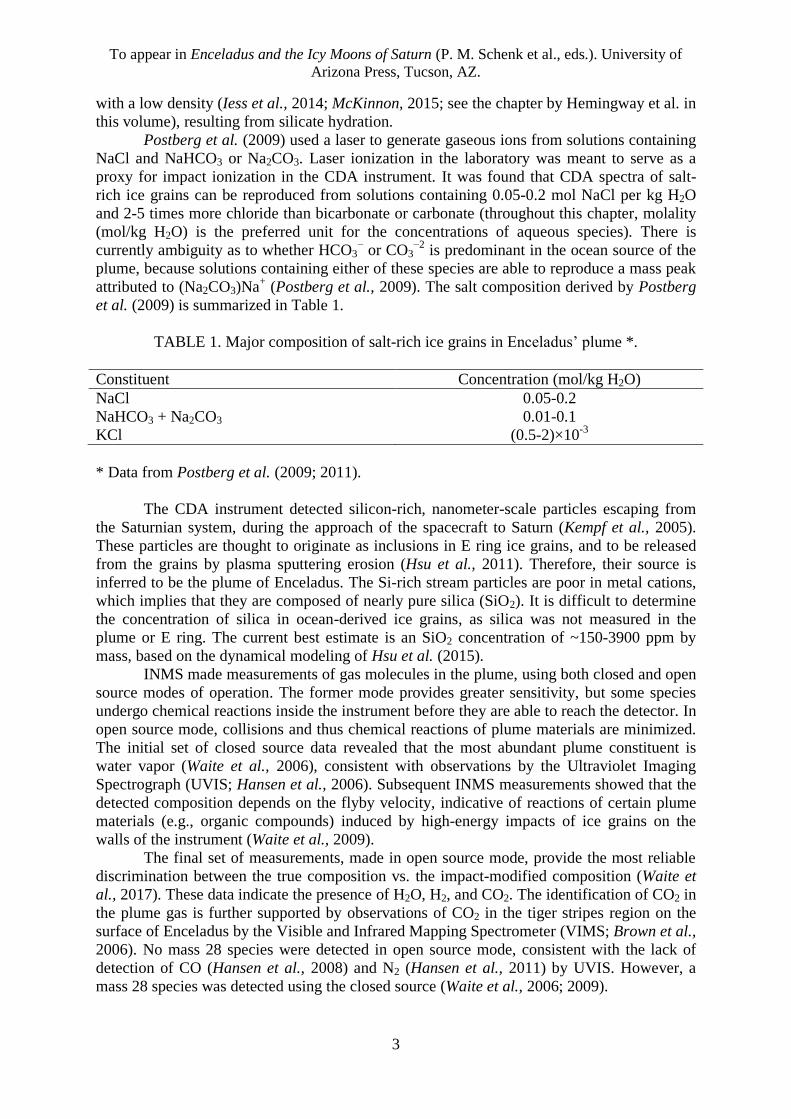
observational evidence for its presence at Enceladus. The gas composition derived by Waite
et al. (2017) is summarized in Table 2.
TABLE 2. Major composition of gases in Enceladus’ plume *.
Constituent Molar Percentage
H2O 96-99
H2 0.4-1.4
CO2 0.3-0.8
NH3 0.4-1.3
CH4 0.1-0.3
* Data from Waite et al. (2017).
3. MARINE GEOCHEMISTRY
3.1. Pressure and temperature in the ocean
Pressures in the ocean of Enceladus can be estimated from models of the internal
structure of the satellite. These models are constrained by Cassini measurements of gravity,
topography, and libration (Iess et al., 2014; Thomas et al., 2016; see the chapter by
Hemingway et al. in this volume). Here, we consider the model of McKinnon (2015), which
has a rocky core of density 2450 kg/m3 and radius 190 km. We do not distinguish between
the slightly different densities of water ice (~920 kg/m3) and ocean water (~1030 kg/m
3), but
instead adopt a uniform density of ρh = 1000 kg/m3 for the whole hydrosphere overlying the
rocky core. For such a two-layer model in which the interior can be approximated as being in
a state of hydrostatic equilibrium, the pressure (P) at radius r between the core radius (Rc) and
the mean surface radius (RE = 252 km) can be computed analytically using (Turcotte and
Schubert, 2002)
3 1 1 2 2 24 2
3 3h c c h E h EP GR r R G R r , (1)
where G refers to the gravitational constant (6.674×10⁻¹¹
m3 kg
-1 s
-2), Rc the radius of the core
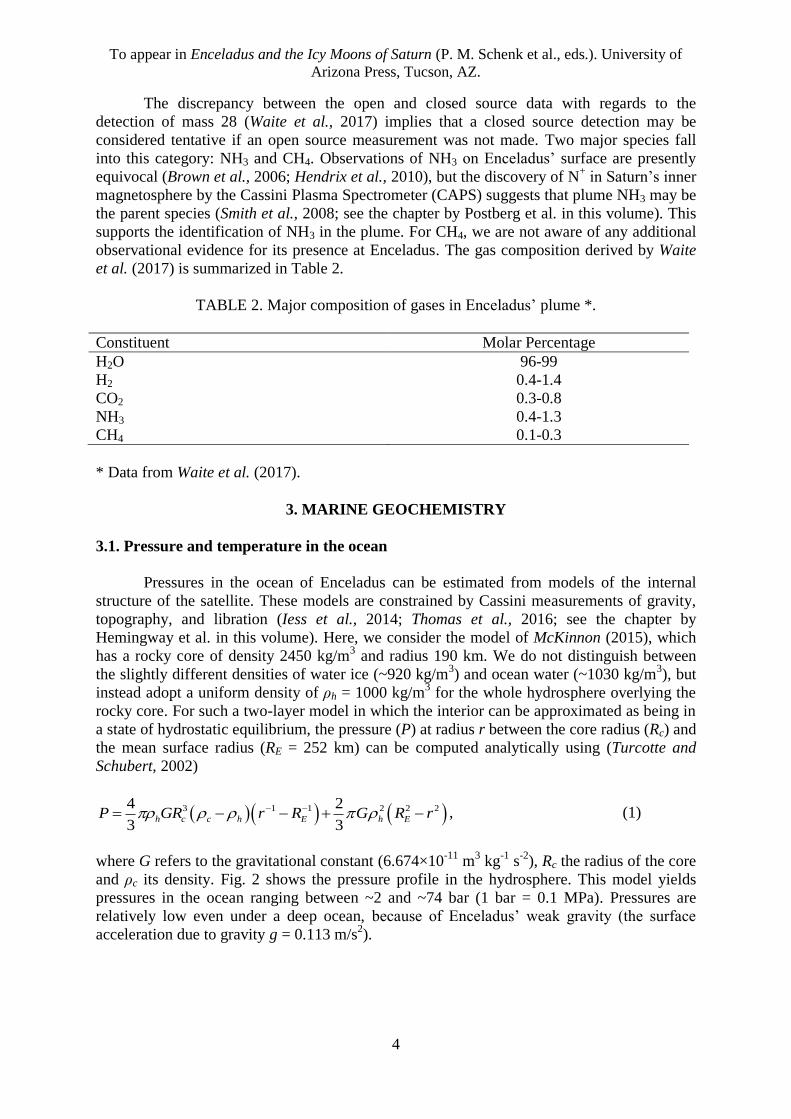
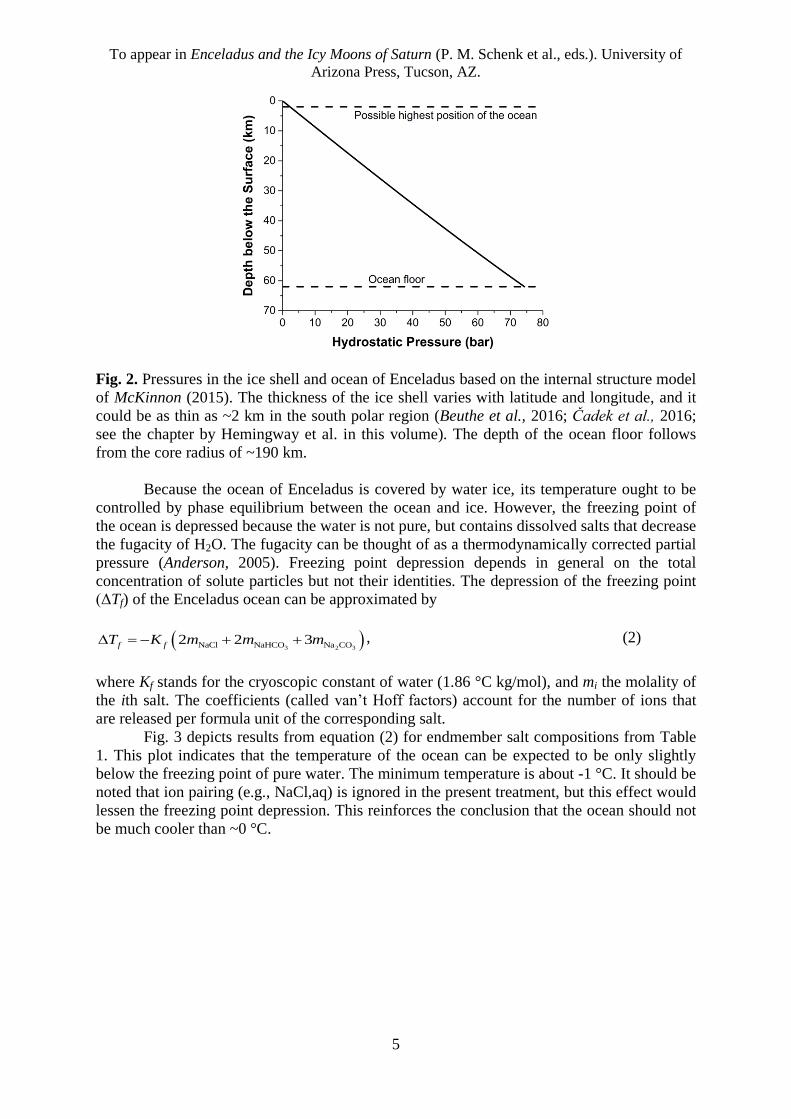
and ρc its density. Fig. 2 shows the pressure profile in the hydrosphere. This model yields
pressures in the ocean ranging between ~2 and ~74 bar (1 bar = 0.1 MPa). Pressures are
relatively low even under a deep ocean, because of Enceladus’ weak gravity (the surface
acceleration due to gravity g = 0.113 m/s2).
To appear in Enceladus and the Icy Moons of Saturn (P. M. Schenk et al., eds.). University of
Arizona Press, Tucson, AZ.
5
Fig. 2. Pressures in the ice shell and ocean of Enceladus based on the internal structure model
of McKinnon (2015). The thickness of the ice shell varies with latitude and longitude, and it
could be as thin as ~2 km in the south polar region (Beuthe et al., 2016; Čadek et al., 2016;
see the chapter by Hemingway et al. in this volume). The depth of the ocean floor follows
from the core radius of ~190 km.
Because the ocean of Enceladus is covered by water ice, its temperature ought to be
controlled by phase equilibrium between the ocean and ice. However, the freezing point of
the ocean is depressed because the water is not pure, but contains dissolved salts that decrease
the fugacity of H2O. The fugacity can be thought of as a thermodynamically corrected partial
pressure (Anderson, 2005). Freezing point depression depends in general on the total
concentration of solute particles but not their identities. The depression of the freezing point
(ΔTf) of the Enceladus ocean can be approximated by
3 2 3NaCl NaHCO Na CO2 2 3f fT K m m m , (2)
where Kf stands for the cryoscopic constant of water (1.86 °C kg/mol), and mi the molality of
the ith salt. The coefficients (called van’t Hoff factors) account for the number of ions that
are released per formula unit of the corresponding salt.
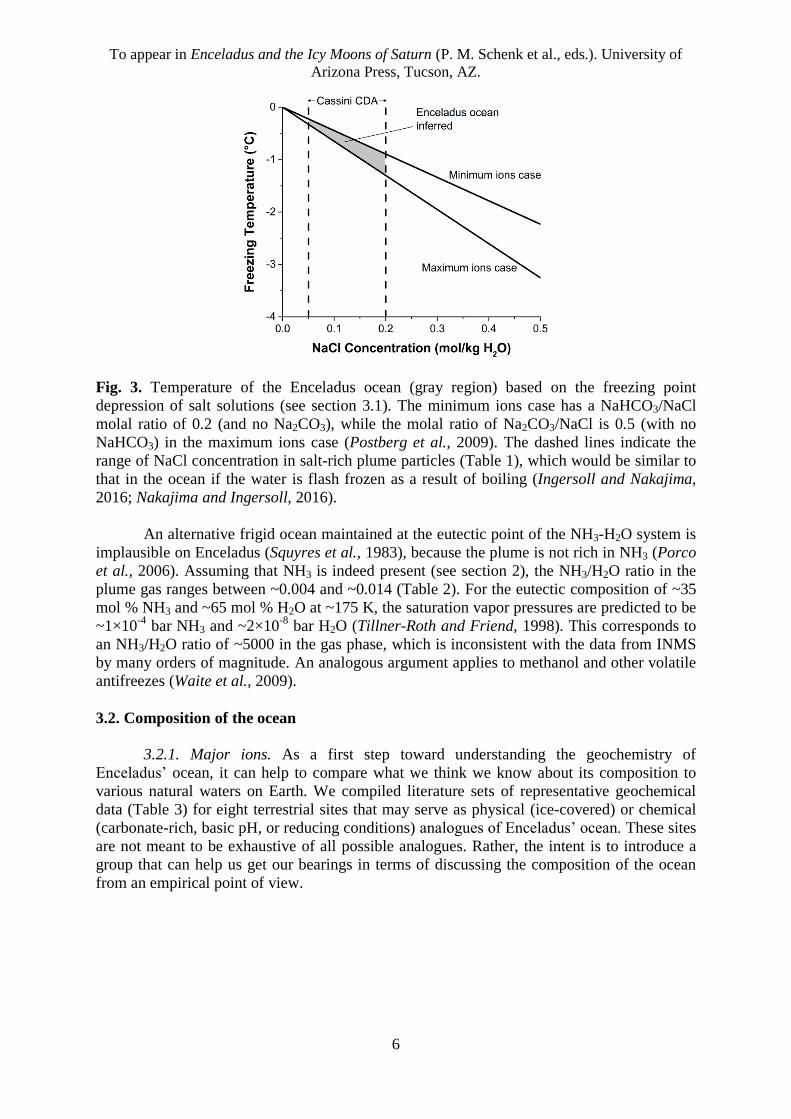
Fig. 3 depicts results from equation (2) for endmember salt compositions from Table
1. This plot indicates that the temperature of the ocean can be expected to be only slightly
below the freezing point of pure water. The minimum temperature is about -1 °C. It should be
noted that ion pairing (e.g., NaCl,aq) is ignored in the present treatment, but this effect would
lessen the freezing point depression. This reinforces the conclusion that the ocean should not
be much cooler than ~0 °C.
To appear in Enceladus and the Icy Moons of Saturn (P. M. Schenk et al., eds.). University of
Arizona Press, Tucson, AZ.
6
Fig. 3. Temperature of the Enceladus ocean (gray region) based on the freezing point
depression of salt solutions (see section 3.1). The minimum ions case has a NaHCO3/NaCl
molal ratio of 0.2 (and no Na2CO3), while the molal ratio of Na2CO3/NaCl is 0.5 (with no
NaHCO3) in the maximum ions case (Postberg et al., 2009). The dashed lines indicate the
range of NaCl concentration in salt-rich plume particles (Table 1), which would be similar to
that in the ocean if the water is flash frozen as a result of boiling (Ingersoll and Nakajima,
2016; Nakajima and Ingersoll, 2016).
An alternative frigid ocean maintained at the eutectic point of the NH3-H2O system is
implausible on Enceladus (Squyres et al., 1983), because the plume is not rich in NH3 (Porco
et al., 2006). Assuming that NH3 is indeed present (see section 2), the NH3/H2O ratio in the
plume gas ranges between ~0.004 and ~0.014 (Table 2). For the eutectic composition of ~35
mol % NH3 and ~65 mol % H2O at ~175 K, the saturation vapor pressures are predicted to be
~1×10⁻⁴
bar NH3 and ~2×10⁻⁸
bar H2O (Tillner-Roth and Friend, 1998). This corresponds to
an NH3/H2O ratio of ~5000 in the gas phase, which is inconsistent with the data from INMS
by many orders of magnitude. An analogous argument applies to methanol and other volatile
antifreezes (Waite et al., 2009).
3.2. Composition of the ocean
3.2.1. Major ions. As a first step toward understanding the geochemistry of
Enceladus’ ocean, it can help to compare what we think we know about its composition to
various natural waters on Earth. We compiled literature sets of representative geochemical
data (Table 3) for eight terrestrial sites that may serve as physical (ice-covered) or chemical
(carbonate-rich, basic pH, or reducing conditions) analogues of Enceladus’ ocean. These sites
are not meant to be exhaustive of all possible analogues. Rather, the intent is to introduce a
group that can help us get our bearings in terms of discussing the composition of the ocean
from an empirical point of view.
To appear in Enceladus and the Icy Moons of Saturn (P. M. Schenk et al., eds.). University of
Arizona Press, Tucson, AZ.
7
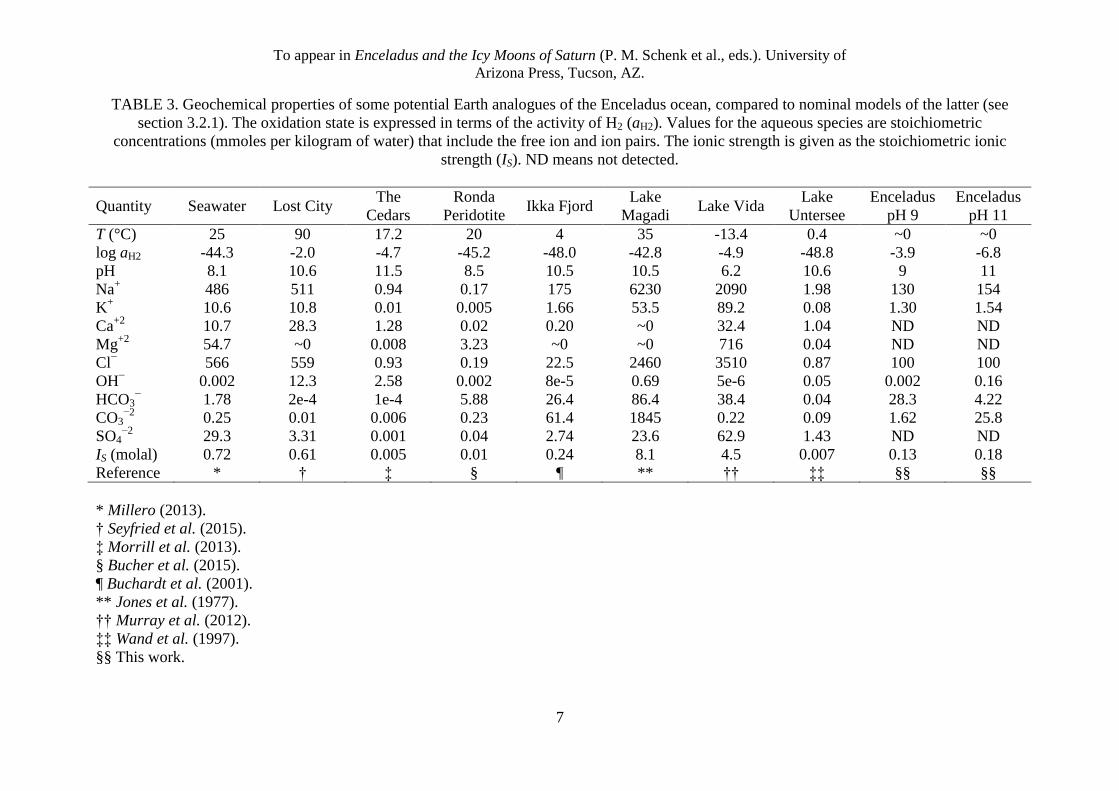
TABLE 3. Geochemical properties of some potential Earth analogues of the Enceladus ocean, compared to nominal models of the latter (see
section 3.2.1). The oxidation state is expressed in terms of the activity of H2 (aH2). Values for the aqueous species are stoichiometric
concentrations (mmoles per kilogram of water) that include the free ion and ion pairs. The ionic strength is given as the stoichiometric ionic
strength (IS). ND means not detected.
Quantity Seawater Lost City The
Cedars
Ronda
Peridotite Ikka Fjord
Lake
Magadi Lake Vida
Lake
Untersee
Enceladus
pH 9
Enceladus
pH 11
T (°C) 25 90 17.2 20 4 35 -13.4 0.4 ~0 ~0
log aH2 -44.3 -2.0 -4.7 -45.2 -48.0 -42.8 -4.9 -48.8 -3.9 -6.8
pH 8.1 10.6 11.5 8.5 10.5 10.5 6.2 10.6 9 11
Na+ 486 511 0.94 0.17 175 6230 2090 1.98 130 154
K+ 10.6 10.8 0.01 0.005 1.66 53.5 89.2 0.08 1.30 1.54
Ca+2
10.7 28.3 1.28 0.02 0.20 ~0 32.4 1.04 ND ND
Mg+2
54.7 ~0 0.008 3.23 ~0 ~0 716 0.04 ND ND
Cl− 566 559 0.93 0.19 22.5 2460 3510 0.87 100 100
OH− 0.002 12.3 2.58 0.002 8e-5 0.69 5e-6 0.05 0.002 0.16
HCO3− 1.78 2e-4 1e-4 5.88 26.4 86.4 38.4 0.04 28.3 4.22
CO3−2
0.25 0.01 0.006 0.23 61.4 1845 0.22 0.09 1.62 25.8
SO4−2
29.3 3.31 0.001 0.04 2.74 23.6 62.9 1.43 ND ND
IS (molal) 0.72 0.61 0.005 0.01 0.24 8.1 4.5 0.007 0.13 0.18
Reference * † ‡ § ¶ ** †† ‡‡ §§ §§
* Millero (2013).
† Seyfried et al. (2015).
‡ Morrill et al. (2013).
§ Bucher et al. (2015).
¶ Buchardt et al. (2001).
** Jones et al. (1977).
†† Murray et al. (2012).
‡‡ Wand et al. (1997).
§§ This work.
To appear in Enceladus and the Icy Moons of Saturn (P. M. Schenk et al., eds.). University of
Arizona Press, Tucson, AZ.
8
Our representation of seawater is the reference composition given by Millero (2013).
Lost City is a low-temperature hydrothermal system that is located near the Mid-Atlantic
Ridge (Kelley et al., 2001; 2005). The fluid composition is derived from the circulation of
seawater through ultramafic (magnesium- and iron-rich) rocks. This leads to hydration and
oxidation (called “serpentinization”) of the rocks. The Cedars is a site in northern California
where ultramafic rocks are being serpentinized on a continent (Morrill et al., 2013). Ronda
Peridotite is another continental ultramafic site, which is located in southern Spain (Bucher et
al., 2015). The data in Table 3 for Rhonda Peridotite refer to brooks whose water has
participated in extensive weathering.
Ikka Fjord is a small fjord in southwestern Greenland (Buchardt et al., 1997). Towers
composed of ikaite (CaCO3•6H2O) precipitate at the bottom of the fjord, where carbonate-
rich spring water seeps into the fjord and mixes with calcium-bearing seawater. Lake Magadi
is a soda lake in the East African Rift Valley in Kenya. It is a brine that is mostly covered by
trona (Na2CO3•NaHCO3•2H2O). Lake Vida is a perennially ice-covered brine in the
McMurdo Dry Valley of East Antarctica (Murray et al., 2012). Its water chemistry may be
controlled by reactions with igneous rocks in the surroundings or lake sediments, as well as
freezing of water that concentrates soluble salts. Lake Untersee is another East Antarctic lake
(Wand et al., 1997), but it is a freshwater lake because its ice cover (~3 m) is much thinner
than that over Lake Vida (~30 m).
We specify a nominal empirical composition for the Enceladus ocean to facilitate
comparisons between its major ion chemistry and those of the possible analogues. We adopt a
recommended pH range of 9 to 11 (see section 3.2.2). The rest of the nominal composition is
as follows: (1) 0.1 molal Cl−, (2) a HCO3
− + CO3
−2 concentration of 0.03 molal, (3) an Na/K
molal ratio of 100, and (4) an H2/CO2 molal ratio of 1.6. These values are consistent with the
data in Tables 1 and 2 (see also section 3.2.3). Speciation calculations are performed at 0 °C
using the thermo.com.V8.R6+ database in The Geochemist’s Workbench (Bethke, 2008). The
present model does not include Ca+2
, Mg+2
, or SO4−2
as these species have not been detected
in the plume or E ring. However, this does not mean that these species are absent from the
ocean. We also do not consider NH3 because it is presently unclear how the plume abundance
of NH3 (Table 2) translates to an ocean concentration. Because NH3 is relatively non-volatile,
it probably freezes out during transport and thus does not exhibit conservative behavior
between the ocean and plume.
The concentrations of major ions in Table 3 reveal similarities and differences
between the natural waters on Earth and Enceladus’ ocean. Seawater is similar to Enceladus’
ocean in terms of being dominated by NaCl. However, seawater is poorer in carbonate
species, and may be richer in Mg+2
and SO4−2
than the Enceladus ocean if the lack of
detection of these species by CDA argues against the ocean containing more than ~10
mmolal MgSO4. The serpentinization systems at Lost City and the Cedars both have
relatively high concentrations of dissolved calcium hydroxide. This drives a decrease in the
concentrations of carbonate species in these systems, unlike the case of Enceladus. Rhonda
Peridotite also appears to differ from the Enceladus ocean, as the former is dominated by
Mg+2
and HCO3−. In contrast, both Ikka Fjord and Lake Magadi seem similar to Enceladus’
ocean in terms of being rich in Na+, Cl
−, and carbonate species. Lake Vida may have a larger
enrichment in Mg+2
than the ocean of Enceladus, if it is assumed that this species has a
concentration below ~10 mmolal in the latter. Finally, the large relative contributions from
Ca+2
and SO4−2
to the ion chemistry of Lake Untersee may represent a key difference between
this environment and Enceladus’ ocean.
We also observe that some of the potential analogues are similar to the models of the
Enceladus ocean with respect to ionic strength (an indicator of total salt content), while others
are dramatically different (Table 3). Both seawater and Lost City fluid (derived from
To appear in Enceladus and the Icy Moons of Saturn (P. M. Schenk et al., eds.). University of
Arizona Press, Tucson, AZ.
9
seawater) are modestly higher in ionic strength than modeled ocean water on Enceladus,
whereas rainwater-derived fluids at the Cedars and Rhonda Peridotite are markedly lower in
ionic strength. Ikka Fjord presents an interesting case that appears to have a similar ionic
strength as the ocean of Enceladus. It is apparent that waters from both Lake Magadi and
Lake Vida are much higher in ionic strength than the Enceladus ocean (Table 3). Conversely,
the low ionic strength of Lake Untersee makes this body of glacial meltwater much “fresher”
than the ocean of Enceladus.
Based on the preceding comparisons, Ikka Fjord and seawater may be the closest
analogues of the Enceladus ocean out of the eight cases considered, with respect to the
composition of major ions. We caution that these analogues are not perfect matches to
Enceladus (nor should we expect them to be given the different geological context). But
between the two of them, they adequately mirror the dominant Na-Cl-HCO3/CO3 chemistry
of the Enceladus ocean.
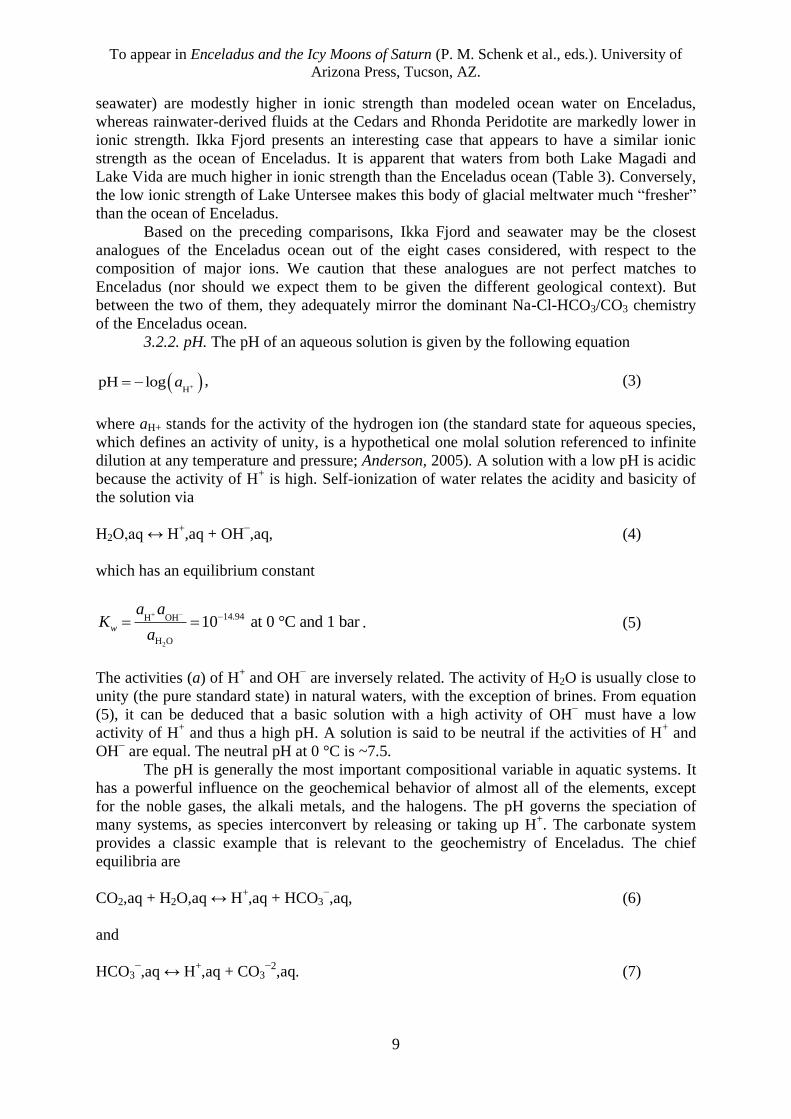
3.2.2. pH. The pH of an aqueous solution is given by the following equation
HpH log a , (3)
where aH+ stands for the activity of the hydrogen ion (the standard state for aqueous species,
which defines an activity of unity, is a hypothetical one molal solution referenced to infinite
dilution at any temperature and pressure; Anderson, 2005). A solution with a low pH is acidic
because the activity of H+ is high. Self-ionization of water relates the acidity and basicity of
the solution via
H2O,aq ↔ H+,aq + OH
−,aq, (4)
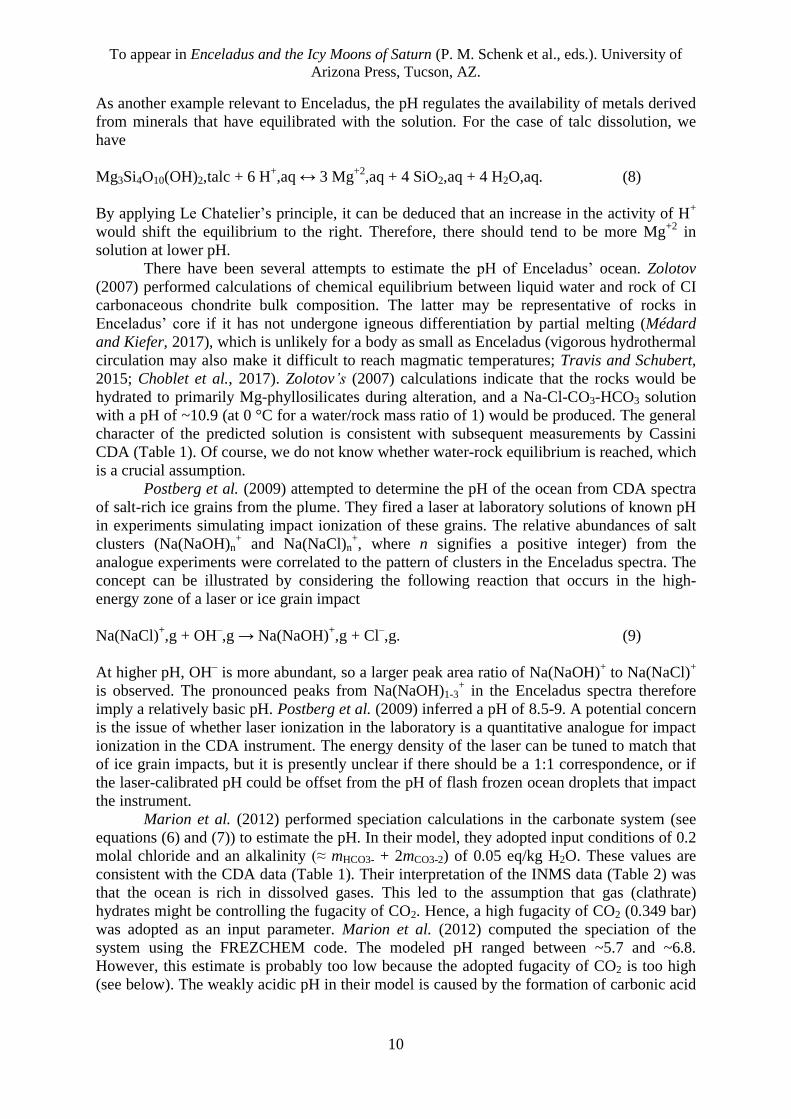
which has an equilibrium constant
2
14.94H OH
H O
10 at 0 °C and 1 barw
a aK
a
. (5)
The activities (a) of H+ and OH
− are inversely related. The activity of H2O is usually close to
unity (the pure standard state) in natural waters, with the exception of brines. From equation
(5), it can be deduced that a basic solution with a high activity of OH− must have a low
activity of H+ and thus a high pH. A solution is said to be neutral if the activities of H
+ and
OH− are equal. The neutral pH at 0 °C is ~7.5.
The pH is generally the most important compositional variable in aquatic systems. It
has a powerful influence on the geochemical behavior of almost all of the elements, except
for the noble gases, the alkali metals, and the halogens. The pH governs the speciation of
many systems, as species interconvert by releasing or taking up H+. The carbonate system
provides a classic example that is relevant to the geochemistry of Enceladus. The chief
equilibria are
CO2,aq + H2O,aq ↔ H+,aq + HCO3
−,aq, (6)
and
HCO3−,aq ↔ H
+,aq + CO3
−2,aq. (7)
To appear in Enceladus and the Icy Moons of Saturn (P. M. Schenk et al., eds.). University of
Arizona Press, Tucson, AZ.
10
As another example relevant to Enceladus, the pH regulates the availability of metals derived
from minerals that have equilibrated with the solution. For the case of talc dissolution, we
have
Mg3Si4O10(OH)2,talc + 6 H+,aq ↔ 3 Mg
+2,aq + 4 SiO2,aq + 4 H2O,aq. (8)
By applying Le Chatelier’s principle, it can be deduced that an increase in the activity of H+
would shift the equilibrium to the right. Therefore, there should tend to be more Mg+2
in
solution at lower pH.
There have been several attempts to estimate the pH of Enceladus’ ocean. Zolotov
(2007) performed calculations of chemical equilibrium between liquid water and rock of CI
carbonaceous chondrite bulk composition. The latter may be representative of rocks in
Enceladus’ core if it has not undergone igneous differentiation by partial melting (Médard
and Kiefer, 2017), which is unlikely for a body as small as Enceladus (vigorous hydrothermal
circulation may also make it difficult to reach magmatic temperatures; Travis and Schubert,
2015; Choblet et al., 2017). Zolotov’s (2007) calculations indicate that the rocks would be
hydrated to primarily Mg-phyllosilicates during alteration, and a Na-Cl-CO3-HCO3 solution
with a pH of ~10.9 (at 0 °C for a water/rock mass ratio of 1) would be produced. The general
character of the predicted solution is consistent with subsequent measurements by Cassini
CDA (Table 1). Of course, we do not know whether water-rock equilibrium is reached, which
is a crucial assumption.
Postberg et al. (2009) attempted to determine the pH of the ocean from CDA spectra
of salt-rich ice grains from the plume. They fired a laser at laboratory solutions of known pH
in experiments simulating impact ionization of these grains. The relative abundances of salt
clusters (Na(NaOH)n+ and Na(NaCl)n
+, where n signifies a positive integer) from the
analogue experiments were correlated to the pattern of clusters in the Enceladus spectra. The
concept can be illustrated by considering the following reaction that occurs in the high-
energy zone of a laser or ice grain impact
Na(NaCl)+,g + OH
–,g → Na(NaOH)
+,g + Cl
–,g. (9)
At higher pH, OH– is more abundant, so a larger peak area ratio of Na(NaOH)
+ to Na(NaCl)
+
is observed. The pronounced peaks from Na(NaOH)1-3+ in the Enceladus spectra therefore
imply a relatively basic pH. Postberg et al. (2009) inferred a pH of 8.5-9. A potential concern
is the issue of whether laser ionization in the laboratory is a quantitative analogue for impact
ionization in the CDA instrument. The energy density of the laser can be tuned to match that
of ice grain impacts, but it is presently unclear if there should be a 1:1 correspondence, or if
the laser-calibrated pH could be offset from the pH of flash frozen ocean droplets that impact
the instrument.
Marion et al. (2012) performed speciation calculations in the carbonate system (see
equations (6) and (7)) to estimate the pH. In their model, they adopted input conditions of 0.2
molal chloride and an alkalinity (≈ mHCO3- + 2mCO3-2) of 0.05 eq/kg H2O. These values are
consistent with the CDA data (Table 1). Their interpretation of the INMS data (Table 2) was
that the ocean is rich in dissolved gases. This led to the assumption that gas (clathrate)
hydrates might be controlling the fugacity of CO2. Hence, a high fugacity of CO2 (0.349 bar)
was adopted as an input parameter. Marion et al. (2012) computed the speciation of the
system using the FREZCHEM code. The modeled pH ranged between ~5.7 and ~6.8.
However, this estimate is probably too low because the adopted fugacity of CO2 is too high
(see below). The weakly acidic pH in their model is caused by the formation of carbonic acid
To appear in Enceladus and the Icy Moons of Saturn (P. M. Schenk et al., eds.). University of
Arizona Press, Tucson, AZ.
11
at relatively high fugacities of CO2. Rainwater on Earth represents a classic example of this
phenomenon (Drever, 1997).
Hsu et al. (2015) suggested that the presence of nanosilica in Enceladus’ ocean
constrains the pH of the ocean. In their interpretation (see section 4.2.1), a cooled
hydrothermal fluid that is supersaturated in amorphous silica can produce nanometer-sized
particles only if the ocean has a moderately alkaline pH. Above a pH of ~10.5, amorphous
silica becomes too soluble to maintain a stable colloidal phase, as implied by the reaction
below
SiO2,amorphous + OH−,aq → HSiO3
–,aq. (10)
These considerations led Hsu et al. (2015) to propose a pH of ~8.5-10.5. A possible concern
with this approach is that it depends on nanosilica being present in the ocean. Hsu et al.
(2015) provided a number of supporting arguments that the nanosilica measured by CDA
originates from E ring ice grains, but nanosilica was not directly observed in either the plume
or the E ring.
Glein et al. (2015) improved upon the carbonate speciation approach of Marion et al.
(2012) in their effort to infer the pH. Glein et al. (2015) attempted to constrain the activity of
CO2 in the ocean not directly from the plume abundance of CO2 (Table 2), but instead by
trying to account for the evolution of the CO2/H2O ratio in the gas as it migrates from the
ocean to space. A large amount of H2O condenses during migration, as the tiger stripes (~200
K) are much colder than the ocean (~273 K). If it is assumed that CO2 does not condense or
condenses to a lesser extent owing to its greater volatility, then the CO2/H2O ratio in the
plume should be greater than the ratio in the ocean source region. Glein et al. (2015) adopted
this no condensation of CO2 endmember, and used the sublimation curve of water ice to
estimate the CO2/H2O ratio at the ocean. This allowed them to make estimates of the activity
of CO2, which were combined with the salt data (Table 1) to calculate the carbonate
speciation of the ocean. The model returned a pH range of ~10.8-13.5. A caveat is that the
assumption of no CO2 condensation is at best an approximation, and could lead to a pH
overestimate of perhaps ~1 unit. This is a concern because VIMS data demonstrate the
condensation of CO2 (Brown et al., 2006), although the fraction that condenses is still being
worked out (Matson et al., 2018).
Table 4 summarizes the previously published estimates for the pH of the ocean of
Enceladus. If the erroneous values from Marion et al. (2012) are discarded, then we are left
with a range from pH 8.5 to 13.5. This is the total uncertainty. The range is not small, but it is
not a trivial problem to determine the pH of an ice-covered ocean using measurements made
in space. Looking at the ranges in the remaining studies, we suggest a “best-fit” pH of ~9-11.
This can be regarded as a compromise between the studies, and it is proposed as a working
model for the Enceladus ocean.
TABLE 4. Estimates for the pH of Enceladus’ ocean.
Reference pH Value
Zolotov (2007) 10.9
Postberg et al. (2009) 8.5-9
Marion et al. (2012) 5.7-6.8
Hsu et al. (2015) 8.5-10.5
Glein et al. (2015) 10.8-13.5
Recommendation (this work) ~9-11
To appear in Enceladus and the Icy Moons of Saturn (P. M. Schenk et al., eds.). University of
Arizona Press, Tucson, AZ.
12
3.2.3. Apparent oxidation state. In general, low-temperature natural waters do not
have a unique oxidation state. Individual redox couples composed of reduced and oxidized
forms of an element can be quantified by an oxidation state parameter (see below), but
different redox couples will have different parameter values if the entire chemical system is
not at redox equilibrium. The latter is almost always the case in low-temperature
environments where the rates of electron transfer reactions are too sluggish to permit the
attainment of equilibrium. Nevertheless, it is useful to define oxidation state parameters as
they give us a scale that can be used to make general comparisons between different
geochemical environments in terms of whether reduction or oxidation is thermodynamically
favored. This is essential for rationalizing the behavior of elements that can exist in multiple
formal oxidation states (e.g., Fe, S, C, N).
Because of the great abundance of water in Enceladus’ ocean, it makes sense to
choose a redox parameter based on hydrogen or oxygen. Here, we choose the activity of H2
(aH2) because H2 was measured in Enceladus’ plume, and a model has been developed to
derive the H2 molality (~activity) in the ocean from the plume measurement (Waite et al.,
2017). A higher H2 activity means that there is a stronger thermodynamic drive for H2 to
reduce other species. The choice of H2 activity to define a redox scale is simply one of
convenience. Values of other commonly used redox parameters can be calculated using
thermodynamic relations. For example, the O2 fugacity (fO2; Frost, 1991) is related to the H2
activity via the disproportionation of water
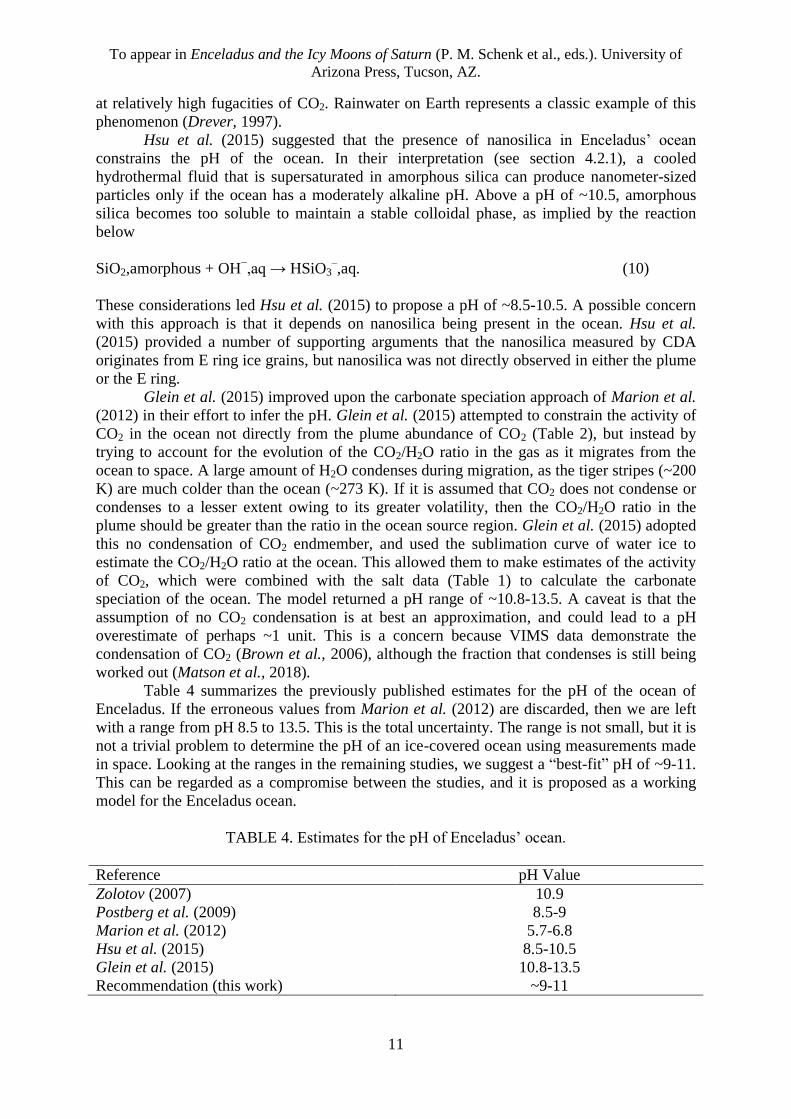
2 H2O,aq ↔ 2 H2,aq + O2,g, (11)
which has an equilibrium constant
2 2
2
2
H O 98.3
11 2
H O
10 at 0 °C and 1 bara f
Ka
. (12)
The minuscule value of this equilibrium constant implies that measurable amounts of H2 and
O2 cannot coexist at equilibrium at 0 °C. Therefore, if a measured H2 or O2 parameter is used
to derive the other parameter, the derived parameter will be unphysically small, and is not
“real” but an abstraction (Anderson, 2005).
Another widely used redox variable is the reduction potential (Eh) referenced to the
standard hydrogen electrode (SHE). On this electrochemical scale, SHE (comprised of unit
fugacity of H2 gas and unit activity of H+) is defined as the zero point. A half-cell reaction
that allows one to relate the activity of H2 to the corresponding Eh can be written as
2 H+,aq + 2 e
–,aq ↔ H2,aq. (13)
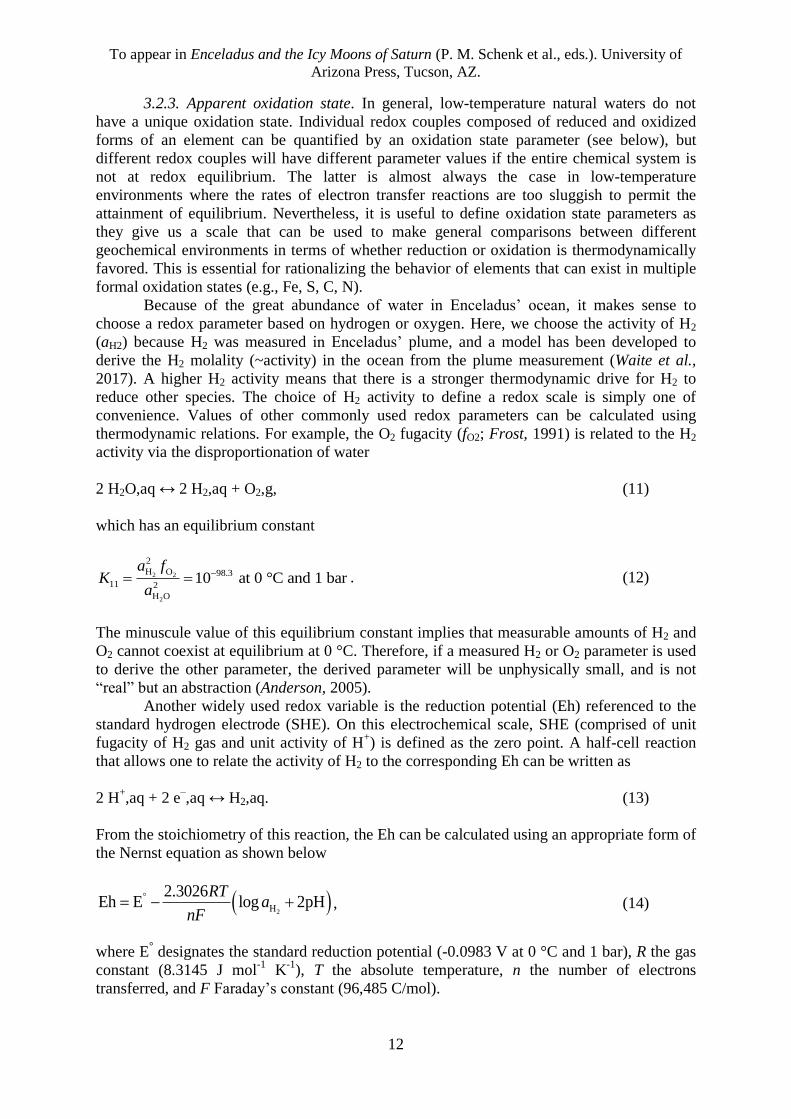
From the stoichiometry of this reaction, the Eh can be calculated using an appropriate form of
the Nernst equation as shown below
2H
2.3026Eh E log 2pH
RTa
nF
, (14)
where E° designates the standard reduction potential (-0.0983 V at 0 °C and 1 bar), R the gas
constant (8.3145 J mol-1
K-1
), T the absolute temperature, n the number of electrons
transferred, and F Faraday’s constant (96,485 C/mol).
To appear in Enceladus and the Icy Moons of Saturn (P. M. Schenk et al., eds.). University of
Arizona Press, Tucson, AZ.
13
It is not easy to determine the concentration of H2 in the ocean of Enceladus from the
mixing ratio of H2 in the plume. One approach is to assume that the H2/H2O ratio is the same
in the ocean as in the plume. However, this is problematic because water vapor condensation
during transport should increase the gas-phase ratio of H2/H2O. Modeling can be performed
to try to account for this effect, but that requires an assumption to be made with regards to the
quench temperature for solid-vapor equilibrium of water in the tiger stripes (Glein et al.,
2015). A more robust approach is to find a different volatile ratio (i.e., one with a much less
condensable reference species than H2O) that would be minimally fractionated between the
ocean and plume. An issue, however, is that deriving absolute concentrations in the ocean
(e.g., the molality of H2) from ratios of volatile gases in the plume requires a constraint on the
absolute concentration of the reference species.
Waite et al. (2017) considered this state of affairs, and proposed an approach centered
on CO2 as the reference species. Carbon dioxide is much less susceptible to condensation
than water because of its much greater volatility. Thus, it may be reasonable to assume that
there is minimal condensation of CO2 during transport, although some condensation must
occur (Brown et al., 2006). Another reason why CO2 is a useful reference species is that its
absolute concentration in the Enceladus ocean can be estimated using existing data from
Enceladus. This can be done by evaluating the speciation of the carbonate system (see
equations (6) and (7)) for specified values of HCO3− + CO3
−2 concentration and pH.
Constraints on these parameters can be found in Tables 1 and 4, respectively. To ascertain the
range in H2 activity (~molality) consistent with the present data, we consider high and low H2
endmembers. For the high H2 endmember, we determine the speciation for a solution
containing 0.2 molal Cl–, 0.1 molal HCO3
– + CO3
–2, and an aqueous H2/CO2 ratio of 4.7
(Table 2). The adopted composition for the low H2 endmember is 0.05 molal Cl–, 0.01 molal
HCO3– + CO3
–2, and H2/CO2 = 0.5 (Table 2). By solving the carbonate speciation problem
(using the Geochemist’s Workbench; Bethke, 2008) over the recommended pH range of 9-11
at 0 °C, the molality of CO2 can be obtained. The activity of H2 can then be estimated using
the scaling relation
2 2 2
2H H CO
2 plume
H
COa m m
. (15)
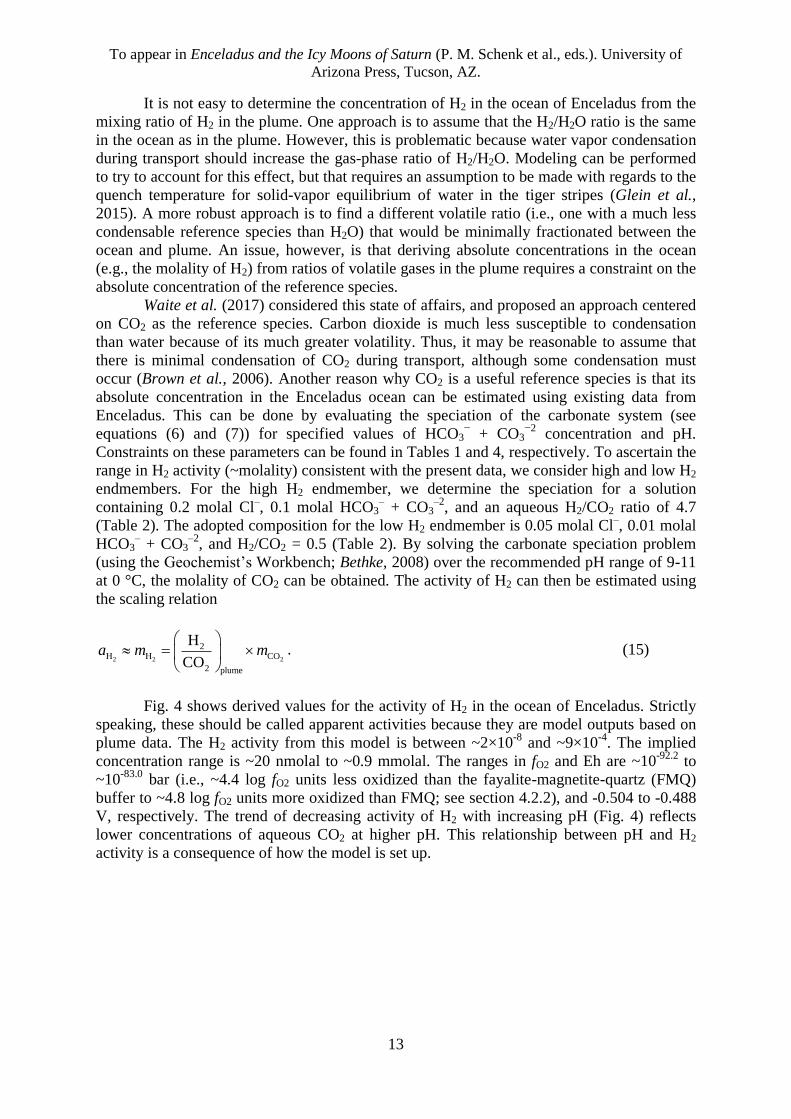
Fig. 4 shows derived values for the activity of H2 in the ocean of Enceladus. Strictly
speaking, these should be called apparent activities because they are model outputs based on
plume data. The H2 activity from this model is between ~2×10⁻⁸
and ~9×10⁻⁴
. The implied
concentration range is ~20 nmolal to ~0.9 mmolal. The ranges in fO2 and Eh are ~10-92.2
to
~10-83.0
bar (i.e., ~4.4 log fO2 units less oxidized than the fayalite-magnetite-quartz (FMQ)
buffer to ~4.8 log fO2 units more oxidized than FMQ; see section 4.2.2), and -0.504 to -0.488
V, respectively. The trend of decreasing activity of H2 with increasing pH (Fig. 4) reflects
lower concentrations of aqueous CO2 at higher pH. This relationship between pH and H2
activity is a consequence of how the model is set up.
To appear in Enceladus and the Icy Moons of Saturn (P. M. Schenk et al., eds.). University of
Arizona Press, Tucson, AZ.
14
Fig. 4. Redox-pH conditions in Enceladus’ ocean vs. potential terrestrial analogues (Table 3).
The pH range for Enceladus is from Table 4, and the range in H2 activity is determined by the
range in H2 mixing ratio in the plume according to the geochemical model described in
section 3.2.3. Neutral pH at 0 °C is shown. The 1 bar H2 line represents the solubility of 1 bar
of H2 from Henry’s law, while the 1 bar O2 line indicates the H2 activity that would be in
equilibrium with 1 bar of O2.
Three possible complications have been identified. First, freezing out ocean-derived
CO2 would decrease the apparent H2 activity, while subliming CO2 from the ice shell would
increase the apparent H2 activity. Second, the present lack of explanation for the observations
of H2 spikes by INMS (Waite et al., 2017) could imply that they are generated by an
instrumental effect. If an unknown instrumental effect can produce the rest of the H2 signal
(interpreted to be from native H2) under different circumstances from the spikes, then the
apparent H2 activity would represent an upper limit (however, see Waite et al., 2017 for a
detailed analysis of the instrument background at mass 2). Third, the apparent H2 activity is
for the plume source region at the top of the ocean. Because H2 is escaping from this region,
the deeper ocean may be presumed to have a higher activity of H2. In this case, the derived
values in Fig. 4 would be lower limits for the bulk ocean.
With constraints on the pH and activity of H2 in Enceladus’ ocean, we can place this
environment into a broader context by comparing its conditions of pH-log aH2 to the possible
Earth analogues from section 3.2.1. To add the analogues to Fig. 4, we calculated the H2
activity from measurements of the concentration of H2 in fluids from Lost City (Seyfried et
al., 2015), the Cedars (Morrill et al., 2013), and Lake Vida (Murray et al., 2012). For the
well-oxygenated other sites, we assumed that O2 is the dominant controller of their redox
chemistry, and we derived thermodynamic values of the H2 activity consistent with equations
(11) and (12) for the temperature of the site of interest (Table 3). In pH-log aH2 space, Lost
City and the Cedars appear to be most similar to the Enceladus ocean (Fig. 4). This suggests
that reactions between water and ultramafic rocks could be influencing these properties of the
ocean (Glein et al., 2015; see section 4.2.2). Lake Vida overlaps the Enceladus ocean in H2
activity, but the former is significantly more acidic than the latter. Conversely, we find that
the other sites are fairly consistent with the inferred pH of Enceladus’ ocean, but the
availability of abundant atmospheric O2 on Earth makes them much more oxidized compared
with the Enceladus ocean.
Overall, the composition of the Enceladus ocean resembles a hybrid of Ikka Fjord,
seawater (see section 3.2.1), and Lost City/the Cedars. None of these sites capture all of the
To appear in Enceladus and the Icy Moons of Saturn (P. M. Schenk et al., eds.). University of
Arizona Press, Tucson, AZ.
15
essential features of Enceladus’ ocean, but they each exhibit at least one key similarity to the
inferred geochemical properties of the latter. Cassini discovered an ocean of sea salt and soda
serpentinizing the underlying rocks.
4. HYDROTHERMAL GEOCHEMISTRY
4.1. Pressure and temperature in the rocky core
We continue using the interior model of McKinnon (2015) to estimate pressures in the
rocky core of Enceladus. Pressures inside the core can be calculated using the following
formula (Turcotte and Schubert, 2002)
2 2 2 2 2 2 3 1 12 2 4
3 3 3c c h E c h c c h c EP G R r G R R GR R R , (16)
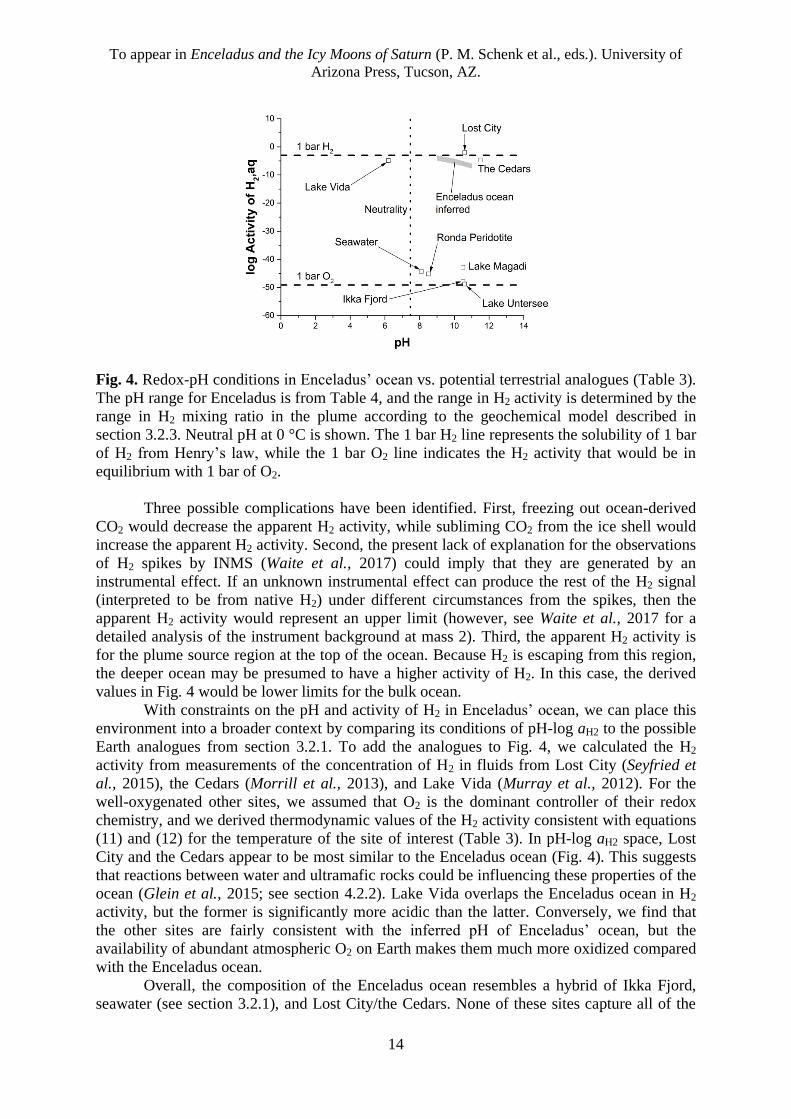
which is applicable to 0 ≤ r ≤ Rc (see section 3.1 for definitions of the parameters). Fig. 5
shows the pressure profile below the ocean floor. According to this model, the pressure
increases from an ocean floor value of ~74 bar to a maximum of ~377 bar at the center of the
moon. The highest pressure in Enceladus is comparable to the average seafloor pressure on
Earth (~400 bar).
Fig. 5. Pressures in the rocky core of Enceladus based on the internal structure model of
McKinnon (2015). The maximum depth of boiling is where the pressure equals the critical
pressure of water (~221 bar).
It is more difficult to determine temperatures in the core (see the chapter by Castillo-
Rogez et al. in this volume). Here, we attempt to set some conservative upper limits. In
sections 4.2.1 and 4.2.2, we consider the temperature implications of models for
hydrothermal SiO2 and H2, respectively. A first constraint is imposed by the liquid-vapor
saturation curve of water. For a core with ~20-30% water-filled porosity (Choblet et al.,
2017; Waite et al., 2017), the boiling point represents the maximum temperature for pressures
less than the critical pressure of H2O (~221 bar). Fig. 5 indicates that boiling would control
the maximum temperature of hydrothermal fluids down to a depth of ~54 km beneath the
ocean floor. Once a fluid is heated to the appropriate boiling temperature, any additional
input of heat would not increase its temperature but would go into vaporizing water. At the
To appear in Enceladus and the Icy Moons of Saturn (P. M. Schenk et al., eds.). University of
Arizona Press, Tucson, AZ.
16
ocean floor, the boiling temperature is ~290 °C. This is the maximum temperature of aqueous
fluids issuing into the ocean from hydrothermal vents. A large portion of the rocky core is
subject to the boiling limit. Owing to the spherical geometry of the core, ~63% of its volume
experiences pressures less than the critical pressure of H2O. In this region (~74-221 bar; Fig.
5), the relationship between the pressure and maximum temperature (Tmax) can be
parameterized as (Wagner and Pruß, 2002)
max
2047log (bar) 5.504
(K)P
T . (17)
The boiling limit does not apply deep in the core (Fig. 5), so a different approach must
be taken to constrain temperatures there. Because the density of Enceladus’ core is rather low
(~2450 kg/m3; Iess et al., 2014; McKinnon, 2015), the core should be rich in hydrated
silicates. This imposes a constraint on the temperature given that hydrated minerals undergo
dehydration at sufficiently high temperatures. Dehydrating the rocks would make the core too
dense. The argument can be quantified by performing a simple geochemical analysis. Here,
we approximate the dehydration process by tracking the release of water from antigorite
serpentine. Antigorite (Mg48Si34O85(OH)62) is the polymorph of serpentine that is most stable
during metamorphism. Serpentine minerals are likely to dominate the budget of mineral-
bound water (i.e., OH) in the deep interior (Zolotov, 2007). To show that this is likely to be
the case, one must go a step beyond the consensus of a heavily hydrated core, and consider
specific hydroxylated silicates that could be present. Waite et al. (2017) developed a
normative model for the mineralogy of possible rocks in the Mg-Si-Fe-S-O-H system on
Enceladus. In their reduced hydrous rock, ~68% of the mineral-bound water is in Mg-
serpentine, ~31% is in Fe(II)-serpentine, and ~1% is in talc/saponite. Their oxidized hydrous
rock has ~69% of the mineral-bound water in Mg-serpentine and ~31% in talc/saponite.
Thus, the mass balance supports a focus on the dehydration of antigorite to elucidate an
approximate upper temperature limit.
The classic dehydration sequence of antigorite (Tracy and Frost, 1991) can be
represented by the following reactions
Mg48Si34O85(OH)62,antigorite → 4 Mg3Si4O10(OH)2,talc
+ 18 Mg2SiO4,forsterite + 27 H2O,aq, (18)
4 Mg3Si4O10(OH)2,talc + 1.778 Mg2SiO4,forsterite →
2.222 Mg7Si8O22(OH)2,anthophyllite + 1.778 H2O,aq, (19)
and
2.222 Mg7Si8O22(OH)2,anthophyllite + 2.222 Mg2SiO4,forsterite →
20 MgSiO3,enstatite + 2.222 H2O,aq. (20)
The curves in Fig. 6 show where these reactions would occur in pressure-temperature space.
By summing equations (18) through (20), it can be found that the complete dehydration of 1
mole of antigorite releases 31 moles of water. Because equation (18) releases ~87% of the
total H2O, we deduce that this reaction effectively determines the content of bound water in
rocks, and therefore their densities. To maintain a relatively low core density, temperatures in
the core should be lower than the appropriate dehydration temperature of antigorite. The
dehydration temperature increases with pressure (Fig. 6). For a maximum pressure of ~377
To appear in Enceladus and the Icy Moons of Saturn (P. M. Schenk et al., eds.). University of
Arizona Press, Tucson, AZ.
17
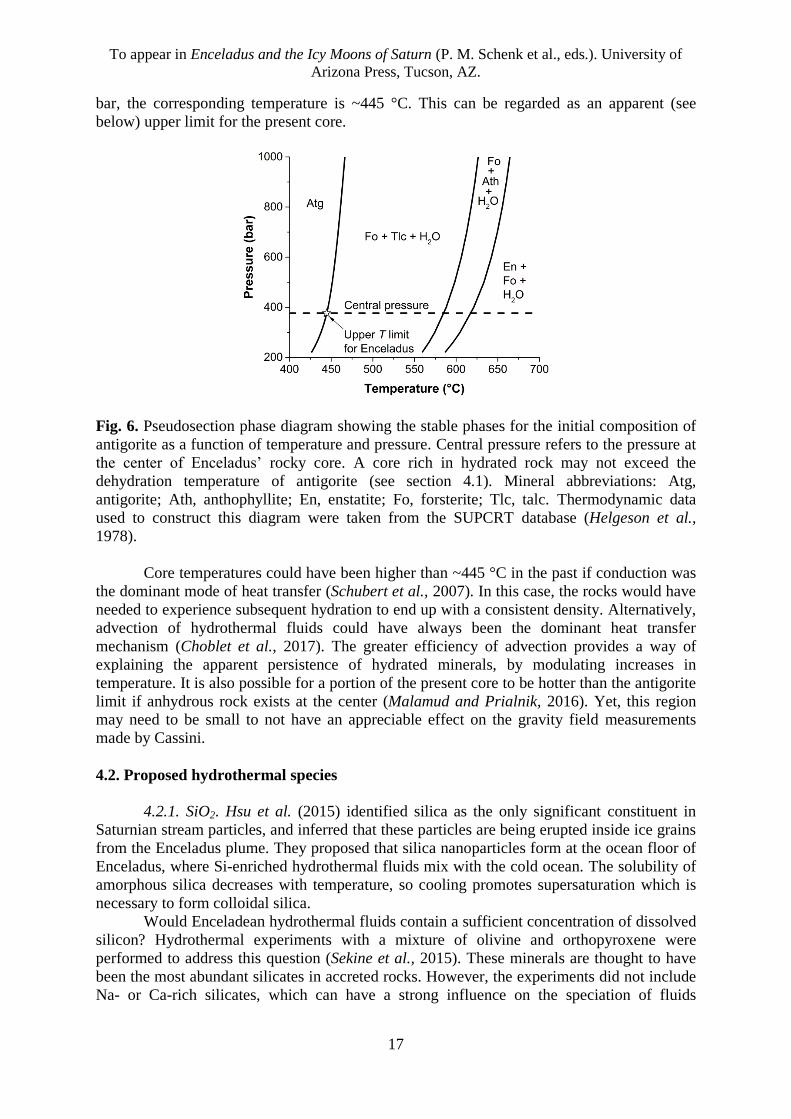
bar, the corresponding temperature is ~445 °C. This can be regarded as an apparent (see
below) upper limit for the present core.
Fig. 6. Pseudosection phase diagram showing the stable phases for the initial composition of
antigorite as a function of temperature and pressure. Central pressure refers to the pressure at
the center of Enceladus’ rocky core. A core rich in hydrated rock may not exceed the
dehydration temperature of antigorite (see section 4.1). Mineral abbreviations: Atg,
antigorite; Ath, anthophyllite; En, enstatite; Fo, forsterite; Tlc, talc. Thermodynamic data
used to construct this diagram were taken from the SUPCRT database (Helgeson et al.,
1978).
Core temperatures could have been higher than ~445 °C in the past if conduction was
the dominant mode of heat transfer (Schubert et al., 2007). In this case, the rocks would have
needed to experience subsequent hydration to end up with a consistent density. Alternatively,
advection of hydrothermal fluids could have always been the dominant heat transfer
mechanism (Choblet et al., 2017). The greater efficiency of advection provides a way of
explaining the apparent persistence of hydrated minerals, by modulating increases in
temperature. It is also possible for a portion of the present core to be hotter than the antigorite
limit if anhydrous rock exists at the center (Malamud and Prialnik, 2016). Yet, this region
may need to be small to not have an appreciable effect on the gravity field measurements
made by Cassini.
4.2. Proposed hydrothermal species
4.2.1. SiO2. Hsu et al. (2015) identified silica as the only significant constituent in
Saturnian stream particles, and inferred that these particles are being erupted inside ice grains
from the Enceladus plume. They proposed that silica nanoparticles form at the ocean floor of
Enceladus, where Si-enriched hydrothermal fluids mix with the cold ocean. The solubility of
amorphous silica decreases with temperature, so cooling promotes supersaturation which is
necessary to form colloidal silica.
Would Enceladean hydrothermal fluids contain a sufficient concentration of dissolved
silicon? Hydrothermal experiments with a mixture of olivine and orthopyroxene were
performed to address this question (Sekine et al., 2015). These minerals are thought to have
been the most abundant silicates in accreted rocks. However, the experiments did not include
Na- or Ca-rich silicates, which can have a strong influence on the speciation of fluids
To appear in Enceladus and the Icy Moons of Saturn (P. M. Schenk et al., eds.). University of
Arizona Press, Tucson, AZ.
18
(Zolotov and Postberg, 2014). Sekine et al. (2015) found that the Si concentration in their
experimental hydrothermal fluid was similar to that predicted for a fluid in equilibrium with
serpentine and talc. Indeed, x-ray diffraction analysis revealed that serpentine and saponite (a
trioctahedral phyllosilicate compositionally similar to the Al-free endmember talc) are the
major alteration minerals. To constrain the formation temperature of the silica nanoparticles,
these workers performed speciation calculations under the assumption that the activity of
SiO2 in hydrothermal fluids on Enceladus would be similar to that determined by a
serpentine-talc buffer, such as
0.5 Mg3Si4O10(OH)2,talc + 0.5 H2O,aq ↔ 0.5 Mg3Si2O5(OH)4,chrysotile
+ SiO2,aq. (21)
In alkaline systems, HSiO3– and NaHSiO3 can be more abundant than aqueous SiO2. There is
a pH effect as indicated by the following equilibria
SiO2,aq + H2O,aq ↔ H+,aq + HSiO3
–,aq, (22)
and
Na+,aq + HSiO3
–,aq ↔ NaHSiO3,aq, (23)
which imply that the concentrations of both HSiO3– and NaHSiO3 should increase at higher
pH. The minimum temperature required to precipitate amorphous silica as a result of cooling
depends on the pH of the hydrothermal fluid and that of ocean water. Sekine et al. (2015)
used their speciation results to map out these relationships. They suggested that the minimum
temperature would be ~150-200 °C if the compositions of the hydrothermal fluid and ocean
water are controlled by the same water-rock equilibria. If the two fluids are treated as pH-
decoupled systems, then the model of Sekine et al. (2015) indicates that the minimum
temperature could be decreased to a value as low as ~50 °C if the hydrothermal fluid pH is ~2
units higher than the ocean pH.
To test if rocks containing serpentine and talc can generate sufficiently Si-rich fluids
that would precipitate amorphous silica upon cooling, the pH of the fluids must be modeled
self-consistently. One way to do this is to assume that the rocks would also contain calcite
(CaCO3) and tremolite (Ca2Mg5Si8O22(OH)2). Downwelling of ocean water into the rocky
core would bring carbonate species (Table 1) in contact with rocks deeper in the core,
facilitating the formation of calcite. For a deep rock endmember (see section 4.2.2), we
envision that some of the calcium is still in silicate minerals, thus tremolite is chosen as a
model mineral to simulate the pH effect. The assemblage chrysotile-talc-calcite-tremolite sets
the activity of CO2 according to
3 Ca2Mg5Si8O22(OH)2,tremolite + 2 Mg3Si2O5(OH)4,chrysotile
+ 6 CO2,aq ↔ 6 CaCO3,calcite + 7 Mg3Si4O10(OH)2,talc. (24)
To complete the model, it is assumed that the hydrothermal fluid inherits the chlorinity and
carbonate alkalinity of the downwelling ocean water. We adopt a nominal chlorinity of 100
mmolal and a total carbonate concentration of 30 mmolal (see section 3.2.1), which translates
to a carbonate alkalinity of 31 and 56 meq/kg H2O for pH 9 and 11, respectively. With
constraints on the activity of CO2 and carbonate alkalinity, the pH can be evaluated from the
speciation of the hydrothermal fluid. Here, the speciation is computed using the GEOCHEQ
code (Zolotov, 2012).
To appear in Enceladus and the Icy Moons of Saturn (P. M. Schenk et al., eds.). University of
Arizona Press, Tucson, AZ.
19
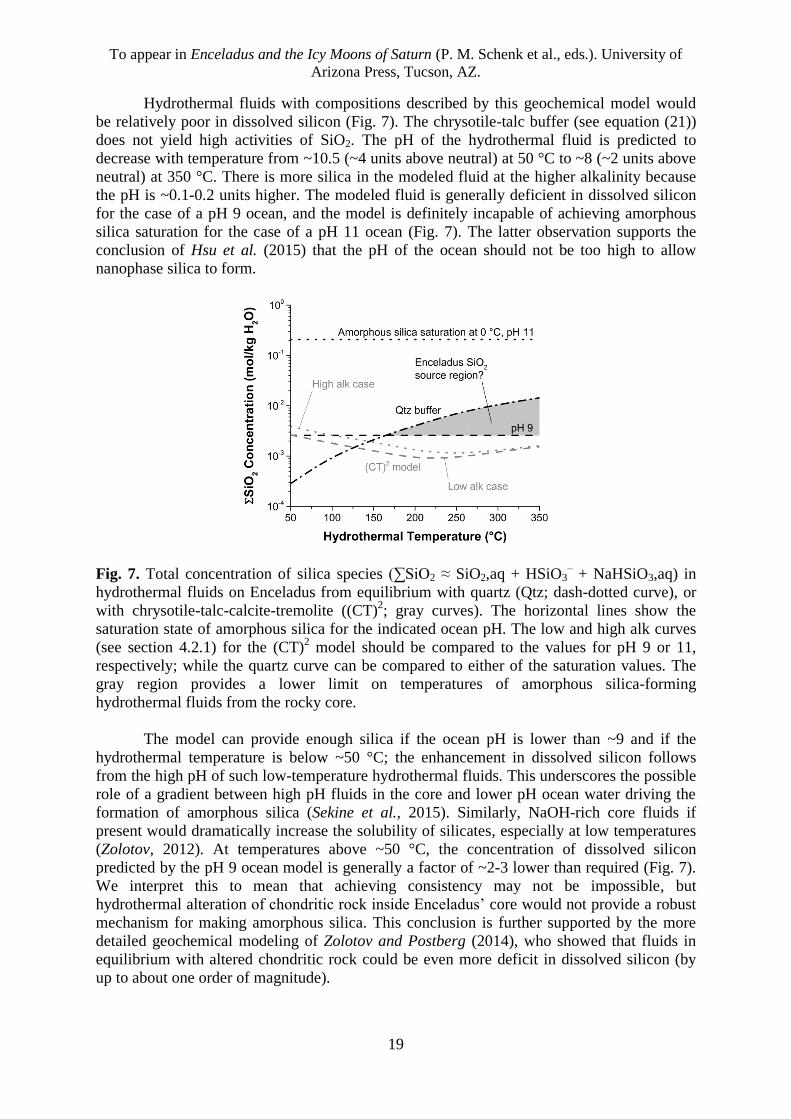
Hydrothermal fluids with compositions described by this geochemical model would
be relatively poor in dissolved silicon (Fig. 7). The chrysotile-talc buffer (see equation (21))
does not yield high activities of SiO2. The pH of the hydrothermal fluid is predicted to
decrease with temperature from ~10.5 (~4 units above neutral) at 50 °C to ~8 (~2 units above
neutral) at 350 °C. There is more silica in the modeled fluid at the higher alkalinity because
the pH is ~0.1-0.2 units higher. The modeled fluid is generally deficient in dissolved silicon
for the case of a pH 9 ocean, and the model is definitely incapable of achieving amorphous
silica saturation for the case of a pH 11 ocean (Fig. 7). The latter observation supports the
conclusion of Hsu et al. (2015) that the pH of the ocean should not be too high to allow
nanophase silica to form.
Fig. 7. Total concentration of silica species (∑SiO2 ≈ SiO2,aq + HSiO3– + NaHSiO3,aq) in
hydrothermal fluids on Enceladus from equilibrium with quartz (Qtz; dash-dotted curve), or
with chrysotile-talc-calcite-tremolite ((CT)2; gray curves). The horizontal lines show the
saturation state of amorphous silica for the indicated ocean pH. The low and high alk curves
(see section 4.2.1) for the (CT)2 model should be compared to the values for pH 9 or 11,
respectively; while the quartz curve can be compared to either of the saturation values. The
gray region provides a lower limit on temperatures of amorphous silica-forming
hydrothermal fluids from the rocky core.
The model can provide enough silica if the ocean pH is lower than ~9 and if the
hydrothermal temperature is below ~50 °C; the enhancement in dissolved silicon follows
from the high pH of such low-temperature hydrothermal fluids. This underscores the possible
role of a gradient between high pH fluids in the core and lower pH ocean water driving the
formation of amorphous silica (Sekine et al., 2015). Similarly, NaOH-rich core fluids if
present would dramatically increase the solubility of silicates, especially at low temperatures
(Zolotov, 2012). At temperatures above ~50 °C, the concentration of dissolved silicon
predicted by the pH 9 ocean model is generally a factor of ~2-3 lower than required (Fig. 7).
We interpret this to mean that achieving consistency may not be impossible, but
hydrothermal alteration of chondritic rock inside Enceladus’ core would not provide a robust
mechanism for making amorphous silica. This conclusion is further supported by the more
detailed geochemical modeling of Zolotov and Postberg (2014), who showed that fluids in
equilibrium with altered chondritic rock could be even more deficit in dissolved silicon (by
up to about one order of magnitude).
To appear in Enceladus and the Icy Moons of Saturn (P. M. Schenk et al., eds.). University of
Arizona Press, Tucson, AZ.
20
We wish to clarify that it is a misconception to assume that fluids compositionally
similar to those at Lost City would precipitate amorphous silica at Enceladus. There is not
enough dissolved silicon in Lost City fluids by ~1-2 orders of magnitude (Seyfried et al.,
2015). Amorphous silica at Enceladus can be used to argue for the existence of hydrothermal
systems (see below), but not systems that are geochemically analogous to Lost City (i.e.,
serpentinization systems).
There is motivation to identify more robust mechanisms of producing amorphous
silica inside Enceladus. We would like to suggest a possibility that involves hydrothermal
processing of quartz-bearing rocks. This is usually how amorphous silica is produced by
hydrothermal processes on Earth (Fournier and Rowe, 1966; Von Damm et al., 1985).
Quartz-bearing rocks could be present as a weathering crust on the core of Enceladus. Such
rocks can be formed via the process of carbonation (Klein and Garrido, 2011), where
carbonate derived from CO2 serves as a sink of divalent cations such as magnesium, leaving
behind Si-enriched phases. As an example of such chemistry, Streit et al. (2012) reported a
remarkable occurrence of quartz that apparently formed by carbonation of serpentinized
peridotite at ambient temperatures on Earth. Carbonation of rocks on Enceladus would be
promoted by the accretion of a large amount of CO2, as observed at numerous comets
(Ootsubo et al., 2012). The relatively high abundance of (bi)carbonate salts in many plume
particles (Table 1) provides evidence for the reaction of CO2 with rocks. Enceladus’ ocean
floor has presumably experienced the most intense chemical weathering, because that is
where the volatiles-to-rock ratio should be largest.
The solubility curve of quartz in Fig. 7 corresponds to the following equilibrium
SiO2,quartz ↔ SiO2,aq. (25)
The curve does not account for variable pH, but GEOCHEQ calculations showed that neutral
SiO2 would be the dominant Si species (>80% of dissolved Si) in heated ocean water that had
equilibrated with quartz, magnesite (MgCO3), and talc (a possible carbonation assemblage in
the weathering crust). Hydrothermal fluids in equilibrium with quartz would be rich in
dissolved silicon (Fig. 7). Quartz-buffered fluids at temperatures above ~165 °C would
contain sufficient silica to precipitate amorphous silica into a pH 9 ocean. This is a lower
limit on temperatures in the source region of the silica nanoparticles. The pH of the ocean
would also be constrained; if we assume a hydrothermal temperature of ~350 °C, then
amorphous silica precipitation from a quartz-buffered fluid is possible only if the ocean has a
pH lower than ~10. The range in the concentration of silica from the quartz model (~3-15
mmolal from ~165-350 °C; Fig. 7) is consistent with the observationally based estimate
(~2.5-65 mmolal) of Hsu et al. (2015).
4.2.2. H2. The INMS instrument detected H2 in the plume (Table 2), and it was
concluded that the H2 is native to Enceladus (Waite et al., 2017). In addition to water-rock
processes such as serpentinization (Vance et al., 2007), there are several other candidate
sources of H2 that must be considered. One possibility is that the H2 is primordial, and was
acquired by gravitational capture from the Saturnian subnebula, or by trapping in cold
amorphous ices. However, these sources can be ruled out based on the lack of detection of 4He (
4He/H2O < 6×10
-5) and
36Ar (
36Ar/H2O < 4×10
-6), respectively, in the plume gas (Waite
et al., 2017). Another possible source of H2 is thermal cracking of NH3 to N2 and H2 (Matson
et al., 2007). But, this mechanism is unattractive owing to the non-detection of N2 (N2/H2O <
5×10⁻⁴
). Alternatively, the H2 could be radiolytic, and might have been produced from H2O
by radiation chemistry at the surface or in the interior (Bouquet et al., 2017). Both of these
processes should be ongoing, but kinetic calculations suggest that neither of them could make
enough H2 to account for the observations (Waite et al., 2017). Conversely, mass balance
To appear in Enceladus and the Icy Moons of Saturn (P. M. Schenk et al., eds.). University of
Arizona Press, Tucson, AZ.
21
calculations indicate that huge amounts of H2 can be generated by reactions between water
and reduced minerals, or by pyrolysis of organic matter (Waite et al., 2017). The H2-
generating potential of both of these sources is sufficient to sustain the present level of
outgassing over the history of the solar system. Waite et al. (2017) therefore suggested that
the H2 is likely produced by hydrothermal processing of rocks containing both ferrous iron-
bearing silicates and organic materials. They further argued that this process is occurring
today, as the H2/CH4 ratio may be much lower than the observed value (~1-14) if the H2 had
been stored in impermeable rocks and released recently.
The following questions remain: (1) How can mineral vs. organic sources of H2 be
discriminated? (2) Would the formation of carbonate minerals affect the yield of H2? (3) How
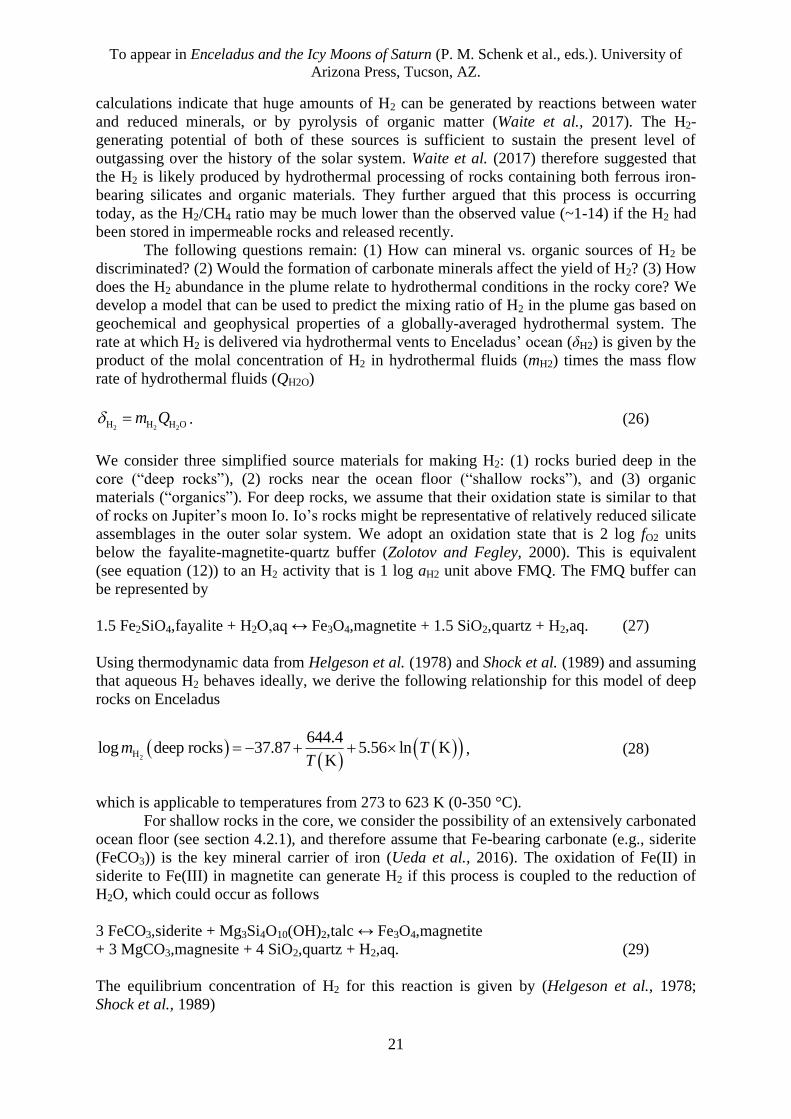
does the H2 abundance in the plume relate to hydrothermal conditions in the rocky core? We
develop a model that can be used to predict the mixing ratio of H2 in the plume gas based on
geochemical and geophysical properties of a globally-averaged hydrothermal system. The
rate at which H2 is delivered via hydrothermal vents to Enceladus’ ocean (δH2) is given by the
product of the molal concentration of H2 in hydrothermal fluids (mH2) times the mass flow
rate of hydrothermal fluids (QH2O)
2 2 2H H H Om Q . (26)
We consider three simplified source materials for making H2: (1) rocks buried deep in the
core (“deep rocks”), (2) rocks near the ocean floor (“shallow rocks”), and (3) organic
materials (“organics”). For deep rocks, we assume that their oxidation state is similar to that
of rocks on Jupiter’s moon Io. Io’s rocks might be representative of relatively reduced silicate
assemblages in the outer solar system. We adopt an oxidation state that is 2 log fO2 units
below the fayalite-magnetite-quartz buffer (Zolotov and Fegley, 2000). This is equivalent
(see equation (12)) to an H2 activity that is 1 log aH2 unit above FMQ. The FMQ buffer can
be represented by
1.5 Fe2SiO4,fayalite + H2O,aq ↔ Fe3O4,magnetite + 1.5 SiO2,quartz + H2,aq. (27)
Using thermodynamic data from Helgeson et al. (1978) and Shock et al. (1989) and assuming
that aqueous H2 behaves ideally, we derive the following relationship for this model of deep
rocks on Enceladus
2H
644.4log deep rocks 37.87 5.56 ln K
Km T
T , (28)
which is applicable to temperatures from 273 to 623 K (0-350 °C).
For shallow rocks in the core, we consider the possibility of an extensively carbonated
ocean floor (see section 4.2.1), and therefore assume that Fe-bearing carbonate (e.g., siderite
(FeCO3)) is the key mineral carrier of iron (Ueda et al., 2016). The oxidation of Fe(II) in
siderite to Fe(III) in magnetite can generate H2 if this process is coupled to the reduction of
H2O, which could occur as follows
3 FeCO3,siderite + Mg3Si4O10(OH)2,talc ↔ Fe3O4,magnetite
+ 3 MgCO3,magnesite + 4 SiO2,quartz + H2,aq. (29)
The equilibrium concentration of H2 for this reaction is given by (Helgeson et al., 1978;
Shock et al., 1989)
To appear in Enceladus and the Icy Moons of Saturn (P. M. Schenk et al., eds.). University of
Arizona Press, Tucson, AZ.
22
2H
364.3log shallow rocks 54.48 8.02 ln K
Km T
T , (30)
from 273-623 K (0-350 °C).
The concentration of H2 in hydrothermal fluids cooking organic matter in Enceladus’
core can be represented by
2 2H H
O/Rorganics
W/Rm Y , (31)
where O/R and W/R correspond to the organic/rock and water/rock mass ratios, respectively;
and YH2 designates the yield of H2 in mol per kg of organic matter. Here, we adopt W/R = 1
for hydrothermally active regions in Enceladus’ core; and O/R = 0.4, a value intermediate
between CI chondrites (Alexander et al., 2007) and dust particles from comet 67P (Bardyn et
al., 2017). The parameterization of Waite et al. (2017), based on the Murchison meteorite
(Okumura and Mimura, 2011), is used to estimate the pyrolytic yield of H2. Equation (31)
then becomes
2H
4023log organics 3.55m
T K . (32)
The H2 yield was fit to experimental data from 350 to 800 °C, but the Arrhenius equation can
be extrapolated to lower temperatures.
The mass flow rate of hydrothermal fluids (see equation (26)) can be estimated using
an approach similar to that of Lowell and DuBose (2005). The basis of the approach is energy
conservation for heat that is transported by hydrothermal fluids into the Enceladus ocean. We
found that heat capacities (Cp) for liquid water at 300 bar can be represented by (Wagner and
Pruß, 2002)
9
pC T , (33)
with α = 4130 J kg-1
K-1
and β = 1.53×10⁻²²
J kg-1
K-10
for 273-623 K (0-350 °C). For this
functional form of the heat capacity, the rate of heat transfer (H) is related to the mass flow
rate via
2
10 10
H O hydro ocean hydro ocean0.1H Q T T T T , (34)
where Thydro refers to the hydrothermal fluid temperature, and Tocean the temperature of
Enceladus’ ocean. We can obtain QH2O as a function of Thydro by specifying a value for H.
Below, we consider a range of 1-10 GW based on Choblet et al.’s (2017) model of tidal
dissipation and fluid flow in Enceladus’ core.
If the concentration of H2 in Enceladus’ ocean has reached a steady state between
hydrothermal input and output from the plume, then the latter rate is also given by equation
(26). The molar ratio of H2/H2O that would be expected in the plume gas can be computed
from the rate of H2 output from the preceding hydrothermal model, and the emission rate of
To appear in Enceladus and the Icy Moons of Saturn (P. M. Schenk et al., eds.). University of
Arizona Press, Tucson, AZ.
23
water vapor from the plume. A value of 200 kg/s (11,000 mol/s) is adopted for the latter
quantity (Hansen et al., 2011).
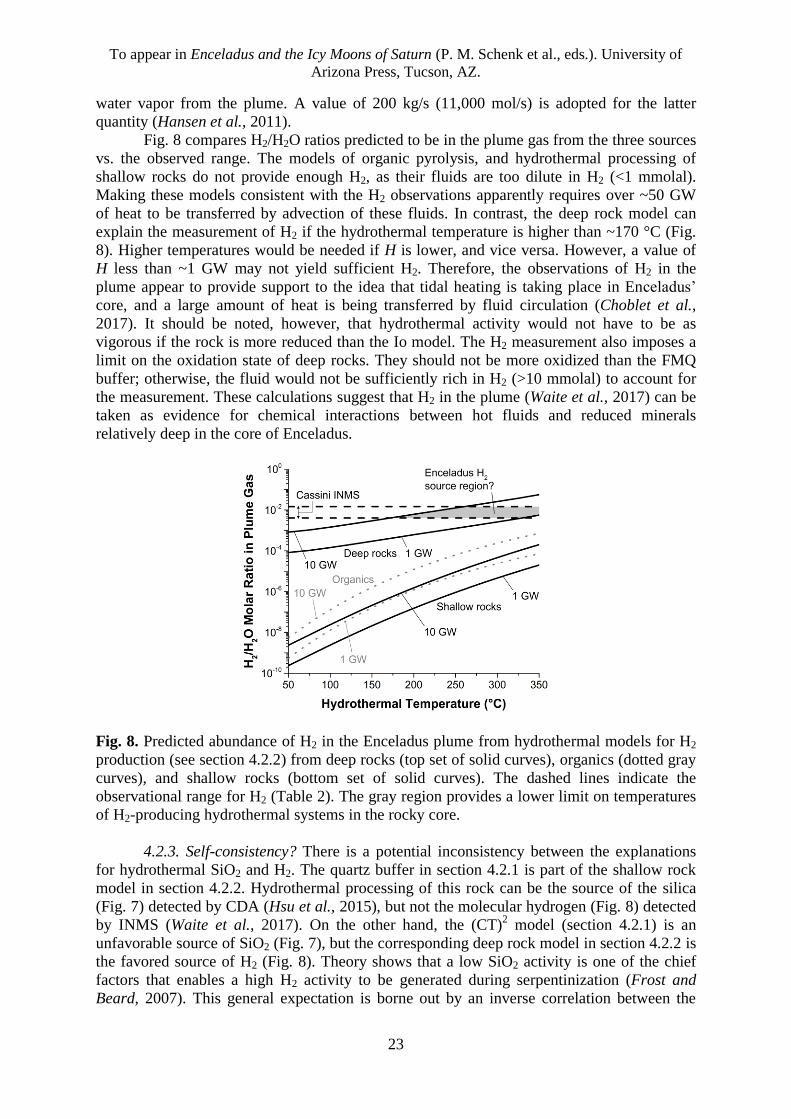
Fig. 8 compares H2/H2O ratios predicted to be in the plume gas from the three sources
vs. the observed range. The models of organic pyrolysis, and hydrothermal processing of
shallow rocks do not provide enough H2, as their fluids are too dilute in H2 (<1 mmolal).
Making these models consistent with the H2 observations apparently requires over ~50 GW
of heat to be transferred by advection of these fluids. In contrast, the deep rock model can
explain the measurement of H2 if the hydrothermal temperature is higher than ~170 °C (Fig.
8). Higher temperatures would be needed if H is lower, and vice versa. However, a value of
H less than ~1 GW may not yield sufficient H2. Therefore, the observations of H2 in the
plume appear to provide support to the idea that tidal heating is taking place in Enceladus’
core, and a large amount of heat is being transferred by fluid circulation (Choblet et al.,
2017). It should be noted, however, that hydrothermal activity would not have to be as
vigorous if the rock is more reduced than the Io model. The H2 measurement also imposes a
limit on the oxidation state of deep rocks. They should not be more oxidized than the FMQ
buffer; otherwise, the fluid would not be sufficiently rich in H2 (>10 mmolal) to account for
the measurement. These calculations suggest that H2 in the plume (Waite et al., 2017) can be
taken as evidence for chemical interactions between hot fluids and reduced minerals
relatively deep in the core of Enceladus.
Fig. 8. Predicted abundance of H2 in the Enceladus plume from hydrothermal models for H2
production (see section 4.2.2) from deep rocks (top set of solid curves), organics (dotted gray
curves), and shallow rocks (bottom set of solid curves). The dashed lines indicate the
observational range for H2 (Table 2). The gray region provides a lower limit on temperatures
of H2-producing hydrothermal systems in the rocky core.
4.2.3. Self-consistency? There is a potential inconsistency between the explanations
for hydrothermal SiO2 and H2. The quartz buffer in section 4.2.1 is part of the shallow rock
model in section 4.2.2. Hydrothermal processing of this rock can be the source of the silica
(Fig. 7) detected by CDA (Hsu et al., 2015), but not the molecular hydrogen (Fig. 8) detected
by INMS (Waite et al., 2017). On the other hand, the (CT)2 model (section 4.2.1) is an
unfavorable source of SiO2 (Fig. 7), but the corresponding deep rock model in section 4.2.2 is
the favored source of H2 (Fig. 8). Theory shows that a low SiO2 activity is one of the chief
factors that enables a high H2 activity to be generated during serpentinization (Frost and
Beard, 2007). This general expectation is borne out by an inverse correlation between the
To appear in Enceladus and the Icy Moons of Saturn (P. M. Schenk et al., eds.). University of
Arizona Press, Tucson, AZ.
24
concentrations of H2 and Si in ultramafic hosted hydrothermal fluids (Seyfried et al., 2011).
In our modeling, one rock needs to be invoked to explain the SiO2 observation, while the
other rock is required to explain the H2 observation; neither rock can explain both
observations. What does this mean?
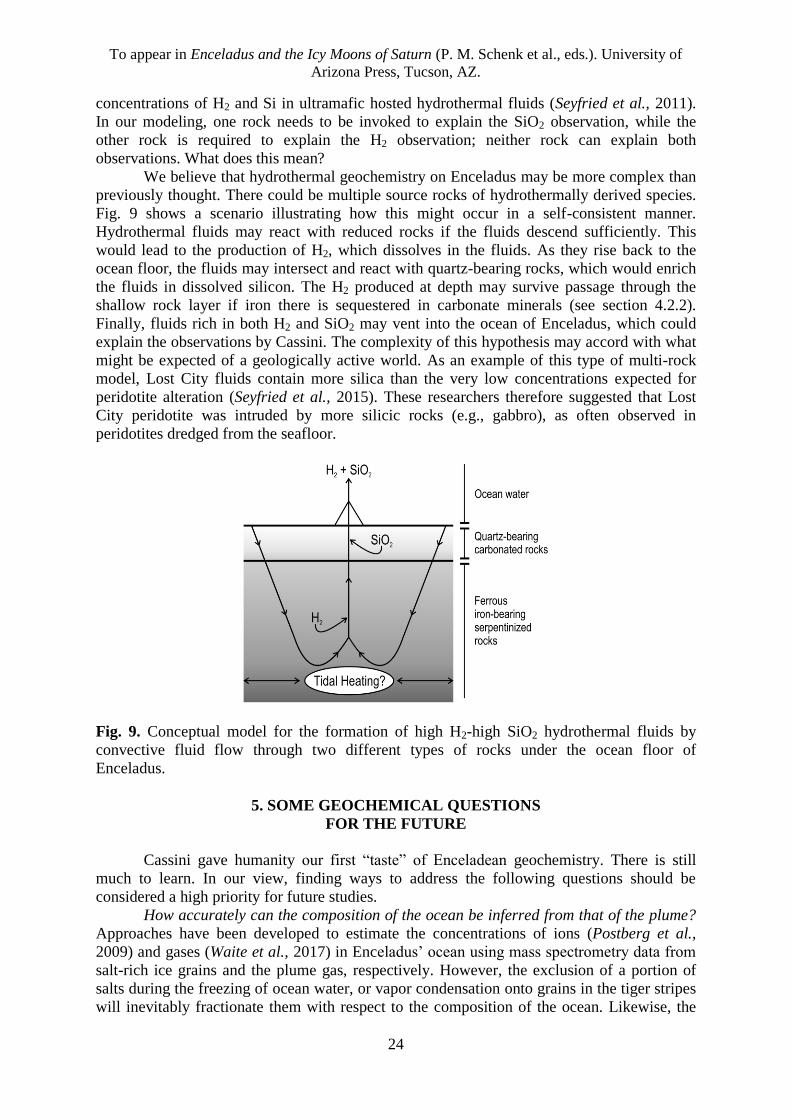
We believe that hydrothermal geochemistry on Enceladus may be more complex than
previously thought. There could be multiple source rocks of hydrothermally derived species.
Fig. 9 shows a scenario illustrating how this might occur in a self-consistent manner.
Hydrothermal fluids may react with reduced rocks if the fluids descend sufficiently. This
would lead to the production of H2, which dissolves in the fluids. As they rise back to the
ocean floor, the fluids may intersect and react with quartz-bearing rocks, which would enrich
the fluids in dissolved silicon. The H2 produced at depth may survive passage through the
shallow rock layer if iron there is sequestered in carbonate minerals (see section 4.2.2).
Finally, fluids rich in both H2 and SiO2 may vent into the ocean of Enceladus, which could
explain the observations by Cassini. The complexity of this hypothesis may accord with what
might be expected of a geologically active world. As an example of this type of multi-rock
model, Lost City fluids contain more silica than the very low concentrations expected for
peridotite alteration (Seyfried et al., 2015). These researchers therefore suggested that Lost
City peridotite was intruded by more silicic rocks (e.g., gabbro), as often observed in
peridotites dredged from the seafloor.
Fig. 9. Conceptual model for the formation of high H2-high SiO2 hydrothermal fluids by
convective fluid flow through two different types of rocks under the ocean floor of
Enceladus.
5. SOME GEOCHEMICAL QUESTIONS
FOR THE FUTURE
Cassini gave humanity our first “taste” of Enceladean geochemistry. There is still
much to learn. In our view, finding ways to address the following questions should be
considered a high priority for future studies.
How accurately can the composition of the ocean be inferred from that of the plume?
Approaches have been developed to estimate the concentrations of ions (Postberg et al.,
2009) and gases (Waite et al., 2017) in Enceladus’ ocean using mass spectrometry data from
salt-rich ice grains and the plume gas, respectively. However, the exclusion of a portion of
salts during the freezing of ocean water, or vapor condensation onto grains in the tiger stripes
will inevitably fractionate them with respect to the composition of the ocean. Likewise, the
To appear in Enceladus and the Icy Moons of Saturn (P. M. Schenk et al., eds.). University of
Arizona Press, Tucson, AZ.
25
gas composition could be fractionated between the ocean and plume by adsorption on ice, or
clathrate formation (Bouquet et al., 2015) or decomposition (Kieffer et al., 2006; Fortes,
2007). We do not know at present how large these effects might be, nor their dependence on
the physical properties of individual species. This necessitates a deeper understanding of how
the dynamics of plume formation influences its composition (see the chapter by Goldstein et
al. in this volume). One path forward is to build a plume-in-the-lab to investigate the plume’s
dynamical effects.
What are the concentrations of minor species in the ocean? A first step is to set upper
limits on currently undetected ions using plume or E ring data from Cassini CDA. Such
constraints would be geochemically useful. Important species that have yet to be quantified
include Ca+2
, Mg+2
, and SO4–2
. Both Ca+2
and Mg+2
would provide information on mineral
controls (e.g., carbonates) of ocean composition, while SO4–2
could serve as a tracer of
oxidant production or delivery to the ocean. A direct measurement of the concentration of
silica in ice grains from the plume (Hsu et al., 2015) should be a high priority. This could be
used to evaluate the saturation indices of different silicate minerals in contact with
Enceladus’ ocean. A wet chemistry laboratory on a south polar lander could allow silica and
other aqueous species to be measured.
What is the detailed redox chemistry of the ocean? Enceladus appears to have a
relatively reduced ocean as H2, NH3, and CH4 are abundant in the plume gas (Table 2).
However, CO2 is also present and the CO2-CH4 couple is apparently out of equilibrium with
the H2O-H2 couple (Waite et al., 2017). Because there is geophysical activity to drive fluid
mixing, other redox couples can be expected to be maintained in disequilibrium states in a
cold ocean. This is vital for establishing the availability of chemical energy sources that could
support life. How can we address this fundamental question? Firstly, we should corroborate
that the ocean is indeed reduced. CH4, NH3, and H2 could be remeasured at slower flyby
speeds (<5 km/s) to ensure that they are not produced from ice grain impacts on spacecraft
instrumentation (Waite et al., 2009). A complementary suite of reduced species are
recommended to be measured in salt-rich plume particles, which could include Fe+2
and
formate (HCOO–). Secondly, our knowledge of redox disequilibria in the Enceladus ocean
would be revolutionized if a comprehensive survey of gaseous and ionic H, O, C, N, and S
species in the plume is performed.
Are there gradients in the composition of the ocean or the rocky core? Degassing
could make the top of the ocean compositionally distinct (e.g., higher pH, lower H2) from
lower layers. Heterogeneous heating could create complex patterns of fluid flow that result in
a redistribution of chemical elements. The development of coupled geophysical-geochemical
models of reactive transport inside Enceladus would help the scientific community to better
understand the consequences of such processes. For example, a rigorous assessment of the
hypothesis outlined in section 4.2.3 requires quantitative results for the compositional
evolution of both fluids and rocks as fluid parcels interact with rocks along reaction paths
underneath the ocean floor (McCollom and Shock, 1998). Detailed geophysical modeling of
both hydrothermal (Choblet et al., 2017) and ocean circulation is needed to constrain rates of
mixing and thus residence times of fluids in different geochemical environments on
Enceladus. Modeling studies of these types offer opportunities for testing, refining, and
differentiating between competing hypotheses. They therefore represent an important bridge
between Cassini and plans to design future missions to Enceladus (see the chapter by Lunine et
al. in this volume). What geochemical evolutionary pathway did Enceladus take? The bulk composition
of rocks accreted by Enceladus is commonly assumed to have been similar to that of CI
chondrites, and Enceladus might have accreted volatiles in proportions similar to those in
some comets (see the chapter by McKinnon et al. in this volume). It is still an open question as
To appear in Enceladus and the Icy Moons of Saturn (P. M. Schenk et al., eds.). University of
Arizona Press, Tucson, AZ.
26
to how an initial mixture of chondritic rock and cometary ices (Zolotov, 2012) relates to the
current composition of Enceladus as summarized in this chapter. To obtain insights into the
formation conditions and accreted composition of Enceladus, additional cosmochemical data
from Enceladus are needed, such as a more precise value for the D/H ratio in H2O (Waite et
al., 2009), a value for the 15
N/14
N ratio in NH3, the abundances of primordial noble gases, and
triple oxygen isotope (18
O/16
O, 17
O/16
O) measurements in samples of water ice from the
plume. Considerable progress toward understanding the history of Enceladus could be made
by elucidating the specific reactions and processes that would link plausible models of
Enceladus’ initial composition to its present geochemical state. Geochemical mass transfer
modeling should be performed to learn what can happen if initial mixtures of frozen volatiles
and ultramafic rocks were subjected to heating, water-rock separation, fluid circulation, and
outgassing from the plume. Can the ocean floor really become heavily carbonated? How
would Fe(II) and Fe(III) partition among minerals, and what are the implications for H2
production during serpentinization?
How representative are thermodynamic models of water-rock interaction for
conditions relevant to Enceladus? We would like to advocate for experimental work that
could be done to assess if chemical equilibrium is an appropriate assumption for aqueous
solutions and altered rocks inside Enceladus. Neveu et al. (2017) took a step in this direction
by comparing chemical equilibrium predictions to literature results from hydrothermal
experiments with olivine or basalt. They found general agreement in the solid and fluid
compositions, but the error in the predicted pH for the basalt experiments was ~1 unit. This
may reflect inaccuracies in the thermodynamic properties of clay minerals in existing
databases. Further comparisons between models and experiments may suggest strategies for
improving the models. As a next step, it would help if such comparisons are made for
volatile-rich chondritic compositions (e.g., a melted lab-made comet), particularly at
temperatures closer to 0 °C.
What new observations can be made to test for hydrothermal activity? The
observations of SiO2 and H2 made by the Cassini spacecraft represent the first recognized
indications of hydrothermal geochemistry (Hsu et al., 2015; Waite et al., 2017). Additional
complementary data are desired, and their promise beckons us to go back to Enceladus. We
should search for other chemical species (e.g., H2S, CO) that may exhibit anomalous
enrichments in the plume, consistent with the presence of fluids that are hot and reduced. A
defining feature of hydrothermal activity is an elevated temperature relative to the ambient
environment. Specific constraints on temperatures of core fluids on Enceladus can be
obtained using tools of geothermometry, including isotopic ratios in simple volatiles (e.g.,
H2-H2O; Horibe and Craig, 1995), ratios of certain organic compounds (e.g.,
ethylene/ethane; Seewald, 1994), and “clumping” of rare isotopes (e.g., 13
CH3D; Stolper et
al., 2014). Measurements of radiogenic (mainly rock-derived) noble gases (primarily 40
Ar
and 4He) are also recommended as indicators of the extent and vigor of hydrothermal
transport from the core to the hydrosphere.
What is the organic geochemistry of Enceladus? Data from both INMS and CDA
show that the plume contains organic materials (Waite et al., 2009; Postberg et al., 2017).
This is consistent with the association of an organic spectral signature with the tiger stripes
(Brown et al., 2006). The organic molecules detected by CDA are massive, rich in
unsaturated carbon atoms in the form of unfused benzene rings, contain O- or N-bearing
groups, and are probably phase-separated as solids from ocean water (Postberg et al., 2017).
At high spacecraft flyby velocities (>14 km/s), these molecules at least partially decompose
to the smaller unsaturated molecules observed by INMS (Waite et al., 2009). What is the
origin of Enceladus’ organic matter? Possibilities include accreted materials analogous to
insoluble organic matter in chondrites (Alexander et al., 2007); hydrothermal synthesis from
To appear in Enceladus and the Icy Moons of Saturn (P. M. Schenk et al., eds.). University of
Arizona Press, Tucson, AZ.
27
small molecule precursors such as CO2, HCN, formaldehyde, or methanol; and biological
carbon fixation (see the chapter by McKay et al. in this volume). We emphasize that
composition is the key to origin. Clues are needed in the form of measurements of the
elemental and isotopic compositions of the particulate organic matter, as well as its functional
group chemistry and structure. Pyrolysis-gas chromatography-mass spectrometry of south
polar surface samples would be useful in this respect. We are also in need of detailed
compositional characterizations of hydrocarbon gases (Waite et al., 2009), and forms of
dissolved organic carbon (e.g., fatty and amino acids) that may be present in the plume. Only
with a more complete data set will we be able to arrive at an integrated understanding of the
geochemistry of Enceladus.
Acknowledgements. C.R.G. is grateful to J. Baross, M. Cable, J. Castillo-Rogez, F.
Klein, J. Lunine, W. McKinnon, K. Miller, C. Porco, K. Rogers, E. Shock, N. Sleep, and H.
Waite for numerous discussions on the geochemistry of Enceladus. C.R.G. wishes to express
his appreciation to M. Zolotov for giving him a copy of the GEOCHEQ code. C.R.G. would
also like to give thanks to the organizers of the 2nd Ocean Worlds meeting at Woods Hole,
where some of the new ideas in this chapter were first presented. J. Dao and R. Menchaca
deserve recognition for their assistance in the preparation of Figs. 1 and 9. The work of
C.R.G. was supported by the Cassini project (NAS703001TONMO711123). F.P.
acknowledges funding from the German Research Foundation (DFG projects PO 1015/2-1,
/3-1, /4-1), and the European Research Council (ERC Grant 724908). S.D.V.’s contribution
was supported by the Icy Worlds node of NASA's Astrobiology Institute (13-13NAI7_2-
0024). His part of the research was carried out at the Jet Propulsion Laboratory, California
Institute of Technology, under a contract with the National Aeronautics and Space
Administration.
REFERENCES
Alexander C. M. O’D., et al. (2007) The origin and evolution of chondrites recorded in the
elemental and isotopic compositions of their macromolecular organic matter.
Geochim. Cosmochim. Acta, 71, 4380-4403.
Anderson G. M. (2005) Thermodynamics of Natural Systems, Second Edition. Cambridge
University Press, Cambridge, UK. 648 pp.
Bardyn A., et al. (2017) Carbon-rich dust in comet 67P/Churyumov-Gerasimenko measured
by COSIMA/Rosetta. Mon. Not. R. Astron. Soc., 469, S712-S722.
Běhounková M., et al. (2012) Tidally-induced melting events as the origin of south-pole
activity on Enceladus. Icarus, 219, 655-664.
Bethke C. M. (2008) Geochemical and Biogeochemical Reaction Modeling, Second Edition.
Cambridge University Press, New York, NY. 543 pp.
Beuthe M., et al. (2016) Enceladus’s and Dione’s floating ice shells supported by minimum
stress isostasy. Geophys. Res. Lett., 43, 10,088-10,096.
Bouquet A., et al. (2015) Possible evidence for a methane source in Enceladus’ ocean.
Geophys. Res. Lett., 42, 1334-1339.
Bouquet A., et al. (2017) Alternative energy: Production of H2 by radiolysis of water in the
rocky cores of icy bodies. Astrophys. J. Lett., 840, L8, http://doi.org/10.3847/2041-
8213/aa6d56.
Brearley A. J. (2006) The action of water. In Meteorites and the Early Solar System II (D. S.
Lauretta and H. Y. McSween, eds.), pp. 587-624. University of Arizona Press,
Tucson, AZ.
To appear in Enceladus and the Icy Moons of Saturn (P. M. Schenk et al., eds.). University of
Arizona Press, Tucson, AZ.
28
Brown R. H., et al. (2006) Composition and physical properties of Enceladus’ surface.
Science, 311, 1425-1428.
Buchardt B., et al. (1997) Submarine columns of ikaite tufa. Nature, 390, 129-130.
Buchardt B., et al. (2001) Ikaite tufa towers in Ikka Fjord, southwest Greenland: Their
formation by mixing of seawater and alkaline spring water. J. Sediment. Res., 71, 176-
189.
Bucher K., et al. (2015) Weathering crusts on peridotite. Contrib. Mineral. Petrol., 169, 52,
doi:10.1007/s00410-015-1146-3.
Čadek O., et al. (2016) Enceladus’s internal ocean and ice shell constrained from Cassini
gravity, shape, and libration data. Geophys. Res. Lett., 43, 5653-5660.
Choblet G., et al. (2017) Powering prolonged hydrothermal activity inside Enceladus. Nat.
Astron., 1, 841-847.
Collins G. C. and Goodman J. C. (2007) Enceladus’ south polar sea. Icarus, 189, 72-82.
Drever J. I. (1997) The Geochemistry of Natural Waters: Surface and Groundwater
Environments, Third Edition. Prentice Hall, Upper Saddle River, NJ. 436 pp.
Ehlmann B. L., et al. (2013) Geochemical consequences of widespread clay mineral
formation in Mars’ ancient crust. Space Sci. Rev., 174, 329-364.
Fortes A. D. (2007) Metasomatic clathrate xenoliths as a possible source for the south polar
plumes of Enceladus. Icarus, 191, 743-748.
Fournier R. O. and Rowe J. J. (1966) Estimation of underground temperatures from the silica
content of water from hot springs and wet-steam wells. Am. J. Sci., 264, 685-697.
Frost B. R. (1991) Introduction to oxygen fugacity and its petrologic importance. Rev.
Mineral. Geochem., 25, 1-9.
Frost B. R. and Beard J. S. (2007) On silica activity and serpentinization. J. Petrol., 48, 1351-
1368.
German C. R. and Seyfried W. E. (2014) Hydrothermal processes. In Treatise on
Geochemistry, Second Edition, Volume 8 (M. J. Mottl and H. Elderfield, eds.), pp.
191-233. Elsevier Science, Amsterdam, Netherlands.
Glein C. R. (2015) Noble gases, nitrogen, and methane from the deep interior to the
atmosphere of Titan. Icarus, 250, 570-586.
Glein C. R. and Shock E. L. (2010) Sodium chloride as a geophysical probe of a subsurface
ocean on Enceladus. Geophys. Res. Lett., 37, L09204, doi:10.1029/2010GL042446.
Glein C. R., et al. (2008) The oxidation state of hydrothermal systems on early Enceladus.
Icarus, 197, 157-163.
Glein C. R., et al. (2015) The pH of Enceladus’ ocean. Geochim. Cosmochim. Acta, 162, 202-
219.
Haff P. K., et al. (1983) Ring and plasma: The enigmae of Enceladus. Icarus, 56, 426-438.
Hansen C. J., et al. (2006) Enceladus’ water vapor plume. Science, 311, 1422-1425.
Hansen C. J., et al. (2008) Water vapour jets inside the plume of gas leaving Enceladus.
Nature, 456, 477-479.
Hansen C. J., et al. (2011) The composition and structure of the Enceladus plume. Geophys.
Res. Lett., 38, L11202, doi:10.1029/2011GL047415.
Helgeson H. C., et al. (1978) Summary and critique of the thermodynamic properties of rock-
forming minerals. Am. J. Sci., 278-A, 1-229.
Hendrix A. R., et al. (2010) The ultraviolet reflectance of Enceladus: Implications for surface
composition. Icarus, 206, 608-617.
Horibe Y. and Craig H. (1995) D/H fractionation in the system methane-hydrogen-water.
Geochim. Cosmochim. Acta, 59, 5209-5217.
Hsu H-W., et al. (2011) Stream particles as the probe of the dust-plasma magnetosphere
interaction at Saturn. J. Geophys. Res., 116, A09215, doi:10.1029/2011JA016488.
To appear in Enceladus and the Icy Moons of Saturn (P. M. Schenk et al., eds.). University of
Arizona Press, Tucson, AZ.
29
Hsu H-W., et al. (2015) Ongoing hydrothermal activities within Enceladus. Nature, 519, 207-
210.
Iess L., et al. (2014) The gravity field and interior structure of Enceladus. Science, 344, 78-
80.
Ingersoll A. P. and Nakajima M. (2016) Controlled boiling on Enceladus. 2. Model of the
liquid-filled cracks. Icarus, 272, 319-326.
Ingersoll A. P. and Pankine A. A. (2010) Subsurface heat transfer on Enceladus: Conditions
under which melting occurs. Icarus, 206, 594-607.
Jones B. F., et al. (1977) Hydrochemistry of the Lake Magadi basin, Kenya. Geochim.
Cosmochim. Acta, 41, 53-72.
Kelley D. S., et al. (2001) An off-axis hydrothermal vent field near the Mid-Atlantic Ridge at
30° N. Nature, 412, 145-149.
Kelley D. S., et al. (2005) A serpentinite-hosted ecosystem: The Lost City hydrothermal field.
Science, 307, 1428-1434.
Kempf S., et al. (2005) Composition of Saturnian stream particles. Science, 307, 1274-1276.
Kieffer S. W., et al. (2006) A clathrate reservoir hypothesis for Enceladus’ south polar plume.
Science, 314, 1764-1766.
Kite E. S. and Rubin A. M. (2016) Sustained eruptions on Enceladus explained by turbulent
dissipation in tiger stripes. Proc. Natl. Acad. Sci. USA, 113, 3972-3975.
Klein F. and Garrido C. J. (2011) Thermodynamic constraints on mineral carbonation of
serpentinized peridotite. Lithos, 126, 147-160.
Lowell R. P. and DuBose M. (2005) Hydrothermal systems on Europa. Geophys. Res. Lett.,
32, L05202, doi:10.1029/2005GL022375.
Lowenstein T. K., et al. (2014) The geologic history of seawater. In Treatise on
Geochemistry, Second Edition, Volume 8 (M. J. Mottl and H. Elderfield, eds.), pp.
569-622. Elsevier Science, Amsterdam, Netherlands.
Malamud U. and Prialnik D. (2016) A 1-D evolutionary model for icy satellites, applied to
Enceladus. Icarus, 268, 1-11.
Marion G. M., et al. (2012) Modeling ammonia-ammonium aqueous chemistries in the Solar
System’s icy bodies. Icarus, 220, 932-946.
Matson D. L., et al. (2007) Enceladus’ plume: Compositional evidence for a hot interior.
Icarus, 187, 569-573.
Matson D. L., et al. (2012) Enceladus: A hypothesis for bringing both heat and chemicals to
the surface. Icarus, 221, 53-62.
Matson D. L., et al. (2018) Enceladus’ near-surface CO2 gas pockets and surface frost
deposits. Icarus, 302, 18-26.
McCollom T. M. and Shock E. L. (1998) Fluid-rock interactions in the lower oceanic crust:
Thermodynamic models of hydrothermal alteration. J. Geophys. Res., 103, 547-575.
McKay C. P., et al. (2008) The possible origin and persistence of life on Enceladus and
detection of biomarkers in the plume. Astrobiology, 8, 909-919.
McKinnon W. B. (2015) Effect of Enceladus’s rapid synchronous spin on interpretation of
Cassini gravity. Geophys. Res. Lett., 42, 2137-2143.
Médard E. and Kiefer W. S. (2017) Differentiation of water-rich planetary bodies:
Dehydration, magmatism and water storage. In Lunar and Planetary Science XLVIII,
Abstract #2749. Lunar and Planetary Institute, Houston.
Millero F. J. (2013) Chemical Oceanography, Fourth Edition. CRC Press, Boca Raton, FL.
591 pp.
Morrill P. L., et al. (2013) Geochemistry and geobiology of a present-day serpentinization
site in California: The Cedars. Geochim. Cosmochim. Acta, 109, 222-240.
To appear in Enceladus and the Icy Moons of Saturn (P. M. Schenk et al., eds.). University of
Arizona Press, Tucson, AZ.
30
Murray A. E., et al. (2012) Microbial life at -13 °C in the brine of an ice-sealed Antarctic
lake. Proc. Natl. Acad. Sci. USA, 109, 20,626-20,631.
Nakajima M. and Ingersoll A. P. (2016) Controlled boiling on Enceladus. 1. Model of the
vapor-driven jets. Icarus, 272, 309-318.
Neveu M., et al. (2015) Prerequisites for explosive cryovolcanism on dwarf planet-class
Kuiper belt objects. Icarus, 246, 48-64.
Neveu M., et al. (2017) Aqueous geochemistry in icy world interiors: Equilibrium fluid, rock,
and gas compositions, and fate of antifreezes and radionuclides. Geochim.
Cosmochim. Acta, 212, 324-371.
Niles P. B., et al. (2013) Geochemistry of carbonates on Mars: Implications for climate
history and nature of aqueous environments. Space Sci. Rev., 174, 301-328.
Nimmo F., et al. (2007) Shear heating as the origin of the plumes and heat flux on Enceladus.
Nature, 447, 289-291.
Okumura F. and Mimura K. (2011) Gradual and stepwise pyrolyses of insoluble organic
matter from the Murchison meteorite revealing chemical structure and isotopic
distribution. Geochim. Cosmochim. Acta, 75, 7063-7080.
Ootsubo T., et al. (2012) AKARI near-infrared spectroscopic survey for CO2 in 18 comets.
Astrophys. J., 752, 15, doi:10.1088/0004-637X/752/1/15.
Patthoff D. A. and Kattenhorn S. A. (2011) A fracture history on Enceladus provides
evidence for a global ocean. Geophys. Res. Lett., 38, L18201,
doi:10.1029/2011GL048387.
Porco C. C., et al. (2006) Cassini observes the active south pole of Enceladus. Science, 311,
1393-1401.
Porco C., et al. (2014) How the geysers, tidal stresses, and thermal emission across the south
polar terrain of Enceladus are related. Astron. J., 148, 45, doi:10.1088/0004-
6256/148/3/45.
Postberg F., et al. (2008) The E-ring in the vicinity of Enceladus: II. Probing the moon’s
interior – The composition of E-ring particles. Icarus, 193, 438-454.
Postberg F., et al. (2009) Sodium salts in E-ring ice grains from an ocean below the surface of
Enceladus. Nature, 459, 1098-1101.
Postberg F., et al. (2011) A salt-water reservoir as the source of a compositionally stratified
plume on Enceladus. Nature, 474, 620-622.
Postberg F., et al. (2017) Complex organic macromolecular compounds in ice grains from
Enceladus. In Lunar and Planetary Science XLVIII, Abstract #1401. Lunar and
Planetary Institute, Houston.
Schmidt J., et al. (2008) Slow dust in Enceladus’ plume from condensation and wall
collisions in tiger stripe fractures. Nature, 451, 685-688.
Schubert G., et al. (2007) Enceladus: Present internal structure and differentiation by early
and long-term radiogenic heating. Icarus, 188, 345-355.
Seewald J. S. (1994) Evidence for metastable equilibrium between hydrocarbons under
hydrothermal conditions. Nature, 370, 285-287.
Sekine Y., et al. (2015) High-temperature water-rock interactions and hydrothermal
environments in the chondrite-like core of Enceladus. Nat. Commun., 6, 8604,
doi:10.1038/ncomms9604.
Seyfried W. E., et al. (2011) Vent fluid chemistry of the Rainbow hydrothermal system
(36°N, MAR): Phase equilibria and in situ pH controls on subseafloor alteration
processes. Geochim. Cosmochim. Acta, 75, 1574-1593.
Seyfried W. E., et al. (2015) The Lost City hydrothermal system: Constraints imposed by
vent fluid chemistry and reaction path models on subseafloor heat and mass transfer
processes. Geochim. Cosmochim. Acta, 163, 59-79.
To appear in Enceladus and the Icy Moons of Saturn (P. M. Schenk et al., eds.). University of
Arizona Press, Tucson, AZ.
31
Shock E. L. and McKinnon W. B. (1993) Hydrothermal processing of cometary volatiles –
Applications to Triton. Icarus, 106, 464-477.
Shock E. L., et al. (1989) Calculation of the thermodynamic and transport properties of
aqueous species at high pressures and temperatures: Standard partial molal properties
of inorganic neutral species. Geochim. Cosmochim. Acta, 53, 2157-2183.
Smith H. T., et al. (2008) Enceladus: A potential source of ammonia products and molecular
nitrogen for Saturn’s magnetosphere. J. Geophys. Res., 113, A11206,
doi:10.1029/2008JA013352.
Spencer J. R., et al. (2006) Cassini encounters Enceladus: Background and the discovery of a
south polar hot spot. Science, 311, 1401-1405.
Squyres S. W., et al. (1983) The evolution of Enceladus. Icarus, 53, 319-331.
Stolper D. A., et al. (2014) Formation temperatures of thermogenic and biogenic methane.
Science, 344, 1500-1503.
Streit E., et al. (2012) Coexisting serpentine and quartz from carbonate-bearing serpentinized
peridotite in the Samail Ophiolite, Oman. Contrib. Mineral. Petrol., 164, 821-837.
Thomas P. C., et al. (2016) Enceladus’s measured physical libration requires a global
subsurface ocean. Icarus, 264, 37-47.
Tillner-Roth R. and Friend D. G. (1998) A Helmholtz free energy formulation of the
thermodynamic properties of the mixture {water + ammonia}. J. Phys. Chem. Ref.
Data, 27, 63-96.
Tobie G., et al. (2008) Solid tidal friction above a liquid water reservoir as the origin of the
south pole hotspot on Enceladus. Icarus, 196, 642-652.
Tracy R. J. and Frost B. R. (1991) Phase equilibria and thermobarometry of calcareous,
ultramafic and mafic rocks, and iron formations. Rev. Mineral. Geochem., 26, 207-
289.
Travis B. J. and Schubert G. (2015) Keeping Enceladus warm. Icarus, 250, 32-42.
Turcotte D. L. and Schubert G. (2002) Geodynamics, Second Edition. Cambridge University
Press, New York, NY. 472 pp.
Ueda H., et al. (2016) Reactions between komatiite and CO2-rich seawater at 250 and 350 °C,
500 bars: Implications for hydrogen generation in the Hadean seafloor hydrothermal
system. Prog. Earth Planet. Sci., 3, 35, doi:10.1186/s40645-016-0111-8. Vance S., et al. (2007) Hydrothermal systems in small ocean planets. Astrobiology, 7, 987-
1005. Vance S., et al. (2014) Ganymede’s internal structure including thermodynamics of
magnesium sulfate oceans in contact with ice. Planet. Space Sci., 96, 62-70. Vance S. D., et al. (2016) Geophysical controls of chemical disequilibria in Europa. Geophys.
Res. Lett., 43, 4871-4879. Von Damm K. L., et al. (1985) Chemistry of submarine hydrothermal solutions at 21°N, East
Pacific Rise. Geochim. Cosmochim. Acta, 49, 2197-2220.
Wagner W. and Pruß A. (2002) The IAPWS formulation 1995 for the thermodynamic
properties of ordinary water substance for general and scientific use. J. Phys. Chem.
Ref. Data, 31, 387-535.
Waite J. H., et al. (2006) Cassini Ion and Neutral Mass Spectrometer: Enceladus plume
composition and structure. Science, 311, 1419-1422.
Waite J. H., et al. (2009) Liquid water on Enceladus from observations of ammonia and 40
Ar
in the plume. Nature, 460, 487-490.
Waite J. H., et al. (2017) Cassini finds molecular hydrogen in the Enceladus plume: Evidence
for hydrothermal processes. Science, 356, 155-159.
Wand U., et al. (1997) Evidence for physical and chemical stratification in Lake Untersee
(central Dronning Maud Land, East Antarctica). Antarct. Sci., 9, 43-45.
To appear in Enceladus and the Icy Moons of Saturn (P. M. Schenk et al., eds.). University of
Arizona Press, Tucson, AZ.
32
Zolotov M. Y. (2007) An oceanic composition on early and today’s Enceladus. Geophys. Res.
Lett., 34, L23203, doi:10.1029/2007GL031234.
Zolotov M. Y. (2012) Aqueous fluid composition in CI chondritic materials: Chemical
equilibrium assessments in closed systems. Icarus, 220, 713-729.
Zolotov M. Y. (2017) Aqueous origins of bright salt deposits on Ceres. Icarus, 296, 289-304.
Zolotov M. Y. and Fegley B. (2000) Eruption conditions of Pele volcano on Io inferred from
chemistry of its volcanic plume. Geophys. Res. Lett., 27, 2789-2792.
Zolotov M. Y. and Postberg F. (2014) Can nano-phase silica originate from chondritic fluids?
The application to Enceladus’ SiO2 particles. In Lunar and Planetary Science XLV,
Abstract #2496. Lunar and Planetary Institute, Houston.