Embed Size (px)
Citation preview
Marisa JacottCyrus Reed, T
Mark Winfield, Canadian I
44 East Aven512.474.
tcps@texas
The Generation and Management of Hazardous Wastes and Transboundary Hazardous Waste Shipments
between Mexico, Canada and the United States, 1990-2000
Prepared by:
, La Neta: Proyecto Emisiones exas Center for Policy Studies nstitute for Environmental Law and Policy
May 2001
ue, Suite 306 * Austin Texas 78701 0811 phone 512.474.7846 fax center.org * www.texascenter.org
The Generation and Management of Hazardous Wastes and Transboundary Hazardous Waste Shipments between Mexico, Canada and the United States, 1990-2000
2
Table of Contents Executive Summary
3
I. Introduction
4
II. Pre-Liberalization Base Case (Pre-1994) (summary only)
5
III. Connection to NAFTA
7
IV. 1994 Onwards: Post-Liberalization?
11
V. Assessment/Explanation
53
VI. Summary and Conclusions
63
VII. Recommendations
65
Appendix A. Pre-1994 Base Cases
67
Appendix B. Mexico and Chapter 11: Hazardous Wastes and the NAFTA Arbitration Panels
92
References 104 Credits and Acknowledgements An initial version of this report was presented at the Symposium on Understanding the Linkages between Trade and Environment sponsored by the North American Commission on Environmental Cooperation (CEC) in Washington, D.C. on October 11th, 2000. The authors would like to thank the CEC for providing a grant to assist in the preparation of this report. The Texas Center for Policy Studies is grateful for the support of the C.S. Mott Foundation, which made research, preparation and publication of this report possible. Finally, the authors would like to thank their respective employers, TCPS, La Neta: Proyecto Emisiones, and the Canadian Institute for Environmental Law and Policy. The views expressed herein, however, are solely those of the three authors.
The Generation and Management of Hazardous Wastes and Transboundary Hazardous Waste Shipments between Mexico, Canada and the United States, 1990-2000
3
Executive Summary
The paper examines the impacts of NAFTA and trade liberalization on the generation, management and shipments of industrial hazardous wastes in Mexico, Canada and the U.S. The paper looks at whether economic activities in the manufacturing and hazardous waste management industry have become more concentrated in the U.S. –Canada and U.S. –Mexico border. In addition, the paper considers whether hazardous waste is being shipped from one country to another or whether companies are investing in hazardous waste facilities in any country to take advantage of less stringent hazardous waste regulations and enforcement. The paper finds that the available data indicates an ongoing concentration of economic activity, including hazardous waste generation and management in the US-Mexico Border region. In the Canada-U.S. border region, waste generation in Ontario and Quebec has been increasing significantly, particularly in the steel and chemical industries, which are concentrated in the border region, although waste generation in states such as Michigan, Pennsylvania and Wisconsin has declined. In addition, despite the decline in waste generation among the US border states, there has been a dramatic growth in US waste exports to Ontario and Quebec and, in the context of a weakened regulatory environment, a significant increase in disposal capacity in those provinces.
Differences in regulatory requirements related to hazardous waste disposal, specifically the existence of less stringent standards in Ontario and Quebec, have been the key factor in the increase in US hazardous waste exports to Canada. Similarly, the expansion of disposal capacity in these provinces is in part intended to serve the US market, although the bulk of the investments in this capacity is Canadian in origin. The ban on imports of hazardous wastes for final disposal into Mexico limits the economic incentive for the establishment of disposal capacity to deal with imported wastes to take advantage of differences in the regulatory and enforcement regime between Mexico and the US. However, there has been significant US investment through joint ventures in Mexican capacity for the treatment, incineration and disposal of domestically generated wastes, with the market for these services being driven by stronger disposal requirements in Mexico in some cases, as well as “temporary” authorizations without publicly-approved standards in others. In addition, hazardous waste exports of electric arc furnace dust from the U.S. to Mexico have increased due to both price differentials and technological changes in the US which have increased the volume of this particular waste stream. Significant gaps exist in the systems for tracking hazardous waste generation and disposal in all three countries. Reliable data on waste generation in Canada and Mexico is extremely limited, and the reliability of the data regarding transboundary waste movements among the three countries has been seriously questioned. Tracking of transboundary waste movements from “cradle to grave” when the “cradle” is in one country and the “grave” in another is almost impossible. While many of these changes have occurred outside of the NAFTA framework, the NAFTA trade rules have also been identified as a constraint on the ability of countries to adopt higher standards to protect human health and the environment. The outcomes of NAFTA chapter 11 complaints seen in such cases at the ban on MMT in Canada and the Metalclad case in Mexico seem likely to reinforce these directions to the detriment of the health, safety and environment of the citizens of all three NAFTA countries.
The Generation and Management of Hazardous Wastes and Transboundary Hazardous Waste Shipments between Mexico, Canada and the United States, 1990-2000
4
I. Introduction/Context The generation and management of hazardous wastes in the NAFTA-party countries has been a major concern for decades. This paper examines the issue of transboundary shipments of industrial hazardous waste between the NAFTA countries and its relationship to commercial hazardous waste management "sector" of the North American economy.1 The paper focuses on two major hypotheses, often referred to as the "pollution haven" and "race-to-the bottom" hypotheses:
• Is trade and investment liberalization concentrating economic activity (in both manufacturing and the hazardous waste management industry) in areas where it takes place more efficiently, or conversely, where ecological stress is already acute such as the U.S. - Mexico border region and the U.S. Canada-Border Region?
• Are companies in the manufacturing or hazardous waste management sectors relocating
or are they sending hazardous wastes to other areas to take advantage of less stringent hazardous waste regulations or enforcement?
These are essentially questions of whether there has been a scale effect -- whether more hazardous waste is produced and shipped simply because there is a greater amount of economic activity -- or a composition effect --whether there has been a shift in where hazardous waste is generated and ultimately sent -- or indeed, both. Finally, the paper also examines to what extent the parties to NAFTA have established effective mechanisms to monitor and control the generation, transboundary movement and disposal of hazardous wastes in North America. The paper approaches issue of impacts of trade liberalization in four steps. First, the paper presents a pre-NAFTA ‘base case” with respect to government policies, the roles of non-governmental actors, disposal capacity, waste generation and disposal, and transboundary waste traffic. Secondly, it describes the changes introduced through NAFTA and its institutions. Third, the changes with respect to government policies, societal interests, disposal capacity, waste generation and disposal and transboundary traffic since 1994 are outlined. Fourth, possible explanations for these changes, including the impacts of trade liberalization and other factors are reviewed and assessed. Conclusions and recommendations for action by the NAFTA members, both collectively and individually, follow.
1 This paper looks only at the generation, management and shipment of industrial hazardous wastes and does not consider to any great extent other hazardous wastes, such as those generated in mining, petroleum exploration, agriculture, silviculture and – except to some extent in Mexico – medical wastes. Hazardous wastes are defined differently in all three countries, although there is significant overlap.
Among other issues, the paper examines:
• Base Cases in the United States, Canada and Mexico,
• Changes introduced through NAFTA and its institutions,
• Changes in government policies, societal interests, disposal capacity, waste generation and transboundary traffic since 1994.
• An assessment and analysis of those changes.
The Generation and Management of Hazardous Wastes and Transboundary Hazardous Waste Shipments between Mexico, Canada and the United States, 1990-2000
5
II. The Pre-Liberalization Base Case (pre-1994) A summary of the state of hazardous waste generation and management in the United States, Canada and Mexico before 1994 is presented here. The base cases examine issues that are both national and international in scope. For a full analysis see Appendix A. Appendix B contains descriptions of recent cases regarding hazardous wastes in Mexico before NAFTA-related arbitration panels. A. United States In the United States, a comprehensive federal regulatory regime for domestic generation, handling and disposal was established in the 1970s and significantly strengthened between the mid-1980s and mid-1990s. There were some gaps in the regulatory structure as cement and other industries burning hazardous wastes enjoyed significant advantages over other hazardous waste management facilities. Data on total hazardous waste generation prior to 1994 is difficult to assess, due to changes in reporting regime, but the USEPA believes there was a downward trend between 1989 and 1993. Transboundary waste traffic was almost exclusively with Canada and Mexico, although very limited data on waste imports and exports is available for the period prior to the mid 1990s. Hazardous waste was generated throughout the country with significant concentrations in both border regions. A few players, who by 1994 had constructed more than sufficient capacity to treat hazardous waste commercially, dominated the hazardous waste industry. Citizens actively opposed new facilities, stopping several proposed landfills along the U.S. –Mexico border. B. Mexico In Mexico, the 1988 LGEEPA established a basic legislative framework for the management of hazardous wastes. This included a ban on imports of such wastes for storage or final disposal and a requirement that hazardous wastes generated from raw materials temporarily imported into the country through the “maquiladora” or other similar export-promotion programs be exported back to the country of the input’s origin. This provision was also included in the 1983 La Paz Agreement between the U.S. and Mexico and a subsequent agreement in 1986. Some regulations to implement other LGEEPA hazardous waste provisions were adopted in 1993. Little data is available on hazardous waste generation and disposal or transboundary movement of wastes is available prior to the mid-1990s, although is thought that waste generation was growing both in the border region and nationally. The compliance of maquiladora facilities with requirements to return hazardous wastes which they generated to the their owners’ country of origin was generally thought to be poor, although actual data is lacking. At the same time, foreign companies as well as national companies were beginning to explore investment opportunities in Mexico, both for the incineration and disposal of hazardous wastes. Citizens began to become involved in campaigns to pressure government to enforce environmental laws and to prevent the opening of new hazardous waste facilities, but had few legal remedies under Mexico law. C. Canada In Canada, a basic regulatory regime for the management of hazardous wastes was established in 1970s and 1980s by all of the provinces. The role of the federal government was limited to the
The Generation and Management of Hazardous Wastes and Transboundary Hazardous Waste Shipments between Mexico, Canada and the United States, 1990-2000
6
regulation of hazardous waste imports and exports. The available data on domestic hazardous waste generation and disposal is very limited, but generally indicates that waste generation tracked the overall level of economic activity closely. Until the mid-1990s hazardous waste imports were relatively stable, while exports increased significantly in late 80’s and early 1990s. Hazardous waste imports and exports were almost entirely limited to traffic between the provinces of Ontario and Quebec and the United States. Hazardous waste disposal capacity in Canada was very limited, with only a few commercial facilities operating in Ontario and Quebec, and those largely dating from 1960s. Various provincial efforts to establish additional disposal capacity in the 1980’ s met with mixed results in face of strong public opposition, although new facilities were established in Swan Hills Alberta and Blainville, Quebec.
The Generation and Management of Hazardous Wastes and Transboundary Hazardous Waste Shipments between Mexico, Canada and the United States, 1990-2000
7
III. Connection to NAFTA One of the questions people have concerning the generation and management of hazardous waste today is how these activities are connected to NAFTA and whether NAFTA limits or encourages the transboundary shipments of hazardous waste. This section outlines how rule changes and institutions created by NAFTA are related to the generation and management of hazardous waste.
A. Rule Changes Under NAFTA rules, hazardous waste is treated as a good, but transboundary shipments can be restricted because of provisions in the GATT and because NAFTA incorporates laws established by previous agreements. These allowances are embodied in the general provisions of NAFTA, in specific articles of NAFTA and in the North American Agreement for Environmental Cooperation. 1. General Provisions of NAFTA Chapter 3 of the NAFTA sets out requirements for the “national treatment” of goods. Article 309 specifically provides:
“1.Except as otherwise provided in this agreement, no party may adopt or maintain any prohibition or restriction on the importation of any good of another Party -- except in accordance with Art. XI of the GATT.”
Article 415 of the NAFTA defines good to include “waste and scrap derived from (I) production in the territory of one or more of the Parties.” Therefore hazardous wastes are likely to be considered a good for the purposes of the Agreement, and the right of Parties to prohibit or restrict their import -- or for that matter their export -- may therefore be limited. Article XI of the GATT permits countries to impose restrictions or bans on imports of goods, via article XX, where such measures are “necessary to protect human, animal or plant life or health.” The term “necessary” has been interpreted to mean that the country maintaining the ban must show: (1) there is no reasonable available alternative measure consistent with the GATT to achieve the desired end and (2) the measure taken is the least trade restrictive measure available. Thus, by incorporating Article XI, NAFTA allows countries to ban or restrict exports and imports of hazardous wastes only to the extent that they can show there is no alternative and that it is the least restrictive trade measure. 2. Hazardous Wastes and NAFTA NAFTA declares that major multilateral conventions on hazardous waste disposal, as well as bilateral agreement on hazardous waste shipments and disposal take precedence over NAFTA itself. Specifically, Article 104 provides that:
In the event of any inconsistency between this agreement (NAFTA) and the specific trade obligations set out in: …(c) The Basel Convention on the Transboundary Movement of Hazardous Wastes, on its entry into force for Canada, Mexico and the US such obligations shall prevail to the extent of the inconsistency, provided that where a party has a choice among equally
The Generation and Management of Hazardous Wastes and Transboundary Hazardous Waste Shipments between Mexico, Canada and the United States, 1990-2000
8
effective and reasonably available means of complying with such obligations, the Party choose the alternative that is least inconsistent with the other provisions of (NAFTA). (d) The agreements set out in Annex 104.1 (these are the 1986 U.S. Canada Agreement on Transboundary Movement of Hazardous Waste and the 1983 U.S.-Mexico Agreement on Cooperation for the Protection and Improvement of the Environment in the Border Area (the La Paz Agreement)
Article 4 of the Basel convention permits countries to ban or restrict imports of hazardous waste if they have reason to believe that the wastes will not be managed in an “environmentally sound manner.” While both Canada and Mexico have ratified the Basel convention, the U.S. has not, making the two binational agreements currently more relevant to NAFTA. Both of these agreements establish the mechanisms for imports and exports between the countries. Of particular importance is Annex III of the La Paz agreement, which states that as long as applicable hazardous waste regulations are met, either country must accept the return of hazardous waste generated by production from raw materials that were imported under a temporary import regime. In practice, this requirement, along with Mexican regulations adopted under the LGEEPA, has meant that most maquiladoras are required to send their hazardous wastes back to the U.S. In addition, while NAFTA does not address the maquiladora program wholesale, several provisions of NAFTA do change some unique features that have fostered their export orientation. On the one hand, under Article 303, NAFTA continues to allow the duty drawback (repayment of the in-bond) on NAFTA-originating inputs to the extent tariffs still remain, while phasing out requirements on the % of sales which must be exported outside of Mexico and other export performance requirements by January 1, 2001 (NAFTA, Article 304). These changes lessen the advantages between being a maquiladora and being a national Mexican company. Some have suggested that maquiladoras might increasingly choose to nationalize, at least partly to escape the repatriation of hazardous waste required under Mexican laws.
Other articles of NAFTA may also impact management of hazardous wastes and shipments between the three parties. Article 1114(2) of the NAFTA declares that Parties should not waive or relax environmental measures in an attempt to attract foreign investment. Article 1110, on the other hand, states that no Party may directly or indirectly nationalize or expropriate an investment of an investor in another Party in its territory or take a measure tantamount to nationalization or expropriation of such an investment without compensation. The article allows companies which believe such a measure to have taken place to initiate a "Chapter 11" case against the government through the World Bank's International Center for the Settlement of Investment Disputes.
In recent years, measures intended to restrict the import or export of substances believed to be harmful to human health have been challenged under these NAFTA Chapter 11 provisions. Examples of such actions include: • Ethyl Corporation’s challenge of Canada’s ban on the import and interprovincial trade in
MMT; • Methanex Corporation, a Canadian Company, filing a $970 million claim for California’s
ban of imports of a gasoline additive (MBET); • Metalclad’s claim, won in August of 2000, that Mexico violated its investor rights by not
allowing it to open a hazardous waste landfill in the state of San Luis Potosí, recently upheld by a review court in Canada;
The Generation and Management of Hazardous Wastes and Transboundary Hazardous Waste Shipments between Mexico, Canada and the United States, 1990-2000
9
• S.D. Myers, an Ohio company, won a claim in November 2000 for damages related to lost business when Canada banned the export of PCB waste from November 1995 to February 1997 in an attempt to meet obligations under the Basel Convention.
• TECMED filing a claim in August of 2000 that the closing of its hazardous waste landfill near Hermosillo, Sonora violated its investor rights.
3. The North American Agreement for Environmental Cooperation The North American Agreement for Environmental Cooperation (NAAEC), sometimes referred to as the Environmental Side-Agreement to the NAFTA, came into effect at the same time of the NAFTA. Articles 5,6,7, 10(4), 12 (2) collectively impose obligations on parties to effectively enforce laws; to pursue avenues of cooperation to this end; to effect specified private enforcement rights and opportunities; and to provide an annual public report on the enforcement of environmental laws. The Agreement also provided for the creation of the North American Commission for Environmental Cooperation (CEC). Articles 14 and 15 of the NAAEC establish a mechanism through which any resident of a NAFTA country may file a submission that assert that a NAFTA country “is failing to effectively enforce its environmental law.” To date, three cases directly related to hazardous waste mismanagement have been brought forward under the Article 14/15 process, one of which will lead to preparation of a factual record. B. NAFTA's Institutions Related to Hazardous Wastes In addition to rule changes, there are also two institutions created by NAFTA that have powers related to hazardous wastes. One is the North American Commission for Environmental Cooperation, which has conducted a comprehensive review of the laws and policies related to hazardous waste generation and management in the United States, Mexico and Canada. The other institution with oversight powers is the Land and Transportation Standards Subcommittee, a separate committee authorized through the NAFTA agreement. 1. North American Commission for Environmental Cooperation
In 1995 the CEC’s law and policy program initiated an ongoing project for enhancing regional cooperation for improved tracking and enforcement of North American Laws regulating the transboundary movement of hazardous wastes and chloroflurocarbons (CFCs). A report published in 1999 under the auspices of the law and policy program concluded that the hazardous waste tracking systems in all three countries were deficient with respect to the quality, quantity and timing of information (CEC 1999: ix). 2. Land Transportation Standards Subcommittee and Transportation
Consultative Group The Land Transportation Standards Subcommittee (LTSS) is a subcommittee of the Committee on Standards-Related Measures and was expressly authorized by NAFTA under Article 913 (5) (a) (I) and Annex 913. The primary purpose of the LTSS is to make the Parties’ relevant standards-related measures on bus, truck and rail operations, including the transportation of dangerous goods, compatible. The three countries have substantially “ harmonized” regulations regarding hazardous materials transport although significant challenges remain, notably
The Generation and Management of Hazardous Wastes and Transboundary Hazardous Waste Shipments between Mexico, Canada and the United States, 1990-2000
10
Mexico’s continued implementation of standards related to “1993 Regulations for Domestic Transport of Hazardous Wastes and Materials.”2
2 For example, Mexico is still not finished adopting common labeling and transport requirements for land, sea and air (LTSS 1999).
The Generation and Management of Hazardous Wastes and Transboundary Hazardous Waste Shipments between Mexico, Canada and the United States, 1990-2000
11
IV. 1994 Onwards: Post-Liberalization? Have the laws and regulations related to the generation, management and shipment of hazardous waste been liberalized since NAFTA took effect? Has there been a move toward increased regulation or deregulation? How has this influenced management capacity and shipments between the three NAFTA countries? This section seeks to answer these questions by looking at five areas of hazardous waste generation and management including government policy, social organization, waste disposal capacity, waste generation, and transboundary waste flows. Starting with federal laws and regulations of the United States, the section examines changes that have occurred at different levels of society and government in the three countries. A. The United States
1. Government Policy
a. Federal Laws and Regulations At the federal level, the U.S. government significantly tightened regulation of hazardous wastes between 1994 and 2000, while loosening some reporting requirements. Among the most important measures taken since 1994 were the new Land Disposal Restrictions Phase II, III and IV (LDR) Rules, the listing of petroleum refinery list, limitations on the “Bevill” exclusion waste, and new Maximum Achievable Control Technology regulations for incinerators and industrial furnaces -- including cement kilns -- authorized under RCRA and the Federal Clean Air Act. These regulations – particularly the LDR IV rules -- significantly raised the treatment levels required for waste generated in the U.S. Among RCRA rules which lessened regulations was a change in the 1997 Form for reporting generation and management of hazardous wastes and the Hazardous Waste Identification Rule (HWIR), much of which still has not gone into effect.
The Generation and Management of Hazardous Wastes and Transboundary Hazardous Waste Shipments between Mexico, Canada and the United States, 1990-2000
12
Table 1. Major New Rules Adopted by U.S. EPA under RCRA and CAA, 1994-2000 Name of Rule Date Description Impact on waste Phase III Land Disposal Restrictions Relating to Carbamate Wastes
April 8, 1996 November 1, 1996 Court of Appeals vacated several standards September 4, 1998 Final Rule
Required concentration-based treatment standards for waste associated with production of some carbamate pesticides. However, court case threw out treatment standards for eight of constituents; Final rule includes treatment standards for seven constituents.
Pesticide generators given choice of specified treatment methods or meeting concentration levels. Ultimately impacted few generators.
Phase III Land Disposal Restrictions Relating to Aluminum Spent Potliners
April 1996 September 1998 Final Rule
Required new concentration-based and treatment standards for aluminum spent potliners; However, litigation caused delay and changes in final rule.
Will require a small percentage of aluminum spent potliner waste containing arsenic to be treated through vitrification; other aluminum spent potliner waste must be treated through combustion or stabilization.
Phase IV Land Disposal Restrictions Relating to Wood Preserving Wastes
May 12, 1997
Established treatment-based standards for wood preserving wastes, requiring combustion for organics, including dioxins and furans; stabilization for chromium standards; and vitrification for arsenic constituents.
Expected to shift some waste managed on-site to off-site facilities, including incinerators, cement kilns, landfills and a vitrification facility in Arkansas (Reynolds Metals Company).
Phase IV Land Disposal Restrictions Relating to Toxicity Characteristic Metal Wastes
May 26, 1998
(1) Requires metal wastes characterized hazardous by the TCLP but not the Extraction Procedure to undergo stabilization or metal recovery before landfilling; (2) Requires underlying hazardous constituents in metal wastes to be treated, as well as establishing stricter treatment standards for 12 metal constituents.
Expected to shift some waste off-site to incinerators, cement kilns, stabilization and commercial landfills following treatment.
Phase IV Land Disposal Restrictions Relating to Mineral Processing Wastes
May 26, 1998
Wastes excluded from treatment under Bevill Amendment forced to treat wastes prior to land disposal.
Expected to cause 71,000 tons of mineral waste to require stabilization treatment.
Newly Listed Wastes Petroleum Refining Wastes
August 8, 1998 Wastes Listed, February 9, 1999 Went Into Effect
Required concentration-based treatment standards for four petroleum refining wastes
Expected to shift onsite wastes to off-site commercial facilities, most of which will be stabilized, incinerated or fuel blended for combustion.
The Generation and Management of Hazardous Wastes and Transboundary Hazardous Waste Shipments between Mexico, Canada and the United States, 1990-2000
13
Name of Rule Date Description Impact on waste Newly Listed Wastes-Organobromine Waste
1997 – currently in litigation.
Required treatment standards for organobromine.
Only affects Great Lakes Chemical Corporation.
Emission Limits for Hazardous Waste Combustion Facilities
April 19,1996-Rules Proposed. September 30, 1999 – Rules Finalized. Facilities have 3 years to meet standards.
Establishes more stringent Maximum Achievable Control Technology (MACT) emission standards for hazardous waste incinerators, waste burning cement kilns and lightweight aggregate kilns.
EPA estimates at least 90% of facilities will have to make substantial investments to meet standards. Likely result will be less on-site burning of hazardous wastes in incinerators and kilns, with larger commercial incinerators and cement kilns burning wastes.
Hazardous Waste Identification Rule – Contaminated Media
Proposed rule published December 21, 1995 Final rule published November 2, 1998. Final rule not expected until April 30, 2001
Exempts from hazardous waste regulations, including treatment standards, some waste at low constituent concentrations. Only applies to cleanup activities, not process waste.
Will reduce off-site management of some hazardous wastes from Superfund sites and other RCRA clean up.
Hazardous Waste Identification Rule – Process Waste
Proposed rule published December 21, 1995. Final rule not expected until April 30, 2001
Would exempt from hazardous waste regulations and treatment standards certain process waste at low concentrations of toxicity.
Impact will depend upon concentration levels specified in final rule.
Source: TNRCC March 2000: 14-23. b. Federal Enforcement In FY 1999, EPA and state agencies inspected about 63% of all TSD facilities for compliance with RCRA and state regulations in the entire United States. That same year, about 11% of all TSD facilities were considered to be in significant non-compliance with RCRA rules, again in the United States as a whole. In general, inspection rates in the U.S. –Canada border states have been slightly higher than the national average, while inspection rates in the U.S –Mexico border region have been lower than the national average. These differences seem to reflect lower budgets in general in southern states – particularly in Texas -- for environmental protection and enforcement as well as the higher number of TSDs concentrated in California and Texas. California rates were surprisingly low during this period, although care should be taken in interpreting these numbers, since EPA-reported and state figures differ.3 While rates of 3The rates reported are directly from EPA's Office of Enforcement and Compliance and Assistance. State figures differ from national figures. For example, California reported it inspected 103 facilities during FY 99 rather than 83. For this reason, these figures should be used only to show general trends over time rather than as an accurate reflection of inspection and compliance rates.
The Generation and Management of Hazardous Wastes and Transboundary Hazardous Waste Shipments between Mexico, Canada and the United States, 1990-2000
14
inspection and formal actions declined in the mid-1990s, however, there has been an upswing in inspections since 1997, although formal actions against violators have continued to decline in both regions. Table 2 details the current levels of enforcement of hazardous waste regulations in different border states. Table 2. RCRA Treatment, Storage and Disposal Facilities: % Inspected, % in Significant Non-Compliance and Number of Formal Enforcement Actions, Mexican Border States, Canadian Border States and Nation, FY 1995-1999 Region Texas California US/Mexico
Border States US/Canada Border States
US Total
% TSDs Inspected 1995 61% 53% 59% 69% 65% 1996 34% 29% 34% 34% 21% 1997 33% 24% 29% 42% 33% 1998 48% 33% 42% 68% 59% 1999 50% 34% 44% 74% 63% % TSDs in Significant Non-Compliance
1995 18% 7% 15% 13% 4% 1996 10% 2% 7% 5% 7% 1997 9% 1% 5% 6% 6% 1998 16% 1% 10% 16% 14% 1999 15% 0% 8% 14% 13% # Formal Enforcement Actions
1995 45 8 61 57 305 1996 12 7 30 38 229 1997 29 0 30 49 205 1998 21 2 28 32 172 1999 16 1 17 25 180 Note: US-Mexico Border States include Arizona, California, New Mexico and Texas; US-Canadian Border States include Idaho, Maine, Michigan, Minnesota, Montana, New Hampshire, New York, North Dakota, Ohio, Pennsylvania, Vermont and Washington. Source: FY95 –FY97: US EPA, State-by-State Enforcement Data Summaries, FY95-FY97 and FY 1998 and FY1999 Program Status Reports In recent years, EPA has placed greater emphasis on enforcing RCRA transportation regulations on hazardous waste imports and exports through financial support to state programs and use of the HAZTRAKS database. Utilizing HAZTRAKS, EPA filed 17 administrative enforcement actions against transport and TSD companies that did not comply with export or import regulations between 1996 and 1998, with penalties totaling $482,000 (Cooke, October 98). In 2000, the U.S. EPA fined a Mexican maquiladora facility for the first time – Maquiladora Chambers Belt Co. – as well as its parent company and a storage facility a total of $50,000 for illegally shipping hazardous wastes to facilities not authorized to receive the waste, as well as improperly labeling, packaging and completing the manifests for the waste (EPA July 24, 2000). In December of 1999, the governments of the Mexico and the U.S. announced the establishment of a new consultative mechanism between the two countries on new and operating hazardous and radioactive waste sites within 100 kilometers. With the new agreement, the two countries -- and by extension its citizens -- should be able to voice opinions about proposed sites for the deposit, management and recycling of hazardous and radioactive wastes.
The Generation and Management of Hazardous Wastes and Transboundary Hazardous Waste Shipments between Mexico, Canada and the United States, 1990-2000
15
c. State Laws and Regulations In addition to changes in federal laws and regulations and developments in federal enforcement, some states have made changes to their laws and regulations dealing with the generation, management and shipment of hazardous waste. There has been a movement in some states to move toward voluntary pollution prevention programs compliance assistance, rather than strict enforcement. Thus, Texas passed the Waste Reduction Policy Act of 1991 to require industries to submit waste reduction and waste minimization plans and annual progress reports, and began a “Clean Industries Program” to assist and recognize businesses for their efforts. This may have led to significant pollution reduction, estimated by TNRCC officials at approximately 12.5 million tons over five years. In addition, the Texas Natural Resource Conservation Commission adopted a number of “regulatory flexibility measures” – some required by Texas legislation – during the mid-1990s, including:
• The 1995 Environmental Audit program allowing industries to audit their facility in order to comply with regulations in return for immunity from civil and administrative penalties;
• A 1995 policy of no surprise inspections of industries in most cases; • Flexible Permits (1995), allowing industries to change or increase production
without a permit amendment; • 1997 Regulatory Flexibility Orders, exempting industries from state statute or rules
in return from alternative “as protective” of public health and the environment (Sunset Advisory Commission 2000, 32).
In addition, the legislature and governor approved a “takings” law which allows business to sue state government for “taking” their property through regulation and forced the state to consider the effect of regulation on property values. Finally, in recent years, the TNRCC has adopted a more rigorous definition of “affected party” when considering standing for citizens opposed to hazardous waste and other environmental permits. With these changes, Texas moved away from stricter regulation and toward a voluntary compliance philosophy as well as limiting public participation in permit hearings.
d. State Enforcement While EPA is ultimately responsible for overseeing the enforcement of RCRA and other laws pertaining to hazardous wastes, because most states have been delegated authority, the actual inspections and enforcement activities occur primarily at the state level. In Texas, about 12,000 facilities are subject to industrial or hazardous waste regulations. Under the TNRCC, the state agency in charge of conducting inspections, issuing notices of violations and issuing penalties, either through an Agreed Order or other means, the total number of notices of violations, agreed orders and penalties has declined in recent years. Still, comparisons between the nation and the zone within the 100 kilometers of the U.S.–Mexico border do not support a conclusion that there
There has been a movement in some states to move toward voluntary pollution prevention programs and compliance assistance, rather than strict enforcement.
The Generation and Management of Hazardous Wastes and Transboundary Hazardous Waste Shipments between Mexico, Canada and the United States, 1990-2000
16
has been less effective enforcement and inspections against TSDs in the border region since NAFTA. Table 3. RCRA Treatment Storage and Disposal Facilities: % Inspected and % in Significant Non-Compliance within 100 kilometers of U.S –Mexico Border, FY 99 State # Facilities # Facilities
Inspected % Facilities Inspected
# Facilities in Significant Non-Compliance
% Facilities in Non-Compliance
Arizona 8 6 75% 1 13% California 16 7 44% 0 0% New Mexico
4 4 100% 0 0%
Texas 34 18 53% 7 21% Total 100 Kilometer Zone
62 35 56% 8 13%
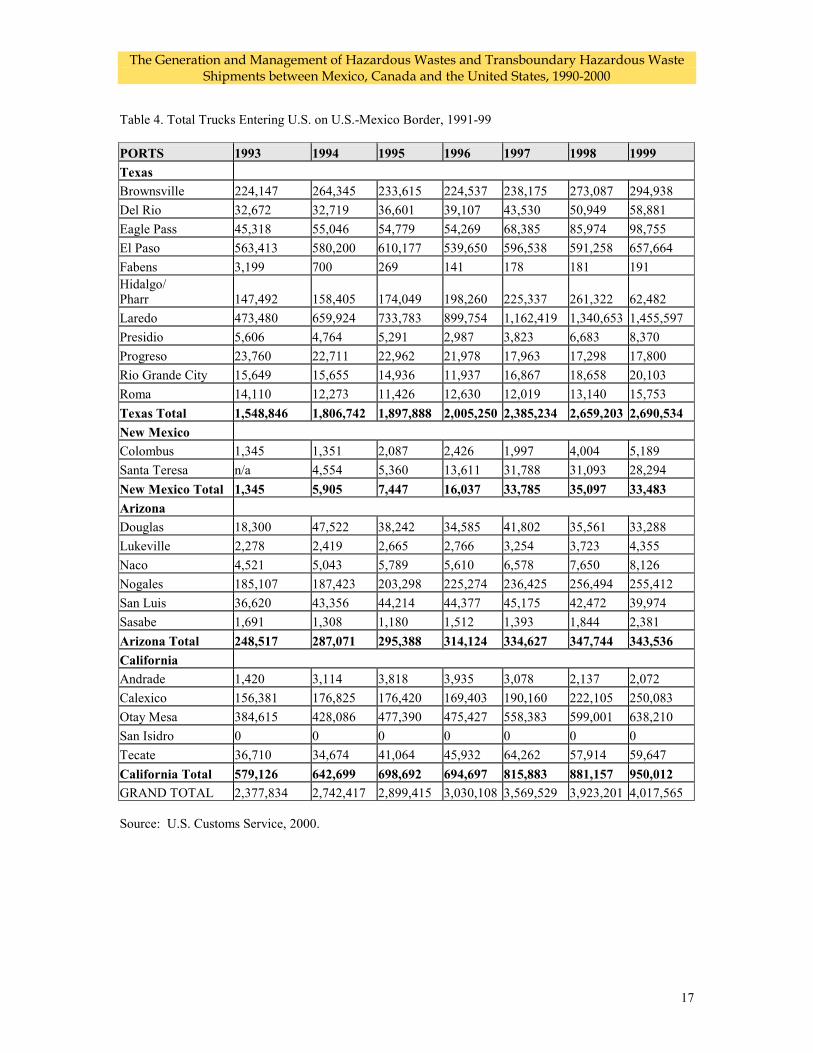
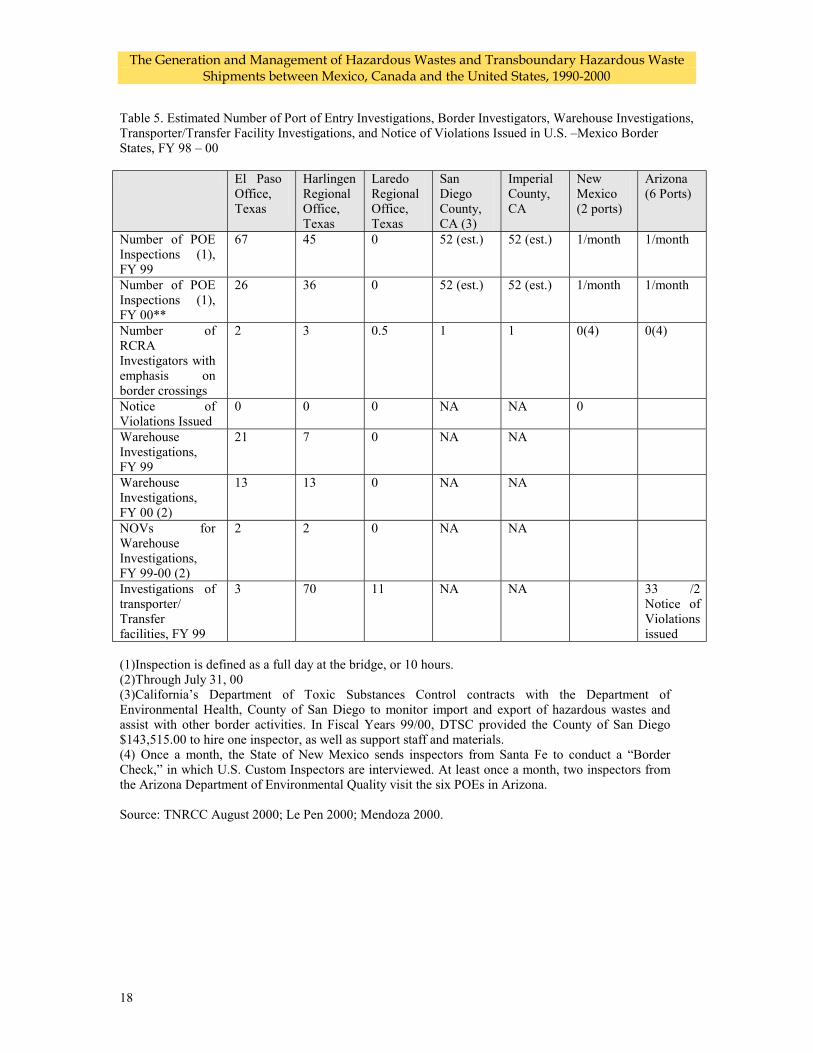
National 3096 1961 63% 354 11% Source: Information provided by Office of Enforcement and Compliance Assistance, U.S. EPA. Both Texas and California have increased inspections and funds dedicated to Points of Entry inspections in recent years, although the percentage of trucks that are actually inspected by state officials is minuscule. The number of trucks entering the U.S. from Mexico has grown by 69 percent since 1993 (See Table 4). Recently, the Arizona Department of Environmental Quality began the Hazardous Waste Border Surveillance, Compliance and Enforcement Program (Border SCEP) using EPA funds (Mendoza 2000). The new programs has allowed the state agency to conduct training with U.S. Customs officials and officials from the Pima County Department of Environmental Quality on RCRA regulations, sampling procedures and proper inspections. It has not, however, allowed the state to do more than rudimentary visits to Points of Entry crossings. In fact, in some ports in all four border states, there is an assurance that no environmental officials will be inspecting ports of entry for compliance with hazardous waste regulations (See Table 5). Some analysts believe this has led to greater traffic at some ports as truckers seek to avoid compliance with manifest and other hazardous waste requirements.4
4 Both Texas and California plan to increase funding and presence in the border in future years. TNRCC plans to conduct coordinated investigations with EPA in Laredo at approximately 300 warehouse and transfer facilities in FY 01. California’s Department of Toxic Substances Control will use additional state funds in FY 00-01 to hire two new inspectors to add to the existing two on the border. This is the first time that state funds have gone directly to border activities. New Mexico had planned to hire a full-time inspector in the border area, but the hired person refused to be relocated to the border. The State of Arizona is currently proposing to locate three new employees in the border area. TNRCC August 3, 2000, Mendoza 2000, and Le Pen 2000.
In some ports of entry in all four southern border states, there is an assurance that no environmental officials will be inspecting trucks for compliance with hazardous waste regulations.
The Generation and Management of Hazardous Wastes and Transboundary Hazardous Waste Shipments between Mexico, Canada and the United States, 1990-2000
17
Table 4. Total Trucks Entering U.S. on U.S.-Mexico Border, 1991-99 PORTS 1993 1994 1995 1996 1997 1998 1999 Texas Brownsville 224,147 264,345 233,615 224,537 238,175 273,087 294,938 Del Rio 32,672 32,719 36,601 39,107 43,530 50,949 58,881 Eagle Pass 45,318 55,046 54,779 54,269 68,385 85,974 98,755 El Paso 563,413 580,200 610,177 539,650 596,538 591,258 657,664 Fabens 3,199 700 269 141 178 181 191 Hidalgo/ Pharr 147,492 158,405 174,049 198,260 225,337 261,322 62,482 Laredo 473,480 659,924 733,783 899,754 1,162,419 1,340,653 1,455,597 Presidio 5,606 4,764 5,291 2,987 3,823 6,683 8,370 Progreso 23,760 22,711 22,962 21,978 17,963 17,298 17,800 Rio Grande City 15,649 15,655 14,936 11,937 16,867 18,658 20,103 Roma 14,110 12,273 11,426 12,630 12,019 13,140 15,753 Texas Total 1,548,846 1,806,742 1,897,888 2,005,250 2,385,234 2,659,203 2,690,534 New Mexico Colombus 1,345 1,351 2,087 2,426 1,997 4,004 5,189 Santa Teresa n/a 4,554 5,360 13,611 31,788 31,093 28,294 New Mexico Total 1,345 5,905 7,447 16,037 33,785 35,097 33,483 Arizona Douglas 18,300 47,522 38,242 34,585 41,802 35,561 33,288 Lukeville 2,278 2,419 2,665 2,766 3,254 3,723 4,355 Naco 4,521 5,043 5,789 5,610 6,578 7,650 8,126 Nogales 185,107 187,423 203,298 225,274 236,425 256,494 255,412 San Luis 36,620 43,356 44,214 44,377 45,175 42,472 39,974 Sasabe 1,691 1,308 1,180 1,512 1,393 1,844 2,381 Arizona Total 248,517 287,071 295,388 314,124 334,627 347,744 343,536 California Andrade 1,420 3,114 3,818 3,935 3,078 2,137 2,072 Calexico 156,381 176,825 176,420 169,403 190,160 222,105 250,083 Otay Mesa 384,615 428,086 477,390 475,427 558,383 599,001 638,210 San Isidro 0 0 0 0 0 0 0 Tecate 36,710 34,674 41,064 45,932 64,262 57,914 59,647 California Total 579,126 642,699 698,692 694,697 815,883 881,157 950,012 GRAND TOTAL 2,377,834 2,742,417 2,899,415 3,030,108 3,569,529 3,923,201 4,017,565 Source: U.S. Customs Service, 2000.
The Generation and Management of Hazardous Wastes and Transboundary Hazardous Waste Shipments between Mexico, Canada and the United States, 1990-2000
18
Table 5. Estimated Number of Port of Entry Investigations, Border Investigators, Warehouse Investigations, Transporter/Transfer Facility Investigations, and Notice of Violations Issued in U.S. –Mexico Border States, FY 98 – 00 El Paso
Office, Texas
Harlingen Regional Office, Texas
Laredo Regional Office, Texas
San Diego County, CA (3)
Imperial County, CA
New Mexico (2 ports)
Arizona (6 Ports)
Number of POE Inspections (1), FY 99
67 45 0 52 (est.) 52 (est.) 1/month 1/month
Number of POE Inspections (1), FY 00**
26 36 0 52 (est.)
52 (est.)
1/month 1/month
Number of RCRA Investigators with emphasis on border crossings
2 3 0.5 1 1 0(4) 0(4)
Notice of Violations Issued
0 0 0 NA NA 0
Warehouse Investigations, FY 99
21 7 0 NA NA
Warehouse Investigations, FY 00 (2)
13 13 0 NA NA
NOVs for Warehouse Investigations, FY 99-00 (2)
2 2 0 NA NA
Investigations of transporter/ Transfer facilities, FY 99
3 70 11 NA NA 33 /2 Notice of Violations issued
(1)Inspection is defined as a full day at the bridge, or 10 hours. (2)Through July 31, 00 (3)California’s Department of Toxic Substances Control contracts with the Department of Environmental Health, County of San Diego to monitor import and export of hazardous wastes and assist with other border activities. In Fiscal Years 99/00, DTSC provided the County of San Diego $143,515.00 to hire one inspector, as well as support staff and materials. (4) Once a month, the State of New Mexico sends inspectors from Santa Fe to conduct a “Border Check,” in which U.S. Custom Inspectors are interviewed. At least once a month, two inspectors from the Arizona Department of Environmental Quality visit the six POEs in Arizona. Source: TNRCC August 2000; Le Pen 2000; Mendoza 2000.
The Generation and Management of Hazardous Wastes and Transboundary Hazardous Waste Shipments between Mexico, Canada and the United States, 1990-2000
19
2. Social Organization
In addition to government actors, there are several social actors interested in the generation and management of hazardous waste in the United States. These actors include citizen groups, community organizations and the hazardous waste industry.
a. Citizens and Community Organizations
Citizen groups continue to use citizen-suit provisions in both RCRA and EPCRA to attempt to improve waste management practices. However, one recent 1998 Supreme Court decision in Steel Company v. Citizens for a Better Environment curtailed the ability of citizen groups to be granted standing on cases involving past violations of EPCRA. Instead, future citizen suits will only be practical in cases of continuing violations or credible future threats. Citizens continued to actively oppose new proposed landfills, incinerators and deep well injection facilities, as well as the continued practice of burning hazardous waste in cement kilns. In general, citizens were successful in preventing new hazardous waste facilities from opening, although many existing “interim” facilities were able to obtain permits, such as the TXI cement plant which burns hazardous wastes in Midlothian, Texas, despite citizen opposition. Citizens are beginning to negotiate directly with companies over pollution prevention, emission reductions and safety issues at the facilities themselves through “Good Neighbor Agreements.” Still, there have been other cases where these committees and agreements have not been effective. The key factors are the ability of the citizens to receive accurate and timely information, and the will of the companies to actually implement changes. Government involvement and oversight is also important in carrying out the agreements.
b. Hazardous Waste Management Industry Since 1994, there has been a consolidation of the hazardous waste management industry in the U.S. For example, in 1998, Chemical Waste Management, which was renamed Waste Management Inc, merged with USA Waste Services Inc., and later divested itself of several international subsidiaries, while keeping its core North American businesses. In addition, the company -- which operated eight commercial landfills and 3 deep well injection facilities in 1994 -- operated only five commercial landfills and 2 deep well injection facilities at the end of 1999 (Waste Management Inc. 2000: 7). In terms of hazardous waste management, since 1994, a series of mergers led four companies – USPCI, Laidlaw Environmental Services, Rollins Environmental Services and Safety Kleen – to become – at least for a time -- one single company – Safety Kleen. Currently, the company operates four general commercial incinerators, a landfill at one of the incinerators to depose of ash, as well as two specialty incinerators in the U.S. and two liquid hazardous waste incinerators in Canada. There are currently 20 commercial incinerators operating in the U.S. (U.S. EPA, July 1999, Exhibit 2-2). During 1997 and 1998, Safety Kleen closed three commercial incinerators. Safety Kleen also operates eight hazardous waste landfills, including six in the U.S. and two in Canada. Safety Kleen estimated it controls 22 % of the off-site industrial waste services industry in North America, generating revenues of nearly $7.4 billion in FY 1999 (Safety Kleen 2000, 13). In addition, fewer cement kilns are believed to be burning hazardous wastes in 1999 than in 1994. By 1999, EPA was reporting that only 18 cement kilns were permitted to burn hazardous
The Generation and Management of Hazardous Wastes and Transboundary Hazardous Waste Shipments between Mexico, Canada and the United States, 1990-2000
20
wastes either under RCRA B permit or interim status (U.S. EPA, July 1999, Exhibit 2-2). It is believed that the new MACT standard will decrease the number of incinerators and cement kilns burning hazardous wastes, but overall capacity is not expected to change much as those able to meet stricter standards will increase their management of hazardous wastes. Table 6. Major Commercial Hazardous Waste Combustion and Disposal Facilities Operating in the U.S., 1999 Treatment Technique Company Number of Facilities Landfills Safety Kleen 6 Waste Management 5 Total Landfills in U.S. 21 Incinerators Safety Kleen 6 Total 20 Deep Well Injection Facilities
Waste Management 2
Total 11 Cement Kilns Burning Hazardous Wastes
18
Sources: U.S. EPA 1999; Waste Management 2000; Safety Kleen 2000. U.S. based companies have continued to look for investment opportunities in Mexico and Canada, due in part to the contraction of the U.S. market, though the actual amount of investment has been relatively small (see Mexico and Canada sections for more details).
3. Waste Disposal Capacity
Estimates of waste disposal capacity in the United States are generally outdated. The U.S. EPA has not required states to conduct Capacity Assurance Plans since 1994. Nonetheless, both the U.S. EPA and most analysts believe that sufficient, and in fact, excess capacity exists in the U.S. to commercially treat hazardous wastes in part because generation of hazardous waste has declined as companies have enacted source-reduction plans (Waste Management Inc. 2000, 7). In addition, most states have also concluded they have sufficient commercial capacity to manage hazardous wastes. The only major category of waste management where Texas lacks capacity is in zinc recovery (TNRCC March 2000, xiii). Currently, most of these wastes generated in Texas are sent to Mexico for recycling.
4. Waste Generation
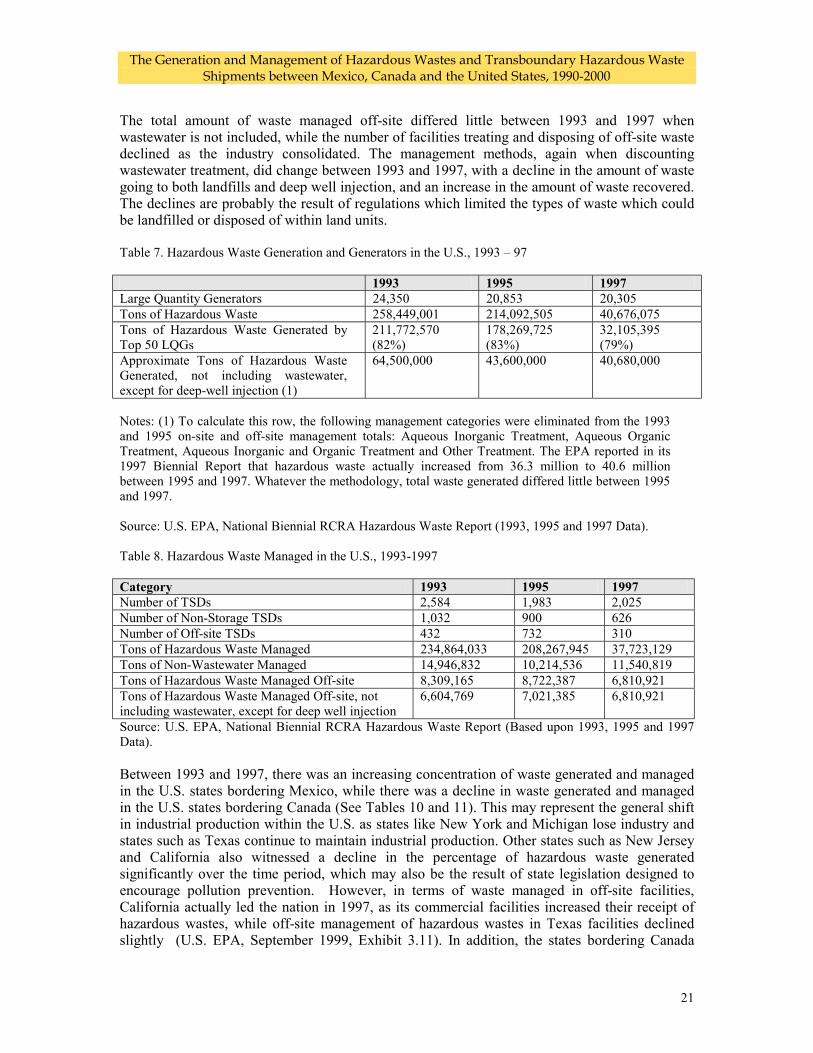
In 1997, some 20,305 Large Quantity Generators generated a total of 40,676,075 tons of hazardous waste, a decrease of approximately 500 generators and almost 170 millions tons from the 1995 report (US EPA September 1999, i). Nonetheless, because EPA streamlined reporting requirements, eliminating all wastewaters that are managed in systems regulated by the Clean Water Act rather than RCRA, it is not possible to compare these figures. If such wastewaters are discounted from the 1993 and 1995 report, hazardous waste generation declined between 1993 and 1997, despite an economic boom and higher production in the U.S. In all three years, the top 50 waste generators generated about 80% of total wastes, although the percentage of the total declined slightly over time, indicating significant reductions at some of the largest generators of hazardous waste.
The Generation and Management of Hazardous Wastes and Transboundary Hazardous Waste Shipments between Mexico, Canada and the United States, 1990-2000
21
The total amount of waste managed off-site differed little between 1993 and 1997 when wastewater is not included, while the number of facilities treating and disposing of off-site waste declined as the industry consolidated. The management methods, again when discounting wastewater treatment, did change between 1993 and 1997, with a decline in the amount of waste going to both landfills and deep well injection, and an increase in the amount of waste recovered. The declines are probably the result of regulations which limited the types of waste which could be landfilled or disposed of within land units. Table 7. Hazardous Waste Generation and Generators in the U.S., 1993 – 97 1993 1995 1997 Large Quantity Generators 24,350 20,853 20,305 Tons of Hazardous Waste 258,449,001 214,092,505 40,676,075 Tons of Hazardous Waste Generated by Top 50 LQGs
211,772,570 (82%)
178,269,725 (83%)
32,105,395 (79%)
Approximate Tons of Hazardous Waste Generated, not including wastewater, except for deep-well injection (1)
64,500,000 43,600,000 40,680,000
Notes: (1) To calculate this row, the following management categories were eliminated from the 1993 and 1995 on-site and off-site management totals: Aqueous Inorganic Treatment, Aqueous Organic Treatment, Aqueous Inorganic and Organic Treatment and Other Treatment. The EPA reported in its 1997 Biennial Report that hazardous waste actually increased from 36.3 million to 40.6 million between 1995 and 1997. Whatever the methodology, total waste generated differed little between 1995 and 1997. Source: U.S. EPA, National Biennial RCRA Hazardous Waste Report (1993, 1995 and 1997 Data). Table 8. Hazardous Waste Managed in the U.S., 1993-1997 Category 1993 1995 1997 Number of TSDs 2,584 1,983 2,025 Number of Non-Storage TSDs 1,032 900 626 Number of Off-site TSDs 432 732 310 Tons of Hazardous Waste Managed 234,864,033 208,267,945 37,723,129 Tons of Non-Wastewater Managed 14,946,832 10,214,536 11,540,819 Tons of Hazardous Waste Managed Off-site 8,309,165 8,722,387 6,810,921 Tons of Hazardous Waste Managed Off-site, not including wastewater, except for deep well injection
6,604,769 7,021,385 6,810,921
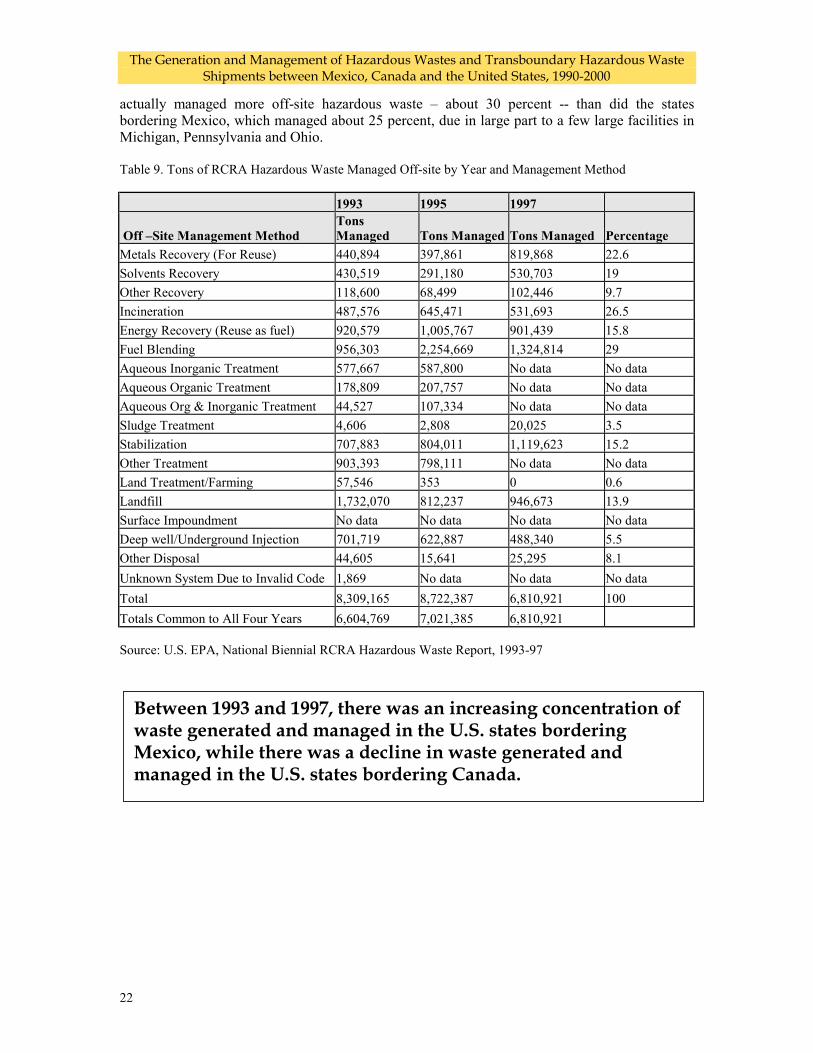
Source: U.S. EPA, National Biennial RCRA Hazardous Waste Report (Based upon 1993, 1995 and 1997 Data). Between 1993 and 1997, there was an increasing concentration of waste generated and managed in the U.S. states bordering Mexico, while there was a decline in waste generated and managed in the U.S. states bordering Canada (See Tables 10 and 11). This may represent the general shift in industrial production within the U.S. as states like New York and Michigan lose industry and states such as Texas continue to maintain industrial production. Other states such as New Jersey and California also witnessed a decline in the percentage of hazardous waste generated significantly over the time period, which may also be the result of state legislation designed to encourage pollution prevention. However, in terms of waste managed in off-site facilities, California actually led the nation in 1997, as its commercial facilities increased their receipt of hazardous wastes, while off-site management of hazardous wastes in Texas facilities declined slightly (U.S. EPA, September 1999, Exhibit 3.11). In addition, the states bordering Canada
The Generation and Management of Hazardous Wastes and Transboundary Hazardous Waste Shipments between Mexico, Canada and the United States, 1990-2000
22
actually managed more off-site hazardous waste – about 30 percent -- than did the states bordering Mexico, which managed about 25 percent, due in large part to a few large facilities in Michigan, Pennsylvania and Ohio. Table 9. Tons of RCRA Hazardous Waste Managed Off-site by Year and Management Method 1993 1995 1997
Off –Site Management Method Tons Managed Tons Managed Tons Managed Percentage
Metals Recovery (For Reuse) 440,894 397,861 819,868 22.6 Solvents Recovery 430,519 291,180 530,703 19 Other Recovery 118,600 68,499 102,446 9.7 Incineration 487,576 645,471 531,693 26.5 Energy Recovery (Reuse as fuel) 920,579 1,005,767 901,439 15.8 Fuel Blending 956,303 2,254,669 1,324,814 29 Aqueous Inorganic Treatment 577,667 587,800 No data No data Aqueous Organic Treatment 178,809 207,757 No data No data Aqueous Org & Inorganic Treatment 44,527 107,334 No data No data Sludge Treatment 4,606 2,808 20,025 3.5 Stabilization 707,883 804,011 1,119,623 15.2 Other Treatment 903,393 798,111 No data No data Land Treatment/Farming 57,546 353 0 0.6 Landfill 1,732,070 812,237 946,673 13.9 Surface Impoundment No data No data No data No data Deep well/Underground Injection 701,719 622,887 488,340 5.5 Other Disposal 44,605 15,641 25,295 8.1 Unknown System Due to Invalid Code 1,869 No data No data No data Total 8,309,165 8,722,387 6,810,921 100 Totals Common to All Four Years 6,604,769 7,021,385 6,810,921 Source: U.S. EPA, National Biennial RCRA Hazardous Waste Report, 1993-97
Between 1993 and 1997, there was an increasing concentration of waste generated and managed in the U.S. states bordering Mexico, while there was a decline in waste generated and managed in the U.S. states bordering Canada.
The Generation and Management of Hazardous Wastes and Transboundary Hazardous Waste Shipments between Mexico, Canada and the United States, 1990-2000
23
Table 10. Percentage of Hazardous Waste Managed and Generated by State and Region, 1993-1997 State or Region
% Generated, 93
% Generated, 95
% Generated 97
% Managed, 93
% Managed, 95
% Managed, 97
Texas 24.6% 32% 46.6% 22.4% 36% 46% California 5.4% 5.2% 1.7% 5.4% 6.5% 3.1% All Mexico Border States (1)
30.2% 37.3% 48.6% 27.9% 42.6% 49.6%
Michigan 8.1% 6.3% 2.4% 8.8% 6.9% 2.9% Washington 5.6% 1.4% 0.3% 4.3% 0.8% 0.1% New York 0.6% 1.1% 1% 0.5% 0.2% 1.1% Ohio 0.7% 0.9% 4.2% 0.7% 0.8% 4.6% Pennsylvania 3.7% 3.0% 0.9% 3.9% 3.0% 1.3% All Canada Border States (2)
21.9% 13.6% 12.8% 21.5% 12.6% 13.4%
(1) Includes Arizona, California, New Mexico and Texas; (2) Includes Idaho, New Hampshire, Maine, Michigan, Minnesota, Montana, New York,
New Hampshire, North Dakota, Ohio, Pennsylvania, Vermont and Washington.
Source: U.S. EPA, The National Biennial RCRA Hazardous Waste Report (Based on 1993, 1995 and 1997 Data), August 95, August 97, and August 99. Table 11. Quantity of Hazardous Wastes Received Off-Site in Selected States, 1995-1997 State 1995 % 1995 1997 %1997 Texas 828, 577 10.5 512,619 6.4 California 319,188 4.0 1,535,991 19.2 All Mexico Border States (1)
1,163,098 14.7 2,058,088 25.7
Michigan 1,076,175 13.6 732,643 9.2 Washington 12,520 0.2 36,760 0.5 New York 191,829 2.4 261,477 3.3 Ohio 577,617 7.3 693,041 8.7 Pennsylvania 431,013 5.4 446,935 5.6 All Canada Border States (2)
2,425,351 30.7 2,411,359 30.3
New Jersey 1,090,521 13.8 46,148 0.6 Indiana 502,050 6.3 611,458 7.6
(1) Includes Arizona, California, New Mexico and Texas; (2) Includes Idaho, Maine, Michigan, Minnesota, Montana, New York, New Hampshire,
North Dakota, Ohio, Pennsylvania, Vermont and Washington. Source: U.S. EPA, The National Biennial RCRA Hazardous Waste Report (Based on 1997 Data), Exhibit B.4 and 3.11.
The Generation and Management of Hazardous Wastes and Transboundary Hazardous Waste Shipments between Mexico, Canada and the United States, 1990-2000
24
5. Transboundary Waste Flows While most hazardous waste is generated and managed within the United States, there has been an increase of transboundary shipments of hazardous wastes. Section V offers an analysis of the possible reasons for this growth.
a. Exports
While record keeping of exports and imports of hazardous waste from the U.S. to Canada and Mexico improved since the passage of NAFTA, there are still significant gaps in records. For example, because of a lack of resources and difficulty with the Exports database, the EPA only conducted annual assessments of exports from 1993 to 1995. This assessment shows that exports increased substantially to both Mexico and Canada, particularly waste going to landfills in Canada. Because lead batteries are not required to be manifested under RCRA, batteries going to Mexico are not included in these totals. The waste that was reported as being shipped to Mexico was electric arc furnace (EAF) dust generated by specialized steel operators. About 100,000 tons of this material was exported to Mexico in 1995. All of this waste is sent to a single zinc recycling facility in Monterrey, Mexico. An analysis of the Biennial RCRA Database reveals that this waste stream increased substantially between 1993 and 1997, and that the volume of waste being exported to Mexico also increased, from approximately 60,000 to 90,000 tons.5 For example, four Texas steel generators which ship electric arc furnace dust to Mexico increased exports of hazardous waste to Zinc Nacional in Mexico from 28,458.78 to 38,193.41 tons between 1993 and 1997, believed to be the result of increased production (Corson, 2000). Overall, EAF dust sent to management facilities off-site climbed from approximately 350,000 to 800,000 tons between 1993 and 1997.
Table 12. Exports from the U.S. to Canada, Mexico and the Rest of the World, 1993-1995 Country Management Method Quantity in
Tons, 93 Quantity in Tons, 94
Quantity in Tons, 95
Canada Reclaimed/Recycled, including fuel blending
16,770.72 26,997.5 30,183.2
Incineration 13,936 8,799.7 11,217.5 Treatment and Landfilled 39,591 61,410.8 51,034.4 Total 70,297.72 115,133.8 121,014.3 Mexico Metal Reclamation
(Emission control dust from electric arc furnace steel mills)
71,596.78 75,851.6 104,408.2
Other Countries
Metal Reclamation 813.95 472.8 970.7
Totals 142,708.95 191,458.2 226,393.2 Source: Information provided to authors by U.S. EPA from EXPORTS Database A similar story is told by looking at the number of export waste streams and waste notices, which have increased over time to both Mexico and Canada. Between 1993 and 1999, the total number of notice of exports increased from 526 to 816 and the total number of waste streams increased
5 The figures for Electric Arc Furnace Dust, Waste Code K061, are derived from a query run on-line of EPA's Biennial Hazardous Waste Database. These figures might not represent all KO61 waste going to Mexico, as it is possible that such waste is sent to a storage facility before being exported to Mexico.
The Generation and Management of Hazardous Wastes and Transboundary Hazardous Waste Shipments between Mexico, Canada and the United States, 1990-2000
25
from 1085 to 4901. Virtually all of this increase was due to increased notices to export to Canada. In 1998, information provided by U.S. exporters showed that 21 facilities in Canada received U.S. hazardous waste, while only one TSD facility in Mexico – Zinc Nacional – received U.S. hazardous waste. However, two other firms in Mexico – Accumex and Metales Potosí – are believed by U.S. officials to be receiving spent lead batteries for recycling. Table 13. Number of Waste Streams and Waste Notices of Exports, 1993-1999 Country 1993 1994 1995 1996 1997 1998 1999 Canada - Notices 489 477 580 720 675 768 772 Canada - Waste Streams 1042 1398 2144 2709 3333 3580 4856 Mexico - Notices 15 22 30 22 27 28 28 Mexico – Waste Streams 15 22 30 22 27 28 35 Other – Notices 22 20 28 12 9 10 16 Other - Waste Streams 28 20 30 12 10 23 17 Totals – Notices 526 519 638 754 711 806 816 Totals - Waste Streams 1085 1440 2204 2833 3370 3631 4901 Source: Information provided by U.S. EPA, 2000 from Exports and WITS Database
b. Imports
Limited information on imports of hazardous waste from Canada and Mexico from the WITS database shows a general decline in the number of notices of imports from both Canada and Mexico. These numbers do not include, however, imports originating from maquiladoras. According to HAZTRAKS, imports of RCRA hazardous waste from Mexico increased slightly from 9,437 tons to 11,057 between 1993 and 1997, while imports of total industrial wastes, including both RCRA and non-RCRA wastes, increased from 21,768 tons to 31,709 tons, a significant increase (TNRCC, December 1998, 2). Some 3,000 tons were imported to two landfills in California owned at the time by Laidlaw and Chemical Waste Management. Using its state tracking system, Texas reported in 1997 that most waste from Mexico went to a Waste Management Inc. incineration facility (3009.5 tons) or was fuel blended (867.27 tons) for later combustion in cement kilns (Corson 2000). There are a significant number of maquiladoras reporting waste return to the U.S. in the HAZTRAKS database. For example, approximately 800 companies, or about 40% of all the maquiladoras located in border states in 1997 are reported as having shipped either hazardous or non-hazardous waste from Mexico to the U.S. sometime during 1997. However, most of the maquiladoras in the database are just from two cities, Ciudad Juárez and Tijuana, and the vast majority of waste from these two cities comes from a handful of maquiladoras. Not surprisingly, the Ports of Entry at these two cities have the highest amount of inspection and enforcement activity by state government and the best working relations between U.S Customs and state and EPA officials. In addition, because of funding problems, Haztraks is two years behind schedule, and currently only data through 1997 has been entered into the system, although 1998 and 1999 information is now being entered into the system as funding was restored. As reported elsewhere, information from the Mexican government shows an increasing trend in waste being exported from Mexico to the U.S.
The Generation and Management of Hazardous Wastes and Transboundary Hazardous Waste Shipments between Mexico, Canada and the United States, 1990-2000
26
Table 14. Number of Waste Streams and Waste Notices of Imports, 1995-1999 1995 1996 1997 1998 1999 Canada Import Notices 660 682 784 536 519 Waste Streams 2650 2170 1597 1530 1735 Mexico-Import Notices NA 28 53 2 6 Waste Streams NA 28 53 6 15 All Countries Import Notices 823 864 1162 824 745 All Countries Waste Streams 2813 2354 1975 1819 1971 Source: Information provided by U.S. EPA to authors from WITS Database. Table 15. Tons of RCRA hazardous waste, Solid Waste and Number of RCRA Hazardous Waste Manifests received from Mexico, 1993-1997 Category 1993 1994 1995 1996 1997 Tons of RCRA Hazardous Waste
9437 10,133 8,510 6,893 11,057
Number of RCRA Manifests 2208 2,857 2,594 2,609 4,303 Total Solid Waste 21,768 31, 709 RCRA Waste Managed at Texas TSD Facilities
3,248.44
NA 3,843.57
NA 5,661.55
Source: U.S. EPA, HAZTRAKS Database, 1998 and TNRCC, TRACS Database.
Table 16. Amount of RCRA Hazardous Waste Shipped to U.S. by Border Cities, 1997 City of Origin Number of
Maquilas in City, 1997
Number of Companies in Haztraks Database that Shipped Solid Waste, 1997
Tons of Hazardous Waste to U.S., 1997
Reynosa 94 13 252 Nuevo Laredo 52 8 23 Matamoros 113 21 400 Tijuana 628 290 5,803 Mexicali 158 71 1,258 San Luis 28 2 130 Nogales 74 35 137 Agua Prieta 32 10 67 Ciudad Juárez 289 246 2,066 Ciudad Acuña 53 3 1 Piedras Negras 45 2 0 Total Border Cities 1,566 701 10,137 Other Cities in Border States
436 88 920
TOTAL 2,002 789 11,057
Approximately 800 companies, or about 40% of all the maquiladoras located in border states in 1997 are reported as having shipped either hazardous or non-hazardous waste from Mexico to the U.S. sometime during 1997. However, most of the maquiladoras in the database are just from two cities, Ciudad Juárez and Tijuana, and the vast majority of waste from these two cities comes from a handful of maquiladoras.
The Generation and Management of Hazardous Wastes and Transboundary Hazardous Waste Shipments between Mexico, Canada and the United States, 1990-2000
27
Source: Column II: INEGI, Estadísticas de la Industria Maquiladora de Exportación, December 1997; Column III: Query Run on U.S. Environmental Protection Agency, HAZTRAKS Database, 1998. Column III: U.S. Environmental Protection Agency, Region 6, HAZTRAKS Web Page, April 1999.
The Generation and Management of Hazardous Wastes and Transboundary Hazardous Waste Shipments between Mexico, Canada and the United States, 1990-2000
28
B. Mexico
Like the United States, Mexico has seen a rise in the amount of hazardous waste generated and managed within its borders. Because of the maquiladora sector, Mexico has also witnessed an increase in the amount of waste exported to the United States. This section examines changes that have occurred at different levels of society and government in Mexico since NAFTA, starting with federal laws and regulations. 1. Government Policy a. Federal Laws and Regulations In 1996, Mexico's Congress approved revisions to the LGEEPA. The revisions to the General Law state that the policy of Mexico is to prevent the generation of hazardous waste, emphasizing minimization policies, recycling and secondary materials recovery. Major revisions to the LGEEPA related to hazardous waste management include: • Establishing a system to differentiate the hazardousness of wastes into "high," "medium" and
"low," through NOMs (Normas Oficiales Mexicanas), to make them easier to manage. • Allowed importers and exporters of hazardous waste to obtain a single authorization for the
year for shipments of hazardous waste, rather than an authorization for each individual shipment.
• Establishing the possibility of transferring control of management of some "low" hazardous wastes to state governments (non-hazardous wastes have always been subject to state government regulation);
• Allowing disposal of hazardous waste in landfills ONLY in those cases where recycling or secondary materials recovery is not technically or economically feasible and prohibiting the disposal of liquid hazardous wastes in landfills; and
• Prohibiting the import of hazardous materials or wastes that have been banned from production or use in the country of origin.
The Amendments kept the major provisions of the General Law regarding export and import of hazardous wastes, including Article 153 – prohibiting import for final disposal or storage -- and Article 55 – mandating return of hazardous waste by maquiladoras. Other important new regulations passed between 1994 and 1999 included: • creation of a standard involving the management of medical waste; • an agreement with the cement industry allowing for incineration of hazardous wastes; • creation of a new hazardous waste tracking system; new regulations on reporting industrial
accidents; and • creation of a voluntary hazardous waste and toxic release-reporting program.
The Generation and Management of Hazardous Wastes and Transboundary Hazardous Waste Shipments between Mexico, Canada and the United States, 1990-2000
29
Table 17. Mexican Government Regulations and Actions regarding Hazardous Waste since 1994 Regulation or Action Description Outcome NOM-087-ECOL-95 Establishes requirements for
separation, packaging, storage, collection, transport, treatment and final disposal of medical hazardous waste.
Has led to over 3,000 medical facilities having to manage their wastes as well as an increase in incinerators and other medical waste management facilities
March 1996 Agreement with Cement Industry
Allowed for temporary authorization for incineration in cement kilns
Despite lack of official standard, has allowed virtually all cement plants in Mexico to burn liquid and solid hazardous waste.
November 1998 Aviso de Retorno System and creation of SIRREP database
Mexico announced that Maquiladoras no longer needed to obtain “Guia Ecológicas” but could instead simply tell the authorities when they were returning hazardous wastes
Has led to a more accurate count of hazardous waste from Mexico but has decreased obligations and oversight.
Environmental Emergencies Branch (DGEA)
As per 1996 amendments, created a government entity and center to provide information and gather statistics on industrial accidents, and enforce rules
Led to much better statistical information on industrial accidents as well as governmental response.
NMX-XXX-SCFI-1999 Voluntary Pollutant Release and Transfer Registry, List of Substances and Reporting
Industries must report information to INE about air emissions; however, information about hazardous waste and toxic emissions is strictly voluntary.
Led to Mexico’s first PRTR report, but only 5% of the participating industries supplied any voluntary data, and many industries did not participate at all.
Still, there are major gaps in Mexico’s environmental regulations and several proposed standards have yet to be approved, including standards for incineration, lubricant treatment and recycling, and PCB management, among others. As a response to the perceived lack of available landfills, Mexico has begun promoting the establishment of a series of CIMARIs -- Integrated Centers for Handling, Recycling and Disposal of Hazardous Waste. According to INE, the development of CIMARIs is intended to alleviate the country's lack of disposal facilities, and provide a full range of possibilities for waste treatment and recycling in a few central locations. CIMARIs are being held up as the solution to Mexico’s hazardous waste management problems, with the government “assuming an open role of promotion (SEMARNAP 1996, 149).” According to Mexico’s official program for hazardous waste management, “an environmental market is an end in and of itself to respond to the necessities of environmental protection and to reinforce the interrelation between environmental policy and economic development. (SEMARNAP 1996, 151).” As of 1998, eight Mexican companies -- most of whom have a U.S. partner -- had been approved by INE as meeting the technological requirements to set up a CIMARI, though the standards have yet to be approved. However, the first company to attempt to open a “CIMARI” failed, due to citizen opposition and irregularities in the approval of an Environmental Impact Assessment.
The Generation and Management of Hazardous Wastes and Transboundary Hazardous Waste Shipments between Mexico, Canada and the United States, 1990-2000
30
As part of the process of promoting CIMARIs, INE has also created a "vulnerability atlas" for all of Mexico, including the entire length of the U.S. - Mexico border. The idea was to determine the most appropriate sites for the management, treatment, storage and disposal of hazardous waste. Although the atlas is reported to be complete and was originally intended to produce social consensus on appropriate sites for CIMARIs, it never underwent public review and is only being used as “an instrument of support (Border XXI Working Group, 2000, 3).” b. Federal Enforcement Since 1993, PROFEPA has continued to inspect, levy fines and close industries; on the other hand, it has also attempted to bring more industries into its National Environmental Auditing Program to correct problems through voluntary action rather than traditional enforcement. While the total number of inspections decreased slightly over the time period, the number of industries with major violations also decreased, while the number of minor violations increased slightly. It is difficult to surmise whether this suggests better overall compliance with environmental regulations or simply that some companies with major violations were never inspected. The amount of inspections and compliance rates do not differ significantly between the border and the nation as a whole, whether looking at maquiladoras only or all border industries. Total fines levied against companies totaled $100 million pesos between 1992 and 1997, including $50 million between 1995 and 1997 (PROFEPA 1998, Figure 5). These fines are small by U.S. enforcement standards. Similarly, the number of companies participating in the Auditing Program increased during the 1994-99 period, which PROFEPA cites as one of its rationales for reducing the universe of industries it has inspected in recent years. In all, PROFEPA reports that 1,439 facilities have undergone environmental audits, 133 of which have been certified as “Clean Industries”. Table 18. Number of Industrial Inspections and Environmental Compliance Rates Over Time, 1994-99 Year 1994 1995 1996 1997 1998 1999 Inspections 12,902 12,881 13,224 11,761 9,590 8,671 % Without Violations 20.6 27.6 25.1 20.6 21.7 20.2 % With Minor Violations 75.7 70.3 72.9 77.4 76.7 78.1 % With Major Violations 4.1 2.1 1.9 2.0 1.6 1.7 Source: PROFEPA, Indices de Cumplimiento de la Normatividad en Mexico (January 1999), Graphic 4. Table 19. Inspections and Compliance Rates, Border States vs. Nation, August 1992 – June 2000 Category All Border Facilities Maquiladoras Entire Nation Total Number of Industrial Inspections
20,768 6,911 91,879
Total Shutdowns 200 29 571 % Shutdowns 1.0 % 0.4% 0.6% Partial Shutdowns 519 172 2,104 % Partial Shutdowns 2.5 % 2.5% 2.2% Total With Minor Violations 16,238 5,154 69,700 % With Minor Violations 78.1% 74.5% 75.9% Total without Violation 3,811 1,556 19,504 % Without Violations 18.3% 22.5% 21.2% Source: Subprocuraduria de Verificacion Industrial, PROFEPA, Website
The Generation and Management of Hazardous Wastes and Transboundary Hazardous Waste Shipments between Mexico, Canada and the United States, 1990-2000
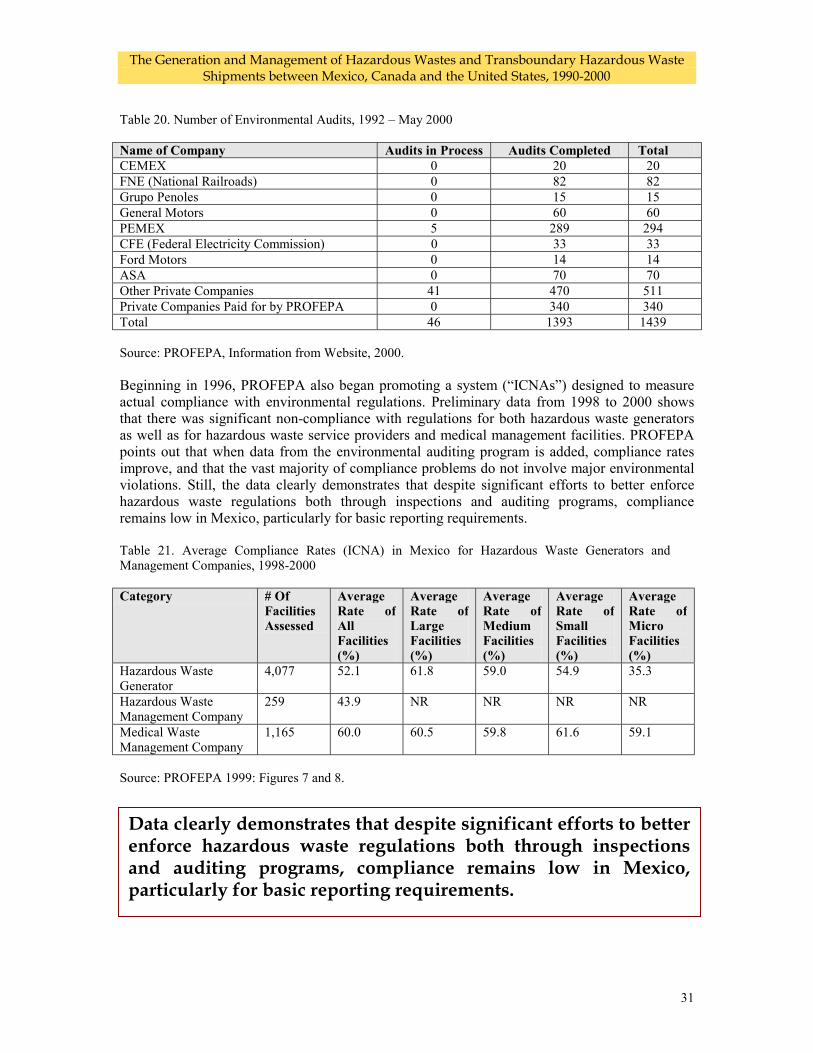
31
Table 20. Number of Environmental Audits, 1992 – May 2000 Name of Company Audits in Process Audits Completed Total CEMEX 0 20 20 FNE (National Railroads) 0 82 82 Grupo Penoles 0 15 15 General Motors 0 60 60 PEMEX 5 289 294 CFE (Federal Electricity Commission) 0 33 33 Ford Motors 0 14 14 ASA 0 70 70 Other Private Companies 41 470 511 Private Companies Paid for by PROFEPA 0 340 340 Total 46 1393 1439 Source: PROFEPA, Information from Website, 2000. Beginning in 1996, PROFEPA also began promoting a system (“ICNAs”) designed to measure actual compliance with environmental regulations. Preliminary data from 1998 to 2000 shows that there was significant non-compliance with regulations for both hazardous waste generators as well as for hazardous waste service providers and medical management facilities. PROFEPA points out that when data from the environmental auditing program is added, compliance rates improve, and that the vast majority of compliance problems do not involve major environmental violations. Still, the data clearly demonstrates that despite significant efforts to better enforce hazardous waste regulations both through inspections and auditing programs, compliance remains low in Mexico, particularly for basic reporting requirements. Table 21. Average Compliance Rates (ICNA) in Mexico for Hazardous Waste Generators and Management Companies, 1998-2000 Category # Of
Facilities Assessed
Average Rate of All Facilities (%)
Average Rate of Large Facilities (%)
Average Rate of Medium Facilities (%)
Average Rate of Small Facilities (%)
Average Rate of Micro Facilities (%)
Hazardous Waste Generator
4,077 52.1 61.8 59.0 54.9 35.3
Hazardous Waste Management Company
259 43.9 NR NR NR NR
Medical Waste Management Company
1,165 60.0 60.5 59.8 61.6 59.1
Source: PROFEPA 1999: Figures 7 and 8.
Data clearly demonstrates that despite significant efforts to better enforce hazardous waste regulations both through inspections and auditing programs, compliance remains low in Mexico, particularly for basic reporting requirements.
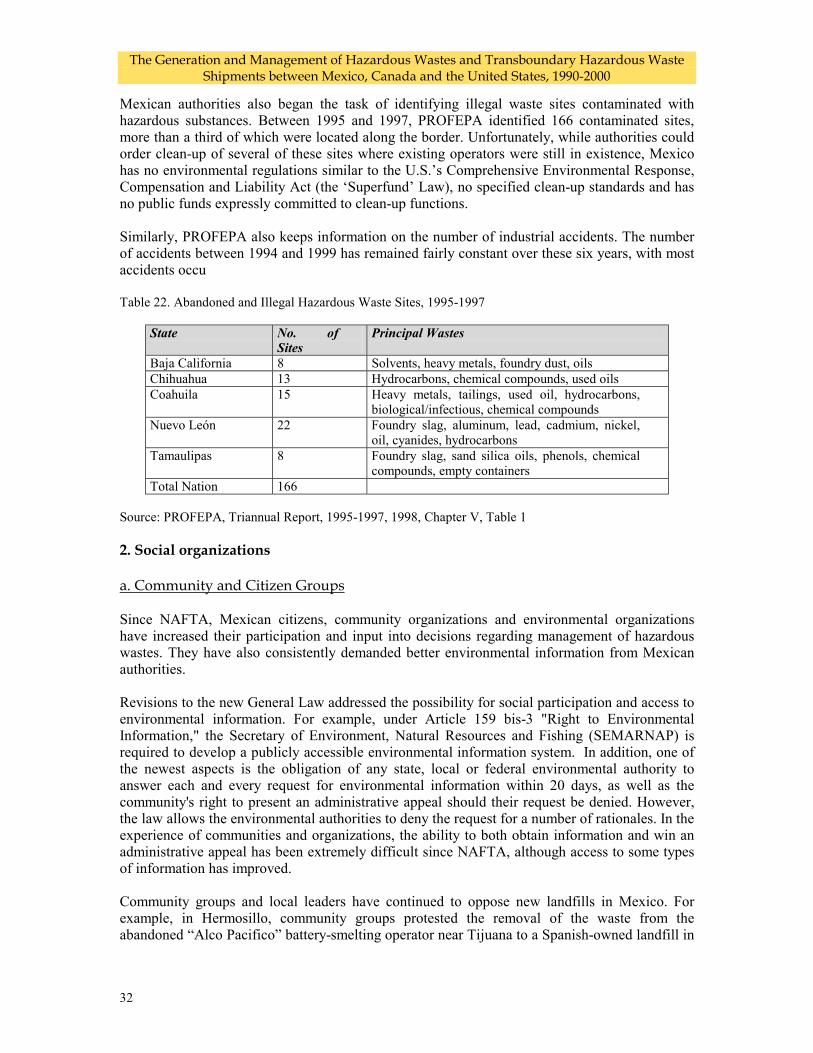
The Generation and Management of Hazardous Wastes and Transboundary Hazardous Waste Shipments between Mexico, Canada and the United States, 1990-2000
32
Mexican authorities also began the task of identifying illegal waste sites contaminated with hazardous substances. Between 1995 and 1997, PROFEPA identified 166 contaminated sites, more than a third of which were located along the border. Unfortunately, while authorities could order clean-up of several of these sites where existing operators were still in existence, Mexico has no environmental regulations similar to the U.S.’s Comprehensive Environmental Response, Compensation and Liability Act (the ‘Superfund’ Law), no specified clean-up standards and has no public funds expressly committed to clean-up functions. Similarly, PROFEPA also keeps information on the number of industrial accidents. The number of accidents between 1994 and 1999 has remained fairly constant over these six years, with most accidents occu Table 22. Abandoned and Illegal Hazardous Waste Sites, 1995-1997
State No. of Sites
Principal Wastes
Baja California 8 Solvents, heavy metals, foundry dust, oils Chihuahua 13 Hydrocarbons, chemical compounds, used oils Coahuila 15 Heavy metals, tailings, used oil, hydrocarbons,
biological/infectious, chemical compounds Nuevo León 22 Foundry slag, aluminum, lead, cadmium, nickel,
oil, cyanides, hydrocarbons Tamaulipas 8 Foundry slag, sand silica oils, phenols, chemical
compounds, empty containers Total Nation 166
Source: PROFEPA, Triannual Report, 1995-1997, 1998, Chapter V, Table 1 2. Social organizations a. Community and Citizen Groups Since NAFTA, Mexican citizens, community organizations and environmental organizations have increased their participation and input into decisions regarding management of hazardous wastes. They have also consistently demanded better environmental information from Mexican authorities. Revisions to the new General Law addressed the possibility for social participation and access to environmental information. For example, under Article 159 bis-3 "Right to Environmental Information," the Secretary of Environment, Natural Resources and Fishing (SEMARNAP) is required to develop a publicly accessible environmental information system. In addition, one of the newest aspects is the obligation of any state, local or federal environmental authority to answer each and every request for environmental information within 20 days, as well as the community's right to present an administrative appeal should their request be denied. However, the law allows the environmental authorities to deny the request for a number of rationales. In the experience of communities and organizations, the ability to both obtain information and win an administrative appeal has been extremely difficult since NAFTA, although access to some types of information has improved. Community groups and local leaders have continued to oppose new landfills in Mexico. For example, in Hermosillo, community groups protested the removal of the waste from the abandoned “Alco Pacifico” battery-smelting operator near Tijuana to a Spanish-owned landfill in
The Generation and Management of Hazardous Wastes and Transboundary Hazardous Waste Shipments between Mexico, Canada and the United States, 1990-2000
Hermosillo called “CYTRAR.” The license for the facility was revoked in 1998 by Mexican authorities. Similarly, Mexican groups, citizens and some political leaders mounted an opposition campaign against a proposed hazardous waste landfill between Torreón and Saltillo in the State of Coahuila, which has not been approved.
Citizens have also taken advantage ofdenuncias populares with PROFEPA.1995 and 1997, citizens filed 17,200central offices, a significant increascomplaints were related to managemeemissions and improper forest managem Finally, some groups have begun to tthrough the Commission on EnvironCoalition, a U.S. NGO, and the ComMexican government for failing to abandoned battery smelter which hasauthorities were to have shut it down. Ito proceed with a factual record of Sonora has submitted a claim with environmental laws against a companyand Mexican companies. In additionDerechos Humanos S.A. -- refiled a cthe law when allowing operation of tEnvironmental Impact Assessment, am b. The Waste Management Industry
The hazardous waste management secMexico’s permitting authority, continincineration facilities for both medical Waste Disposal Capacity).
Much of this increase was spurred by 1995, Mexico approved regulations fwastes, which forced hospitals and characterize and treat their wastes orcompanies established autoclave and iservices.
In addition, the Mexican government accases –solid wastes and the subseque
Community groups and local leaders have continued to oppose new landfills in Mexico.
Foreign companies have bemarket.
33
provisions in the General Law to register complaints, or Many of these have been in the border region. Between environmental complaints with PROFEPA’s state and e since 1994. Nevertheless, only 1 percent of these nt of hazardous wastes, with the majority involving air ent (PROFEPA1998, Chapter IV).
ake advantage of the NAFTA side-agreement provisions mental Cooperation. In 1998, the Environmental Health ité Ciudadano de Tijuana filed a complaint against the
enforce its laws against Metales y Derivados S.A., an operated outside Tijuana for six years after Mexican
n May of 2000, the CEC Council instructed the Secretariat the case. More recently, a human rights organization in the CEC, alleging that Mexico has failed to enforce
called Molymex, which processes residues from both U.S. , a group in Hermosillo -- the Acedemia Sonorense de omplaint in 2000 alleging that Mexican authorities broke he CYTRAR landfill in Hermosillo without an approved ong other charges.
tor grew tremendously between 1992 and 2000 as INE, ued to permit a number of treatment, recycling and hazardous and industrial hazardous waste (see section on
the adoption of new policies and standards in Mexico. In or the treatment and incineration of medical hazardous other medical facilities generating hazardous waste to send them off-site to disposal facilities. Many private ncineration facilities to offer medical waste management
tively promoted the fuel blending of liquid – and in some nt incineration in cement kilns as a means to reuse and
come involved in the Mexican
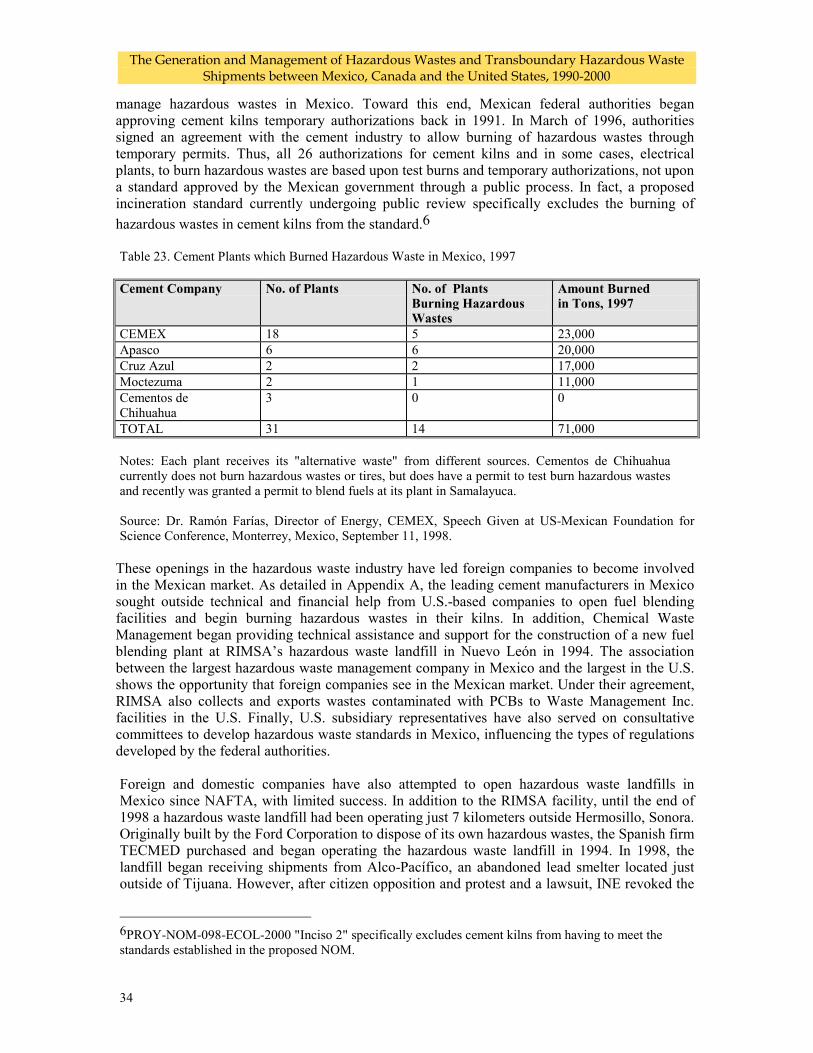
The Generation and Management of Hazardous Wastes and Transboundary Hazardous Waste Shipments between Mexico, Canada and the United States, 1990-2000
34
manage hazardous wastes in Mexico. Toward this end, Mexican federal authorities began approving cement kilns temporary authorizations back in 1991. In March of 1996, authorities signed an agreement with the cement industry to allow burning of hazardous wastes through temporary permits. Thus, all 26 authorizations for cement kilns and in some cases, electrical plants, to burn hazardous wastes are based upon test burns and temporary authorizations, not upon a standard approved by the Mexican government through a public process. In fact, a proposed incineration standard currently undergoing public review specifically excludes the burning of hazardous wastes in cement kilns from the standard.6 Table 23. Cement Plants which Burned Hazardous Waste in Mexico, 1997 Cement Company No. of Plants No. of Plants
Burning Hazardous Wastes
Amount Burned in Tons, 1997
CEMEX 18 5 23,000 Apasco 6 6 20,000 Cruz Azul 2 2 17,000 Moctezuma 2 1 11,000 Cementos de Chihuahua
3 0 0
TOTAL 31 14 71,000 Notes: Each plant receives its "alternative waste" from different sources. Cementos de Chihuahua currently does not burn hazardous wastes or tires, but does have a permit to test burn hazardous wastes and recently was granted a permit to blend fuels at its plant in Samalayuca. Source: Dr. Ramón Farías, Director of Energy, CEMEX, Speech Given at US-Mexican Foundation for Science Conference, Monterrey, Mexico, September 11, 1998.
These openings in the hazardous waste industry have led foreign companies to become involved in the Mexican market. As detailed in Appendix A, the leading cement manufacturers in Mexico sought outside technical and financial help from U.S.-based companies to open fuel blending facilities and begin burning hazardous wastes in their kilns. In addition, Chemical Waste Management began providing technical assistance and support for the construction of a new fuel blending plant at RIMSA’s hazardous waste landfill in Nuevo León in 1994. The association between the largest hazardous waste management company in Mexico and the largest in the U.S. shows the opportunity that foreign companies see in the Mexican market. Under their agreement, RIMSA also collects and exports wastes contaminated with PCBs to Waste Management Inc. facilities in the U.S. Finally, U.S. subsidiary representatives have also served on consultative committees to develop hazardous waste standards in Mexico, influencing the types of regulations developed by the federal authorities. Foreign and domestic companies have also attempted to open hazardous waste landfills in Mexico since NAFTA, with limited success. In addition to the RIMSA facility, until the end of 1998 a hazardous waste landfill had been operating just 7 kilometers outside Hermosillo, Sonora. Originally built by the Ford Corporation to dispose of its own hazardous wastes, the Spanish firm TECMED purchased and began operating the hazardous waste landfill in 1994. In 1998, the landfill began receiving shipments from Alco-Pacífico, an abandoned lead smelter located just outside of Tijuana. However, after citizen opposition and protest and a lawsuit, INE revoked the
6PROY-NOM-098-ECOL-2000 "Inciso 2" specifically excludes cement kilns from having to meet the standards established in the proposed NOM.
The Generation and Management of Hazardous Wastes and Transboundary Hazardous Waste Shipments between Mexico, Canada and the United States, 1990-2000
35
licensing permit of CYTRAR, ordering the company --owned by a Spanish company called TECMED -- to cease operations by November 20 (Jacott 2000, 42). The company is currently not operating in Mexico but has filed a Chapter 11 complaint with the International Center for the Settlement of Investment Disputes. (Nauman 2000). Similarly, Metalclad subsidiaries attempted to open hazardous waste landfills in Aguascalientes and San Luis Potosí, but met stiff opposition, including from local and state regulators. In January 1997, Metalclad Corporation filed a Chapter 11 complaint through the International Center for the Settlement of Investment Disputes alleging that the Mexican state of San Luis Potosi violated NAFTA’s investor right provisions when it prevented the company from opening its 360,000 ton-per-year hazardous waste disposal landfill, in essence “expropriating” its property. Even though the Mexican federal authorities had given an authorization to the site in 1995, state and municipal government prevented the landfill from opening by never issuing land use permits, and declaring the area an environmental reserve. The company sought $90 million in damages. On August 30, 2000, the three-member tribunal ruled in Metalclad’s favor, ordering Mexico to pay $16.7 million in damages for failing to protect the company’s rights as an investor. The Chapter 11 decision occurred behind closed doors. An appeal by the Mexican government to a “neutral” Canadian court was recently upheld (DePalma). In the meantime, however, the company decided to divest itself of its Mexican operations, including its two San Luis Potosi-based companies, Ecosistemas del Potosi and Confinamiento Tecnico de Residuos Industriales (Metalclad 2000, 10). Table 24. Hazardous Waste Landfills Which Have Operating Permits in Mexico, 1998 Facility Name Location Ciba-Geigy Atotonilquillo, Jalisco CONFIN* Guadalcazar, San Luis Potosí RIMSA Mina, Nuevo León CYTRAR** Hermosillo, Sonora Source: Instituto Ecologico de Mexico, Information from web page (http://www.ine.gob.mx/dgmrar/ri/list-ea/rubro7.htm), April 1999. Finally, in 1997 -- Servicios Ambientales de Coahuila -- proposed building a “CIMARI” just north of the town of General Cepada, Coahuila, between Saltillo and Torreón, near an important water reservoir and migratory bird sanctuary called the Presa de Tulillo. A $70 million joint venture between RACT, a Utah-based management company, and CleanMex, a Tamaulipas company, the landfill and recycling facility now appears stalled due to opposition from farmers, ranchers, residents of Saltillo and Torreón and Mexico's political opposition parties. The site was supported and approved in virtual secrecy by the local municipality and a "preventative study" was approved by INE. After plans for the facility became public, INE declared that a more rigorous environmental impact statement (EIS) would be required in order for a permit to be issued (Jacott 2000, 44). 3. Disposal Capacity
Public investment in all solid waste management declined slightly between 1990 and 1996, in large part of the contraction of the economy, although parastatal companies like CFE and PEMEX did invest significant amounts of money in managing hazardous wastes. Overall, total public environmental investment rose slightly over the period, mainly in water and wastewater
The Generation and Management of Hazardous Wastes and Transboundary Hazardous Waste Shipments between Mexico, Canada and the United States, 1990-2000
36
infrastructure. Similarly, the total amount of money spent by the public sector in environmental protection also declined slightly from 1990 to 1998. Since 1996, there has been significant investment in new private hazardous waste facilities. By 2000, INE reports that there were more than 500 facilities that had authorizations to collect, store, recycle, treat, incinerate or landfill hazardous wastes, a huge increase since 1994. About 40% of these facilities were located in one of the six border states, indicating there is substantial infrastructure in this part of the country. In addition, since the 1995 standards requiring treatment and/or incineration of medical waste were adopted, more than 56 facilities have been authorized. There has also been a large increase in authorized facilities to incinerate hazardous wastes in cement kilns. Unfortunately, the Mexican government has not conducted a public capacity assessment detailing the total capacity or current hazardous waste management of these industries. Under the nation’s first attempt at a national Pollutant Release and Transfer Registry –known as the RETC in Mexico – only six hazardous waste management companies reported any information to Mexican federal authorities (SEMARNAP 1999, Appendix). Table 25. Total Public Investment in Environmental Protection, and Solid Waste Management, 1990-1996 (Thousands of Dollars) 1 1990 1991 1992 1993 1994 1995 1996 Capital Investment Solid Wastes 2 127,536 36,067 52,560 21,837 51,257 28,421 22,740 Total Env. Investment 393,891 291,819 367,970 439,410 427,344 248,895 262,896 Operating Investment Solid Wastes 2 4,348 147,945 219,318 239,362 223,677 124,780 122,195 Total Env. Investments3 492,217 784,560 1,058,368 1,324,199 1,406,648 700,843 682,114 Total Investment Solid Waste 2 131,884 184,012 271,878 261,199 274,934 153,201 144,935 Total Env. Investment 3 886,107 1,076,379 1,426,338 1,763,609 1,833,991 949,738 945,010 1. The figures cover the primary expenditures of public investment in environmental protection,
including the Federal Governement, State Governments, and Mexico City. Parastatal companies such as Petroleos Mexicanos (PEMEX) and Comisión Federal de Electricidad are also included.
2. This includes the collection, treatment and management of all wastes, including municipal, industrial, hazardous and others.
3. In addition to the investment in waste management, total investments include water, soils, air and other.
Source: INEGI, using information from the Federal Budget (Presupuesto de Egresos de la Federación) and Federal Public Treasury Account (Cuenta de la Hacienda Pública Federal) for the years covered. Figures prepared by SEMARNAP for a report to the OECD on investment in pollution abatement and control.
Note: The information available on public investment in waste treatment is still too aggregated for meaningful analysis. Treatment and collection are listed, without information on whether the wastes are hazardous, industrial non-hazardous, municipal or other. Neither is there any break-out information on investment in equipment, operation, maintenance, fuels or salaries.
The Generation and Management of Hazardous Wastes and Transboundary Hazardous Waste Shipments between Mexico, Canada and the United States, 1990-2000
37
Table 26. Public Expenditure in Environmental Protection as Percentage of Gross Domestic Product, 1990-1998 (Millions of Pesos at Non-Adjusted Prices) Year Gross Domestic Product 1 Environmental Protection
Expenditures 2 Protection/GDP (%)
1990 676,067.0 2,536 0.38 1991 868,219.2 3,248 0.37 1992 1,029,004.6 4,414 0.43 1993 1,155,132.2 5,494 0.48 1994 1,306,301.6 6,190 0.47 1995 1,678,834.8 6,096 0.36 1996 2,296,674.6 7,182 0.31 1997 2,873,273.0 7,934 0.28 1998 3,516,344.8 8,643 0.25 1 GDP in basic values. 2 Refers to those categories of the budget actually spent, eliminating those that were budgeted but never carried out, as well as those which did not directly relate to environmental protection. Source: INEGI, Sistema de Cuentas Económicas y Ecológicas de México, 1988-1998, México 2000. Table 27. Geographic Distribution of Hazardous Waste Collection, Storage and Management Facilities in Mexico State or Region
Collection and Transport
Storage
Reuse Recycling
Treatment Burning (1)
Landfills
Total
Baja California 25 9 0 8 0 2 0 44 Coahuila 12 0 0 5 1 2 0 20 Chihuahua 17 6 0 2 0 0 0 25 Nuevo León 61 14 0 17 4 1 1 98 Sonora 3 2 0 3 0 0 0 8 Tamaulipas 16 8 0 1 4 0 0 29 Total Border 134 39 0 36 9 5 1 229 Total National 262 82 4 119 40 37 2 546 Note; Burning includes incinerators, cement kilns and aggregate kilns. Fuel blending is considered in treatment. Source: INE, as reported in website (http://www.ine.gob.mx/dgmrar/ri/infra-rip.htm,) with some information updated.
INE reports that there was a huge increase in facilities which had authorizations to collect, store, recycle, treat, incinerate or landfill hazardous wastes by 2000.
The Generation and Management of Hazardous Wastes and Transboundary Hazardous Waste Shipments between Mexico, Canada and the United States, 1990-2000
38
Table 28. Increase in Authorized Facilities in Hazardous Waste Management, including Medical Waste, 1992-1999 Permits and/or Authorizations ‘92 ‘93 ‘94 ‘95 ‘96 ‘97 ‘98 ‘99 ‘00 Tot Reuse of used solvents 0 1 0 0 0 0 1 3 0 5 Recycling of used drums 0 1 3 0 0 1 16 13 5 39 Recycling of dirty solvents 0 4 5 1 1 1 7 2 3 24 Recycling of photographic fixing liquid 0 0 0 0 0 0 1 3 1 5 Recycling of used lubricants 0 2 2 2 1 3 1 4 0 15 Recycling of metals 0 0 3 1 0 2 5 5 2 18 All Recycling and Reuse Facilities 0 8 13 4 2 7 31 30 11 101 Fuel Blending Plants 0 1 2 0 0 0 5 9 2 19 Treatment of PCB contaminated materials 0 0 0 2 1 2 1 0 0 6 Treatment of remnants on-site 0 1 11 1 0 0 4 16 2 35 Treatment of infectious biological remnants 0 0 0 0 0 0 8 11 4 23 Treatment of dangerous remnants 0 1 0 0 1 1 3 5 5 16 All Treatment Facilities 0 2 11 3 2 3 16 32 11 80 Incineration of alternative fuel 1 0 0 0 1 1 7 16 0 26 Incineration of dangerous remnants 0 1 0 0 0 0 3 3 2 9 Incineration of biologically infectious remnants 0 0 0 0 0 0 1 8 5 14 All Incineration Facilities 1 1 0 0 1 1 11 27 7 49 Final Disposal 0 3 0 0 0 0 0 0 0 3 Totals 1 15 26 7 5 11 63 98 31 252 Note: Because some facilities perform more than one type of hazardous waste management, the total number of facilities is less than the total number of permits. Source: INE, information from website.

The Generation and Management of Hazardous Wastes and Transboundary Hazardous Waste Shipments between Mexico, Canada and the United States, 1990-2000
39
4. Waste Generation
Between 1994 and 1999 the number of companies, which had the potential to generate hazardous wastes increased substantially. For example, the chemical, petrochemical, plastics and rubber sector, as well as iron, steel and basic metal industries increased their value added manufacturing during the period, while the number of maquiladoras also increased, both along the border and more rapidly in Mexico’s interior. Not only did the total number of plants and employees increase during this period, but the use of raw materials and foreign inputs also increased, meaning that the wastes generated from these inputs had to be exported back to the country of origin as per Mexican law. Despite the increase in production in facilities believed to produce large amounts of hazardous waste in Mexico, public data on the amount of hazardous waste generated is extremely poor. INE reported that in 1999, only 13,245 companies in all of Mexico actually reported generating hazardous waste, even though officials believed that more than 100,000 companies have the potential to do so. These industries reported generating 3.3 million tons of hazardous waste in 1999, a total that is far below the 1994 estimate of 8.0 million and the 1997 estimate of 10.0 million. Interestingly, some states actually reported totals above 1994 estimates, showing how compliance with reporting requirements vary widely by state and indicating that INE’s estimates may actually be very conservative.
Table 29. Value-Added of Non-Renewable Manufacturing Industries in Mexico, 1990-1998 (Millons of 1993 pesos) Sector 1994 1995 1996 1997 1998 Division V Chemicals, Petro-Chemicals, Plastics and Rubbers
36 270.1 35 935.0 38 297.0 40 910.7 43 374.1
Petroleum and Derivatives 5 061.9 4 736.2 4 786.7 4 725.1 4 968.0 Basic Petro-Chemicals 2 256.2 2 353.8 2 247.9 1 983.3 1 735.4 Chemicals 3 787.8 3 897.4 4 122.3 4 460.1 4 563.5 Fertilizers 489.5 565.9 635.5 549.1 483.2 Synthetic Resins 2 972.5 3 215.5 3 585.0 3 860.0 4 187.9 Pharmaceutical 5 861.0 6 628.1 7 001.5 7 827.4 8 382.4 Soaps, Detergents and Resins 4 556.0 4 251.4 4 377.7 4 694.2 5 084.3 Other Chemicals 4 341.0 3 903.7 4 275.7 4 721.0 5 335.7 Rubber Products 2 116.5 1 901.4 2 233.4 2 459.0 2 765.6 Plastics 4 827.7 4 481.6 5 031.4 5 631.5 5 868.1 Division VI Cement 4 619.8 3 783.6 4 245.3 4 436.3 4 547.2 Division VII Basic Metallic Industries 10 304.9 10 724.6 12 736.1 14 154.0 14 720.1 Iron and Steel Industries 7 275.1 8 076.7 9 281.0 10 360.0 10 561.0 Other Basic Metal Industries 3 029.8 2 647.9 3 455.1 3 794.0 4 159.1 Total 51 194.8 50 443.2 55 278.4 59 501.0 62 641.4 Source: INEGI, Sistema de Cuentas Nacionales de México 1988-1998, México, 2000. As Cited in Indicadores de Desarrollo Sustentable en México. INEGI/SEMARNAP 2000.
Public data on the amount of hazardous waste generated in Mexico is extremely poor.
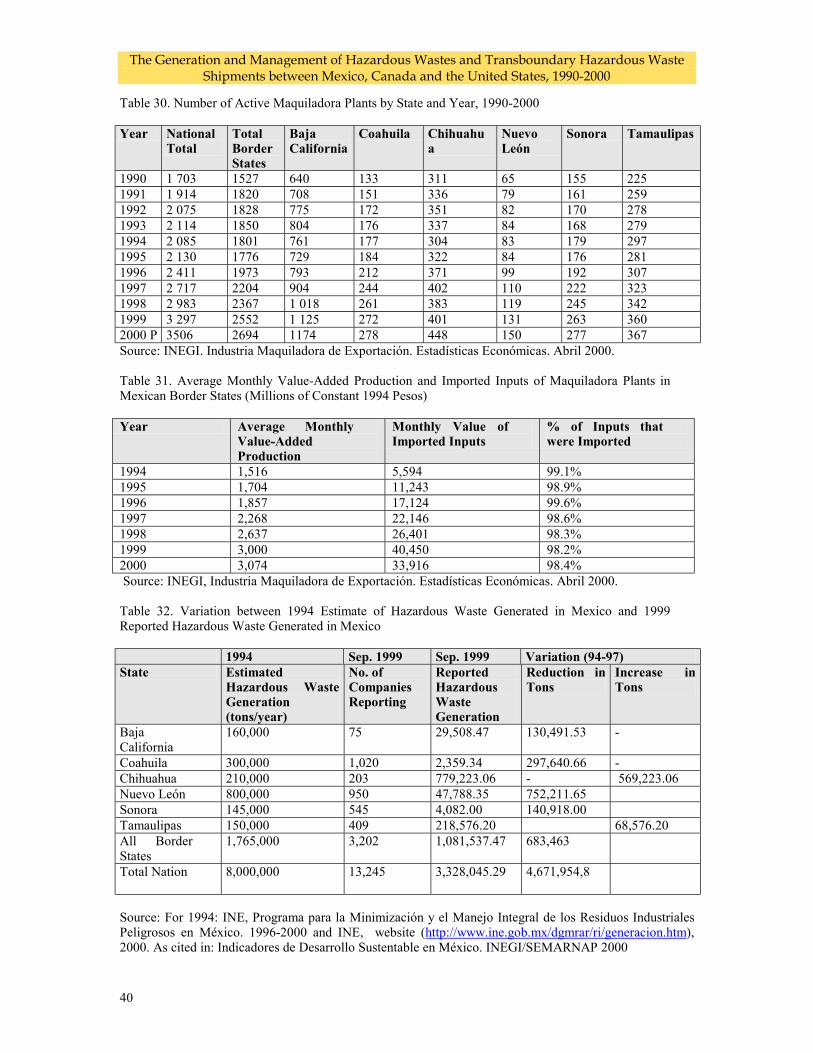
The Generation and Management of Hazardous Wastes and Transboundary Hazardous Waste Shipments between Mexico, Canada and the United States, 1990-2000
40
Table 30. Number of Active Maquiladora Plants by State and Year, 1990-2000 Year National
Total Total Border States
Baja California
Coahuila Chihuahua
Nuevo León
Sonora Tamaulipas
1990 1 703 1527 640 133 311 65 155 225 1991 1 914 1820 708 151 336 79 161 259 1992 2 075 1828 775 172 351 82 170 278 1993 2 114 1850 804 176 337 84 168 279 1994 2 085 1801 761 177 304 83 179 297 1995 2 130 1776 729 184 322 84 176 281 1996 2 411 1973 793 212 371 99 192 307 1997 2 717 2204 904 244 402 110 222 323 1998 2 983 2367 1 018 261 383 119 245 342 1999 3 297 2552 1 125 272 401 131 263 360 2000 P 3506 2694 1174 278 448 150 277 367 Source: INEGI. Industria Maquiladora de Exportación. Estadísticas Económicas. Abril 2000. Table 31. Average Monthly Value-Added Production and Imported Inputs of Maquiladora Plants in Mexican Border States (Millions of Constant 1994 Pesos) Year Average Monthly
Value-Added Production
Monthly Value of Imported Inputs
% of Inputs that were Imported
1994 1,516 5,594 99.1% 1995 1,704 11,243 98.9% 1996 1,857 17,124 99.6% 1997 2,268 22,146 98.6% 1998 2,637 26,401 98.3% 1999 3,000 40,450 98.2% 2000 3,074 33,916 98.4% Source: INEGI, Industria Maquiladora de Exportación. Estadísticas Económicas. Abril 2000. Table 32. Variation between 1994 Estimate of Hazardous Waste Generated in Mexico and 1999 Reported Hazardous Waste Generated in Mexico 1994 Sep. 1999 Sep. 1999 Variation (94-97) State Estimated
Hazardous Waste Generation (tons/year)
No. of Companies Reporting
Reported Hazardous Waste Generation
Reduction in Tons
Increase in Tons
Baja California
160,000 75 29,508.47 130,491.53 -
Coahuila 300,000 1,020 2,359.34 297,640.66 - Chihuahua 210,000 203 779,223.06 - 569,223.06 Nuevo León 800,000 950 47,788.35 752,211.65 Sonora 145,000 545 4,082.00 140,918.00 Tamaulipas 150,000 409 218,576.20 68,576.20 All Border States
1,765,000 3,202 1,081,537.47 683,463
Total Nation 8,000,000 13,245
3,328,045.29 4,671,954,8
Source: For 1994: INE, Programa para la Minimización y el Manejo Integral de los Residuos Industriales Peligrosos en México. 1996-2000 and INE, website (http://www.ine.gob.mx/dgmrar/ri/generacion.htm), 2000. As cited in: Indicadores de Desarrollo Sustentable en México. INEGI/SEMARNAP 2000
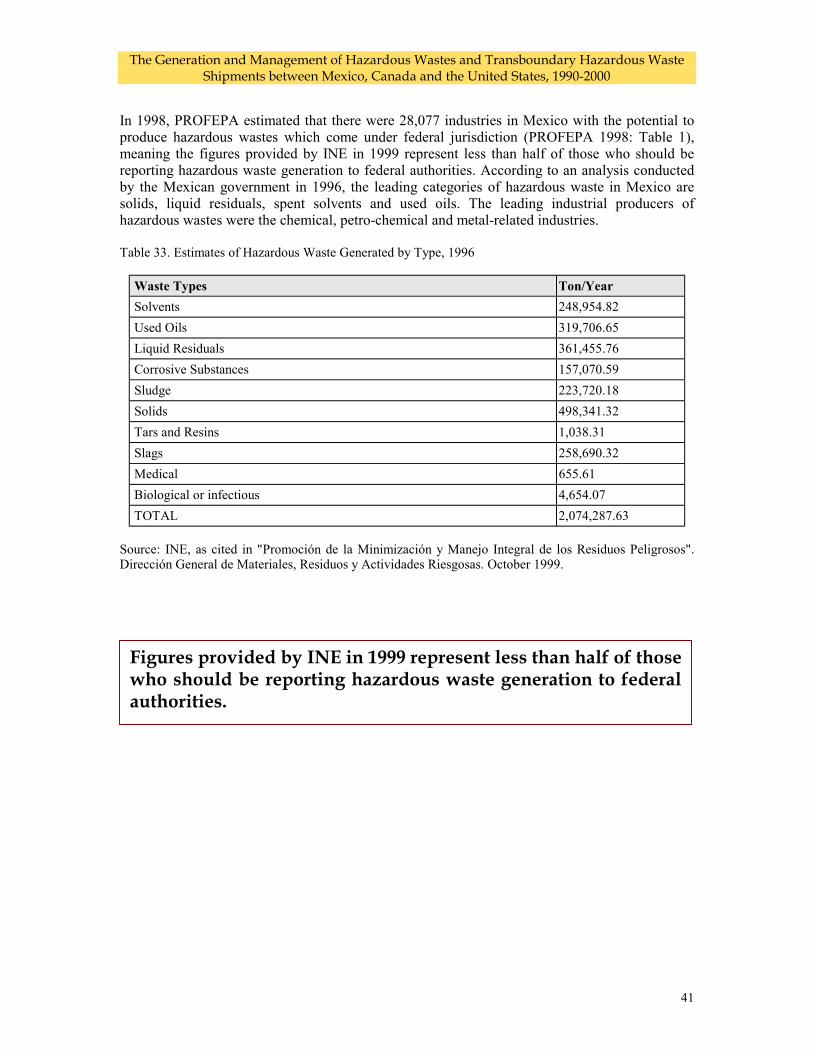
The Generation and Management of Hazardous Wastes and Transboundary Hazardous Waste Shipments between Mexico, Canada and the United States, 1990-2000
41
In 1998, PROFEPA estimated that there were 28,077 industries in Mexico with the potential to produce hazardous wastes which come under federal jurisdiction (PROFEPA 1998: Table 1), meaning the figures provided by INE in 1999 represent less than half of those who should be reporting hazardous waste generation to federal authorities. According to an analysis conducted by the Mexican government in 1996, the leading categories of hazardous waste in Mexico are solids, liquid residuals, spent solvents and used oils. The leading industrial producers of hazardous wastes were the chemical, petro-chemical and metal-related industries. Table 33. Estimates of Hazardous Waste Generated by Type, 1996
Waste Types Ton/Year Solvents 248,954.82 Used Oils 319,706.65 Liquid Residuals 361,455.76 Corrosive Substances 157,070.59 Sludge 223,720.18 Solids 498,341.32 Tars and Resins 1,038.31 Slags 258,690.32 Medical 655.61 Biological or infectious 4,654.07 TOTAL 2,074,287.63
Source: INE, as cited in "Promoción de la Minimización y Manejo Integral de los Residuos Peligrosos". Dirección General de Materiales, Residuos y Actividades Riesgosas. October 1999.
Figures provided by INE in 1999 represent less than half of those who should be reporting hazardous waste generation to federal authorities.
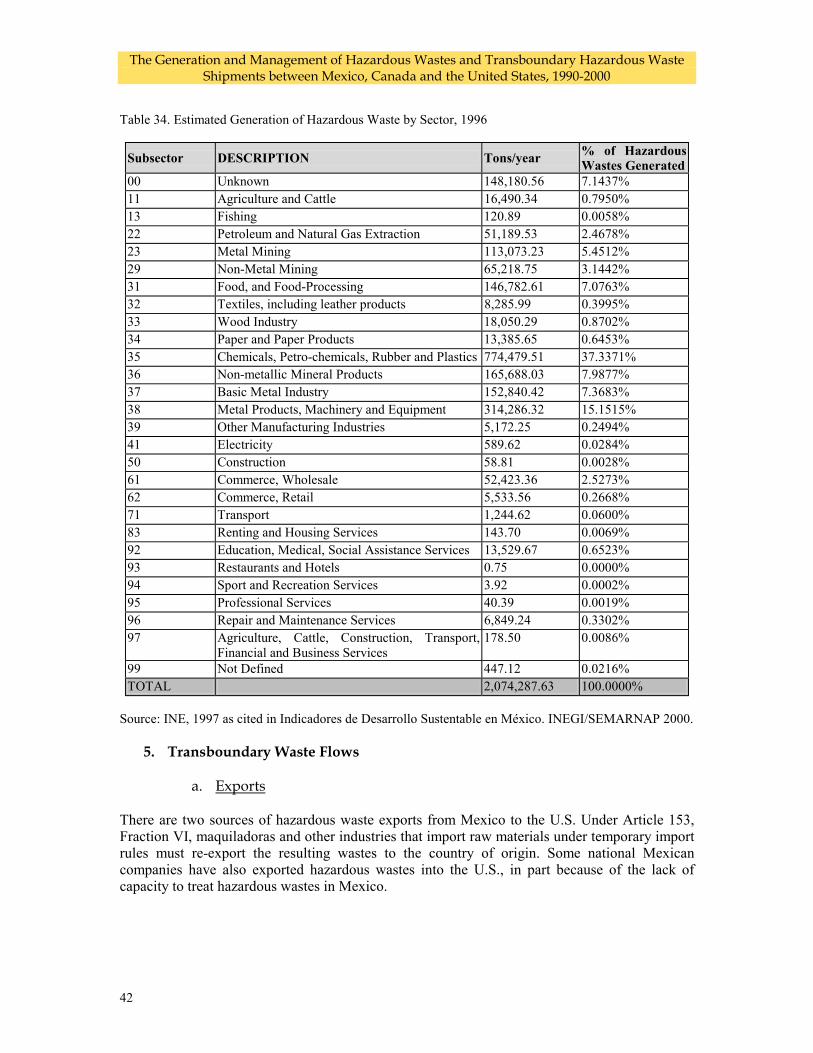
The Generation and Management of Hazardous Wastes and Transboundary Hazardous Waste Shipments between Mexico, Canada and the United States, 1990-2000
42
Table 34. Estimated Generation of Hazardous Waste by Sector, 1996
Subsector DESCRIPTION Tons/year % of Hazardous Wastes Generated
00 Unknown 148,180.56 7.1437% 11 Agriculture and Cattle 16,490.34 0.7950% 13 Fishing 120.89 0.0058% 22 Petroleum and Natural Gas Extraction 51,189.53 2.4678% 23 Metal Mining 113,073.23 5.4512% 29 Non-Metal Mining 65,218.75 3.1442% 31 Food, and Food-Processing 146,782.61 7.0763% 32 Textiles, including leather products 8,285.99 0.3995% 33 Wood Industry 18,050.29 0.8702% 34 Paper and Paper Products 13,385.65 0.6453% 35 Chemicals, Petro-chemicals, Rubber and Plastics 774,479.51 37.3371% 36 Non-metallic Mineral Products 165,688.03 7.9877% 37 Basic Metal Industry 152,840.42 7.3683% 38 Metal Products, Machinery and Equipment 314,286.32 15.1515% 39 Other Manufacturing Industries 5,172.25 0.2494% 41 Electricity 589.62 0.0284% 50 Construction 58.81 0.0028% 61 Commerce, Wholesale 52,423.36 2.5273% 62 Commerce, Retail 5,533.56 0.2668% 71 Transport 1,244.62 0.0600% 83 Renting and Housing Services 143.70 0.0069% 92 Education, Medical, Social Assistance Services 13,529.67 0.6523% 93 Restaurants and Hotels 0.75 0.0000% 94 Sport and Recreation Services 3.92 0.0002% 95 Professional Services 40.39 0.0019% 96 Repair and Maintenance Services 6,849.24 0.3302% 97 Agriculture, Cattle, Construction, Transport,
Financial and Business Services 178.50 0.0086%
99 Not Defined 447.12 0.0216% TOTAL 2,074,287.63 100.0000%
Source: INE, 1997 as cited in Indicadores de Desarrollo Sustentable en México. INEGI/SEMARNAP 2000.
5. Transboundary Waste Flows
a. Exports
There are two sources of hazardous waste exports from Mexico to the U.S. Under Article 153, Fraction VI, maquiladoras and other industries that import raw materials under temporary import rules must re-export the resulting wastes to the country of origin. Some national Mexican companies have also exported hazardous wastes into the U.S., in part because of the lack of capacity to treat hazardous wastes in Mexico.
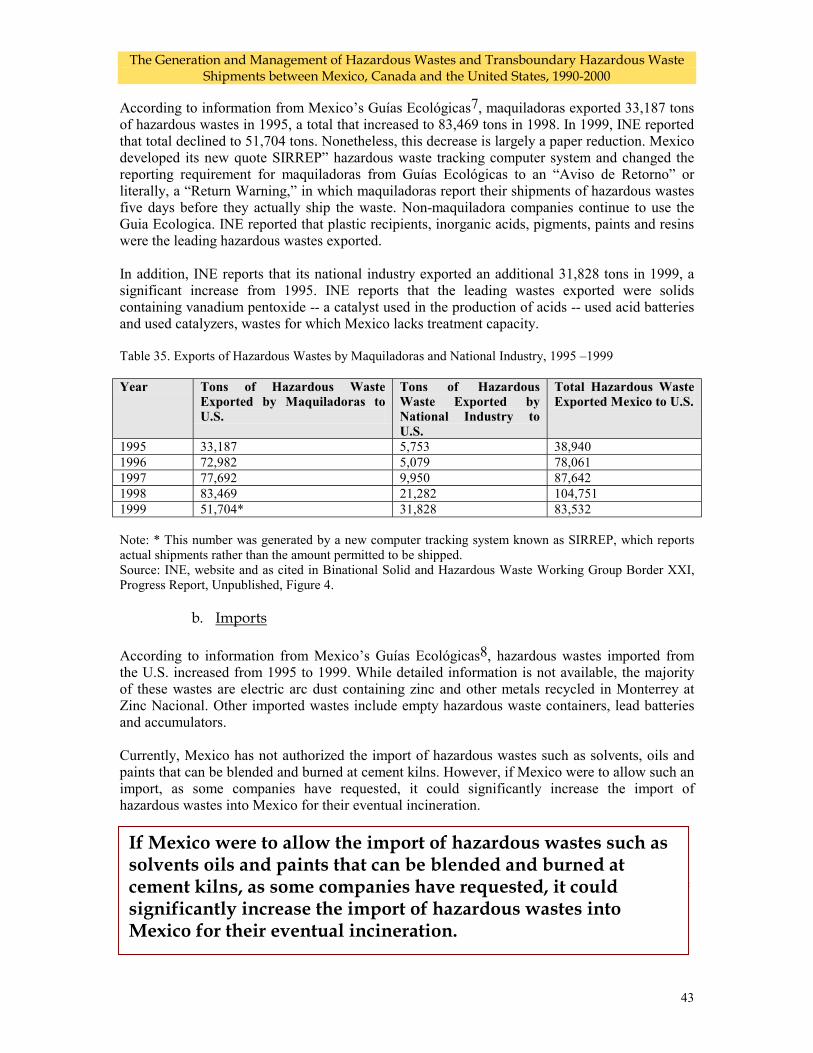
The Generation and Management of Hazardous Wastes and Transboundary Hazardous Waste Shipments between Mexico, Canada and the United States, 1990-2000
43
According to information from Mexico’s Guías Ecológicas7, maquiladoras exported 33,187 tons of hazardous wastes in 1995, a total that increased to 83,469 tons in 1998. In 1999, INE reported that total declined to 51,704 tons. Nonetheless, this decrease is largely a paper reduction. Mexico developed its new quote SIRREP” hazardous waste tracking computer system and changed the reporting requirement for maquiladoras from Guías Ecológicas to an “Aviso de Retorno” or literally, a “Return Warning,” in which maquiladoras report their shipments of hazardous wastes five days before they actually ship the waste. Non-maquiladora companies continue to use the Guia Ecologica. INE reported that plastic recipients, inorganic acids, pigments, paints and resins were the leading hazardous wastes exported. In addition, INE reports that its national industry exported an additional 31,828 tons in 1999, a significant increase from 1995. INE reports that the leading wastes exported were solids containing vanadium pentoxide -- a catalyst used in the production of acids -- used acid batteries and used catalyzers, wastes for which Mexico lacks treatment capacity. Table 35. Exports of Hazardous Wastes by Maquiladoras and National Industry, 1995 –1999 Year Tons of Hazardous Waste
Exported by Maquiladoras to U.S.
Tons of Hazardous Waste Exported by National Industry to U.S.
Total Hazardous Waste Exported Mexico to U.S.
1995 33,187 5,753 38,940 1996 72,982 5,079 78,061 1997 77,692 9,950 87,642 1998 83,469 21,282 104,751 1999 51,704* 31,828 83,532 Note: * This number was generated by a new computer tracking system known as SIRREP, which reports actual shipments rather than the amount permitted to be shipped. Source: INE, website and as cited in Binational Solid and Hazardous Waste Working Group Border XXI, Progress Report, Unpublished, Figure 4.
b. Imports
According to information from Mexico’s Guías Ecológicas8, hazardous wastes imported from the U.S. increased from 1995 to 1999. While detailed information is not available, the majority of these wastes are electric arc dust containing zinc and other metals recycled in Monterrey at Zinc Nacional. Other imported wastes include empty hazardous waste containers, lead batteries and accumulators. Currently, Mexico has not authorized the import of hazardous wastes such as solvents, oils and paints that can be blended and burned at cement kilns. However, if Mexico were to allow such an import, as some companies have requested, it could significantly increase the import of hazardous wastes into Mexico for their eventual incineration.
7 Since 1995, the Mexican government has been reporting the import and export of hazardous waste through a computer database that incorporates all of its “Guías Ecológicas.” However, there is no public information available on where these wastes are actually generated, where the wastes go, what transport companies are used, and who complies adequately with import and export regulations. 8 See footnote 7.
If Mexico were to allow the import of hazardous wastes such as solvents oils and paints that can be blended and burned at cement kilns, as some companies have requested, it could significantly increase the import of hazardous wastes into Mexico for their eventual incineration.
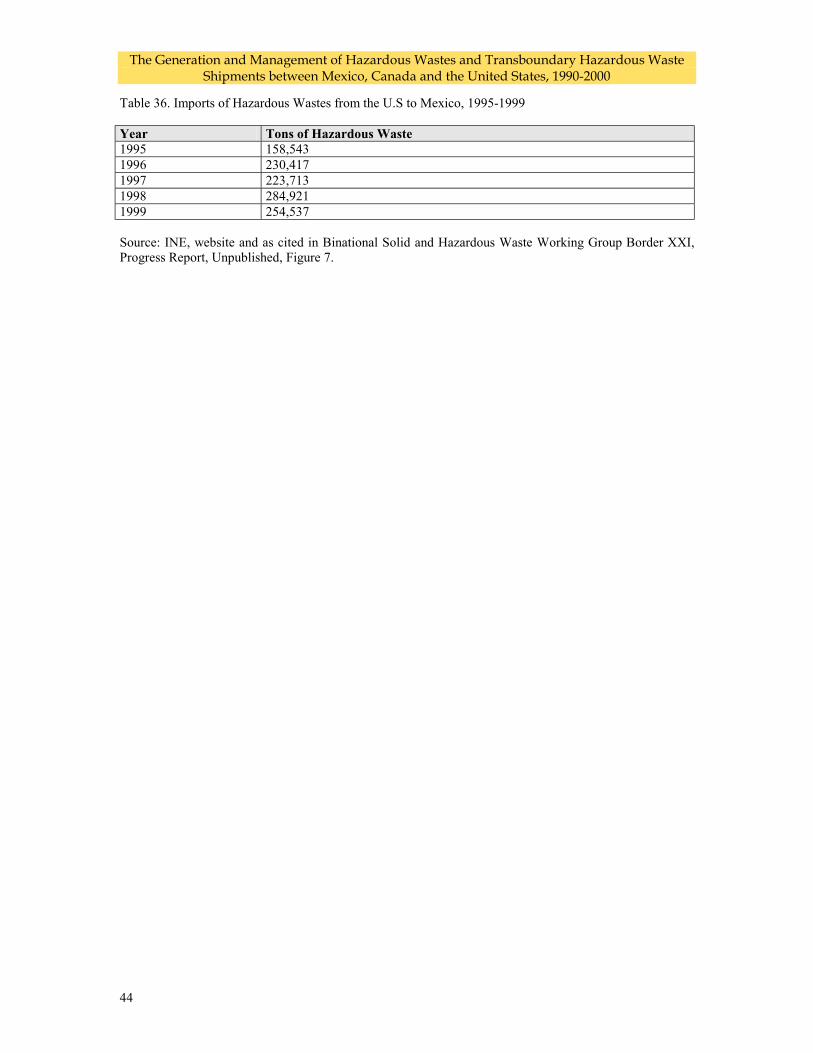
The Generation and Management of Hazardous Wastes and Transboundary Hazardous Waste Shipments between Mexico, Canada and the United States, 1990-2000
44
Table 36. Imports of Hazardous Wastes from the U.S to Mexico, 1995-1999 Year Tons of Hazardous Waste 1995 158,543 1996 230,417 1997 223,713 1998 284,921 1999 254,537 Source: INE, website and as cited in Binational Solid and Hazardous Waste Working Group Border XXI, Progress Report, Unpublished, Figure 7.
The Generation and Management of Hazardous Wastes and Transboundary Hazardous Waste Shipments between Mexico, Canada and the United States, 1990-2000
45
C. Canada In Canada, the federal government has been gradually moving towards strengthening its role in the international and interprovincial movements of hazardous wastes. This has largely been a result of the need to implement obligations under the Basel Convention, ratified in 1992, and its amendments. 1. Government Policy a. Federal Laws and Regulations
Revisions to the Canadian Environmental Protection Act (CEPA) adopted in 1999, grant the federal Minister of the Environment explicit authority to refuse to authorize a waste import or export, even where a province agrees to it, if he or she believes that the waste in question will not be managed in manner that will protect the environment and human health against adverse effects (CEPA 1999, s.185 (2)). The Act also permits the Minister to require that waste exporters to develop and implement plans to reduce or phase-out their export of wastes for final disposal (CEPA 1999, s.188). The revised CEPA permits the federal government to make regulations regarding emergency prevention, preparedness, response and recovery (CEPA 1999, s.200). However, no regulations have been made under these provisions. The Act also permits emergency plans to be required from facilities manufacturing, processing or otherwise using substances that have been found to be ‘toxic’ for the purposes of the Act (CEPA 1999, s.199). Similarly, the Act permits the Minister of the Environment to require the development of pollution prevention plans by facilities that process, manufacture or otherwise use substances that are declared ‘toxic” for the purposes of the Act (CEPA 1999, s.56). However, no emergency planning or pollution prevention planning requirements have been established to date. The Federal Minister of the Environment has indicated that the development of national standards for “environmentally sound management” for purposes of the implementation of Canada’s Basel Convention commitments through CEPA will occur through the Canadian Council of Ministers of the Environment (Anderson March 2000). The Council is made up of the federal, provincial and territorial Ministers of the Environment, and operates on a consensus based decision-making model. b. Federal Enforcement The level of enforcement activity by Environment Canada related to the CEPA hazardous waste import/export regulations remained stable between 1994/95 and 1996/97. In October 1997, the Auditor-General of Canada tabled a report in Parliament that raised serious questions about the effectiveness of the federal government's controls on the transboundary movement of hazardous wastes (Auditor-General of Canada 1997). The report focused on imports and exports of wastes to and from Canada. The federal government departments and agencies identified in the Audit were reported as having agreed to implement the Auditor-General's recommendations. There was a doubling of the number of inspections related to the regulations between 1996/97 and 1997/98.
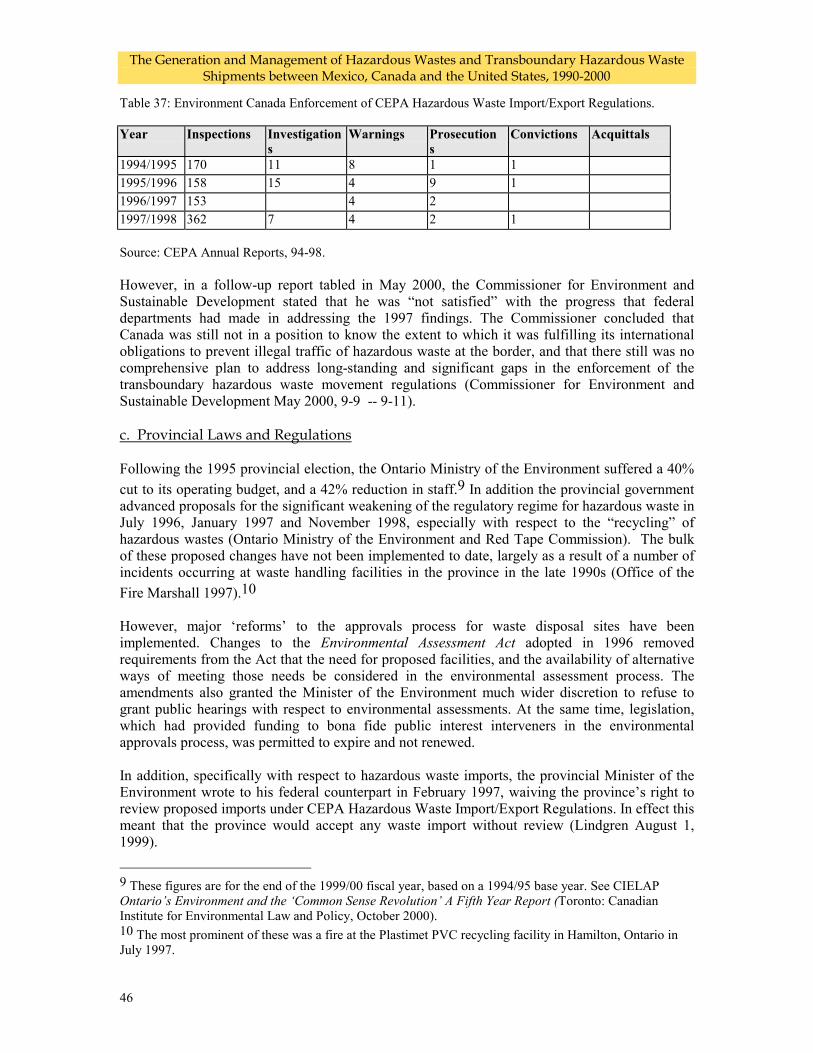
The Generation and Management of Hazardous Wastes and Transboundary Hazardous Waste Shipments between Mexico, Canada and the United States, 1990-2000
46
Table 37: Environment Canada Enforcement of CEPA Hazardous Waste Import/Export Regulations. Year Inspections Investigation
s Warnings Prosecution
s Convictions Acquittals
1994/1995 170 11 8 1 1 1995/1996 158 15 4 9 1 1996/1997 153 4 2 1997/1998 362 7 4 2 1 Source: CEPA Annual Reports, 94-98. However, in a follow-up report tabled in May 2000, the Commissioner for Environment and Sustainable Development stated that he was “not satisfied” with the progress that federal departments had made in addressing the 1997 findings. The Commissioner concluded that Canada was still not in a position to know the extent to which it was fulfilling its international obligations to prevent illegal traffic of hazardous waste at the border, and that there still was no comprehensive plan to address long-standing and significant gaps in the enforcement of the transboundary hazardous waste movement regulations (Commissioner for Environment and Sustainable Development May 2000, 9-9 -- 9-11). c. Provincial Laws and Regulations Following the 1995 provincial election, the Ontario Ministry of the Environment suffered a 40% cut to its operating budget, and a 42% reduction in staff.9 In addition the provincial government advanced proposals for the significant weakening of the regulatory regime for hazardous waste in July 1996, January 1997 and November 1998, especially with respect to the “recycling” of hazardous wastes (Ontario Ministry of the Environment and Red Tape Commission). The bulk of these proposed changes have not been implemented to date, largely as a result of a number of incidents occurring at waste handling facilities in the province in the late 1990s (Office of the Fire Marshall 1997).10 However, major ‘reforms’ to the approvals process for waste disposal sites have been implemented. Changes to the Environmental Assessment Act adopted in 1996 removed requirements from the Act that the need for proposed facilities, and the availability of alternative ways of meeting those needs be considered in the environmental assessment process. The amendments also granted the Minister of the Environment much wider discretion to refuse to grant public hearings with respect to environmental assessments. At the same time, legislation, which had provided funding to bona fide public interest interveners in the environmental approvals process, was permitted to expire and not renewed.
In addition, specifically with respect to hazardous waste imports, the provincial Minister of the Environment wrote to his federal counterpart in February 1997, waiving the province’s right to review proposed imports under CEPA Hazardous Waste Import/Export Regulations. In effect this meant that the province would accept any waste import without review (Lindgren August 1, 1999).
9 These figures are for the end of the 1999/00 fiscal year, based on a 1994/95 base year. See CIELAP Ontario’s Environment and the ‘Common Sense Revolution’ A Fifth Year Report (Toronto: Canadian Institute for Environmental Law and Policy, October 2000). 10 The most prominent of these was a fire at the Plastimet PVC recycling facility in Hamilton, Ontario in July 1997.
The Generation and Management of Hazardous Wastes and Transboundary Hazardous Waste Shipments between Mexico, Canada and the United States, 1990-2000
47
Following major expansion in 1992 the government of Alberta decided to permit the Alberta Special Waste Management facility in Swan Hills to receive out of province waste in November 1994 (Feschuk, November 23, 1994). d. Provincial Enforcement Provincial environmental law enforcement efforts have been in general decline since the mid 1990’s due to the loss of capacity resulting from budgetary reductions. In Ontario, for example, fines for environmental offences fell from over $3 million in 1995 to $864,000 in 1998 (Winfield, Figure 1.3). In addition, the province ceased publication of its annual reports on enforcement activities in 1995.
2. Social organization
a. Citizens and Community Organizations
The ability of community groups and public interest organizations to influence the approvals process for hazardous waste disposal facilities has been significantly weakened by the combination of the elimination of intervener funding, and the ‘streamlined’ approvals process.
Since 1995 in Ontario for example, major expansions of existing disposal facilities,11 and the establishment of new facilities12 have been approved without public hearings. In other cases, authorities approved new disposal capacity without review under environmental assessment legislation.13 This has severely limited the scope of public interventions where hearings have been held. In addition, in some more remote locations, local government and public support for new disposal capacity has emerged. Examples of such developments have included Swan Hills Alberta, and Kirkland Lake, Ontario. New or expanded hazardous waste disposal facilities have been seen as development opportunities in these economically distressed communities.14
b. The Waste Management Industry. The regulatory ‘reform’ initiatives undertaken by provincial governments from the mid-1990s onwards were clearly intended to address the concerns of industry, including the hazardous waste disposal sector. The Ontario Red Review Tape Commission, for example, has described its
11 Laidlaw Landfill, Sarnia, September 1997. 12 Taro “non-hazardous” industrial waste landfill in Stoney Creek 13 For example, the Gary Steacy Dismantling Ltd low-level PCB incinerator in Northumberland County, Ontario, December 1997, and SRBP high-level PCB incinerator in Cornwall Ontario, December 1999. 14 On Kirkland Lake see “Bennett files application” (editorial), Northern Daily News, March 30, 2000.
Provincial environmental law enforcement efforts have been in general decline since the mid 1990’s.
The Generation and Management of Hazardous Wastes and Transboundary Hazardous Waste Shipments between Mexico, Canada and the United States, 1990-2000
48
proposals to significantly weaken regulatory controls on hazardous waste management as seeking to:
“address the concerns of business that waste regulations be overhauled to provide consistency and clarity, remove barriers to recycling, and to implement a risk-based approach.” (RTC, 65).
Similarly, the Ontario Ministry of the environment’s July 1996 Responsive Environmental Protection regulatory reform white paper spoke of:
“providing flexibility and certainty industry needs to ensure jobs and economic growth.” (Ontario Ministry of the Environment 1996, 15) and providing “less red tape for the regulated community.” (Ontario Ministry of the Environment 1996, 46).
The ability of the industry to influence public policy in this area position may be further strengthened by impact of NAFTA investor-state provisions. In September 1998 S.D. Myers Ltd., a U.S. firm brought forward a case under Chapter 11 of the Agreement seeking compensation for the a ban on the export of Canadian PCBs to the United States for disposal put in place by the Canadian Government between November 1995 and February 1997 (Scoffield, September 1, 1998). The company had sought to import Canadian PCBs for destruction during that period. In November of 2000, the tribunal ruled in SD Myers’ favor, finding that by enacting the ban Canada treated U.S. investors less favorably than its own and that the ban was not the least trade restrictive measure available to protect public health and the environment. Damages have not been awarded in the case, although the company is seeking approximately $50 million (McArthur November 14, 2000). In this case, the NAFTA's investor protection rules were used to seek compensation even though the "investor's" facilities were not located in the country from which it sought damages.
3. Disposal Capacity The situation with respect to hazardous waste disposal capacity has changed dramatically in Canada since the early 1990s. This began with an expansion of the ASWMC facility in Swan Hills, 1992, followed by the opening of the facility to out of province wastes in November 1994 (Feschuk November 23, 1994). The relaxed approvals environment has also facilitated the bringing of new disposal capacity on-line in Ontario and Quebec and additional expansions are being planned. The new facilities have tended to be expansions of existing Canadian owned facilities, or new developments by Canadian operators. Some US investment in new disposal capacity has occurred in the past two years as well.
The situation with respect to hazardous waste disposal capacity has changed dramatically in Canada since the early 1990s. The relaxed approvals environment has also facilitated the bringing of new disposal capacity on-line in Ontario and Quebec and additional expansions are being planned.
The Generation and Management of Hazardous Wastes and Transboundary Hazardous Waste Shipments between Mexico, Canada and the United States, 1990-2000
49
New Hazardous Waste Management Facilities Approved or Planned in Ontario and Quebec New facilities approved in Ontario since 1995 include the following:
• July 1996: Philip Environmental Services Corporation Taro East Landfill in Stoney Creek, approved to receive up to 10 million tons of “industrial non-hazardous” waste over a period of 20 years. The facility was subsequently used to dispose of hazardous waste rendered “non-hazardous” though a solidification process at various facilities in Hamilton and Toronto.
• September 1997: A 1.9 million ton expansion of the Laidlaw/Safety-Kleen commercial hazardous waste landfill in Corunna approved.
• November 1997: The use of a scrap metal smelting furnace by Gary Steacy Dismantling Ltd. approved for the destruction of low-level PCB wastes in Northumberland County, with a capacity of up to 1.8 million liters of transformer fluids and 700 tons of waste fluorescent light ballast (Environmental Assessment Board December 1997).
• May 1998: A facility to remove PCBs from electrical equipment operated by the US based firm Trans-Cycle Industries Ltd. approved in Kirkland Lake, Ontario, with an approved capacity of 101,000 tons of waste per year. The facility is approved to receive wastes from all provinces. The facility applied for a permit to receive wastes from Basel and OCED countries in, which was denied in December 1999.1
• November 1999: The use of a modified scrap metal smelting furnace by SRBP Resource Recovery approved for high level PCB incineration in Cornwall. The facility is approved to receive up to 130 tons of liquid mercaptan residues, 1,250 tons of other mercaptan wastes, and up to 4,380 tons of PCB wastes per year with no restrictions on sources (Environmental Assessment Board November 1, 1999). The approval is currently under appeal to the Ontario cabinet.
• November 1999: Bennett Environmental Inc. announces the development of an incineration facility for the treatment of up to 200,000 tons per year of soil contaminated with chlorinated and non-chlorinated organic compounds in Kirkland Lake. The facility, which would receive both Ontario and out of province and out of country wastes, is currently in the approvals process.
New disposal capacity in Quebec approved in the past few years has included:
• October 1997: An incineration facility for the treatment of soil contaminated with chlorinated and non-chlorinated organic compounds to be operated by Bennett Environmental Inc. in St.Ambroise approved. The facility, with a capacity of 60,000 tons per year, commenced operations in 1998, and receives waste from Canadian and U.S. sources.
• Stablex: recent permit revisions will allow the facility to increase its waste intake from 100,000 to 125,000 tons per year. The facility reports a 49% increase in waste volumes since 1995, with 40% of the wastes handled currently originating in the United States (Stablex Canada 2000).
The Generation and Management of Hazardous Wastes and Transboundary Hazardous Waste Shipments between Mexico, Canada and the United States, 1990-2000
50
4. Waste Generation No reliable data on total waste hazardous waste in Canada is available. The only available estimates are for Ontario from 1986 to 1991. These indicated that waste generation closely followed overall levels of economic activity.
The only other national data available on waste generation is through the National Pollutant Release Inventory (NPRI). The NPRI showed a significant overall increase of 22.6% in total waste transfers to disposal from 1995-1997. Indeed, reductions in total releases being reported through NPRI are being overwhelmed by these increases in transfers, with the implication that no progress is being made on reducing total waste generation (Environmental Canada 1999, Table 3 and CEC 2000, Table 5-29).
More reliable data available for off-site transfers of hazardous waste is available through the provincial hazardous waste manifesting systems. However, detailed analyses of this data have only been performed for Ontario. This shows a dramatic growth (41.8%) in off-site transfers between 1994 and 1998, the most recent year for which data is available (Yacoumides June 2000, Table 1). This follows period of a close relationship between overall economic activities and waste seen between 1987 and 1993. (Winfield 1999, Figure 2).
Although a portion of this increase can be accounted for by changes in disposal practices for landfill leachates, the data shows a 23.8% growth in the generation of wastes from industrial sources. This is consistent with NPRI data on off-site transfers in Ontario showing a 26.1% increase in transfers to treatment/disposal between 1995-97 (Environmental Canada 1999, Table 29). The growth in transfers from industrial sources has been concentrated in the steel and chemical industries (CEC 2000, Table 4-52).
The limited data available through the NPRI shows similar trends for Quebec with a 28% increase in off-site transfers to disposal or treatment reported between 1995-1997 (Environmental Canada 1999, Table 31).
5. Transboundary Waste Flows a. Exports Hazardous waste exports from Canada stabilized in the mid-1990s, after a period of growth in the late 1980s and early 1990s. Exports grew from 230,000 to 280,000 tons between 1993 and 1998, before declining to about 250,000 tons in 1999. Hazardous exports from Canada originate mainly from Ontario and Quebec, although Manitoba and British Colombia also export significant amounts. Virtually all of the waste exported from Canada is sent to the US.
A detailed analysis of the provincial hazardous waste manifesting systems shows a dramatic growth (41.8%) in off-site transfers in Ontario between 1994 and 1998, the most recent year for which data is available.
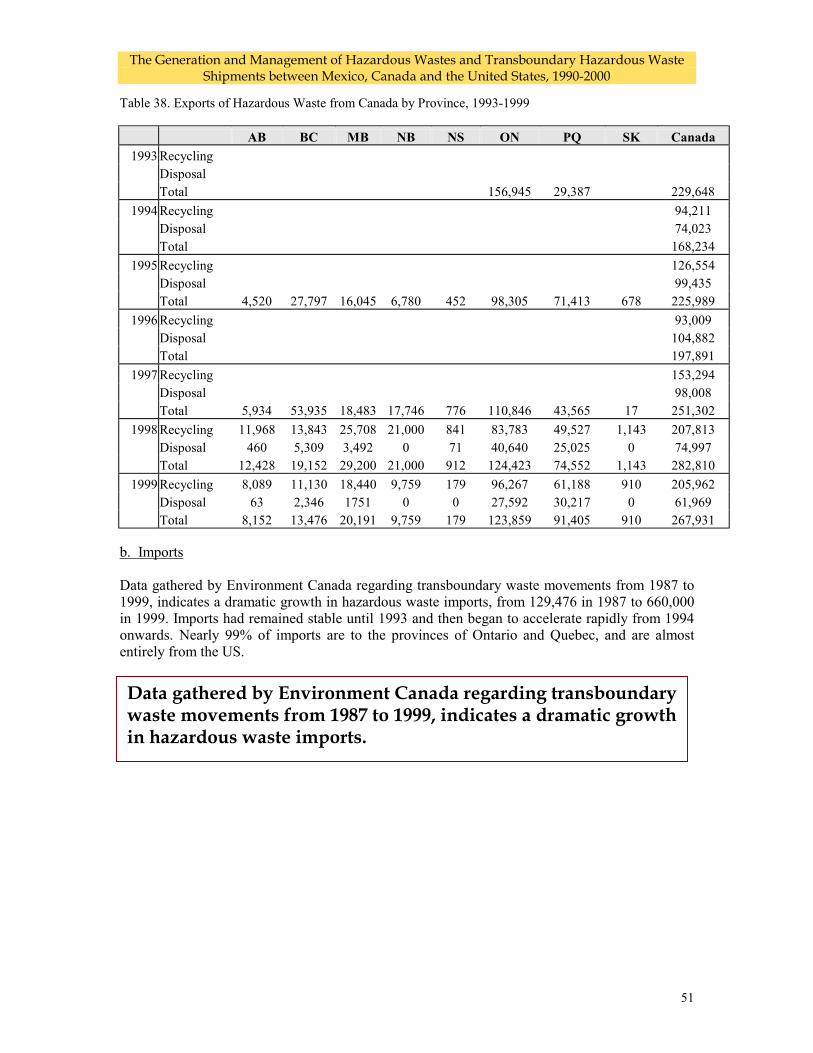
The Generation and Management of Hazardous Wastes and Transboundary Hazardous Waste Shipments between Mexico, Canada and the United States, 1990-2000
51
Table 38. Exports of Hazardous Waste from Canada by Province, 1993-1999 AB BC MB NB NS ON PQ SK Canada
1993 Recycling Disposal Total 156,945 29,387 229,648
1994 Recycling 94,211 Disposal 74,023 Total 168,234
1995 Recycling 126,554 Disposal 99,435 Total 4,520 27,797 16,045 6,780 452 98,305 71,413 678 225,989
1996 Recycling 93,009 Disposal 104,882 Total 197,891
1997 Recycling 153,294 Disposal 98,008 Total 5,934 53,935 18,483 17,746 776 110,846 43,565 17 251,302
1998 Recycling 11,968 13,843 25,708 21,000 841 83,783 49,527 1,143 207,813 Disposal 460 5,309 3,492 0 71 40,640 25,025 0 74,997 Total 12,428 19,152 29,200 21,000 912 124,423 74,552 1,143 282,810
1999 Recycling 8,089 11,130 18,440 9,759 179 96,267 61,188 910 205,962 Disposal 63 2,346 1751 0 0 27,592 30,217 0 61,969 Total 8,152 13,476 20,191 9,759 179 123,859 91,405 910 267,931 b. Imports Data gathered by Environment Canada regarding transboundary waste movements from 1987 to 1999, indicates a dramatic growth in hazardous waste imports, from 129,476 in 1987 to 660,000 in 1999. Imports had remained stable until 1993 and then began to accelerate rapidly from 1994 onwards. Nearly 99% of imports are to the provinces of Ontario and Quebec, and are almost entirely from the US.
Data gathered by Environment Canada regarding transboundary waste movements from 1987 to 1999, indicates a dramatic growth in hazardous waste imports.
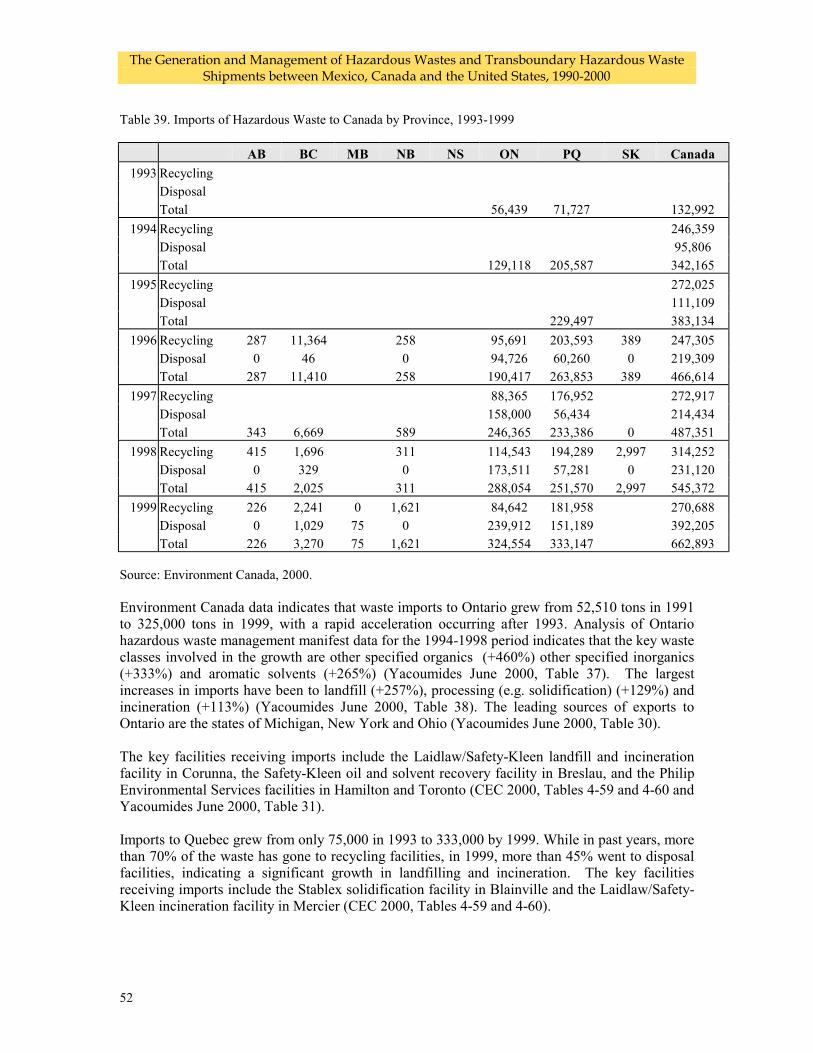
The Generation and Management of Hazardous Wastes and Transboundary Hazardous Waste Shipments between Mexico, Canada and the United States, 1990-2000
52
Table 39. Imports of Hazardous Waste to Canada by Province, 1993-1999 AB BC MB NB NS ON PQ SK Canada
1993 Recycling Disposal Total 56,439 71,727 132,992
1994 Recycling 246,359 Disposal 95,806 Total 129,118 205,587 342,165
1995 Recycling 272,025 Disposal 111,109 Total 229,497 383,134
1996 Recycling 287 11,364 258 95,691 203,593 389 247,305 Disposal 0 46 0 94,726 60,260 0 219,309 Total 287 11,410 258 190,417 263,853 389 466,614
1997 Recycling 88,365 176,952 272,917 Disposal 158,000 56,434 214,434 Total 343 6,669 589 246,365 233,386 0 487,351
1998 Recycling 415 1,696 311 114,543 194,289 2,997 314,252 Disposal 0 329 0 173,511 57,281 0 231,120 Total 415 2,025 311 288,054 251,570 2,997 545,372
1999 Recycling 226 2,241 0 1,621 84,642 181,958 270,688 Disposal 0 1,029 75 0 239,912 151,189 392,205 Total 226 3,270 75 1,621 324,554 333,147 662,893 Source: Environment Canada, 2000. Environment Canada data indicates that waste imports to Ontario grew from 52,510 tons in 1991 to 325,000 tons in 1999, with a rapid acceleration occurring after 1993. Analysis of Ontario hazardous waste management manifest data for the 1994-1998 period indicates that the key waste classes involved in the growth are other specified organics (+460%) other specified inorganics (+333%) and aromatic solvents (+265%) (Yacoumides June 2000, Table 37). The largest increases in imports have been to landfill (+257%), processing (e.g. solidification) (+129%) and incineration (+113%) (Yacoumides June 2000, Table 38). The leading sources of exports to Ontario are the states of Michigan, New York and Ohio (Yacoumides June 2000, Table 30). The key facilities receiving imports include the Laidlaw/Safety-Kleen landfill and incineration facility in Corunna, the Safety-Kleen oil and solvent recovery facility in Breslau, and the Philip Environmental Services facilities in Hamilton and Toronto (CEC 2000, Tables 4-59 and 4-60 and Yacoumides June 2000, Table 31). Imports to Quebec grew from only 75,000 in 1993 to 333,000 by 1999. While in past years, more than 70% of the waste has gone to recycling facilities, in 1999, more than 45% went to disposal facilities, indicating a significant growth in landfilling and incineration. The key facilities receiving imports include the Stablex solidification facility in Blainville and the Laidlaw/Safety-Kleen incineration facility in Mercier (CEC 2000, Tables 4-59 and 4-60).
The Generation and Management of Hazardous Wastes and Transboundary Hazardous Waste Shipments between Mexico, Canada and the United States, 1990-2000
53
D. Summary of Post-1994 Case Hazardous waste generation, management, shipments and government policies have undergone significant changes since 1994 in all three countries. In the U.S. regulatory controls on hazardous waste disposal have been strengthened with new listings of waste and new controls on landfill disposal and incineration. The total amount of hazardous wastes generated and managed is generally thought to have decreased slightly. However, there have been significant regional variations with this trend, with waste generation in states in the Canada-US border region declining, while waste generation has increased among the southern border states. There has been little growth in hazardous waste disposal capacity, and the industry has been undergone a substantial consolidation. The US still has limited data on imports and exports of hazardous waste and there is little inspection or enforcement of transboundary shipments of hazardous wastes. This limited data, however, does indicate that transboundary shipments have increased both with Mexican and with Canada. The changes in Mexico and Canada have been more significant. In Mexico regulatory controls on hazardous waste management have been strengthened in some areas. However, this has been accompanied by a dramatic expansion of the number of approved hazardous waste disposal facilities, particularly since 1997, with substantial foreign investment in the sector. In addition, hazardous waste generation is thought to have continued to rise, both nationally and in the border region, although low compliance with reporting requirements makes it difficult to assess how much more waste is being generated and to assure that waste is being adequately managed. Waste imports from the US for “treatment” and “recycling” have increased, as have exports of wastes, although exports remain far below the levels that would be expected under the waste return requirements of the maquiladora program. Perhaps the most dramatic changes, however, have been seen in Canada. Provincial regulatory requirements regarding the management of hazardous wastes, and the approval of disposal facilities have been significantly weakened, particularly in Ontario and Quebec. These developments have been accompanied by a significant growth in the domestic generation of wastes, particularly from the steel and chemical industries. There has also been a very sharp increase of imports of wastes to Ontario and Quebec from the US for disposal, while waste exports have remained stable. Relaxed approvals requirements have facilitated the establishment of new disposal capacity in Ontario and Quebec, and additional expansions are planned.
Hazardous waste generation, management, shipments, and government policies have undergone significant changes since 1994 in all three countries. Perhaps the most dramatic changes in the management of hazardous wastes have been seen in Canada.
The Generation and Management of Hazardous Wastes and Transboundary Hazardous Waste Shipments between Mexico, Canada and the United States, 1990-2000
54
V. Assessment/Explanation A. Overview The previous section showed significant change within each country in terms of the generation, management and shipments of hazardous waste since 1994. The following discussion attempts to analyze the data presented in light of the two questions posed at the outset of the paper:
• Are companies in the manufacturing or hazardous waste management sectors relocating or are they sending hazardous wastes to other areas to take advantage of less stringent hazardous waste regulations or enforcement?
• Is trade and investment liberalization concentrating economic activity (in both manufacturing and the hazardous waste management industry) in areas where it takes place more efficiently, or conversely, where ecological stress is already acute such as the U.S. - Mexico border region and the U.S. Canada-Border Region?
In other words, has there been a "race to the bottom," or conversely, a "race to the top"? Have pollution havens been created in any of the three NAFTA countries? B. Explanation of Changes in Waste Flows There have been significant increases in U.S. hazardous waste exports to Canada and Mexico and from Mexico to the U.S. Exports from Canada to the U.S. have remained relatively stable. The following discussion examines a number of potential explanations for these shifts in waste flows. 1. U.S. to CANADA
a. Shifts in exchange rates It has been suggested that the increase in waste flows into Canada for disposal can be explained as a result of the decline of the value of the Canadian dollar relative to the US dollar, making disposal in Canada a less expensive option. An examination of waste imports relative to the value of the Canadian and US dollars, as plotted in Figure 1, indicates that the point at which waste imports began to grow dramatically (1993/94) correlates weakly with a decline in the value of the Canadian dollar relative to the US dollar between 1991 and 1994. However, subsequent increases in the value of the Canadian dollar to not appear to have affected waste imports. Furthermore, earlier rises (1987-89) in imports to Canada correlate weakly with increases in the value of the Canadian dollar.
It has been suggested that the increase in waste flows into Canada for disposal can be explained as a result of the decline of the Canadian dollar relative to the US dollar, making disposal in Canada a less expensive option. However, changes in relative values of the US and Canadian dollars do not appear to have had any noticeable impact on Canadian waste exports.
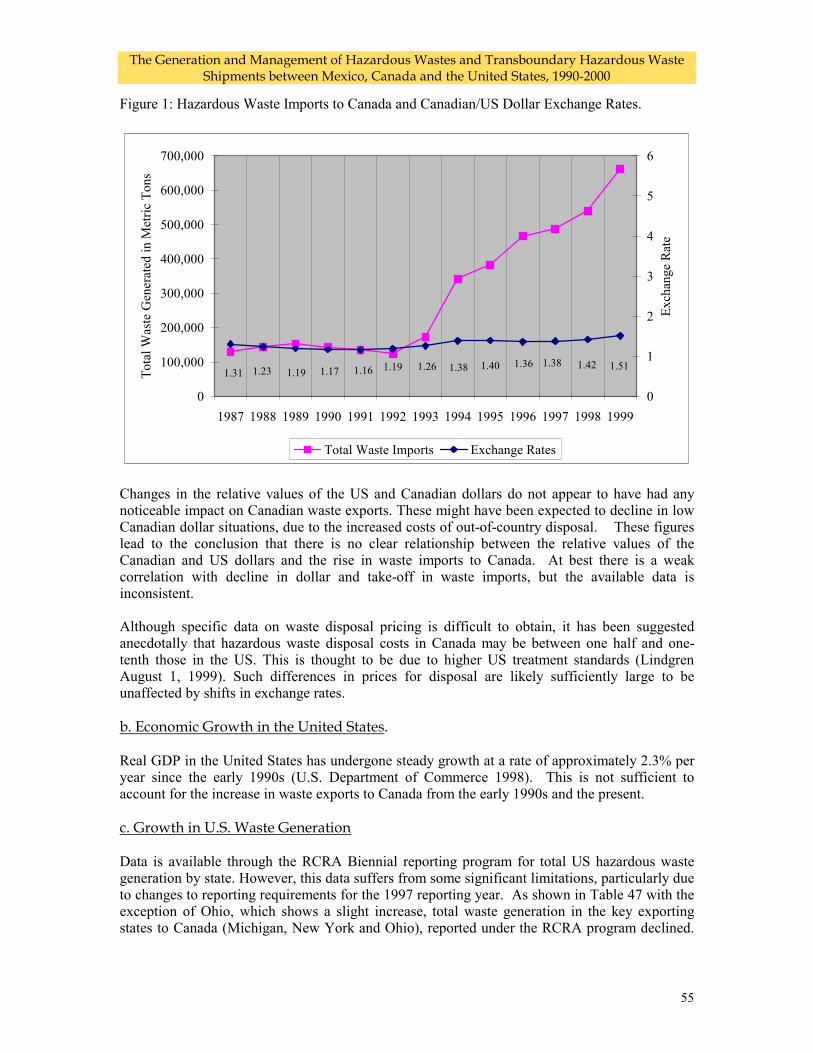
The Generation and Management of Hazardous Wastes and Transboundary Hazardous Waste Shipments between Mexico, Canada and the United States, 1990-2000
55
Figure 1: Hazardous Waste Imports to Canada and Canadian/US Dollar Exchange Rates.
1.311.36 1.38 1.42 1.511.401.381.261.191.161.171.191.23
0
100,000
200,000
300,000
400,000
500,000
600,000
700,000
1987 1988 1989 1990 1991 1992 1993 1994 1995 1996 1997 1998 1999
Tota
l Was
te G
ener
ated
in M
etric
Ton
s
0
1
2
3
4
5
6
Exch
ange
Rat
e
Total Waste Imports Exchange Rates
Changes in the relative values of the US and Canadian dollars do not appear to have had any noticeable impact on Canadian waste exports. These might have been expected to decline in low Canadian dollar situations, due to the increased costs of out-of-country disposal. These figures lead to the conclusion that there is no clear relationship between the relative values of the Canadian and US dollars and the rise in waste imports to Canada. At best there is a weak correlation with decline in dollar and take-off in waste imports, but the available data is inconsistent.
Although specific data on waste disposal pricing is difficult to obtain, it has been suggested anecdotally that hazardous waste disposal costs in Canada may be between one half and one-tenth those in the US. This is thought to be due to higher US treatment standards (Lindgren August 1, 1999). Such differences in prices for disposal are likely sufficiently large to be unaffected by shifts in exchange rates. b. Economic Growth in the United States. Real GDP in the United States has undergone steady growth at a rate of approximately 2.3% per year since the early 1990s (U.S. Department of Commerce 1998). This is not sufficient to account for the increase in waste exports to Canada from the early 1990s and the present. c. Growth in U.S. Waste Generation Data is available through the RCRA Biennial reporting program for total US hazardous waste generation by state. However, this data suffers from some significant limitations, particularly due to changes to reporting requirements for the 1997 reporting year. As shown in Table 47 with the exception of Ohio, which shows a slight increase, total waste generation in the key exporting states to Canada (Michigan, New York and Ohio), reported under the RCRA program declined.
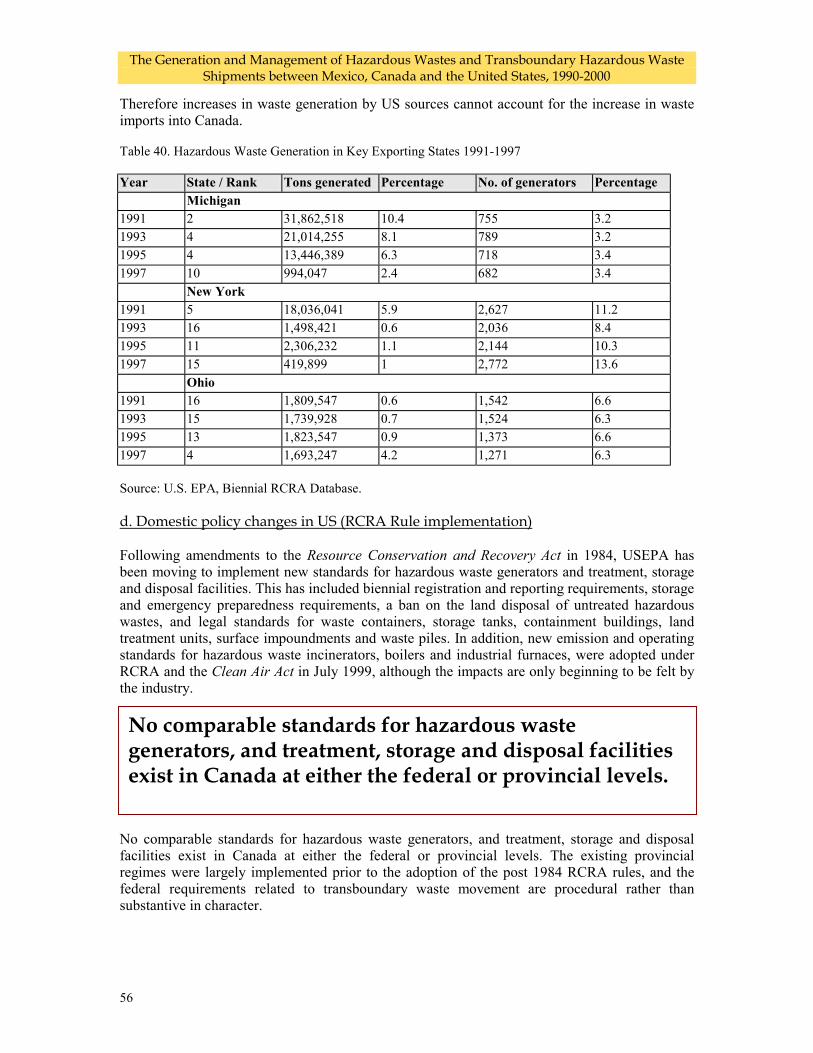
The Generation and Management of Hazardous Wastes and Transboundary Hazardous Waste Shipments between Mexico, Canada and the United States, 1990-2000
56
Therefore increases in waste generation by US sources cannot account for the increase in waste imports into Canada.
Table 40. Hazardous Waste Generation in Key Exporting States 1991-1997 Year State / Rank Tons generated Percentage No. of generators Percentage Michigan 1991 2 31,862,518 10.4 755 3.2 1993 4 21,014,255 8.1 789 3.2 1995 4 13,446,389 6.3 718 3.4 1997 10 994,047 2.4 682 3.4 New York 1991 5 18,036,041 5.9 2,627 11.2 1993 16 1,498,421 0.6 2,036 8.4 1995 11 2,306,232 1.1 2,144 10.3 1997 15 419,899 1 2,772 13.6 Ohio 1991 16 1,809,547 0.6 1,542 6.6 1993 15 1,739,928 0.7 1,524 6.3 1995 13 1,823,547 0.9 1,373 6.6 1997 4 1,693,247 4.2 1,271 6.3 Source: U.S. EPA, Biennial RCRA Database. d. Domestic policy changes in US (RCRA Rule implementation) Following amendments to the Resource Conservation and Recovery Act in 1984, USEPA has been moving to implement new standards for hazardous waste generators and treatment, storage and disposal facilities. This has included biennial registration and reporting requirements, storage and emergency preparedness requirements, a ban on the land disposal of untreated hazardous wastes, and legal standards for waste containers, storage tanks, containment buildings, land treatment units, surface impoundments and waste piles. In addition, new emission and operating standards for hazardous waste incinerators, boilers and industrial furnaces, were adopted under RCRA and the Clean Air Act in July 1999, although the impacts are only beginning to be felt by the industry.
No comparable standards for hazardous waste generators, and treatment, storage and disposal facilities exist in Canada at either the federal or provincial levels. The existing provincial regimes were largely implemented prior to the adoption of the post 1984 RCRA rules, and the federal requirements related to transboundary waste movement are procedural rather than substantive in character.
No comparable standards for hazardous waste generators, and treatment, storage and disposal facilities exist in Canada at either the federal or provincial levels.
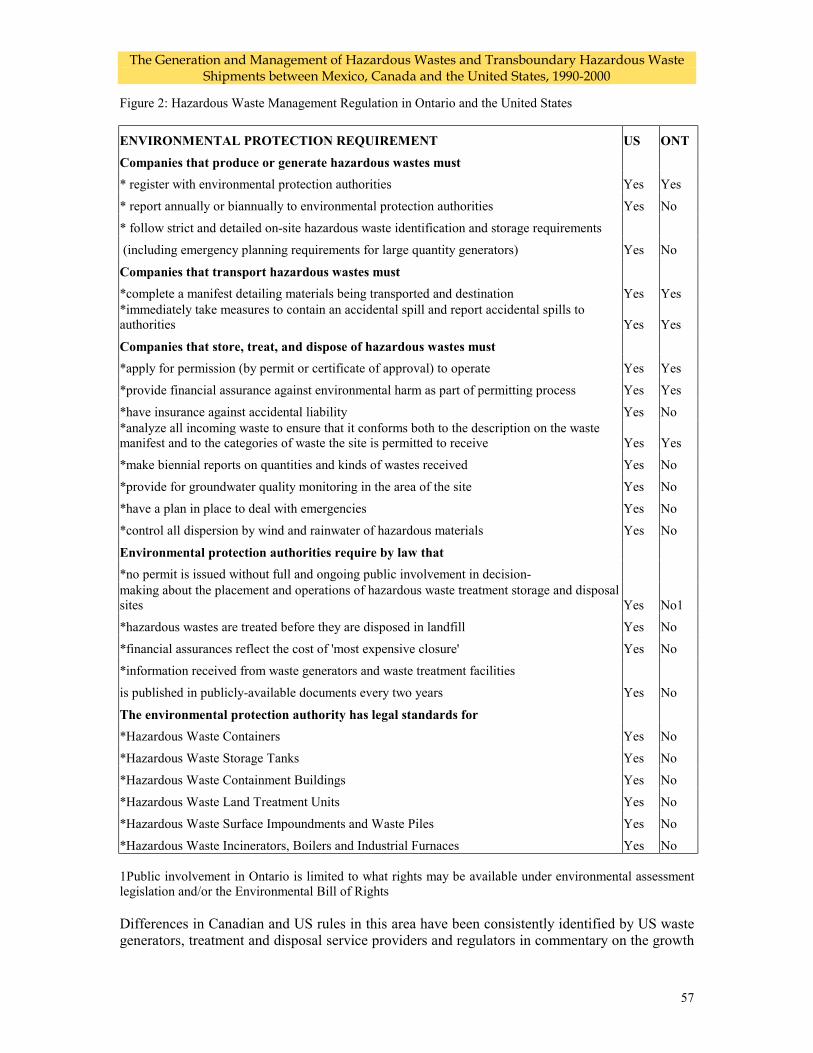
The Generation and Management of Hazardous Wastes and Transboundary Hazardous Waste Shipments between Mexico, Canada and the United States, 1990-2000
57
Figure 2: Hazardous Waste Management Regulation in Ontario and the United States
ENVIRONMENTAL PROTECTION REQUIREMENT US ONT Companies that produce or generate hazardous wastes must
* register with environmental protection authorities Yes Yes
* report annually or biannually to environmental protection authorities Yes No
* follow strict and detailed on-site hazardous waste identification and storage requirements
(including emergency planning requirements for large quantity generators) Yes No
Companies that transport hazardous wastes must
*complete a manifest detailing materials being transported and destination Yes Yes *immediately take measures to contain an accidental spill and report accidental spills to authorities Yes Yes
Companies that store, treat, and dispose of hazardous wastes must
*apply for permission (by permit or certificate of approval) to operate Yes Yes
*provide financial assurance against environmental harm as part of permitting process Yes Yes
*have insurance against accidental liability Yes No *analyze all incoming waste to ensure that it conforms both to the description on the waste manifest and to the categories of waste the site is permitted to receive Yes Yes
*make biennial reports on quantities and kinds of wastes received Yes No
*provide for groundwater quality monitoring in the area of the site Yes No
*have a plan in place to deal with emergencies Yes No
*control all dispersion by wind and rainwater of hazardous materials Yes No
Environmental protection authorities require by law that
*no permit is issued without full and ongoing public involvement in decision- making about the placement and operations of hazardous waste treatment storage and disposal sites Yes No1
*hazardous wastes are treated before they are disposed in landfill Yes No
*financial assurances reflect the cost of 'most expensive closure' Yes No
*information received from waste generators and waste treatment facilities
is published in publicly-available documents every two years Yes No
The environmental protection authority has legal standards for
*Hazardous Waste Containers Yes No
*Hazardous Waste Storage Tanks Yes No
*Hazardous Waste Containment Buildings Yes No
*Hazardous Waste Land Treatment Units Yes No
*Hazardous Waste Surface Impoundments and Waste Piles Yes No
*Hazardous Waste Incinerators, Boilers and Industrial Furnaces Yes No 1Public involvement in Ontario is limited to what rights may be available under environmental assessment legislation and/or the Environmental Bill of Rights Differences in Canadian and US rules in this area have been consistently identified by US waste generators, treatment and disposal service providers and regulators in commentary on the growth
The Generation and Management of Hazardous Wastes and Transboundary Hazardous Waste Shipments between Mexico, Canada and the United States, 1990-2000
58
in waste imports (Mittelstaedt September 27, 1999). The Ontario (Mittelstaedt, September 18, 1999) and Canadian federal Ministers of the Environment (Mittelstaedt March 22, 2000) and the Canadian Environmental Industry Association (Mittelstaedt February 28, 2000) have acknowledged the gap between Canadian and US standards as a significant factor in the growth in waste imports as well. e. Trade Liberalization Direct Impacts The direct impact of the provisions of NAFTA and trade liberalization on waste flows and government policies in this area has been limited. However, three Chapter 11 cases have been brought forward with respect to hazardous waste management, the S.D. Myers PCB export restrictions case in Canada, and the Metalclad and TECMED cases in Mexico. The recent rulings favorable to Metalclad and S.D. Myers against the governments of Mexico and Canada respectively may have a chilling effect on new regulations and the enforcement of existing regulations, particularly at the provincial (or state) and local level.
Issues related to potential restrictions on governments’ freedom of action with respect to hazardous waste policy as a result of the provisions of NAFTA were raised during the Government of Canada’s deliberations regarding its 1995 PCB export ban (Scoffield October 31, 1998). In addition, when data showing the dramatic growth in hazardous waste imports into Ontario was first released to the public in March 1999, the Ontario Minister of the Environment stated that he could do nothing to reduce the flow as “we have a free trade agreement (NAFTA) that limits us.” (The Hon. N. Sterling, Ontario Minister of the Environment, as cited in B. McAndrew April 18, 1999). Similarly, his successor stated in August 1999 that he was “handcuffed” by the NAFTA with respect to waste imports (The Hon. T. Clement, Ontario Minister of the Environment, as cited in Lindgren August 1, 1999). f. Trade Liberalization Indirect impacts Trade liberalization has, therefore been both identified by Canadian governments as a barrier to the strengthening of environmental protection requirements, and as a driver of policy initiatives which have had the effect of weakening environmental laws and regulations. Ontario’s Red Tape Commission, for example, has stated that:
• “In today’s global environment, business must minimize their expenditures in order to remain competitive with our trading partners.”
• “These (regulatory) requirements simply increase the costs of doing business. Therefore getting rid of and avoiding unnecessary and duplicative regulatory requirements can create a competitive advantage, particularly in an open economy such as Ontario’s that depends on exports” (Red Tape Commission, 3).
The Ontario Ministry of the Environment cast its regulatory ‘reform’ proposals in a similar light: • “As capital becomes increasingly mobile and reliant on high technology infrastructure,
we must continually find new ways to make environmental management clear, flexible and predictable”;
• “current regulatory requirements that may function as non-tariff barriers need to be brought into line with current practices”;
• “a reformed system of environmental regulation will contribute to a competitive business climate.” (Ontario Ministry of the Environment, July 1996, 13).
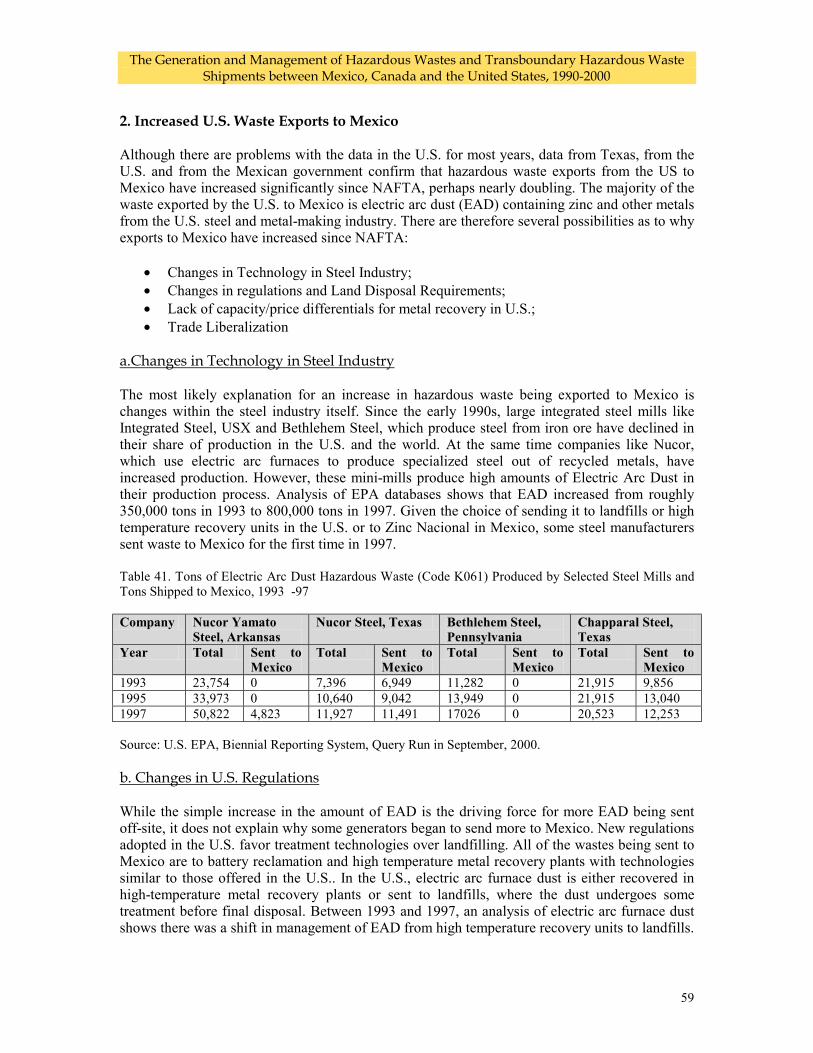
The Generation and Management of Hazardous Wastes and Transboundary Hazardous Waste Shipments between Mexico, Canada and the United States, 1990-2000
59
2. Increased U.S. Waste Exports to Mexico Although there are problems with the data in the U.S. for most years, data from Texas, from the U.S. and from the Mexican government confirm that hazardous waste exports from the US to Mexico have increased significantly since NAFTA, perhaps nearly doubling. The majority of the waste exported by the U.S. to Mexico is electric arc dust (EAD) containing zinc and other metals from the U.S. steel and metal-making industry. There are therefore several possibilities as to why exports to Mexico have increased since NAFTA:
• Changes in Technology in Steel Industry; • Changes in regulations and Land Disposal Requirements; • Lack of capacity/price differentials for metal recovery in U.S.; • Trade Liberalization
a.Changes in Technology in Steel Industry The most likely explanation for an increase in hazardous waste being exported to Mexico is changes within the steel industry itself. Since the early 1990s, large integrated steel mills like Integrated Steel, USX and Bethlehem Steel, which produce steel from iron ore have declined in their share of production in the U.S. and the world. At the same time companies like Nucor, which use electric arc furnaces to produce specialized steel out of recycled metals, have increased production. However, these mini-mills produce high amounts of Electric Arc Dust in their production process. Analysis of EPA databases shows that EAD increased from roughly 350,000 tons in 1993 to 800,000 tons in 1997. Given the choice of sending it to landfills or high temperature recovery units in the U.S. or to Zinc Nacional in Mexico, some steel manufacturers sent waste to Mexico for the first time in 1997. Table 41. Tons of Electric Arc Dust Hazardous Waste (Code K061) Produced by Selected Steel Mills and Tons Shipped to Mexico, 1993 -97 Company Nucor Yamato
Steel, Arkansas Nucor Steel, Texas Bethlehem Steel,
Pennsylvania Chapparal Steel, Texas
Year Total Sent to Mexico
Total Sent to Mexico
Total Sent to Mexico
Total Sent to Mexico
1993 23,754 0 7,396 6,949 11,282 0 21,915 9,856 1995 33,973 0 10,640 9,042 13,949 0 21,915 13,040 1997 50,822 4,823 11,927 11,491 17026 0 20,523 12,253 Source: U.S. EPA, Biennial Reporting System, Query Run in September, 2000. b. Changes in U.S. Regulations While the simple increase in the amount of EAD is the driving force for more EAD being sent off-site, it does not explain why some generators began to send more to Mexico. New regulations adopted in the U.S. favor treatment technologies over landfilling. All of the wastes being sent to Mexico are to battery reclamation and high temperature metal recovery plants with technologies similar to those offered in the U.S.. In the U.S., electric arc furnace dust is either recovered in high-temperature metal recovery plants or sent to landfills, where the dust undergoes some treatment before final disposal. Between 1993 and 1997, an analysis of electric arc furnace dust shows there was a shift in management of EAD from high temperature recovery units to landfills.
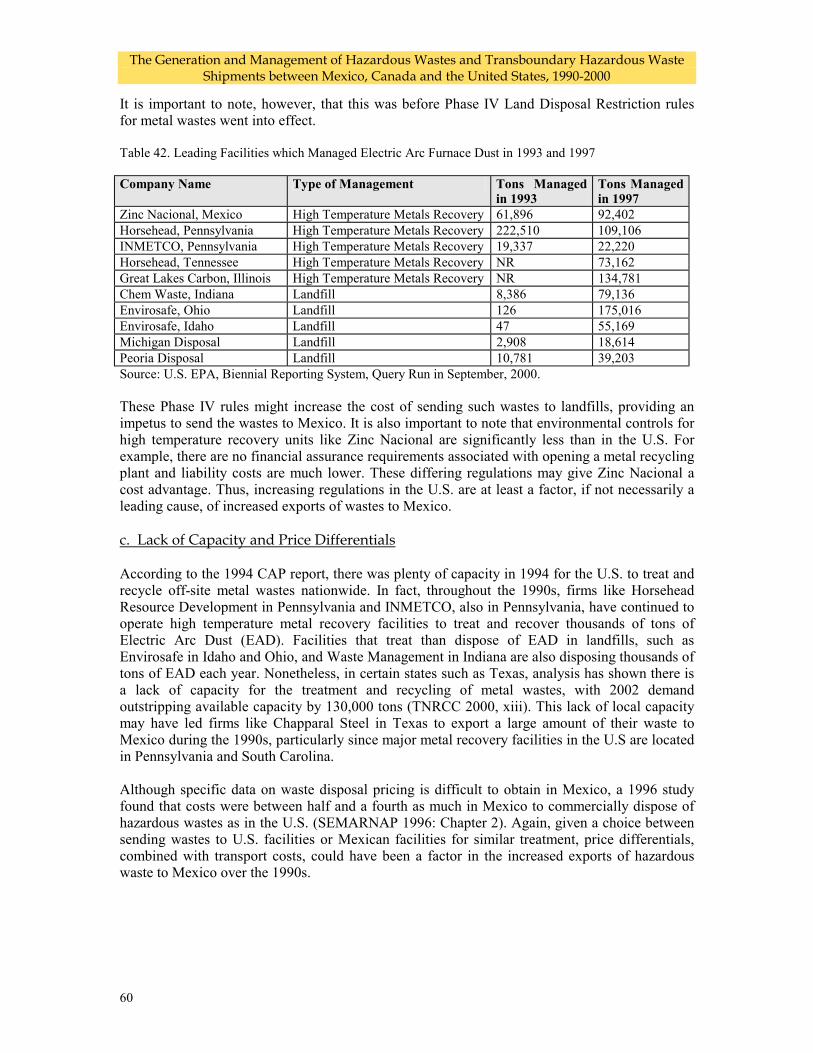
The Generation and Management of Hazardous Wastes and Transboundary Hazardous Waste Shipments between Mexico, Canada and the United States, 1990-2000
60
It is important to note, however, that this was before Phase IV Land Disposal Restriction rules for metal wastes went into effect. Table 42. Leading Facilities which Managed Electric Arc Furnace Dust in 1993 and 1997 Company Name Type of Management Tons Managed
in 1993 Tons Managed in 1997
Zinc Nacional, Mexico High Temperature Metals Recovery 61,896 92,402 Horsehead, Pennsylvania High Temperature Metals Recovery 222,510 109,106 INMETCO, Pennsylvania High Temperature Metals Recovery 19,337 22,220 Horsehead, Tennessee High Temperature Metals Recovery NR 73,162 Great Lakes Carbon, Illinois High Temperature Metals Recovery NR 134,781 Chem Waste, Indiana Landfill 8,386 79,136 Envirosafe, Ohio Landfill 126 175,016 Envirosafe, Idaho Landfill 47 55,169 Michigan Disposal Landfill 2,908 18,614 Peoria Disposal Landfill 10,781 39,203 Source: U.S. EPA, Biennial Reporting System, Query Run in September, 2000. These Phase IV rules might increase the cost of sending such wastes to landfills, providing an impetus to send the wastes to Mexico. It is also important to note that environmental controls for high temperature recovery units like Zinc Nacional are significantly less than in the U.S. For example, there are no financial assurance requirements associated with opening a metal recycling plant and liability costs are much lower. These differing regulations may give Zinc Nacional a cost advantage. Thus, increasing regulations in the U.S. are at least a factor, if not necessarily a leading cause, of increased exports of wastes to Mexico. c. Lack of Capacity and Price Differentials According to the 1994 CAP report, there was plenty of capacity in 1994 for the U.S. to treat and recycle off-site metal wastes nationwide. In fact, throughout the 1990s, firms like Horsehead Resource Development in Pennsylvania and INMETCO, also in Pennsylvania, have continued to operate high temperature metal recovery facilities to treat and recover thousands of tons of Electric Arc Dust (EAD). Facilities that treat than dispose of EAD in landfills, such as Envirosafe in Idaho and Ohio, and Waste Management in Indiana are also disposing thousands of tons of EAD each year. Nonetheless, in certain states such as Texas, analysis has shown there is a lack of capacity for the treatment and recycling of metal wastes, with 2002 demand outstripping available capacity by 130,000 tons (TNRCC 2000, xiii). This lack of local capacity may have led firms like Chapparal Steel in Texas to export a large amount of their waste to Mexico during the 1990s, particularly since major metal recovery facilities in the U.S are located in Pennsylvania and South Carolina. Although specific data on waste disposal pricing is difficult to obtain in Mexico, a 1996 study found that costs were between half and a fourth as much in Mexico to commercially dispose of hazardous wastes as in the U.S. (SEMARNAP 1996: Chapter 2). Again, given a choice between sending wastes to U.S. facilities or Mexican facilities for similar treatment, price differentials, combined with transport costs, could have been a factor in the increased exports of hazardous waste to Mexico over the 1990s.
The Generation and Management of Hazardous Wastes and Transboundary Hazardous Waste Shipments between Mexico, Canada and the United States, 1990-2000
61
d. Trade Liberalization The waste being exported to Mexico has gone to the same firms in Mexico over the last six years. However, certain firms that began to export for the first time to Mexico in 1997 may have felt more comfortable sending hazardous wastes abroad due to Mexico’s new image as a “free trade” country. Still, because NAFTA simply reaffirms the prominence of the La Paz Agreement and its annexes and Mexican law continues to prohibit the import of hazardous wastes for disposal, NAFTA and “trade liberalization” itself does not explain the increase in exports from the US to Mexico. 3. Mexico to U.S. Hazardous Waste Flow There are significant differences between the U.S. and Mexico in terms of how much waste they report as flowing from Mexico to the U.S. over the 1990s.15 However, the total amount does appear to be increasing. There are three possible reasons for this increase. First, as detailed extensively in this report and elsewhere there are simply more maquiladoras and more industrial production in Mexico. Second, a lack of capacity in Mexico for certain types of treatment such as landfilling and recycling of catalytic converters makes export to the U.S. the best option. Finally, there may be better compliance with hazardous waste repatriation requirements as PROFEPA has increased oversight through inspections and its national auditing program. Nonetheless, because the number of maquiladoras near the border has nearly doubled since 1994, and the percentage of foreign inputs has remained constant, the total amount of wastes reported as being imported still suggests a lack of compliance with Mexican regulations. In fact, this report suggests that hazardous waste exports should be considerably higher than reported. Trade liberalization itself does not appear to be directly influencing the flow – except in the sense that investment in Mexico has increased – and is instead most directly related to the requirements under La Paz and Mexican environmental law that maquiladoras return hazardous wastes to the country from which raw materials were imported. However, because of changes introduced under NAFTA’s Articles 303 and 304 which reduce the benefits of being a maquiladora, it is possible that many maquiladoras may decide to nationalize in order to escape the repatriation requirements. Thus, both inadequate compliance with reporting and repatriation requirements – and perhaps inadequate enforcement on the part of Mexican authorities – as well as the future possibility of a nationalization of the maquiladora industry -- could allow many companies to escape these regulations in a “liberalized” free trade zone. This might have the effect of actually decreasing exports from Mexico to the U.S. even as hazardous waste capacity in Mexico increases.
15 Recently, the EPA, with help from INE, claims it was able to document the reasons for the differences in numbers between the two countries. The EPA compared initial data between the two countries in 1997 -- 50,811 reported in Mexico as compared to 11,057 reported by the U.S. According to the EPA analysis, 68 percent of the hazardous waste reported to be exported by companies in Mexico to the United States were actually --by U.S. regulations -- defined as non-hazardous industrial wastes. Another 29% of the difference was due to a reporting error, when one company reported a product intended for use in the United States as a hazardous waste. Therefore, the unexplained difference is only very minor, about 622 tons in all.15 Still, it should be noted that the exercise only took into account the 50,811 tons Mexico initially reported, not the 76,808 tons finally reported.
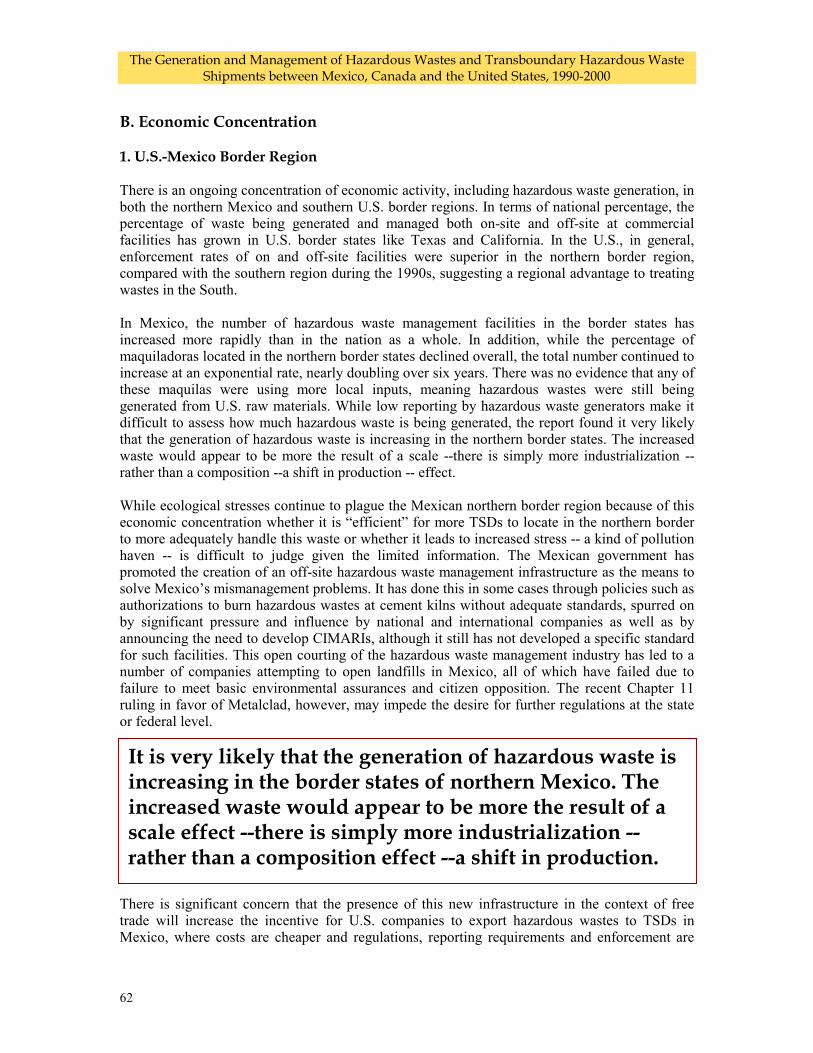
The Generation and Management of Hazardous Wastes and Transboundary Hazardous Waste Shipments between Mexico, Canada and the United States, 1990-2000
62
B. Economic Concentration 1. U.S.-Mexico Border Region
There is an ongoing concentration of economic activity, including hazardous waste generation, in both the northern Mexico and southern U.S. border regions. In terms of national percentage, the percentage of waste being generated and managed both on-site and off-site at commercial facilities has grown in U.S. border states like Texas and California. In the U.S., in general, enforcement rates of on and off-site facilities were superior in the northern border region, compared with the southern region during the 1990s, suggesting a regional advantage to treating wastes in the South. In Mexico, the number of hazardous waste management facilities in the border states has increased more rapidly than in the nation as a whole. In addition, while the percentage of maquiladoras located in the northern border states declined overall, the total number continued to increase at an exponential rate, nearly doubling over six years. There was no evidence that any of these maquilas were using more local inputs, meaning hazardous wastes were still being generated from U.S. raw materials. While low reporting by hazardous waste generators make it difficult to assess how much hazardous waste is being generated, the report found it very likely that the generation of hazardous waste is increasing in the northern border states. The increased waste would appear to be more the result of a scale --there is simply more industrialization -- rather than a composition --a shift in production -- effect. While ecological stresses continue to plague the Mexican northern border region because of this economic concentration whether it is “efficient” for more TSDs to locate in the northern border to more adequately handle this waste or whether it leads to increased stress -- a kind of pollution haven -- is difficult to judge given the limited information. The Mexican government has promoted the creation of an off-site hazardous waste management infrastructure as the means to solve Mexico’s mismanagement problems. It has done this in some cases through policies such as authorizations to burn hazardous wastes at cement kilns without adequate standards, spurred on by significant pressure and influence by national and international companies as well as by announcing the need to develop CIMARIs, although it still has not developed a specific standard for such facilities. This open courting of the hazardous waste management industry has led to a number of companies attempting to open landfills in Mexico, all of which have failed due to failure to meet basic environmental assurances and citizen opposition. The recent Chapter 11 ruling in favor of Metalclad, however, may impede the desire for further regulations at the state or federal level. There is significant concern that the presence of this new infrastructure in the context of free trade will increase the incentive for U.S. companies to export hazardous wastes to TSDs in Mexico, where costs are cheaper and regulations, reporting requirements and enforcement are
It is very likely that the generation of hazardous waste is increasing in the border states of northern Mexico. The increased waste would appear to be more the result of a scale effect --there is simply more industrialization -- rather than a composition effect --a shift in production.
The Generation and Management of Hazardous Wastes and Transboundary Hazardous Waste Shipments between Mexico, Canada and the United States, 1990-2000
63
less strict. In particular, depending upon how “reuse” and “recycle” is interpreted, significant amounts of U.S. liquid hazardous waste could be exported to Mexico for incineration in cement kilns under a less rigid regulatory framework. This would significantly increase stress in the region. 2. U.S. –Canada Border Region
While hazardous waste generation declined and commercial management of hazardous wastes remained stable in the U.S northern region, in Canada both generation and disposal capacity increased in border provinces like Ontario and Quebec since the early 1990s. The new and expanded disposal facilities in Ontario and Quebec receive significant amounts of hazardous waste from the U.S. The availability of inexpensive disposal options in Canada may undermine efforts to manage and reduce hazardous wastes on-site in the U.S. and Canada.
The Generation and Management of Hazardous Wastes and Transboundary Hazardous Waste Shipments between Mexico, Canada and the United States, 1990-2000
64
VI. Summary and Conclusions This paper approached the issue of the impacts of trade liberalization on hazardous waste management in North America in four steps. First, a pre-NAFTA ‘base case” with respect to government policies, the roles of non-governmental actors, disposal capacity, waste generation and disposal, and transboundary waste traffic was established for each country. The full base-case is available from Texas Center for Policy Studies as Appendix A. Secondly, the changes introduced through NAFTA and its institutions were described. Third, the changes with respect to government policies, waste generation, transboundary movement and disposal in each NAFTA country since 1994 were outlined. Fourth, possible explanations for these changes, including the impacts of trade liberalization, and other factors were reviewed and assessed. This paper sought to answer two questions with respect to environmental effects of NAFTA with respect to the management of hazardous wastes:
• Is trade and investment liberalization concentrating economic activity in the hazardous waste management industry in areas where it takes place more efficiently, or conversely, where ecological stress is already acute such as the U.S. - Mexico border region and the U.S. Canada-Border Region? and
• Are companies in the manufacturing or hazardous waste management sectors relocating or are they sending hazardous wastes to other areas to take advantage of less stringent hazardous waste regulations or enforcement?
With respect to the first question, the available data indicates an ongoing concentration of economic activity, including hazardous waste generation and management in the US-Mexico Border region. This is evidenced by the continued concentration of generation and increase in off-site waste management activities in US border states, the concentration of waste collection, storage and management facilities in Mexican border states, and steady growth of active maquiladora plants in the border region. While it has not been possible in this report to affirm that this concentration has increased “stress” over “efficiency” – particularly as hazardous waste data is limited in Mexico – there is significant concern that off-site management of U.S. and Mexican wastes in Mexico will increase ecological stress over time. The situation with respect to the Canada-US border region is less clear. Waste generation in key US border states has been in decline. However, waste generation in Ontario and Quebec has been increasing significantly, particularly in the steel and chemical industries, which are concentrated in the border region. In addition, despite the decline in waste generation among the US border states, there has been a dramatic growth in US waste exports to Ontario and Quebec and, in the context of a weakened regulatory environment, a significant increase in disposal capacity in those provinces. Differences in regulatory requirements related to hazardous waste disposal, specifically the existence of less stringent standards in Ontario and Quebec has been the key factor in the increase in US hazardous waste exports to Canada. Similarly, the expansion of disposal capacity in these provinces is largely intended to serve the US market, although the bulk of the investments in this capacity are Canadian in origin. The ban on imports of hazardous wastes for final disposal into Mexico limits the economic incentive for the establishment of disposal capacity to deal with imported wastes to take advantage of differences in the regulatory and enforcement regime between Mexico and the US, although exports of some wastes to domestic Mexican firms have increased. In addition, there
The Generation and Management of Hazardous Wastes and Transboundary Hazardous Waste Shipments between Mexico, Canada and the United States, 1990-2000
65
has been significant US investment in Mexican capacity for the disposal of domestically generated wastes, with the market for these services being driven by stronger disposal requirements in Mexico in some cases, as well as “temporary” authorizations without publicly-approved standards in others. Significant gaps exist in the systems for tracking hazardous waste generation and disposal in all three countries. Reliable data on waste generation in Canada and Mexico is extremely limited, and the reliability of the data regarding transboundary waste movements among the three countries has been seriously questioned. Tracking of transboundary waste movements from “cradle to grave” when the “cradle” is in one country and the “grave” in another is almost impossible. More broadly, while the process of trade liberalization may initially have been a driver for the establishment of a more stringent regulatory regime in Mexico, it has also been explicitly referenced as a factor in the weakening of environmental protection regimes by Canadian governments undertaking such “reforms.” The NAFTA trade rules have also been identified as a constraint on their ability to adopt higher standards to protect human health and the environment. The outcomes of NAFTA Chapter 11 complaints seen in such cases as the ban on PCB exports from Canada and the Metalclad case in Mexico seem likely to reinforce these directions to the detriment of the health, safety and environment of the citizens of all three NAFTA countries.
While the process of trade liberalization may initially have been a driver for the establishment of a more stringent regulatory regime in Mexico, it has also been explicitly referenced as a factor in the weakening of environmental protection regimes by Canadian governments undertaking such “reforms.”
The Generation and Management of Hazardous Wastes and Transboundary Hazardous Waste Shipments between Mexico, Canada and the United States, 1990-2000
66
VII. Recommendations The authors make the following recommendations on how to improve the climate for better management of hazardous wastes in the three NAFTA countries.
A. Recommendations for Collective Action by the Parties.
• In light of the recent Chapter 11 decisions regarding S.D.Myers and Metalclad, which we believe ultimately undermine the right of Parties to enforce their own environmental standards rules, the three Parties must revisit NAFTA's Chapter 11 provisions. Appropriate changes must be made to safeguard the ability of Parties to set and maintain environmental standards and make environmental policy decisions which they regarding as necessary to protect the health and environment of their citizens.
• Through the CEC, the three parties should reopen negotiations on transboundary environmental impact assessments, as mandated by NAFTA.
• The difficulty in tracking hazardous wastes across borders is a serious concern. All three countries should work to improve reporting and tracking of hazardous waste generation and disposal and strengthen the compatibility of their hazardous waste tracking systems.
• Mexico and the U.S. should continue to update, coordinate and improve the SIRREP/HAZTRAKS system so that it includes both hazardous waste imports and exports between the two countries. Canada and the U.S. should discuss creating a similar system to track wastes between the two countries.
B. Mexico
• Mexico should make its Pollutant Release and Transfer Registry -- known in Mexico as the RETC -- obligatory, particularly Section 1 and Section IV, detailing both toxic releases and hazardous waste generation.
• Mexico should increase enforcement --including through more resources and penalties -- to assure that companies meet their hazardous waste reporting requirements under Mexican law.
• Mexico should issue a definitive ruling that incineration and use of hazardous wastes as a fuel in cement kilns and other industrial furnaces is a disposal technology and therefore importation of hazardous wastes to such facilities is not permitted under Mexican law.
• Mexico should conduct a full needs assessment of hazardous waste management capacity and shortages, including opportunities for source reduction and reuse. The CEC could play a role in coordinating this effort.
C. Canada
• Canada needs to establish regular waste generation and disposal reporting requirements for hazardous waste generators, as well as a system to make the resulting information publicly available and accessible.
• Canada should adopt standards for "environmentally sound disposal" of hazardous wastes, as per its obligations under the Basel Convention. These standards should be at least comparable to the U.S. RCRA standards for land disposal, and the RCRA/Clean Air Act MACT standards for hazardous waste incinerators and other facilities burning hazardous wastes as ‘fuel.’
The Generation and Management of Hazardous Wastes and Transboundary Hazardous Waste Shipments between Mexico, Canada and the United States, 1990-2000
67
D. The United States • The U.S. should rescind RCRA regulations which exclude used batteries from export
notification requirements to accurately track exports from the U.S. to Mexico. • The U.S. should increase resources to border states to adequately inspect Ports of Entry for
compliance with hazardous waste handling, transport and reporting requirements and increase cooperation between Customs and environmental authorities to track hazardous waste in a timely manner.
The Generation and Management of Hazardous Wastes and Transboundary Hazardous Waste Shipments between Mexico, Canada and the United States, 1990-2000
68
Appendix A: Pre-1994 Base Cases A. The United States 1. Government Policy a. Introduction Before substantial state and federal regulation of waste began in the mid 1970s in the U.S., most industrial waste was disposed of in landfills, stored in surface impoundments such as lagoons or pits, discharged into surface waters with little or no treatment, or burned. Mismanagement of these wastes was common, resulting in polluted ground water, streams, lakes and rivers as well as damage to wildlife and vegetation and public health (US EPA November 1986, 1). Today, three major federal laws guide management of hazardous and other industrial waste: • Resource Conservation and Recovery Act (RCRA) of 1976. As re-authorized in 1980
and 1984 by the Hazardous and Solid Waste Amendments, this federal law creates a step-by-step management approach restricting and controlling the treatment, storage and disposal of hazardous waste; mandates a permitting system to assure the safe management of all hazardous waste; and implements a system to track hazardous waste as it moves “cradle-to-grave,” from the point of generation to disposal.
• Safe Drinking Water Act of 1974, amended in 1986 and 1996. This act, along with RCRA, protects ground water sources of potable water, and regulates the underground and deepwell injection of industrial and hazardous wastes;
• CERCLA, the Comprehensive Emergency Response, Compensation and Liability Act of 1980, amended in 1986 as the Superfund Amendment and Reauthorization Act (SARA). This federal law created a $1.6 billion “Superfund” to address spills of hazardous waste and clean up of old, abandoned hazardous waste sites, which was later increased to $13.6 million. Title III of SARA, the Emergency Planning and Community-Right-to-Know Act of 1986, required major industries to report releases, transfers and recycling of toxic chemicals to the Environmental Protection Agency as part of the Toxics Release Inventory Program.
Other federal laws which relate to hazardous waste include the 1976 Hazardous Material Transportation Act, implemented by the U.S. Department of Transportation, the Federal Clean Air Act, which regulates the emissions of hazardous substances into the air, the Clean Water Act – which regulates the discharge of pollutants into surface waters and sewers -- and the Toxics Substances and Control Act, which regulates the disposal of PCBs and several other toxic compounds. In addition to federal regulations, most states have adopted their own laws to manage hazardous waste. Some 44 of 50 states have been delegated the RCRA program by the EPA, although the EPA continues to oversee the program and be involved in compliance and enforcement activities. b.Regulations and enforcement of hazardous waste at generation All manufacturers who produce hazardous wastes are subject to a variety of state and federal requirements for the proper management, transport and reporting of hazardous wastes. First of all, manufacturers are required to take detailed analysis of their waste to determine if their waste is considered hazardous under RCRA regulations. Most RCRA hazardous wastes must be treated
The Generation and Management of Hazardous Wastes and Transboundary Hazardous Waste Shipments between Mexico, Canada and the United States, 1990-2000
69
in a TSD RCRA permitted or interim facility, whether on or off-site. Virtually all hazardous waste must be treated prior to land disposal. Under the 1984 amendments to RCRA, Congress required the U.S. Environmental Protection Agency (hereafter EPA) to establish treatment standards for all waste identified as hazardous in 1984 by May 1990, although a two-year variance was allowed for certain wastes (TNRCC March 2000: 12). Congress also required EPA to establish standards for “newly-identified” hazardous wastes within six months after identification, a requirement the EPA failed to meet. In addition, all manufacturers identified as large quantity generators (LQG)16 must report the amount of hazardous waste they generate every two years, information which is published by the U.S. EPA. Some state-defined thresholds for large quantity generators are lower than the federal definitions. c. Hazardous Waste Tracking Systems Under RCRA’s cradle-to-grave system, all generators must prepare a “manifest” which includes information on the waste, shipper and facility which will handle the waste for any RCRA Subtitle C defined hazardous waste sent off-site. RCRA hazardous waste can only be delivered to a treatment, storage or disposal (TSD) facility having either a RCRA permit or interim status under RCRA. Once the waste is received, the TSD must note any discrepancies between the manifest and the shipment, send a copy to both the shipper and generator within 30 days and keep a copy of the manifest on-site for at least three years (40 CFR 264.71). In addition, many states have more inclusive definitions of hazardous waste and have developed their own hazardous waste tracking systems (CEC 1999: 14). Three federal laws and two international agreements cover tracking and enforcement of transboundary movements of hazardous wastes between the NAFTA countries. The Federal laws include: *the 1976 RCRA as amended and regulations pursuant contained in 40CFR Part 260; *the 1974 Hazardous Materials Transportation Act (HMTA) and its regulations; and *the 1976 Toxic Substances Control Act (TCSA) as amended and its regulations in 40 CFR 761. International agreements have been reached with Canada under the 1986 Canada-US Agreement on the Transboundary Movement of Hazardous Wastes, and with Mexico, under the 1983 U.S.-Mexico Agreement on Cooperation for the Protection and Improvement of the Environment in the Border Area (the La Paz Agreement ). In 1986, the U.S. and Mexico adopted Annex III of the La Paz Agreement, addressing the transboundary movement of hazardous wastes between the two countries. While RCRA, implemented by EPA, and HMTA, implemented by the Department of Transportation, and their regulations establish most of the regulations for shipments of hazardous wastes across borders, TCSA provides the framework for the transport of PCB wastes. Prior to 1996, imports of PCBs were only allowed at concentrations less than 50 parts per million.
16 The federal criteria for a large quantity generator is the following: The generator generated in any single month 1,000 kg (1.1 tons) or more of RCRA hazardous waste; or The generator generated in any single month, or accumulated at any single time, more than 1 kg. . of acute RCRA acute hazardous waste; or The generator generated, or accumulated, at any time, more than 100 kg of spill cleanup material contaminated with RCRA acute hazardous waste.
The Generation and Management of Hazardous Wastes and Transboundary Hazardous Waste Shipments between Mexico, Canada and the United States, 1990-2000
70
All exporters must submit a Notification of Intent to Export (NOI) to the EPA (40 CFR Part 262.52). In addition, all primary exporters – both shippers and generators -- must file with EPA a report by March 1 summarizing the hazardous waste exported during the previous year. Information from notices of intent to export and consents and from annual reports and manifests are contained in EPA’s EXPORTS database. TSD facilities which import hazardous waste must notify the EPA regional administrator at least four weeks in advance of the expected shipment, although subsequent notification is not required if it is for the same type of waste. In addition, the TSD must pre-file the manifest form with U.S. Customs officials at the appropriate Port of Entry. Under the bilateral agreements, Mexico and Canada must pre-notify the U.S. of any shipments of waste going to a U.S. facility and receive approval. However, because the U.S. is obligated under the La Paz agreement to accept hazardous and other wastes from maquiladoras, no official approval is needed, although notification still applies. There was virtually no information on imports of wastes before 1995. In addition to the Imports and Exports databases, the U.S. and Mexico agreed in 1990 to develop a database to track hazardous wastes between the two countries. In October of 1992, the two countries announced the development of Haztraks (Hazardous Waste Tracking System). In the early 1990s, Haztraks was jointly run by EPA’s Region VI and IX, through Region VI in Dallas. Unfortunately, because of a failure of coordination between the two governments, Haztraks has included no or little information on exports from the U.S. to Mexico, and information on imports from Mexico has significant data gaps, detailed extensively in other reports (Jacott 2000: 29-31). d. Regulations of Hazardous Waste Management Facilities Any Treatment, Storage and Disposal facility (TSD) treating or disposing of hazardous waste must obtain a RCRA permit from either EPA or the authorized state and meet certain operating, siting and design standards (Some facilities are allowed to operate under “interim” status until a final permit has been issued.) RCRA also:
• Prohibits liquid hazardous waste from hazardous waste land disposal facilities; • Bans and/or restricts untreated solid hazardous wastes from being disposed at land
disposal facilities: • prescribes landfill operating standards; • imposes financial and liability insurance obligations on TSD facilities for bodily and
property damage; • provides for a closure and post-closure financial assurance (40 CFR 264.140 (b)) as well
as clean-up procedures (40 CFR 264.111). • obligates a contingency plan in the event of an emergency and must have an emergency
coordinator at all times in the facility (40 CFR 264.55). • TSD must keep an “operating record” of the facility (CFR 264.75).
Major gaps in regulation of TSDs that have been identified under U.S. law include:
• No requirement for an environmental impact study or analysis; • Cement kilns and utilities and other industries have been allowed to burn hazardous
wastes under “interim” status for decades – although the 1991 Boiler and Industrial Furnace Regulations increased standards -- and cement kiln dust has not been regulated
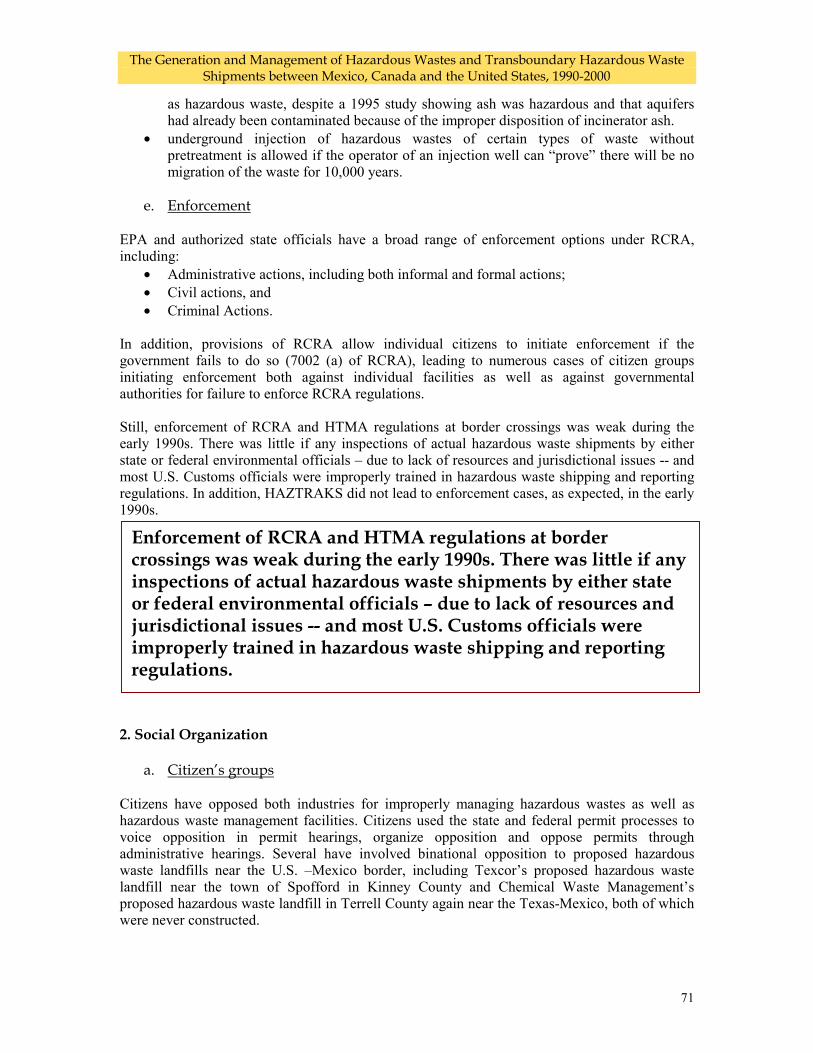
The Generation and Management of Hazardous Wastes and Transboundary Hazardous Waste Shipments between Mexico, Canada and the United States, 1990-2000
71
as hazardous waste, despite a 1995 study showing ash was hazardous and that aquifers had already been contaminated because of the improper disposition of incinerator ash.
• underground injection of hazardous wastes of certain types of waste without pretreatment is allowed if the operator of an injection well can “prove” there will be no migration of the waste for 10,000 years.
e. Enforcement
EPA and authorized state officials have a broad range of enforcement options under RCRA, including:
• Administrative actions, including both informal and formal actions; • Civil actions, and • Criminal Actions.
In addition, provisions of RCRA allow individual citizens to initiate enforcement if the government fails to do so (7002 (a) of RCRA), leading to numerous cases of citizen groups initiating enforcement both against individual facilities as well as against governmental authorities for failure to enforce RCRA regulations. Still, enforcement of RCRA and HTMA regulations at border crossings was weak during the early 1990s. There was little if any inspections of actual hazardous waste shipments by either state or federal environmental officials – due to lack of resources and jurisdictional issues -- and most U.S. Customs officials were improperly trained in hazardous waste shipping and reporting regulations. In addition, HAZTRAKS did not lead to enforcement cases, as expected, in the early 1990s.
2. Social Organization
a. Citizen’s groups
Citizens have opposed both industries for improperly managing hazardous wastes as well as hazardous waste management facilities. Citizens used the state and federal permit processes to voice opposition in permit hearings, organize opposition and oppose permits through administrative hearings. Several have involved binational opposition to proposed hazardous waste landfills near the U.S. –Mexico border, including Texcor’s proposed hazardous waste landfill near the town of Spofford in Kinney County and Chemical Waste Management’s proposed hazardous waste landfill in Terrell County again near the Texas-Mexico, both of which were never constructed.
Enforcement of RCRA and HTMA regulations at border crossings was weak during the early 1990s. There was little if any inspections of actual hazardous waste shipments by either state or federal environmental officials – due to lack of resources and jurisdictional issues -- and most U.S. Customs officials were improperly trained in hazardous waste shipping and reporting regulations.
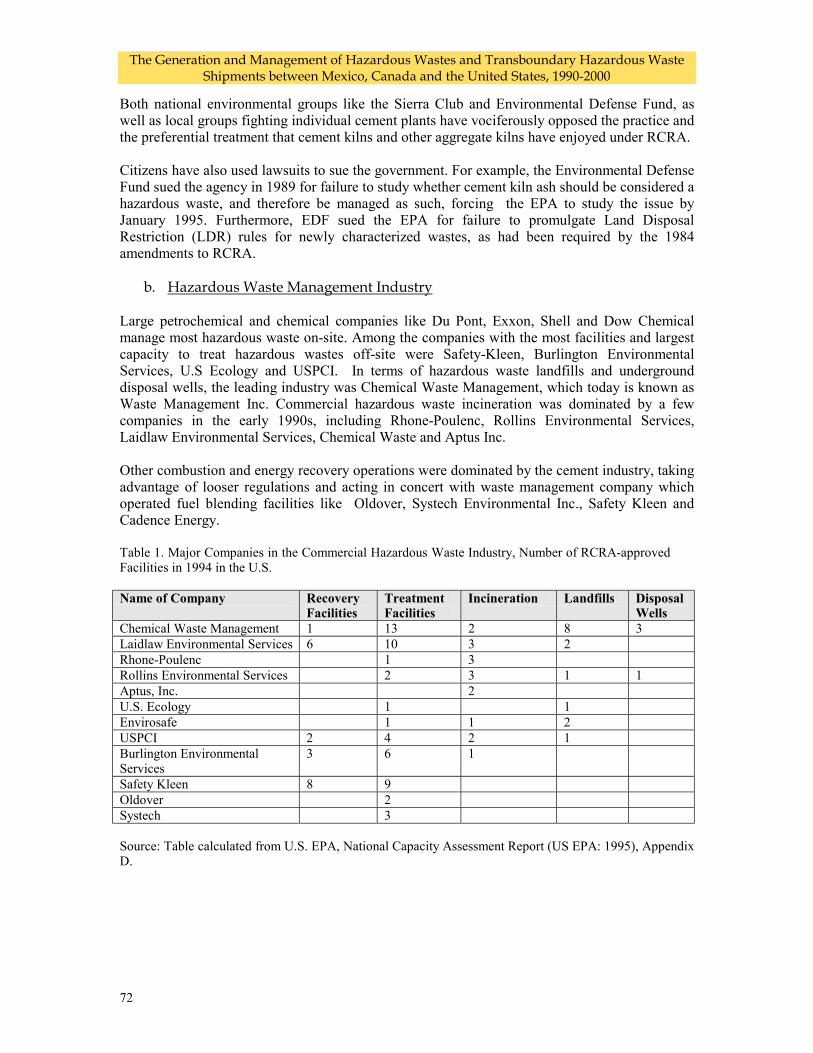
The Generation and Management of Hazardous Wastes and Transboundary Hazardous Waste Shipments between Mexico, Canada and the United States, 1990-2000
72
Both national environmental groups like the Sierra Club and Environmental Defense Fund, as well as local groups fighting individual cement plants have vociferously opposed the practice and the preferential treatment that cement kilns and other aggregate kilns have enjoyed under RCRA. Citizens have also used lawsuits to sue the government. For example, the Environmental Defense Fund sued the agency in 1989 for failure to study whether cement kiln ash should be considered a hazardous waste, and therefore be managed as such, forcing the EPA to study the issue by January 1995. Furthermore, EDF sued the EPA for failure to promulgate Land Disposal Restriction (LDR) rules for newly characterized wastes, as had been required by the 1984 amendments to RCRA.
b. Hazardous Waste Management Industry Large petrochemical and chemical companies like Du Pont, Exxon, Shell and Dow Chemical manage most hazardous waste on-site. Among the companies with the most facilities and largest capacity to treat hazardous wastes off-site were Safety-Kleen, Burlington Environmental Services, U.S Ecology and USPCI. In terms of hazardous waste landfills and underground disposal wells, the leading industry was Chemical Waste Management, which today is known as Waste Management Inc. Commercial hazardous waste incineration was dominated by a few companies in the early 1990s, including Rhone-Poulenc, Rollins Environmental Services, Laidlaw Environmental Services, Chemical Waste and Aptus Inc. Other combustion and energy recovery operations were dominated by the cement industry, taking advantage of looser regulations and acting in concert with waste management company which operated fuel blending facilities like Oldover, Systech Environmental Inc., Safety Kleen and Cadence Energy. Table 1. Major Companies in the Commercial Hazardous Waste Industry, Number of RCRA-approved Facilities in 1994 in the U.S. Name of Company Recovery
Facilities Treatment Facilities
Incineration Landfills Disposal Wells
Chemical Waste Management 1 13 2 8 3 Laidlaw Environmental Services 6 10 3 2 Rhone-Poulenc 1 3 Rollins Environmental Services 2 3 1 1 Aptus, Inc. 2 U.S. Ecology 1 1 Envirosafe 1 1 2 USPCI 2 4 2 1 Burlington Environmental Services
3 6 1
Safety Kleen 8 9 Oldover 2 Systech 3 Source: Table calculated from U.S. EPA, National Capacity Assessment Report (US EPA: 1995), Appendix D.
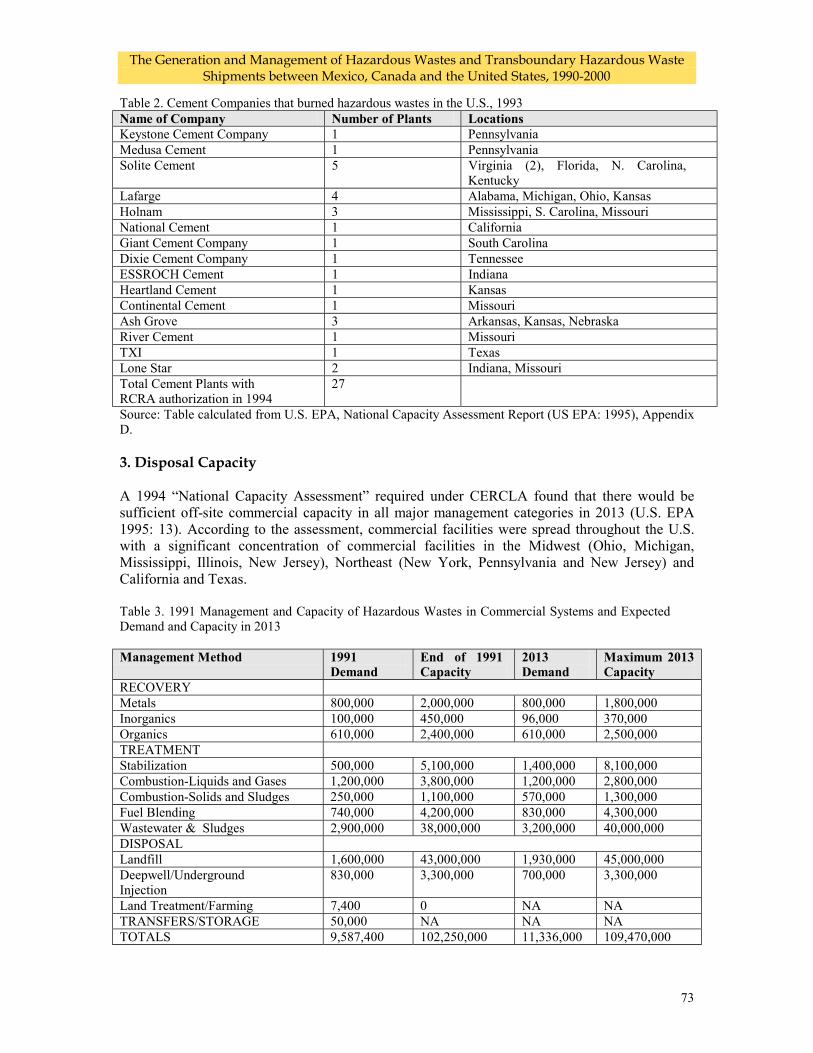
The Generation and Management of Hazardous Wastes and Transboundary Hazardous Waste Shipments between Mexico, Canada and the United States, 1990-2000
73
Table 2. Cement Companies that burned hazardous wastes in the U.S., 1993 Name of Company Number of Plants Locations Keystone Cement Company 1 Pennsylvania Medusa Cement 1 Pennsylvania Solite Cement 5 Virginia (2), Florida, N. Carolina,
Kentucky Lafarge 4 Alabama, Michigan, Ohio, Kansas Holnam 3 Mississippi, S. Carolina, Missouri National Cement 1 California Giant Cement Company 1 South Carolina Dixie Cement Company 1 Tennessee ESSROCH Cement 1 Indiana Heartland Cement 1 Kansas Continental Cement 1 Missouri Ash Grove 3 Arkansas, Kansas, Nebraska River Cement 1 Missouri TXI 1 Texas Lone Star 2 Indiana, Missouri Total Cement Plants with RCRA authorization in 1994
27
Source: Table calculated from U.S. EPA, National Capacity Assessment Report (US EPA: 1995), Appendix D. 3. Disposal Capacity A 1994 “National Capacity Assessment” required under CERCLA found that there would be sufficient off-site commercial capacity in all major management categories in 2013 (U.S. EPA 1995: 13). According to the assessment, commercial facilities were spread throughout the U.S. with a significant concentration of commercial facilities in the Midwest (Ohio, Michigan, Mississippi, Illinois, New Jersey), Northeast (New York, Pennsylvania and New Jersey) and California and Texas. Table 3. 1991 Management and Capacity of Hazardous Wastes in Commercial Systems and Expected Demand and Capacity in 2013 Management Method 1991
Demand End of 1991 Capacity
2013 Demand
Maximum 2013 Capacity
RECOVERY Metals 800,000 2,000,000 800,000 1,800,000 Inorganics 100,000 450,000 96,000 370,000 Organics 610,000 2,400,000 610,000 2,500,000 TREATMENT Stabilization 500,000 5,100,000 1,400,000 8,100,000 Combustion-Liquids and Gases 1,200,000 3,800,000 1,200,000 2,800,000 Combustion-Solids and Sludges 250,000 1,100,000 570,000 1,300,000 Fuel Blending 740,000 4,200,000 830,000 4,300,000 Wastewater & Sludges 2,900,000 38,000,000 3,200,000 40,000,000 DISPOSAL Landfill 1,600,000 43,000,000 1,930,000 45,000,000 Deepwell/Underground Injection
830,000 3,300,000 700,000 3,300,000
Land Treatment/Farming 7,400 0 NA NA TRANSFERS/STORAGE 50,000 NA NA NA TOTALS 9,587,400 102,250,000 11,336,000 109,470,000
The Generation and Management of Hazardous Wastes and Transboundary Hazardous Waste Shipments between Mexico, Canada and the United States, 1990-2000
74
Source: U.S. EPA, National Capacity Assessment Report (US EPA: 1995), Tables II-V.
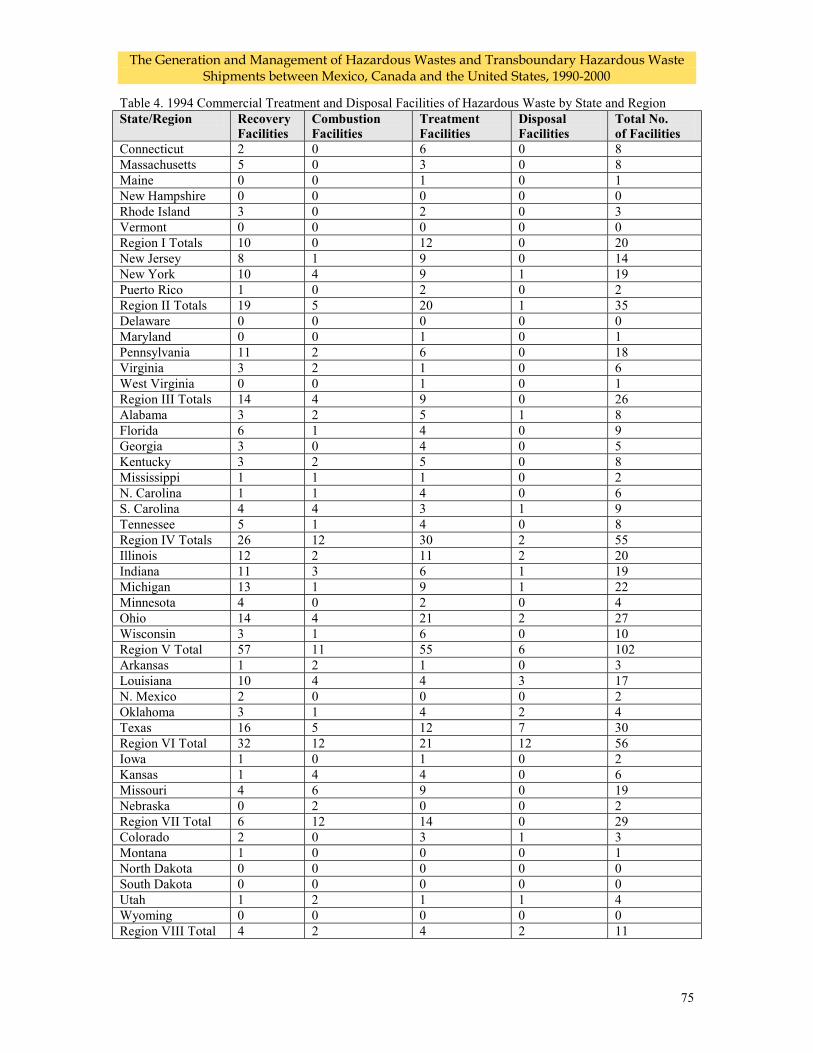
The Generation and Management of Hazardous Wastes and Transboundary Hazardous Waste Shipments between Mexico, Canada and the United States, 1990-2000
75
Table 4. 1994 Commercial Treatment and Disposal Facilities of Hazardous Waste by State and Region State/Region Recovery
Facilities Combustion Facilities
Treatment Facilities
Disposal Facilities
Total No. of Facilities
Connecticut 2 0 6 0 8 Massachusetts 5 0 3 0 8 Maine 0 0 1 0 1 New Hampshire 0 0 0 0 0 Rhode Island 3 0 2 0 3 Vermont 0 0 0 0 0 Region I Totals 10 0 12 0 20 New Jersey 8 1 9 0 14 New York 10 4 9 1 19 Puerto Rico 1 0 2 0 2 Region II Totals 19 5 20 1 35 Delaware 0 0 0 0 0 Maryland 0 0 1 0 1 Pennsylvania 11 2 6 0 18 Virginia 3 2 1 0 6 West Virginia 0 0 1 0 1 Region III Totals 14 4 9 0 26 Alabama 3 2 5 1 8 Florida 6 1 4 0 9 Georgia 3 0 4 0 5 Kentucky 3 2 5 0 8 Mississippi 1 1 1 0 2 N. Carolina 1 1 4 0 6 S. Carolina 4 4 3 1 9 Tennessee 5 1 4 0 8 Region IV Totals 26 12 30 2 55 Illinois 12 2 11 2 20 Indiana 11 3 6 1 19 Michigan 13 1 9 1 22 Minnesota 4 0 2 0 4 Ohio 14 4 21 2 27 Wisconsin 3 1 6 0 10 Region V Total 57 11 55 6 102 Arkansas 1 2 1 0 3 Louisiana 10 4 4 3 17 N. Mexico 2 0 0 0 2 Oklahoma 3 1 4 2 4 Texas 16 5 12 7 30 Region VI Total 32 12 21 12 56 Iowa 1 0 1 0 2 Kansas 1 4 4 0 6 Missouri 4 6 9 0 19 Nebraska 0 2 0 0 2 Region VII Total 6 12 14 0 29 Colorado 2 0 3 1 3 Montana 1 0 0 0 1 North Dakota 0 0 0 0 0 South Dakota 0 0 0 0 0 Utah 1 2 1 1 4 Wyoming 0 0 0 0 0 Region VIII Total 4 2 4 2 11
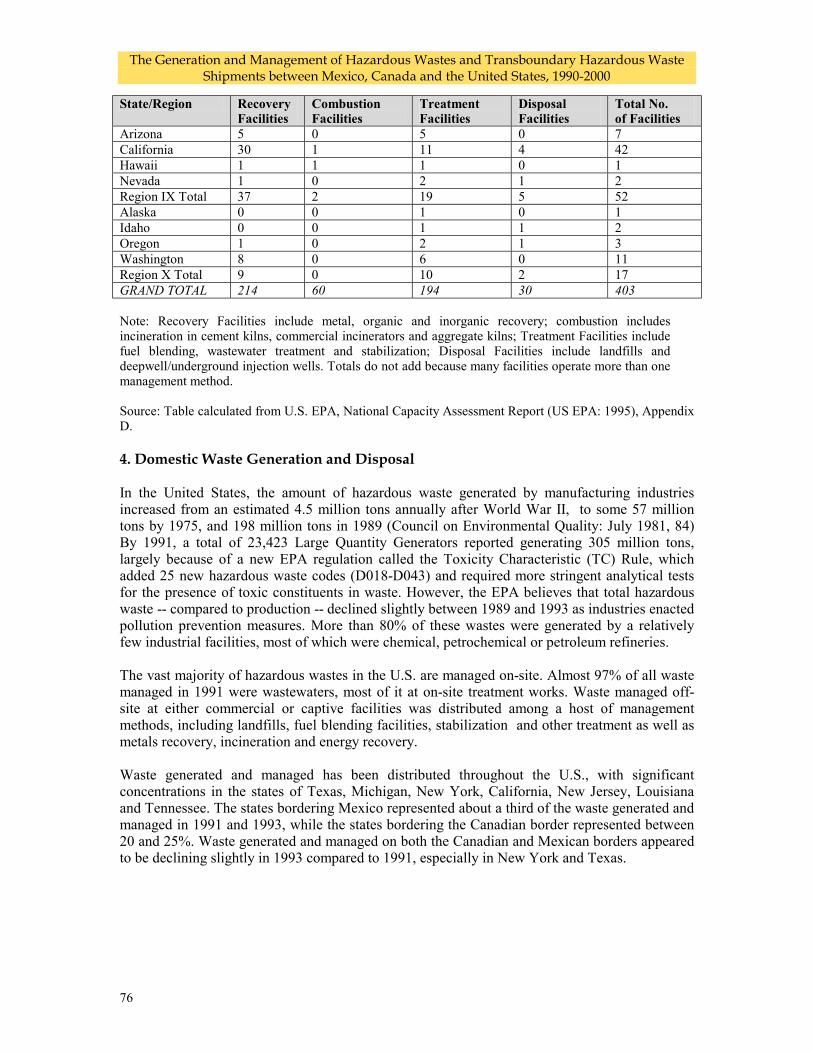
The Generation and Management of Hazardous Wastes and Transboundary Hazardous Waste Shipments between Mexico, Canada and the United States, 1990-2000
76
State/Region Recovery Facilities
Combustion Facilities
Treatment Facilities
Disposal Facilities
Total No. of Facilities
Arizona 5 0 5 0 7 California 30 1 11 4 42 Hawaii 1 1 1 0 1 Nevada 1 0 2 1 2 Region IX Total 37 2 19 5 52 Alaska 0 0 1 0 1 Idaho 0 0 1 1 2 Oregon 1 0 2 1 3 Washington 8 0 6 0 11 Region X Total 9 0 10 2 17 GRAND TOTAL 214 60 194 30 403 Note: Recovery Facilities include metal, organic and inorganic recovery; combustion includes incineration in cement kilns, commercial incinerators and aggregate kilns; Treatment Facilities include fuel blending, wastewater treatment and stabilization; Disposal Facilities include landfills and deepwell/underground injection wells. Totals do not add because many facilities operate more than one management method. Source: Table calculated from U.S. EPA, National Capacity Assessment Report (US EPA: 1995), Appendix D. 4. Domestic Waste Generation and Disposal In the United States, the amount of hazardous waste generated by manufacturing industries increased from an estimated 4.5 million tons annually after World War II, to some 57 million tons by 1975, and 198 million tons in 1989 (Council on Environmental Quality: July 1981, 84) By 1991, a total of 23,423 Large Quantity Generators reported generating 305 million tons, largely because of a new EPA regulation called the Toxicity Characteristic (TC) Rule, which added 25 new hazardous waste codes (D018-D043) and required more stringent analytical tests for the presence of toxic constituents in waste. However, the EPA believes that total hazardous waste -- compared to production -- declined slightly between 1989 and 1993 as industries enacted pollution prevention measures. More than 80% of these wastes were generated by a relatively few industrial facilities, most of which were chemical, petrochemical or petroleum refineries. The vast majority of hazardous wastes in the U.S. are managed on-site. Almost 97% of all waste managed in 1991 were wastewaters, most of it at on-site treatment works. Waste managed off-site at either commercial or captive facilities was distributed among a host of management methods, including landfills, fuel blending facilities, stabilization and other treatment as well as metals recovery, incineration and energy recovery. Waste generated and managed has been distributed throughout the U.S., with significant concentrations in the states of Texas, Michigan, New York, California, New Jersey, Louisiana and Tennessee. The states bordering Mexico represented about a third of the waste generated and managed in 1991 and 1993, while the states bordering the Canadian border represented between 20 and 25%. Waste generated and managed on both the Canadian and Mexican borders appeared to be declining slightly in 1993 compared to 1991, especially in New York and Texas.
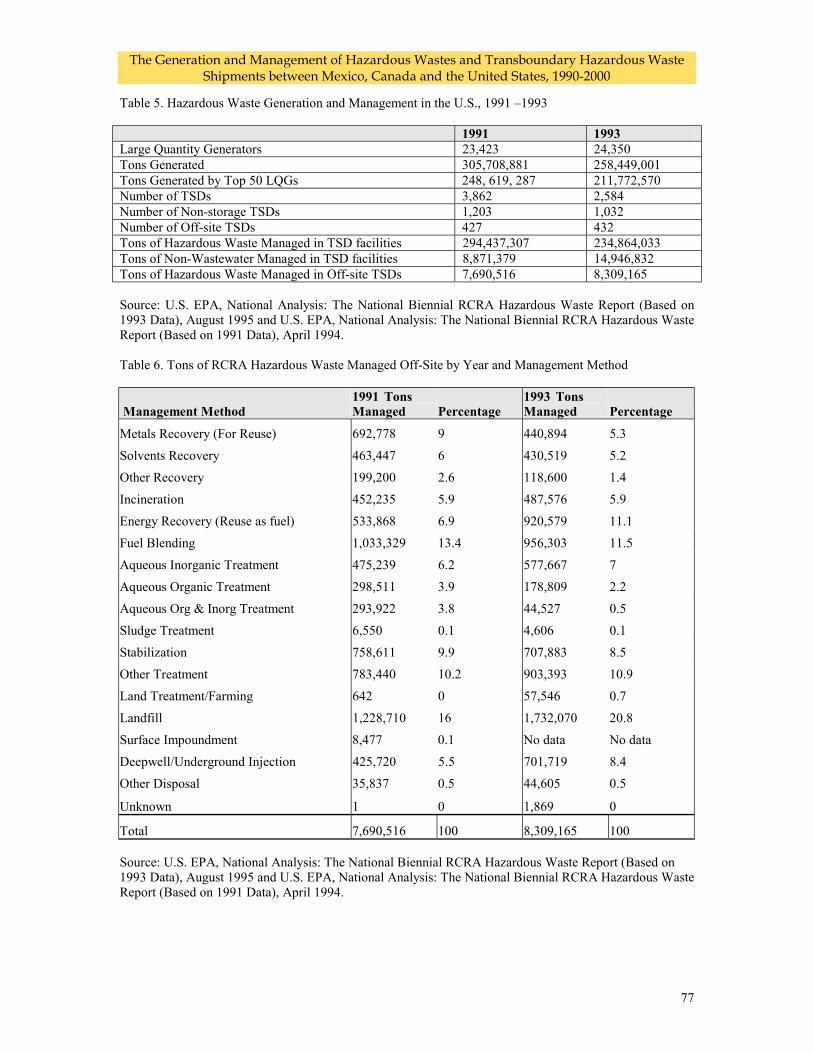
The Generation and Management of Hazardous Wastes and Transboundary Hazardous Waste Shipments between Mexico, Canada and the United States, 1990-2000
77
Table 5. Hazardous Waste Generation and Management in the U.S., 1991 –1993 1991 1993 Large Quantity Generators 23,423 24,350 Tons Generated 305,708,881 258,449,001 Tons Generated by Top 50 LQGs 248, 619, 287 211,772,570 Number of TSDs 3,862 2,584 Number of Non-storage TSDs 1,203 1,032 Number of Off-site TSDs 427 432 Tons of Hazardous Waste Managed in TSD facilities 294,437,307 234,864,033 Tons of Non-Wastewater Managed in TSD facilities 8,871,379 14,946,832 Tons of Hazardous Waste Managed in Off-site TSDs 7,690,516 8,309,165 Source: U.S. EPA, National Analysis: The National Biennial RCRA Hazardous Waste Report (Based on 1993 Data), August 1995 and U.S. EPA, National Analysis: The National Biennial RCRA Hazardous Waste Report (Based on 1991 Data), April 1994. Table 6. Tons of RCRA Hazardous Waste Managed Off-Site by Year and Management Method
Management Method 1991 Tons Managed Percentage
1993 Tons Managed Percentage
Metals Recovery (For Reuse) 692,778 9 440,894 5.3
Solvents Recovery 463,447 6 430,519 5.2
Other Recovery 199,200 2.6 118,600 1.4
Incineration 452,235 5.9 487,576 5.9
Energy Recovery (Reuse as fuel) 533,868 6.9 920,579 11.1
Fuel Blending 1,033,329 13.4 956,303 11.5
Aqueous Inorganic Treatment 475,239 6.2 577,667 7
Aqueous Organic Treatment 298,511 3.9 178,809 2.2
Aqueous Org & Inorg Treatment 293,922 3.8 44,527 0.5
Sludge Treatment 6,550 0.1 4,606 0.1
Stabilization 758,611 9.9 707,883 8.5
Other Treatment 783,440 10.2 903,393 10.9
Land Treatment/Farming 642 0 57,546 0.7
Landfill 1,228,710 16 1,732,070 20.8
Surface Impoundment 8,477 0.1 No data No data
Deepwell/Underground Injection 425,720 5.5 701,719 8.4
Other Disposal 35,837 0.5 44,605 0.5
Unknown 1 0 1,869 0
Total 7,690,516 100 8,309,165 100 Source: U.S. EPA, National Analysis: The National Biennial RCRA Hazardous Waste Report (Based on 1993 Data), August 1995 and U.S. EPA, National Analysis: The National Biennial RCRA Hazardous Waste Report (Based on 1991 Data), April 1994.
The Generation and Management of Hazardous Wastes and Transboundary Hazardous Waste Shipments between Mexico, Canada and the United States, 1990-2000
78
Table 7. Percentage of Hazardous Waste Managed and Generated by State and Region, 1991-1993 State or Region % Generated,
1991 % Generated, 1993
% Managed, 1991
% Managed, 1993
Texas 34% 24.6% 35.3% 22.4% California 4.2% 5.4% 4.1% 5.4% All Mexico Border States (1) 38.4% 30.2% 39.5% 27.9% Michigan 10.4% 8.1% 10.8% 8.8% Ohio 0.6% 0.7% 0.6% 0.7% Pennsylvania 0.6% 3.7% 0.5% 3.9% Washington 4.8% 5.6% 3.6% 4.3% New York 5.9% 0.6% 6.2% 0.5% All Canada Border States (2) 25.9% 21.9% 25% 21.5% Louisiana 10.3% 12.3% 10.7% 13.4% New Jersey 9.6% 7% 10.1% 7.5% Tennessee 0.6% 13.1% 0.3% 14.5%
a. Includes Arizona, California, New Mexico and Texas; b. Includes Idaho, New Hampshire, Maine, Michigan, Minnesota, Montana, New York,
New Hampshire, North Dakota, Ohio, Pennsylvania, Vermont and Washington.
Source: U.S. EPA, National Analysis: The National Biennial RCRA Hazardous Waste Report (Based on 1993 Data), August 1995 and U.S. EPA, National Analysis: The National Biennial RCRA Hazardous Waste Report (Based on 1991 Data), April 1994. 5. Transboundary Waste Flows
a. Exports
EPA kept poor records on imports and exports of hazardous wastes before NAFTA. For example, certain hazardous wastes, which are exported for recycling such as lead batteries, are exempt from reporting requirements even though EPA knows significant amounts go to Mexico. In 1993, an analysis conducted by the EPA revealed that a total of 142,708.45 tons of hazardous wastes were exported to other countries, 99.5% of which was exported to either Canada or Mexico. Most of the waste exported was recycled or reclaimed (62.49%), or eventually went to landfills (27.74%). Between 1990 and 1993, the number of export notices and waste streams authorized stayed relatively stable. Table 8. Exports from the U.S. to Canada, Mexico and the Rest of the World, 1993 Country of Import Management Method or Type of Waste Quantity in Tons Canada Reclaimed/Recycled, including Fuel blending 16,770.72 Incineration 13,936 Treatment and Landfilled 39,591 Total 70,297.72 Mexico Metal Reclamation
(emission control dust from electric arc furnace steel mills)
71,596.78
Other Countries Metal Reclamation 813.95 Totals 142,708.95 Source: Information provided to authors by U.S. EPA from Exports Database
The Generation and Management of Hazardous Wastes and Transboundary Hazardous Waste Shipments between Mexico, Canada and the United States, 1990-2000
79
Table 9. Number of Waste Streams and Waste Notices of Exports, 1990-93 Country 1990 1991 1992 1993 Canada-Notices 503 467 499 489 Canada-Waste Streams 1060 848 1061 1042 Mexico-Notices 20 17 7 15 Mexico –Waste Streams 20 17 7 15 Totals --Notices 574 544 529 526 Totals-Waste Streams 1141 976 1098 1085 Note: Total includes exports of waste to Europe and other OECD countries. Source: Information provided by U.S. EPA, 2000 from IMPORTS and EXPORTS databases.
b. Imports There is virtually no information available on imports of hazardous waste from before development of the Waste Imports Tracking System in 1995. According to HAZTRAKS, imports of RCRA hazardous waste from Mexico increased slightly between 1991 and 1993. Table 10. Tons of RCRA hazardous waste and Number of RCRA Hazardous Waste Manifests received from Mexico, 1991-1993 Category 1991 1992 1993 Tons of RCRA Hazardous Waste
5524 6833 9437
Number of Manifests 874 1201 2208 Source: U.S. EPA, HAZTRAKS Database, 1998.
The Generation and Management of Hazardous Wastes and Transboundary Hazardous Waste Shipments between Mexico, Canada and the United States, 1990-2000
80
B. Mexico
1. Government Policy
a. Introduction
In 1965, the Mexican government initiated the maquiladora program to increase foreign investment and generate employment and industry in Northern Mexico. Under the program, manufacturers do not have to pay import duties, and instead utilize an “in-bond” system, in which the manufacturer posts a bond, which is returned when the final product is exported. The maquiladora program began to expand rapidly during the 1970s at a time when Mexico still did not have basic controls established on the management, generation and shipments of hazardous wastes. In addition, government policy favored the protection of national industries and promotion of energy production and consumption, all of which led to industrial concentration with environmental consequences. Subsidized state industries such as CFE (Federal Energy Commission) and PEMEX (Mexican Petroleum) were among the largest and most-polluting industries in terms of hazardous wastes. In the 1980s, the Mexican government drastically changed its policy, opening up its economy to investment and international prices, and ending protectionist measures and subsidies to national industries. The change also helped promote the maquiladora sector and the northern border began to receive a greater portion of investment and industrialization, as well as population increases. In 1983, the Mexican government came to an agreement with the U.S. known as the La Paz Agreement. In 1986, the two countries adopted Annex III, which required the U.S. to take back hazardous wastes generated by the maquiladora industry from the imported raw materials. In 1988, Mexico passed its still most important piece of environmental legislation, the General Law for Ecological Equilibrium and Environmental Protection (LGEEPA or General Law), which incorporated environmental issues, including management of hazardous wastes, into one regulatory scheme (see below).
b. Regulations and enforcement of hazardous waste at generation The 1988 General Law imposed significant treatment and reporting requirements on hazardous waste generators. While the 1988 Law provided the regulatory framework for managing hazardous wastes, most of the actual federal environmental performance provisions and standards were not adopted until 1993 through the NOMs, or Mexican Official Standards. In 1993, INE, through its National Consultative Committee for Environmental Standards, approved seven NOMs related to hazardous wastes and hazardous waste management. In addition, in 1992, by presidential decree following a series of industrial accidents, the National Program for the Prevention of High-Risk Environmental Accidents went into operation, requiring risk assessments for many generators of hazardous wastes. Finally, in 1993, Mexico passed the Regulations for Domestic Transport of Hazardous Wastes and Materials although implementation is still on going.
The Generation and Management of Hazardous Wastes and Transboundary Hazardous Waste Shipments between Mexico, Canada and the United States, 1990-2000
81
Table 11: Requirements of Hazardous Waste Generators in Mexico, 1988-1993
• Characterize whether or not wastes are hazardous; • Register with SEMARNAP as a hazardous waste generator; • Prepare, if necessary, Accident Prevention Program and Risk Assessment Plans • Label and identify hazardous wastes properly • Provide proper containment of hazardous wastes for either on-site storage or transport • Meet treatment and disposal standards through operating permit • Report monthly any entrance or exit of hazardous wastes from facility • Complete a manifest for any hazardous waste shipped within Mexico • Complete and receive an authorization, known as a “Guia Ecologica” (Ecological Guide) for
any export and/or import of hazardous wastes. • Report every six months, a summary of the total waste generated, as well as wastes sent off-
site: • Report to INE if final disposal facility does not send a copy of the manifest back to the
generator. Source: LGEEPA and PROFEPA, 1999 Indice de Cumplimiento de la Normatividad Ambiental en Mexico, Chapter III. Table 12. NOMs (Normas Oficiales Mexicanas or Official Mexican Standards) Related to Hazardous
Waste Generation and Management
Standard Number Description
NOM-052-ECOL-1993 Establishes hazardous waste characteristics, lists the different waste streams and indicates the limits that make a hazardous residue toxic to the environment
NOM-053-ECOL-1993 Determines the procedures to carry out different extraction techniques to determine waste toxicity.
NOM-054-ECOL-1993 Procedures to determine incompatibility between two or more residues considered hazardous under NOM-052.
NOM-055-ECOL-1993 Requirements for a hazardous waste landfill site, except radioactive waste landfills.
NOM-056-ECOL-1993 Design and construction requirements for complementary works to a hazardous waste landfill site.
NOM-057-ECOL-1993 Design, construction and operation requirements for hazardous waste landfill cells.
NOM-058-ECOL-1993 Requirements for operation of a hazardous waste site. It is important to note that with these standards, Mexico adopted standards fairly similar to those of the U.S. although the definition of hazardous waste in Mexico and the way it is determined is different. In general, Mexico’s definition is more expansive, meaning that many wastes that would be considered non-hazardous in the U.S. are considered hazardous in Mexico. Still, while much of the regulatory framework and performance standards were in place in Mexico by 1993, actual compliance with these standards was very low as both industries and the government struggled with implementation issues.
c. Hazardous waste tracking systems Article 153 of the LGEEPA allowed the Mexican government to restrict the import and export of hazardous wastes and more specifically prevented hazardous wastes from being imported into Mexico for “final disposal or simple deposit, storage or landfilling in national territory,” while
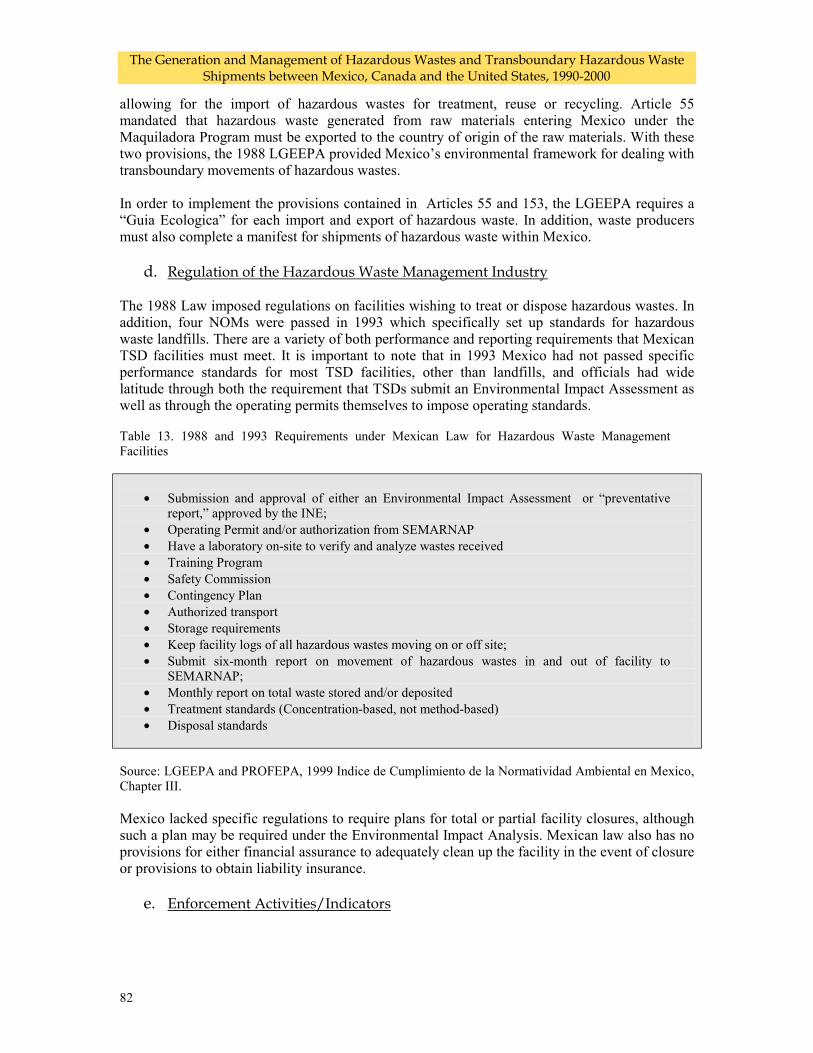
The Generation and Management of Hazardous Wastes and Transboundary Hazardous Waste Shipments between Mexico, Canada and the United States, 1990-2000
82
allowing for the import of hazardous wastes for treatment, reuse or recycling. Article 55 mandated that hazardous waste generated from raw materials entering Mexico under the Maquiladora Program must be exported to the country of origin of the raw materials. With these two provisions, the 1988 LGEEPA provided Mexico’s environmental framework for dealing with transboundary movements of hazardous wastes. In order to implement the provisions contained in Articles 55 and 153, the LGEEPA requires a “Guia Ecologica” for each import and export of hazardous waste. In addition, waste producers must also complete a manifest for shipments of hazardous waste within Mexico.
d. Regulation of the Hazardous Waste Management Industry The 1988 Law imposed regulations on facilities wishing to treat or dispose hazardous wastes. In addition, four NOMs were passed in 1993 which specifically set up standards for hazardous waste landfills. There are a variety of both performance and reporting requirements that Mexican TSD facilities must meet. It is important to note that in 1993 Mexico had not passed specific performance standards for most TSD facilities, other than landfills, and officials had wide latitude through both the requirement that TSDs submit an Environmental Impact Assessment as well as through the operating permits themselves to impose operating standards. Table 13. 1988 and 1993 Requirements under Mexican Law for Hazardous Waste Management Facilities
• Submission and approval of either an Environmental Impact Assessment or “preventative
report,” approved by the INE; • Operating Permit and/or authorization from SEMARNAP • Have a laboratory on-site to verify and analyze wastes received • Training Program • Safety Commission • Contingency Plan • Authorized transport • Storage requirements • Keep facility logs of all hazardous wastes moving on or off site; • Submit six-month report on movement of hazardous wastes in and out of facility to
SEMARNAP; • Monthly report on total waste stored and/or deposited • Treatment standards (Concentration-based, not method-based) • Disposal standards
Source: LGEEPA and PROFEPA, 1999 Indice de Cumplimiento de la Normatividad Ambiental en Mexico, Chapter III. Mexico lacked specific regulations to require plans for total or partial facility closures, although such a plan may be required under the Environmental Impact Analysis. Mexican law also has no provisions for either financial assurance to adequately clean up the facility in the event of closure or provisions to obtain liability insurance.
e. Enforcement Activities/Indicators
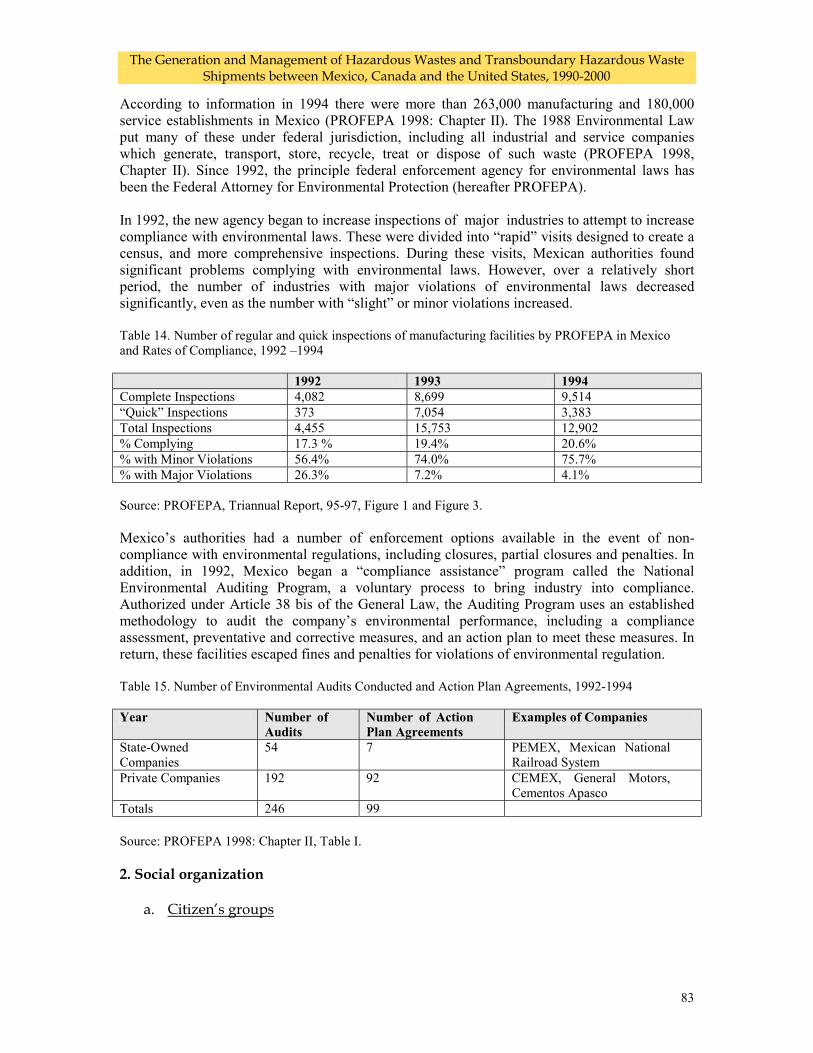
The Generation and Management of Hazardous Wastes and Transboundary Hazardous Waste Shipments between Mexico, Canada and the United States, 1990-2000
83
According to information in 1994 there were more than 263,000 manufacturing and 180,000 service establishments in Mexico (PROFEPA 1998: Chapter II). The 1988 Environmental Law put many of these under federal jurisdiction, including all industrial and service companies which generate, transport, store, recycle, treat or dispose of such waste (PROFEPA 1998, Chapter II). Since 1992, the principle federal enforcement agency for environmental laws has been the Federal Attorney for Environmental Protection (hereafter PROFEPA). In 1992, the new agency began to increase inspections of major industries to attempt to increase compliance with environmental laws. These were divided into “rapid” visits designed to create a census, and more comprehensive inspections. During these visits, Mexican authorities found significant problems complying with environmental laws. However, over a relatively short period, the number of industries with major violations of environmental laws decreased significantly, even as the number with “slight” or minor violations increased. Table 14. Number of regular and quick inspections of manufacturing facilities by PROFEPA in Mexico and Rates of Compliance, 1992 –1994 1992 1993 1994 Complete Inspections 4,082 8,699 9,514 “Quick” Inspections 373 7,054 3,383 Total Inspections 4,455 15,753 12,902 % Complying 17.3 % 19.4% 20.6% % with Minor Violations 56.4% 74.0% 75.7% % with Major Violations 26.3% 7.2% 4.1% Source: PROFEPA, Triannual Report, 95-97, Figure 1 and Figure 3. Mexico’s authorities had a number of enforcement options available in the event of non-compliance with environmental regulations, including closures, partial closures and penalties. In addition, in 1992, Mexico began a “compliance assistance” program called the National Environmental Auditing Program, a voluntary process to bring industry into compliance. Authorized under Article 38 bis of the General Law, the Auditing Program uses an established methodology to audit the company’s environmental performance, including a compliance assessment, preventative and corrective measures, and an action plan to meet these measures. In return, these facilities escaped fines and penalties for violations of environmental regulation. Table 15. Number of Environmental Audits Conducted and Action Plan Agreements, 1992-1994 Year Number of
Audits Number of Action Plan Agreements
Examples of Companies
State-Owned Companies
54 7 PEMEX, Mexican National Railroad System
Private Companies 192 92 CEMEX, General Motors, Cementos Apasco
Totals 246 99
Source: PROFEPA 1998: Chapter II, Table I. 2. Social organization
a. Citizen’s groups
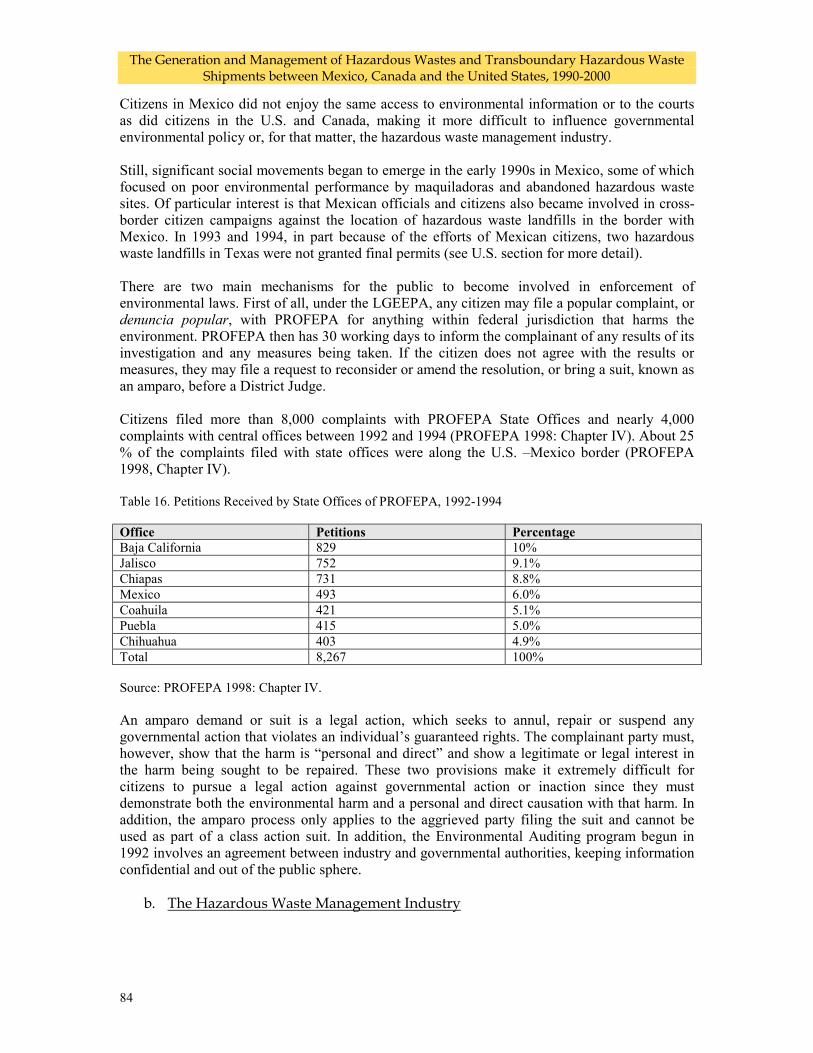
The Generation and Management of Hazardous Wastes and Transboundary Hazardous Waste Shipments between Mexico, Canada and the United States, 1990-2000
84
Citizens in Mexico did not enjoy the same access to environmental information or to the courts as did citizens in the U.S. and Canada, making it more difficult to influence governmental environmental policy or, for that matter, the hazardous waste management industry. Still, significant social movements began to emerge in the early 1990s in Mexico, some of which focused on poor environmental performance by maquiladoras and abandoned hazardous waste sites. Of particular interest is that Mexican officials and citizens also became involved in cross-border citizen campaigns against the location of hazardous waste landfills in the border with Mexico. In 1993 and 1994, in part because of the efforts of Mexican citizens, two hazardous waste landfills in Texas were not granted final permits (see U.S. section for more detail). There are two main mechanisms for the public to become involved in enforcement of environmental laws. First of all, under the LGEEPA, any citizen may file a popular complaint, or denuncia popular, with PROFEPA for anything within federal jurisdiction that harms the environment. PROFEPA then has 30 working days to inform the complainant of any results of its investigation and any measures being taken. If the citizen does not agree with the results or measures, they may file a request to reconsider or amend the resolution, or bring a suit, known as an amparo, before a District Judge. Citizens filed more than 8,000 complaints with PROFEPA State Offices and nearly 4,000 complaints with central offices between 1992 and 1994 (PROFEPA 1998: Chapter IV). About 25 % of the complaints filed with state offices were along the U.S. –Mexico border (PROFEPA 1998, Chapter IV). Table 16. Petitions Received by State Offices of PROFEPA, 1992-1994 Office Petitions Percentage Baja California 829 10% Jalisco 752 9.1% Chiapas 731 8.8% Mexico 493 6.0% Coahuila 421 5.1% Puebla 415 5.0% Chihuahua 403 4.9% Total 8,267 100% Source: PROFEPA 1998: Chapter IV. An amparo demand or suit is a legal action, which seeks to annul, repair or suspend any governmental action that violates an individual’s guaranteed rights. The complainant party must, however, show that the harm is “personal and direct” and show a legitimate or legal interest in the harm being sought to be repaired. These two provisions make it extremely difficult for citizens to pursue a legal action against governmental action or inaction since they must demonstrate both the environmental harm and a personal and direct causation with that harm. In addition, the amparo process only applies to the aggrieved party filing the suit and cannot be used as part of a class action suit. In addition, the Environmental Auditing program begun in 1992 involves an agreement between industry and governmental authorities, keeping information confidential and out of the public sphere.
b. The Hazardous Waste Management Industry
The Generation and Management of Hazardous Wastes and Transboundary Hazardous Waste Shipments between Mexico, Canada and the United States, 1990-2000
85
In the early 1990s, most hazardous waste management was either handled on-site by generating industries or treated, burned, recycled or burned at one of the 79 facilities then authorized by the Mexican government. One area that began to expand in the early 1990s was the burning of hazardous wastes in cement kilns. In 1993, Mobley Environmental Services, a Texas company specialized in liquid hazardous waste management, joined forces with CEMEX – Cementos Mexicanos – one of the largest cement companies in the world, to form Pro Ambiente, S.A. de C.V. That same year, Pro Ambiente built a facility at CEMEX’s plant in Torreon, Mexico to blend “alternative” fuels such as used oils and lubricants for incineration at CEMEX plant. (CEMEX later bought Pro Ambiente outright). The cement plant began burning such fuels in 1994 using a temporary authorization from INE. Similarly, Cementos Apasco, partially owned by Swiss Cement-giant Holderbank, signed a joint investment agreement in 1993 with Chemical Waste de Mexico to open a fuel blending plant called Ecoltec near the cement plant in Ramos Arizpe, Coahuila. The plant would be partially fueled by hazardous wastes – mainly solvents -- both from the Ecoltec plant as well as by a transfer station owned by Chem Waste in El Salto, Guadalajara. Apasco also began burning tires at some facilities in 1993. Metalclad, a California company, also began investing in Mexico in 1991, setting up several subsidiaries, including Ecosistemas Nacionales, which ran a fuel blending facility in Tenango, Morelos called Química Omega, which provided alternative fuels to two CEMEX cement plants in the state of Hidalgo. Later, in 1994, Brown Ferris Industries invested in the plant, changing the name to BFI Omega. Metalclad also began actively searching for sites to open a hazardous waste landfill in Mexico, finally locating a site in 1993 in the state of San Luis Potosí. Thus, by 1994, several U.S. companies, including Chem Waste Management, Metalclad, Mobley Environmental Services and BFI had invested in the Mexican hazardous waste management industry. However, total investment in Mexico in the industry was relatively small, with INE estimating that $115 million had been invested by national and foreign companies (INE/SEMARNAP 1996, Chapter III).
3. Disposal Capacity Mexican officials estimated that in 1994, only 12 percent of the waste generated in Mexico was being adequately treated and disposed of in Mexico (INE 1996, Chapter III). Most of this disposal capacity was the result of a single landfill – RIMSA. In all, INE estimated a total of 79 facilities or companies that treated, disposed or recycled hazardous waste, as well as 71 facilities that collected or transported hazardous wastes. However, INE could not provide any data on either the total amount of waste managed at these facilities or the total capacity, other than that it was not nearly sufficient to treat all the hazardous wastes generated in the country.
By 1994, several U.S. companies, including Chem Waste Management, Metalclad, Mobley Environmental Services and BFI had invested in the Mexican hazardous waste management industry. However, total investment in Mexico in the industry was relatively small.
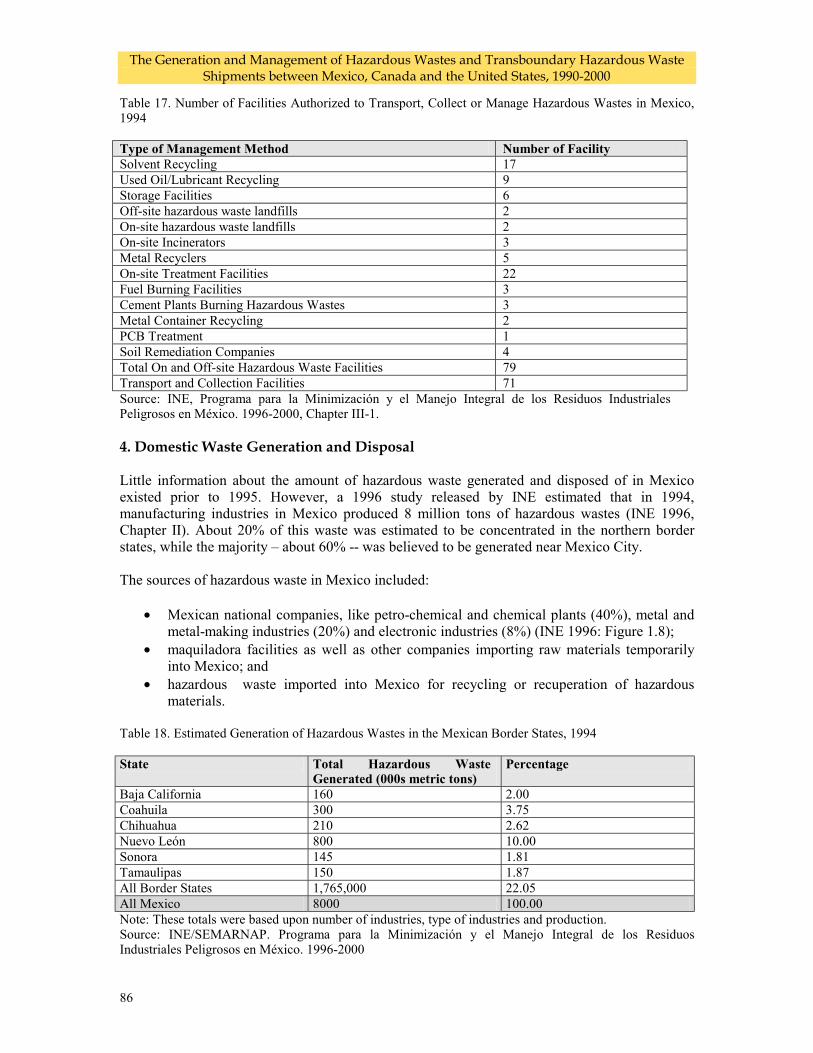
The Generation and Management of Hazardous Wastes and Transboundary Hazardous Waste Shipments between Mexico, Canada and the United States, 1990-2000
86
Table 17. Number of Facilities Authorized to Transport, Collect or Manage Hazardous Wastes in Mexico, 1994 Type of Management Method Number of Facility Solvent Recycling 17 Used Oil/Lubricant Recycling 9 Storage Facilities 6 Off-site hazardous waste landfills 2 On-site hazardous waste landfills 2 On-site Incinerators 3 Metal Recyclers 5 On-site Treatment Facilities 22 Fuel Burning Facilities 3 Cement Plants Burning Hazardous Wastes 3 Metal Container Recycling 2 PCB Treatment 1 Soil Remediation Companies 4 Total On and Off-site Hazardous Waste Facilities 79 Transport and Collection Facilities 71 Source: INE, Programa para la Minimización y el Manejo Integral de los Residuos Industriales Peligrosos en México. 1996-2000, Chapter III-1. 4. Domestic Waste Generation and Disposal Little information about the amount of hazardous waste generated and disposed of in Mexico existed prior to 1995. However, a 1996 study released by INE estimated that in 1994, manufacturing industries in Mexico produced 8 million tons of hazardous wastes (INE 1996, Chapter II). About 20% of this waste was estimated to be concentrated in the northern border states, while the majority – about 60% -- was believed to be generated near Mexico City. The sources of hazardous waste in Mexico included:
• Mexican national companies, like petro-chemical and chemical plants (40%), metal and metal-making industries (20%) and electronic industries (8%) (INE 1996: Figure 1.8);
• maquiladora facilities as well as other companies importing raw materials temporarily into Mexico; and
• hazardous waste imported into Mexico for recycling or recuperation of hazardous materials.
Table 18. Estimated Generation of Hazardous Wastes in the Mexican Border States, 1994 State Total Hazardous Waste
Generated (000s metric tons) Percentage
Baja California 160 2.00 Coahuila 300 3.75 Chihuahua 210 2.62 Nuevo León 800 10.00 Sonora 145 1.81 Tamaulipas 150 1.87 All Border States 1,765,000 22.05 All Mexico 8000 100.00 Note: These totals were based upon number of industries, type of industries and production. Source: INE/SEMARNAP. Programa para la Minimización y el Manejo Integral de los Residuos Industriales Peligrosos en México. 1996-2000
The Generation and Management of Hazardous Wastes and Transboundary Hazardous Waste Shipments between Mexico, Canada and the United States, 1990-2000
87
The same 1996 document reported that a large amount of the waste was believed to be deposited illegally, either on-site, in municipal landfills or in clandestine dumps. Most hazardous waste that was managed properly was being sent to RIMSA –the hazardous waste landfill located near Monterrey, Mexico. PROFEPA reports that their own figures suggest that 70,000 tons of waste was sent to landfills in 1992, a total that increased to 193,000 tons by 1994 (PROFEPA 1998, Chapter II-5). PROFEPA has detailed many of the environmental impacts resulting from mismanagement of hazardous wastes in its reports, as have Mexican non-governmental organizations and neighborhood groups. One of the most serious concerns has been the existence of illegal disposal sites. One of the best known is the case of Alco Pacífico, a U.S. company that recycled used car batteries. The company was shut down in 1991 by PROFEPA due to mismanagement of hazardous wastes. Nonetheless, about 23,000 tons of hazardous waste was left behind and remained at the site until the late-1990s (PROFEPA 1998, Chapter IV). Industrial accidents were also common before NAFTA. Nonetheless, before 1993, Mexico did not keep comprehensive records of industrial accidents (PROFEPA 1998, Chapter III). 5. Transboundary Waste Flows Unfortunately, little data exists from Mexico about the transboundary movement of hazardous wastes before 1995. Citing its own figures – not those generated from a tracking system -- PROFEPA reports that maquiladoras exported about 3,000 tons of hazardous wastes in 1992, an amount that increased to 27,500 by 1994 (PROFEPA 1998, Chapter II-6). At the same time, PROFEPA estimates that approximately 150,000 tons of waste was imported into the country. The figures suggest that few maquiladoras were complying with repatriation requirements, or at least not reporting them to Mexican authorities before 1994.
The Generation and Management of Hazardous Wastes and Transboundary Hazardous Waste Shipments between Mexico, Canada and the United States, 1990-2000
88
C. Canada 1. Government Policy
a. Introduction
Canada is party to two major international agreements related to the transboundary movement of hazardous wastes; the 1986 Canada-US Agreement on the Transboundary Movement of Hazardous Wastes and the Basel Convention on the Transboundary Movement of Hazardous Wastes, which Canada ratified in 1992.
Provincial governments have taken primary responsibility for regulating the handling and disposal of hazardous wastes. The role of Canada’s federal government has been limited to regulating the international and interprovincial movement of wastes, and the handling and disposal of specific substances, such as PCB’s, which are declared to be “toxic” substances for the purposes of the Canadian Environmental Protection Act (CEPA, S. 11).
b. Federal Regulations and Enforcement of Hazardous Waste at Generation
Canada has no federal regulatory controls on hazardous waste generation, or requirements that waste generators receive approvals under federal legislation before commencing operations. Nor have any reporting requirements been established for hazardous waste generators at the federal level.
Some waste generation is reported through the National Pollutant Release Inventory (NPRI), established in 1992 under the Canadian Environmental Protection Act (CEPA). The NPRI initially required facilities to report their on-site releases (to air, water, land, and underground injection) and off-site transfers to treatment and disposal of 178 specific substances to the federal environment department (Environment Canada) annually. The manufacturing, processing or otherwise using of 10 tons or more of a substance in a given year triggered reporting. The first year for which pollutant release and transfer data was reported under the NPRI was 1993, and Environment Canada releases the reported date to the public each year.
With the exception of PCB storage facilities (Storage of PCB Materials Regulations SOR/92-508) there are no federal requirements regarding the development of emergency response plans for hazardous waste treatment and disposal facilities currently in place in Canada.
c. Provincial Regulations and Enforcement
Hazardous waste generators are generally not subject to regulation or approval requirements by provincial environment departments or ministries under provincial environmental protection legislation unless they are storing quantities of waste on-site for an extended period of time. However, activities that result in releases of wastes or contaminants to the environment, or the operation of on-site disposal facilities (e.g. incinerators or landfills) are typically subject to approval requirements under provincial legislation. Provincial agencies typically have wide discretion in the imposition of terms and conditions on such approvals (Swaigen. 1993, chapters 16-19). Most provinces established hazardous waste generator registration requirements linked to hazardous waste movement manifesting in the 1980s. However, this is usually a one-time only requirement, and there are no regular reporting requirements for waste generators.
The Generation and Management of Hazardous Wastes and Transboundary Hazardous Waste Shipments between Mexico, Canada and the United States, 1990-2000
89
There are no general requirements for emergency response plans by hazardous waste generators under provincial legislation. Fire safety plans may be required for facilities which use or store flammable materials in some provinces under fire safety legislation. In addition, conditions related to emergency prevention and response may be included in the approvals granted to waste generators or waste management facilities under provincial environmental legislation. However, the application of such requirements varies from province to province, and even from facility to facility (Winfield May 2000).
d. Hazardous waste tracking systems
The federal government’s principle role with respect to the management of hazardous waste is centred upon their interprovincial and international movement. The Export and Import of Hazardous Wastes Regulations, made under CEPA in 1992, require that approval be obtained from Environment Canada before a waste import or export can take place. In practice Environment Canada has relied upon the judgement of the jurisdiction (country in the case of exports or province or territory in the case of imports) as to the acceptability of the waste movement, and granted approvals on that basis. Under the regulations, a waste manifest describing the waste accompany the shipment at all times, the exporter/importer must carry insurance to cover any damages to third parties for which the exporter or importer is responsible, and to cover environmental damage due to spills leaks or other incidents during export or import. Canadian exporters must also accept the return of wastes that are refused by the importer. Primary responsibility for the enforcement of the regulations at the border lies with Canada Customs. Regulations banning the export of PCB wastes to any destination other than the United States were adopted in 1990. During the 1980’s all Canadian provinces implemented hazardous waste shipment manifesting systems to track movements of hazardous wastes under their environmental protection legislation. These typically establish requirements that manifests accompany waste movements at all times, and provide for monitoring and tracking systems to ensure that wastes are only accepted by facilities approved to receive them under provincial legislation. In some provinces the waste manifest data is made available to the public on an annual basis. The provincial manifesting systems are generally designed to link with the federal requirements under the CEPA transboundary waste movement regulations in the case of international waste movements in and out of the province.
e. Regulation of the Hazardous Waste Management Industry No federal approvals are required to operate hazardous waste disposal sites or systems in Canada. Federal regulations for controlling hazardous waste disposal only exist for federally owned PCBs (Federal Mobile PCB Treatment and Destruction Regulations, 1989 SOR 90-5). Hazardous waste management facilities are required to report substance releases and transfers above NPRI reporting thresholds through the NPRI program.
During the 1970’s and 1980’s all provinces established requirements for approvals under their environmental protection legislation for the construction and operation of hazardous waste
The Generation and Management of Hazardous Wastes and Transboundary Hazardous Waste Shipments between Mexico, Canada and the United States, 1990-2000
90
disposal sites or systems. These included transportation and transfer services. In some provinces such systems were subject to mandatory public hearings before they could be approved. In addition, in some provinces environmental assessments were required for proposed facilities, although the application of these requirements, and the contents, varied widely from province to province, and even within a given province. Environmental assessments could include an examination of wider issues related to such things as the need for facilities, and the availability of alternative waste disposal technologies, than are considered in the approval process under environmental protection statutes (Swaigen 1993, Chapter 9). Specific requirements related to the construction and operation of disposal sites, and waste handling and disposal practices were established on a case-by-case basis as terms and conditions of the approvals granted to individual facilities. As outlined in Figure 1, no universally applicable standards for facility operations or waste disposal, comparable to those established for hazardous waste disposal facilities under the US Resource Conservation and Recovery Act were established. f. Enforcement Activities/Indicators The federal government’s enforcement activities related to the CEPA hazardous waste regulations are reported through annual reports on the administration and enforcement of the Act tabled each year in Parliament. However, as the regulations only came into force in late 1992, enforcement data only exists for 1994 onwards. Data on provincial environmental law enforcement is limited. Certain provinces, including, Ontario, Quebec and British Columbia began to provide annual reports on prosecutions and convictions under their environmental protection legislation in the early 1990’s (Ontario Ministry of the Environment 1995). The enforcement of regulations related to hazardous handling and disposal were consistently identified as priority targets for environmental law enforcement efforts in Ontario and Quebec in the late 1980s and early 1990s.
2. Social organization a. Citizen’s groups
Potential host communities had traditionally opposed the establishment of new hazardous waste disposal capacity, particularly facilities that might receive out of province wastes. In fact, it became an increasingly accepted view in the late 1980’s and early 1990s it was impossible to site disposal facilities in the face of determined local opposition (Rabe 1994). This seemed particularly true in the context of the environmental assessment requirements for proposed facilities applicable in most provinces, and the availability of intervener funding to bona fide public interest interveners in such processes in key provinces, particularly Ontario.17 b. The Hazardous Waste Management Industry The hazardous waste disposal industry’s ability to influence public policy in this area was historically strong, but not overwhelming. The poor record of performance of private sector disposal facilities in the 1970’s, led a number of provinces, including Ontario, Alberta, and
17 See the Ontario Intervenor Funding Project Act, 1989..
The Generation and Management of Hazardous Wastes and Transboundary Hazardous Waste Shipments between Mexico, Canada and the United States, 1990-2000
91
Manitoba to establish Crown corporations for the purpose of constructing publicly owned and operated treatment and disposal infrastructure (Winfield 1992). At the same time, government policy at federal and provincial levels, as evidenced by the 1986 Canada-US Agreement on the Transboundary Movement of Hazardous waste, favored open borders to hazardous waste traffic. The rationale for this policy was to permit disposal at nearest available facility, regardless of which side of the border it was on, thereby reducing the risks of spills or accidents during transport (Winfield 1992).
3. Disposal Capacity Specialized commercial hazardous waste disposal facilities first began to be established in Canada in the late 1960’s. This capacity was limited to Ontario and Quebec, with major facilities including incinerator/landfill complexes operated by Laidlaw ltd. near Sarnia, Ontario and Mercier, Quebec, both of which received imported as well as domestically generated wastes. During the 1970’s the disposal of waste in municipal waste landfills was generally phased-out, and some older incineration facilities shut down. A commercial stabilization facility operated by Stablex Ltd. was established in Blainville, Quebec in 1983 (Stablex Canada 2000). This facility also received imported and domestic wastes. Concerns over the lack of disposal capacity, degree to which existing disposal capacity was controlled by one operator (Laidlaw Ltd) and lack of public confidence in private disposal facility operators lead the province of Ontario to establish a Crown Corporation, the Ontario Waste Management Corporation, (OWMC) for the purpose of constructing a comprehensive treatment and disposal facility in 1980. However, this facility was never constructed (Jackson 1983).
The only other major new facility to be established during this period was the Alberta Special Waste Management Corporation’s comprehensive treatment and disposal facility in Swan Hills, Alberta, opened in 1987 as a joint public/private sector venture. This facility was explicitly barred from receiving out of province wastes as one of the conditions related to willingness of the host community to accept the facility (Winfield 1992, Chapter VI). The Manitoba government in 1993 also established a smaller and less comprehensive physical/chemical treatment facility.18 4. Domestic Waste Generation and Disposal Very limited reliable data on hazardous waste generation and disposal in Canada is available prior to the mid-1980’s, when generator registration and comprehensive hazardous waste manifesting systems were introduced at the provincial level. Even these systems were limited in terms of the data which they generated on on-site disposal, as generator registration was only required on a one-time only rather than annual or biennial basis. The Canadian Hazardous Waste Inventory, completed by Environment Canada in 1995 on the basis of 1991 data, estimated total waste hazardous generation in Ontario to be in the region of 1.5 million tons per year. Estimates for total waste generation in Ontario developed by the Ontario Waste Management
18 Operated by the Manitoba Hazardous Waste Management Corporation in Montcalm, Manitoba. The corporation’s business was taken over by the Toronto based Miller Environmental Corporation in 1996.
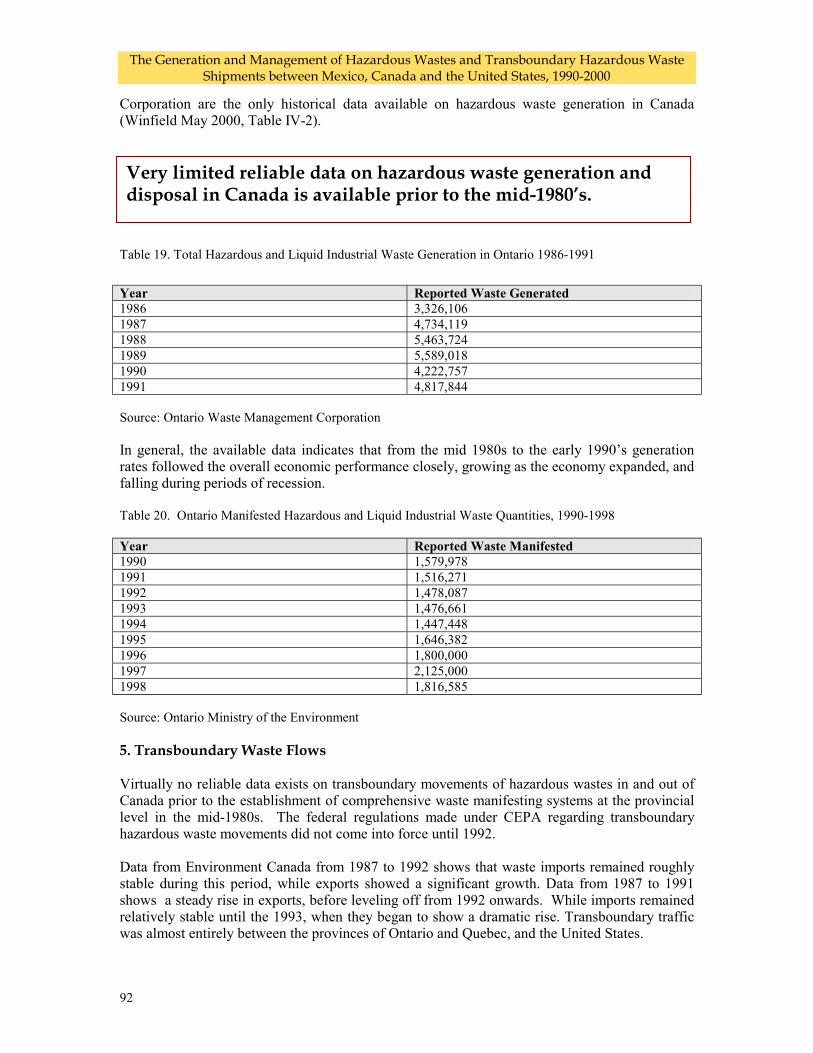
The Generation and Management of Hazardous Wastes and Transboundary Hazardous Waste Shipments between Mexico, Canada and the United States, 1990-2000
92
Corporation are the only historical data available on hazardous waste generation in Canada (Winfield May 2000, Table IV-2).
Table 19. Total Hazardous and Liquid Industrial Waste Generation in Ontario 1986-1991
Year Reported Waste Generated 1986 3,326,106 1987 4,734,119 1988 5,463,724 1989 5,589,018 1990 4,222,757 1991 4,817,844 Source: Ontario Waste Management Corporation In general, the available data indicates that from the mid 1980s to the early 1990’s generation rates followed the overall economic performance closely, growing as the economy expanded, and falling during periods of recession. Table 20. Ontario Manifested Hazardous and Liquid Industrial Waste Quantities, 1990-1998 Year Reported Waste Manifested 1990 1,579,978 1991 1,516,271 1992 1,478,087 1993 1,476,661 1994 1,447,448 1995 1,646,382 1996 1,800,000 1997 2,125,000 1998 1,816,585 Source: Ontario Ministry of the Environment 5. Transboundary Waste Flows Virtually no reliable data exists on transboundary movements of hazardous wastes in and out of Canada prior to the establishment of comprehensive waste manifesting systems at the provincial level in the mid-1980s. The federal regulations made under CEPA regarding transboundary hazardous waste movements did not come into force until 1992.
Data from Environment Canada from 1987 to 1992 shows that waste imports remained roughly stable during this period, while exports showed a significant growth. Data from 1987 to 1991 shows a steady rise in exports, before leveling off from 1992 onwards. While imports remained relatively stable until the 1993, when they began to show a dramatic rise. Transboundary traffic was almost entirely between the provinces of Ontario and Quebec, and the United States.
Very limited reliable data on hazardous waste generation and disposal in Canada is available prior to the mid-1980’s.
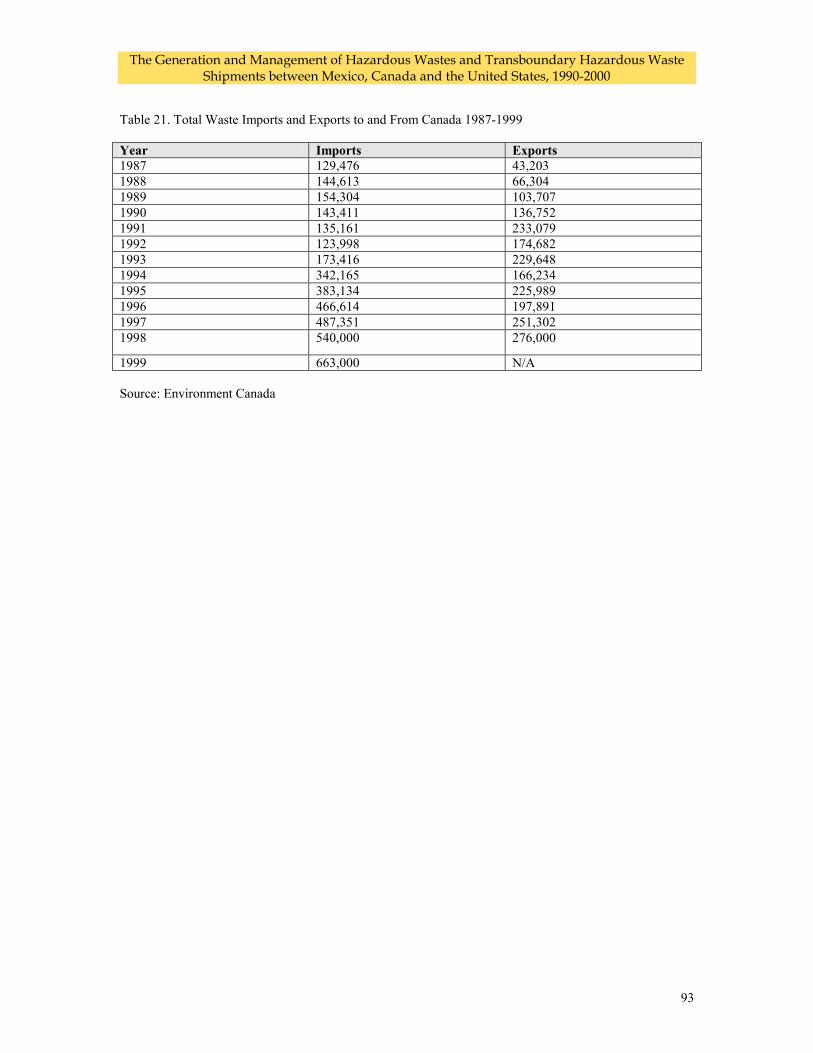
The Generation and Management of Hazardous Wastes and Transboundary Hazardous Waste Shipments between Mexico, Canada and the United States, 1990-2000
93
Table 21. Total Waste Imports and Exports to and From Canada 1987-1999
Year Imports Exports 1987 129,476 43,203 1988 144,613 66,304 1989 154,304 103,707 1990 143,411 136,752 1991 135,161 233,079 1992 123,998 174,682 1993 173,416 229,648 1994 342,165 166,234 1995 383,134 225,989 1996 466,614 197,891 1997 487,351 251,302 1998 540,000 276,000
1999 663,000 N/A Source: Environment Canada
The Generation and Management of Hazardous Wastes and Transboundary Hazardous Waste Shipments between Mexico, Canada and the United States, 1990-2000
94
Appendix B. Mexico and Chapter 11 of NAFTA: Hazardous Wastes and the NAFTA Arbitration Panels
(Compiled by Marisa Jacott, La Neta: Proyecto Emisiones and translated and updated into English by Cyrus Reed, Texas Center for Policy Studies) I. Introduction
Citizen groups and environmental organizations are increasingly worried and aware that commercial interests outweigh environmental and public health protection through the globalization process in general and in particular through the North American Free Trade Agreement. These concerns are based upon the existence and binding judicial power of commercial arbitration panels set up through Article 1115 of Chapter 11 of NAFTA, as is the case of the International Centre for Settlement of Investment Disputes-ICSID, an arm of the World Bank. In contrast, the Article 14 and 15 process established by the North American Agreement for Environmental Cooperation (NAAEC), more commonly known as the NAFTA environmental side agreement, only has the ability to conduct a fact-finding, non-binding report through the Commission on Environmental Cooperation. Currently, in Mexico, four different cases related to management of hazardous and non-hazardous wastes have been introduced through the ISCID process, while three cases related to failure to enforce hazardous waste regulations have been brought through Article 14 and 15.
II. Commercial NAFTA Connection: International Centre for Settlement of Investment Disputes (ICSID) The role of the ICSID is linked to Chapter 11 of NAFTA (Investment, Services and Related Matters), which allows foreign investors to bring a complaint before a commercial arbitration panel. Chapter 11, Article 1115 states: “Without prejudice to the rights and obligations of the Parties under Chapter Twenty (Institutional Arrangements of t he Dispute Settlement Procedures), this Section establishes a mechanism for the settlement of investment disputes that assures both equal treatment among investors of the Parties in accordance with the principle of international reciprocity and due process before an impartial tribunal.” The International Centre for Settlement of Investment Disputes was created in 1966 as a decentralized arm of the World Bank to help promote foreign investment. The Centre offers arbitration and dispute resolution services to resolve disagreements between governments, national and foreign investors (see box in text).
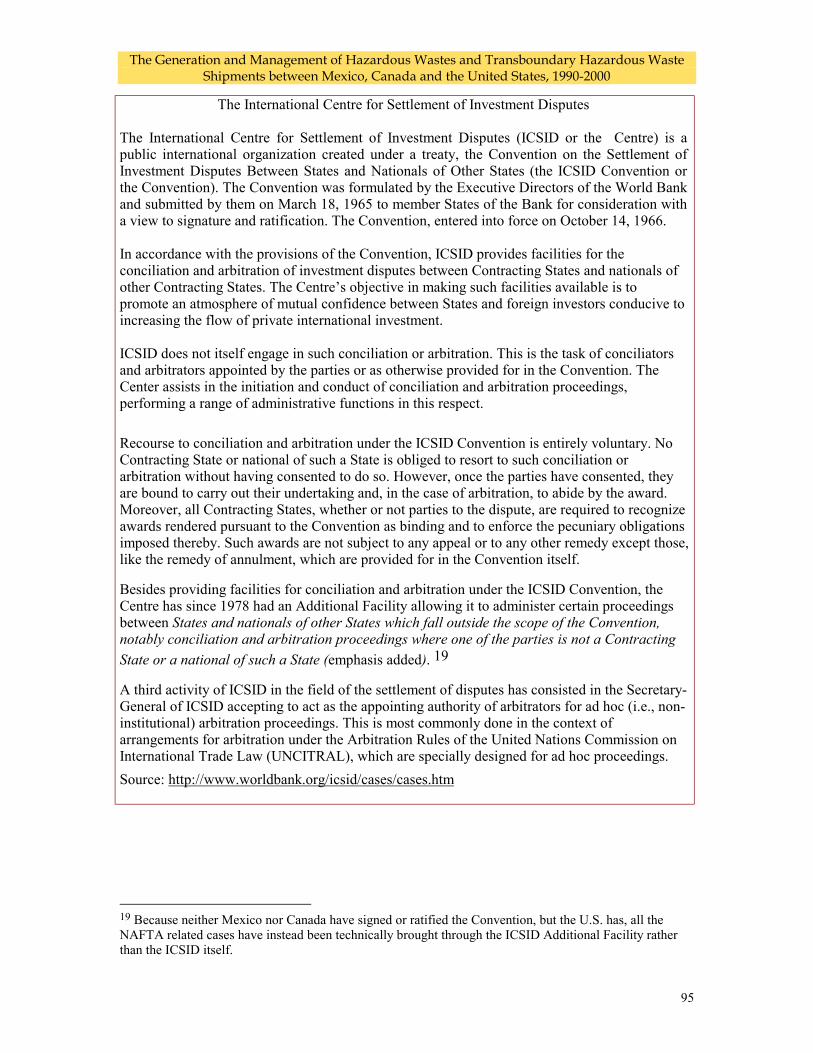
The Generation and Management of Hazardous Wastes and Transboundary Hazardous Waste Shipments between Mexico, Canada and the United States, 1990-2000
95
19 Because neither Mexico nor Canada have signed or ratified the Convention, but the U.S. has, all the NAFTA related cases have instead been technically brought through the ICSID Additional Facility rather than the ICSID itself.
The International Centre for Settlement of Investment Disputes
The International Centre for Settlement of Investment Disputes (ICSID or the Centre) is a public international organization created under a treaty, the Convention on the Settlement of Investment Disputes Between States and Nationals of Other States (the ICSID Convention or the Convention). The Convention was formulated by the Executive Directors of the World Bank and submitted by them on March 18, 1965 to member States of the Bank for consideration with a view to signature and ratification. The Convention, entered into force on October 14, 1966. In accordance with the provisions of the Convention, ICSID provides facilities for the conciliation and arbitration of investment disputes between Contracting States and nationals of other Contracting States. The Centre’s objective in making such facilities available is to promote an atmosphere of mutual confidence between States and foreign investors conducive to increasing the flow of private international investment. ICSID does not itself engage in such conciliation or arbitration. This is the task of conciliators and arbitrators appointed by the parties or as otherwise provided for in the Convention. The Center assists in the initiation and conduct of conciliation and arbitration proceedings, performing a range of administrative functions in this respect. Recourse to conciliation and arbitration under the ICSID Convention is entirely voluntary. No Contracting State or national of such a State is obliged to resort to such conciliation or arbitration without having consented to do so. However, once the parties have consented, they are bound to carry out their undertaking and, in the case of arbitration, to abide by the award. Moreover, all Contracting States, whether or not parties to the dispute, are required to recognize awards rendered pursuant to the Convention as binding and to enforce the pecuniary obligations imposed thereby. Such awards are not subject to any appeal or to any other remedy except those, like the remedy of annulment, which are provided for in the Convention itself.
Besides providing facilities for conciliation and arbitration under the ICSID Convention, the Centre has since 1978 had an Additional Facility allowing it to administer certain proceedings between States and nationals of other States which fall outside the scope of the Convention, notably conciliation and arbitration proceedings where one of the parties is not a Contracting State or a national of such a State (emphasis added). 19
A third activity of ICSID in the field of the settlement of disputes has consisted in the Secretary-General of ICSID accepting to act as the appointing authority of arbitrators for ad hoc (i.e., non-institutional) arbitration proceedings. This is most commonly done in the context of arrangements for arbitration under the Arbitration Rules of the United Nations Commission on International Trade Law (UNCITRAL), which are specially designed for ad hoc proceedings. Source: http://www.worldbank.org/icsid/cases/cases.htm
The Generation and Management of Hazardous Wastes and Transboundary Hazardous Waste Shipments between Mexico, Canada and the United States, 1990-2000
96
There is growing evidence of the power of these financial and international commercial entities. The most fundamental tasks given to the ICSID include:
• A procedure to arbitrate and another procedure to conciliate disagreements between
national and foreign investors related to investment. • Article 2 of the Convention establishes the International Bank for Reconstruction and
Development as the headquarters of the ICSID.
• Article 5 mentions that the Bank President is an ex-oficio President of the Administrative Council, although without voting privileges.
• Article 20 establishes that: “The Centre, its property and assets shall enjoy immunity
from all legal process, except when the Centre waives this immunity.”
Of particular importance of Convention rules related to arbitration procedures is Article 45, which states:
(1) Failure of a party to appear or to present his case shall not be deemed an admission of the other party's assertions.
(2) If a party fails to appear or to present his case at any stage of the proceedings the other party may request the Tribunal to deal with the questions submitted to it and to render an award. Before rendering an award, the Tribunal shall notify, and grant a period of grace to, the party failing to appear or to present its case, unless it is satisfied that that party does not intend to do so.
In addition, Article 48 (The Award) states:
(1) The Tribunal shall decide questions by a majority of the votes of all its members.
(2) The award of the Tribunal shall be in writing and shall be signed by the members of the Tribunal who voted for it.
(3) The award shall deal with every question submitted to the Tribunal, and shall state the reasons upon which it is based.
(4) Any member of the Tribunal may attach his individual opinion to the award, whether he dissents from the majority or not, or a statement of his dissent.
(5) The Centre shall not publish the award without the consent of the parties. 20 While neither Canada nor Mexico have signed and ratified the Convention, because the U.S. has and because NAFTA specifically establishes the Centre as one of the mechanisms to resolve or arbitrate disputes, NAFTA disputes currently have been pursued through the ICSID Additional Facility. The rules established under this procedure are remarkably similar to the ICSID process itself, stating for example in Article 54 of the ICSID Additional Facility Rules that: “(4) The award shall be final and binding on the parties. The parties waive any time limits for the 20 http://www.worldbank.org/icsid/basicdoc/
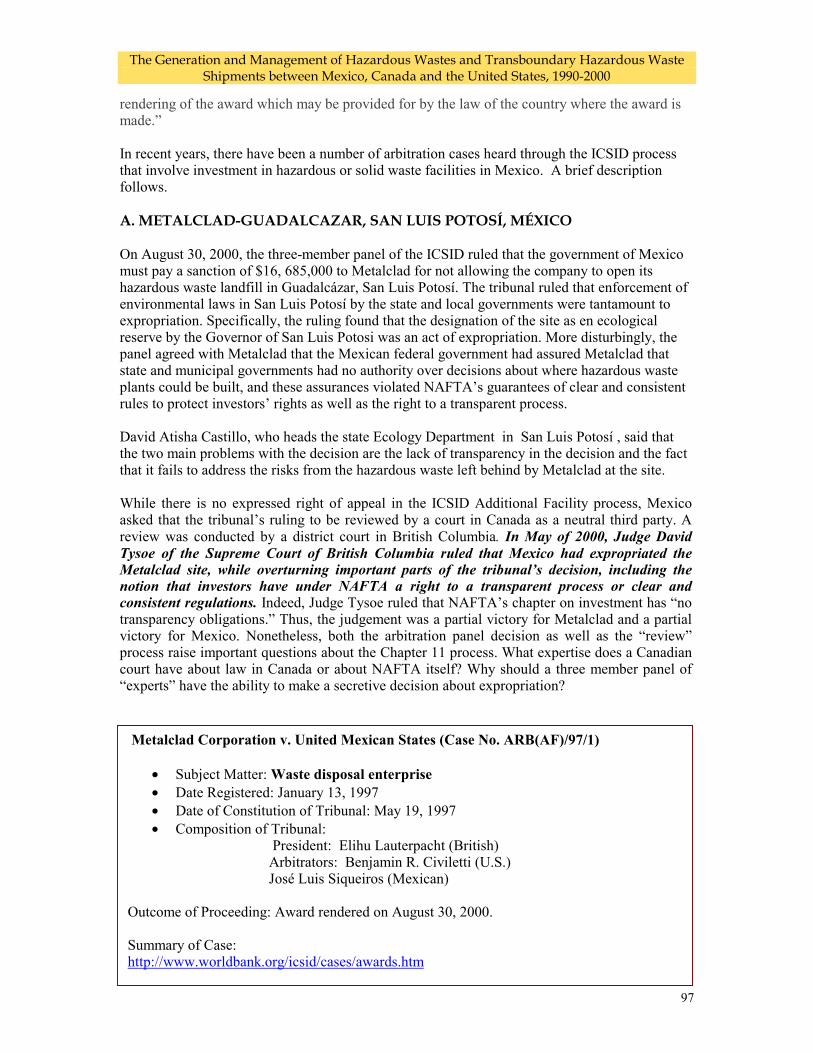
The Generation and Management of Hazardous Wastes and Transboundary Hazardous Waste Shipments between Mexico, Canada and the United States, 1990-2000
97
rendering of the award which may be provided for by the law of the country where the award is made.” In recent years, there have been a number of arbitration cases heard through the ICSID process that involve investment in hazardous or solid waste facilities in Mexico. A brief description follows. A. METALCLAD-GUADALCAZAR, SAN LUIS POTOSÍ, MÉXICO On August 30, 2000, the three-member panel of the ICSID ruled that the government of Mexico must pay a sanction of $16, 685,000 to Metalclad for not allowing the company to open its hazardous waste landfill in Guadalcázar, San Luis Potosí. The tribunal ruled that enforcement of environmental laws in San Luis Potosí by the state and local governments were tantamount to expropriation. Specifically, the ruling found that the designation of the site as en ecological reserve by the Governor of San Luis Potosi was an act of expropriation. More disturbingly, the panel agreed with Metalclad that the Mexican federal government had assured Metalclad that state and municipal governments had no authority over decisions about where hazardous waste plants could be built, and these assurances violated NAFTA’s guarantees of clear and consistent rules to protect investors’ rights as well as the right to a transparent process. David Atisha Castillo, who heads the state Ecology Department in San Luis Potosí , said that the two main problems with the decision are the lack of transparency in the decision and the fact that it fails to address the risks from the hazardous waste left behind by Metalclad at the site. While there is no expressed right of appeal in the ICSID Additional Facility process, Mexico asked that the tribunal’s ruling to be reviewed by a court in Canada as a neutral third party. A review was conducted by a district court in British Columbia. In May of 2000, Judge David Tysoe of the Supreme Court of British Columbia ruled that Mexico had expropriated the Metalclad site, while overturning important parts of the tribunal’s decision, including the notion that investors have under NAFTA a right to a transparent process or clear and consistent regulations. Indeed, Judge Tysoe ruled that NAFTA’s chapter on investment has “no transparency obligations.” Thus, the judgement was a partial victory for Metalclad and a partial victory for Mexico. Nonetheless, both the arbitration panel decision as well as the “review” process raise important questions about the Chapter 11 process. What expertise does a Canadian court have about law in Canada or about NAFTA itself? Why should a three member panel of “experts” have the ability to make a secretive decision about expropriation?
Metalclad Corporation v. United Mexican States (Case No. ARB(AF)/97/1)
• Subject Matter: Waste disposal enterprise • Date Registered: January 13, 1997 • Date of Constitution of Tribunal: May 19, 1997 • Composition of Tribunal:
President: Elihu Lauterpacht (British) Arbitrators: Benjamin R. Civiletti (U.S.) José Luis Siqueiros (Mexican)
Outcome of Proceeding: Award rendered on August 30, 2000. Summary of Case: http://www.worldbank.org/icsid/cases/awards.htm
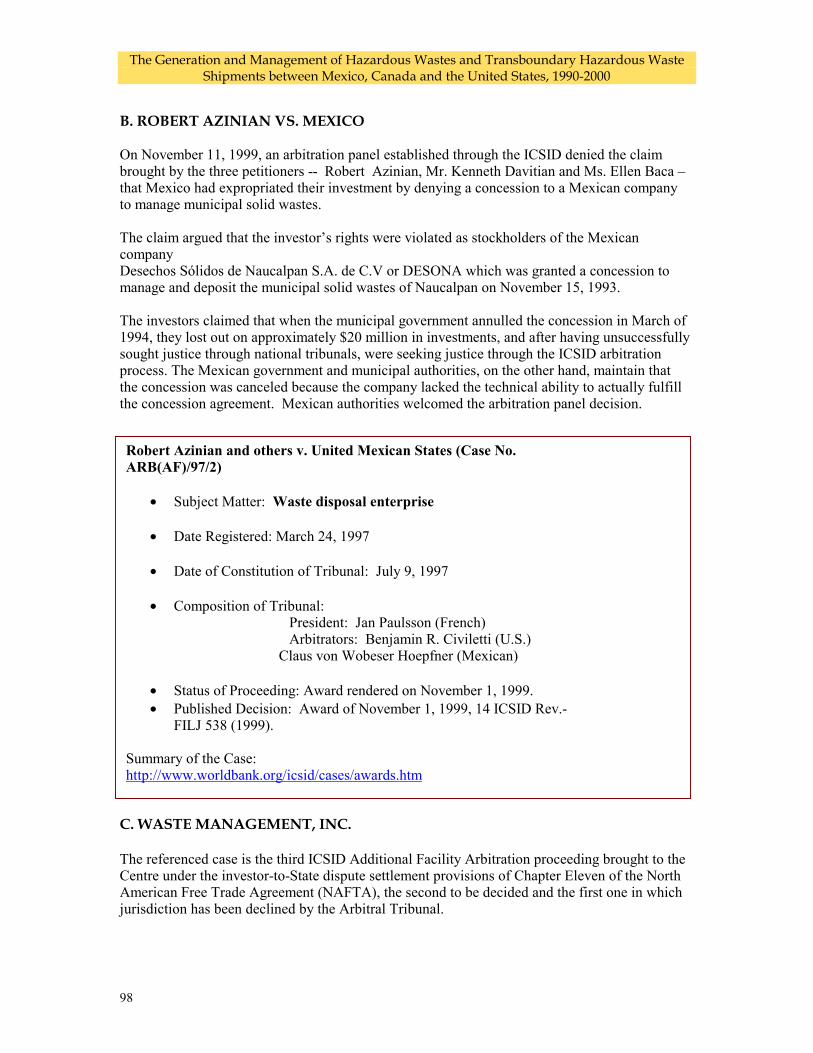
The Generation and Management of Hazardous Wastes and Transboundary Hazardous Waste Shipments between Mexico, Canada and the United States, 1990-2000
98
B. ROBERT AZINIAN VS. MEXICO On November 11, 1999, an arbitration panel established through the ICSID denied the claim brought by the three petitioners -- Robert Azinian, Mr. Kenneth Davitian and Ms. Ellen Baca – that Mexico had expropriated their investment by denying a concession to a Mexican company to manage municipal solid wastes. The claim argued that the investor’s rights were violated as stockholders of the Mexican company Desechos Sólidos de Naucalpan S.A. de C.V or DESONA which was granted a concession to manage and deposit the municipal solid wastes of Naucalpan on November 15, 1993. The investors claimed that when the municipal government annulled the concession in March of 1994, they lost out on approximately $20 million in investments, and after having unsuccessfully sought justice through national tribunals, were seeking justice through the ICSID arbitration process. The Mexican government and municipal authorities, on the other hand, maintain that the concession was canceled because the company lacked the technical ability to actually fulfill the concession agreement. Mexican authorities welcomed the arbitration panel decision.
C. WASTE MANAGEMENT, INC. The referenced case is the third ICSID Additional Facility Arbitration proceeding brought to the Centre under the investor-to-State dispute settlement provisions of Chapter Eleven of the North American Free Trade Agreement (NAFTA), the second to be decided and the first one in which jurisdiction has been declined by the Arbitral Tribunal.
Robert Azinian and others v. United Mexican States (Case No. ARB(AF)/97/2)
• Subject Matter: Waste disposal enterprise
• Date Registered: March 24, 1997
• Date of Constitution of Tribunal: July 9, 1997
• Composition of Tribunal: President: Jan Paulsson (French) Arbitrators: Benjamin R. Civiletti (U.S.)
Claus von Wobeser Hoepfner (Mexican)
• Status of Proceeding: Award rendered on November 1, 1999. • Published Decision: Award of November 1, 1999, 14 ICSID Rev.-
FILJ 538 (1999). Summary of the Case: http://www.worldbank.org/icsid/cases/awards.htm
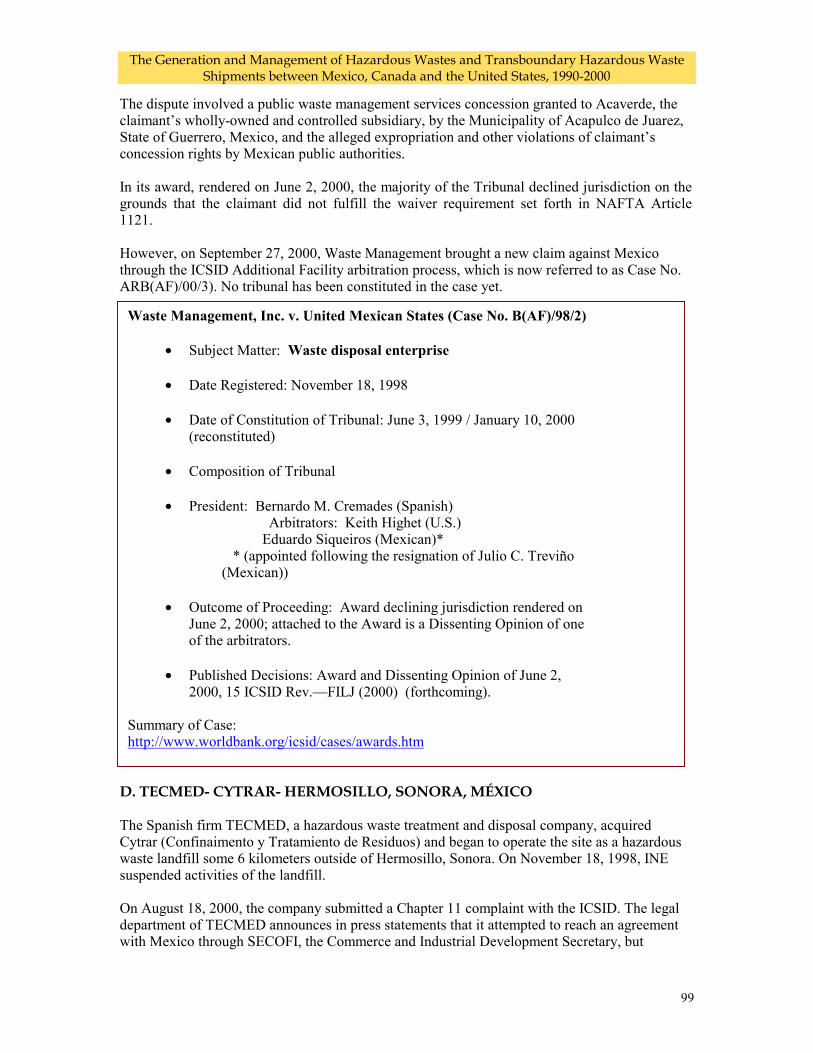
The Generation and Management of Hazardous Wastes and Transboundary Hazardous Waste Shipments between Mexico, Canada and the United States, 1990-2000
99
The dispute involved a public waste management services concession granted to Acaverde, the claimant’s wholly-owned and controlled subsidiary, by the Municipality of Acapulco de Juarez, State of Guerrero, Mexico, and the alleged expropriation and other violations of claimant’s concession rights by Mexican public authorities. In its award, rendered on June 2, 2000, the majority of the Tribunal declined jurisdiction on the grounds that the claimant did not fulfill the waiver requirement set forth in NAFTA Article 1121. However, on September 27, 2000, Waste Management brought a new claim against Mexico through the ICSID Additional Facility arbitration process, which is now referred to as Case No. ARB(AF)/00/3). No tribunal has been constituted in the case yet.
D. TECMED- CYTRAR- HERMOSILLO, SONORA, MÉXICO The Spanish firm TECMED, a hazardous waste treatment and disposal company, acquired Cytrar (Confinaimento y Tratamiento de Residuos) and began to operate the site as a hazardous waste landfill some 6 kilometers outside of Hermosillo, Sonora. On November 18, 1998, INE suspended activities of the landfill. On August 18, 2000, the company submitted a Chapter 11 complaint with the ICSID. The legal department of TECMED announces in press statements that it attempted to reach an agreement with Mexico through SECOFI, the Commerce and Industrial Development Secretary, but
Waste Management, Inc. v. United Mexican States (Case No. B(AF)/98/2)
• Subject Matter: Waste disposal enterprise
• Date Registered: November 18, 1998
• Date of Constitution of Tribunal: June 3, 1999 / January 10, 2000 (reconstituted)
• Composition of Tribunal
• President: Bernardo M. Cremades (Spanish)
Arbitrators: Keith Highet (U.S.) Eduardo Siqueiros (Mexican)* * (appointed following the resignation of Julio C. Treviño (Mexican))
• Outcome of Proceeding: Award declining jurisdiction rendered on
June 2, 2000; attached to the Award is a Dissenting Opinion of one of the arbitrators.
• Published Decisions: Award and Dissenting Opinion of June 2,
2000, 15 ICSID Rev.—FILJ (2000) (forthcoming). Summary of Case: http://www.worldbank.org/icsid/cases/awards.htm
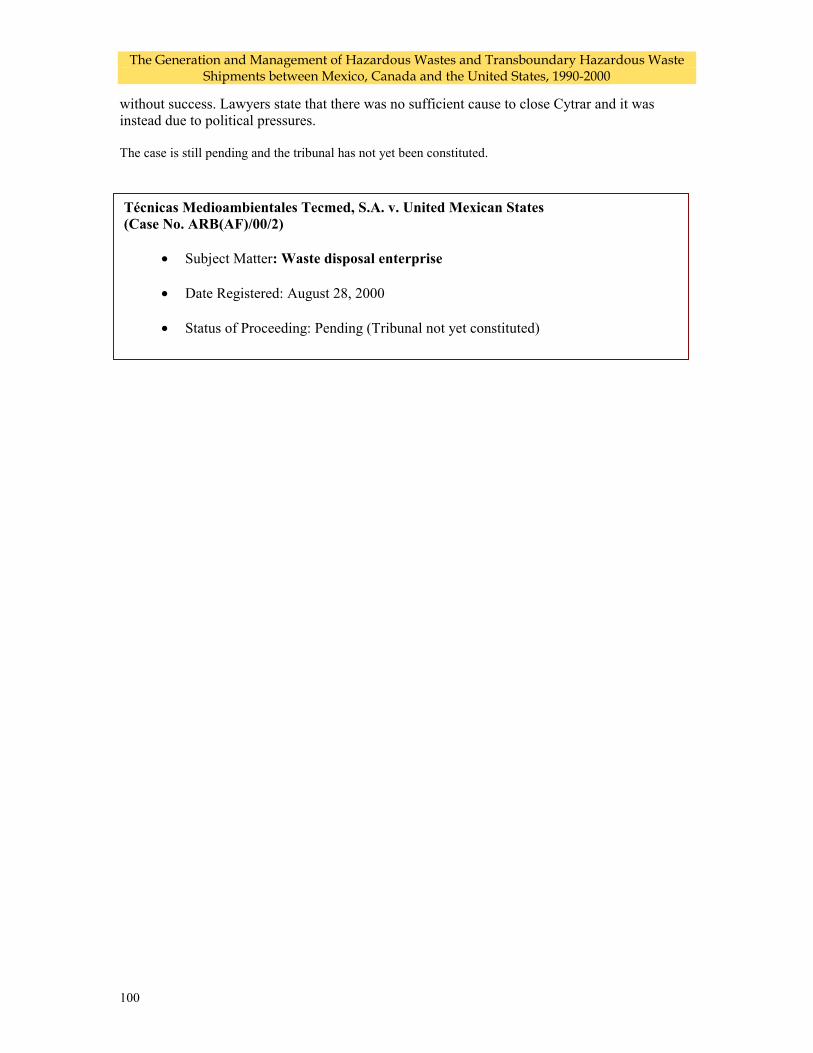
The Generation and Management of Hazardous Wastes and Transboundary Hazardous Waste Shipments between Mexico, Canada and the United States, 1990-2000
100
without success. Lawyers state that there was no sufficient cause to close Cytrar and it was instead due to political pressures. The case is still pending and the tribunal has not yet been constituted.
Técnicas Medioambientales Tecmed, S.A. v. United Mexican States (Case No. ARB(AF)/00/2)
• Subject Matter: Waste disposal enterprise
• Date Registered: August 28, 2000
• Status of Proceeding: Pending (Tribunal not yet constituted)
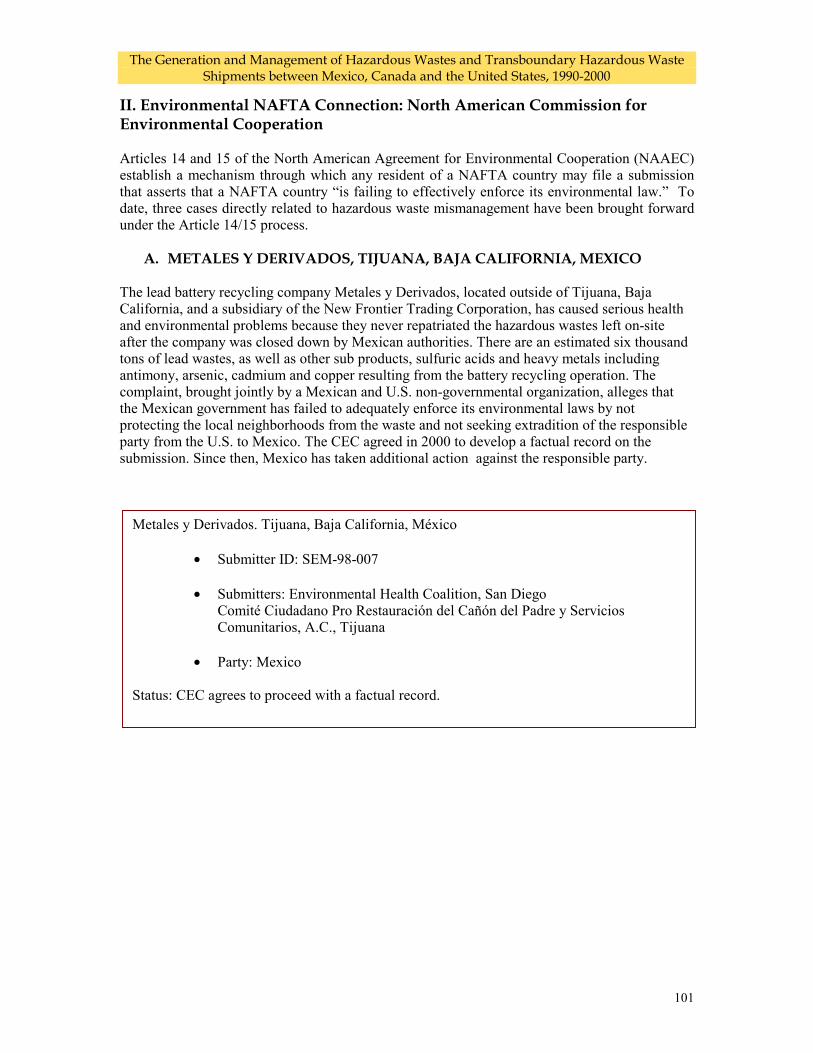
The Generation and Management of Hazardous Wastes and Transboundary Hazardous Waste Shipments between Mexico, Canada and the United States, 1990-2000
101
II. Environmental NAFTA Connection: North American Commission for Environmental Cooperation
Articles 14 and 15 of the North American Agreement for Environmental Cooperation (NAAEC) establish a mechanism through which any resident of a NAFTA country may file a submission that asserts that a NAFTA country “is failing to effectively enforce its environmental law.” To date, three cases directly related to hazardous waste mismanagement have been brought forward under the Article 14/15 process.
A. METALES Y DERIVADOS, TIJUANA, BAJA CALIFORNIA, MEXICO
The lead battery recycling company Metales y Derivados, located outside of Tijuana, Baja California, and a subsidiary of the New Frontier Trading Corporation, has caused serious health and environmental problems because they never repatriated the hazardous wastes left on-site after the company was closed down by Mexican authorities. There are an estimated six thousand tons of lead wastes, as well as other sub products, sulfuric acids and heavy metals including antimony, arsenic, cadmium and copper resulting from the battery recycling operation. The complaint, brought jointly by a Mexican and U.S. non-governmental organization, alleges that the Mexican government has failed to adequately enforce its environmental laws by not protecting the local neighborhoods from the waste and not seeking extradition of the responsible party from the U.S. to Mexico. The CEC agreed in 2000 to develop a factual record on the submission. Since then, Mexico has taken additional action against the responsible party.
Metales y Derivados. Tijuana, Baja California, México
• Submitter ID: SEM-98-007 • Submitters: Environmental Health Coalition, San Diego
Comité Ciudadano Pro Restauración del Cañón del Padre y Servicios Comunitarios, A.C., Tijuana
• Party: Mexico
Status: CEC agrees to proceed with a factual record.
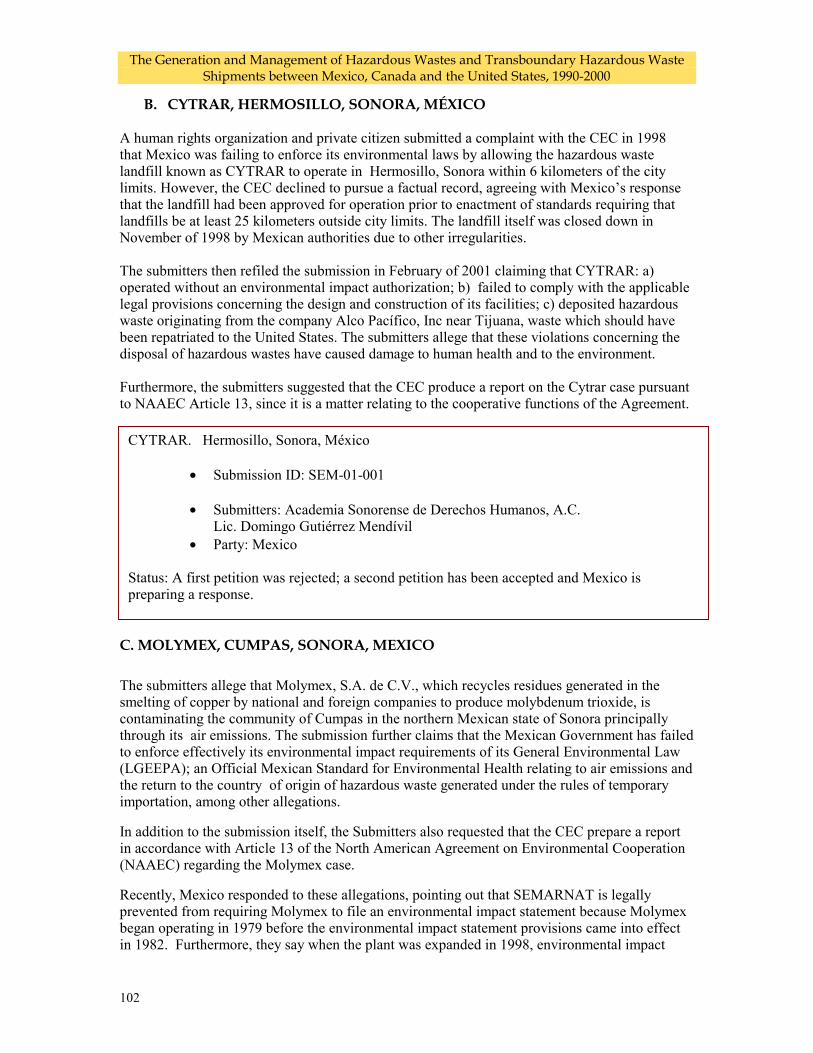
The Generation and Management of Hazardous Wastes and Transboundary Hazardous Waste Shipments between Mexico, Canada and the United States, 1990-2000
102
B. CYTRAR, HERMOSILLO, SONORA, MÉXICO A human rights organization and private citizen submitted a complaint with the CEC in 1998 that Mexico was failing to enforce its environmental laws by allowing the hazardous waste landfill known as CYTRAR to operate in Hermosillo, Sonora within 6 kilometers of the city limits. However, the CEC declined to pursue a factual record, agreeing with Mexico’s response that the landfill had been approved for operation prior to enactment of standards requiring that landfills be at least 25 kilometers outside city limits. The landfill itself was closed down in November of 1998 by Mexican authorities due to other irregularities. The submitters then refiled the submission in February of 2001 claiming that CYTRAR: a) operated without an environmental impact authorization; b) failed to comply with the applicable legal provisions concerning the design and construction of its facilities; c) deposited hazardous waste originating from the company Alco Pacífico, Inc near Tijuana, waste which should have been repatriated to the United States. The submitters allege that these violations concerning the disposal of hazardous wastes have caused damage to human health and to the environment. Furthermore, the submitters suggested that the CEC produce a report on the Cytrar case pursuant to NAAEC Article 13, since it is a matter relating to the cooperative functions of the Agreement.
C. MOLYMEX, CUMPAS, SONORA, MEXICO
The submitters allege that Molymex, S.A. de C.V., which recycles residues generated in the smelting of copper by national and foreign companies to produce molybdenum trioxide, is contaminating the community of Cumpas in the northern Mexican state of Sonora principally through its air emissions. The submission further claims that the Mexican Government has failed to enforce effectively its environmental impact requirements of its General Environmental Law (LGEEPA); an Official Mexican Standard for Environmental Health relating to air emissions and the return to the country of origin of hazardous waste generated under the rules of temporary importation, among other allegations.
In addition to the submission itself, the Submitters also requested that the CEC prepare a report in accordance with Article 13 of the North American Agreement on Environmental Cooperation (NAAEC) regarding the Molymex case.
Recently, Mexico responded to these allegations, pointing out that SEMARNAT is legally prevented from requiring Molymex to file an environmental impact statement because Molymex began operating in 1979 before the environmental impact statement provisions came into effect in 1982. Furthermore, they say when the plant was expanded in 1998, environmental impact
CYTRAR. Hermosillo, Sonora, México
• Submission ID: SEM-01-001 • Submitters: Academia Sonorense de Derechos Humanos, A.C.
Lic. Domingo Gutiérrez Mendívil • Party: Mexico
Status: A first petition was rejected; a second petition has been accepted and Mexico is preparing a response.
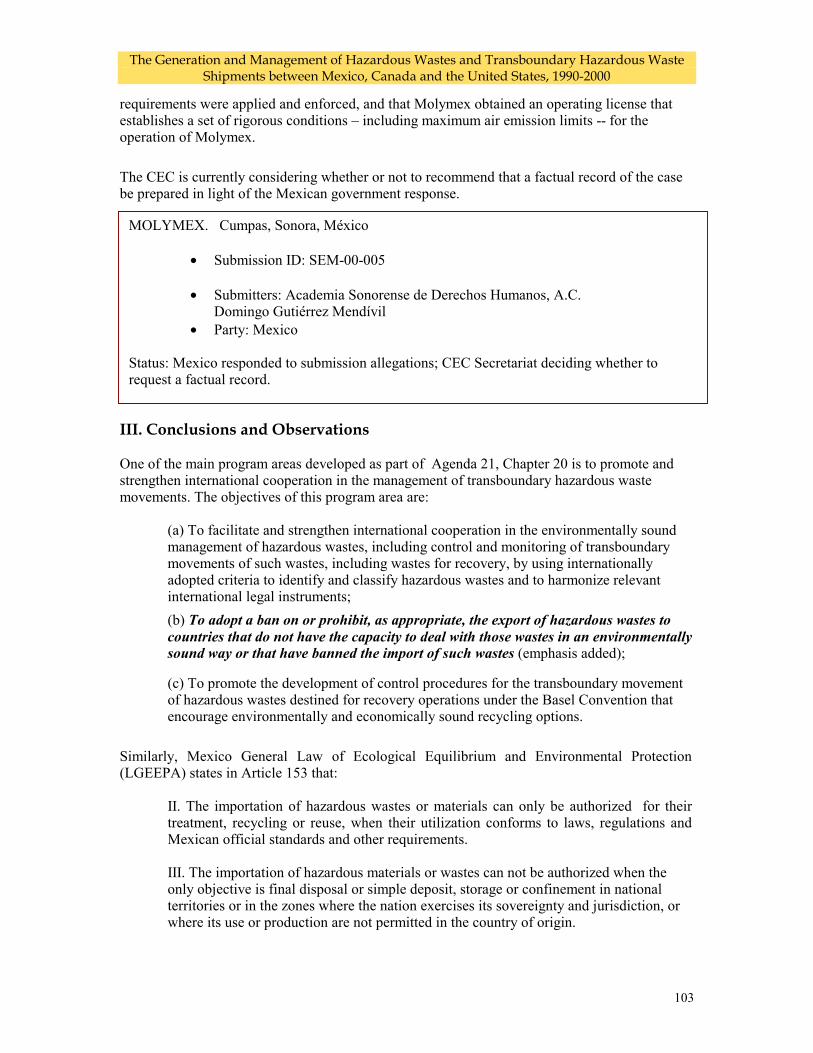
The Generation and Management of Hazardous Wastes and Transboundary Hazardous Waste Shipments between Mexico, Canada and the United States, 1990-2000
103
requirements were applied and enforced, and that Molymex obtained an operating license that establishes a set of rigorous conditions – including maximum air emission limits -- for the operation of Molymex. The CEC is currently considering whether or not to recommend that a factual record of the case be prepared in light of the Mexican government response.
III. Conclusions and Observations
One of the main program areas developed as part of Agenda 21, Chapter 20 is to promote and strengthen international cooperation in the management of transboundary hazardous waste movements. The objectives of this program area are:
(a) To facilitate and strengthen international cooperation in the environmentally sound management of hazardous wastes, including control and monitoring of transboundary movements of such wastes, including wastes for recovery, by using internationally adopted criteria to identify and classify hazardous wastes and to harmonize relevant international legal instruments; (b) To adopt a ban on or prohibit, as appropriate, the export of hazardous wastes to countries that do not have the capacity to deal with those wastes in an environmentally sound way or that have banned the import of such wastes (emphasis added);
(c) To promote the development of control procedures for the transboundary movement of hazardous wastes destined for recovery operations under the Basel Convention that encourage environmentally and economically sound recycling options.
Similarly, Mexico General Law of Ecological Equilibrium and Environmental Protection (LGEEPA) states in Article 153 that:
II. The importation of hazardous wastes or materials can only be authorized for their treatment, recycling or reuse, when their utilization conforms to laws, regulations and Mexican official standards and other requirements. III. The importation of hazardous materials or wastes can not be authorized when the only objective is final disposal or simple deposit, storage or confinement in national territories or in the zones where the nation exercises its sovereignty and jurisdiction, or where its use or production are not permitted in the country of origin.
MOLYMEX. Cumpas, Sonora, México
• Submission ID: SEM-00-005 • Submitters: Academia Sonorense de Derechos Humanos, A.C.
Domingo Gutiérrez Mendívil • Party: Mexico
Status: Mexico responded to submission allegations; CEC Secretariat deciding whether to request a factual record.
The Generation and Management of Hazardous Wastes and Transboundary Hazardous Waste Shipments between Mexico, Canada and the United States, 1990-2000
104
VI. Hazardous wastes and materials generated in the production, transformation, elaboration or repair of raw materials introduced into the country through temporary importation, including those established in article 85 of the Customs Law, should be returned to the country of origin within the time frame established by the Secretariat.21
Tribunals such as those established through the International Centre for Settlement of Investment Disputes-ICSID are an example of how NAFTA – through Chapter 11 – provides supremacy to commercial and economic interests over environmental protection. These types of international tribunals are imposing international laws or treaties over and above national laws, regulations and enforcement procedures. More immediately, they could have a chilling effect on efforts to strengthen environmental laws or enforce existing ones. While – as this appendix reports – some of the arbitration panels have ruled in favor of the national governments and their enforcement of national environmental laws, there have also been those –such as the Metalclad case – which have supported the investors’ claims. We believe that the arguments behind the investor protection clauses of Chapter 11, many of which are based upon article 1102 –National Treatment – are imprudent in terms of the environment and public health. If equity existed within NAFTA between commercial interests and environmental protection, it would be rapidly recognized the impossibility of opening up the Mexican market to importation of hazardous wastes and hazardous waste landfills, due to the lack of proper standards, adequate infrastructure to import wastes and proper environmental impact requirements. And perhaps more importantly, due to a lack of adequate environmental enforcement of applicable laws. To achieve this equity, mechanisms that exist through international agencies such as the CEC to promote a safe environment and proper enforcement or environmental laws must have judicial force. Observations:
1. The Metalclad case clearly reaffirms the supremacy of commercial interests over
environmental protection. NAFTA’s Chapter 11 is the vehicle. Environmental, public health and social issues pale in comparison to the operations of a commercial interest.
2. It is of utmost concern when a country cannot protect its environment, as well as the
enforcement of its federal, state and local laws. The right of local governments to exercise their functions in the face of any international agreement should not be characterized as “discriminatory” treatment.
3. We most resolve immediately the legislative gaps in Mexico’s environmental laws so
that no loopholes remain which could be used to damage our environment. The authorities themselves recognize that there are not always clear rules developed to protect our environment.
21 http://www.ine.gob.mx/uaj/lgeepa/articulo153.html. Translation by Cyrus Reed, Texas Center for Policy Studies.
The Generation and Management of Hazardous Wastes and Transboundary Hazardous Waste Shipments between Mexico, Canada and the United States, 1990-2000
105
4. The double standard applied by foreign companies in Mexico is an unfortunate practice that severely affects Mexico’s environment, undermining the promotion of environmental justice. In Mexico, foreign companies, principally North American, enjoy weaker standards and spotty compliance and enforcement with environmental laws. The emission limits and hazardous waste requirements are mush more rigorous in their own country than they are in Mexico.
5. The Commission on Environmental Cooperation should have the power to initiate and
make judicial decisions. We lament the impossibility of action of the CEC and its enabling legislation – the North American Agreement for Environmental Cooperation (NAAEC) -- when faced with NAFTA. We demand the revision of NAFTA and the strengthening of NAAEC.
6. It worries us that the environmental arbitrations -- if that’s what you can call the Article
14 and 15 processes – do not have the same weight as commercial arbitrations.
7. Cases such as those brought by Metalclad to the ICSID provide precedence for future claims. The claim submitted by the Spanish firm Técnicas Medio Ambientales de México (TECMED), owners of the hazardous waste landfill CYTRAR outside of Hermosillo, Sonora, is a recent example. We know this case, as well as the Metalclad case, infringes upon Mexico’s sovereignty to enact and enforce environmental legislation, even as great environmental and health damages occurred at these sites. It would be a travesty if we also had to pay for these claims, while also having to assume clean up of these mismanaged sites.
8. Citizens will always defend their right to a healthy environment for our development and
welfare (Article 4 of the Mexican Constitution), as well as the right-to-know. The social and environmental organizations of Mexico restate what we have said since the negotiations leading up to NAFTA. We are faced with a free trade agreement that places us in a clear disadvantage. It is clear that we the Mexican people are negatively impacted by the agreement, not the large foreign corporations.
The Generation and Management of Hazardous Wastes and Transboundary Hazardous Waste Shipments between Mexico, Canada and the United States, 1990-2000
106
REFERENCES Anderson, David. March 2000. Letter to CIELAP. Ministry of Environment: Ottawa. Auditor-General. 1997. Report of the Auditor-General of Canada to the House of Commons: Chapter 4 Control of the Transboundary Movement of Hazardous Waste. Ottawa: Minister of Public Works and Government Services Canada.
Bill 76, The Environmental Assessment and Consultation Improvements Act, 1996. Border XXI Binational Working Group on Solid and Hazardous Waste. 2000. Working Group Progress Report, unpublished. San Francisco: US EPA Region IX and DF: SEMARNAP. Canadian Environmental Protection Act. 1999. Code of Federal Regulations, Chapter 40. Cooke, Gregg, EPA Administrator, Region VI. 1998. “Enforcement Issues in the US/Mexico Border Zone,” presented at the 10/23/98 Texas-Mexico Bar Association Meeting, Mexico City. Commission on Environmental Cooperation (CEC). 2000. Taking Stock 1997: North American Pollutant Releases and Transfers. Montreal: CEC. CEC. 1999. Tracking and Enforcement of Transborder Hazardous Waste Shipments in North America: A Needs Assessment. Montreal: CEC. CEC. 1998. Draft North American Agreement on Transboundary Environmental Impact Assessment. Montreal: CEC. CEC. 1997. NAFTA’s Institutions: The Environmental Potential and Performance of the NAFTA Free Trade Commission and Related. Montreal: CEC. Commissioner for Environment and Sustainable Development. May 2000. Report to the House of Commons. Ottawa: Minister of Supply and Services. Corson, Amanda. August 3, 2000. “Analysis of Hazardous Waste Imports/Exports Between 1993 and 1997.” Austin: TNRCC. Council on Environmental Quality, July 1981. Executive Office of the President, Environmental Trends. Washington: US Government Printing Office. DePalma, Anthony. May 4, 2001. “Judge Issues Split Decision in NAFTA Rules Case,” New York Times. Environmental Assessment Board. December 1997.Gary Steacy Dismantling Ltd., File NO EP97-03. Environmental Assessment Board. November 1, 1999. Material Resource Recovery SRBP Inc., File No.98-123.
The Generation and Management of Hazardous Wastes and Transboundary Hazardous Waste Shipments between Mexico, Canada and the United States, 1990-2000
107
Environmental Canada. 1999. National Pollutant Release Inventory 1997 Summary Report. Ottawa: Environment Canada. Federal Mobile PCB Treatment and Destruction Regulations, 1989 SOR 90-5) Feschuk, S. November 23, 1994. “Alberta plant to accept provinces’ hazardous wastes,” The Globe and Mail. INE/SEMARNAP. 1996. Programa para la Minimización y el Manejo Integral de los Residuos Industriales Peligrosos en México. 1996-2000. DF: SEMARNAP. INE, October 1999. "Promoción de la Minimización y Manejo Integral de los Residuos Peligrosos". Dirección General de Materiales, Residuos y Actividades Riesgosas. INEGI. 2000. Sistema de Cuentas Nacionales de México, 1988-1998. Jackson, J. 1982. Chemical Nightmare: The Unnecessary Legacy of Hazardous Waste. Toronto: Between the Lines. Jacott, Marisa, Cyrus Reed and Alejandro Villamar. March, 2000. Hazardous Waste Management in the United States-Mexico Border States: More Questions than Answers. Austin: Texas Center for Policy Studies. Land Transportation Standards Subcommittee. 1999. Minutes of the Meeting LTSS Group 5, October 25-28, 1999. Lepen, Pamela. August 8, 2000. Letter “Information Request Regarding Department of Toxic Substances Control Border Transporter Inspection Program in California.” Cypress, California: DTSC. Lindgren, A. August 1, 1999. “Mexico North,” The Ottawa Citizen. McAndrew, B. April 18, 1999. “Hazardous waste pouring into Ontario” McArthur, Keith. November 14, 2000. "NAFTA ruling goes against Ottawa," Globe and Mail. Mendoza, Edna. August 18, 2000. Letter “Hazardous Waste Border Surveillance Program in Arizona.” Tucson, Arizona: Arizona Department of Environmental Quality. Metalclad Corporation. 2000. Form 10-K: Annual Report for the year ended December 31, 1999. Newport Beach, California: Metalclad Corporation. Mittelstaedt, M. March 22, 2000. “Imported waste worries Anderson,” The Globe and Mail. Mittelsteadt, M. February 28, 2000. “Rules on hazardous waste feared too lax,” The Globe and Mail. Mittelstaedt, M. September 27, 1999. “Records lay open toxic-waste imports,” The Globe and Mail.
The Generation and Management of Hazardous Wastes and Transboundary Hazardous Waste Shipments between Mexico, Canada and the United States, 1990-2000
108
Mittelstaedt, M. September 18, 1999. “Ontario to close toxic-waste loophole,” The Globe and Mail. Nauman, Talli. October 24, 2000. "Cytrar Parent Firm Files World Bank Complaint Against Mexico," Borderlines Updater. North American Agreement on Environmental Cooperation Between the Government of Canada, the Government of the United Mexican States and the Government of the United States of America. 1993. Office of the Fire Marshal. 1997. Protecting the Public and the Environment by Improving Fire Safety at Ontario’s Recycling and Waste Handling Facilities .Toronto: Ministry of the Solicitor General and Correctional Services. Ontario Ministry of the Environment. 1997. Better, Stronger, Clearer Environmental Regulation for Ontario. Ontario Ministry of the Environment. July 1996. Responsive Environmental Protection: Reforming Environment & Energy Regulation in Ontario. Ontario Ministry of the Environment. 1995. Offences Against the Environment: Convictions in 1994 . Toronto: Ontario Ministry of the Environment. PROFEPA. 1998. Triannual Report of Activities, 1995-97. DF: SEMARNAP. PROFEPA. 1999. Indices de Cumplimiento de la Normatividad Ambiental en México. DF: SEMARNAP. Rabe, BG. 1994. Beyond NIMBY: Hazardous Waste Siting in Canada and the United States Washington: Brookings Institution. Red Tape Commission. 1997. Cutting Red Tape Barriers to Jobs and Better Government. Toronto: Cabinet Office. Safety Kleen. 2000. 10-K Annual Report For the Fiscal Year Ended August 31, 1999. Columbia: South Carolina: Safety Kleen. Scoffield, H. October 31, 1998. “Ottawa knew it was likely violating NAFTA with PCB ban, documents show,” The Globe and Mail. Scoffield, H. September 1, 1998. “PCB export ban breached NAFTA, firm says,” The Globe and Mail. SEMARNAP. 1999. Informe Nacional de Emisiones y Transferencias de Contaminantes, 1997-1998: Registro de Emisiones y Transferencia de Contaminantes. DF: SEMARNAP. Swaigen, J and D.Estrin, eds.1993.Environment on Trial: A Guide to Ontario Environmental Law and Policy. Toronto: CIELAP. Stablex Canada Inc. 2000. Website. (http://www. Envirobiz.com/audit/stablex/stablex.htm).
The Generation and Management of Hazardous Wastes and Transboundary Hazardous Waste Shipments between Mexico, Canada and the United States, 1990-2000
109
Sunset Advisory Commission. 2000. Texas Natural Resource Conservation Commission: Staff Report. Austin: Sunset Advisory Commission. Texas Natural Resource Conservation Commission (TNRCC). August 8, 2000. Letter to Cyrus Reed on Ports of Entry Enforcement. Austin: TNRCC. TNRCC. March 2000. Needs Assessment for Hazardous Waste Management Commercial Management Capacity in Texas (2000 Update). Austin: TNRCC. TNRCC. September 1999. Trends in Texas Hazardous Waste Management: Based Upon 1997 Data. TNRCC. December 1998. Electronic Tracking of Hazardous Waste from Mexican Maquiladoras to the United States. Austin: TNRCC. U.S. EPA. July 24, 2000. "First Time a Mexican Facility is Fined under U.S. Environmental Law," EPA Press Release, Region IX. U.S. EPA. September 1999. National Analysis: The National Biennial RCRA Hazardous Waste Report (Based on 1997 Data). Washington: US EPA. U.S. EPA 1999 Assessment of the Potential Costs, Benefits and Other Impacts of the Hazardous Waste Combustion MACT Standards: Final Rule, July 1999. U.S. EPA. 1998. U.S. -Mexico Border XXI Program: 1997-1998 Implementation Plans and 1996 Accomplishment Report. Washington, D.C., 1998. U.S. EPA. August 1997. National Analysis: The National Biennial RCRA Hazardous Waste Report (Based on 1995 Data). Washington: US EPA. U.S. EPA. August 1995. National Analysis: The National Biennial RCRA Hazardous Waste Report (Based on 1993 Data). Washington: US EPA. U.S. EPA. 1995. National Capacity Assessment Report: Capacity Planning Pursuant to CERCLA Section 104 c (9). Washington: US EPA. U.S. EPA. August 1994. National Analysis: The National Biennial RCRA Hazardous Waste Report (Based on 1991 Data). Washington.: US EPA . US EPA. 1986. Solving the Hazardous Waste Problem: EPA’s RCRA Program. Washington, D.C. US Department of Commerce. 1999. 1998 Citizen’s Guide to the US Economy . Available at www.senate.gov/~jec/98guide.htm. Waste Management Inc. 2000. 1999 Annual Report. Houston: Waste Management Inc. Winfield, Marc and Jenish. 1999. Ontario’s Environment and the ‘Common Sense Revolution:’ A Four Year Report. Toronto: CIELAP. Winfield, Marc. May 2000. Hazardous Waste Management in Ontario. Toronto: CIELAP.
The Generation and Management of Hazardous Wastes and Transboundary Hazardous Waste Shipments between Mexico, Canada and the United States, 1990-2000
110
Winfield, Marc. 1999. Hazardous Wastes and Toxic Substances. Toronto: Environmental Agenda for Ontario/CIELAP. Winfield, Marc. 1992. The Ultimate Horizontal Issue: Environmental Politics in Ontario and Alberta, 1970-1992. Toronto: Ph.D. Thesis, Department of Political Science, University of Toronto. Yacoumides, J. June 2000. Open for Toxics: Hazardous Waste Disposal Becomes a Growth Industry for Ontario, Toronto: CIELAP.