Embed Size (px)
Citation preview
ISSN: 1439-2305
Number 368 – April 2019
THE GENDER GAP IN INTERNATIONAL
TRADE: FEMALE-RUN FIRMS AND THE
EXPORTER PRODUCTIVITY PREMIUM
Astrid Krenz
The Gender Gap in International Trade: Female-runFirms and the Exporter Productivity Premium∗
Astrid Krenz†
April 2019
Abstract. Female-run firms are less likely to be exporters although they exert positive
influence in various aspects in an economy and society. With a new and comprehen-
sive data set on manufacturing plants, I investigate the exporter productivity premium
of female-run firms in Germany. The results show that female-run firms gain a higher
exporter-productivity premium than male-run firms. I find evidence for selection into ex-
porting but no impact for learning from exporting for female-run exporting firms. These
results give hint to discrimination barriers that female-run firms face when they are ex-
porting as compared to male-run firm exporters.
Keywords: Gender Inequality, Exporter-Productivity Premium, Germany, Firm Hetero-
geneity.
JEL: F14, L25, L60, O12.
∗ I am thankful for support by an EU Marie Curie Cofund / Durham International Junior Research Fellowshipunder EU grant agreement number 609412. The Stata Code that was programmed for the analyses is availableupon request. The Stata Codes that I programmed were run on the computers in the Statistical Office inHannover by Florian Koehler. Florian Koehler and Rita Skorka were in charge of the check of validity of theoriginal data, the check of validity of my constructed dataset and the checks of confidentiality regulations of myresults. The data used are confidential but not exclusive and come at a cost, further information can be found atwww.forschungsdatenzentrum.de/nutzungsbedingungen.asp . Remote data access applied.† Durham University Department of Economics and Finance Mill Hill Lane Durham DH1 3LB, United Kingdom;email: [email protected].
1. Introduction
Female-run firms are found to be much less involved into exporting than male-run firms (Chiu
2018, Froman 2018).1 This is surprising in so far as female-run firms are found to have very
positive effects on the economy and society. Female-run businesses pay back loans more quickly
and reliably than males (D’Espallier (2011); a 98 percent pay-back rate for female enterpreneurs
is mentioned according to the WTO ”Aid for Trade Global Review”, 2017), female-owned firms
hire more women in their companies (ITC, 2015; Ederington et al. 2009), and female firm owners
are more educated than male firm owners (Canadian Trade Commissioner, 2016). As females
invest more into their children’s education and health than men (about 90 percent as compared
to about 40 percent by men, ITC, 2015), a promotion of females into international trade and
the additional income gained upon is regarded as one of the major tools to bring families out of
poverty circles in the developing world (ITC, 2015).
The issue that females are underrepresented in international trade is currently experiencing
a high level of policy attention. The Buenos Aires Declaration on Trade and Women’s Eco-
nomic Empowerment (which was endorsed at the December 2017 WTO Ministerial Conference
in Buenos Aires and signed by about 120 WTO members and observers) acknowledged that em-
powering female businesses and providing more inclusive trade policies will promote economic
growth, sustainable development and reduce gender inequality and poverty. Several interna-
tional institutions have fostered programmes to remove barriers to trade for women, to increase
their economic empowerment and to help them participate in international trade.2
Lack of adequate data to investigate the situation and needs of female-run businesses re-
mains a problem. The WTO engages in rising awareness of gender issues in trade and aims to
gather data together with the World Bank in order to better understand this phenomenon. The
outcome of this endeavour shall be published with the 2019 Aid for Trade Global Review. Em-
powering female engagement in international trade is considered as a part of the 2030 Agenda
1Froman (2018) mentions that among US American companies 30 percent are female-owned but only 12 percentof exporting businesses are female-owned.2The WTO’s Aid for Trade initiative endeavours, for example, to support e-commerce, new digital technologiesand services trade for women (WTO, 2017). The National Trade Promotion Agency of Malaysia, for example, haslaunched the so called Women Exporters Development Programme (WEDP). The programme provides three yearsof support for female-owned and -led companies. The support consists of financial support for visiting internationaltrade fairs, participation in seminars and workshops, business coaching, skill enhancement training, network-ing, mentoring and leadership and entrepreneurial development, see http://www.matrade.gov.my/en/malaysia-exporters-section/224-etrade-programme–supporting-document .
1
on Sustainable Development among Goal No. 5 which aims to achieve gender equality and to
empower all women and girls.
Based on Official German Statistics, I construct a new, unique tailor-made and rich data
set on manufacturing plants for Germany and analyse the exporter productivity premium for
female-run businesses in the German economy. The advantage of the data is that they are
based on the whole population of firms in the German economy, which differentiates these
data from other firm data sets that are based on surveys (e.g. ZEW, IAB) or on sub-samples
(e.g. Bundesbank microdata for foreign direct investments).3 The data is of high quality and
comprehensive as German Law mandates that all firms have to report to the Official Statistics.
I use the terminology of a female-run firm for my analyses to cover either female firm ownership
or a majority share of female employees in a company (either more than 50 or 60 percent). The
exporter productivity premium is defined as the difference in productivity between an exporter
versus a non-exporter.4
Germany is a highly industrialized and democratic country and is one of the major exporting
nations in the world. Yet, a glass ceiling, which is defined as a gender gap in getting access to
management and top job positions and to the same wage is highly persistent in the economy.
According to recent figures, the gender wage gap amounts to about 21 percent in Germany.5
In 2014, Germany endorsed a law to increase the share of females in executive positions or
boardrooms in big enterprises to at least 30 percent by 2016 (Frauenquote or women’s quota).
Whereas research about how that share of female leaders or the share of female employees in a
company is attributing to firms’ success is increasing over the past years, there is up-to-date no
3The register of firms comprises all firms, especially all manufacturing firms, which are considered for the presentanalysis. Excepted are only those firms from sectors A, O, T and U according to ISIC rev. 4, which are thesectors of agriculture, forestry and fishing, public administration and defense and other services.4Henceforth, female/ male exporter is used as an abbreviation for an exporting female-run / male-run firm.5See https : //ec.europa.eu/eurostat/statistics − explained/index.php/Gender − pay − gap − statistics . Thisfigure represents the 2017 unadjusted gender pay gap, that is the difference between average gross hourly earn-ings between male and female employees as percentage of gross hourly earnings of males. It is computed fromenterprises that employ 10 or more employees.
2

study that investigates the role of German female-run firms in productivity and international
trade performance.6 7 The present paper is intended to fill this gap.
The intuition and underlying mechanism for my analysis is the following. Female-run firms
might face a higher degree of discrimination when it comes to establishing trade. Females
might not be taken seriously by potential other traders. They might be viewed as being less
committing to work, following the argumentation by Boler, Javorcik, Ulltveit-Moe (2018). They
might face barriers to trade that range from institutional to financial and social factors, which
I will describe in more detail in the following. As such traders (importers) might discriminate
against women and thus female run firms will exhibit a higher gender exporter-productivity
premium than male run firms. In particular, discrimination of female-run firm exporters may
depend on the importer’s cultural background. Female-run firms might face difficulties when in
the importer’s country female leadership or business activity is rare or frowned upon.8
My results show that female-run firms in Germany, measured either by female firm ownership,
or by the percentage of female employment in a firm being either higher than 50 or 60 percent,
bear a higher exporter-productivity premium than male-run firms. This points to difficulties
that female-run firms face when they try to export. I find strong evidence for female-owned firms
as well as for those firms that have a majority share of female employees in their company to be
less likely to export. While controlling for firm characteristics including firm productivity and
6Bertrand et al. (2019) find that the introduction of the 40 percent quota for women in corporate boards of publiclimited liability companies in Norway reduced the gender wage gap within boards, however they do not find animpact on other females. They further find that qualifications of women appointed to the boards were higherafter the reform. Pletzer et al. (2015) find small and non-significant effects of female representation in corporateboards on financial firm performance in their meta-analysis which is based on 20 different studies’ coefficients andresults, however they point out that there might be several limitations of their meta-study.7A range of studies examined how promotions of females or perception of females in leading positions relateto discrimination and how discriminating beliefs can be reduced. It is found that female promotion increaseswhen more women are in senior positions in a company but not when there are more females at the same rank(Kunze and Miller, 2017). The authors explain that female bosses might enable lower-ranked females to getbetter mentors, role models and networks. Among peers, however, greater competition might prevail regardingpromotions or mentoring and support. Conducting experiments in military camps, the literature shows thatwhen men lived and worked together with females in the camps, their attitude towards female squad leadershippositively changed over time (Finseraas et al., 2016).8In many countries legal and regulatory barriers exist which prevent women from work and asset ownership (ITC,2015). Permission of a male is required to register a business in some countries. Inheritance rights favor men overwomen, a report from the World Bank reveals that 33 out of 173 countries do not support equal inheritance rightsbetween sons and daughters, 18 of these countries are from the MENA region (World Bank, 2015). Having fewerassets and property rights, females will have more difficulties to access financial credits, aside from the dependenceon male permission. The report further found that in 90 percent of the 173 analyzed countries at least one lawexisted that reduced female opportunities. In another report the World Bank reveals that in different regions ofthe world gender disparities in ownership and in control of assets, rigid social norms about gender roles, genderwage gaps, underrepresentation of females in top job positions as well as occupational segregation exist (WorldBank, 2013). In several places in the world women have fewer opportunities in education and suffer in particularfrom lack of infrastructure and water access.
3
further regional and industry-wide influences, this shows that the decision to export significantly
depends on gender.
There are manifold barriers that female exporters will face. These barriers are an unequal
access to finance and capital, unequal access to market information and networks, institutions
and regulations that hinder women from using their assets, and cultural and social norms like
the division of housework or caring responsibilities (ITC, 2015).9 These barriers do already
hinder non-exporting female firm owners, however, they are even higher for exporters, as these
businesses require even more capital, networks, skills and travel activities and time for work.
Discrimination barriers can be differentiated across supply-side and demand-side driven ones
(Pande and Ford, 2011). Demand-side discrimination can comprise the preference for male
leaders and businessmen, lack of information about the skills and capabilities of females10, and
restrictive business networks that exclude women or make it difficult for women to participate
in business. On the supply-side, discrimination barriers comprise duties of child care and other
household tasks for which women might interrupt career or work fewer hours, and fewer aspira-
tions or preference for non-competitive environments due to fewer female role models or lack of
information. Evidence from the literature (Pande and Ford, 2011), especially from the literature
on women’s quota (Bertrand et al., 2019), suggests that females want to act in high positions
in companies, and they are very well-qualified: all the reserved places in boards were filled with
women, and their qualifications were higher than before the female quota reform.
The rest of the paper is organized as follows. The next part reviews the previous literature.
Part 3 describes the data, the choice of variables and descriptive statistics. The fourth part
deals with the empirical analysis, describes the methodology and reports the results. The last
section concludes.
2. Review of the Literature
This section summarizes related research from the literature, on i. discrimination theory, ii.
evidence on firms, productivity and trade in Germany, iii. international trade and the exporter
productivity premium, iv. gender studies and findings for wages and trade.
9Previous literature found that difficulties and higher costs to attain external finance do negatively affect firms’productivity and innovation (Gorodnichenko and Schnitzer, 2013). A survey of studies revealing evidence oncredit constraints and exporting can be found in Wagner (2014).10Lack of information about abilities of females in leading positions/ at work might lead to judge females onassumed average performance. This judgement might be biased and underestimate females’ performance, this isknown as statistical discrimination.
4

2.1. Discrimination theory. According to the seminal discrimination model of Becker (1957),
competition should in the long-run drive out those firms from the market that discriminate
(which could involve fewer employment of minorities, females, other races, etc.). Discrimination
is costly, when taking into account that males are paid more than women. Firms will loose
profits for either paying or forfeiting income for their act of discrimination. In the end only the
most profitable firms, which are those that are less discriminating, will survive.
Ederington et al. (2009) extend Becker’s model to the case of international trade and put
his hypotheses to an empirical test using Colombian plant-level data. In terms of international
trade theory, exporting firms that open themselves to the world market and experience increasing
competition should discriminate less than firms that produce for the domestic market, only. The
authors test whether firms employ more or less women. They assume as well that there exists a
wage differential in the beginning and wages for women are lower than those for men. Firms that
discriminate more - who hire less women - will thus bear a higher marginal cost of production
and will be less profitable. Using the Colombian data, the authors find that firms that employ
a higher share of women are those that engage more into exporting. More competition induces
firms to hire more women. However, they do not find evidence for trade liberalization to drive
firms out of the market.
Juhn et al. (2013, 2014) find that exporting firms upgrade their technology due to trade
liberalization which improves the productivity of women in blue-collar occupations. These firms
pay those women higher wages which reduces the gender wage gap, moreover it increases their
employment. They find empirical support for these results using plant-level data for Mexico.
Contrasting evidence is found by Saure and Zoabi (2014). They construct a model where
trade integration induces a widening of the gender wage gap and a reduction of female labor
participation. Female and male labor are considered to be imperfect substitutes and two distinct
factors of production. Female labor and capital are assumed to be in a stronger complementary
relation than male labor and capital. The country is assumed to be capital-abundant. If trade
integration occurs, the sector that uses more female labor expands and the sector that uses more
male labor contracts. Male workers migrate to the female sector, which reduces the capital labor
ratio and drops the marginal productivity of women by more than the marginal productivity of
men. They find supporting empirical evidence for their model using US population survey data
and bilateral trade data for the US and Mexico.
5
2.2. Firms and productivity in Germany. Almost 30 years after German reunification
differences in firm performance still exist between the West and East of Germany (Wagner,
2012, 2016, 2018). Although the East experienced a considerable catch-up in living standards
over time, labor productivity is still significantly lagging behind in the East as compared to the
West (Burda, 2006, 2008; Burda and Severgnini 2018; Burda and Hunt 2001).
Burda and Severgnini (2018) conduct regional TFP regressions across the German federal
states and show that the labor productivity gap can be explained by a persistent TFP gap in
East Germany and by low concentration of managers, low start-up intensity and a fewer number
of large firms.
Burda and Hunt (2001) find that the East-West productivity gap remains constant across
skill-levels. They argue that factors other than skills explain the persistent gap and point for
example to the relevance of further infrastructure investment in East Germany. Moreover, the
authors find that better educated migrate from the East to the West of Germany which might
explain a TFP reduction in the East. This is further investigated by Burda (2006, 2008) in a
model that captures opposite directions of factor movement for capital and labor and which is
backed by the fact that after reunification East Germany became subject to a massive inflow of
capital, however it also became subject to an outflow of employment after reunification.
In numerous studies Wagner used firm-level data from the Official German Statistics and
merged the Official German Trade Statistics to these data. His studies show that firms in East
Germany are smaller in size, export less and have a lower human capital rate defined as wages
per employee (e.g. Wagner, 2016).
With data for more than 160 million export and import transactions over the years from 2009
to 2012, Wagner (2018) shows that in the Germany economy larger, older and foreign owned
firms, and firms that have a higher labor productivity as well as research and development and
human capital intensity are the firms that are active in a larger number of foreign markets. Most
of the firms are active on a few markets, only, but firms that are active on many markets are
responsible for a higher share of foreign trade.
In numerous further studies Wagner shows that the extensive margins of trade are positively
associated with labor productivity in the German economy (e.g. Wagner, 2012).
2.3. Exporting and productivity. There exists a wide range of studies on the relationship
between firm productivity and trade. An overview of studies can be found for example in
6
Wagner (2016 b). Empirical evidence on the relationship between trade and productivity has
been established by the seminal papers by Bernard and Jensen (1995, 1999), and was followed
up by the theory on heterogenous firms in international trade by Melitz (2003). According to
these studies only the most productive firms will decide to export as those are the firms that
are able to cover the fixed costs of production. This relation is investigated as selection into
exporting in the trade literature. Another link is that firms once they export might show a
better performance in terms of productivity or firm survival. This effect is known as learning
from exporting. Whereas the previous literature has found ample evidence for selection into
exporting (Clerides et al. 1998, van Biesebroeck 2005, International Study Group on Trade and
Productivity 2008; see Singh 2010 for an overview), there is less evidence found for learning
from exporting (no evidence for learning from exporting is for example found by Bernard and
Jensen 1999, Bernard and Wagner 1997, Clerides et al. 1998, Smeets and Warzynski 2010).
Positive evidence for learning from exporting is found by Van Biesebroeck (2005) for a sample of
Sub-Saharan African countries, Blalock and Gertler (2004) for Indonesian firms, and de Loecker
(2007) for Slovenian firms.
2.4. Gender, wages and exports. A large body of literature investigates the gender wage gap
(see e.g. Goldin, 2014, and for an overview and discussion Blau and Kahn, 2017). Here I focuss
on explanations for the relation between international trade, gender, wages and productivity.
Boler et al. (2018) investigate the gender wage gap in Norwegian manufacturing exporting
firms using a matched employer-employee data set. They exploit the mechanism that an exposure
in competition faced by exporting firms induces them to require more commitment to work
from their employees. However, when females are observed as being less committing to work,
the gender wage gap increases. The authors find a widening of the gender wage gap when
college educated females are employed in an exporting firm. Exploiting a policy variable that
captures fathers’ parental leave they show that the gender wage gap between exporters and
non-exporters is narrowing. The authors explain that when additional child care is available,
women are perceived to commit more to work.
Black and Brainerd (2002), however, find evidence that the wages gap decreases more rapidly
due to a trade shock in those industries that were more concentrated rather than competitive in
the beginning. They use population survey and census data for the United States to analyze the
7

impact of a change in the import share on the gender wage gap across industries and metropolitan
areas.
The closest work to this paper is Davies and Mazikheyev (2015). They conduct a cross-
sectional analysis using data from the World Enterprise Survey to investigate the gender exporter
productivity premium for a sample of developing countries. They find a negative female exporter
productivity premium, while I find a positive one. The authors interpret their results as pointing
to women having problems in learning from exporting rather than less trade barriers to be present
for female exporters. However, in one regression they find a positive effect for the case of large
firms when interacting the variables of exporting and female firm ownership with export costs
(which they measure at the country- and not at the firm-level) and interpret this as pointing to
barriers to trade and discrimination that female exporters face. One limitation of their study is
that they do not directly test for selection into exporting and learning from exporting.
Summarizing, literature on the relationship between females’ engagement in international
trade and productivity, the impact of barriers to trade or learning from exporting effects, can be
found almost none. Few studies explain the effects of trade and globalization on the gender wage
gap. How trade affects productivity of female-run businesses remains to date an open question.
In the following I analyze the exporter productivity premium of female-run firms in the German
economy.
3. Data
For the analysis I constructed a new data set based on data from the German Federal Sta-
tistical Office and the Offices of the Laender. I merged data from three different sources: the
register of firms (Unternehmensregister, abbr. URS ) which covers information on plants and
enterprises, the data set on manufacturing plants (AFiD Industriebetriebe) and the data set on
manufacturing enterprises (AFiD Industrieunternehmen).11 The data is of high quality, accurate
and comprehensive as by German Law all firms in the German economy have to report to the
official statistics. The register of firms is capturing all plants and enterprises in the German
economy. Data provision and management by the Statistical Offices, however, takes time.12
Remote data access applied. In what follows, I analyze the exporter-productivity premium in
11AFiD stands for Amtliche Firmendaten or Official Firm Data.12It took more than 2 1
2years after application for the data that I got some first access to the data. Additional
time is passing by for having the Statistical Office run the author’s programmes on the original data on the Office’scomputer and for checks of confidentiality of results.
8
the German economy at the plant level. Each plant has a unique plant-level identifier and its
affiliation to an enterprise can be traced back by a given enterprise-level identifier. A plant is
defined as the local production unit. An enterprise is defined as the judicial entity and one or
more plants are assigned to a judicial entity. The terminology ’firm’ is used as a broad concept -
which is commonly used in the literature as well - that encompasses plants and/ or enterprises.
For the analyses, I took data for the manufacturing sectors, only.13 Due to data availability
at the plant-level, I run estimations for the cross-section of the year 2014. The final data set
consists of all manufacturing plants in Germany that have at least 20 employees. This cut-off is
given by the AFiD data. Subsequently, effects were also estimated separately for the subsets of
small and medium-sized plants and large plants. Large plants are characterized as having more
than 250 employees and more than 50 billions euros of sales value. Firms other than that are
defined as small and medium-sized plants.
For the analysis I use information on the status of a female firm owner of the enterprise that
the plant belongs to, which is modelled by a dummy variable that equals 1 if there is at least
one female firm owner and zero otherwise. In the following this will be referred to as female
firm ownership. The information is extracted from the AFiD data on manufacturing enterprises.
Given that female firm ownership does not necessarily represent the operation of business by
females, I approximate the female management and operation of a firm by the share of female
employees being bigger than 50 and 60 percent, using the number of female employees in the total
number of employees. This information does also come from the AFiD data on manufacturing
enterprises. The idea for this proxy comes from the previous literature that found that female-
managed and -owned firms employ a higher share of females than male-managed and -owned
ones (ITC, 2015; Ederington et al. 2009).14
I use further explanatory factors at the plant-level that played a role in the previous literature
on trade and productivity. I control for the export status by a dummy variable that is 1 when
the plant exports and zero otherwise (this is also a measure for the extensive margin of trade
13The sectors comprise the manufacturing industries according to the German industry classification WZ 2008,sectors 1000 to 3300. This classification corresponds to the international ISIC rev 4 classification. 11.6 percent ofthe plants are from the sector of food production, 11.5 percent from the sector of fabricated metals productionand 13.7 from the sector of machinery construction.14Ederington et al. (2009) find in their regression analyses that the hiring of female employees depends significantlyand positively on the female share of managers and owners. The authors argue that this might reveal that femaleowners and managers have less taste for discriminating women. Data from the ITC for 20 developing countriesshow that in 40 percent of female-owned firms more than 50 percent of employees is female, whereas this is thecase only in 22 percent of male-owned and -managed firms. About 53 percent, more than half of the male-ownedand -managed firms employ only up to 20 percent female employees (ITC, 2015).
9
that I use in one of the later subsections). I used a measure of the log of the share of exports
in total sales to control for the intensive margin of trade. Further variables include firm size as
measured by the log of the number of employees in a plant, the status to be a multi-product
firm (dummy variable that equals 1 when more than one good is produced by the plant), the
foreign ownership status (that is 1 when the plant is a subsidiary to a multinational enterprise
which has its headquarter in a foreign country15, this data comes from the register of firms), the
log of investment in intangible assets (licenses, patents, trade marks, concessions), the log of
intermediate goods intensity (the value of intermediate goods is taken in relation to the number
of employees), the capital depreciation to gain a measure of capital intensity which is logged
(capital intensity is measured as the absolute amount of capital depreciation in relation to the
number of employees; there are no measures for capital stock in the data available, and this
approach has also been applied by Wagner (2016)), as well as 2-digit industry affiliation and
regional federal state effects, and an East dummy variable (that is 1 when the plant is in East
Germany and zero if it is in West Germany). There are no variables for firm demography and
age in the data sets available. Therefore, I used a measure to capture whether a plant is older
than five years, that is based on whether the plant reported within 5 years or not in the register
of firms. Productivity is measured as the log of plant-level labor productivity by dividing sales
output by the number of employees. As no information on the capital stock is available in the
mentioned firm data sets, a more detailed measure of total factor productivity could not be used
for this analysis.
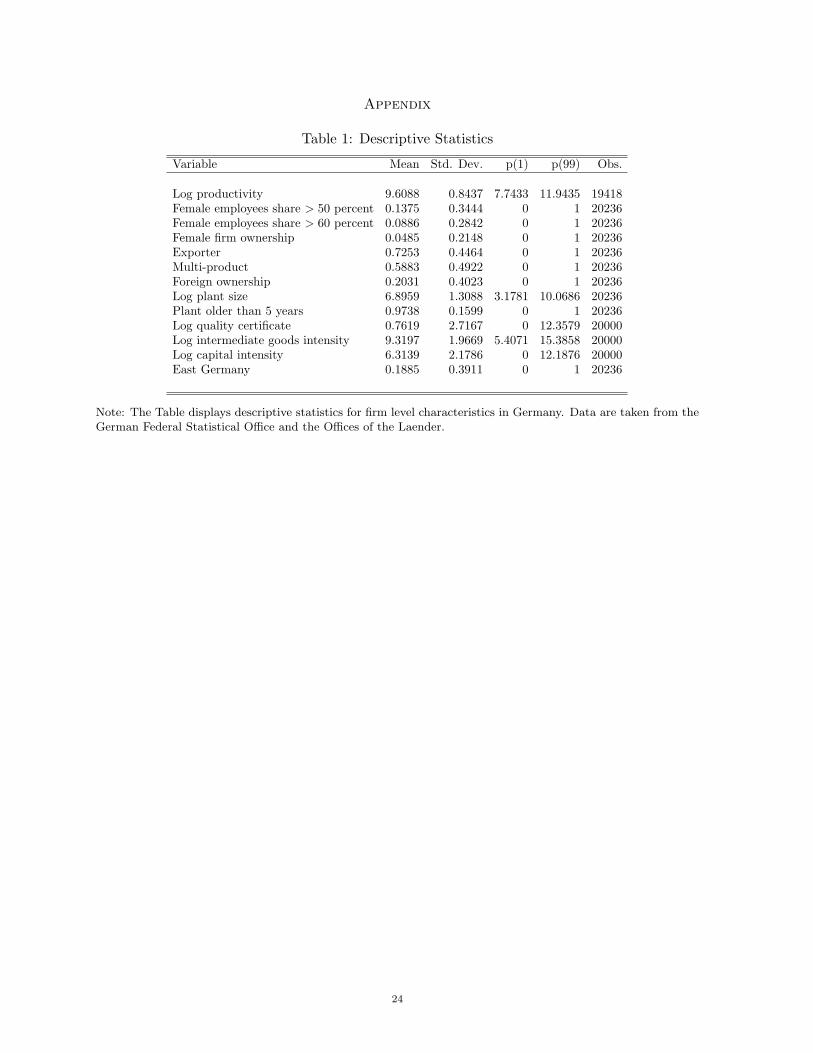
Insert Table 1 here.
Table 1 displays the descriptive statistics for my full data set covering all manufacturing
plants in the German economy that have at least 20 employees. As can be seen from the data
sample 4.8 percent of the plants belong to an enterprise that has a female-owner, 9 percent of
manufacturing plants belong to an enterprise that employs more than 60 percent of women and
14 percent of plants belong to an enterprise that employs more than 50 percent of females. 19
percent of plants are operating in the East of Germany. Around 73 percent of plants export and
15A firm is considered to be foreign-owned if it has more than 50 percent of the voting rights of the owner ormore than 50 percent of the shares directly or indirectly controlled by a firm or person or institution in anothercountry.
10
59 percent are multi-product plants. Around 20 percent of plants belong to an enterprise that
is foreign-owned and about 97 percent of plants were older than 5 years.
Table 2 reports descriptive statistics where firm ownership and the employee share are differ-
entiated by gender. Comparing mean values, the results show that female-owned firms are less
productive than male-owned firms. 68 percent of female-owned firms export whereas about 73
percent of male-owned firms export. A higher share of female-owned firms produce more than
one product (65 versus 59 percent), female-owned firms are less foreign-owned, smaller in size,
older and fewer are operating in East Germany than male-owned firms. These statistics for
female-owned firms are broadly in line with those for the groups of firms that employ more than
50 percent of females or more than 60 percent of females, except for one important difference:
the share of firms that employ more than 50 or more than 60 percent females is higher in East
Germany, about 23 versus 18 percent in West Germany.
Insert Table 2 here.
Table 3 displays results from a non-parametric test for first order stochastic dominance of
one distribution over another. With this test not only the differences in mean productivity
but across groups for all moments of the distribution can be examined. The According to
the Kolmogorov-Smirnov test the hypothesis that the two distributions between female and
male exporters do not differ is rejected at the one percent significance level. Moreover, the
results show that the productivity distribution of male-owned firm exporters is dominated by
the productivity distribution of female-owned firm exporters, i.e. female exporters have a higher
productivity. As these results do not cover a fully fledged regression analysis, one can only
cautiously interpret these results pointing to female firm exporters either producing with higher
productivity possibly due to higher trade costs or by learning more from exporting. A different
picture emerges for the size of firms: the productivity distribution of male exporters is to the
right of female exporters. Exporting female firms thus seem to be smaller firms.
Insert Table 3 here.
11
4. Empirical Results
4.1. Methodological Design. To investigate the exporter-productivity premium across female-
and male-run firms in Germany, I estimated the following basic regression:
Yi = β0 + β1Femalei + β2Exporteri ∗ Femalei + β3Exporteri + β4Xi + δs + γj + ǫi (1)
where i is the manufacturing plant, s the industry sector, j the regional state, Y is the log of
labor productivity measured by sales output in relation to the number of employees, Female is a
dummy that is equal to one when the firm is owned by a female or when the employment share
of females in a firm is either bigger than 50 or bigger than 60 percent, exporter is a dummy
that is equal to one when the plant is exporting, X is a vector of control variables (including
the log of the number of employees capturing firm size, a dummy for foreign ownership status, a
dummy for multi-product status, a dummy to capture whether the plant is older than 5 years,
the log of investments in intangible assets, the log of intermediate goods intensity, the log of
capital intensity, and interaction terms between East Germany, exporting and productivity), δs
are 2-digit industry fixed effects, γj are regional fixed effects at the federal state level and ǫ is
an idiosyncratic error term.
The exporter productivity premium for a male-run firm is β3 and for a female-run firm it is
β2 + β3. If β2 > 0, the exporter productivity gap is larger for female-run firms and according
to the mechanism explained above this can be interpreted as female firms facing higher barriers
to trade than male-run firms. An analysis of the impact of causation is provided in subsection
4.5. It has to be disentangled whether female-run firms have to be more productive to start
exporting or whether they learn from exporting and thus have higher productivity. The results
of my analyses show that a positive exporter productivity premium is present among German
firms, and the gap becomes larger when the exporter is a female-owned firm or a firm in which
the female employment share is larger than 50 or 60 percent. Moreover, the results point to
selection into exporting being relevant whereas no significant effects are found in favor of learning
from exporting.
4.2. Baseline Results. Table 4, Table 5 and Table 6 report the main results. In Table 4,
column 1 shows a basic estimation including only the export status, female-ownership status
and the interaction term between female firm ownership and exporting. The results reveal
12
a strongly significant and positive exporter productivity premium of male exporters being 33
percent more productive than male non-exporters. The exporter productivity premium of a
female-owned firm is almost twice as large, namely 57 percent.16 The inclusion of industry
and regional fixed effects sorts out influences of different gender patterns across industries and
regions.
Insert Table 4 here.
Further controls are added to the regression and results are shown in columns 2 and 3. When
including firm size, multi-product status, foreign ownership status and information for whether
the plant is older than 5 years, the female exporter productivity premium roughly stays the same,
at 0.2784. When adding further controls on intermediate inputs and capital intensity - which are
important to properly estimate a production function - and intangible assets investments, the
coefficient becomes lower, it is 0.1277. The results show that firms that are larger, foreign-owned,
multi-product firms and have more intangible assets are more productive.
I further investigated whether running a business in East Germany bears more costs that
female exporting firms will have to bear. For that purpose I added interaction terms between
the East dummy and exporting, the East dummy and female ownership status as well as a
triple interaction term between exporting, female firm ownership and the East dummy. If
additional barriers and costs were present for female exporters when they are operating in East
Germany, then one would expect the triple interaction term to be positive. The coefficient on the
interaction term of female owner, exporter and East Germany is positive, as expected, however
it is not significant.
Insert Table 5 here.
In Table 5 results are shown for the female employee share as a regressor, to proxy for female
management of the firm. The exporter productivity premium in firms that employ less than 50
percent men is lower than in the case of male firm ownership, it is about 21 percent as shown
in column 1. Firms with a female employee share bigger than 50 percent have an exporter
productivity premium of about 65 percent. This effect is more than twice as high as in the
16This results from computing 0.33 + 0.24 = 0.57 and multiplying this term by 100.
13
case of female firm ownership. These results are still valid when introducing further explanatory
factors to the regression equation, though the premium becomes lower in absolute terms.
Insert Table 6 here.
Table 6 displays results when the female employee share is exceeding 60 percent. The exporter
productivity premium is lower than for the case when the female employee share was larger
than 50 percent. The estimate is positive and significant and female-run firms have an exporter
productivity premium of at least 34 percent, which is somewhat less than twice the premium
for male-run firms.
4.3. Firm Size. Table 7 presents results from an estimation differentiated by firm size. The
sample is split between large plants that have more than 250 employees and a sales value of
more than 50 billion euros, and the remainder of small and medium-sized plants.
In column 1 and 2 it is shown that the female exporter productivity premium is positive
but insignificant for big plants. Female-owned firms are not significantly less productive than
male-owned firms, which is different from previous baseline results. The exporter premium is
positive and significant.
In column 3 and 4 it is shown that the female exporter productivity premium is positive and
significant for small and medium-sized plants. The premium is about 34 percent. Moreover,
female-owned firms are significantly less productive and the exporter premium is positively
significant.
Summarizing, the results show that the exporter productivity premium for female firm owners
is significant and positive in small and medium-sized plants. Female firm owners require a
higher productivity premium to find it profitable to export in order to cover additional costs
and discrimination.
Insert Table 7 here.
14
4.4. Extensive and Intensive Margins of Trade. In a next step the extensive and intensive
margins of trade were investigated. For the extensive margin an export dummy (1 if it is an
exporting plant) was used as the dependent variable. A logit regression is applied to investigate
whether a plant exports or not depending on productivity, gender and further factors. The
results from the regressions are shown in Table 8. The premium for female-owned firms that
are more productive is significant and positive. This is the case for female firm ownership, as
well as for the female employee share of a firm being higher than 50 and 60 percent. Moreover,
the results show that larger, older, more productive, multi-product-, foreign-owned firms and
firms that have more intangible assets are more likely to export. Apparently, producing in East
Germany is fostering trade for firms with employment shares of females bigger than 50 or 60
percent, but it is negatively impacting the export decision according to the female ownership
status in East Germany.
Most importantly, the results reveal that female-owned firms and firms that have female
employee shares larger than 50 or 60 percent are less likely to export. Given that influential firm
characteristics as well as industry and regional effects are controlled for in the regressions for
the export decision, the results show that it is female ownership or the majority share of female
employees that significantly and strongly reduce the decision to export. This remains true even
after controlling for the productivity of manufacturing plants.
Insert Table 8 here.
For regressions at the intensive margin the log of the export share was used as dependent
variable. A Tobit estimator was taken and the same set of explanatory variables was included
as for the extensive margin regressions. The results are shown in Table 9. The coefficient of the
interaction term of female and productivity is positive, however not significant in the case of a
female employee share higher than 50 and 60 percent. This could be interpreted as traders decide
whether to trade with female-run firms or not (that means the extensive margin is important
only), and when they decided to do, how much they trade does not depend on the gender status
of the firm. Furthermore, the results show that more productive, larger, foreign-owned firms
and firms that have more intangible assets export a larger share of their sales. The coefficients
for age of the plant and multi-product status are negative but not significant. Moreover, the
effects for East Germany are non-significant.
15
Insert Table 9 here.
4.5. Selection into Exporting and Learning from Exporting. To investigate the causal
relationship between female exporting and firm productivity it is important to sort out whether
firms that are more productive from the beginning sort into exporting (selection into exporting)
or whether exporting is leading to an improvement of firm productivity (learning from export-
ing). For this task, I accessed additional firm-level and external data for the cross-section of the
year 2012.17 These data comprise information from the AFiD data sets of manufacturing plants
and manufacturing enterprises, but not from the register of firms. For that reason, measures of
foreign firm ownership and of the age of the plant are not available for the regression. Deflated
measures were taken for values of variables.
For testing for selection into exporting, the pre-entry differences in labor productivity for those
plants that export and those that do not are investigated.18 The idea behind this procedure is
that if the more productive firms become exporters, differences in firm productivity and perfor-
mance should be found already some years before those firms start to export. This comparison
has been applied for example in Bernard and Jensen (1995, 1999) or the International Study
Group on Exports and Productivity (2008) who find that several years before firms start to
export firms are larger, more productive and pay higher wages. For my analyses, plants that did
not export between the years t-2 and t-1 but did so in year t were selected (this is the export
status variable Exp) and the difference in labor productivity in year t-2 between plants who
exported in year t and those who did not is estimated. t is in this context the year 2014. The
following regression is estimated:
Yit−2 = β0 + β1Femaleit−2 + β2Expit ∗ Femaleit−2 + β3Expit + β4Xit−2 + δs + γj + ǫit−2 (2)
where i is the plant, t the year, Y is the log of labor productivity, Exp is a dummy variable for
export status (1 if a plant exports in year t, but not in years t-2 and t-1), Female is a dummy
for firm ownership or the female employee share being bigger than 50 or 60 percent, X is a
vector of control variables (including the log of employees to capture firm size, a dummy for
17This involved further time for coordination and data management by the Statistical Office, as well as financialcosts.18Pre-entry and post-entry differences can be computed for one, two, three or more year-differences, the finalchoice depends not least on data access.
16
multi-product status, the log of investments in intangible assets, the log of intermediate goods
intensity and the log of capital intensity), γ are regional dummies at the federal state level, δ
are 2-digit industry dummies and ǫ is an idiosyncratic error term.
Insert Table 10 here.
Results in Table 10 show that female firm ownership exerts a significantly negative effect on labor
productivity for different models, and exporting exerts a significantly positive effect on labor
productivity. The coefficient for the interaction term of female firm ownership and exporting is
positive, however not significant at the conventional levels.
Insert Table 11 here.
In Table 11 results are shown for the female employee share being bigger than 50 percent. As can
be seen a positive and significant effect can be found for the interaction term between the female
employee share and exporting, which weakens in significance the more variables are entering the
model.
Insert Table 12 here.
Table 12 displays results for the female employee share being bigger than 60 percent. The
exporter-productivity premia of female-run firms are positive. To summarize, the effects that
support selection into exporting appear relevant for the female employee share, but not for
female firm ownership. This indicates that only the most productive female-run firms sort into
exporting, which points to barriers that those firms face and additional costs they have to cover,
which only the most productive firms can afford to pay and thus can finally become exporters.
For tests of the learning from exporting hypothesis, plants that did not export in years t-2
and t-1 but in year t and in at least one other year in the year t+1 and t+2 are compared
with plants that did not export in any year between t-2 and t+2. t in this context is the year
2012. The idea behind this comparison is that exporting fosters the post-entry productivity
17
differences. The dependent variable is the difference in the growth of labor productivity over
two years after starting to export. I estimate the following regression:
Yit+2 − Yit+1 = β0 + β1Femaleit + β2Expit ∗ Femaleit + β3Expit + β4Xit + δs + γj + ǫit (3)
with i the plant, t the year, Y is the log of labor productivity, Exp is a dummy variable for
export status (which is 1 if a plant did not export in years t-2 and t-1 but in t and in at least one
other year in t+1 or t+2), Female is a dummy variable for female firm ownership or the female
employee share being bigger than 50 or 60 percent, X is a vector of control variables (including
the log of the number of employees capturing firm size, a dummy variable for multi-product
status, the log of investments in intangible assets, the log of intermediate goods intensity, the
log of capital intensity), γ are regional dummies at the federal state level, δ are 2-digit industry
dummies and ǫ is an idiosyncratic error term.
Insert Table 13 here.
The results from Table 13 show that there is no relationship between the interaction term on
female firm ownership and export status at the conventional significance levels. There is also no
significant relationship resulting when the female employee shares bigger than 50 or 60 percent
are considered. The results can be seen from Table 14 and Table 15. Consequently, one may
conclude that learning from exporting does not play a significant role. This finds support in the
literature for example by studies from Bernard and Jensen (1995, 1999), Bernard and Wagner
(1997), and Clerides et al. (1996). Interestingly, the results further reveal that female-run firms
have a higher productivity two years after the export starting date: the coefficient for this effect
in the case of a female employee share bigger than 50 or 60 percent is positive and statistically
different from zero. This is a remarkable result for its own sake. Independently from exporting,
female-run businesses achieve higher productivity growth in the German economy, as compared
to male-run firms.
Insert Table 14 here.
Insert Table 15 here.
18
5. Conclusion
Female-run firms differ from male-run firms in many aspects. One of them is that female-run
businesses are less involved in exporting. This comes as a disadvantage because what is known
from international trade theory is that exporters are more productive, they pay higher wages
and hire more people. Inclusion of more women to international trade is put high on the current
policy agenda with many efforts by theWTO, ITC, Worldbank and other institutions to empower
women, to decrease barriers of trade for women and help them participate in international
trade. Female participation in trade is considered to have an important impact on sustainable
development and economic growth worldwide.
The present paper focusses on the relationship between exporting and productivity for female-
run businesses in Germany. For that purpose I constructed a new, tailor-made and comprehen-
sive data set on manufacturing plants based on official firm statistics from the German Federal
Statistical Office and the Offices of the Laender. The results show that female-run firms have
a positive exporter-productivity premium. Female-run firms that export are about twice as
productive as male-run firms. Having a higher premium indicates that female-run firms face
higher costs through discrimination barriers that they have to overcome when they decide to
engage in exporting. The effect is large from an economic point of view. Disentangling ef-
fects through correlation from causation, results further exhibit that this effect results from a
process of selection into exporting rather than learning from exporting. It corroborates the
finding that female-run firms face discrimination barriers, they have to be more productive to
become an exporter, and this translates into a higher female exporter-productivity premium.
The difficulties that female firms face when they want to export and the resulting higher gender
exporter-productivity premium will have an impact on the gender wage gap and gender income
inequality in Germany.
The literature on the relationship between trade and productivity of female-run firms is still
very scarce. Only through gathering adequate data that capture information on female exporters
additional insight into the needs and disadvantages that female-run businesses face can be gained.
The results for the German economy point to important policy implications. Politics could
enforce programmes to support females to engage in international trade through financial means,
networks and institutional set-ups and regulations. Moreover, it could encourage females by
improving cultural perception of female business activities and females’ role division between
19

work, family and children and within the society. This will also involve to improve child and
family care facilities as well as flexible work conditions. These measures are likely to feed back
positively on the whole economy and on society.
20
References
Becker, G. S. (1957). The Economics of Discrimination, Chicago, University of Chicago Press.
Bernard, A. B., Jensen, J. B. (1999). Exceptional exporter performance: cause, effect, or both?,
Journal of International Economics 47, 1, 1-25.
Bernard, A. B., Wagner, J. (1997). Exports and Success in German Manufacturing, Review of
World Economics, 133, 1, p. 134-157.
Bernard, A. B., Jensen, J.B. (1995). Exporters, Jobs, and Wages in U.S. Manufacturing: 1976-
1987, Brookings Papers: Microeconomics, p. 67-119.
Bertrand, M., Black, S. E., Jensen, S., Lleras-Muney, A. (2019). Breaking the Glass Ceiling? The
Effect of Board Quotas on Female Labour Market Outcomes in Norway, Review of Economic
Studies, 86, 191-239.
Black, S. E., Brainerd, E. (2004). Importing equality? The impact of globalization on gender
discrimination, Industrial and Labor Relations Review 57, 4, 540-559.
Blalock, G., Gertler, P. J. (2004). Learning from exporting revisited in a less developed setting,
Journal of Development Economics 75, 2, p. 397-416.
Blau, F. D., Khan, L. M. (2017). The Gender Wage Gap: Extent, Trends, and Explanations,
Journal of Economic Literature 55, 3, 789-865.
Boler, E. A., Javorcik, B., Ulltveit-Moe, K. H. (2018). Working across time zones: Exporters
and the gender wage gap, Journal of International Economics , 111, 122-133.
Burda, M. C. (2008). What kind of shock was it? Regional integration and structural change
in Germany after unification, Journal of Comparative Economics, 36, 557-567.
Burda, M. C. (2006). Factor reallocation in Eastern Germany after reunification, American
Economic Review Papers and Proceedings, 96, 2, 368-374.
Burda, M. C., Hunt, J. (2001). From reunification to economic integration: productivity and
the labor market in Eastern Germany, Brookings Papers on Economic Activity, 32, 2, 1-92.
Burda, M. C., Severgnini, B. (2018). Total factor productivity convergence in German states
since reunification: Evidence and explanations, Journal of Comparative Economics, 46, 1,
192-211.
Canadian Trade Commissioner (2016). Majority-Female Owned Exporting SMEs in Canada, ,
p. 1-16, https://www.tradecommissioner.gc.ca/businesswomen-femmesdaffaires/2016-MFO-
SMES-PME-EDMF.aspx?lang=eng.
Chiu, B. (2018). Women-run Businesses Aren’t Exporting Enough - But Things Are Changing,
Forbes, https://www.forbes.com/sites/bonniechiu/2018/10/05/female-entrepreneurs-are-going-
global-new-policy-attention-may-close-the-gap.
21
Clerides, S. K., Lach, S., Tybout, J. R. (1998). Is learning by exporting important? Micro-
dynamic evidence from Colombia, Mexico, and Morocco, Quarterly Journal of Economics
113, 3, 903-947.
D’Espallier, B., Guerin, I., Mersland, R. (2011). Women and repayment in Microfinance: A
Global Analysis, World Development, 39, 5, 758-772.
Davies, R. B., Mazhikeyev, A. (2015). The Glass Border: Gender and Exporting in Developing
Countries, UCD working paper, WP15/25.
de Loecker, J. (2007). Do exports generate higher productivity? Evidence from Slovenia, Journal
of International Economics , 73, 69-98.
Ederington, J., Minier, J., Troske, K. R. (2009). Where the Girls Are: Trade and Labor Market
Segregation in Colombia, IZA discussion paper No. 4131.
Finseraas, H., Johnsen, A. A., Kotsadam, A., Torsvik, G. (2016). Exposure to female colleagues
breaks the glass ceiling: Evidence from a combined vignette and field experiment, European
Economic Review, 90, 363-374.
Froman, M. (2019). Unlocking Export Opportunities for Women-Owned Businesses, The United
State of Women, https://www.theunitedstateofwomen.org/blog/unlocking-export-opportunities-
for-women-owned-businesses.
Goldin, C. (2014). A Grand Gender Convergence: Its Last Chapter, American Economic Review,
104, 4, 1091-1119.
Gorodnichenko, Y., Schnitzer, M. (2013). Financial Constraints and Innovation: Why Poor
Countries Don’t Catch Up, Journal of the European Economic Association, 11, 5, 1115-1152.
ITC, International Trade Centre (2015). Unlocking Markets for Women to Trade, Geneva.
International Study Group on Exports and Productivity (2008). Understanding Cross-Country
Differences in Exporter Premia - Comparable Evidence for 14 Countries, Review of World
Economics , 144, 4, 596-635.
Juhn, C., Ujhelyi, G., Villegas-Sanchez, C. (2014). Men, Women, and Machines: How Trade
Impacts Gender Inequality, Journal of Development Economics , 106, 179-193.
Juhn, C., Ujhelyi, G., Villegas-Sanchez, C. (2013). Trade Liberalization and Gender Inequality,
American Economic Review, 103, 3, 269-273.
Kunze, A., Miller, A. R. (2017). Women helping Women? Evidence from private sector data on
workplace hierarchies, Review of Economics and Statistics, 99, 5, 769-775.
Melitz, M. J. (2003). The Impact of Trade on Intra-Industry Reallocations and Aggregate
Industry Productivity, Econometrica, 71, p. 1695-1725.
Pande, R., Ford, D. (2011). Gender quotas and female leadership: A review, Background paper
for the World Development Report on Gender 2012.
22
Pletzer, J. L., Nikolova, R., Kedzior, K. K., Voelpel, S. C. (2015). Does Gender Matter? Female
Respresentation on Corporate Boards and Firm Financial Performance - A Meta-Analysis,
Plos One, doi:10.1371/journal.pone.0130005.
Saure, P., Zoabi, H. (2014). International trade, the gender wage gap and female labor force
participation, Journal of Development Economics, 111, 1723.
Singh, T. (2010). Does International Trade cause Economic Growth? A Survey, World Economy,
33, 11, 1517-1564.
Smeets, V., Warzynski, F. (2010). Learning by Eporting, Importing or Both? Estimating
productivity with multi-product firms, pricing heterogeneity and the role of international
trade, Aarhus Economics Department Working paper 10-13.
van Biesebroeck, J. (2005). Exporting raises productivity in Sub-Saharan African manufacturing
plants, Journal of International Economics 67, 2, 373-391.
Wagner, J. (2018). Active on Many Foreign Markets: A Portrait of German Multi-market
Exporters and Importers from Manufacturing Industries Journal of Economics and Statistics,
238, 2, 157-182.
Wagner, J. (2016). Still different after all these years - Extensive and Intensive Margins of
Exports in East and West German Manufacturing Enterprises, Journal of Economics and
Statistics, 236, 2, p. 297-322.
Wagner, J. (2016 b). Microeconometrics of International Trade, World Scientific Publishing.
Wagner, J. (2014). Credit constraints and exports: a survey of empirical studies using firm-level
data, Industrial and Corporate Change, 23, 6, 1477-1492.
Wagner, J. (2012). Productivity and the extensive margins of trade in German manufacturing
firms: Evidence from a non-parametric test, Economics Bulletin, 32, 4, p. 3061-3070.
World Bank (2017). Doing Business Report 2017, Washington, 14th edition.
World Bank (2015). Women, business, and the law 2016 - Getting to equal, Washington.
World Bank (2013). Opening Doors - Gender Equality and Development in the Middle East
and North Africa, Washington.
WTO, World Trade Organization (2017). Aid for Trade Global Review 2017.
23
Appendix
Table 1: Descriptive Statistics
Variable Mean Std. Dev. p(1) p(99) Obs.
Log productivity 9.6088 0.8437 7.7433 11.9435 19418Female employees share > 50 percent 0.1375 0.3444 0 1 20236Female employees share > 60 percent 0.0886 0.2842 0 1 20236Female firm ownership 0.0485 0.2148 0 1 20236Exporter 0.7253 0.4464 0 1 20236Multi-product 0.5883 0.4922 0 1 20236Foreign ownership 0.2031 0.4023 0 1 20236Log plant size 6.8959 1.3088 3.1781 10.0686 20236Plant older than 5 years 0.9738 0.1599 0 1 20236Log quality certificate 0.7619 2.7167 0 12.3579 20000Log intermediate goods intensity 9.3197 1.9669 5.4071 15.3858 20000Log capital intensity 6.3139 2.1786 0 12.1876 20000East Germany 0.1885 0.3911 0 1 20236
Note: The Table displays descriptive statistics for firm level characteristics in Germany. Data are taken from theGerman Federal Statistical Office and the Offices of the Laender.
24
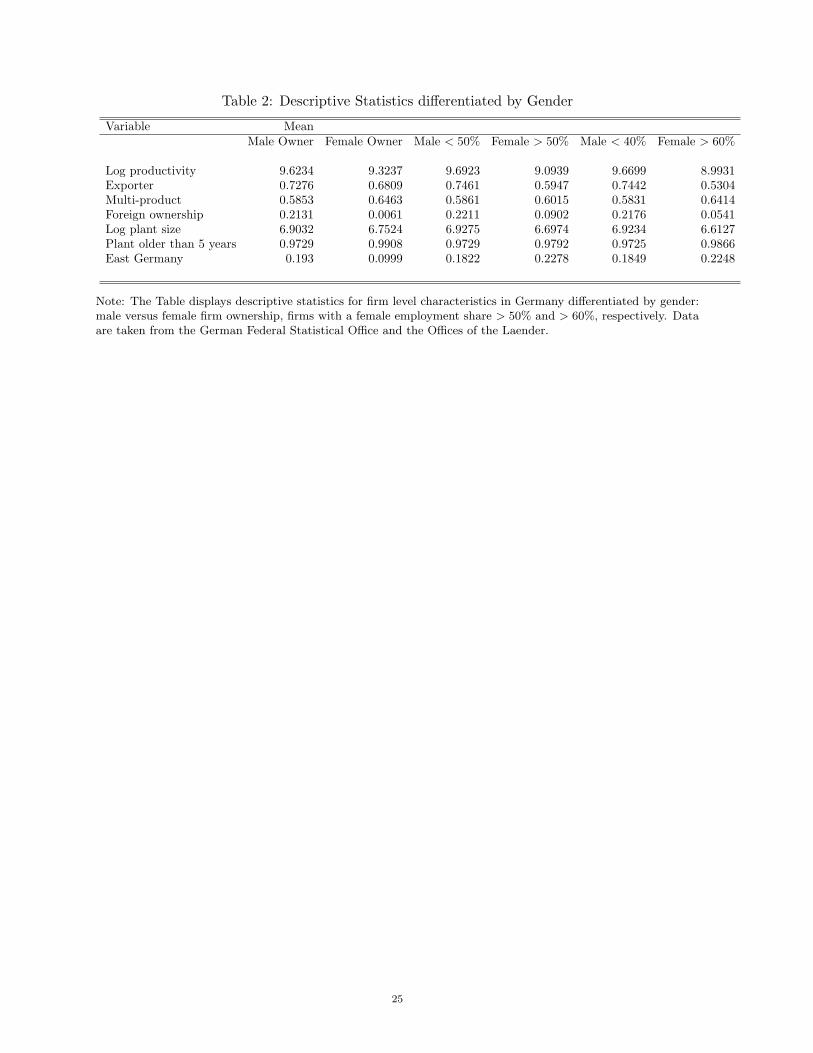
Table 2: Descriptive Statistics differentiated by Gender
Variable MeanMale Owner Female Owner Male < 50% Female > 50% Male < 40% Female > 60%
Log productivity 9.6234 9.3237 9.6923 9.0939 9.6699 8.9931Exporter 0.7276 0.6809 0.7461 0.5947 0.7442 0.5304Multi-product 0.5853 0.6463 0.5861 0.6015 0.5831 0.6414Foreign ownership 0.2131 0.0061 0.2211 0.0902 0.2176 0.0541Log plant size 6.9032 6.7524 6.9275 6.6974 6.9234 6.6127Plant older than 5 years 0.9729 0.9908 0.9729 0.9792 0.9725 0.9866East Germany 0.193 0.0999 0.1822 0.2278 0.1849 0.2248
Note: The Table displays descriptive statistics for firm level characteristics in Germany differentiated by gender:male versus female firm ownership, firms with a female employment share > 50% and > 60%, respectively. Dataare taken from the German Federal Statistical Office and the Offices of the Laender.
25
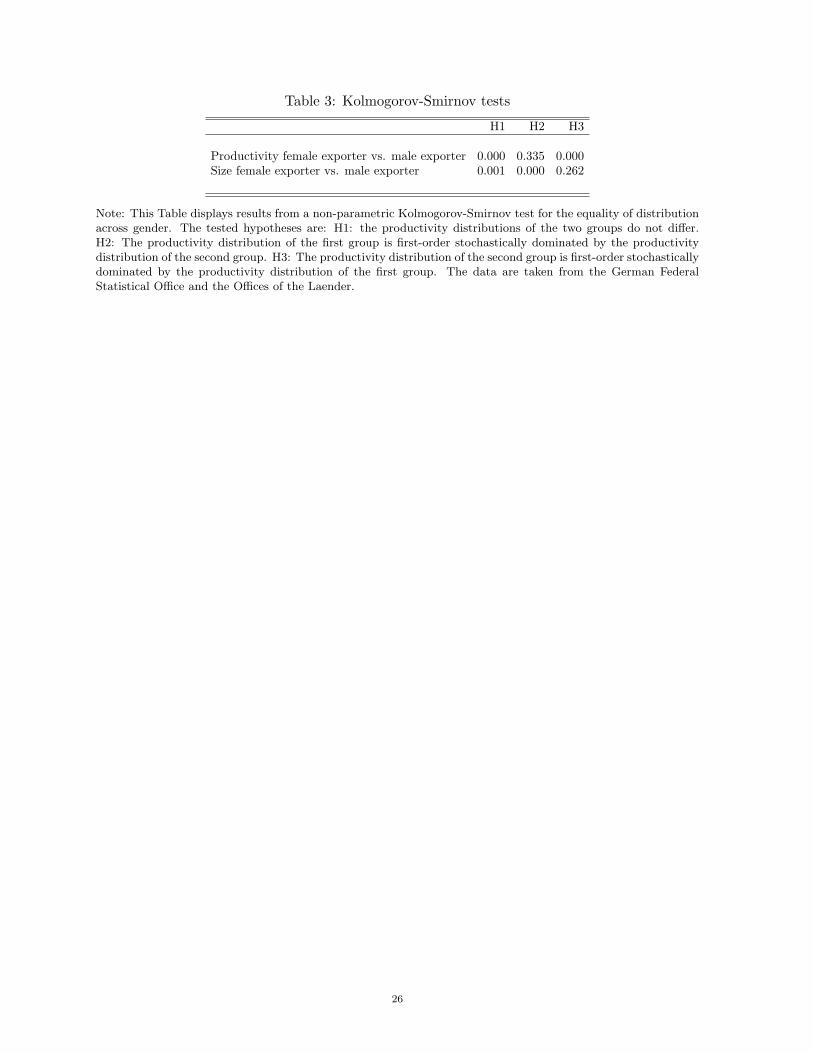
Table 3: Kolmogorov-Smirnov tests
H1 H2 H3
Productivity female exporter vs. male exporter 0.000 0.335 0.000Size female exporter vs. male exporter 0.001 0.000 0.262
Note: This Table displays results from a non-parametric Kolmogorov-Smirnov test for the equality of distributionacross gender. The tested hypotheses are: H1: the productivity distributions of the two groups do not differ.H2: The productivity distribution of the first group is first-order stochastically dominated by the productivitydistribution of the second group. H3: The productivity distribution of the second group is first-order stochasticallydominated by the productivity distribution of the first group. The data are taken from the German FederalStatistical Office and the Offices of the Laender.
26
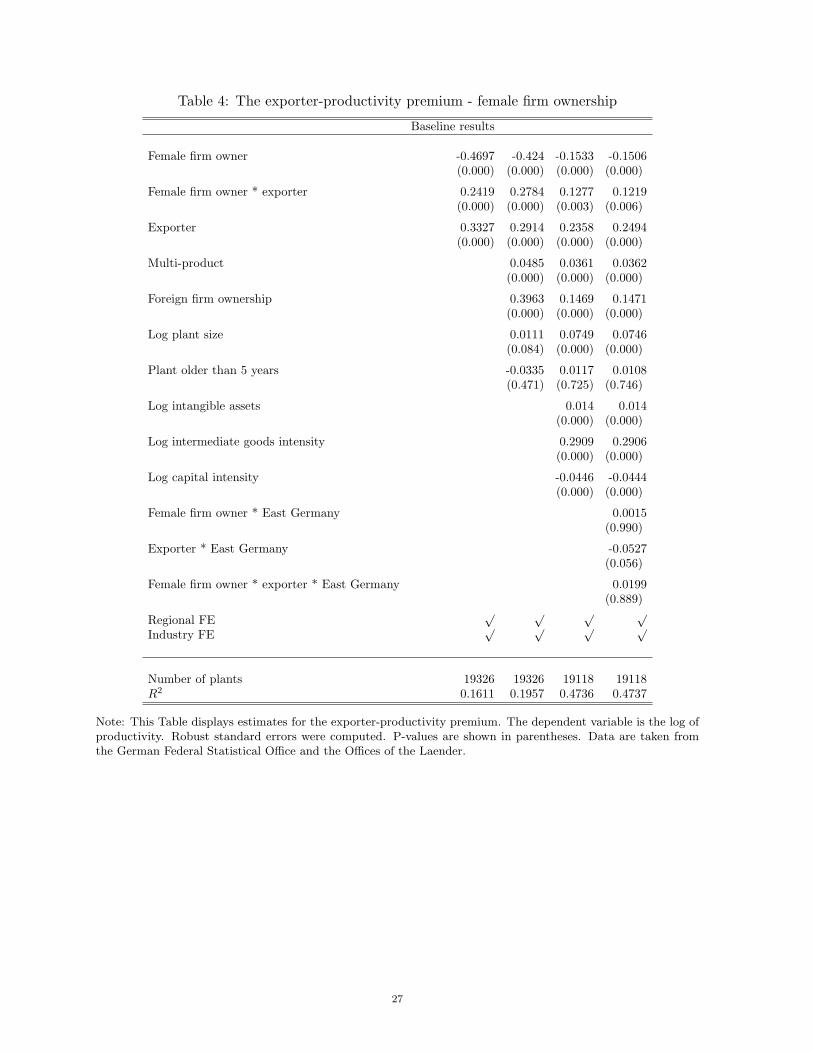
Table 4: The exporter-productivity premium - female firm ownership
Baseline results
Female firm owner -0.4697 -0.424 -0.1533 -0.1506(0.000) (0.000) (0.000) (0.000)
Female firm owner * exporter 0.2419 0.2784 0.1277 0.1219(0.000) (0.000) (0.003) (0.006)
Exporter 0.3327 0.2914 0.2358 0.2494(0.000) (0.000) (0.000) (0.000)
Multi-product 0.0485 0.0361 0.0362(0.000) (0.000) (0.000)
Foreign firm ownership 0.3963 0.1469 0.1471(0.000) (0.000) (0.000)
Log plant size 0.0111 0.0749 0.0746(0.084) (0.000) (0.000)
Plant older than 5 years -0.0335 0.0117 0.0108(0.471) (0.725) (0.746)
Log intangible assets 0.014 0.014(0.000) (0.000)
Log intermediate goods intensity 0.2909 0.2906(0.000) (0.000)
Log capital intensity -0.0446 -0.0444(0.000) (0.000)
Female firm owner * East Germany 0.0015(0.990)
Exporter * East Germany -0.0527(0.056)
Female firm owner * exporter * East Germany 0.0199(0.889)
Regional FE√ √ √ √
Industry FE√ √ √ √
Number of plants 19326 19326 19118 19118R2 0.1611 0.1957 0.4736 0.4737
Note: This Table displays estimates for the exporter-productivity premium. The dependent variable is the log ofproductivity. Robust standard errors were computed. P-values are shown in parentheses. Data are taken fromthe German Federal Statistical Office and the Offices of the Laender.
27

Table 5: The Exporter-productivity premium - female employee share > 50%
Baseline results
Female employee share > 50% -0.9996 -0.9647 -0.4922 -0.4963(0.000) (0.000) (0.000) (0.000)
Female employee share > 50% * exporter 0.4416 0.4553 0.2257 0.2382(0.000) (0.000) (0.000) (0.000)
Exporter 0.2101 0.1776 0.1807 0.1910(0.000) (0.000) (0.000) (0.000)
Multi-product 0.0421 0.0338 0.0340(0.000) (0.000) (0.000)
Foreign firm ownership 0.3689 0.1448 0.1451(0.000) (0.000) (0.000)
Log plant size 0.0059 0.0683 0.0682(0.346) (0.000) (0.000)
Plant older than 5 years -0.0104 0.0209 0.0201(0.819) (0.526) (0.541)
Log intangible assets 0.0133 0.0132(0.000) (0.000)
Log intermediate goods intensity 0.2763 0.2760(0.000) (0.000)
Log capital intensity -0.044 -0.0437(0.000) (0.000)
Female employee share > 50% * East Germany 0.0159(0.764)
Exporter * East Germany -0.0398(0.181)
Female employee share > 50% * exporter * East Germany -0.0530(0.411)
Regional FE√ √ √ √
Industry FE√ √ √ √
Number of plants 19326 19326 19118 19118R2 0.2218 0.2512 0.4882 0.4883
Note: This Table displays estimates for the exporter-productivity premium. The dependent variable is the log ofproductivity. Robust standard errors were computed. P-values are shown in parentheses. Data are taken fromthe German Federal Statistical Office and the Offices of the Laender.
28
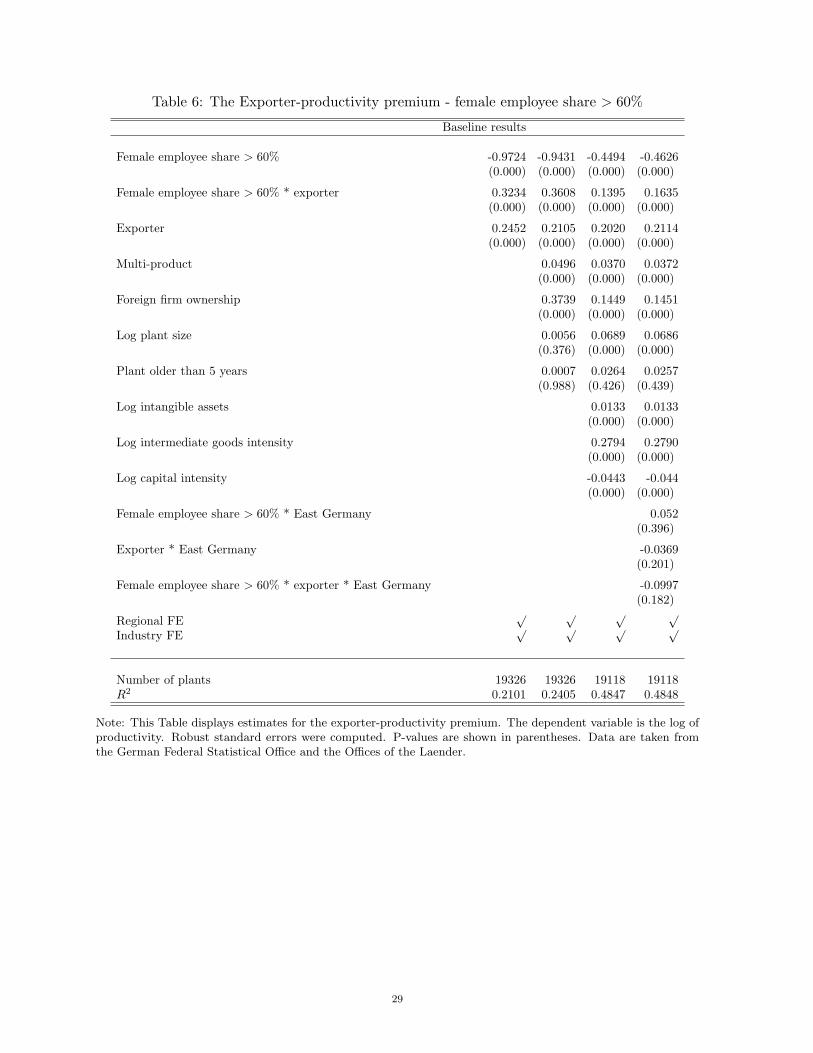
Table 6: The Exporter-productivity premium - female employee share > 60%
Baseline results
Female employee share > 60% -0.9724 -0.9431 -0.4494 -0.4626(0.000) (0.000) (0.000) (0.000)
Female employee share > 60% * exporter 0.3234 0.3608 0.1395 0.1635(0.000) (0.000) (0.000) (0.000)
Exporter 0.2452 0.2105 0.2020 0.2114(0.000) (0.000) (0.000) (0.000)
Multi-product 0.0496 0.0370 0.0372(0.000) (0.000) (0.000)
Foreign firm ownership 0.3739 0.1449 0.1451(0.000) (0.000) (0.000)
Log plant size 0.0056 0.0689 0.0686(0.376) (0.000) (0.000)
Plant older than 5 years 0.0007 0.0264 0.0257(0.988) (0.426) (0.439)
Log intangible assets 0.0133 0.0133(0.000) (0.000)
Log intermediate goods intensity 0.2794 0.2790(0.000) (0.000)
Log capital intensity -0.0443 -0.044(0.000) (0.000)
Female employee share > 60% * East Germany 0.052(0.396)
Exporter * East Germany -0.0369(0.201)
Female employee share > 60% * exporter * East Germany -0.0997(0.182)
Regional FE√ √ √ √
Industry FE√ √ √ √
Number of plants 19326 19326 19118 19118R2 0.2101 0.2405 0.4847 0.4848
Note: This Table displays estimates for the exporter-productivity premium. The dependent variable is the log ofproductivity. Robust standard errors were computed. P-values are shown in parentheses. Data are taken fromthe German Federal Statistical Office and the Offices of the Laender.
29
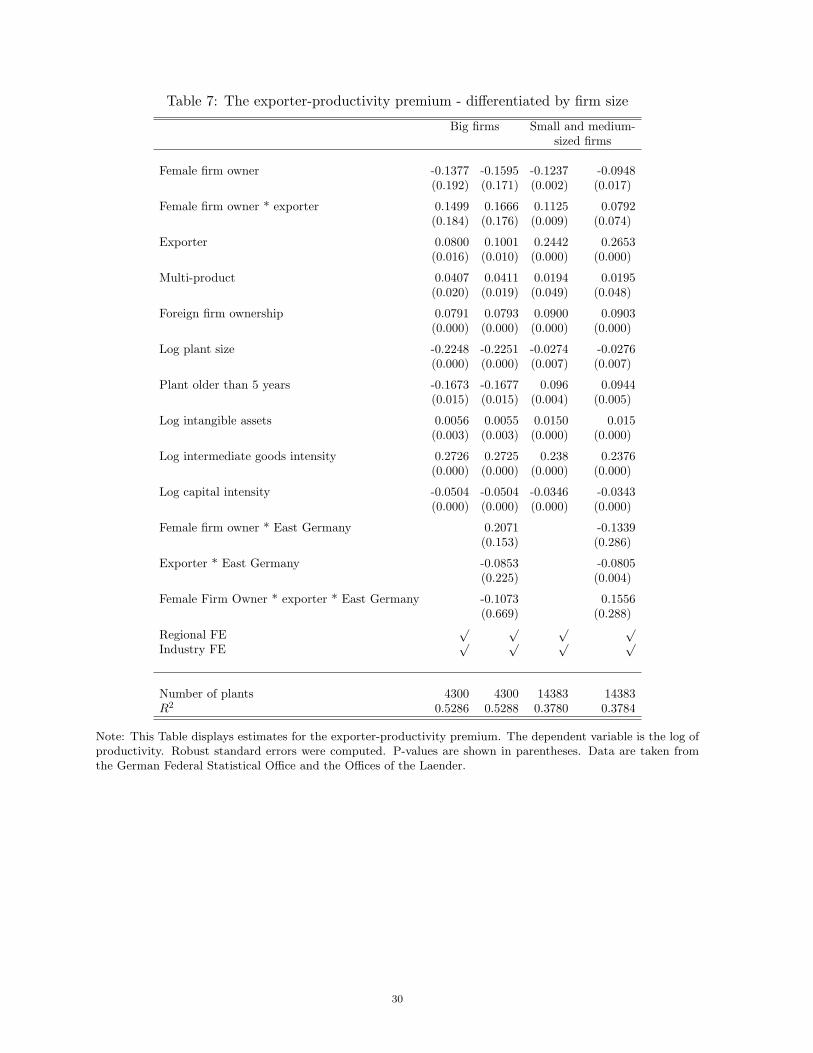
Table 7: The exporter-productivity premium - differentiated by firm size
Big firms Small and medium-sized firms
Female firm owner -0.1377 -0.1595 -0.1237 -0.0948(0.192) (0.171) (0.002) (0.017)
Female firm owner * exporter 0.1499 0.1666 0.1125 0.0792(0.184) (0.176) (0.009) (0.074)
Exporter 0.0800 0.1001 0.2442 0.2653(0.016) (0.010) (0.000) (0.000)
Multi-product 0.0407 0.0411 0.0194 0.0195(0.020) (0.019) (0.049) (0.048)
Foreign firm ownership 0.0791 0.0793 0.0900 0.0903(0.000) (0.000) (0.000) (0.000)
Log plant size -0.2248 -0.2251 -0.0274 -0.0276(0.000) (0.000) (0.007) (0.007)
Plant older than 5 years -0.1673 -0.1677 0.096 0.0944(0.015) (0.015) (0.004) (0.005)
Log intangible assets 0.0056 0.0055 0.0150 0.015(0.003) (0.003) (0.000) (0.000)
Log intermediate goods intensity 0.2726 0.2725 0.238 0.2376(0.000) (0.000) (0.000) (0.000)
Log capital intensity -0.0504 -0.0504 -0.0346 -0.0343(0.000) (0.000) (0.000) (0.000)
Female firm owner * East Germany 0.2071 -0.1339(0.153) (0.286)
Exporter * East Germany -0.0853 -0.0805(0.225) (0.004)
Female Firm Owner * exporter * East Germany -0.1073 0.1556(0.669) (0.288)
Regional FE√ √ √ √
Industry FE√ √ √ √
Number of plants 4300 4300 14383 14383R2 0.5286 0.5288 0.3780 0.3784
Note: This Table displays estimates for the exporter-productivity premium. The dependent variable is the log ofproductivity. Robust standard errors were computed. P-values are shown in parentheses. Data are taken fromthe German Federal Statistical Office and the Offices of the Laender.
30

Table 8: The extensive margin of trade
Female firm owner -3.9832(0.000)
Female firm owner * log productivity 0.4438(0.000)
Female employee share > 50% -4.2056(0.000)
Female employee share > 50% * log productivity 0.4218(0.000)
Female employee share > 60% -2.5761(0.002)
Female employee share > 60% * log productivity 0.2223(0.018)
Log productivity 0.5992 0.5158 0.5500(0.000) (0.000) (0.000)
Female firm owner * East Germany -0.4899(0.060)
Female employee share > 50% * East Germany 0.2673(0.027)
Female employee share > 60% * East Germany 0.2921(0.037)
Multi-product 0.0781 0.0706 0.0776(0.064) (0.096) (0.067)
Foreign firm ownership 0.1863 0.1904 0.1823(0.001) (0.001) (0.002)
Log plant size 0.6439 0.6303 0.6304(0.000) (0.000) (0.000)
Plant older than 5 years 0.2097 0.2177 0.2417(0.087) (0.076) (0.049)
Log intangible assets 0.0635 0.0631 0.0631(0.000) (0.000) (0.000)
Log intermediate goods intensity -0.0047 -0.0094 -0.0123(0.819) (0.647) (0.549)
Log capital intensity -0.0443 -0.0449 -0.0459(0.005) (0.005) (0.004)
Regional FE√ √ √
Industry FE√ √ √
Number of plants 19118 19118 19118PseudoR2 0.2394 0.2416 0.2415
Note: This Table displays estimates for the extensive margin of trade. The dependent variable is a dummyvariable for export status. Robust standard errors were computed. P-values are shown in parentheses. Data aretaken from the German Federal Statistical Office and the Offices of the Laender.
31
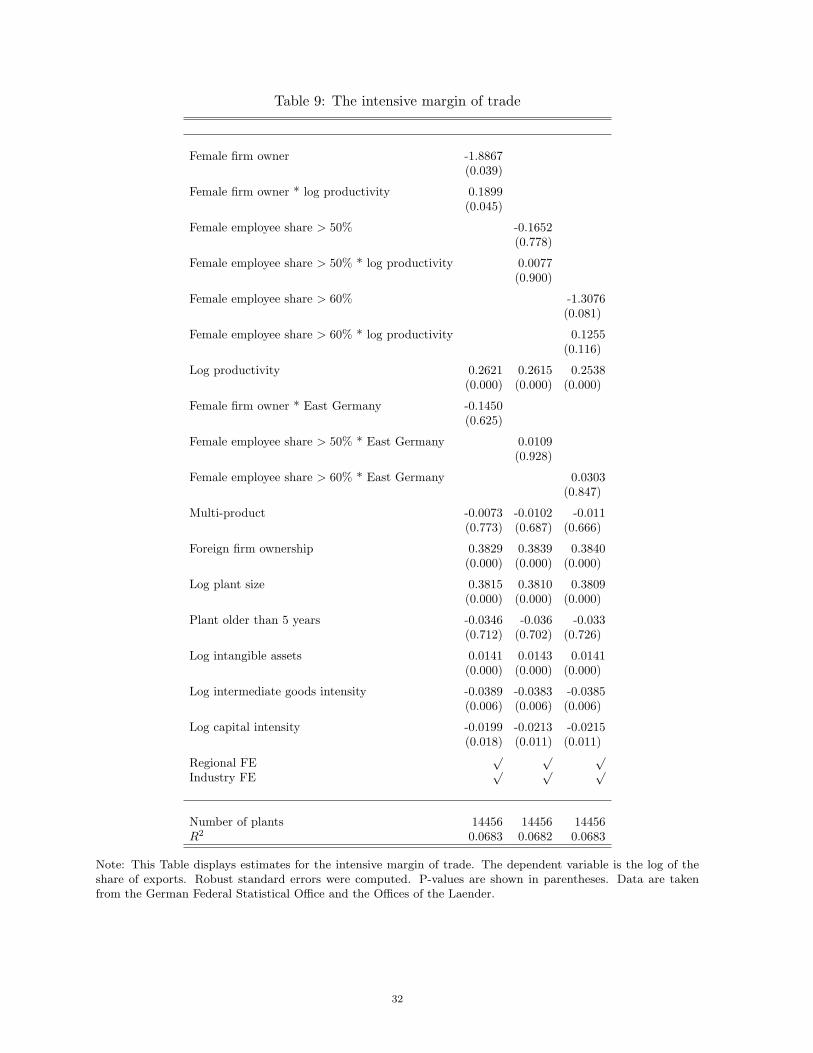
Table 9: The intensive margin of trade
Female firm owner -1.8867(0.039)
Female firm owner * log productivity 0.1899(0.045)
Female employee share > 50% -0.1652(0.778)
Female employee share > 50% * log productivity 0.0077(0.900)
Female employee share > 60% -1.3076(0.081)
Female employee share > 60% * log productivity 0.1255(0.116)
Log productivity 0.2621 0.2615 0.2538(0.000) (0.000) (0.000)
Female firm owner * East Germany -0.1450(0.625)
Female employee share > 50% * East Germany 0.0109(0.928)
Female employee share > 60% * East Germany 0.0303(0.847)
Multi-product -0.0073 -0.0102 -0.011(0.773) (0.687) (0.666)
Foreign firm ownership 0.3829 0.3839 0.3840(0.000) (0.000) (0.000)
Log plant size 0.3815 0.3810 0.3809(0.000) (0.000) (0.000)
Plant older than 5 years -0.0346 -0.036 -0.033(0.712) (0.702) (0.726)
Log intangible assets 0.0141 0.0143 0.0141(0.000) (0.000) (0.000)
Log intermediate goods intensity -0.0389 -0.0383 -0.0385(0.006) (0.006) (0.006)
Log capital intensity -0.0199 -0.0213 -0.0215(0.018) (0.011) (0.011)
Regional FE√ √ √
Industry FE√ √ √
Number of plants 14456 14456 14456R2 0.0683 0.0682 0.0683
Note: This Table displays estimates for the intensive margin of trade. The dependent variable is the log of theshare of exports. Robust standard errors were computed. P-values are shown in parentheses. Data are takenfrom the German Federal Statistical Office and the Offices of the Laender.
32
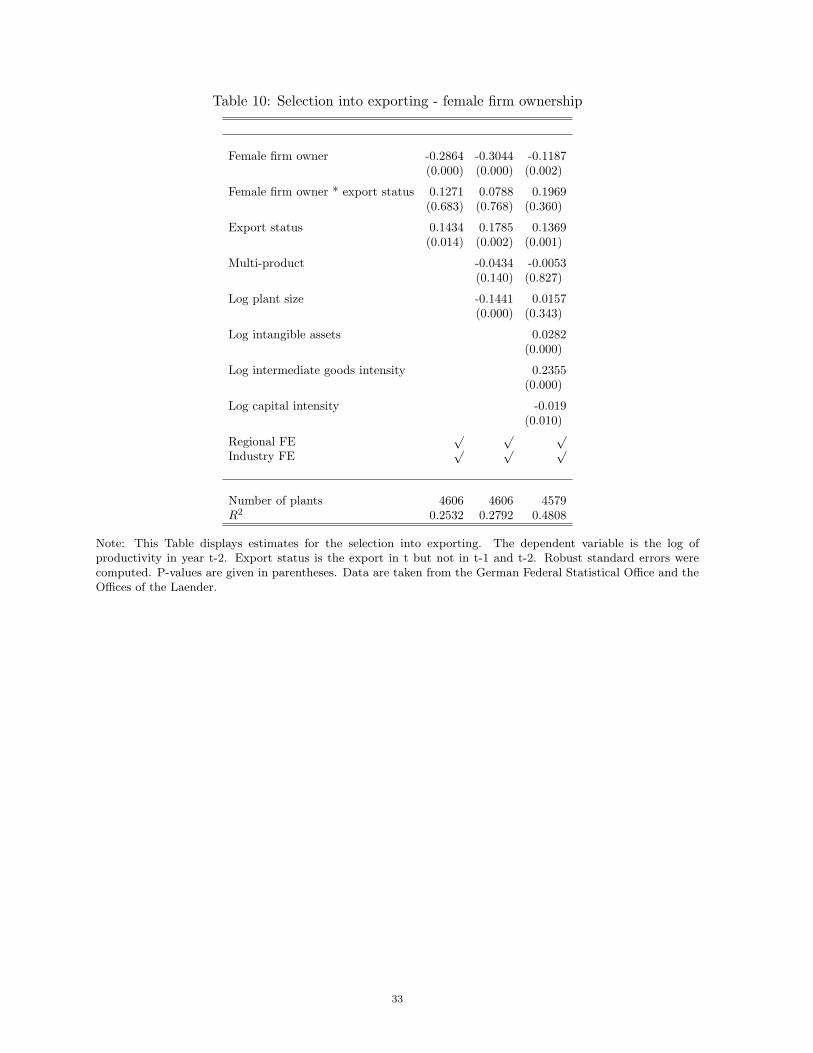
Table 10: Selection into exporting - female firm ownership
Female firm owner -0.2864 -0.3044 -0.1187(0.000) (0.000) (0.002)
Female firm owner * export status 0.1271 0.0788 0.1969(0.683) (0.768) (0.360)
Export status 0.1434 0.1785 0.1369(0.014) (0.002) (0.001)
Multi-product -0.0434 -0.0053(0.140) (0.827)
Log plant size -0.1441 0.0157(0.000) (0.343)
Log intangible assets 0.0282(0.000)
Log intermediate goods intensity 0.2355(0.000)
Log capital intensity -0.019(0.010)
Regional FE√ √ √
Industry FE√ √ √
Number of plants 4606 4606 4579R2 0.2532 0.2792 0.4808
Note: This Table displays estimates for the selection into exporting. The dependent variable is the log ofproductivity in year t-2. Export status is the export in t but not in t-1 and t-2. Robust standard errors werecomputed. P-values are given in parentheses. Data are taken from the German Federal Statistical Office and theOffices of the Laender.
33
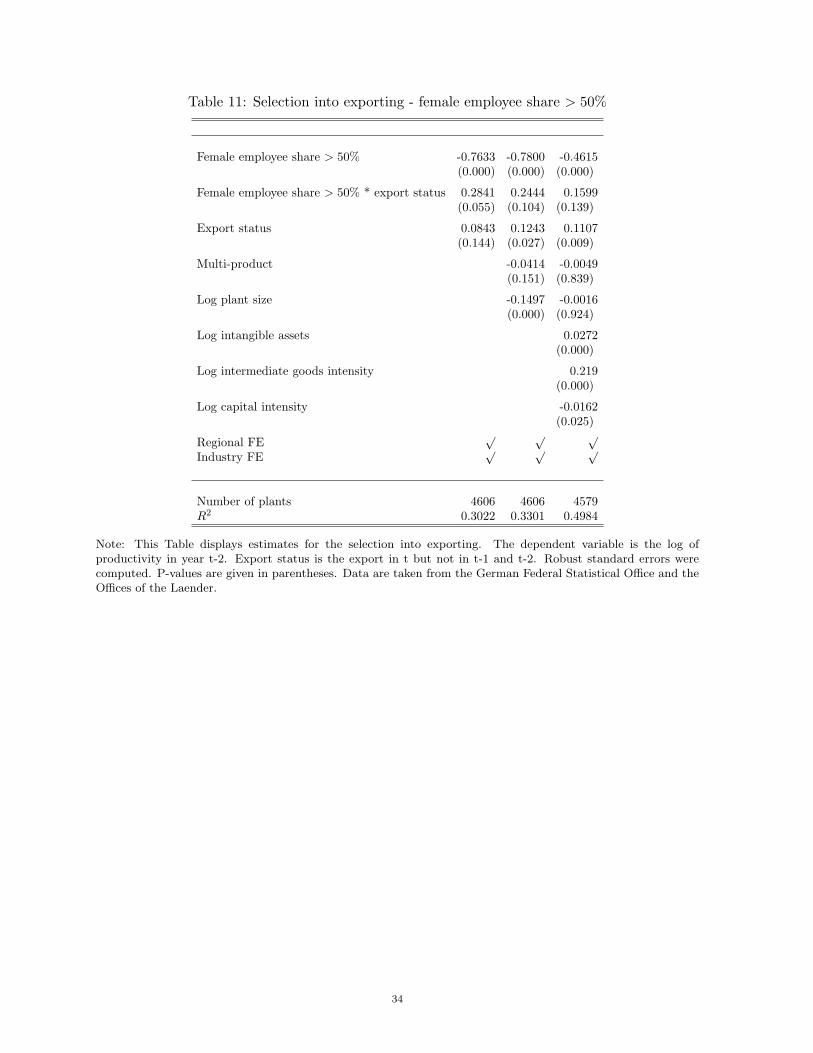
Table 11: Selection into exporting - female employee share > 50%
Female employee share > 50% -0.7633 -0.7800 -0.4615(0.000) (0.000) (0.000)
Female employee share > 50% * export status 0.2841 0.2444 0.1599(0.055) (0.104) (0.139)
Export status 0.0843 0.1243 0.1107(0.144) (0.027) (0.009)
Multi-product -0.0414 -0.0049(0.151) (0.839)
Log plant size -0.1497 -0.0016(0.000) (0.924)
Log intangible assets 0.0272(0.000)
Log intermediate goods intensity 0.219(0.000)
Log capital intensity -0.0162(0.025)
Regional FE√ √ √
Industry FE√ √ √
Number of plants 4606 4606 4579R2 0.3022 0.3301 0.4984
Note: This Table displays estimates for the selection into exporting. The dependent variable is the log ofproductivity in year t-2. Export status is the export in t but not in t-1 and t-2. Robust standard errors werecomputed. P-values are given in parentheses. Data are taken from the German Federal Statistical Office and theOffices of the Laender.
34

Table 12: Selection into exporting - female employee share > 60%
Female employee share > 60% -0.755 -0.7651 -0.4469(0.000) (0.000) (0.000)
Female employee share > 60% * export status 0.3817 0.3241 0.1927(0.042) (0.094) (0.149)
Export status 0.0921 0.1331 0.1178(0.103) (0.016) (0.004)
Multi-product -0.0195 0.0080(0.497) (0.738)
Log plant size -0.1483 0.0037(0.000) (0.824)
Log intangible assets 0.0272(0.000)
Log intermediate goods intensity 0.2209(0.000)
Log capital intensity -0.0162(0.026)
Regional FE√ √ √
Industry FE√ √ √
Number of plants 4606 4606 4579R2 0.2967 0.3234 0.4958
Note: This Table displays estimates for the selection into exporting. The dependent variable is the log ofproductivity in year t-2. Export status is the export in t but not in t-1 and t-2. Robust standard errors werecomputed. P-values are given in parentheses. Data are taken from the German Federal Statistical Office and theOffices of the Laender.
35
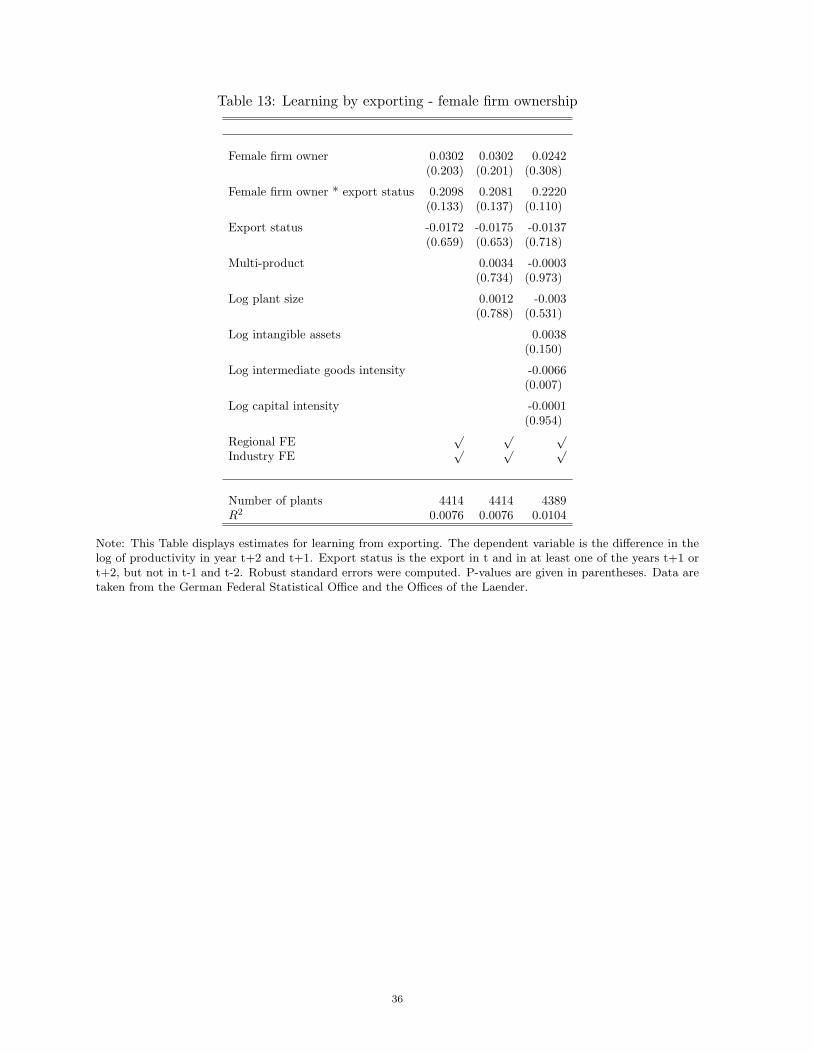
Table 13: Learning by exporting - female firm ownership
Female firm owner 0.0302 0.0302 0.0242(0.203) (0.201) (0.308)
Female firm owner * export status 0.2098 0.2081 0.2220(0.133) (0.137) (0.110)
Export status -0.0172 -0.0175 -0.0137(0.659) (0.653) (0.718)
Multi-product 0.0034 -0.0003(0.734) (0.973)
Log plant size 0.0012 -0.003(0.788) (0.531)
Log intangible assets 0.0038(0.150)
Log intermediate goods intensity -0.0066(0.007)
Log capital intensity -0.0001(0.954)
Regional FE√ √ √
Industry FE√ √ √
Number of plants 4414 4414 4389R2 0.0076 0.0076 0.0104
Note: This Table displays estimates for learning from exporting. The dependent variable is the difference in thelog of productivity in year t+2 and t+1. Export status is the export in t and in at least one of the years t+1 ort+2, but not in t-1 and t-2. Robust standard errors were computed. P-values are given in parentheses. Data aretaken from the German Federal Statistical Office and the Offices of the Laender.
36

Table 14: Learning by exporting - female employee share > 50%
Female employee share > 50% 0.0337 0.0338 0.0263(0.004) (0.003) (0.031)
Female employee share > 50% * export status 0.0082 0.0084 0.0035(0.934) (0.933) (0.972)
Export -0.0043 -0.0047 -0.0007(0.918) (0.909) (0.985)
Multi-product 0.0040 0.0003(0.686) (0.978)
Log plant size 0.0013 -0.0024(0.775) (0.610)
Log intangible assets 0.0038(0.148)
Log intermediate goods intensity -0.0059(0.020)
Log capital intensity -0.0002(0.939)
Regional FE√ √ √
Industry FE√ √ √
Number of plants 4414 4414 4389R2 0.0079 0.0079 0.0104
Note: This Table displays estimates for learning from exporting. The dependent variable is the difference in thelog of productivity in year t+2 and t+1. Export status is the export in t and in at least one of the years t+1 ort+2, but not in t-1 and t-2. Robust standard errors were computed. P-values are given in parentheses. Data aretaken from the German Federal Statistical Office and the Offices of the Laender.
37
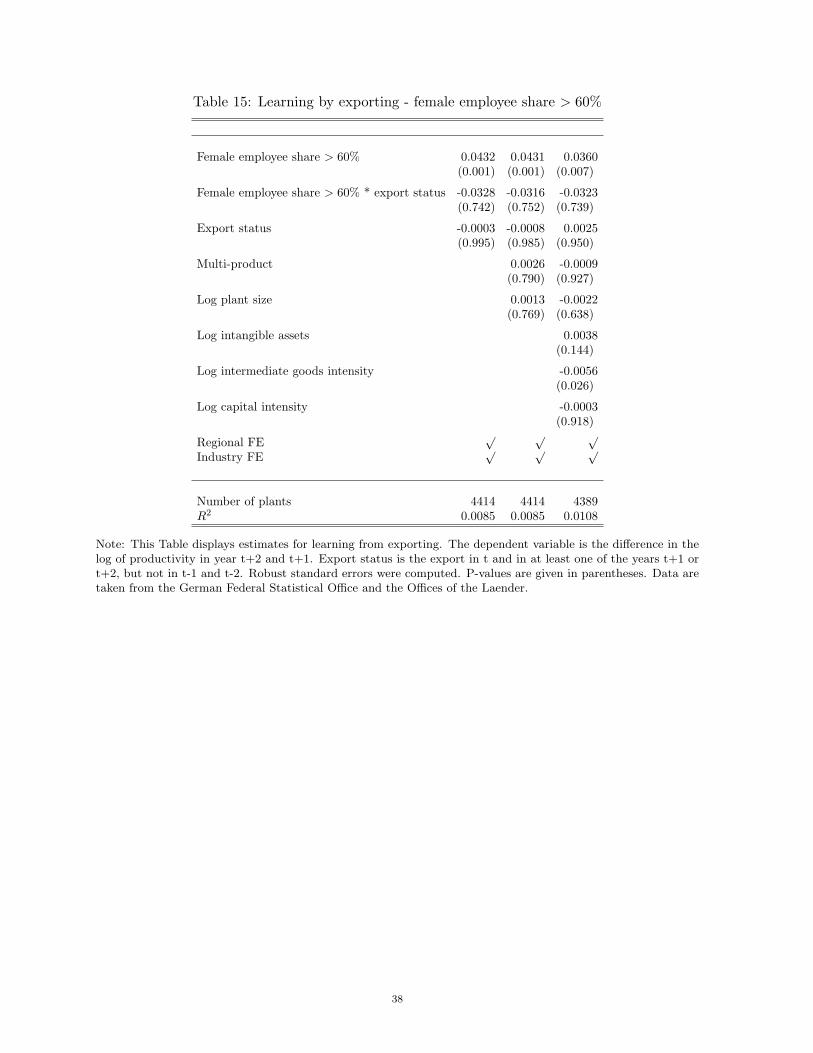
Table 15: Learning by exporting - female employee share > 60%
Female employee share > 60% 0.0432 0.0431 0.0360(0.001) (0.001) (0.007)
Female employee share > 60% * export status -0.0328 -0.0316 -0.0323(0.742) (0.752) (0.739)
Export status -0.0003 -0.0008 0.0025(0.995) (0.985) (0.950)
Multi-product 0.0026 -0.0009(0.790) (0.927)
Log plant size 0.0013 -0.0022(0.769) (0.638)
Log intangible assets 0.0038(0.144)
Log intermediate goods intensity -0.0056(0.026)
Log capital intensity -0.0003(0.918)
Regional FE√ √ √
Industry FE√ √ √
Number of plants 4414 4414 4389R2 0.0085 0.0085 0.0108
Note: This Table displays estimates for learning from exporting. The dependent variable is the difference in thelog of productivity in year t+2 and t+1. Export status is the export in t and in at least one of the years t+1 ort+2, but not in t-1 and t-2. Robust standard errors were computed. P-values are given in parentheses. Data aretaken from the German Federal Statistical Office and the Offices of the Laender.
38