Embed Size (px)
Citation preview
Atmos. Chem. Phys., 17, 595–613, 2017www.atmos-chem-phys.net/17/595/2017/doi:10.5194/acp-17-595-2017© Author(s) 2017. CC Attribution 3.0 License.
The G4Foam Experiment: global climate impacts of regionalocean albedo modificationCorey J. Gabriel1, Alan Robock1, Lili Xia1, Brian Zambri1, and Ben Kravitz2
1Department of Environmental Sciences, Rutgers University, New Brunswick, NJ, USA2Atmospheric Sciences and Global Change Division, Pacific Northwest National Laboratory, Richland, Washington, USA
Correspondence to: Corey J. Gabriel ([email protected])
Received: 29 September 2016 – Published in Atmos. Chem. Phys. Discuss.: 5 October 2016Revised: 1 December 2016 – Accepted: 22 December 2016 – Published: 12 January 2017
Abstract. Reducing insolation has been proposed as a geo-engineering response to global warming. Here we presentthe results of climate model simulations of a unique Geo-engineering Model Intercomparison Project Testbed experi-ment to investigate the benefits and risks of a scheme thatwould brighten certain oceanic regions. The National Centerfor Atmospheric Research CESM CAM4-Chem global cli-mate model was modified to simulate a scheme in which thealbedo of the ocean surface is increased over the subtropicalocean gyres in the Southern Hemisphere. In theory, this couldbe accomplished using a stable, nondispersive foam, com-prised of tiny, highly reflective microbubbles. Such a foamhas been developed under idealized conditions, although de-ployment at a large scale is presently infeasible. We con-ducted three ensemble members of a simulation (G4Foam)from 2020 through to 2069 in which the albedo of the oceansurface is set to 0.15 (an increase of 150 %) over the threesubtropical ocean gyres in the Southern Hemisphere, againsta background of the RCP6.0 (representative concentrationpathway resulting in +6 W m−2 radiative forcing by 2100)scenario. After 2069, geoengineering is ceased, and the sim-ulation is run for an additional 20 years. Global mean surfacetemperature in G4Foam is 0.6 K lower than RCP6.0, withstatistically significant cooling relative to RCP6.0 south of30◦ N. There is an increase in rainfall over land, most pro-nouncedly in the tropics during the June–July–August sea-son, relative to both G4SSA (specified stratospheric aerosols)and RCP6.0. Heavily populated and highly cultivated regionsthroughout the tropics, including the Sahel, southern Asia,the Maritime Continent, Central America, and much of theAmazon experience a statistically significant increase in pre-cipitation minus evaporation. The temperature response to
the relatively modest global average forcing of −1.5 W m−2
is amplified through a series of positive cloud feedbacks, inwhich more shortwave radiation is reflected. The precipita-tion response is primarily the result of the intensification ofthe southern Hadley cell, as its mean position migrates north-ward and away from the Equator in response to the asymmet-ric cooling.
1 Introduction
1.1 Background
The current rate of increase in global mean surface temper-ature is unprecedented in the last 1000 years (Marcott etal., 2013). The atmospheric concentration of CO2 is highernow than at any time in the last 650 000 years (Siegen-thaler et al., 2005). It is extremely likely that the warmingsince 1950 is primarily the result of anthropogenic emissionof heat-trapping gases rather than natural climate variabil-ity (IPCC, 2013). Motivated by insufficient progress in set-ting and achieving mitigation targets, solar radiation man-agement (SRM) has been proposed as a method of reduc-ing global mean temperature, thereby ameliorating manyof the negative effects of global warming (Crutzen, 2006).The most discussed SRM approach involves injection of sul-fur dioxide (SO2) into the tropical stratosphere. Other sug-gested SRM geoengineering methods include marine cloudbrightening (Jones et al., 2009; Rasch et al., 2009; Lathamet al., 2012) and surface albedo modification (Irvine et al.,2011; Cvijanovic et al., 2015; Mengis et al., 2016). Each ofthese methods has the potential to cool Earth’s surface, but
Published by Copernicus Publications on behalf of the European Geosciences Union.
596 C. J. Gabriel et al.: The G4Foam Experiment: global climate impacts
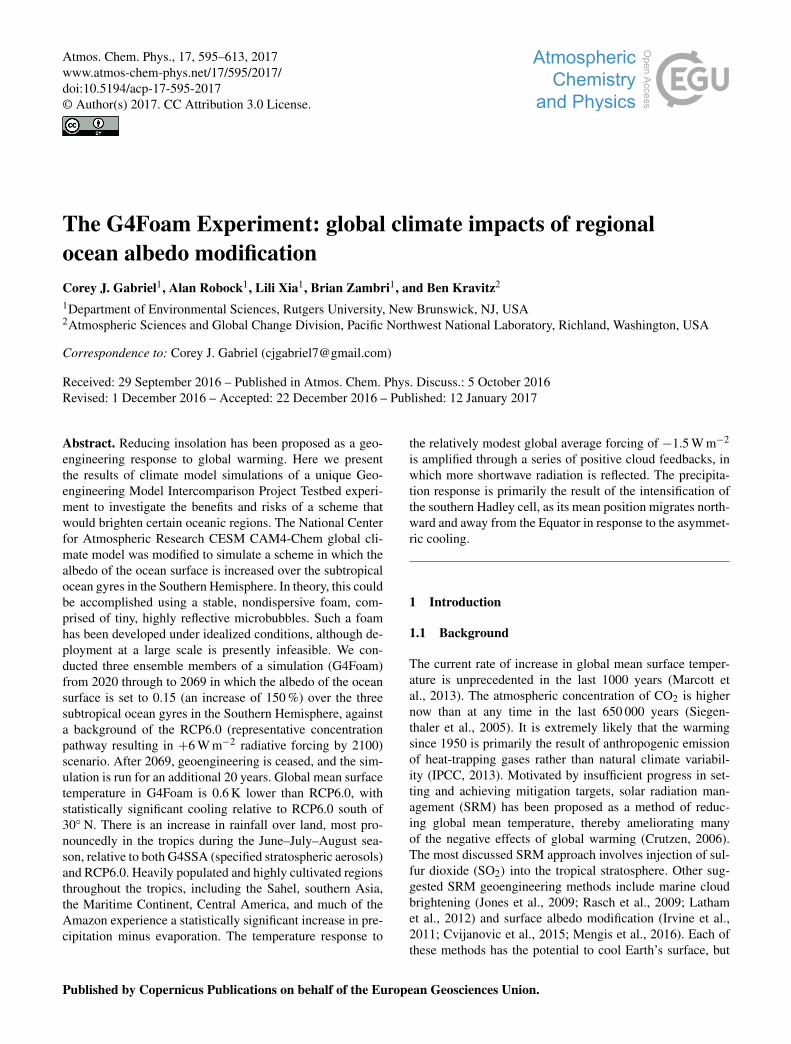
Figure 1. Applied forcing and global mean temperature response. Ocean albedo changed from a daily average of 0.06, which includes avery small daily cycle, to a fixed value of 0.15 with no daily cycle, over “foam regions”, 20◦ N–20◦ S, 90–170◦W (South Pacific Ocean),20◦ N–20◦ S, 30◦W–0◦ E (South Atlantic Ocean) and 20◦ N–20◦ S, 55–105◦ E (South Indian Ocean). Each foamed region is outlined inblack. Control-run sea-level pressure (mb) is shown with contours and 10 m winds (m s−1) are shaded.
each comes with known potential side effects. For example,Robock (2008, 2014, 2016) enumerated and described spe-cific risks and benefits of stratospheric geoengineering.
Here we present a Geoengineering Model intercomparisonProject (GeoMIP) Testbed experiment (Kravitz et al., 2011,2015), consisting of the novel implementation of an oceansurface albedo modification scheme in a climate model,which simulates the placement of a reflective foam, con-sisting of microbubbles, on the ocean surface. RCP6.0 andG4SSA are run with an ocean surface albedo with a verysmall diurnal cycle, and the daily average albedo is veryclose to 0.06. In our experiment, the albedo of the oceansurface is raised from this daily mean of 0.06 to a constantvalue of 0.15, with no daily cycle, over the subtropical oceangyres in the Southern Hemisphere, specifically 20◦ N–20◦ S,90–170◦W (South Pacific Ocean), 20◦ N–20◦ S, 30◦W–0◦ E(South Atlantic Ocean) and 20◦ N–20◦ S, 55–105◦ E (SouthIndian Ocean; Fig. 1). Everywhere else, ocean surface albedoin G4Foam is calculated in the same way as in RCP6.0 andG4SSA. It is possible that the absence of a small daily cy-cle in albedo would result in a slightly different surface en-ergy budget than would occur if the foamed regions exhibitedvariations in albedo. However, the foamed regions’ albedoswould likely fluctuate as a function of many things, includ-ing some movement of the foam itself, foam interaction with
precipitation or aerosols, wind speed, and sun angle. Furtherstudy of the properties of the foam, including in ocean waterwith some turbulence, could provide information that wouldallow future modeling of the foam to include albedo fluctua-tions. This is the G4Foam experiment, which simulates a par-ticular implementation of an idealized form of the technologydescribed by Aziz et al. (2014), where stable reflective foam,suitable for use as SRM in ocean regions with limited nutri-ents that support little marine life, is made in the laboratory.
The broad idea of microbubble deployment as a form ofSRM is explored by Seitz (2010). Here we only examinethe potential benefits and risks of such a scheme, and do notadvocate deployment of any form of geoengineering regard-less of its present feasibility. Robock (2011) has cautionedagainst the potential implications of ocean albedo modifica-tion as presented by Seitz (2010).
Stratospheric sulfate injection (SSI) is the most discussedform of geoengineering and, given the current state of re-search, the most feasible (Dykema et al., 2014; Keith et al.,2014). Implementation of the G4Foam regional ocean albedomodification scheme could be considered with or withoutconcurrent SSI. G4Foam could be used as a potential SSIconcurrent scheme aimed at correcting possible adverse im-pacts on the hydrological cycle brought about by ongoingSSI. G4Foam is also a potential alternative to SSI, with a far
Atmos. Chem. Phys., 17, 595–613, 2017 www.atmos-chem-phys.net/17/595/2017/
C. J. Gabriel et al.: The G4Foam Experiment: global climate impacts 597
different latitudinal distribution of benefits. The focus here issolely on the second scenario, as it allows for the elucidationof the impacts of the G4Foam experiment forcing alone.
1.2 Motivation and research question
Is it possible to cool the planet while concurrently maintain-ing or increasing precipitation in highly populated and heav-ily cultivated regions, particularly in regions dependent onmonsoon precipitation? We begin by determining whethera forcing can be applied in a global climate model (GCM)that will result in the model responding with a northwardand landward shift of tropical precipitation needed to achieveour objective. To that end we conducted simulations with theCommunity Earth System Model 1 and Community Atmo-spheric Model 4 fully coupled to tropospheric and strato-spheric chemistry (CESM1 CAM4-Chem) model (Lamarqueet al., 2012; Tilmes et al., 2015, 2016). We ran the model withhorizontal resolution of 0.9◦× 1.25◦ latitude–longitude and26 levels from the surface to about 40 km (3.5 mb), as wasdone for G4SSA (specified stratospheric aerosol) by Xia etal. (2016).
The experiments consisted of three ensemble members ofa simulation from 2020 to 2089 in which the ocean sur-face albedo is raised as described above from an averageof 0.06, which includes a small diurnal cycle of albedo, toa daytime constant 0.15 on the SH subtropical ocean gyresfor 50 years, 2020–2069, and then returned to unforced val-ues from 2070 to 2089 to assess termination. Our hypothe-sis is that the tropical rain belts will move northward largelyas a result of increased moisture convergence over land re-gions, particularly during Northern Hemisphere (NH) sum-mer (June–July–August, JJA) in NH monsoon regions. En-hanced divergence over the already strong subtropical highs,due to increased subsidence over the increased albedo oceanregions in the subtropical Southern Hemisphere (SH), wouldhelp the cooler air from the forced subtropical regions advectthroughout the SH troposphere.
The asymmetric cooling would force changes in theHadley cell, enhancing cross-equatorial flow, which wouldcool the surface in the NH tropics, especially during JJA,when heat mortality and morbidity is highest. However, de-spite a reduction in the JJA mean temperature in the tropics,extreme events are responsible for most heat-related mortal-ity and morbidity, and the reduction in the mean temperaturedoes not necessarily mean that there will be a reduction in thetype of extreme heat events that cause human tragedy. WhileKharin et al. (2007) showed that, in general, temperature ex-tremes track with the mean temperature, this is not alwaysthe case. The changes in extreme events may, for example,be greater at high latitudes and the variability of temperaturesover land may increase in a warmer climate.
Specific to geoengineering, Aswathy et al. (2015) showedthat different climate engineering methods produce spatiallyheterogeneous changes in extreme precipitation and tempera-
ture events. They showed that one SRM scheme may be moreeffective than another in reducing different types of extremeevents despite relatively similar global and regional mean re-sponses. In particular, a marine cloud brightening schemethat brightens ocean areas between 30◦ N and 30◦ S is shownto be less effective in reducing extreme precipitation and tem-perature events over land than the G3 experiment is.
Finally, the resulting cooling of low-latitude NH land areaswould not dampen the monsoon. The wet-season monsooncirculation is initiated and maintained by the moist static en-ergy gradient, not the surface temperature gradient. A wet-ter, more cloudy land mass will strengthen, not dampen, thecirculation relative to a warmer, drier continent (Hurley andBoos, 2013), especially with a cooler, lower specific humid-ity environment under the descending branch of the merid-ional circulation.
The strength of this response will be very sensitive to anycloud feedbacks that result from the surface albedo forcing.The basis of this comprehensive hypothesis is described indetail, below, specifically in Sect. 1.3 and 1.4. The details ofthe experiment are discussed in detail in Sect. 2.
1.3 Stratospheric geoengineering weakens thehydrological cycle
With global warming, low-level specific humidity will in-crease by about 7 % K−1 within the tropical planetary bound-ary layer. This response will be spatially homogeneousthroughout the tropics. However, the precipitation responsewill be different. Increased moisture convergence in areasthat already get a lot of precipitation will result in the “wetgetting wetter,” while increased moisture divergence in dryareas will result in the “dry getting drier” (Held and Soden,2006).
The “rich get richer, poor get poorer” paradigm does nothold up in an SRM world, where the response is very differ-ent from that under global warming. Based on the results ofan observational study, Trenberth and Dai (2007) pointed outthe possibility that drought, particularly in the tropics, couldresult from geoengineering. Tilmes et al. (2013) analyzed thehydrological cycle in most of the GeoMIP participating Cou-pled Model Intercomparison Project 5 (CMIP5; Taylor et al.,2012) models by comparing abrupt 4xCO2, piControl, andG1. They found a robust reduction in global monsoon rain-fall, including in the Asian and west African monsoon re-gions in G1 relative to both abrupt 4xCO2 and piControl.Haywood et al. (2013) explored the impact of SSI in onehemisphere only and found a movement of the IntertropicalConvergence Zone (ITCZ) away from the hemisphere thatwas cooler as a result of the asymmetric SSI.
This consensus about the potential for less tropical rain-fall under a regime of stratospheric SRM motivates us toidentify an alternative or SSI-adjunctive geoengineering ap-proach that could cool the planet, without reducing monsoonprecipitation in highly cultivated areas.
www.atmos-chem-phys.net/17/595/2017/ Atmos. Chem. Phys., 17, 595–613, 2017
598 C. J. Gabriel et al.: The G4Foam Experiment: global climate impacts
1.4 Extratropical forcing impacts the position of theITCZ
Under global warming, tropical rain belts will move to-ward the hemisphere that warms more (Chiang and Bitz,2005; Frierson and Hwang, 2012). This ITCZ migrationwas first seen in early atmosphere–ocean coupled models.Clouds were prescribed in those models, and when cloudswere changed in such a way to preferentially cool one hemi-sphere, the ITCZ responded to changes by moving toward thewarmer hemisphere. Increasing low-cloud cover, and therebyinducing cooling, in one hemisphere relative to the othercaused the tropical rain belts over the Pacific Ocean to movetoward the other hemisphere (Manabe and Stouffer, 1980).The impacts of asymmetric heating of the hemispheres be-came highly relevant during the Sahel drought. Much of therainfall deficit during the devastating 20–30 year drought canbe attributed to cooling initiated by increased troposphericsulfate emissions in the NH (Hwang et al., 2013). The forcedcooling over the NH was enhanced by a positive dynamicalfeedback in the North Atlantic Ocean (Broccoli et al., 2006;Kang et al., 2008), and the ITCZ and associated tropical rainbelts migrated south. Since the Sahel is at the northern mar-gin of the ITCZ’s annual migration, or at the northern termi-nus of the west African monsoon, southward displacement ofthe ITCZ led to a devastating drought (Folland et al., 1986).
Broccoli et al. (2006) diagnosed the energy balance mech-anism that causes the ITCZ to shift in response to asymmetricheating of the extratropics. Using models of varying com-plexity, Broccoli et al. (2006) imposed an anomalous cool-ing of the NH, either via a last glacial maximum simulation,or via hosing of the North Atlantic. The heating asymme-try causes the extratropics in the NH to demand more heatand the extratropics in the SH to demand less heat. Sincecross-equatorial heat transport is achieved principally via theHadley cell, the SH Hadley cell strengthens, particularly inaustral summer, in response to the NH cooling, and net en-ergy flow in the upper branch intensifies, redistributing en-ergy into the NH from the relatively warm SH.
Net flow of energy in the Hadley cell can be describedin terms of the flow of moist static energy, which flows inthe direction of the upper-troposphere branch of the Hadleycell. This is because moist static energy is higher at higheraltitudes in the troposphere due to the increased contributionof the geopotential energy term overwhelming the moistureand internal energy terms in the moist static energy equationfor the high-altitude air. Net transport of energy, occurringin the upper branch of the Hadley cell from the SH to theNH, leads to increased moisture advection to the SH in thelower branch of the Hadley cell. This redistribution of en-ergy causes the ascending branch of the Hadley cell to mi-grate to the warmer SH where moisture convergence is in-creased and convective quasi-equilibrium is achieved underthe relatively narrow poleward-shifted ascending branch ofthe stronger SH winter Hadley cell. This mechanism leads to
the southward-displaced tropical rain belts (Broccoli et al.,2006).
This result is consistent with Lindzen and Hou (1988),who used a relatively simple model to show that even a smallmovement of maximum heating poleward into one hemi-sphere causes great asymmetry in the Hadley cell, with thewinter cell intensifying tremendously and the summer cellbecoming rather modest. More recent work continues to elu-cidate the mechanism of extratropical forcing of the ITCZ(Kang et al., 2008). The ocean also plays a vital role in push-ing the ITCZ into the warmer hemisphere (Xie and Philander,1994).
GCM results confirm this mechanism and connect thechanges due to northward displacement of the ITCZ with theonset of active periods in the Asian summer monsoon (Chaoand Chen, 2001). It is evident that a geoengineering tech-nique that could preferentially cool the SH could shift thetropical rain bands northward. However, in a GCM there areclouds. How would clouds respond in the hemisphere cooledby geoengineering? Would clouds change in the area beingdirectly cooled? Would a cooling of the subtropics either di-rectly, or indirectly via eddy flux from the artificially coolhigh latitudes, cause an increase in subtropical subsidence?Would this increase in the sinking of air above the intensifiedsubtropical highs cause water vapor to be trapped in the lowertroposphere, forming low clouds and suppressing water va-por mixing into the free troposphere, where the water vapormay instead be used up in formation of high clouds, whichtend to reduce outgoing long-wave radiation? Informed bythese established diagnostic mechanisms associated with theimpacts of asymmetric heating of the hemispheres, we seekto concurrently cool the entire SH and the NH tropics, mod-estly cool the NH extratropics and, most importantly, inducean anomalous overturning circulation and redistribute rain-fall from ocean to land and from south to north across thetropics.
2 Methods
2.1 Design of experiment and model configuration
Figure 1 shows the regions selected for albedo enhancement.These regions were chosen because of their low-cloud frac-tion, low wind speeds, weak currents, and lack of biologicalproductivity.
We used the Community Land Model (CLM) version 4.0with prescribed satellite phenology (CLM4SP) instead of theversion of CLM with a carbon–nitrogen cycle, coupled withCAM4–chem. Vegetation photosynthesis is calculated underthe assumption of prescribed phenology and no explicit nu-trient limitations (Bonan et al., 2011; Xia et al., 2016). Dy-namic vegetation is not turned on in this study. The oceanmodel does not include any biogeochemical responses.
Atmos. Chem. Phys., 17, 595–613, 2017 www.atmos-chem-phys.net/17/595/2017/
C. J. Gabriel et al.: The G4Foam Experiment: global climate impacts 599
The fundamental question we wish to answer concernsrepresentation of the physical processes that lead to realisticsimulation tropical precipitation. The Asian monsoon is ofgreat importance in that investigation. Fortunately, monsoonprocesses and regimes are depicted well in our atmosphericcomponent, CAM4 (Meehl et al., 2012). Some important fea-tures of CAM4 that illustrate its good monsoon representa-tion include the amount and location of precipitation overthe southern Tibetan Plateau and over the Western Ghats (amountain range near the west coast of south India). This isimproved when compared to earlier versions of the model.The rain shadow leeward of this range is often not resolvedby GCMs, however CAM4 shows some evidence of this rainshadow. These changes related to orography and horizon-tal resolution are important and likely generalize to similarland surface features outside of India, where model biaseshave not been as carefully studied as they have been in heav-ily populated southern India. This improvement can be at-tributed to the CCSM4 finite-volume dynamical core, whichreplaces the spectral version of the CCSM3 and the inter-connected higher horizontal resolution (Neale et al., 2013).Additionally, large-scale features are improved. For example,the representation of the ITCZ during NH winter southwardmigration over the Maritime Continent is improved (Meehlet al., 2012).
There is an important process associated with monsoonprecipitation, however, that may be imperfectly simulatedacross many CMIP5 GCMs. Zonal mean absorbed short-wave radiation is too high over the Southern Ocean (Kay etal., 2016). This cloud problem leads to a warmer SouthernOcean, which leads to anomalous SH atmospheric eddy fluxto the subtropics from the extratropics, potentially dampingthe cooling response of our negative surface radiative forcingin the subtropical oceans. The effect of a transfer of heat fromthe SH extratropics into the Hadley cell already causes a rel-atively weak negative bias in the amount of interhemisphericheat transport from the south to north. Therefore, the mani-festation of this bias in G4Foam would be to partially offsetour imposed cooling, lessening the need for interhemisphericenergy transport to the SH and suppressing the surface returnflow of moisture advection into the NH. Lower than observedinterhemispheric energy transport would be associated witha weaker Asian monsoon. However, this feature is equallypresent in our G4Foam experiment and the comparison ex-periments G4SSA and RCP6.0, so is unlikely to appreciablyaffect the differences.
We compare G4Foam to two experiments. First is a spe-cific sulfate injection scenario, G4 Specified StratosphericAerosol (G4SSA; Xia et al., 2016). They used a prescribedstratospheric aerosol distribution roughly analogous to an-nual tropical emission into the stratosphere (at 60 mb) of8 Tg SO2 yr−1 from 2020 to 2070. This produces a radiativeforcing of about −2.5 W m−2. The G4SSA forcing rampsdown from 2069 to 2071 and then continues without addi-tional forcing from 2072 to 2089. In G4SSA tropospheric
aerosols are not affected by the prescribed stratosphericaerosols. Therefore we cannot evaluate how stratosphericaerosols would actually fall out and impact the chemistry,dynamics and thermodynamics of the troposphere from thisexperiment. Neely et al. (2016) offers more detail on the pre-scription of stratospheric aerosols in CAM4–Chem. The sec-ond simulation for comparison, which serves as the referencesimulation for both G4Foam and G4SSA, is the Representa-tive Concentration Pathway 6.0 (RCP6.0) (Meinshausen etal., 2011) from 2004 to 2089. We have run three ensemblemembers each for G4Foam, G4SSA, and RCP6.0.
2.2 Ocean albedo enhancement approach
A plausible technology now exists to make quantities oflong-lasting foam, or engineered microbubbles, to enhanceocean albedo. Ocean albedo modification gained attentionwhen Seitz (2010) suggested that since air–water and air–sea interfaces are similarly refractive, dispersing microbub-bles onto the surface of the ocean would reflect sunlight inmuch the same way as cloud droplets do. While engineer-ing refractive or stable foams is commonly done and ap-plied in both food science and firefighting, engineering astable and refractive foam appropriate for a geoengineeringscheme appeared fanciful until Aziz et al. (2014) produceda long-lasting refractive foam made with biodegradable andnon-toxic additives. Aziz et al. identified foam lifetime of3 months or more per microbubble as lasting long enoughthat the input of energy to create the microbubbles would notbe prohibitive. After experimenting with protein-only solu-tions, Aziz et al. (2014) added high methyl ester pectin totype A gelatin and created a foam in salt water, which wasstill intact and stable at the cessation of the experiment af-ter 3 months. The reflectance of the foam was about 50 %,which is comparable to that of whitecaps. The creation ofthese stable microbubbles makes enhancing ocean albedo inthis manner “feasible” (Aziz et al., 2014). However, thereare a number of other potential risks associated with mi-crobubble deployment, even if the feasibility issues are setaside. Robock (2011) pointed out that vertical mixing in theocean, changes in ocean circulation, impacts on photosyn-thesis, and risks to the biosphere could all impair the efficacyof this geoengineering approach. Robock (2011) also pointedout that a cooler ocean would serve as a more effective CO2sink, helping to offset the CO2 increase that comes about asa feedback of warming. Other potentially attractive attributesof this technique include the possibility that it could be de-ployed exclusively in the 20 % of the world’s oceans that arenot biologically active (Aziz et al., 2014) and therefore havelittle impact on the biosphere, and that there would be no riskto ozone in the stratosphere.
www.atmos-chem-phys.net/17/595/2017/ Atmos. Chem. Phys., 17, 595–613, 2017
600 C. J. Gabriel et al.: The G4Foam Experiment: global climate impacts
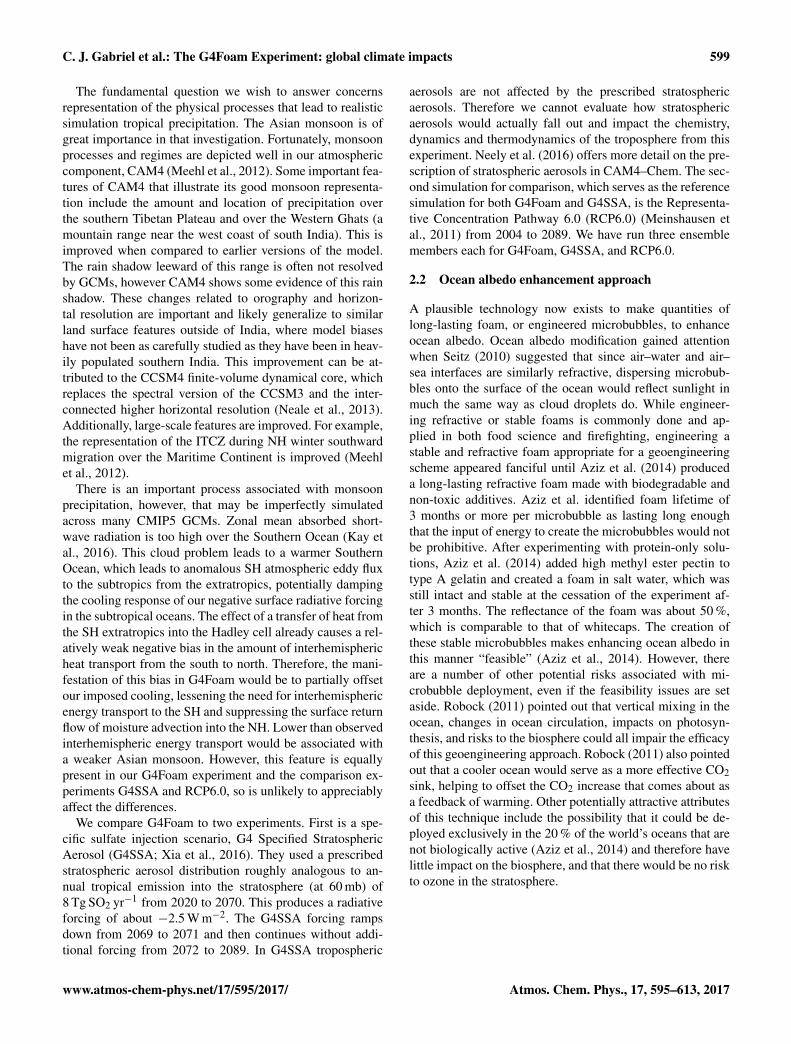
Figure 2. (a) Net all-sky SW flux at top of atmosphere and (b) time series of global mean net cloud forcing. Each ensemble member and theensemble mean are shown for each forcing.
Atmos. Chem. Phys., 17, 595–613, 2017 www.atmos-chem-phys.net/17/595/2017/
C. J. Gabriel et al.: The G4Foam Experiment: global climate impacts 601
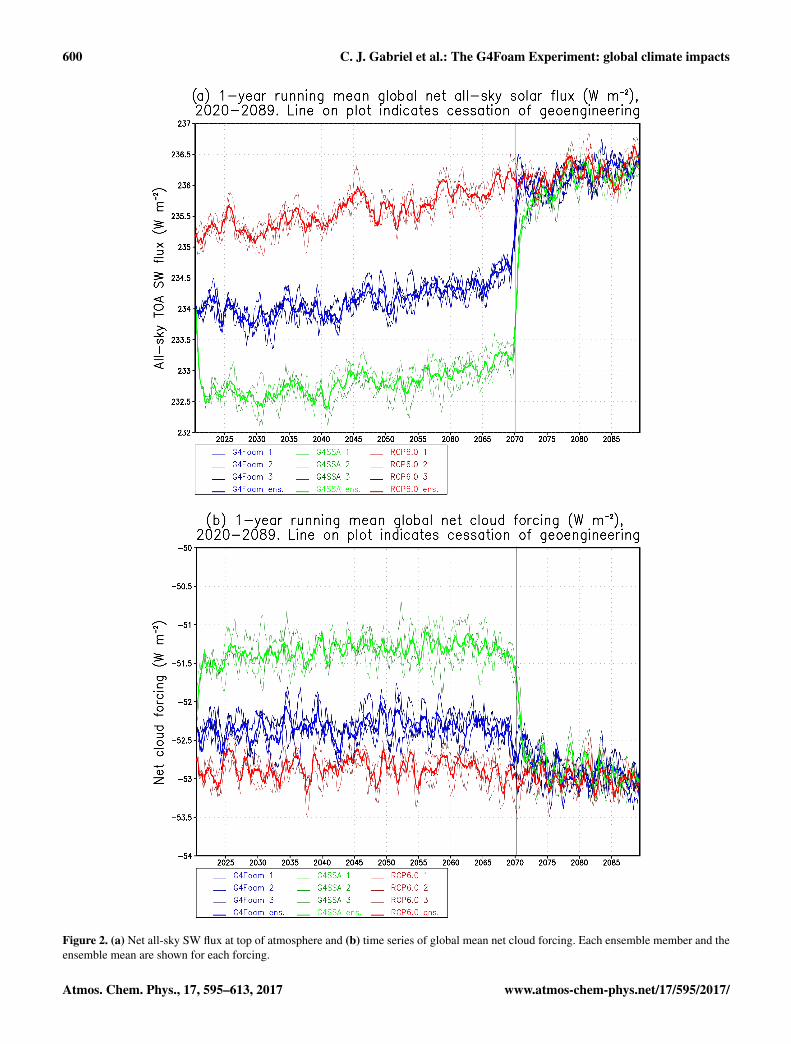
Figure 3. (a) Net clear-sky SW flux at top of atmosphere, which includes the effects of changes in radiation caused by changes in oceansurface albedo or land albedo (ice and snow), as well as stratospheric aerosols (stratospheric geoengineering) and (b) time series of globalmean temperature. In G4Foam, temperature is more than twice as sensitive to ocean albedo forcing as it is to stratospheric geoengineering,as applied in G4SSA, albeit with very different latitudinal distributions of temperature changes. Each ensemble member and the ensemblemean are shown for each forcing.
www.atmos-chem-phys.net/17/595/2017/ Atmos. Chem. Phys., 17, 595–613, 2017
602 C. J. Gabriel et al.: The G4Foam Experiment: global climate impacts
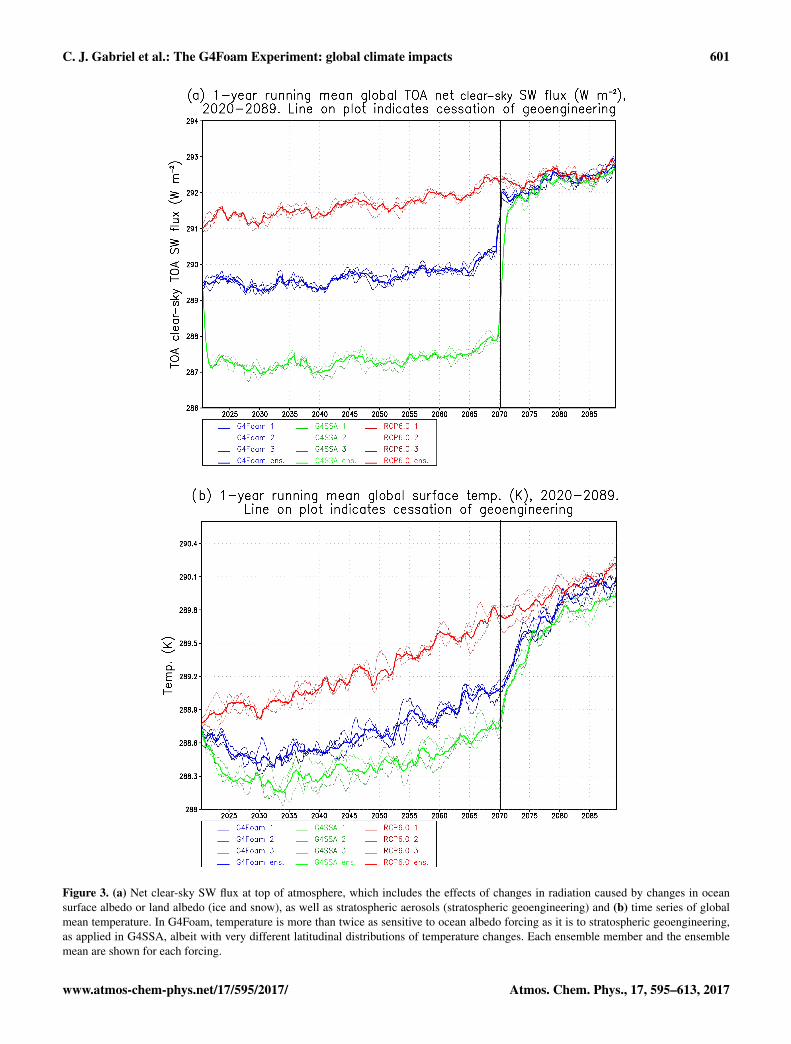
Table 1. Changes in temperature and precipitation in G4Foam relative to both G4SSA and RCP6.0, for the entire globe and for the Tropics(20◦ S–20◦ N) annually and in Northern Hemisphere summer, for the 40-year period beginning 10 years after the start of climate engineering.
Global, 2030–2069 G4Foam – G4SSA G4Foam – RCP6.0(% change) (% change)
Precipitation (mm day−1) +0.02 (+0.61) −0.06 (−1.98)Land precipitation (mm day−1) +0.07 (+3.19) +0.01 (+0.32)Ocean precipitation (mm day−1) −0.01 (−0.36) −0.08 (−2.57)Temperature (K) +0.27 −0.53Land temperature (K) +0.63 −0.44
Global, 2030–2069, June–July–August
Precipitation (mm day−1) +0.02 (+0.70) −0.05 (−1.85)Land precipitation (mm day−1) +0.08 (+3.35) +0.02 (+0.70)Ocean precipitation (mm day−1) +0.01 (−0.29) −0.08 (−2.51)Temperature (K) +0.32 −0.60Land temperature (K) +0.71 −0.53
Tropical, 2030–2069
Precipitation (mm day−1) +0.06 (+1.59) −0.03 (−1.06)Land precipitation (mm day−1) +0.16 (+3.93) +0.07 (+1.43)Ocean precipitation (mm day−1) +0.03 (+0.77) −0.07 (−1.92)Temperature (K) +0.21 −0.60Land temperature (K) +0.43 −0.61
Tropical, 2030–2069, June–July–August
Precipitation (mm day−1) +0.06 (+1.52) −0.03 (−0.84)Land precipitation (mm day−1) +0.16 (+4.66) +0.07 (+2.02)Ocean precipitation (mm day−1) +0.03 (+0.67) −0.06 (−1.61)Temperature (K) +0.18 −0.61Land temperature (K) +0.37 −0.70
3 Results
The following results compare the G4Foam climate with theclimates in G4SSA and RCP6.0 averaged over the period2030–2069. While G4Foam and G4SSA forcing commencesin 2020, the first ten years of both experiments are a periodof transition. For that reason 2020–2029 is discarded fromour comparisons. We analyze mainly annual average and JJAresults, since JJA is meteorological summer in the NH andusing JJA facilitates comparison with G4SSA, which reportsresults in terms of JJA (Xia et al., 2016).
3.1 Temperature and cloud response
The primary purpose of G4Foam is to assess the possibil-ity of reducing global mean surface temperature without re-ducing monsoon precipitation. The G4Foam simulations re-duce global mean surface temperature relative to RCP6.0 by0.60 K and global mean land surface temperature by 0.51 Krelative to RCP6.0. In JJA, G4Foam is 0.70 K cooler thanRCP6.0 over land in the tropics, 20◦ S–20◦ N, during JJA(Table 1).
These temperature changes in G4Foam, relative toRCP6.0, result from an all-sky top-of-atmosphere forcing of−1.5 W m−2 (global, year-round), and −1.9 W m−2 in thetropics during JJA only (Fig. 2). This JJA cooling in the trop-ics is of particular importance due to the dense populationand heavy agricultural demand in the tropics, particularlynorth of the equator.
G4Foam does not achieve the same amount of cooling asG4SSA, which would reduce global mean surface tempera-ture by 0.92 K. All-sky top-of-atmosphere shortwave flux inG4SSA is reduced by 2.7 W m−2 as compared to RCP6.0. Interms of global mean clear-sky top-of-atmosphere shortwaveflux, relative to RCP6.0, G4Foam applies only 38 % of theforcing that is applied in G4SSA (Fig. 3). The G4Foam forc-ing is more efficient in reducing temperature than G4SSA,largely because there is an additional 1.1 W m−2 of net cloudforcing in G4Foam relative to G4SSA (Fig. 2b).
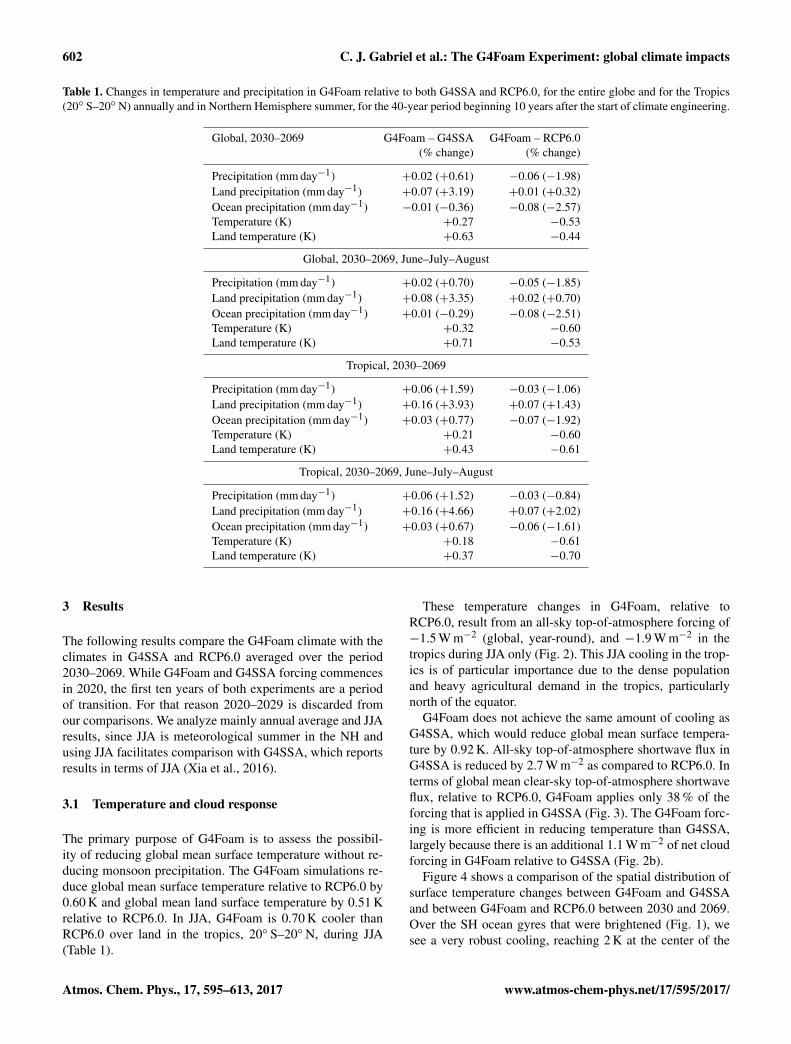
Figure 4 shows a comparison of the spatial distribution ofsurface temperature changes between G4Foam and G4SSAand between G4Foam and RCP6.0 between 2030 and 2069.Over the SH ocean gyres that were brightened (Fig. 1), wesee a very robust cooling, reaching 2 K at the center of the
Atmos. Chem. Phys., 17, 595–613, 2017 www.atmos-chem-phys.net/17/595/2017/
C. J. Gabriel et al.: The G4Foam Experiment: global climate impacts 603
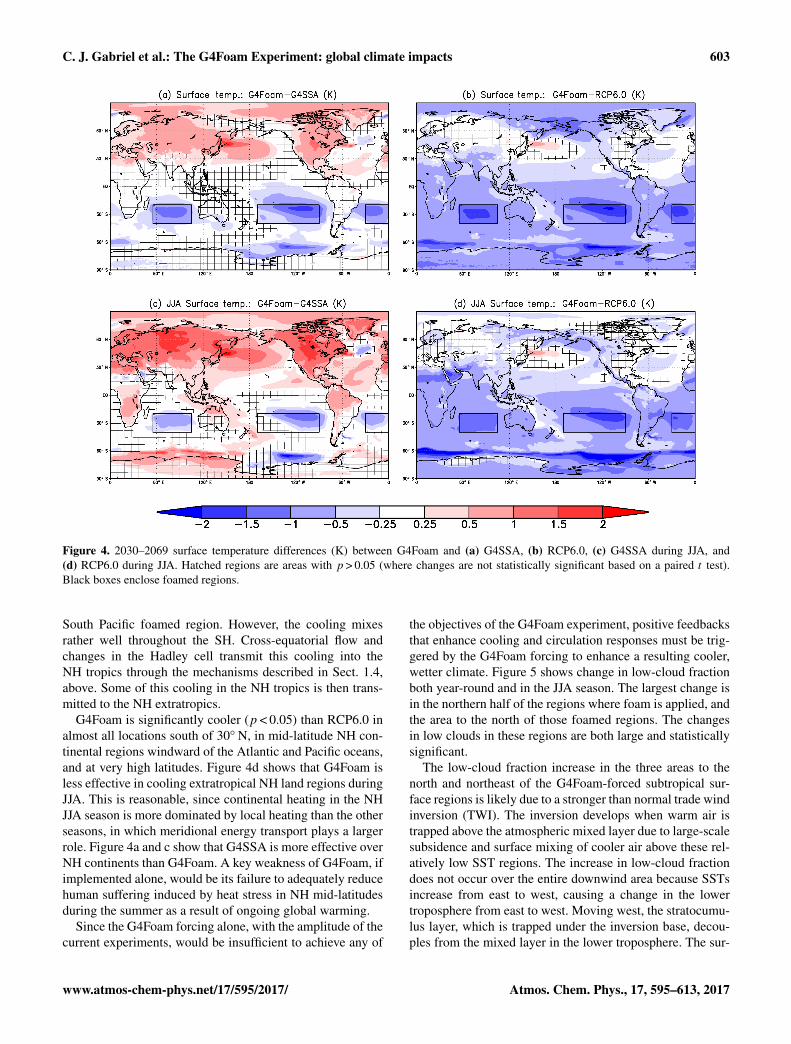
Figure 4. 2030–2069 surface temperature differences (K) between G4Foam and (a) G4SSA, (b) RCP6.0, (c) G4SSA during JJA, and(d) RCP6.0 during JJA. Hatched regions are areas with p > 0.05 (where changes are not statistically significant based on a paired t test).Black boxes enclose foamed regions.
South Pacific foamed region. However, the cooling mixesrather well throughout the SH. Cross-equatorial flow andchanges in the Hadley cell transmit this cooling into theNH tropics through the mechanisms described in Sect. 1.4,above. Some of this cooling in the NH tropics is then trans-mitted to the NH extratropics.
G4Foam is significantly cooler (p < 0.05) than RCP6.0 inalmost all locations south of 30◦ N, in mid-latitude NH con-tinental regions windward of the Atlantic and Pacific oceans,and at very high latitudes. Figure 4d shows that G4Foam isless effective in cooling extratropical NH land regions duringJJA. This is reasonable, since continental heating in the NHJJA season is more dominated by local heating than the otherseasons, in which meridional energy transport plays a largerrole. Figure 4a and c show that G4SSA is more effective overNH continents than G4Foam. A key weakness of G4Foam, ifimplemented alone, would be its failure to adequately reducehuman suffering induced by heat stress in NH mid-latitudesduring the summer as a result of ongoing global warming.
Since the G4Foam forcing alone, with the amplitude of thecurrent experiments, would be insufficient to achieve any of
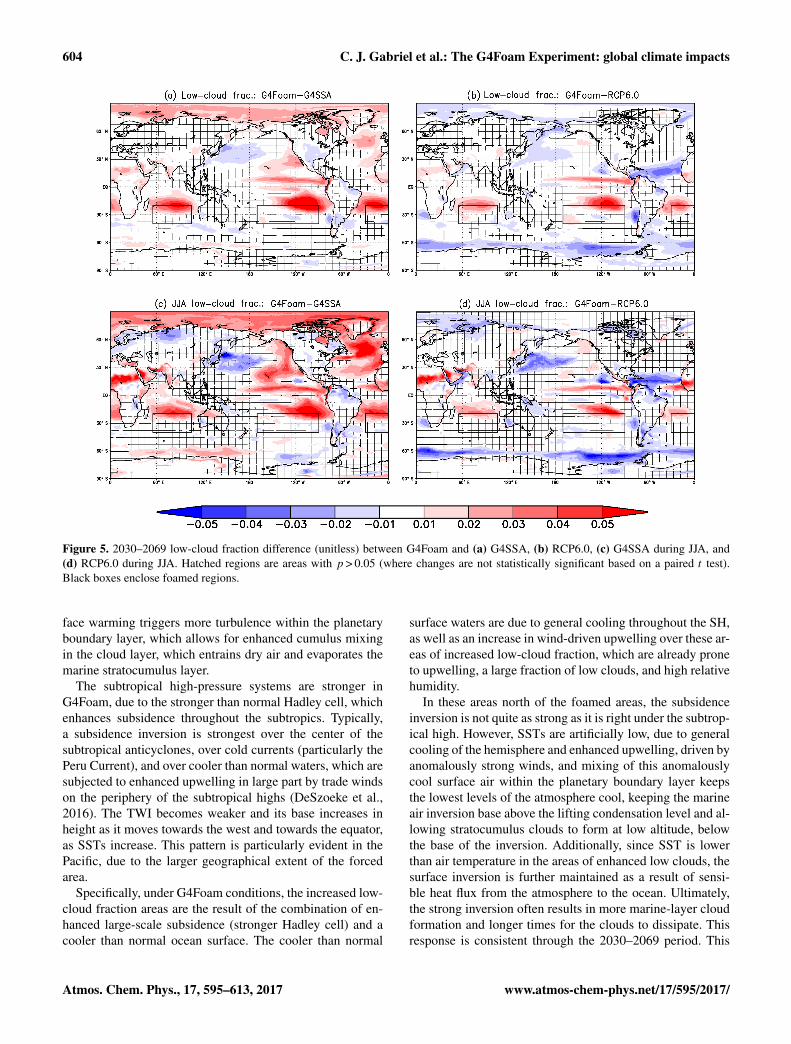
the objectives of the G4Foam experiment, positive feedbacksthat enhance cooling and circulation responses must be trig-gered by the G4Foam forcing to enhance a resulting cooler,wetter climate. Figure 5 shows change in low-cloud fractionboth year-round and in the JJA season. The largest change isin the northern half of the regions where foam is applied, andthe area to the north of those foamed regions. The changesin low clouds in these regions are both large and statisticallysignificant.
The low-cloud fraction increase in the three areas to thenorth and northeast of the G4Foam-forced subtropical sur-face regions is likely due to a stronger than normal trade windinversion (TWI). The inversion develops when warm air istrapped above the atmospheric mixed layer due to large-scalesubsidence and surface mixing of cooler air above these rel-atively low SST regions. The increase in low-cloud fractiondoes not occur over the entire downwind area because SSTsincrease from east to west, causing a change in the lowertroposphere from east to west. Moving west, the stratocumu-lus layer, which is trapped under the inversion base, decou-ples from the mixed layer in the lower troposphere. The sur-
www.atmos-chem-phys.net/17/595/2017/ Atmos. Chem. Phys., 17, 595–613, 2017
604 C. J. Gabriel et al.: The G4Foam Experiment: global climate impacts
Figure 5. 2030–2069 low-cloud fraction difference (unitless) between G4Foam and (a) G4SSA, (b) RCP6.0, (c) G4SSA during JJA, and(d) RCP6.0 during JJA. Hatched regions are areas with p > 0.05 (where changes are not statistically significant based on a paired t test).Black boxes enclose foamed regions.
face warming triggers more turbulence within the planetaryboundary layer, which allows for enhanced cumulus mixingin the cloud layer, which entrains dry air and evaporates themarine stratocumulus layer.
The subtropical high-pressure systems are stronger inG4Foam, due to the stronger than normal Hadley cell, whichenhances subsidence throughout the subtropics. Typically,a subsidence inversion is strongest over the center of thesubtropical anticyclones, over cold currents (particularly thePeru Current), and over cooler than normal waters, which aresubjected to enhanced upwelling in large part by trade windson the periphery of the subtropical highs (DeSzoeke et al.,2016). The TWI becomes weaker and its base increases inheight as it moves towards the west and towards the equator,as SSTs increase. This pattern is particularly evident in thePacific, due to the larger geographical extent of the forcedarea.
Specifically, under G4Foam conditions, the increased low-cloud fraction areas are the result of the combination of en-hanced large-scale subsidence (stronger Hadley cell) and acooler than normal ocean surface. The cooler than normal
surface waters are due to general cooling throughout the SH,as well as an increase in wind-driven upwelling over these ar-eas of increased low-cloud fraction, which are already proneto upwelling, a large fraction of low clouds, and high relativehumidity.
In these areas north of the foamed areas, the subsidenceinversion is not quite as strong as it is right under the subtrop-ical high. However, SSTs are artificially low, due to generalcooling of the hemisphere and enhanced upwelling, driven byanomalously strong winds, and mixing of this anomalouslycool surface air within the planetary boundary layer keepsthe lowest levels of the atmosphere cool, keeping the marineair inversion base above the lifting condensation level and al-lowing stratocumulus clouds to form at low altitude, belowthe base of the inversion. Additionally, since SST is lowerthan air temperature in the areas of enhanced low clouds, thesurface inversion is further maintained as a result of sensi-ble heat flux from the atmosphere to the ocean. Ultimately,the strong inversion often results in more marine-layer cloudformation and longer times for the clouds to dissipate. Thisresponse is consistent through the 2030–2069 period. This
Atmos. Chem. Phys., 17, 595–613, 2017 www.atmos-chem-phys.net/17/595/2017/
C. J. Gabriel et al.: The G4Foam Experiment: global climate impacts 605
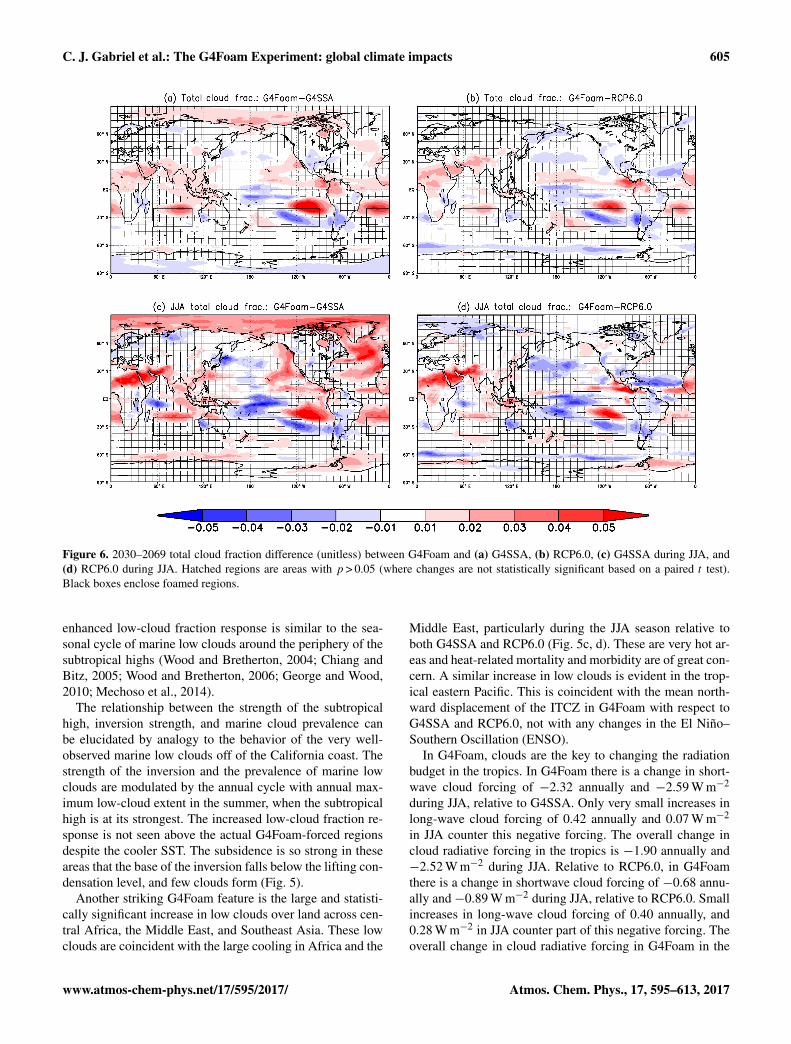
Figure 6. 2030–2069 total cloud fraction difference (unitless) between G4Foam and (a) G4SSA, (b) RCP6.0, (c) G4SSA during JJA, and(d) RCP6.0 during JJA. Hatched regions are areas with p > 0.05 (where changes are not statistically significant based on a paired t test).Black boxes enclose foamed regions.
enhanced low-cloud fraction response is similar to the sea-sonal cycle of marine low clouds around the periphery of thesubtropical highs (Wood and Bretherton, 2004; Chiang andBitz, 2005; Wood and Bretherton, 2006; George and Wood,2010; Mechoso et al., 2014).
The relationship between the strength of the subtropicalhigh, inversion strength, and marine cloud prevalence canbe elucidated by analogy to the behavior of the very well-observed marine low clouds off of the California coast. Thestrength of the inversion and the prevalence of marine lowclouds are modulated by the annual cycle with annual max-imum low-cloud extent in the summer, when the subtropicalhigh is at its strongest. The increased low-cloud fraction re-sponse is not seen above the actual G4Foam-forced regionsdespite the cooler SST. The subsidence is so strong in theseareas that the base of the inversion falls below the lifting con-densation level, and few clouds form (Fig. 5).
Another striking G4Foam feature is the large and statisti-cally significant increase in low clouds over land across cen-tral Africa, the Middle East, and Southeast Asia. These lowclouds are coincident with the large cooling in Africa and the
Middle East, particularly during the JJA season relative toboth G4SSA and RCP6.0 (Fig. 5c, d). These are very hot ar-eas and heat-related mortality and morbidity are of great con-cern. A similar increase in low clouds is evident in the trop-ical eastern Pacific. This is coincident with the mean north-ward displacement of the ITCZ in G4Foam with respect toG4SSA and RCP6.0, not with any changes in the El Niño–Southern Oscillation (ENSO).
In G4Foam, clouds are the key to changing the radiationbudget in the tropics. In G4Foam there is a change in short-wave cloud forcing of −2.32 annually and −2.59 W m−2
during JJA, relative to G4SSA. Only very small increases inlong-wave cloud forcing of 0.42 annually and 0.07 W m−2
in JJA counter this negative forcing. The overall change incloud radiative forcing in the tropics is −1.90 annually and−2.52 W m−2 during JJA. Relative to RCP6.0, in G4Foamthere is a change in shortwave cloud forcing of −0.68 annu-ally and−0.89 W m−2 during JJA, relative to RCP6.0. Smallincreases in long-wave cloud forcing of 0.40 annually, and0.28 W m−2 in JJA counter part of this negative forcing. Theoverall change in cloud radiative forcing in G4Foam in the
www.atmos-chem-phys.net/17/595/2017/ Atmos. Chem. Phys., 17, 595–613, 2017
606 C. J. Gabriel et al.: The G4Foam Experiment: global climate impacts
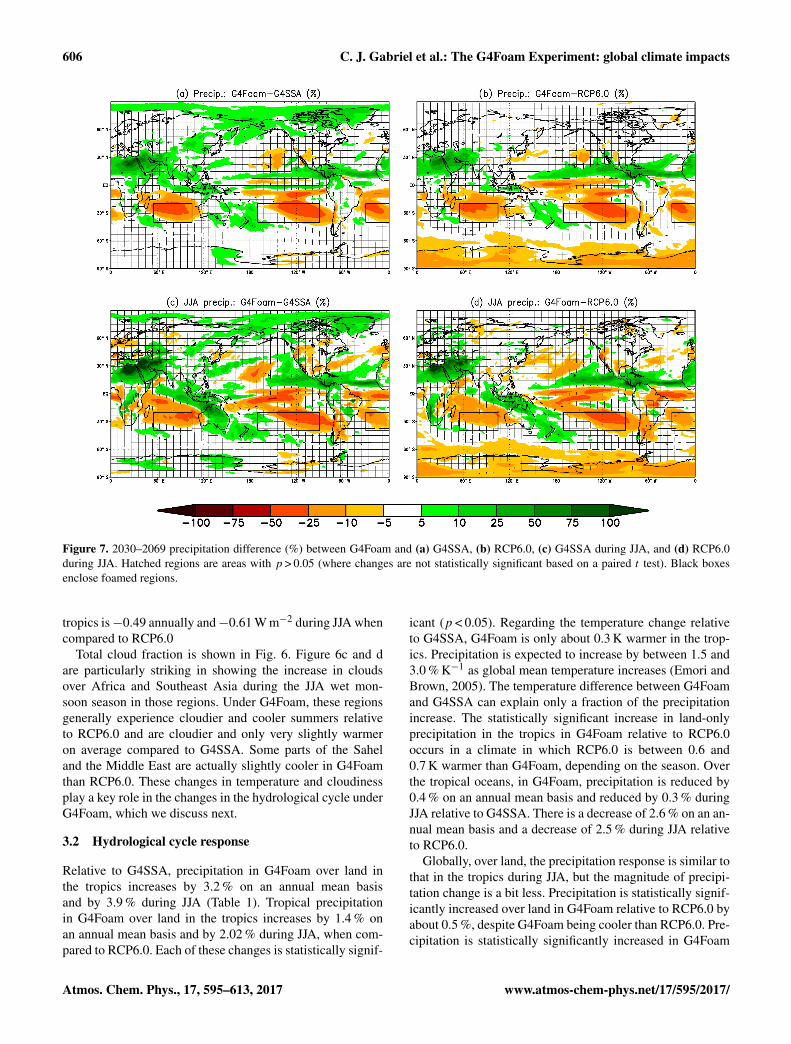
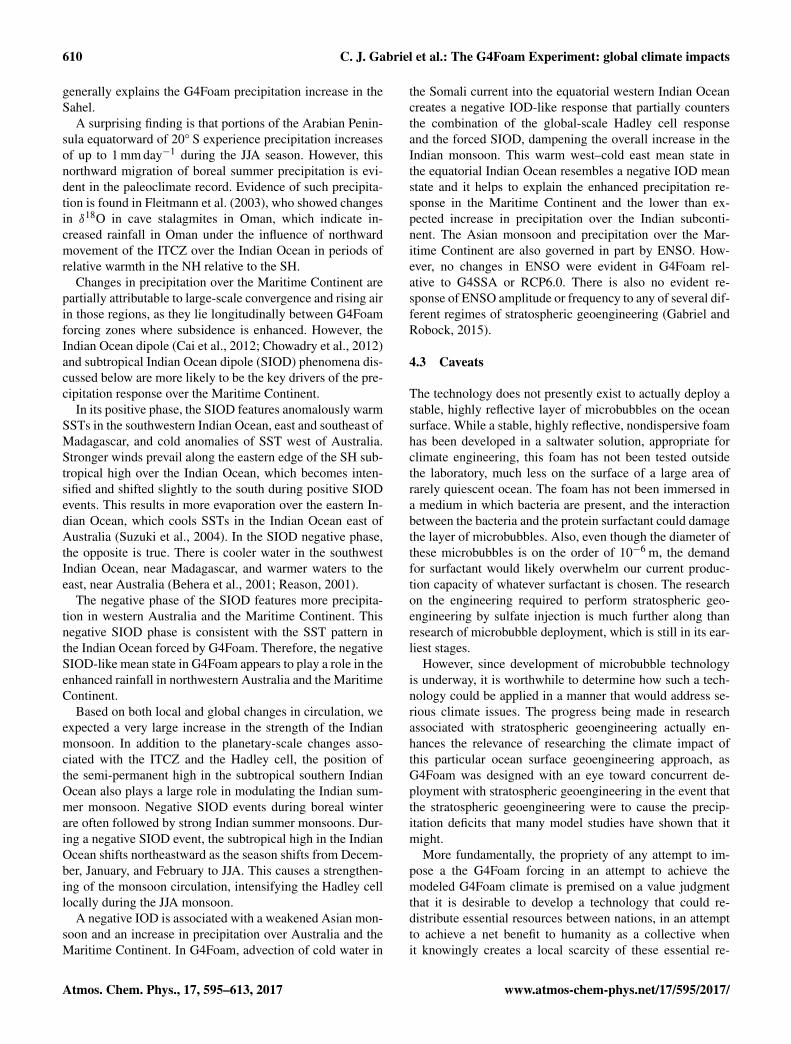
Figure 7. 2030–2069 precipitation difference (%) between G4Foam and (a) G4SSA, (b) RCP6.0, (c) G4SSA during JJA, and (d) RCP6.0during JJA. Hatched regions are areas with p > 0.05 (where changes are not statistically significant based on a paired t test). Black boxesenclose foamed regions.
tropics is−0.49 annually and−0.61 W m−2 during JJA whencompared to RCP6.0
Total cloud fraction is shown in Fig. 6. Figure 6c and dare particularly striking in showing the increase in cloudsover Africa and Southeast Asia during the JJA wet mon-soon season in those regions. Under G4Foam, these regionsgenerally experience cloudier and cooler summers relativeto RCP6.0 and are cloudier and only very slightly warmeron average compared to G4SSA. Some parts of the Saheland the Middle East are actually slightly cooler in G4Foamthan RCP6.0. These changes in temperature and cloudinessplay a key role in the changes in the hydrological cycle underG4Foam, which we discuss next.
3.2 Hydrological cycle response
Relative to G4SSA, precipitation in G4Foam over land inthe tropics increases by 3.2 % on an annual mean basisand by 3.9 % during JJA (Table 1). Tropical precipitationin G4Foam over land in the tropics increases by 1.4 % onan annual mean basis and by 2.02 % during JJA, when com-pared to RCP6.0. Each of these changes is statistically signif-
icant (p < 0.05). Regarding the temperature change relativeto G4SSA, G4Foam is only about 0.3 K warmer in the trop-ics. Precipitation is expected to increase by between 1.5 and3.0 % K−1 as global mean temperature increases (Emori andBrown, 2005). The temperature difference between G4Foamand G4SSA can explain only a fraction of the precipitationincrease. The statistically significant increase in land-onlyprecipitation in the tropics in G4Foam relative to RCP6.0occurs in a climate in which RCP6.0 is between 0.6 and0.7 K warmer than G4Foam, depending on the season. Overthe tropical oceans, in G4Foam, precipitation is reduced by0.4 % on an annual mean basis and reduced by 0.3 % duringJJA relative to G4SSA. There is a decrease of 2.6 % on an an-nual mean basis and a decrease of 2.5 % during JJA relativeto RCP6.0.
Globally, over land, the precipitation response is similar tothat in the tropics during JJA, but the magnitude of precipi-tation change is a bit less. Precipitation is statistically signif-icantly increased over land in G4Foam relative to RCP6.0 byabout 0.5 %, despite G4Foam being cooler than RCP6.0. Pre-cipitation is statistically significantly increased in G4Foam
Atmos. Chem. Phys., 17, 595–613, 2017 www.atmos-chem-phys.net/17/595/2017/
C. J. Gabriel et al.: The G4Foam Experiment: global climate impacts 607
relative to G4SSA over land by 3.5 %, despite G4Foam onlybeing 0.3 K warmer than G4SSA.
The overall global precipitation difference betweenG4Foam and G4SSA or RCP6.0, when land and ocean arecombined and all seasons and all latitudes are included, isrelatively small, and close to the 1.5 to 3 % K−1 range of pre-cipitation increase with temperature identified by Emori andBrown (2005). Globally, G4Foam is warmer than G4SSAby 0.3 K and there is 0.61 % (2.1 % K−1) more precipitation.G4Foam is cooler than RCP6.0 by 0.6 K and drier by 1.9 %(3.1 % K−1).
The spatial pattern of precipitation changes is shown inFig. 7. Precipitation is greatly reduced over the ocean, par-ticularly in the SH, relative to both G4SSA and RCP6.0.Changes in precipitation poleward of 40◦ latitude in eitherhemisphere are largely due to the temperature dependenceof precipitation. The changes in the SH subtropics are domi-nated by the shortwave forcing applied over the ocean gyres,which reduces both evaporation and precipitation in those ar-eas.
The changes in precipitation in the tropics are driven by anorthward shift in the ITCZ. Large precipitation anomaliesoccur in a narrow band north of the equator and smaller pos-itive anomalies occur in broader regions, primarily over NHmonsoon regions. Importantly, we see a statistically signif-icant increase in monsoon precipitation over the Sahel, theMiddle East, and the Indian subcontinent as well as south-west Asia and the Maritime Continent on an annual meanbasis in G4Foam relative to G4SSA (Fig. 7a). Relative toRCP6.0, these changes are not statistically significant overthe Indian subcontinent or southwest Asia, but there are onlyvery isolated and small areas in these regions in which thereis any precipitation reduction, either on the annual mean orduring JJA. Therefore, over much of heavily populated south-ern Asia, east of the Arabian Sea, G4Foam will be cooler thanRCP6.0 without any notable mean precipitation differences.Most of these areas are expected to receive more rainfall asthe planet warms. If this excess rainfall is not desirable inareas that are already wet, these results suggest that weaken-ing the hydrological cycle would require that G4Foam wouldhave to be combined with an additional geoengineering tech-nique, such as stratospheric SRM.
Relative to both G4SSA and RCP6.0, there is a greatdeal more precipitation all year and particularly during JJAover Central America, the northern Amazon, much of Africa,parts of the Arabian peninsula, and the Maritime Continent.This response is more robust than the response over South-east Asia due to the more direct dependence of rainfall inthese regions on ITCZ position than in Southeast Asia, wherethe monsoon is also driven by numerous local and remotefactors, including ENSO and the Indian Ocean dipole (IOD).
Although these G4Foam simulations enhance rainfall overmany heavily populated and highly cultivated regions, partic-ularly in the tropics, there are regions that would receive lessprecipitation and experience a decrease in P −E (precipita-
tion − evaporation) under this regime. Precipitation patternsfor islands in the South Pacific are largely governed by theposition and strength of the South Pacific Convergence Zone(SPCZ), which changes substantially under G4Foam due inpart to the cooling and to the movement of gradients of tem-perature and pressure. Precipitation deficits over Madagascarand some regions in Africa and South America exceed 10 %.
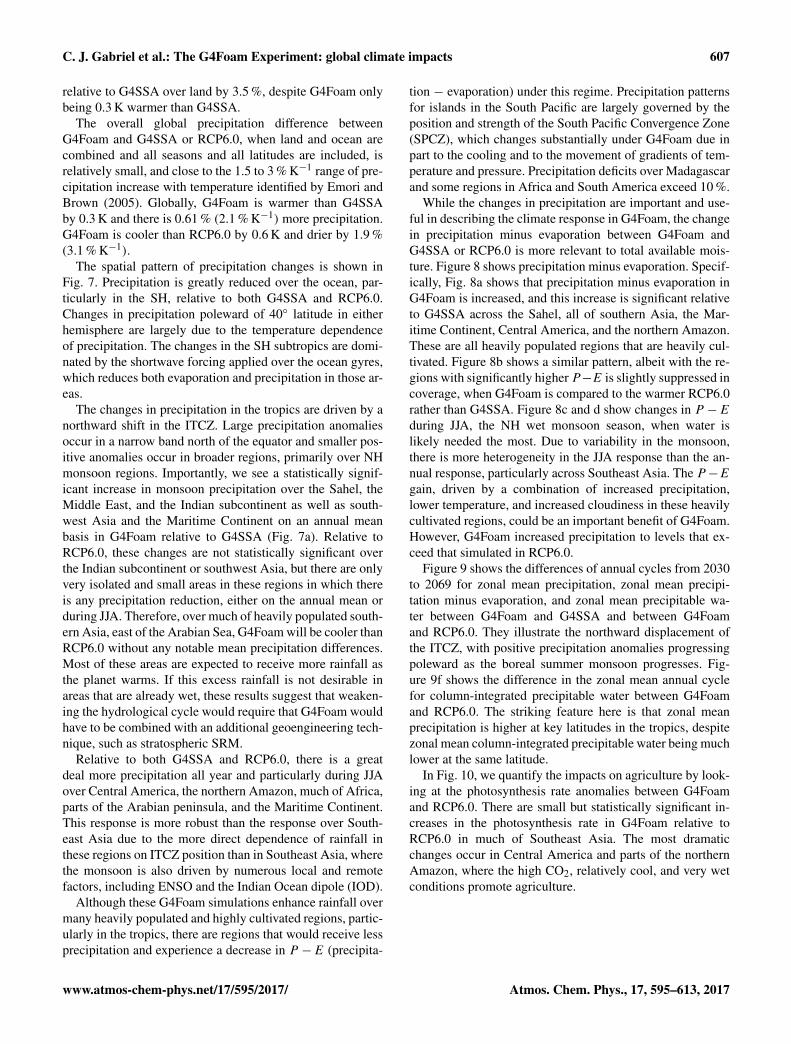
While the changes in precipitation are important and use-ful in describing the climate response in G4Foam, the changein precipitation minus evaporation between G4Foam andG4SSA or RCP6.0 is more relevant to total available mois-ture. Figure 8 shows precipitation minus evaporation. Specif-ically, Fig. 8a shows that precipitation minus evaporation inG4Foam is increased, and this increase is significant relativeto G4SSA across the Sahel, all of southern Asia, the Mar-itime Continent, Central America, and the northern Amazon.These are all heavily populated regions that are heavily cul-tivated. Figure 8b shows a similar pattern, albeit with the re-gions with significantly higher P−E is slightly suppressed incoverage, when G4Foam is compared to the warmer RCP6.0rather than G4SSA. Figure 8c and d show changes in P −Eduring JJA, the NH wet monsoon season, when water islikely needed the most. Due to variability in the monsoon,there is more heterogeneity in the JJA response than the an-nual response, particularly across Southeast Asia. The P −Egain, driven by a combination of increased precipitation,lower temperature, and increased cloudiness in these heavilycultivated regions, could be an important benefit of G4Foam.However, G4Foam increased precipitation to levels that ex-ceed that simulated in RCP6.0.
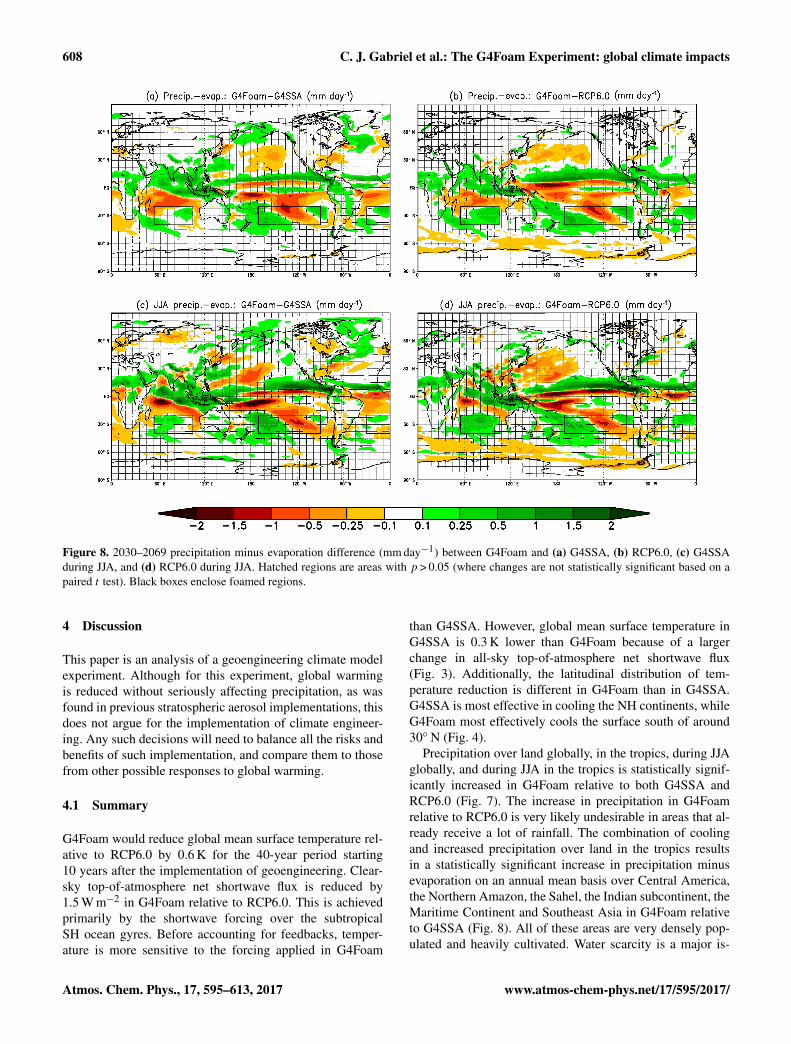
Figure 9 shows the differences of annual cycles from 2030to 2069 for zonal mean precipitation, zonal mean precipi-tation minus evaporation, and zonal mean precipitable wa-ter between G4Foam and G4SSA and between G4Foamand RCP6.0. They illustrate the northward displacement ofthe ITCZ, with positive precipitation anomalies progressingpoleward as the boreal summer monsoon progresses. Fig-ure 9f shows the difference in the zonal mean annual cyclefor column-integrated precipitable water between G4Foamand RCP6.0. The striking feature here is that zonal meanprecipitation is higher at key latitudes in the tropics, despitezonal mean column-integrated precipitable water being muchlower at the same latitude.
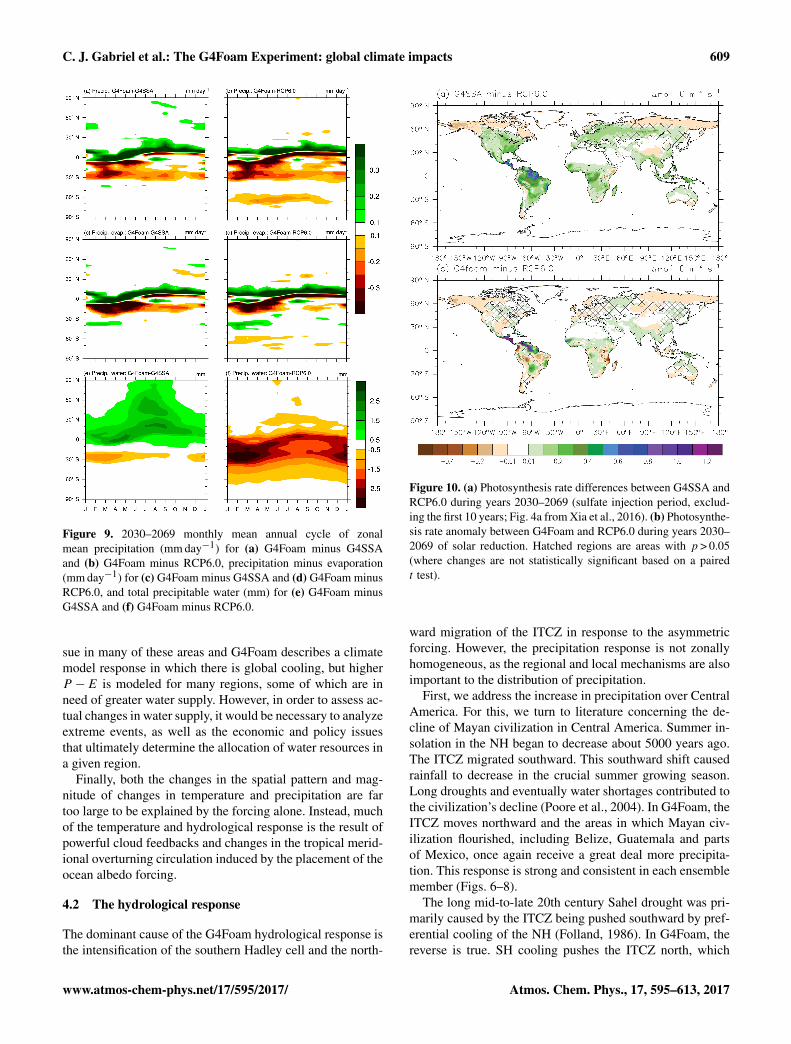
In Fig. 10, we quantify the impacts on agriculture by look-ing at the photosynthesis rate anomalies between G4Foamand RCP6.0. There are small but statistically significant in-creases in the photosynthesis rate in G4Foam relative toRCP6.0 in much of Southeast Asia. The most dramaticchanges occur in Central America and parts of the northernAmazon, where the high CO2, relatively cool, and very wetconditions promote agriculture.
www.atmos-chem-phys.net/17/595/2017/ Atmos. Chem. Phys., 17, 595–613, 2017
608 C. J. Gabriel et al.: The G4Foam Experiment: global climate impacts
Figure 8. 2030–2069 precipitation minus evaporation difference (mm day−1) between G4Foam and (a) G4SSA, (b) RCP6.0, (c) G4SSAduring JJA, and (d) RCP6.0 during JJA. Hatched regions are areas with p > 0.05 (where changes are not statistically significant based on apaired t test). Black boxes enclose foamed regions.
4 Discussion
This paper is an analysis of a geoengineering climate modelexperiment. Although for this experiment, global warmingis reduced without seriously affecting precipitation, as wasfound in previous stratospheric aerosol implementations, thisdoes not argue for the implementation of climate engineer-ing. Any such decisions will need to balance all the risks andbenefits of such implementation, and compare them to thosefrom other possible responses to global warming.
4.1 Summary
G4Foam would reduce global mean surface temperature rel-ative to RCP6.0 by 0.6 K for the 40-year period starting10 years after the implementation of geoengineering. Clear-sky top-of-atmosphere net shortwave flux is reduced by1.5 W m−2 in G4Foam relative to RCP6.0. This is achievedprimarily by the shortwave forcing over the subtropicalSH ocean gyres. Before accounting for feedbacks, temper-ature is more sensitive to the forcing applied in G4Foam
than G4SSA. However, global mean surface temperature inG4SSA is 0.3 K lower than G4Foam because of a largerchange in all-sky top-of-atmosphere net shortwave flux(Fig. 3). Additionally, the latitudinal distribution of tem-perature reduction is different in G4Foam than in G4SSA.G4SSA is most effective in cooling the NH continents, whileG4Foam most effectively cools the surface south of around30◦ N (Fig. 4).
Precipitation over land globally, in the tropics, during JJAglobally, and during JJA in the tropics is statistically signif-icantly increased in G4Foam relative to both G4SSA andRCP6.0 (Fig. 7). The increase in precipitation in G4Foamrelative to RCP6.0 is very likely undesirable in areas that al-ready receive a lot of rainfall. The combination of coolingand increased precipitation over land in the tropics resultsin a statistically significant increase in precipitation minusevaporation on an annual mean basis over Central America,the Northern Amazon, the Sahel, the Indian subcontinent, theMaritime Continent and Southeast Asia in G4Foam relativeto G4SSA (Fig. 8). All of these areas are very densely pop-ulated and heavily cultivated. Water scarcity is a major is-
Atmos. Chem. Phys., 17, 595–613, 2017 www.atmos-chem-phys.net/17/595/2017/
C. J. Gabriel et al.: The G4Foam Experiment: global climate impacts 609
Figure 9. 2030–2069 monthly mean annual cycle of zonalmean precipitation (mm day−1) for (a) G4Foam minus G4SSAand (b) G4Foam minus RCP6.0, precipitation minus evaporation(mm day−1) for (c) G4Foam minus G4SSA and (d) G4Foam minusRCP6.0, and total precipitable water (mm) for (e) G4Foam minusG4SSA and (f) G4Foam minus RCP6.0.
sue in many of these areas and G4Foam describes a climatemodel response in which there is global cooling, but higherP −E is modeled for many regions, some of which are inneed of greater water supply. However, in order to assess ac-tual changes in water supply, it would be necessary to analyzeextreme events, as well as the economic and policy issuesthat ultimately determine the allocation of water resources ina given region.
Finally, both the changes in the spatial pattern and mag-nitude of changes in temperature and precipitation are fartoo large to be explained by the forcing alone. Instead, muchof the temperature and hydrological response is the result ofpowerful cloud feedbacks and changes in the tropical merid-ional overturning circulation induced by the placement of theocean albedo forcing.
4.2 The hydrological response
The dominant cause of the G4Foam hydrological response isthe intensification of the southern Hadley cell and the north-
Figure 10. (a) Photosynthesis rate differences between G4SSA andRCP6.0 during years 2030–2069 (sulfate injection period, exclud-ing the first 10 years; Fig. 4a from Xia et al., 2016). (b) Photosynthe-sis rate anomaly between G4Foam and RCP6.0 during years 2030–2069 of solar reduction. Hatched regions are areas with p > 0.05(where changes are not statistically significant based on a pairedt test).
ward migration of the ITCZ in response to the asymmetricforcing. However, the precipitation response is not zonallyhomogeneous, as the regional and local mechanisms are alsoimportant to the distribution of precipitation.
First, we address the increase in precipitation over CentralAmerica. For this, we turn to literature concerning the de-cline of Mayan civilization in Central America. Summer in-solation in the NH began to decrease about 5000 years ago.The ITCZ migrated southward. This southward shift causedrainfall to decrease in the crucial summer growing season.Long droughts and eventually water shortages contributed tothe civilization’s decline (Poore et al., 2004). In G4Foam, theITCZ moves northward and the areas in which Mayan civ-ilization flourished, including Belize, Guatemala and partsof Mexico, once again receive a great deal more precipita-tion. This response is strong and consistent in each ensemblemember (Figs. 6–8).
The long mid-to-late 20th century Sahel drought was pri-marily caused by the ITCZ being pushed southward by pref-erential cooling of the NH (Folland, 1986). In G4Foam, thereverse is true. SH cooling pushes the ITCZ north, which
www.atmos-chem-phys.net/17/595/2017/ Atmos. Chem. Phys., 17, 595–613, 2017
610 C. J. Gabriel et al.: The G4Foam Experiment: global climate impacts
generally explains the G4Foam precipitation increase in theSahel.
A surprising finding is that portions of the Arabian Penin-sula equatorward of 20◦ S experience precipitation increasesof up to 1 mm day−1 during the JJA season. However, thisnorthward migration of boreal summer precipitation is evi-dent in the paleoclimate record. Evidence of such precipita-tion is found in Fleitmann et al. (2003), who showed changesin δ18O in cave stalagmites in Oman, which indicate in-creased rainfall in Oman under the influence of northwardmovement of the ITCZ over the Indian Ocean in periods ofrelative warmth in the NH relative to the SH.
Changes in precipitation over the Maritime Continent arepartially attributable to large-scale convergence and rising airin those regions, as they lie longitudinally between G4Foamforcing zones where subsidence is enhanced. However, theIndian Ocean dipole (Cai et al., 2012; Chowadry et al., 2012)and subtropical Indian Ocean dipole (SIOD) phenomena dis-cussed below are more likely to be the key drivers of the pre-cipitation response over the Maritime Continent.
In its positive phase, the SIOD features anomalously warmSSTs in the southwestern Indian Ocean, east and southeast ofMadagascar, and cold anomalies of SST west of Australia.Stronger winds prevail along the eastern edge of the SH sub-tropical high over the Indian Ocean, which becomes inten-sified and shifted slightly to the south during positive SIODevents. This results in more evaporation over the eastern In-dian Ocean, which cools SSTs in the Indian Ocean east ofAustralia (Suzuki et al., 2004). In the SIOD negative phase,the opposite is true. There is cooler water in the southwestIndian Ocean, near Madagascar, and warmer waters to theeast, near Australia (Behera et al., 2001; Reason, 2001).
The negative phase of the SIOD features more precipita-tion in western Australia and the Maritime Continent. Thisnegative SIOD phase is consistent with the SST pattern inthe Indian Ocean forced by G4Foam. Therefore, the negativeSIOD-like mean state in G4Foam appears to play a role in theenhanced rainfall in northwestern Australia and the MaritimeContinent.
Based on both local and global changes in circulation, weexpected a very large increase in the strength of the Indianmonsoon. In addition to the planetary-scale changes asso-ciated with the ITCZ and the Hadley cell, the position ofthe semi-permanent high in the subtropical southern IndianOcean also plays a large role in modulating the Indian sum-mer monsoon. Negative SIOD events during boreal winterare often followed by strong Indian summer monsoons. Dur-ing a negative SIOD event, the subtropical high in the IndianOcean shifts northeastward as the season shifts from Decem-ber, January, and February to JJA. This causes a strengthen-ing of the monsoon circulation, intensifying the Hadley celllocally during the JJA monsoon.
A negative IOD is associated with a weakened Asian mon-soon and an increase in precipitation over Australia and theMaritime Continent. In G4Foam, advection of cold water in
the Somali current into the equatorial western Indian Oceancreates a negative IOD-like response that partially countersthe combination of the global-scale Hadley cell responseand the forced SIOD, dampening the overall increase in theIndian monsoon. This warm west–cold east mean state inthe equatorial Indian Ocean resembles a negative IOD meanstate and it helps to explain the enhanced precipitation re-sponse in the Maritime Continent and the lower than ex-pected increase in precipitation over the Indian subconti-nent. The Asian monsoon and precipitation over the Mar-itime Continent are also governed in part by ENSO. How-ever, no changes in ENSO were evident in G4Foam rel-ative to G4SSA or RCP6.0. There is also no evident re-sponse of ENSO amplitude or frequency to any of several dif-ferent regimes of stratospheric geoengineering (Gabriel andRobock, 2015).
4.3 Caveats
The technology does not presently exist to actually deploy astable, highly reflective layer of microbubbles on the oceansurface. While a stable, highly reflective, nondispersive foamhas been developed in a saltwater solution, appropriate forclimate engineering, this foam has not been tested outsidethe laboratory, much less on the surface of a large area ofrarely quiescent ocean. The foam has not been immersed ina medium in which bacteria are present, and the interactionbetween the bacteria and the protein surfactant could damagethe layer of microbubbles. Also, even though the diameter ofthese microbubbles is on the order of 10−6 m, the demandfor surfactant would likely overwhelm our current produc-tion capacity of whatever surfactant is chosen. The researchon the engineering required to perform stratospheric geo-engineering by sulfate injection is much further along thanresearch of microbubble deployment, which is still in its ear-liest stages.
However, since development of microbubble technologyis underway, it is worthwhile to determine how such a tech-nology could be applied in a manner that would address se-rious climate issues. The progress being made in researchassociated with stratospheric geoengineering actually en-hances the relevance of researching the climate impact ofthis particular ocean surface geoengineering approach, asG4Foam was designed with an eye toward concurrent de-ployment with stratospheric geoengineering in the event thatthe stratospheric geoengineering were to cause the precip-itation deficits that many model studies have shown that itmight.
More fundamentally, the propriety of any attempt to im-pose a the G4Foam forcing in an attempt to achieve themodeled G4Foam climate is premised on a value judgmentthat it is desirable to develop a technology that could re-distribute essential resources between nations, in an attemptto achieve a net benefit to humanity as a collective whenit knowingly creates a local scarcity of these essential re-
Atmos. Chem. Phys., 17, 595–613, 2017 www.atmos-chem-phys.net/17/595/2017/
C. J. Gabriel et al.: The G4Foam Experiment: global climate impacts 611
sources. To some extent, making this value judgment is ger-mane and is a prerequisite to the discussion of any form ofgeoengineering. Even though G4Foam would be successfulin increasing P −E in more heavily populated areas, P −Ewill almost certainly be reduced in remote regions, such asSouth Pacific islands. Is it ethical to pick winners and loserswhen the selection process is aimed at increasing the numberof winners and decreasing the number of losers? Hypothet-ically, if G4Foam worked as described in this paper, from apurely consequentialist perspective, and with the sole objec-tive being increased utility for the human collective, G4Foamcould be considered beneficial.
Finally, this paper is concerned with the climate responseto surface albedo changes. We do not examine how plac-ing an actual layer of microbubbles in the ocean wouldchange ocean circulation or impact chemistry and biologyin the ocean. Evaluating the changes in the ocean, espe-cially changes in its circulation that are caused by the sur-face albedo modification, is one of the next issues to explore.The ocean regions we propose to brighten have low biologi-cal productivity and weak currents, but the possibility of re-mote impacts, due to changes in circulation having negativeimpacts on important ocean regions, is worth considering.
4.4 Future research
Whether or not a concurrent deployment of stratosphericgeoengineering and ocean albedo modification could cool theentire planet while maintaining or enhancing the hydrologi-cal cycle, particularly in the tropics, is the next natural step inthis research. Such research is motivated by the need to de-termine whether some combination of geoengineering tech-niques can be used to offset regional climate disparities thatusing one method of geoengineering alone could induce.
5 Data availability
Descriptions of data and links to output of this andother GeoMIP experiments, can be found at the Ge-oMIP homepage http://climate.envsci.rutgers.edu/GeoMIP/data.html. Additional data from this experiment can be foundat http://climateresearch.envsci.rutgers.edu/corey. The un-derlying research data can be accessed by contacting the cor-responding author at [email protected].
Acknowledgements. We thank two anonymous referees for theirvaluable comments, which improved this paper. This work issupported by US National Science Foundation (NSF) grantsAGS-1157525, GEO-1240507, and AGS-1617844. Computersimulations were conducted on the National Center for Atmo-spheric Research (NCAR) Yellowstone supercomputer. NCARis funded by NSF. The CESM project is supported by NSF andthe Office of Science (BER) of the US Department of Energy.The Pacific Northwest National Laboratory is operated for theUS Department of Energy by Battelle Memorial Institute under
contract DE-AC05-76RL01830.
Edited by: L. M. RussellReviewed by: two anonymous referees
References
Aswathy, V. N., Boucher, O., Quaas, M., Niemeier, U., Muri, H.,Mülmenstädt, J., and Quaas, J.: Climate extremes in multi-modelsimulations of stratospheric aerosol and marine cloud brighten-ing climate engineering, Atmos. Chem. Phys., 15, 9593–9610,doi:10.5194/acp-15-9593-2015, 2015.
Aziz, A., Hailes, H. C., Ward, J. M., and Evans, J. R. G.: Long-term stabilization reflective foams in seawater, Roy. Soc. Ch., 95,53028–53036, 2014.
Behera, S. K. and Yamagata, T.: Subtropical SST dipole events inthe southern Indian Ocean, Geophys. Res. Lett., 28, 327–330,2001.
Bonan, G. B., Lawrence, P. J., Oleson, K. W., Levis, S., Jung,M., Reichstein, M., Lawrence, D. M., and Swenson, S. C.:Improving canopy processes in the Community Land Modelversion 4 (CLM4) using global flux fields empirically in-ferred from FLUXNET data, J. Geophys. Res., 116, G02014,doi:10.1029/2010JG001593, 2011.
Broccoli, A. J., Dahl, K. A., and Stouffer, R. J.: The response of theITCZ to Northern Hemisphere cooling, Geophys. Res. Lett., 33,L01702, doi:10.1029/2005GL024546, 2006.
Cai W., Van Rensch P., Cowan T., and Hendon H. H.: Telecon-nection pathways for ENSO and the IOD and the mechanismfor impacts on Australian rainfall, J. Climate, 24, 3910–3923,doi:10.1175/2011JCLI4129.1, 2011.
Chao, W. C. and Chen, B.: The origin of the monsoons, J. Atmos.Sci., 58, 3497–3507. 2001.
Chiang, J. C. H. and Bitz, C. M.: Influence of high latitude ice coveron the marine Intertropical Convergence Zone, Clim. Dynam.,25, 477–496, 2005.
Chowdary, J. S., Xie, S.-P., Tokinaga, H., Okumura, Y. M., Kub-ota, H., Johnson, N., and Zheng, X.-T.: Interdecadal varia-tions in ENSO teleconnection to the Indo–western Pacific for1870–2007, J. Climate, 25, 1722–1744, doi:10.1175/JCLI-D-11-00070.1, 2012.
Crutzen, P.: Albedo enhancement by stratospheric sulfur injections:A contribution to solve a policy dilemma?, Climatic Change, 77,211–219, 2006.
Cvijanovic, I., Caldeira, K., and MacMartin, D.G.: Impacts ofocean albedo alteration on Arctic sea ice restoration andNorthern Hemisphere climate, Environ. Res. Lett., 10, 044020,doi:10.1088/1748-9326/10/4/044020, 2015.
DeSzoeke, S. P., Verlinden, K. L., Yuter, S. E., and Mechem, D. B.:The Time Scales of Variability of Marine Low Clouds, J. Cli-mate, 29, 6463–6481, doi:10.1175/JCLI-D-15-0460.1, 2016.
Dykema J. A., Keith D. W., Anderson J. G., and Weisenstein,D.: Stratospheric controlled perturbation experiment: a small-scale experiment to improve understanding of the risks ofsolar geoengineering, Philos. T. R. Soc. A, 372, 20140059,doi:10.1098/rsta.2014.0059, 2014.
www.atmos-chem-phys.net/17/595/2017/ Atmos. Chem. Phys., 17, 595–613, 2017
612 C. J. Gabriel et al.: The G4Foam Experiment: global climate impacts
Emori, S. and Brown, S. J.: Dynamic and thermodynamic changesin mean and extreme precipitation under changed climate, Geo-phys. Res. Lett., 32, L17706, doi:10.1029/2005GL023272, 2005.
Fleitmann, D., Burns, S. J., Mudelsee, M., Neff, U., Kramers, J.,Mangini, A., and Matter, A.: Holocene forcing of the Indianmonsoon recorded in a stalagmite from Southern Oman, Science,300, 1737–1739, 2003.
Folland, C. K., Parker, D. E., and Palmer, T. N.: Sahel rainfalland worldwide sea temperatures 1901–85, Nature, 320, 602–607,1986.
Frierson, D. M. W. and Hwang, Y.-T.: Extratropical influence onITCZ shifts in slab ocean simulation of global warming, J. Cli-mate, 25, 720–733, 2012.
Gabriel, C. J. and Robock, A.: Stratospheric geoengineering im-pacts on El Niño/Southern Oscillation, Atmos. Chem. Phys., 15,11949–11966, doi:10.5194/acp-15-11949-2015, 2015.
George, R. C. and Wood, R.: Subseasonal variability of low cloudradiative properties over the southeast Pacific Ocean, Atmos.Chem. Phys., 10, 4047–4063, doi:10.5194/acp-10-4047-2010,2010.
Haywood, J. M., Jones, A., Bellouin, N., and Stephenson,D.: Asymmetric forcing from stratospheric aerosols im-pacts Sahelian rainfall, Nature Climate Change, 3, 660–665,doi:10.1038/nclimate1857, 2013.
Held, I. M. and Soden, B. J.: Robust responses of the hydrologicalcycle to global warming, J. Climate, 19, 5686–5699, 2006.
Hurley, J. V. and Boos, W. R.: Interannual variability of monsoonprecipitation and local subcloud equivalent potential tempera-ture, J. Climate, 26, 9507–9527, 2013.
Hwang, Y.-T., Frierson, D. M. W., and Kang, S. M.: Anthropogenicsulfate aerosol and the southward shift of tropical precipitationin the late 20th century, Geophys. Res. Lett., 40, 2845–2850,doi:10.1002/grl.50502, 2013.
IPCC: Summary for Policymakers, in: Climate Change 2013: ThePhysical Science Basis, Contribution of Working Group I to theFifth Assessment Report of the Intergovernmental Panel on Cli-mate Change, edited by: Stocker, T. F., Qin, D., Plattner, G.-K.,Tignor, M., Allen, S. K., Boschung, J., Nauels, A., Xia, Y., Bex,V., and Midgley, P. M., Cambridge University Press, Cambridge,UK and New York, NY, USA, 2013.
Irvine, P. J., Ridgwell, A., and Lunt, D. J.: Climatic effects ofsurface albedo geoengineering, J. Geophys. Res., 116, D24112,doi:10.1029/2011JD016281, 2011.
Jones, A., Haywood, J., and Boucher, O.: Climate impacts of geo-engineering marine stratocumulus clouds, J. Geophys. Res., 114,D10106, doi:10.1029/2008JD011450, 2009.
Kang, S. M., Held, I. M., Frierson, D. M. W., and Zhao, M.: Theresponse of the ITCZ to extratropical thermal forcing: Idealizedslab-ocean experiments with a GCM, J. Climate, 21, 3521–3532,2008.
Kay J. E., Wall C., Yettella V., Medeiros B., Hannay C., CaldwellP., and Bitz C.: Global climate impacts of fixing the SouthernOcean shortwave radiation bias in the community earth systemmodel (CESM), J. Climate, 96, 1333–13349, doi:10.1175/JCLI-D-15-0358, 2016.
Keith, D. W., Duren, R., and MacMartin, D. G.: Field experimentson solar geoengineering: report of a workshop exploring a repre-sentative research portfolio, Philos. T. R. Soc. A, 372, 20140175,2014.
Kharin, V. V., Zwiers, F. W., Zhang, X., and Hegerl, G. C.: Changesin temperature and precipitation extremes in the IPCC ensem-ble of Global Coupled Model Simulations, J. Climate, 20, 1419–1444, doi:10.1175/JCLI4066.1, 2007.
Kravitz, B., Robock, A., Boucher, O., Schmidt, H., Taylor, K.,Stenchikov, G., and Schulz, M.: The geoengineering model in-tercomparison project (GeoMIP), Atmos. Sci. Lett., 12, 162–167,doi:10.1002/asl.316., 2011.
Kravitz, B., Robock, A., Tilmes, S., Boucher, O., English, J. M.,Irvine, P. J., Jones, A., Lawrence, M. G., MacCracken, M.,Muri, H., Moore, J. C., Niemeier, U., Phipps, S. J., Sillmann, J.,Storelvmo, T., Wang, H., and Watanabe, S.: The GeoengineeringModel Intercomparison Project Phase 6 (GeoMIP6): simulationdesign and preliminary results, Geosci. Model Dev., 8, 3379–3392, doi:10.5194/gmd-8-3379-2015, 2015.
Lamarque, J.-F., Emmons, L. K., Hess, P. G., Kinnison, D. E.,Tilmes, S., Vitt, F., Heald, C. L., Holland, E. A., Lauritzen,P. H., Neu, J., Orlando, J. J., Rasch, P. J., and Tyndall, G.K.: CAM-chem: description and evaluation of interactive at-mospheric chemistry in the Community Earth System Model,Geosci. Model Dev., 5, 369–411, doi:10.5194/gmd-5-369-2012,2012.
Latham, J., Bower, K., Choularton, T., Coe, H., Connoly, P., Cooper,G., Craft, T., Foster, J., Gadian, A., Galbraith, L., Iacovides,H., Johnston, D., Launder, B., Leslie, B., Meyer, J., Neuker-mans, A., Ormond, B., Parkes, B., Rasch, P., Rush, J., Salter,S., Stevenson, T., Wang, H., Wang, Q., and Wood, R.: Ma-rine cloud brightening, Philos. T. R. Soc. A, 370, 4217–4262,doi:10.1098/rsta.2012.0086, 2012.
Lindzen, R. S. and Hou, A. Y.: Hadley circulations for zonally aver-aged heating centered off the equator, J. Atmos. Sci., 45, 2416–2427, 1988.
Manabe, S. and Stouffer, R. J.: Sensitivity of a global climate modelto an increase of CO2 concentration in the atmosphere, J. Geo-phys. Res., 85, 5529–5554, 1980.
Marcott, S. A., Shakun, J. D., Clark, P. U., and Mix, A. C.: Areconstruction of regional and global temperature for the past11 300 years, Science, 339, 1198–1201, 2013.
Mechoso, C., Wood, R., Weller, R., Bretherton, C. S., Clarke, A.,Coe, H., Fairall, C., Farrar, J. T., Feingold, G., and Garreaud,R.: Ocean-cloud-atmosphere-land interactions in the southeast-ern Pacific: The VOCALS Program, B. Am. Meteorol. Soc., 95,357–375, 2014.
Meehl, G. A., Arblaster, J. M., Caron, J. M., Annamalai, H.,Jochum, M., Chakraborty, A., and Murtugudde, R.: Monsoonregimes and processes in CCSM4. Part I: The Asian-AustralianMonsoon, J. Climate, 25, 2583–2608, 2012.
Meinshausen, M., Smith, S. J., Calvin, K., Daniel, J. S., Kainuma,M. L. T., Lamarque, J.-F., Matsumoto, K., Montzka, S. A., Raper,S. C. B., Riahi, K., Thomason, A., Velders, G. J. M., and vanVuuren, D. P. P.: The RCP greenhouse gas concentrations andtheir extension from 1765 to 2300, Climatic Change, 109, 213–241, doi:10.1007/s10584-011-0156-z, 2011.
Mengis, N., Martin, T., Keller, D. P., and Oschlies, A.: As-sessing climate impacts and risks of ocean albedo modifica-tion in the Arctic, J. Geophys. Res.-Oceans, 121, 3044–3057,doi:10.1002/2015JC011433, 2016.
Neale, R., Richter, J., Park, S., Lauritzen, P., Vavrus, S., Rasch,P., and Zhang, M.: The mean climate of the Community Atmo-
Atmos. Chem. Phys., 17, 595–613, 2017 www.atmos-chem-phys.net/17/595/2017/
C. J. Gabriel et al.: The G4Foam Experiment: global climate impacts 613
sphere Model (CAM4) in forced SST and fully coupled experi-ments, J. Climate, 26, 5150–5168, 2013.
Neely III, R. R., Conley, A. J., Vitt, F., and Lamarque, J.-F.: Aconsistent prescription of stratospheric aerosol for both radiationand chemistry in the Community Earth System Model (CESM1),Geosci. Model Dev., 9, 2459–2470, doi:10.5194/gmd-9-2459-2016, 2016.
Poore, R. Z., Quinn, T. M., and Verardo, S.: Century-scalemovement of the Atlantic Intertropical Convergence Zonelinked to solar variability, Geophys. Res. Lett., 31, L12214,doi:10.1029/2004GL019940, 2004.
Rasch, P. J., Latham, J., and Chen, C. C.: Geoengineering by cloudseeding: influence on sea ice and climate system, Environ. Res.Lett., 4, 45–112, doi:10.1088/1748-9326/4/4/045112, 2009.
Reason, C. J. C.: Subtropical Indian Ocean SST dipole events andsouthern African rainfall, Geophys. Res. Lett., 28, 2225–2228,doi:10.1029/2000GL012735, 2001.
Robock, A.: 20 reasons why geoengineering may be a bad idea, B.Atom. Sci., 64, 14–18, doi:10.2968/064002006, 2008.
Robock, A.: Bubble, bubble, toil and trouble. An editorial comment,Climatic Change, 105, 383–385, doi:10.1007/s10584-010-0017-1, 2011.
Robock, A.: Stratospheric aerosol geoengineering, Environ. Sci.Technol., 38, 162-185, 2014.
Robock, A.: Albedo enhancement by stratospheric sul-fur injection: More research needed, Earth’s Future, 4,doi:10.1002/2016EF000407, 2016.
Seitz, R.: Bright water: hydrosols, water conservation and climatechange, Climatic Change, 105, 365–381, 2010.
Siegenthaler, U., Stocker, T. F., Monnin, E., Luthi, D., SchwanderJ., Stauffer, B., Raynaud, D., Barnola, J. M., Fischer, H., Mas-son, Delmotte, V., and Jouzel, J.: Stable carbon cycle-climate re-lationship during the late Pleistocene, Science, 310, 1313–1317,2005.
Suzuki, R., Behera, S. K., Iizuka, S., and Yamagata, T.: The IndianOcean subtropical dipole simulated using a CGCM, J. Geophys.Res., 109, C09001, doi:10.1029/2003JC001974, 2004.
Taylor, K. E., Stouffer, R. J., and Meehl, G. A.: An overview ofCMIP5 and the experiment design, B. Am. Meteorol. Soc., 93,485–498, doi:10.1175/BAMS-D-11-00094.1, 2012.
Tilmes, S., Fasullo, J., Lamarque, J.-F., Marsh, D. R., Mills, M., Al-terskjaer, K., Muri, H., Kristjánsson, J. E., Boucher, O., Schulz,M., Cole, J. N. S., Curry, C. L., Jones, A., Haywood, J., Irvine,P. J., Ji, D., Moore, J. C., Karam, D. B., Kravitz, B., Rasch, P.J., Singh, B., Yoon, J.-H., Niemeier, U., Schmidt, H., Robock,A., Yang, S., and Watanabe, S.: The hydrological impact ofgeoengineering in the Geoengineering Model IntercomparisonProject (GeoMIP), J. Geophys. Res.-Atmos, 118, 11036–11058,doi:10.1002/jgrd.50868, 2013.
Tilmes, S., Mills, M. J., Niemeier, U., Schmidt, H., Robock, A.,Kravitz, B., Lamarque, J.-F., Pitari, G., and English, J. M.: Anew Geoengineering Model Intercomparison Project (GeoMIP)experiment designed for climate and chemistry models, Geosci.Model Dev., 8, 43–49, doi:10.5194/gmd-8-43-2015, 2015.
Tilmes, S., Lamarque, J.-F., Emmons, L. K., Kinnison, D. E.,Marsh, D., Garcia, R. R., Smith, A. K., Neely, R. R., Conley,A., Vitt, F., Val Martin, M., Tanimoto, H., Simpson, I., Blake,D. R., and Blake, N.: Representation of the Community EarthSystem Model (CESM1) CAM4-chem within the Chemistry-Climate Model Initiative (CCMI), Geosci. Model Dev., 9, 1853–1890, doi:10.5194/gmd-9-1853-2016, 2016.
Trenberth, K. E., and Dai, A.: Effects of Mount Pinatubovolcanic eruption on the hydrological cycle as an ana-log of geoengineering, Geophys. Res. Lett., 34, L15702,doi:10.1029/2007GL030524, 2007.
Wood, R. and Bretherton, C. S.: Boundary layer depth, entrainment,and decoupling in the cloud-capped subtropical and tropical ma-rine boundary layer, J. Climate, 17, 3576–3588, 2004.
Wood, R. and Bretherton, C. S.: On the relationship between strat-iform low cloud cover and lower-tropospheric stability, J. Cli-mate, 19, 6425–6432, 2006.
Xia, L., Robock, A., Tilmes, S., and Neely III, R. R.: Stratosphericsulfate geoengineering could enhance the terrestrial photosynthe-sis rate, Atmos. Chem. Phys., 16, 1479–1489, doi:10.5194/acp-16-1479-2016, 2016.
Xie, S.-P. and Philander, S. G. H.: A coupled ocean-atmospheremodel of relevance to the ITCZ in the eastern Pacific, Tellus,46A, 340–350, 1994.
www.atmos-chem-phys.net/17/595/2017/ Atmos. Chem. Phys., 17, 595–613, 2017