Embed Size (px)
Citation preview

www.csis.org |
Anthony H. Cordesman Arleigh A. Burke Chair in Strategy
The FY2015 Defense Budget and the QDR: Key Trends and Data Points ���
���
March 6, 2014
1800 K Street, NW Suite 400
Washington, DC 20006
Phone: 1.202.775.3270 Fax: 1.202.775.3199
Email: [email protected]
Web: www.csis.org/burke/reports

2
Putting the FY2015 Budget Submission in Context

3
OMB Projection of Total Federal Budget: 2013-2024
Source: http://www.whitehouse.gov/sites/default/files/omb/budget/fy2015/assets/budget.pdf, p. 168

4
The Projected Defense Share of the FY2015 Federal Budget: Winners and Losers Relative to FY2014
Source: Washington Post, March 5, 2015, http://www.washingtonpost.com/wp-srv/special/politics/presidential-budget-2015/

5
The President’s FY2015 Goal for Deficit Burden on the Economy
Source: http://www.whitehouse.gov/sites/default/files/omb/budget/fy2015/assets/budget.pdf, p. 8
6
America’s Long-Term Budget Deficit Trajectory
Note: “When President Obama took office in 2009 at the height of the recession, the annual budget deficit came in at 10.1 percent of gross domestic product -- a level not seen since the end of World War II. In the five years since, the budget deficit has been sliced more than half. New figures in Obama's just-released budget put it at only 3.7 percent of GDP in 2014….the recent reduction of the deficit has come primarily due to spending cuts instead of revenue increases. Spending has shrunk 4.1 percentage points from 2009 to today, while revenue has grown only 2.2 percentage points in the same period. To put it another way, there have been nearly $2 in spending cuts for every $1 in revenue increases.” Source: Washington Post, March 5, 2014, http://www.washingtonpost.com/blogs/wonkblog/wp/2014/03/04/explore-60-years-of-budget-deficits-in-one-chart/?hpid=z3

7
Key Trends in FY2015 Defense Budget Request

8
National Budget Summary of FY2015 Defense Request
Source: http://www.whitehouse.gov/sites/default/files/omb/budget/fy2015/assets/budget.pdf, pp. 56-57
Provides $495.6 billion in discretionary funding for the base budget of the Department of Defense to carry out our national defense strategy and protect national security. This includes:
• |Ending the war in Afghanistan and, pending the signing of a Bilateral Security Agreement maintaining a small force of Americans and international partners to train and assist Afghan forces and carry out limited counterterrorism operations in pursuit of any remnants of al Qaeda;
• Supporting Government-wide efforts to rebalance diplomatic, economic, and military resources to the Asia-Pacific region while also upholding responsibilities elsewhere;|
• Protecting the homeland and ensuring a safe, secure, and effective nuclear deterrent;|
• Sustaining our ability to project power and win decisively against both state adversaries and terrorist threats;
• Making progress toward restoring balance to the Joint Force by gradually raising readiness levels negatively impacted by sequestration while supporting the transition to a
• smaller military that is more agile and technologically superior;
• |Providing funds to recruit and retain the best-trained All-Volunteer Force; support military families; care for wounded, ill, and injured service members; make further, measurable progress toward eliminating sexual assault in the military; and help service members effectively transition to civilian life; and
• Sustaining investments in science and technology programs,
which drive innovation in military capabilities as well as in the civilian economy.
Opportunity, Growth, and Security Initiative: Through the Opportunity, Growth, and Security Initiative, supports:
• |Accelerated modernization of key weapons systems, faster progress toward restoring readiness lost under sequestration, and improvements to the Department’s facilities.
Reforms:
• Takes steps to slow the growth in military compensation and benefit costs to free up funds for training and modernization while ensuring we continue to honor and support our men and women in uniform.
• Retires aging aircraft and adjusts the planned acquisition and refurbishment of select naval assets, allowing for critical investments in new weapons systems and platforms.
• Aligns infrastructure with current needs and includes institutional reform efforts, such as a 20 percent cut in operating budgets for headquarters staff, which will consolidate duplicative efforts and streamline Department-wide management functions.

9
National Budget Summary of FY2015 National Intelligence Request
Source: http://www.whitehouse.gov/sites/default/files/omb/budget/fy2015/assets/budget.pdf, pp. 63
Provides $45.6 billion in base discretionary funding for the National Intelligence Program to support national security goals and reflect a deliberative process to focus funding on the most critical capabilities. This includes: • Funding to continue integrating intelligence across the Government to help policy officials make
decisions informed by the latest and most accurate intelligence available; • |Countering the proliferation of weapons of mass destruction by strengthening collection
capabilities; • |Supporting military operations around the world by addressing both current and future needs; • |Adapting to evolving cyberspace capabilities to help protect Federal networks, critical
infrastructure, and America’s economy, while improving the security of intelligence networks against intrusion and counterintelligence threats; and
• |Enhancing information sharing through expanded use of the IT cloud to facilitate greater efficiency and improved data security across the intelligence information environment.
Reforms: • Supports the new presidential policy directive that governs signals intelligence collection and
strengthens Executive Branch oversight of signals intelligence activities. • Continues efforts to rightsize the workforce and to preserve critical current and future mission
capabilities in the current fiscal environment. • Reduces lower priority programs to enable investments in the most critical National Intelligence
Program capabilities.

10
Budget Totals in President’s FY 2015 Budget Request DoD Topline, FY 2001 – FY 2019
Source: FY2015 Budget Request, OFFICE OF THE UNDER SECRETARY OF DEFENSE (COMPTROLLER) / CFO March 2014, p. 2.

11
FY2015 Spending by Category and Service
Source: FY2015 Budget Request, OFFICE OF THE UNDER SECRETARY OF DEFENSE (COMPTROLLER) / CFO March 2014, p. 12.

12
FY2015 versus FY2014 Baseline
Source: FY2015 Budget Request, OFFICE OF THE UNDER SECRETARY OF DEFENSE (COMPTROLLER) / CFO March 2014, p. 21.

13
FY2015 versus FY2014 Baseline FYDP
Source: FY2015 Budget Request Overview, OFFICE OF THE UNDER SECRETARY OF DEFENSE (COMPTROLLER) / CFO March 2014, p. I-4.

14
Force Level Changes

15
Key Force Goals in the FY2015 Request and 2014 QDR -I
Source: FY2015 Budget Request Overview, OFFICE OF THE UNDER SECRETARY OF DEFENSE (COMPTROLLER) / CFO March 2014, p. 2-4.
• Sustaining a world-class Army, capable of conducting the full range of operations on land, including prompt and sustained land combat, by maintaining a force structure that it can train, equip, and keep ready. To sustain this force, the Department will rebalance within the Army, across the Active, Guard, and Reserve components. The active Army will reduce its end strength from a war-time high of 570,000 to 440,000 to 450,000 personnel. The Army National Guard will continue its downsizing from a war-time high of 358,000 to 335,000 Soldiers, and the U.S. Army Reserve will reduce from 205,000 to 195,000 Soldiers. If sequestration-level cuts are imposed in FY 2016 and beyond, all components of the Army would be further reduced.
• • Preserving the Navy’s capacity to build security globally and respond to crises. While prioritizing day-to-day presence demands, the Navy will decommission some assets and modernize its fleets of surface ships, aircraft, and submarines to meet 21st Century threats. Current Littoral Combat Ship (LCS) production plans will either transition to a future LCS Flight or new-design small surface combatant with capabilities tailored to the emerging security situation.
• • Maintaining the role of the Marine Corps as a vital crisis response force, protecting its most important modernization priorities and ensuring readiness, but planning for an end strength of 182,000 active Marines. This end strength includes an increase of about 900 Marines for the Embassy Security Guard program, which will protect U.S. interests and installations abroad. If sequester-level cuts return, the Marines would be further reduced.
• Maintaining an Air Force with global power projection capabilities crucial for this updated defense strategy. Modernizing next generation Air Force combat equipment – to include fighters and bombers – particularly against advancing modern air defense systems. To free resources for these programs as well as to preserve investments in critical capabilities, the Air Force will reduce or eliminate capacity in some single-mission aviation platforms
16
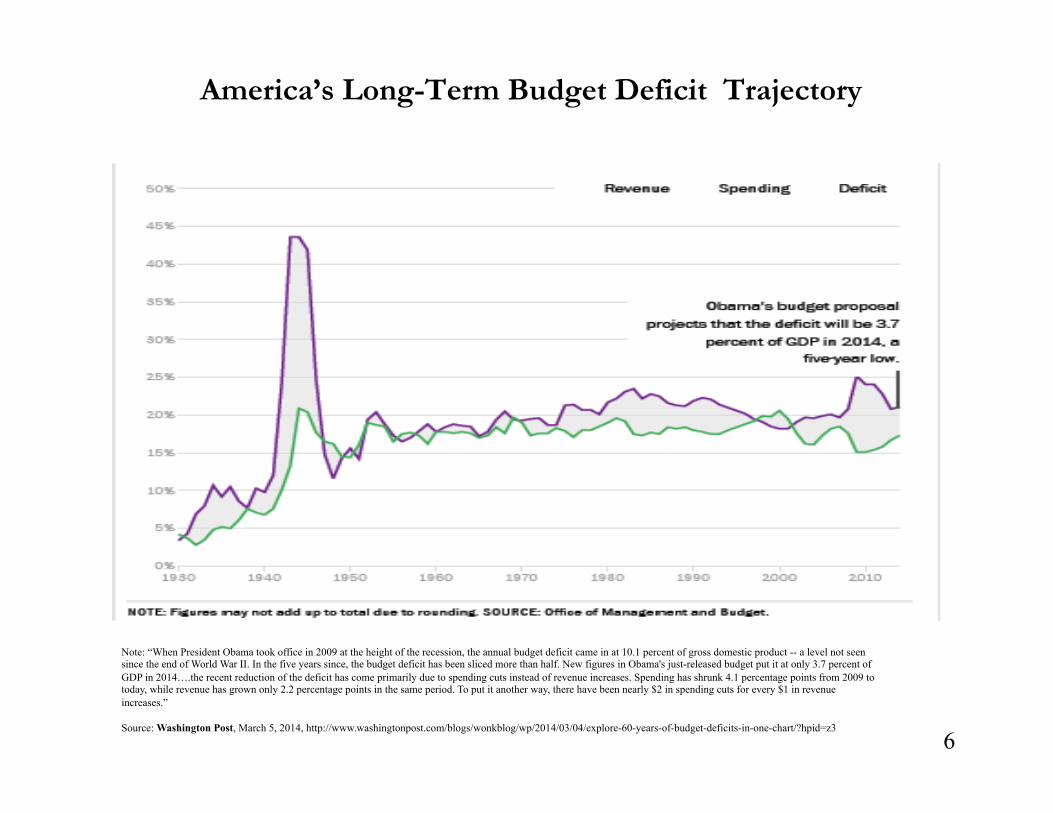
Key Force Goals in the FY2015 Request and 2014 QDR -II
Source: FY2015 Budget Request Overview, OFFICE OF THE UNDER SECRETARY OF DEFENSE (COMPTROLLER) / CFO March 2014, p. 2-5.
• Cyber. We will invest in new and expanded cyber capabilities and forces to enhance our ability to conduct cyberspace operations, and support military operations worldwide; to support Combatant Commanders as they plan and execute military missions; and to counter cyber-attacks against the United States.
• Missile Defense. We are increasing the number of Ground-Based Interceptors and deploying a second radar in Japan to provide early warning and tracking. DoD will make targeted investments in defensive interceptors, discrimination capabilities, and sensors; and is studying the best location for an additional missile defense interceptor site in the Eastern United States if additional interceptors are needed.
• Nuclear Deterrence. We will continue to invest in modernizing our essential nuclear delivery systems, warning, command and control, and, in collaboration with the Department of Energy, nuclear weapons and supporting infrastructure.
• Space. We will move toward less complex, more affordable, more resilient systems and system architectures and pursue a multi-layered approach to deter attacks on space systems, while retaining the capabilities to respond should deterrence fail.
• Precision Strike. We will procure advanced air-to-surface missiles that will allow fighters and bombers to engage a wide range of targets and a long-range anti-ship cruise missile that will improve the Joint ability of U.S. aircraft to engage surface combatants in defended airspace.
• Intelligence, Surveillance, and Reconnaissance (ISR). We will rebalance investments toward systems that are operationally responsive and effective in highly contested environments while sustaining persistent capabilities appropriate for more permissive environments in order to support global situational awareness, counter-terrorism, and other operations.
• Counter Terrorism and Special Operations. We will maintain overall Special Operations Forces end strength at more than 69,700 personnel, protecting our ability to sustain persistent, networked, distributed operations to defeat Al Qaeda, counter other emerging transnational threats, counter weapons of mass destruction, build the capacity of our partners, and support conventional operations.

17
Further Force and Military Personnel Cuts (without Sequester)
Source: FY2015 Budget Request, OFFICE OF THE UNDER SECRETARY OF DEFENSE (COMPTROLLER) / CFO March 2014, pp. 9-10.
• Air Force aircraft at 4,814 in FY 2019 (5,194 in FY 2014) • Retire A-10s • Retire U-2s
• Predators/Reapers levels at 55 CAPs in FY 2019 • Navy ships at 309 in FY 2019 (288 in FY 2014) 11 cruisers in long-
term phased modernization • Army BCTs and aviation brigades reduced

18
Manpower Levels: FY2014 vs. FY2015
Source: FY2015 Budget Request Overview, OFFICE OF THE UNDER SECRETARY OF DEFENSE (COMPTROLLER) / CFO March 2014, p. A-2.
Active Component End Strength – Base Budget (in Thousands)
Active Component End Strength – OCO Budget (in Thousands)
Active Component End Strength – Base + OCO Budget (in Thousands)

19
Reserve Forces: FY2014 vs. FY2015
Source: FY2015 Budget Request Overview, OFFICE OF THE UNDER SECRETARY OF DEFENSE (COMPTROLLER) / CFO March 2014, p. 6-6 and 6-7.

20
Civilian FTE Personnel Cuts (without Sequester)
Source: FY2015 Budget Request, OFFICE OF THE UNDER SECRETARY OF DEFENSE (COMPTROLLER) / CFO March 2014, pp. 5-16.

21
Force Levels: FY2014 vs. FY2015
Source: FY2015 Budget Request Overview, OFFICE OF THE UNDER SECRETARY OF DEFENSE (COMPTROLLER) / CFO March 2014, p. 8-11.

22
The Broad Goals in the QDR
Source: 2014 Quadrennial Defense Review, March 2014, p. v.
Protecting and advancing these interests, consistent with the National Security Strategy, the 2014 QDR embodies the 21st century defense priorities outlined in the 2012 Defense Strategic Guidance. These priorities include rebalancing to the Asia-Pacific region to preserve peace and stability in the region; maintaining a strong commitment to security and stability in Europe and the Middle East; sustaining a global approach to countering violent extremists and terrorist threats, with an emphasis on the Middle East and Africa; continuing to protect and prioritize key investments in technology while our forces overall grow smaller and leaner; and invigorating efforts to build innovative partnerships and strengthen key alliances and partnerships. The 2014 QDR builds on these priorities and incorporates them into a broader strategic framework. The Department’s defense strategy emphasizes three pillars: • Protect the homeland, to deter and defeat attacks on the United States and to
support civil authorities in mitigating the effects of potential attacks and natural disasters.
• Build security globally, in order to preserve regional stability, deter adversaries, support allies and partners, and cooperate with others to address common security challenges.
• Project power and win decisively, to defeat aggression, disrupt and destroy terrorist networks, and provide humanitarian assistance and disaster relief.

23
Rebalancing for the 21st Century
Source: 2014 Quadrennial Defense Review, March 2014, p. vii.
Rebalancing for a broad spectrum of conflict. Future conflicts could range from hybrid contingencies against proxy groups using asymmetric approaches, to a high-end conflict against a state power armed with WMD or technologically advanced anti-access and area-denial (A2/AD) capabilities. Reflecting this diverse range of challenges, the U.S. military will shift focus in terms of what kinds of conflicts it prepares for in the future, moving toward greater emphasis on the full spectrum of possible operations. Although our forces will no longer be sized to conduct large-scale prolonged stability operations, we will preserve the expertise gained during the past ten years of counterinsurgency and stability operations in Iraq and Afghanistan. We will also protect the ability to regenerate capabilities that might be needed to meet future demands. The Joint Force must also be prepared to battle increasingly sophisticated adversaries who could employ advanced warfighting capabilities while simultaneously attempting to deny U.S. forces the advantages they currently enjoy in space and cyberspace. We will sustain priority investments in science, technology, research, and development both within the defense sectorand beyond. The Department is taking steps to ensure that progress continues in areas most critical to meeting future challenges such as full-spectrum cyberspace capabilities and where the potential for game-changing breakthroughs appears most promising. We will actively seek innovative approaches to how we fight, how we posture our force, and how we leverage our asymmetric strengths and technological advantages. Innovation is paramount given the increasingly complex warfighting environment we expect to encounter.

24
QDR Force Level Goals: FY2019 -I
Source: FY2014 Quadrennial Defense Review March 2014, pp. 40-41.
Department of the Army* 18 divisions (10 Regular Army; 8 Army National Guard) 22 aviation brigades (10 Regular Army, 2 U.S. Army Reserve, and 10 Army National Guard) 15 Patriot air and missile defense battalions, 7 Terminal High-Altitude Area Defense (THAAD) missile defense batteries (all Regular Army) Department of the Navy 11 aircraft carriers (CVNs) and 10 carrier air wings (CVWs) 92 large surface combatants (68 DDG-51s, 3 DDG-1000s, and 21 CG-47s with 10-11 cruisers in temporary lay-up for modernization) 43 small surface combatants (25 LCS, 8 MCMs, and 10 PCs) 33 amphibious warfare ships (10 LHAs/LHDs, 11 LPDs, and 12 LSDs, with 1 LSD in temporary lay-up for modernization) 51 attack submarines (SSNs) and 4 guided missile submarines (SSGNs) Personnel end strength: 323,200 Active Component (AC); 58,800 Naval Reserve

25
QDR Force Level Goals: FY2019 -II
Source: FY2014 Quadrennial Defense Review March 2014, pp. 40-41.
Marine Corps 2 Marine Expeditionary Forces organized in 3 AC and 1 Reserve Component (RC) Division/Wing/Logistics Group teams 3 Marine Expeditionary Brigade Command Elements 7 Marine Expeditionary Unit Command Elements Personnel end strength: 182,000 AC; 39,000 RC Department of the Air Force* 48 fighter squadrons (26 AC; 22 RC) (971 aircraft) 9 heavy bomber squadrons (96 aircraft: 44 B-52, 36 B-1B, 16 B-2) 443 aerial refueling aircraft (335 KC-135, 54 KC-46, 54 KC-10) 211 strategic airlift aircraft (39 C-5, 172 C-17) 300 tactical airlift aircraft (C-130) 280 ISR aircraft (231 MQ-9, 17 RC-135, 32 RQ-4) 27 Command and Control Aircraft (18 E-3, 3 E-4, 6 E-8) 6 operational satellite constellations (missile warning, navigation and timing, wideband & protected SATCOM, environmental monitoring, multi-mission) Personnel end strength: 308,800 AC; 66,500 Air Force Reserve; 103,600 Air National Guard

26
Modernization and Investment

27
Modernization Goals for FY2015
Source: FY2015 Budget Request, OFFICE OF THE UNDER SECRETARY OF DEFENSE (COMPTROLLER) / CFO March 2014, p. 7.
• Cyber fully funded ($5.1B) • 34 JSF and continued RDT&E ($8B) 343 in FY15 – FY19 • 7 Ships ($14.4B) including 2 subs, 2 destroyers, 3 LCS 44 ships in
FY15 – FY19 • 8 P-8 Aircraft ($2.1B) 56 P-8s in FY15 – FY19 • Ballistic Missile Defense development ($8.5B) • Long Range Strike Bomber ($0.9B) / Ohio replacement submarine
development ($1.1B) • Investment in Helicopters ($8.4B) / Mobility Aircraft ($2.4B for
KC-46) / New Aircraft Engine Cancel Ground Combat Vehicle (new plan by year’s end)
• Delay Combat Rescue Helicopter • Consider alternatives to Littoral Combat Ship (LCS) program

28
Investment Spending FY2014 vs. FY2015
Source: FY2015 Budget Request Overview, OFFICE OF THE UNDER SECRETARY OF DEFENSE (COMPTROLLER) / CFO March 2014, p. 6-1.
29
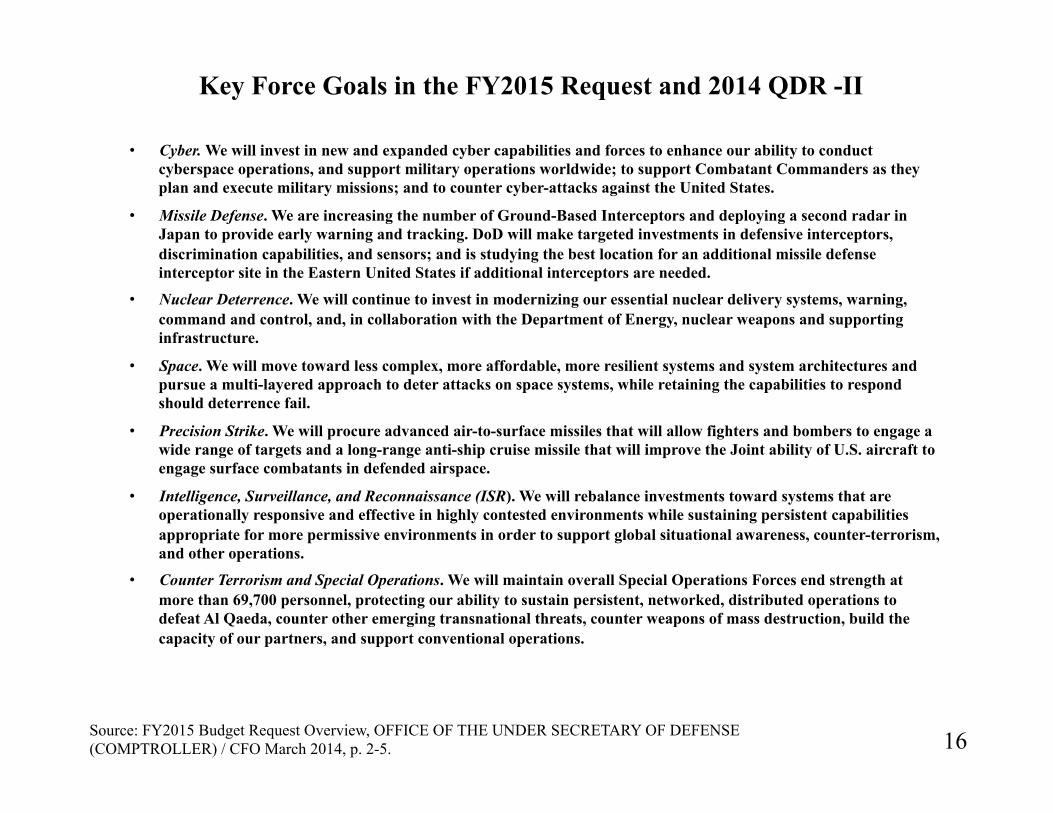
Major Acquisition Programs: FY2014 vs. FY2015 - I
Source: FY2015 Budget Request Overview, OFFICE OF THE UNDER SECRETARY OF DEFENSE (COMPTROLLER) / CFO March 2014, p. 6-2.

30
Major Acquisition Programs: FY2014 vs. FY2015 - II
Source: FY2015 Budget Request Overview, OFFICE OF THE UNDER SECRETARY OF DEFENSE (COMPTROLLER) / CFO March 2014, p. 6-2.
31
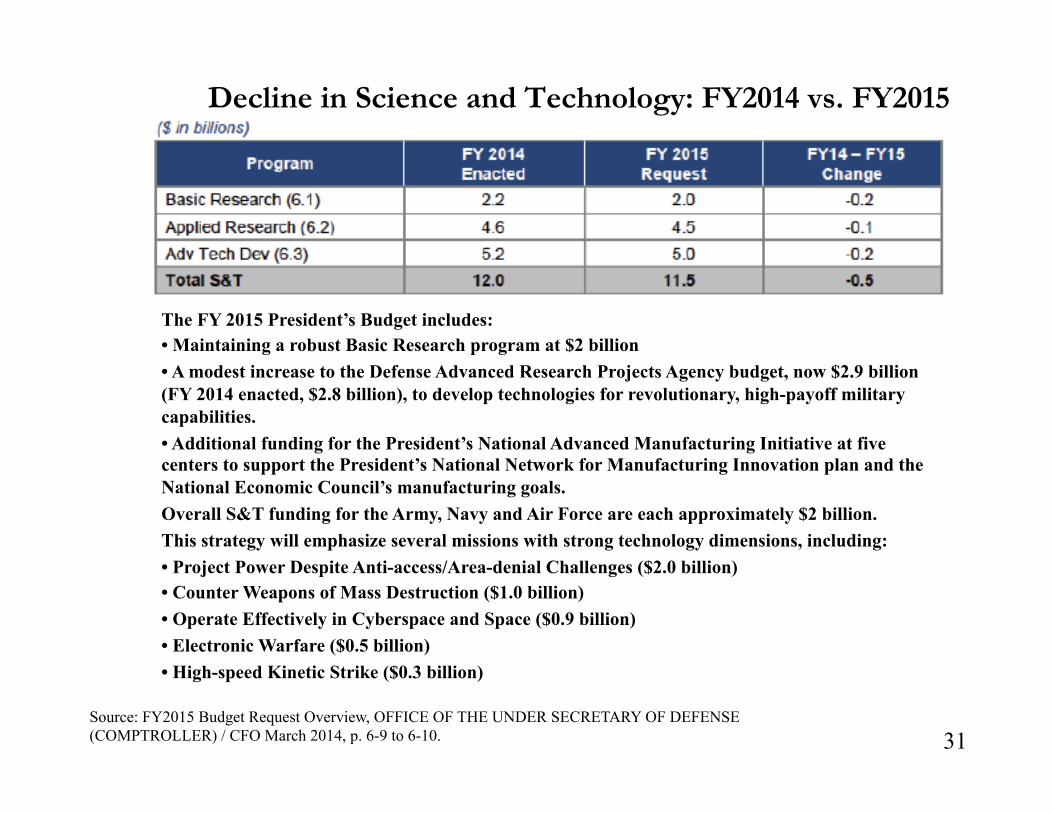
Decline in Science and Technology: FY2014 vs. FY2015
Source: FY2015 Budget Request Overview, OFFICE OF THE UNDER SECRETARY OF DEFENSE (COMPTROLLER) / CFO March 2014, p. 6-9 to 6-10.
The FY 2015 President’s Budget includes: • Maintaining a robust Basic Research program at $2 billion • A modest increase to the Defense Advanced Research Projects Agency budget, now $2.9 billion (FY 2014 enacted, $2.8 billion), to develop technologies for revolutionary, high-payoff military capabilities. • Additional funding for the President’s National Advanced Manufacturing Initiative at five centers to support the President’s National Network for Manufacturing Innovation plan and the National Economic Council’s manufacturing goals. Overall S&T funding for the Army, Navy and Air Force are each approximately $2 billion. This strategy will emphasize several missions with strong technology dimensions, including: • Project Power Despite Anti-access/Area-denial Challenges ($2.0 billion) • Counter Weapons of Mass Destruction ($1.0 billion) • Operate Effectively in Cyberspace and Space ($0.9 billion) • Electronic Warfare ($0.5 billion) • High-speed Kinetic Strike ($0.3 billion)

32
Readiness vs. Going Hollow

33
Gradually Restore Ready Force: O&M Grows 3.1%/yr
Source: FY2015 Budget Request, OFFICE OF THE UNDER SECRETARY OF DEFENSE (COMPTROLLER) / CFO March 2014, p. 8.
• Recover from sequestration impact and the past decade of high
deployment • Work to establish new readiness posture for the post-Afghanistan
period • Army: Contingency Response Force regionally aligned, forward
deployed, trained for decisive action • USMC: Crisis response, forward deployed, full spectrum combat
capability, reconstitute in stride • Navy: Operate forward, maintain global at-sea presence • Air Force: Begin to restore full range of operations • USSOCOM: Maintain full spectrum, global capabilities and regional
expertise •Cyber Operations: Continue to grow and train cyber mission force

34
Going Hollow Through FY2014
Source: FY2015 Budget Request Overview, OFFICE OF THE UNDER SECRETARY OF DEFENSE (COMPTROLLER) / CFO March 2014, p. 3-2.
• The Army produced just 2 of 43 active duty brigade combat teams fully
ready and available to execute a major combat operation. During FY 2013, the Army was forced to cancel full-spectrum training for seven brigade combat teams. It takes 1 year to build full readiness for unified land operations.
• The Navy’s average global presence was down about 10 percent from normal levels with fewer ships patrolling the waters.
• Only 50 percent of non-deployed Marine units were at acceptable readiness levels.
• Air Force was forced to stand-down 13 combat units for several months due to the FY 2013 sequester. In addition to standing down combat units, the Air Force cancelled Red Flag training events, ultimately affecting 20 U.S. and coalition squadrons. It will take at least 3 to 6 months to recover to already low readiness levels and will inflict lasting institutional impacts.
• Because Special Operations Forces (SOF) depend on conventional forces to provide enabling and logistics support for training and operational force packaging, degraded readiness across the Services began to directly impact SOF training and readiness.

35
Gradually Restore Ready Force: O&M Grows 3.1%/yr
Source: FY2015 Budget Request, OFFICE OF THE UNDER SECRETARY OF DEFENSE (COMPTROLLER) / CFO March 2014, p. 8.
• Recover from sequestration impact and the past decade of high
deployment • Work to establish new readiness posture for the post-Afghanistan
period • Army: Contingency Response Force regionally aligned, forward
deployed, trained for decisive action • USMC: Crisis response, forward deployed, full spectrum combat
capability, reconstitute in stride • Navy: Operate forward, maintain global at-sea presence • Air Force: Begin to restore full range of operations • USSOCOM: Maintain full spectrum, global capabilities and regional
expertise •Cyber Operations: Continue to grow and train cyber mission force

36
Fighting Sequestration, but Well Below FY2014
Challenge

37
President’s FY 2015 DoD Topline Request Versus FY2014 Request and Sequestration Level
Source: FY2015 Budget Request, OFFICE OF THE UNDER SECRETARY OF DEFENSE (COMPTROLLER) / CFO March 2014, p. 15.

38
Impact of Cutting FY2015 Request to Sequestration Level
Source: FY2015 Budget Request, OFFICE OF THE UNDER SECRETARY OF DEFENSE (COMPTROLLER) / CFO March 2014, p. 16.
• Topline down $115B in FY 2015 – FY 2019 • End-strength cuts deeper than pre-sequester goals • Carriers and wings reduced below pre-sequester goals • Same proposed changes in military compensation • More force cuts (e.g., KC-10, Global Hawk Block 40,Predators/
Reapers) • Less recovery in readiness (O&M up 1.9%/yr, 3.1%/yr in
budget) • Less growth in procurement
• 326 JSF (343 in PB15 FYDP) • 36 Ships (44 in PB15 FYDP)
• RDT&E declines -1.3%/yr (grows 1.6% in PB15 FYDP) • No recovery in facilities funding

39
Impact of Cutting FY2015 Request to Sequestration Level on Military Manpower and Carriers
Source: FY2015 Budget Request, OFFICE OF THE UNDER SECRETARY OF DEFENSE (COMPTROLLER) / CFO March 2014, pp. 9, 11.

40
Limits to Navy Readiness Without Cuts to Sequestration Level
Source: USNF FY2015 Budget Overview, March 2014, pp. 8.

41
Pressure on Army Without Cuts to Sequestration Level
Source: US Army FY2015 Budget Overview, March 2014, pp. 5.

42
Impact of Cutting FY2015 Request to Sequestration Level on the US Air Force
force
Source: USAF FY2015 Budget Overview, March 2014, p 7,.

43
Efficiency vs. Cost Escalation:
More than Equal to the Impact of Sequestration

44
Six Fiscal Years of Cuts & Good(?) Intentions
Source: FY2015 Budget Request Overview, OFFICE OF THE UNDER SECRETARY OF DEFENSE (COMPTROLLER) / CFO March 2014, p. 4-1.
The FY 2015 budget continues the reform agenda advanced in the previous five budgets, but with greater emphasis on contracting and other efficiencies:
• FY 2010 budget: Focused on weapons programs, e.g., terminating F-22 fighter production and the VH-71 Presidential helicopter. • FY 2011 budget: Again focused on weapons programs, e.g., ended C-17 production and stopped pursuit of a second engine for the Joint Strike Fighter. • FY 2012 budget: Much more focus on DoD business operations, but plans included some changes in weapons programs. Also proposed military health care changes. • FY 2013 budget: Continued focus on DoD business operations, overhead activities and support functions. • FY 2014 budget: Continued focus on more effective use of resources, with greater emphasis on weapons programs and Military Construction. • FY 2015 plan: More focus on contracting efficiencies, controlling health care costs and reducing management headquarters.
Many of these efficiencies have been reinvested into higher priority military programs. Others have been used to accommodate lower defense budgets.

45
DoD’s Dream Fantasy of Major New Efficiency Savings = $94B
Source: FY2015 Budget Request, OFFICE OF THE UNDER SECRETARY OF DEFENSE (COMPTROLLER) / CFO March 2014, pp. 1.4.
$94B during FY2015 to FY 2019 Cumulative total of $339 Billion in Efficiency savings in FY2012 to FY2015 budget proposals PB15 five-year efficiency savings total about $94B • Key initiatives 20% cut in headquarters operating budgets
• Reduction in contractor funding • Civilian manpower restructuring • Health care cost savings • Terminating/deferring weapons programs and military construction
projects • BRAC round in 2017 (long-term savings) • Better Buying Power • Auditable financial statements
These are in addition to past plans that are being implemented
• FY 2012: $150B in FY12 – FY16 • FY 2013: $ 60B in FY13 – FY17 • FY 2014: $ 35B in FY14 – FY18

46
CBO Projection of Real Defense Spending Based on FY2014 Budget
Note that CBO Projects the Real Defense spending will be far higher than DoD projects due to ongoing failures to control cost escalation and budget real world costs

47
Impact of DoD Cost Escalation and Gap Between DoD Underestimates and Historical Reality
Source: CBO,” Approaches for Scaling Back the Defense Department’s Budget Plans,” March 2013, p. 15
Source: Congressional Budget Office. Notes: Shaded subcategories together account for 90 percent of cost growth from 2013 through 2021. DoD = Department of Defense; FYDP = Future Years Defense Program. a. CBO’s cost projection of DoD’s base budget is based on cost factors and growth rates that reflect the department’s actual experience and Congressional action in recent years. b. The FYDP-based cost projection is based on cost assumptions underlying DoD’s 2013 FYDP and on CBO’s extrapolation of those figures from 2018 through 2021. From 2013 to 2017, the projection equals the FYDP totals. …more than 90 percent of the estimated growth in costs arises in four particular areas: military cash compensation, military health care benefits, the acquisition of major weapon systems, and civilian compensation (see Table 2-2). Efforts to limit cost growth could have the most impact in those areas.

48
Cost Escalation Could Double the Impact of Sequestration - II
CBO,” Approaches for Scaling Back the Defense Department’s Budget Plans,” March 2013, p. 2
Note: DoD = Department of Defense; BCA = Budget Control Act of 2011 as amended by the American Taxpayer Relief Act of 2012; FYDP = Future Years Defense Program. a. This estimate is based on the assumption that DoD would receive 95.5 percent of funding made available for national defense. (That figure is based on DoD’s average share of that funding from 2002 to 2011.) b. CBO’s cost projection of DoD’s base budget is based on cost factors and growth rates that reflect the department’s actual experience and Congressional action in recent years. c. The FYDP-based cost projection is based on cost assumptions underlying DoD’s 2013 FYDP (issued in March 2012) and on CBO’s extrapolation of those figures from 2018 through 2021. From 2013 to 2017, the projection equals the FYDP totals. d. Nominal dollars were converted to 2013 dollars using CBO’s projection of the gross domestic product price index.

49
Cost Escalation Could Double the Impact of Sequestration - I
CBO,” Approaches for Scaling Back the Defense Department’s Budget Plans,” March 2013, p. 3
Note: DoD = Department of Defense; BCA = Budget Control Act of 2011 as amended by the American Taxpayer Relief Act of 2012; FYDP = Future Years Defense Program. a. CBO’s cost projection of DoD’s base budget is based on cost factors and growth rates that reflect the department’s actual experience and Congressional action in recent years. b. The FYDP-based cost projection is based on cost assumptions underlying DoD’s 2013 FYDP (issued in March 2012) and on CBO’s extrapolation of those figures from 2018 through 2021. From 2013 to 2017, the projection equals the FYDP totals. c. This estimate is based on the assumption that DoD would receive 95.5 percent of funding made available for national defense. (That figure is based on DoD’s average share of that funding from 2002 to 2011.) d. The automatic enforcement provisions do not establish a lower cap in 2013; instead, spending is reduced by sequestering (canceling) funding that has already been appropriated for that fiscal year. The amount shown for 2013 is CBO’s estimate of the funding available in DoD’s base budget after sequestration.

50
Impact of DoD Cost Escalation and Gap Between DoD Underestimates and Historical Reality
Source: CBO,” Approaches for Scaling Back the Defense Department’s Budget Plans,” March 2013, p. 15
Source: Congressional Budget Office. Notes: Shaded subcategories together account for 90 percent of cost growth from 2013 through 2021. DoD = Department of Defense; FYDP = Future Years Defense Program. a. CBO’s cost projection of DoD’s base budget is based on cost factors and growth rates that reflect the department’s actual experience and Congressional action in recent years. b. The FYDP-based cost projection is based on cost assumptions underlying DoD’s 2013 FYDP and on CBO’s extrapolation of those figures from 2018 through 2021. From 2013 to 2017, the projection equals the FYDP totals. …more than 90 percent of the estimated growth in costs arises in four particular areas: military cash compensation, military health care benefits, the acquisition of major weapon systems, and civilian compensation (see Table 2-2). Efforts to limit cost growth could have the most impact in those areas.

51
Soldier Benefits vs. Enough Soldiers

52
Trying to Bring Military Compensation Under Control
Source: FY2015 Budget Request, OFFICE OF THE UNDER SECRETARY OF DEFENSE (COMPTROLLER) / CFO March 2014, p. 64.
Principles followed: • No one’s pay and allowances are cut • Fully support All-Volunteer Force •Compensation sufficient to recruit and
retain needed personnel • Use savings to pay for training and maintenance
• Major initiatives –Basic pay raise limited to 1% in FY 2015, also limits beyond
• Exception: General Officer/Flag Officer pay frozen in FY 2015 • Slow growth in Basic Allowance for Housing until out of pocket averages
5% • Eliminate renters insurance from Basic Allowance for Housing rates
• Reduce commissary subsidy by $1 billion over three years •No direction to close commissaries
• Consolidate TRICARE healthcare plans with altered deductible/co-pays • Resubmit previous TRICARE-For-Life and pharmacy proposals •But not
previous TRICARE Prime fee increases

53
FY2015 PB Military Compensation Proposals
Source: FY2015 Budget Request Overview, OFFICE OF THE UNDER SECRETARY OF DEFENSE (COMPTROLLER) / CFO March 2014, p. 5-5.

54
CBO Projection of Annual Increases in Military Basic Pay: 2001-2017
Source:” Coasts of Military Pay and Benefits in the Defense Budget,” November 2012, p.
Source: Department of Defense. Notes: Basic pay is the main (and typically the largest) component of military pay. All service members receive basic pay, the amount of which depends on the member’s pay grade—based on military rank—and on the number of years that he or she has served. DoD = Department of Defense; FYDP = Future Years Defense Program.

55
CBO Projection of Real Rise in Operations Costs per Active Duty Service Member in Base Budget: 1980-2022
Source: Congressional Budget Office. Note: DoD = Department of Defense; FYDP = Future Years Defense Program; n.a. = not applicable (because the option does not affect that category). a. CBO’s cost projection of DoD’s base budget is based on cost factors and growth rates that reflect the department’s actual experience and Congressional action in recent years. b. The FYDP-based cost projection is based on cost assumptions underlying DoD’s 2013 FYDP and on CBO’s extrapolation of those figures from 2018 through 2021. From 2013 to 2017, the projection equals the FYDP totals. From 1980 to 2001, the last year before the beginning of the conflicts in Afghanistan and Iraq, funding in the operations category of DoD’s base budget increased at a roughly constant rate of about $2,000 per active-duty service member per year (after adjusting for inflation). Since 2001, however, operations costs per capita in the base budget have increased by an average of about $2,300 per year. (The large operations costs associated with the wars should be reflected in OCO budgets, not in the base budget.)
Source: CBO,” Approaches for Scaling Back the Defense Department’s Budget Plans,” March 2013, p. 34

56
CBO Projection of of Long-Term Cost of Military Health Spending Without Reform & Cost Controls: 2013-2022
Source:” Coasts of Military Pay and Benefits in the Defense Budget,” November 2012, p. 34

57
CBO Estimate of rising cost of Military Health Compensation: 2000-2012
Source:” Coasts of Military Pay and Benefits in the Defense Budget,” November 2012, “ p. 2

58
Hoping for $26 Billion More in FY2015?

59
$26 Billion Bet on the FY 2015 Opportunity, Growth, and Security Initiative
Source: FY2015 Budget Request, OFFICE OF THE UNDER SECRETARY OF DEFENSE (COMPTROLLER) / CFO March 2014, p. 14.
Total $26 billion for DoD •Readiness enhancements Training adds in Army
• Spares and logistics in Navy • Unit training in USMC • Training in Air Force
•Investment increases Army Helicopters (56) • Navy P-8 (8), E-2D Aircraft (1) • USMC Light Armored Vehicle • Air Force F-35 (2), C-130J (10), MQ-9 Aircraft (12) • Science and Technology ($335M)
•Installation support increases All Services increase base sustainment All Services add MilCon funding

60
Potential Impact of Opportunity, Growth, and Security Initiative on PB15 DoD Base-Budget Topline
Source: FY2015 Budget Request, OFFICE OF THE UNDER SECRETARY OF DEFENSE (COMPTROLLER) / CFO March 2014, p. 13.

61
OGS Goals for FY2015 - I
Source: FY2015 Budget Request Overview, OFFICE OF THE UNDER SECRETARY OF DEFENSE (COMPTROLLER) / CFO March 2014, pp. I-5 to I-6.
For FY 2015, the President’s Budget includes a separate, fully paid-for Opportunity, Growth, and Security (OGS) Initiative. The OGS Initiative, which is split evenly between defense and non-defense funding, shows how additional discretionary investments in 2015 can spur economic progress, promote opportunity, and strengthen national security. For the Department of Defense, the OGS Initiative proposes additional funding of $26.4 billion in FY 2015. Sequestration degraded readiness throughout the Joint Force by requiring sharp cuts to training, maintenance, and support. More than a decade of war contributed to readiness problems. Although the base budget provides the resources needed to gradually restore readiness and balance, it does not provide funds to accelerate readiness improvements in FY 2015.
Making Faster Progress toward Restoring Readiness The OGS Initiative provides the resources needed in FY 2015 to make faster progress by supporting increased activity at depot maintenance facilities around the country; greater training support; and increases in funding for fuel, spare parts, and transportation costs. Some specific examples include increased readiness and training range support for the Air Force; increased training and base support for the Army; increased aviation depot maintenance funding for the Navy; and increased training and Intelligence, Surveillance, and Reconnaissance operations for U.S. Special Operations Command.
Accelerating Modernization of Key Weapons Systems: ….The OGS Initiative would allow DoD to accelerate the schedules for developing and buying new or upgraded systems in order to ensure that the United States maintains technological superiority over any potential adversaries. For example, the OGS Initiative provides enhanced resources for procurement of manned and unmanned aircraft, helicopters, ground vehicles, and communication systems.

62
OGS Goals for FY2015 - II
Source: FY2015 Budget Request Overview, OFFICE OF THE UNDER SECRETARY OF DEFENSE (COMPTROLLER) / CFO March 2014, pp. I-5 to I-6.
Some specific examples include the procurement of eight P-8, one E-2D, and three C-40 aircraft for the Navy; procurement of two H-1, one KC-130, and one C-12 aircraft for the Marine Corps; two F-35 aircraft, 10 C-130s, and 12 MQ-9 Reapers for the Air Force; and modernization of the Army’s helicopter and the Air Force’s C-130 programs. Improving DoD Facilities Around the Country Sequestration required significant cuts to funding for DoD facilities, forcing the Department to defer some sustainment, restoration, and modernization (SRM) costs as well as some military construction projects. The base budget provides the funds necessary to keep DoD bases, housing, and other facilities safe, secure, and operational in the near term but not enough to keep up with long-term deterioration. The OGS Initiative adds additional resources for SRM and construction at DoD installations across the country that will generate jobs and avoid some larger than necessary future costs to replace buildings, roads, runways, and other facilities

63
OGS Goals for FY2015 - III
Source: FY2015 Budget Request Overview, OFFICE OF THE UNDER SECRETARY OF DEFENSE (COMPTROLLER) / CFO March 2014, pp. I-5 to I-6.
• Army – Increase OPTEMPO, training, and Training Support System operations and services ($1.8 billion) – Increase base support and facility sustainment ($1.6 billion) – Procure 26 AH-64 Apache helicopters ($0.6 billion) – Procure 28 UH-60 Blackhawk helicopters ($0.5 billion) – Increase depot maintenance capabilities ($0.4 billion) – Procure 2 CH-47 Chinook helicopters ($0.1 billion) • Navy – Increase demolition and facility sustainment, recapitalization and modernization ($2.3 billion) – Procure 8 P-8A Poseidon aircraft ($1.1 billion) – Increase Military Construction ($1.2 billion) – Increase aviation logistics and maintenance ($0.3 billion) – Increase Permanent Change of Station (PCS) funding ($0.2 billion) • Marine Corps – Increase Military Construction ($0.3 billion) – Improve infrastructure readiness ($0.1 billion) – Increase field logistics support ($0.1 billion)

64
OGS Goals for FY2015 - IV
Source: FY2015 Budget Request Overview, OFFICE OF THE UNDER SECRETARY OF DEFENSE (COMPTROLLER) / CFO March 2014, pp. I-5 to I-6.
• Air Force – Increase facilities sustainment, maintenance, and repair ($1.6 billion) – Increase Military Construction ($1.4 billion) – Procure 10 C-130J series aircraft ($1.1 billion) – Increase readiness and training range support ($0.4 billion) – Procure 2 F-35 aircraft and associated modernization ($0.3 billion) – Procure 12 MQ-9 Reaper unmanned air systems ($0.2 billon) • United States Special Operations Command (USSOCOM) – Increase training, readiness and Intelligence, Surveillance and Reconnaisance (ISR) operations ($0.3 billion) – Recapitalize Command, Control, Communications, Computers and Intelligence (C4I) ($0.1 billion) • Missile Defense Agency – Procure additional radar spares ($0.2 billion)