Embed Size (px)
Citation preview

NOT FOR QUOTATION WITHOUT THE PERMISSION OF THE AUTHORS
THE FVTURE OF LUNG DISEASES: COPD MODEL FOR SLOVAKIA
M. R u s n a k A. Y a s h i n P. K r i s t q f e k
December 1985 CP-85-49
Collaborative P a p e r s r e p o r t work which has not been performed solely at t he International Institute for Applied Systems Analysis and which has received only limited review. Views or opinions expressed herein do not necessarily represen t those of t h e Institute, i ts National Member Organizations, or o the r organizations supporting the work.
INTERNATIONAL INSTITUTE FOR APPLIED SYSTEMS ANALYSIS 2361 Laxenburg, Austria

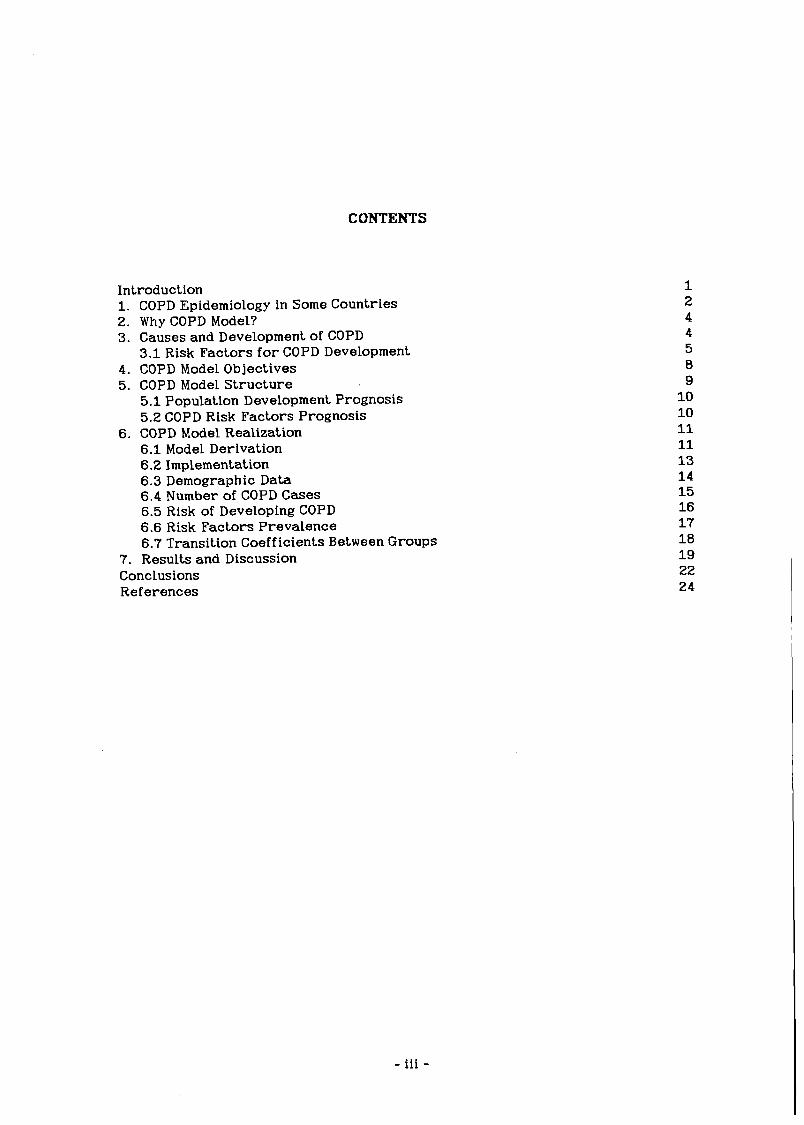
CONTENTS
Introduction 1. COPD Epidemiology in Some Countries 2. Why COPD Model? 3. Causes and Development of COPD
3.1 Risk Factors f o r COPD Development 4. COPD Model Objectives 5. COPD Model S t ruc ture
5.1 Population Development Prognosis 5.2 COPD Risk Factors Prognosis
6. COPD Model Realization 6.1 Model Derivation 6.2 Implementation 6.3 Demographic D a t a 6.4 Number of COPD Cases 6.5 Risk of Developing COPD 6.6 Risk Factors Prevalence 6.7 Transition Coefficients Between Groups
7. Results and Discussion Conclusions References
- iii -


THE FUTURE OF LUNG DISEASES: COPD MODEL FOR SLOVAKIA
M. Rusnak*, A. Yashin** and P. Kristufik***
INTRODUCTION
The initial explorations of bronchial t r e e pathology can be t raced back t o the
ear ly p a r t of the nineteenth century. Laennec w a s the f i r s t t o demonstrate the
so-called "catarrh pulmonaire" and i t s significance t o t he disease (Ba jan 1983). but
the attention of physicians centered upon tuberculosis and pneumonia up until the
1950s. The death of more than 4000-mainly older-people during a catastrophic
four-day smog in London (1952) and the realization tha t chronic bronchitis and i ts
complications were the fatal causes has proved the importance of studying this
group of diseases (Protivinski 1968).
Intensive research has demonstrated the necessity f o r a more precise defini-
tion of the group of illnesses described under the general term chronic nonspecif-
ic lung diseases. Common effor ts of specialists from all over the world have cul-
minated in accepted definitions of chronic bronchitis, pulmonary emphysema and
bronchial asthma by the World Health Organisation (WHO 1980). Recently, a com-
mon term has been used by mostly American authors f o r all of these diagnostic un-
its: chronic obstructive pulmonary disease (COPD).
Numerous studies have shown an undesirable spread of COPD in the developed
countries. The high and still growing prevalence of these diseases creates a bur-
den on health-care systems, which leads to an associated growth in health c a r e ex-
penditures and in the number of sick-leave cases and disabled people.
It is generally understood tha t the causes of COPD are largely from within the
society itself: life style (smoking), environmental (air) pollution, working condi-
tions, and social and economic circumstances are believed t o be responsible f o r
*Martin Rusnak, Research Institute for Medical Bionics, Jedlova 6, 883 08 Bratislava, Czechoslo- vakia **Anatoli Yashin, IIASA, A-2361 Laxenburg, Austria ***P. Kristufek, Institute for Pneumophtisiology and Geriatrics, Podunajske Biskuplce, 82556 Bra- tislava, Czechoslovakia
the onsets of these chronic diseases. The growth in COPD prevalence is influenced
by recent demographic trends, especially population aging.
The large proportion of people with these sicknesses makes a complete regis-
tration of a l l tine cases a practical impossibility. But COPD prevalence must be es-
timated in some way because of the necessity t o forecaste and plan appropriate
health care resources. We have developed an appropriate tool f o r the analysis of
possible trends and descr ibe COPD model in this paper . The authors hope tha t i t
will be of some help in answering specific questions about COPD development. The
model uses data from the Slovak Socialist Republic and allows the user t o test
several scenarios, as described in Chapter 7.
1. COPD EPIDEMIOLOGY IN SOME COUNTRIES
Much new information on COPD and i t s effect on the health of the population
has been revealed in numerous epidemiological studies. For example, i t w a s shown
tha t 17% of al l British general practit ioners in the i r fifties have symptoms of COPD,
as do 37.8% of older physicians (Pride 1977); Hutli from Finland found COPD in 27%
of the population surveyed (Press and Rufener-Press 1974) and the prevalence of
COPD in Sweden is estimated t o be less than 2% (Kirilog and Irnell 1974). Morbidity
of chronic bronchitis in the US differs according t o t he areas surveyed and the
chosen population groups: 23.5% in telephone companies' employees, 21.3% in the
inhabitants of smaller industrial towns, 11% in r u r a l areas (Mueller et al. 1971).
Other American surveys have revealed tha t 27% of t he male and 13% of the female
populations have symptoms and/or spirometric abnormalities indicating COPD (Hig-
gins and Keller 1970). Swiss data f o r the male population in Geneva found the oc-
cur rence of COPD t o be between 2.7% in men 20-29 years old and up t o 7.7% in men
over 60 years old (Press and Rufener-Press 1974).
There have been several epidemiological studies of COPD prevalence in
Czechoslovakia. In a group of 8298 men (52-67 years old) from Prague, 32% were
found t o have COPD. In r u r a l a reas , cases were found in 24.8% of men 40-64 years
old and in 7% of the women (Boudik et al. 1969b). From 1971 t o 1975, a group of
20000 men 15 years and older (in t he Czechoslovak area along the Danube r iver )
were checked f o r symptoms of COPD. Of this group, 18.4% were diagnosed as hav-
ing chronic bronchitis (Virsik et al. 1976).
The data on COPD mortality does not adequately descr ibe t he importance of
this disease in t he population. Several fac t s can explain this situation:
Frequent coincidence of COPD with o ther , especially cardiovascular, diseases;
Many physicians tend t o r e f e r t o complications of COPD r a t h e r than the main
disorder as a primary cause of death (Fletcher et al . 1964);
Sometimes t h e terminal bronchopneumonia o r o the r concomittant disease is
classified as a cause of death instead of COPD (Herles 1964).
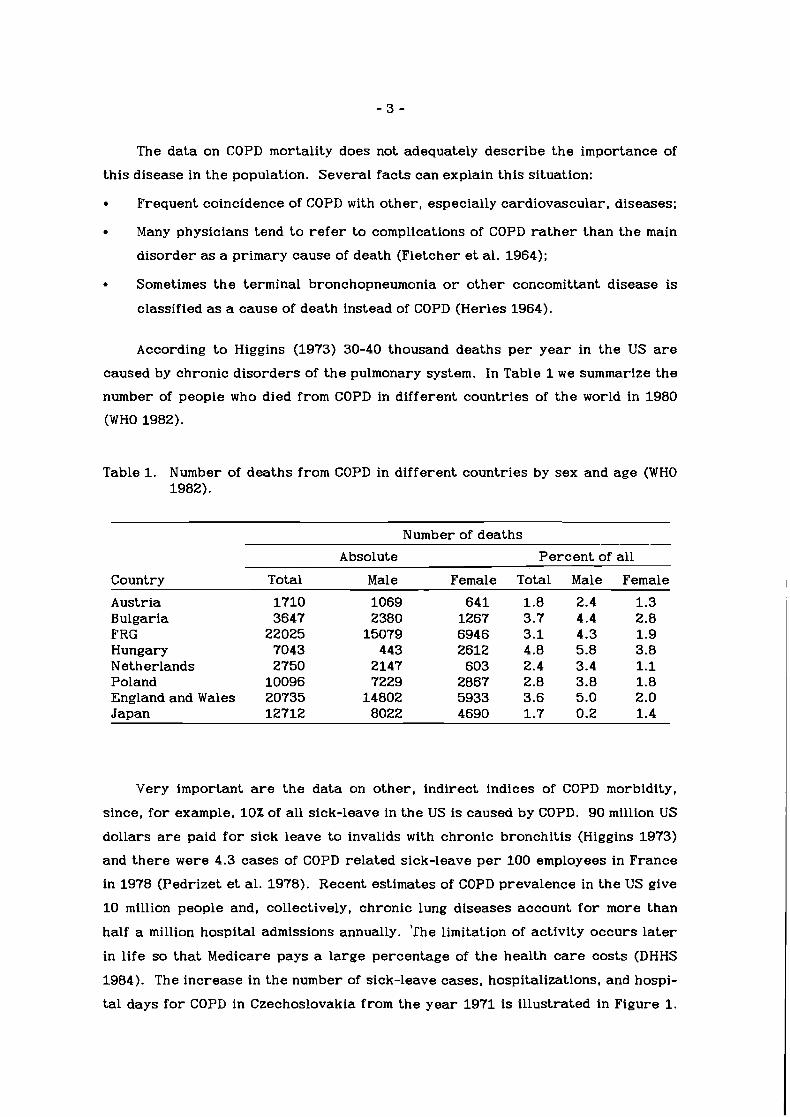
According t o Higgins (1973) 30-40 thousand deaths p e r yea r in t he US are
caused by chronic disorders of t he pulmonary system. In Table 1 w e summarize the
number of people who died from COPD in different countries of t h e world in 1980
(WHO 1982).
Table 1. Number of deaths from COPD in different countries by sex and age (WHO 1982).
Number of deaths
Country
Austria Bulgaria FRG Hungary Netherlands Poland England and Wales Japan
Absolute Percent of all
Total Male Female Total Male Female
1710 1069 641 1.8 2.4 1.3 3647 2380 1267 3.7 4.4 2.8
22025 15079 6946 3.1 4.3 1.9 7043 443 2612 4.8 5.8 3.8 2750 2147 603 2.4 3.4 1.1
10096 7229 2867 2.8 3.8 1.8 20735 14802 5933 3.6 5.0 2.0 12712 8022 4690 1.7 0.2 1.4
Very important are the data on other , indirect indices of COPD morbidity,
since, f o r example, 10% of all sick-leave in t he US is caused by COPD. 90 million US
dollars are paid f o r sick leave t o invalids with chronic bronchitis (Higgins 1973)
and the re were 4.3 cases of COPD related sick-leave p e r 100 employees in France
in 1978 (Pedrizet et al . 1978). Recent estimates of COPD prevalence in t h e US give
10 million people and, collectively, chronic lung diseases account f o r more than
half a million hospital admissions annually. ' lhe limitation of activity occurs l a t e r
in life s o t ha t Medicare pays a large percentage of t h e health care costs (DHHS
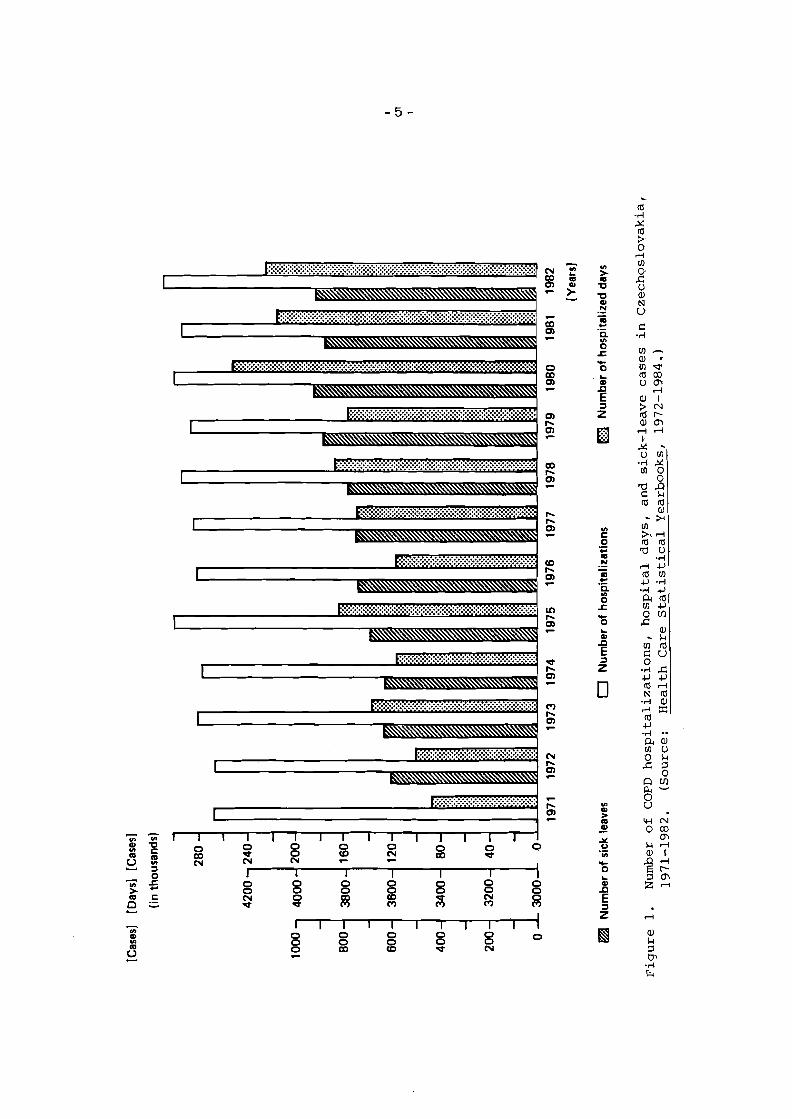
1984). The increase in t he number of sick-leave cases, hospitalizations, and hospi-
t a l days f o r COPD in Czechoslovakia from the yea r 1971 is illustrated in Figure 1.

- 4 -
The continuous increase of all t he indices is visible (CSSR zdravotnictvi 1983).
2. WHYA COPD MODEL?
Understanding the fac t s and recognizing t h e importance of t he effects of
chronic, noninfectious diseases on the health s ta tus of population led us t o design
a COPD mathematical model. The aim of the model i s to facilitate the estimation of
COPD prevalence and i ts development as the basis f o r creating a rational forecast
of health care development. I t could s e rve as a test f o r various hypotheses about
the development of t h e illness in t h e affected population. The scope of t h e model i s
broader than t h e health care system itself, since i t includes aspects of social c a r e ,
environment, and economics. This integrative approach introduces quantitative
expressions f o r new ideas tha t frequently appea r in t h e l i t e ra ture on health care
and clinical medicine. The model is based on an understanding of t he causes and
r isk fac tors responsible f o r t he onset and development of COPD.
3. CAUSES AND DEYELOPMENT OF COPD
Chronic obstructive pulmonary disease is one of t he typical illnesses in t h e
developed world. I ts etiology i s usually described as multicausal. The exact origin
of this type of disease during the life span i s often undetectable which complicates
t he exac t disclosure of t he causative factor . In t he i r daily pract ice , medical doc-
tors usually only face t h e full manifestations of clinical symptoms. The relation-
ship of these manifestations t o t he primary causes is often impossible t o analyze in
detail (Bajan 1968).
Several epidemiological studies undertaken in various countries have furth-
e r ed o u r understanding of many etiopathogenetic factors in COPD development.
From the clinical and pract ical point of view, i t i s possible t o divide these into four
categories (Halak and Bajan 1976):
biological
physical
chemical
allergical.
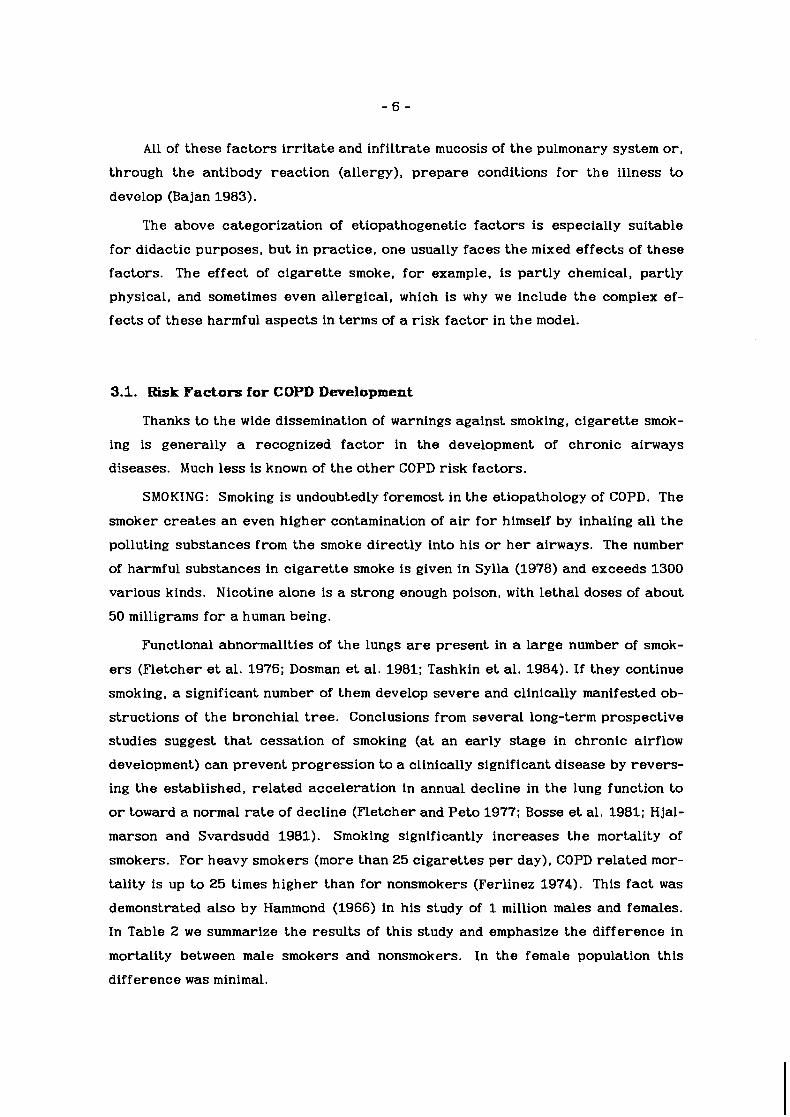
All of these fac tors i r r i ta te and infiltrate mucosis of the pulmonary system o r ,
through the antibody reaction (allergy), p repa re conditions f o r the illness t o
develop (Ba jan 1983).
The above categorization of etiopathogenetic fac tors i s especially suitable
f o r didactic purposes, but in pract ice, one usually faces the mixed effects of these
factors. The effect of c igaret te smoke, f o r example. i s partly chemical, partly
physical, and sometimes even allergical, which is why we include the complex ef-
fects of these harmful aspects in t e r m s of a r isk factor in the model.
3.1. Risk F a c t o r s f o r COPD Deve lopment
Thanks t o the wide dissemination of warnings against smoking, c igaret te smok-
ing is generally a recognized factor in the development of chronic airways
diseases. Much less i s known of the o ther COPD risk factors.
SMOKING: Smoking is undoubtedly foremost in the etiopathology of COPD. The
smoker c rea tes an even higher contamination of a i r f o r himself by inhaling all t he
polluting substances from the smoke directly into his o r h e r airways. The number
of harmful substances in cigaret te smoke i s given in Sylla (1978) and exceeds 1300
various kinds. Nicotine alone is a strong enough poison, with lethal doses of about
50 milligrams f o r a human being.
Functional abnormalities of the lungs are present in a large number of smok-
ers (Fletcher et al. 1976; Dosman e t al. 1981; Tashkin et al. 1984). If they continue
smoking, a significant number of them develop severe and clinically manifested ob-
structions of the bronchial tree. Conclusions from several long-term prospective
studies suggest tha t cessation of smoking (at an ear ly s tage in chronic airflow
development) can prevent progression t o a clinically significant disease by revers-
ing the established, related acceleration in annual decline in the lung function t o
o r toward a normal r a t e of decline (Fletcher and Pe to 1977; Bosse et al. 1981; Hjal-
marson and Svardsudd 1981). Smoking significantly increases the mortality of
smokers. For heavy smokers (more than 25 cigaret tes p e r day), COPD related mor-
tality is up t o 25 times higher than f o r nonsmokers (Ferlinez 1974). This fac t w a s
demonstrated also by Hammond (1966) in his study of 1 million males and females.
In Table 2 w e summarize the resul ts of this study and emphasize the difference in
mortality between m a l e smokers and nonsmokers. In the female population this
difference w a s minimal.
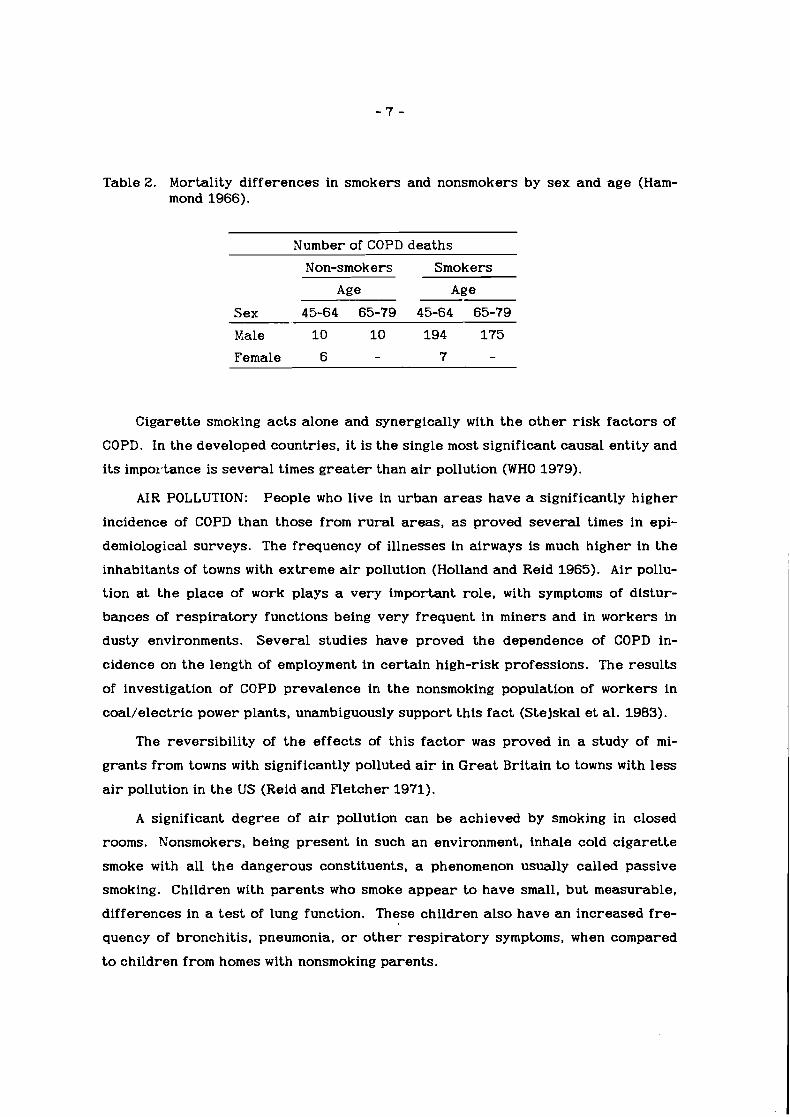
Table 2. Mortality differences in smokers and nonsmokers by sex and age (Ham- mond 1966).
Number of COPD deaths
Non-smokers Smokers
Age Age
Sex 45-64 65-79 45-64 65-79
Male 10 10 194 175
Female 6 - 7 -
Cigarette smoking acts alone and synergically with the o ther r isk factors of
COPD. In the developed countries, i t is the single most significant causal entity and
i t s impol-tance is several times g rea t e r than a i r pollution (WHO 1979).
AIR POLLUTION: People who live in urban areas have a significantly higher
incidence of COPD than those from r u r a l a reas , as proved several times in epi-
demiological surveys. The frequency of illnesses in airways is much higher in the
inhabitants of towns with extreme a i r pollution (Holland and Reid 1965). Air pollu-
tion at the place of work plays a very important role, with symptoms of distur-
bances of resp i ra tory functions being very frequent in miners and in workers in
dusty environments. Several studies have proved the dependence of COPD in-
cidence on the length of employment in certain high-risk professions. The resul ts
of investigation of COPD prevalence in the nonsmoking population of workers in
coal/electric power plants, unambiguously support this fac t (Stejskal e t al. 1983).
The reversibility of t he effects of this fac tor w a s proved in a study of mi-
grants from towns with significantly polluted a i r in Great Britain t o towns with less
a i r pollution in the US (Reid and Fletcher 1971).
A significant degree of a i r pollution can be achieved by smoking in closed
rooms. Nonsmokers, being present in such a n environment, inhale cold cigaret te
smoke with all the dangerous constituents, a phenomenon usually called passive
smoking. Children with parents who smoke appea r t o have small, but measurable,
differences in a test of lung function. These children also have an increased f re -
quency of bronchitis, pneumonia, o r o the r respiratory symptoms, when compared
t o children from homes with nonsmoking parents.
INFECTION: Despite the fac t tha t infection is not among the leading causes of
COPD, i ts role in the increase and development of the sickness is generally recog-
nized and proved (Tager and Speizer 1975). The role and significance of bacterial
and viral infection, from the etiopathogenetical point of view, is demonstrated not
only in the origin of, but also in t he maintenance of the chronic cha rac t e r of the
COPD process. Several authors s t r e s s the significance of infections of the lower
respiratory t r a c t in childhood (Holland et al. 1969; Reid 1969). They take into
consideration the higher sensitivity in these children t o the development of COPD.
According t o the resul ts of a study of 2228 schoolboys between the ages of 7 and 11
years (from South Wales and West England), up t o 10% of the boys and 6% of the
girls had infected airways. In t he majority of these children, significant impair-
ment of lung functions w a s found (Yarnell and Leger 1981).
ALLERGY: These fac tors present independent and, until now, ambiguously
solved problems. Despite plenty of new evidence, t he re is no known mechanism
tha t can explain the complex of changes tha t lead t o the final state of i r reversible
obstructive changes on the basis of atopy alone (Orie and von d e r Lende 1970;
Schmidt 1979).
AGE: In connection with the etiological factors tha t affect t he development of
COPD, i t is necessary t o mention one more very important factor-age. COPD fre-
quently occurs in the older age category of t he population. Conditions f o r the on-
set of the manifestation of COPD crea te , besides o the r factors , physiological,
s t ructural , and pathophysiological changes in the lungs and in t he bronchial t r e e
during the la te r phases of life, as well as a general decrease of resistance.
GENETICS: In the ear ly 1960s, scholars announced a new syndrom--alpha 1
protease inhibitor deficiency being genetically t ransfer red , later known under the
term alpha 1 antitrypsin deficiency (Laurel and Eriksson 1963). Later on, the re -
lationship between this disorder and a significant increase in the size and reduc-
tion of the number of alveoli, a diminution of t he internal lung surface, and a rear-
rangement of the lung tissue was stated (Snider and Korthy 1978). I t is more than
probable tha t these mechanisms play an important role in the course of COPD
(Snider 1984).
ALCOHOL: Burch and DePasquale (1967) hypothesized the existence of an "al-
coholic lung disease" and Rankin called attention t o t he high prevalence of airways
obstruction in alcoholics who also smoke (Rankin e t al. 1969). Indeed, heavy al-
cohol consumption is associated with chronic cigaret te smoking in a large number
of epidemiologic surveys. The association of heavy drinking with increased cough-
ing, excessive mucous hypersecretion, and frequent episodes of non-specific
respiratory illnesses has led numerous investigators t o speculate tha t alcohol exa-
cerbates the effects of smoking and contributes t o the development of chronic
bronchitis (Lebowitz 1981; Krumpe et al. 1984). Despite all of the research being
done in this field, t he question still remains open.
Etiopathogenetic fac tors of COPD represent a complicated se t of agents of ex-
ogenous o r endogenous charac te r . They cooperate in t he i r originating changes in
the bronchial tree and in creating the conditions f o r the individual forms and
features of COPD manifestation. There a r e still many open and unsolved questions
in the etiopathogenesis of COPD, despite the evident progress of research into the
effects and influence of different COPD risk factors. N e w discoveries in this field
will not only have a theoretical impact, but also a significant impact on prevention.
ear ly diagnosis, and effective therapy.
4. COPD MODEL OBJECTIYES
Health care statistics adequately describe the prevalence of tuberculosis,
venereal diseases, and communicative diseases in a majority of countries. This is
because when medical statistics were developed, tuberculosis and infectious
diseases were the most important health problems. This conjunction of medical
statistics and infectious diseases is described in the curriculum vitae of Florence
Nightingale, who helped t o pioneer the revolutionary notion that social phenomena
could be objectively measured and subjected to mathematical analysis (Cohen
1984). Besides this historical relationship, t he re is another fea ture of routine
medical statisitics: the majority of them are episode based (case based), not based
on the individual (Zacek 1984); modern health c a r e calls f o r knowledge of the
la t te r type of information. The prevalence image is governed by chronic, noncom-
municable diseases. However, no cu r r en t routine source of medical information
treats the whole history of the development of a chronic disease from i ts onset un-
til i ts end. Thus, health care managers frequently do not know the prevalence of a
particular illness in the population. However, they must have this knowledge in
o r d e r t o effectively fight against the illnesses.
Prevalence studies are often used t o examine occurences of chronic diseases,
involving a limited proportion of the population who suffer from a part icular
disease, disability, syndrome o r studied symptom within a shor t period of time. Of
' course, such surveys a r e usually very expensive, which is why they a r e res t r ic ted

in time and a r ea . The description of t he allocation of a number of sick people is
t he usual resul t and such information is of g r ea t value fo r health care manage-
ment. However, i t i s insufficient f o r the purpose of setting objective ta rge ts and
procedures f o r t he health c a r e system and fo r short- and long-term planning,
especially the latter.
In a r ecen t paper , w e drew attention t o t he possibilities of using mathematical
modeling to transform s ta t ic information--which has been accumulated by means of
different surveys--into a dynamic tool in the hands of health care managers
(Koonce et al . 1984). During the designing of t he COPD model, w e have kept in mind
this target . The design is based on understanding the cu r r en t situation and defin-
ing ou r aims. The general aim, remaining a f t e r all of o u r efforts, i s to decrease
t h e prevalence of COPD. To fu r the r this, t h e model can aid t h e task of discovering
the effects of different r i sk fac tors on COPD prevalence diminution. There is
probably no need f o r explaining tha t i t has, besides t h e ethical consequences. such
a diminution would have a ser ious economic effect with r e spec t to t h e whole of so-
ciety. The model also follows this aspect of health care.
W e assume tha t a f t e r some time the model will find i ts place within t he system
of continuous health-care development forecasts. Even more, w e suggest tha t this
model could be used in postgraduate training of health care managers at different
levels. Research into COPD could prof i t from utilizing this model as well.
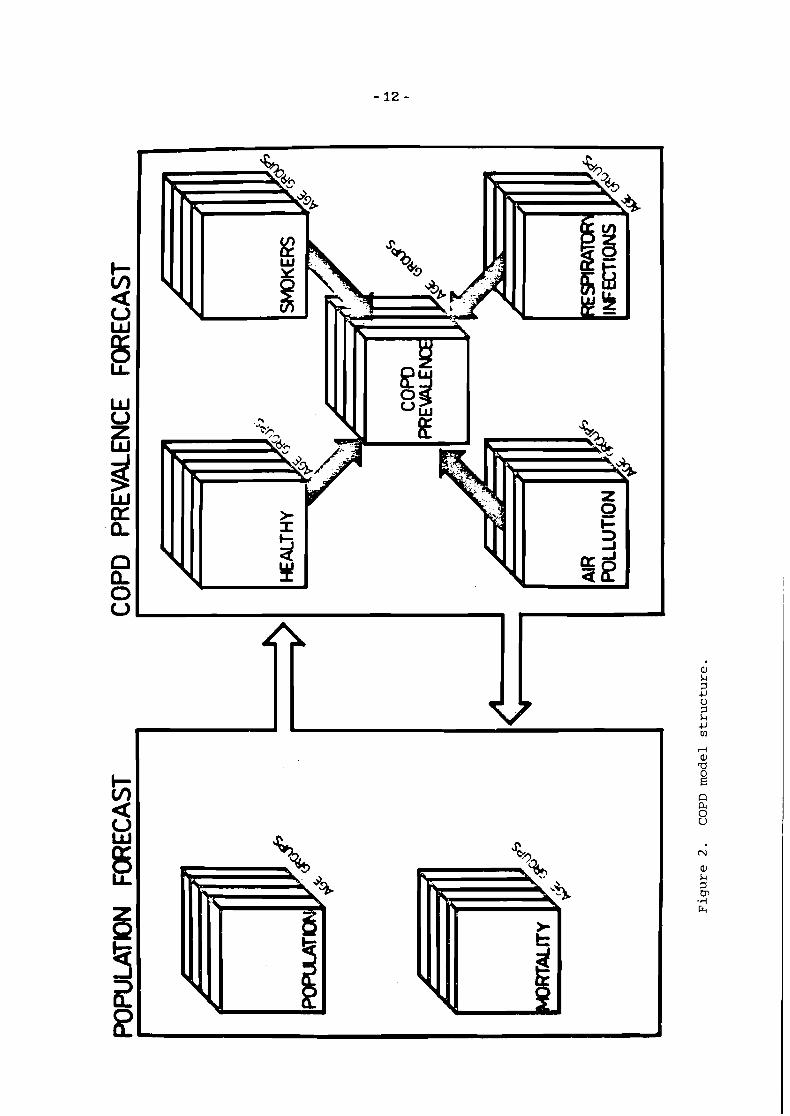
5. COPD MODEL STRUCTURE
The COPD prevalence model consists of t w o ma jo r blocks of logic:
prognosis f o r population development
prognosis f o r t he development of COPD risk fac tors development.
The possibility of testing different scenarios allows a holistic approach t o t h e
model.
5.1. Population Development Prognosis
The forecas t is based on a simplified view of population development. Data f o r
the demographic prognosis are estimated from the number of newborns, t h e
number of all deaths, and t h e number of transitions between age groups. Such fac-
t o r s as migration, male/female rat io , and s o on, were not considered in t he fore-
- 11 -
cast. The overall prognosis is based on data from Slovakia, 1983.
5.2. COPD Risk Factors Prognosis
This module represents the key point of the whole model. We have employed
ou r knowledge of COPD etiopathogenesis in this a r ea . The whole model construc-
tion is according to the following th ree population divisions: (1) healthy individu-
als, (2) those in COPD risk, and (3) those suffering from COPD.
HeaLthy IndividuaLs: We define the members of this group as those individu-
als without COPD symptoms and those not under t he influence of any of the risk fac-
tors. We ignore the possibility of genetic t ransfer of COPD, which means that , from
our point of view, all newborns a r e healthy, having the same probability of staying
healthy o r entering any of the risk groups.
IndividuaLs w i t h COPD Risk Factor: W e begin from the point of view of the
model ta rge ts in analyzing the problem of risk group selection. The only ones we
selected were those with important etiopathogenesis and the real possibility f o r in-
tervention by a health c a r e system o r society. That i s why w e chose the following
factors:
smoking: one of the most important factors , influencing the largest p a r t of
the population, but t he effect of intervention by health c a r e o r society is sti l l
dubious.
air poLLution: compared with smoking this fac tor i s of secondary impor-
tance. The ro le of securing a diminution o r even elimination of this is of pri-
m a r y importance.
f requent r e sp i r a to ry infections: t he role of this fac tor in the development
of COPD in adulthood is still not clearly defined. In t he struggle against this
fac tor , the last word has not yet been said.
COPD s ick individuaLs: Individuals who fulfil t he WHO cr i te r ia f o r chronic
bronchitis, lung emphysema, o r bronchial asthma were placed in this group (WHO
1980).
The overall model s t ruc ture i s shown in Figure 2.
6. COPD MODEL REALKZATION
6.1. Model Der ivat ion
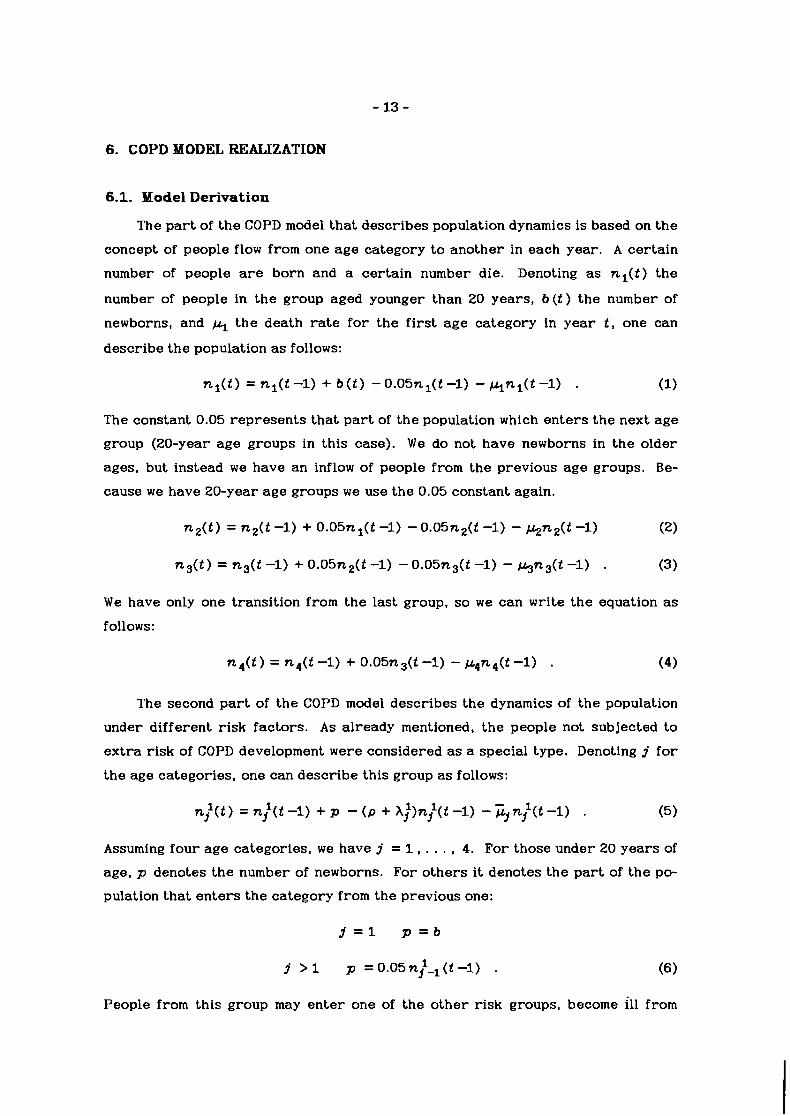
The p a r t of the COPD model tha t describes population dynamics is based on the
concept of people flow from one age category t o another in each year . A cer tain
number of people a r e born and a cer tain number die. Denoting as n l ( t ) the
number of people in the group aged younger than 20 years , b ( t ) t he number of
newborns, and j+ t he death r a t e f o r the f i r s t age category in yea r t , one can
describe the population as follows:
n l ( t ) = n l ( t -1) + b ( t ) - 0.05nl(t -1) - h n l ( t -1) . (1)
The constant 0.05 represents that p a r t of the population which en te r s the next age
group (20-year age groups in this case). We do not have newborns in the older
ages, but instead we have an inflow of people from the previous age groups. Be-
cause we have 20-year age groups w e use the 0.05 constant again.
W e have only one transition from the last group, s o w e can write the equation as
follows:
The second p a r t of t he COPD model describes the dynamics of the population
under different risk factors. A s already mentioned, the people not subjected to
ex t r a risk of COPD development were considered as a special type. Denoting j f o r
the age categories, one can describe this group as follows:
Assuming four age categories, we have j = 1 , . . . , 4. For those under 20 years of
age, p denotes the number of newborns. For o thers i t denotes the p a r t of the po-
pulation tha t en ters the category from the previous one:
People from this group may en te r one of the o ther risk groups, become ill from

COPD, or even die. The process of transition to o ther health hazards is represent-
ed by the sum of the transition coefficients p
The possibility of t he onset of a COPD disease in healthy individuals is depicted by
the coefficient A!. The number of people dying in this group from causes o ther
than COPD is:
when stands fo r mortality ra te .
Applying similar notation, one can derive equations for estimating the number
of cigaret te smokers:
1 1 2 2 n:(t) = n;(t -1) + p nj ( t ) + p - Aj nj ( t -1) - 0.05nf(t -1) - zjn:(t -1)
the number of people in an air-polluted environment:
2 1 n;(t) = n;(t -1) + p nj ( t ) + p - A?n;(t -1) - 0.05nf(t -1) - -,nf(t -1)
and the number of children with frequent respiratory infections:
3 1 4 4 n:(t) = n:(t-1) + p nl ( t ) - A,n,(t -1) -0.05n:(t-1) -&n:(t -1) . (11)
Since the aim of the model is to estimate the number of people with COPD, the
following equation w a s derived:

- 15 -
t o depict t he COPD prevalence dynamics.
6.2. Implementation
The following items were used f o r t h e initialization of t he forecast :
age s t ruc tu re of the population of t h e Slovak Socialistic Republic (SSR),
1983;
general death r a t e fo r population of SSR, 1983;
number of newborns in SSR, 1983;
number of COPD related deaths in SSR. 1983;
risk of COPD in individuals in SSR, 1983, with and without r isk factors ;
COPD risk-factor prevalence in t h e population of SSR, 1983;
coefficients of transition from the group without r isk to t h a t with r isk;
average length of s tay in t he hospital f o r a patient with COPD;
coefficient of transition from t h e group of COPD ill to disabled;
average number of days in sanatoriums.
W e divide t h e population into four groups according to age:
0-19 years ;
20-39 years ;
40-59 years ;
60 yea r s and over.
W e are aware of t h e error possibly arising from this rough a g e stratification,
but res t r ic t ions due to t h e computer used did not allow us to probe this problem
more deeply. The same situation occurs in t h e sex s t ruc ture . The following may
support o u r decision not to consider sex differences: in developed countries
smoking s ta r ted as a predominantly male phenomenon and women s ta r ted to smoke
much la te r . While men were usually the f i r s t to stop smoking, smoking continued to
increase among women (although i t has now s ta r ted to level off, apparently as a
resul t of smoking control activities) at a much lower rate than tha t reached by men
(WHO 1979). S o w e t r i ed to select data describing the whole population regardless
of sex.

In o u r model design, w e employed the assumption tha t each of the r isk factors
affects t he population independently. W e abstracted t he i r synergistic effects,
having in mind t h e following ranking:
(1) smoking
(2) a i r pollution
(3) frequent resp i ra tory diseases in childhood.
So, if an individual is a smoker, i t i s possible to neglect t he influence of o the r con-
taminating factors . Similar hypotheses were also accepted f o r t he o the r combina-
tions of factors , since t he lack of data on the effects of the combinations of r i sks
forces this simplification.
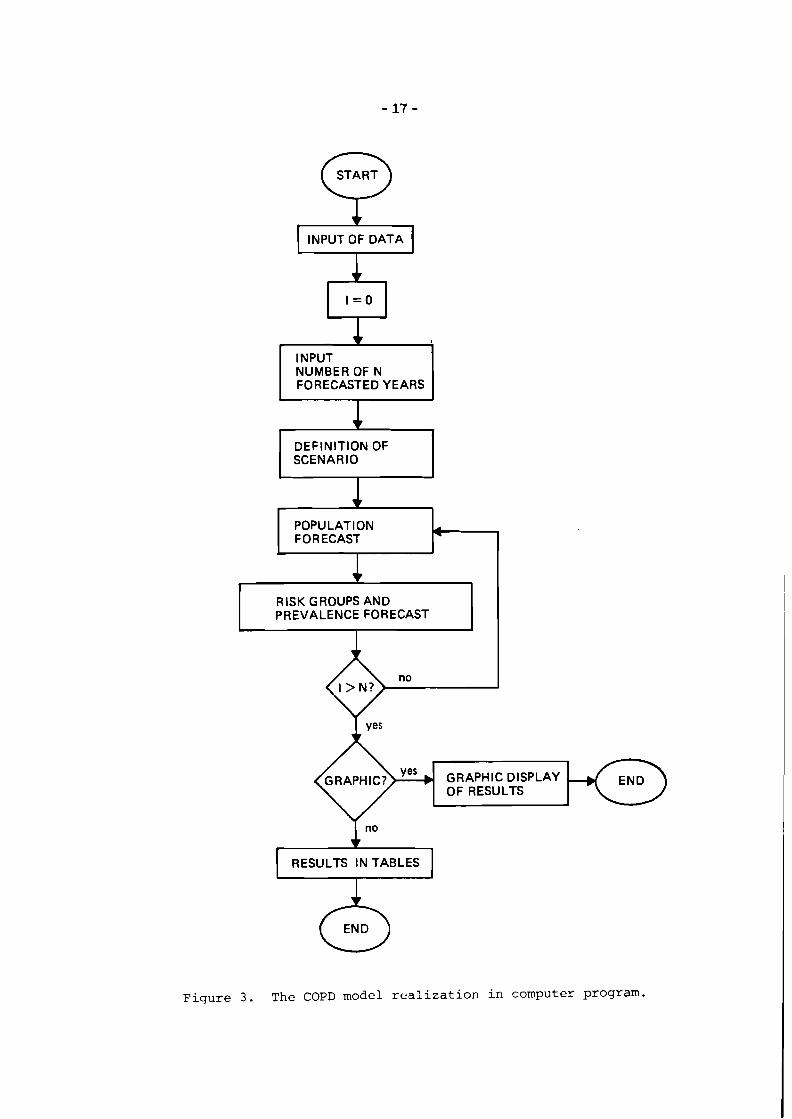
W e implemented the COPD model on an APPLE-IIe microcomputer in APPLESOFT
BASIC. The program is assembled from several modules, as shown in Figure 3. Data
specifying the s tar t ing conditions of t he model are incorporated into the program
by means of t he command DATA.
6.3. Demographic Data
The demographic data f o r t he SSR population (age s t ruc ture , death rate,
newborns) were ex t rac ted from t h e Sta t i s t i ca l Health Care Year Book f o r
Czechoslovakia (CSSR zdravotnictvi 1983)*. Specific mortality fo r COPD w a s
derived from a stat is t ics book (Pohyb obyvatelstva v SSR, 1983). The number of
COPD deaths is not enumerated in this book, which i s why w e considered the sum of
deaths from following diagnostic categories, according to the Internat ional Clas-
s i f i c a t i o n o f f i s e a s e s (VIII-th revision):
ICD 491 chronic inflammation of bronchi-chronic bronchitis
ICD 492 lung emphysema
ICD 493 bronchial asthma.
There are t h r e e types of mortalities considered in this model: overall mortali-
ty, specific COPD mortality, and mortality without COPD. This distinction w a s em-
ployed par t ly t o verify t h e different effects on mortality and par t ly because of t h e
possibility of extending t h e model to o the r diseases.
*These data a r e included in Table 3.
START 0 1 INPUT OF DATA (
INPUT NUMBER OF N FORECASTED YEARS 1 DEFINITION OF SCENARIO
POPULATION
RISK GROUPS AND I PREVALENCE FORECAST I I
GRAPHIC? OF RESULTS
RESULTS I N TABLES - Figure 3. The COPD model realization in computer program.

Table 3. Population, number of deaths without COPD, and number of deaths from COPD (Pohyb obyvateslstva v SSR 1983).
Initial demographic data fo r Slovakia, 1983
Age group Population in SSR Deaths without COPD COPD deaths
0-19 1736000 3342 1 20-39 1619000 1912 7 40-59 1070000 6735 123
60- 731000 33269 1760
6.4. Number o f COPD Cases
There are two main channels of information about general morbidity data:
routine statist ics
special investigations
Most countries do not supply routine data on COPD prevalence (Shigan 1977). How-
eve r , the data do descr ibe hospitalizations, sick-leave cases and days, disease
specific mortality, and o t h e r indirect measures of prevalence. The most appropri-
ate source of prevalence da t a are special investigations. W e based the estimation
(of t he initial COPD prevalence in t he SSR) on t h e resul ts of a study of 20000 inha-
bitants, 15 yea r s and older , in the Danube area (Virsik et al. 1976) along with an
investigation of about 60000 people (male and female) in t he West of Slovakia (Kru-
ty et al. 1975). For a more precise estimation of prevalence, w e plan an extension
of t he model with a module of prevalence estimation based on some indirect pre-
valence indices. The values of t he initial COPD prevalence are summarized up in
Table 4.
6.5. Risk o f D e v e l o p i n g COPD
W e consider t h e estimation of coefficients-for expressing the r isk of COPD
development in an individual sor ted by r isk factors--to be of crucial value f o r the
success of t he model. The way tha t w e perceive t he r isk considers t he pathogenic
power of the etiology fac tor , which means the magnitude of risk f o r an individual
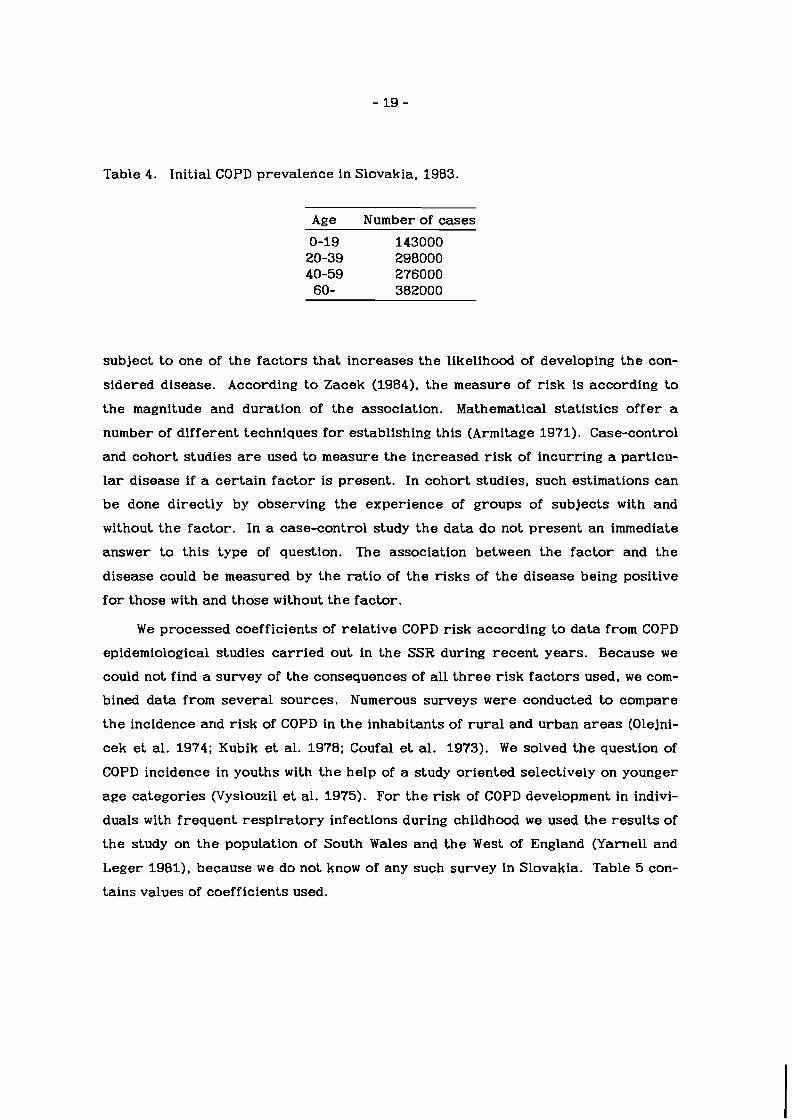
Table 4. Initial COPD prevalence in Slovakia, 1983.
Age Number of cases
subject to one of t h e fac tors tha t increases t he likelihood of developing the con-
sidered disease. According to Zacek (1984), t h e measure of r isk is according t o
the magnitude and duration of t he association. Mathematical statist ics o f fe r a
number of different techniques f o r establishing this (Armitage 1971). Case-control
and cohort studies are used to measure t he increased r isk of incurring a particu-
lar disease if a cer ta in fac tor is present. In cohort studies, such estimations can
be done directly by observing t h e experience of groups of subjects with and
without t h e fac tor . In a case-control study the da ta do not present an immediate
answer t o this type of question. The association between the fac tor and the
disease could be measured by the ra t io of t he r i sks of t h e disease being positive
f o r those with and those without t he factor .
W e processed coefficients of re la t ive COPD risk according to data from COPD
epidemiological studies ca r r i ed out in t he SSR during r ecen t years. Because w e
could not find a survey of t he consequences of all t h r e e r isk fac tors used, w e com-
bined data from severa l sources. Numerous surveys were conducted to compare
t he incidence and r isk of COPD in t he inhabitants of r u r a l and urban areas (Olejni-
cek et al. 1974; Kubik et al. 1978; Coufal et al. 1973). W e solved the question of
COPD incidence in youths with t he help of a study oriented selectively on younger
age categories (Vyslouzil et al. 1975). For t h e r isk of COPD development in indivi-
duals with frequent resp i ra tory infections during childhood w e used the resul ts of
t he study on t h e population of South Wales and the West of England (Yarnell and
Leger 1981), because w e do not know of any such survey in Slovakia. Table 5 con-
tains values of coefficients used.

Table 5. Risk of COPD onset f o r people under different r isks , by age.
Age
Risk group 0-19 20-39 40-59 60-
Without risk 0.02 0.1 0.2 0.25 Smokers 0.05 0.3 0.6 0.75 Air pollution 0.1 0.2 0.25 0.3 Respiratory infections 0.39 0 0 0
6.6. Risk Factors Prevalence
The estimation of risk-factor incidences in t he population could, at f i r s t
glance, be regarded as an easier task compared t o previous ones, but w e have t o
state rational limitations t o be successful. There a r e a large number of surveys
tha t consider t he distribution of smokers in the population. Different c lusters of
smokers a r e used according to, e.g., what is smoked, f o r how long, how deeply the
smoke is inhaled, e tc . W e made use of the following stratification of people ac-
cording t o the i r smoking habits:
smokers
nonsmokers
W e restr ic ted o u r attention t o cigaret te smoking alone. W e received some
valuable data on smoking from the Special Study of Tobacconism in Slovakia (Ka-
t r iak 1983). They investigated the smoking habits of 1700 inhabitants of the SSR
14 years and older, chosen at random according to sex, age, social status, and
residential area. The study represents a complex view on smoking epidemiology in
the SSR.
More problems were faced in estimating the number of people affected by pol-
luted a i r . For Slovaks living in areas with good quality a i r and f o r those living in
towns with proved a i r pollution, no appropriate data were found. W e understand
tha t this division is too general, but until be t te r data i s available w e can use noth-
ing else. The data on a i r pollution were estimated according t o Kiihnl (1982).
The frequency of respiratory diseases in children is about 3-4 illnesses p e r
year , but is usually less frequent f o r children in ru ra l areas. W e estimated the
number of children with frequent respiratory infections with the help of a
pediatrician's expe r t estimation. Our opinion, based on experience with this data

estimation, i s t ha t no more p rec i se da t a on t ha t problem will b e available in t h e
n e a r future . The proport ions of people subject t o di f ferent r i sks are summarized
in Table 6.
Table 6. Proport ions of people subject t o different r i sk f a c to r s by age .
- A g e - - - Risk group 0-19 20-39 40-59 60-
Smokers 0.144 0.277 0.245 0.07 Air pollution 0.273 0.161 0.130 0.045 Respira tory infections 0.264 0 0 0
6.7. T r a n s i t i o n C o e f f i c i e n t s B e t w e e n G r o u p s
These coefficients descr ibe how an individual subject t o none of t h e mentioned
health r i sks can e n t e r one of t h e r i sk groups. Derivation of these coefficients is
based on t h e assumption t ha t a newborn child i s under no r i sk , which excludes t h e
possibility of hered i ta ry defects. Numbers f o r transit ions to t h e group of smokers
were derived from t h e a l ready mentioned study of c igare t t e smoking epidemics in
Slovakia (Katriak 1983). The estimation of coefficients f o r air pollution w a s done
using migration da t a f o r Slovakia (Kiihnl 1982). Because of t h e lack of s ta t is t ical
da t a on children's r e sp i r a to ry infections, expe r t opinions were used. The expe r t s
(physicians) were familiar with t h e epidemiological situation among t h e children in
Slovakia. Table 7 comprises t h e descr ibed coefficients f o r Slovakia.
Table 7. Coefficients of t ransi t ions between t h e group of people with no mentioned health hazard compared t o those with hazard.
Age
Risk group 0-19 20-39 40-59 60-
To smokers 50 30 30 30 To air-polluted areas 0.025 0.06 0.06 0.165 To r e sp i r a to ry infections 0.08 0 0 0

7. RESULTS AND DISCUSSION
The COPD model allows the user t o forecast the prevalence development t o t h e
year 2003 (20 years forecast) . Figure 4 depicts t h e basic development of pre-
valence, when no interventions are assumed. Notice t h e steady increase in quanti-
ty of sick people, especially in age categories, which. should s t r ike t he attention
of health care managers and policymakers.
Several scenarios were used t o test different approaches and the i r impacts
on the population. The transformation of an exper t ' s ideas into scenarios
represen ts a quantification of t he hypothesis, and i t i s possible t o express such a
quantification in severa l different ways. The model uses percentages as a measure
of change between the original state and the hypothetical situation. The change
could be introduced in any y e a r of t he forecasted period.
Tested hypotheses w e r e chosen in o r d e r t o highlight t h e answers t o these
questions:
how would a change in t he amount of people affected by different r i sks influ-
ence COPD prevalence in t he future?
how would t h e prevalence react t o a change in more effective COPD therapy
and prevention?
Figures 5 and 6 depict situations in which different changes in t h e smoking si-
tuation are assumed. The hypotheses of reducing the number of smokers and of in-
creasing the smoker population were tested. Reducing t h e amount of people af-
fected by c igare t te smoke has long been a task of many, not necessarily health
care, authorit ies all ove r t he world, with several programs of WHO and o the r insti-
tutions trying t o treat this problem. US smoking habits are shown in Table 8.
Column (1) of Table 8 shows tha t t he total US c igare t te consumption has in-
creased fairly steadily over t h e past t w o decades, but t h e growth in total consump-
tion has not kept pace with t he growth in t h e smoking population. This is ref lected
in column (3) in which t h e aggregate da ta are converted into cigaret tes p e r adult
(individuals over 1 7 years of age). A s columns (3) and (4) show, by this measure
cigaret te consumption has fallen steadily, if gradually, since 1973 (Warner 1983).
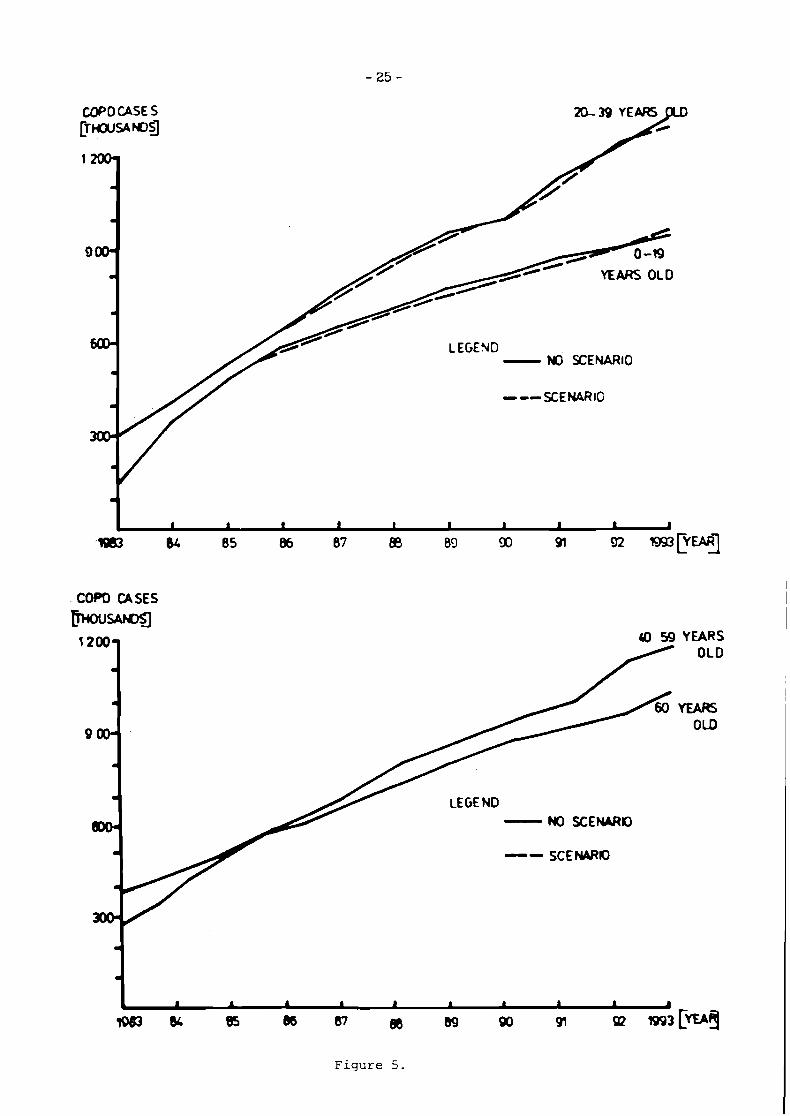
Figure 5 shows t h e prevalence change a f t e r t h e effective antismoking cam-
paign w a s introduced (dimunition of smokers t o 80% in people younger than 20
years and t o 70% between 20-39 years of age in t he yea r 1985).

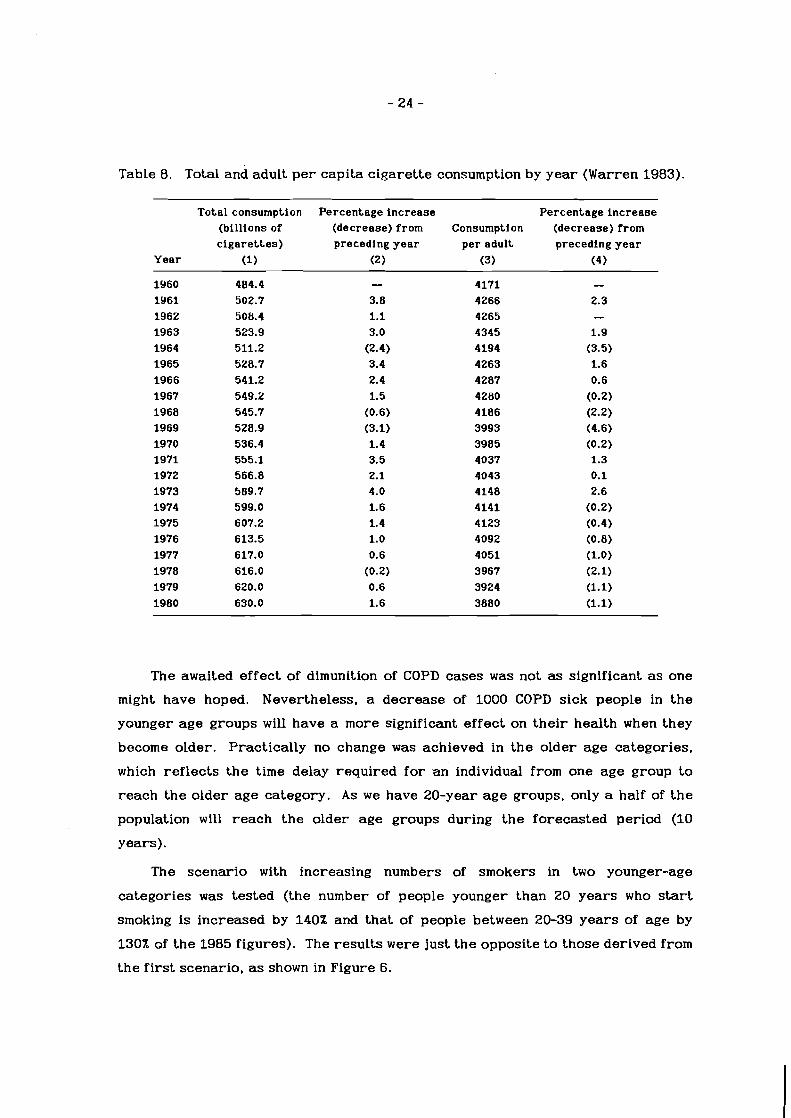
Table 8. Total and adult p e r capita c igaret te consumption by yea r (Warren 1983).
Total consumption Percentage increase Percentage increase (bi l l ions of (decrease) from Consumption (decrease) from c i g a r e t t e s ) preceding y e a r per adult preceding y e a r
Year (1) (2) (3) (4)
The awaited effect of dimunition of COPD cases w a s not as significant as one
might have hoped. Nevertheless, a decrease of 1000 COPD sick people in t h e
younger age groups will have a more significant effect on t he i r health when they
become older. Practically no change w a s achieved in t he older age categories,
which ref lects t he time delay required f o r -an individual from one age group to
reach the older age category. A s w e have 20-year age groups, only a half of t h e
population will reach the older age groups during t h e forecasted period (10
years).
The scenario with increasing numbers of smokers in two younger-age
categories w a s tested (the number of people younger than 20 years who start
smoking is increased by 140% and tha t of people between 20-39 yea r s of age by
130% of t he 1985 figures). The resul ts were just t he opposite to those derived from
the f i r s t scenario, as shown in Figure 6.
COP0 CASE S [THOUS NDSJ
YEARS OLD
I Ff,FNII ----. -- - NO SCENARIO
---XENARIG
COPD CASES
MJW 1200- a 59 YEARS
1
9001
a
1
80. NO S C E W I [ )
I SCE WIO
4
4
J 1 1 1 1 1 1 1 1 1 A
1063 6c 85 & 87 86 69 90 91 a R J ~ [ I E * ~
COPD CASES
MJW Ul 59 YEARS
Figu re 5.

C O P D U S E S /~MOUSANDS/
1 2-
4
I
900.
a
600- LEGEND
4 - NO SCENARIO --- SCENARIO a
300-
a
COPD CASES EwNDSI
12001 40-59 YEARS OLD
.I
.I
m
600- LECEH) - NO SCENARKI m
-- SCENARIO
Figu re 6.
The most affected population would be in the younger-age categories. The hy-
pothesis used ref lects a situation tha t is common in nearly all t he developed coun-
t r ies . The number of heavy smokers among men in twenties and the i r thir t ies in-
creased, but t h e number among older men decreased. The number of female heavy
smokers, on t h e o the r hand, has continued to increases until women were in t he i r
fifties (Stoto 1985).
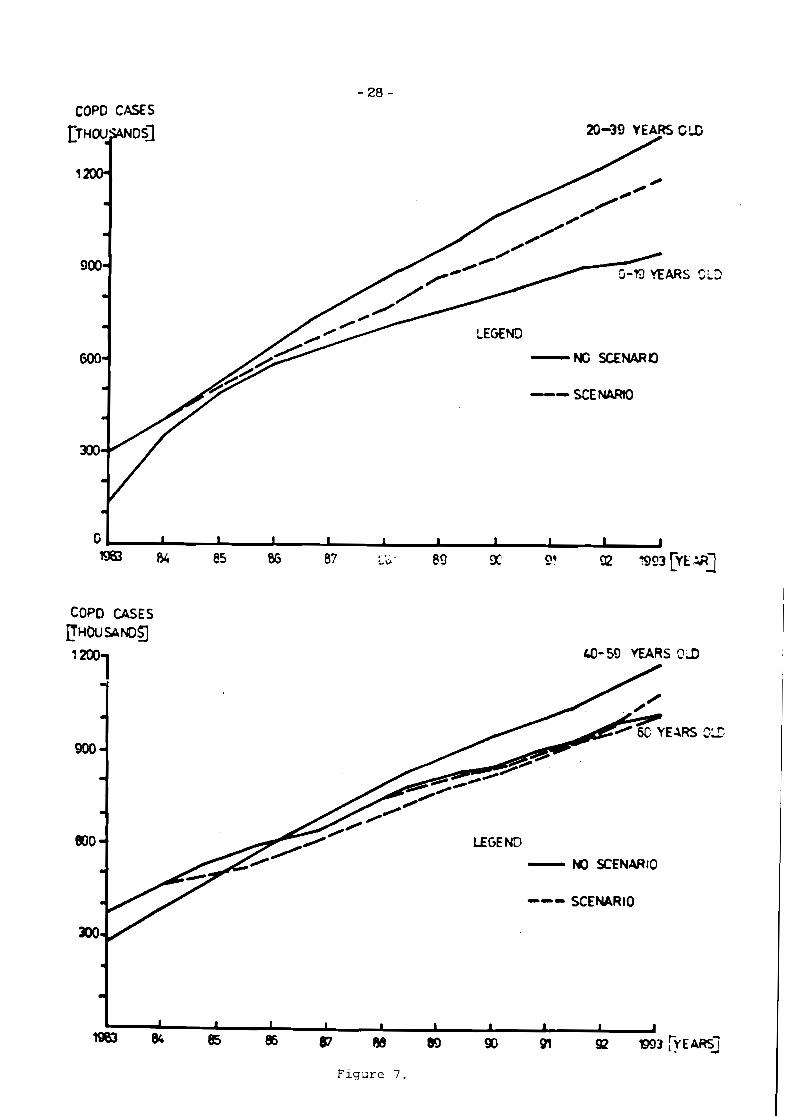
Another two scenarios tested t he situations in which substantial changes in
COPD prevention and treatment effectiveness occur. Screening fo r initial lung
function impairments and complex treatment of acute upper resp i ra tory infections
together with decreasing a i r pollution, are the main possibilities f o r preventing
COPD illness. Figure 7 ref lects t he situation with increased effectiveness of
preventive programs. The usual t a rge t of such programs is t h e adult p a r t of t he
population--up t o 60 years of age. The hypothesis employed suggests t he r i s e in
prevention effectiveness will be 140% in t he age groups 20-39 and 40-59 years . The
response of t he model w a s immediate. The change w a s introduced in 1984 and a sig-
nificant decrease in COPD prevalence appeared during t h e same yea r in the second
and third age categories and a f t e r four years in t he older age categories.
Assuming tha t t h e health authorit ies will not pay appropr ia te attention t o t he
preventive activities, t h e hypothesis of a decline to 60% of t h e cu r r en t s ta tus in
the same age groups as t h e previous scenario w a s tested. The change w a s intro-
duced in 1984 and t h e resul ts of t h e forecas t are shown in Figure 8.
CONCLUSIONS
More hypotheses than mentioned h e r e were checked, most striking resul ts be-
ing given as examples of the model's runs. The described model is one of t he f i r s t
s teps in ou r effor ts t o model sociodemographic impacts of chronic diseases on po-
pulations. The results showed us what w e should use in fu ture population models.
Based on t h e experiments with t h e model, t h e following conclusions can be
drawn:
t he model provides t h e experimentor with meaningful forecasts and enables
him o r h e r t o test different types of scenarios;
t h e COPD model is sensitive enough to simulate assumed changes;
COP0 CASES
LEGE ND - NO SCENARIO
--- SCENARIO
F i g u r e 7 .

COPD CASES L f ~ u ~ m
w
1200- - a
900-
.I
COO-
OLD
Figure 8 ,
the data aggregation by four age groups seems t o us t o be too coarse ,
disaggregation into more age groups and by sex would probably bring be t te r
insights into t he system dynamics;
t he disaggregation would certainly requi re more computer memory than 64 K
bytes and the use of some compilor seems t o be necessary, because of the in-
creased time f o r computation;
the interactive, user-friendly mode of t he model's operation allows i ts utiliza-
tion by those unskilled with computers.
The incomplete information on COPD prevalence and on the transitions
between different population groups does not allow to use t he traditional model-
tuning procedures. The resul ts of modeling, however, were discussed with exper t s
in COPD, whose opinion was tha t the model i s realist ic and can help in understand-
ir\g the mechanisms of COPD development. The new da ta on various aspects of COPD
will allow us to develop a more detailed version of the model.
Based on these facts , t he new version of this model i s under preparation. The
authors hope tha t i t will be of substantial help t o o ther scholars in this field.

REFERENCES
Armitage, P . (1971) Stat is t ical Methods in Medical Research. Blackwell Scientific Publications. 504 pp.
Bajan, A. (1968) Choroby Dychacieho Ustrojenstva Medicinsky a Ekonomicky Prob- lem. Lek. Obzor. 17(8):493-498.
Bajan, A. (1983) Bronchit is Chronica. Osveta. 214 pp.
Bosse, R., D. Sparrow, C.L. Rose, and S.T. Weiss (1981) Longitudinal Effect of Age and Smoking Cessation on Pulmonary Function. American Review of Respira- tory Diseases 123:378-381.
Boudik, F., F. Herles, V. Teichmann, F. Macholda, F. Horacek, and P.C. Kaufmann (1969a) Vyskyt Chronicke Bronchitidy v Mestskem Obvodu. Cas. lek. ces. 108(1): 17-19.
Boudik, F.. V. Teichmann, K. Novak, and J. Jencovsky (1969b) Vyskyt Vlekle Bron- chitidy Medzi Venkovskym Obzvatelsttvem. Vni trn i lek. 15(8):736-744.
Burch, G.E. and N.P. DePasquale (1967) Alcoholic Lung Disease--An Hypothesis. American Heart Journal 73:147-148.
Cohen, I.B. (1984) Florence Nightingale. S c i e n t m c American 250(3):128-137.
Coufal, K . , J. Palka, and J. Krchakova (1973) Chronicka Bronchitida Medzi Ven- kovskym Obyvatelstvem v Okresu Blansko. S t u d i a Fheumol. Phtiseol. Cechoslov. 33(7):453-464.
CSSR zdravotnictvi (1983) Ustav Zdrav. Informact a S ta t i s t i ky (Praha). 514 pp.
Dosman. J.A., D.J. Cotton, B.L. Graham, et al. (1981) Sensitivity and Specifity of Early Diagnostic Tests of Lung Function in Smokers. Chest 79:6-11.
DHHS (1984) Surgeon General's Report o n the Health Consequences of h o k i n g (Washington, D.C.: U.S. Department of Health and Human Services, National Institute of Health).
Ferlinez, R. (1974) Lungen u n d Bronchialerkrankungen (Stuttgart: G. Thieme). 710 pp.
Fletcher, C.M. and R. Pe to (1977) The Natural History of Chronic Airflow Obstruc- tion. B r i t i s h Medical Journal 1:1645-1648.
Fletcher, C.M., N .L. Jones, B. Burrows, and A.M. Nidden (1964) American Emphyse- ma and Chronic Bronchitis. American Review of Resp ira tory Diseases 96 (1) : 1-13.
Fletcher. C.M., R. Peto, C.M. Tinker, and F.E. Speizer (1976) 7'he Natural History of Chronic Bronchit is and Emphysema. An Eight Year S t u d y (Oxford University Press) . 271 pp.
Halak, 0 . and A. Bajan (1976) Sucasny Pohlad na Vyvoj Bronchitidy Dospelych. Stud . Pneumol. Phtiseol. Cechoslov. 36(9):595-600.
Hammond, E.C. (1966) Smoking in Relation to the Death Rates of One Million Men and Women. National Cancer Inst i tute Monographs (19):127-204.
Herles, F. (1964) Problematika a Zdravotnicky Vyznam Chronicke Bronchitidy. Prakt . Lek. 44(19):721-722.
Higgins, T.T. (1973) The Epidemiology of Chronic Respiratory Disease. Preventive Medicine 2(2): 14-33.
Higgins, M.V. and Y.B. Keller (1970) Predictors of Mortality in the Adult Population of Tecumseh (Respiratory Symptoms, Chronic Respiratory Diseases and Venti- latory Lung Function). Arch. Environ. Health 21:418-420.

Hjalmarson, A. and K. Svardsudd (1981) Health Consequences of Giving Up Smoking in a Prospective Population Study of Middle-Aged Swedish Men. Acta Med. Scand. 210:93-96.
Holland, W.W. and D.D. Reid (1965) The Urban Factor in Chronic Bronchitis. Lancet 1:445.
Holland, W.W., T. Hallit, A. Benett and A. Elliott (1969) Factors Influencing t h e On- set of Chronic Respiratory Disease. Br i t i sh Medical Journal 2:205.
Katriak, M. (1983) Sociologicke Aspekty Tabakismu. Ustav Zdrav. Vychovy (Bra- tislava). 97 pp.
Kirilog. Y. and L. Irnell (1974) The Prevalence of Bronchial Asthma and Chronic Bronchitis in Uppsala. Sweden. Scand. J. Resp. Dis. (Supplement) 89:35-40.
Koonce, J., A.I. Yashin, C.J. Walters, and M. Rusnak (1984) Modeling of Public Health: Call for In terd isc ip l inary Actions. CP-84-1 (Laxenburg, Austria: International Institute f o r Applied Systems Analysis).
Krumpe, P.E., J.M. Cummiskey and G.A. Lillington (1984) Alcohol and the Respirato- r y Tract. Medical Cl inics of North America 68(1):201-219.
Kruty, R., E. Hulova, E. Roch, G. Hudakova, and J. Varsnyi (1975) Hromadna Depis- taz Chronickych Bronchitid. Stud ia Phtiseol. Cech. 35(4):479-483.
Kubik, A. et al. (1978) Epidemiologie Chronicke Bronchitidy v P raze a Zatci. Stu- d i a Pneumol. Phtiseol. Cech. 35(9):596-605.
Kiihnl, K. (1982) Migration a n d Settlement: 16. Czechoslovakia. RR-82-32 (Lax- enburg, Austria: International Institute fo r Applied Systems Analysis).
Laurel, C.B. and S. Eriksson (1963) The Electrophoretic Alpha-1 Globulin Pa t te rn of Serum in Alpha-1 Antitrypsin Deficiency. Scand. J. CLin. Lab. Invest . 15:132-140.
Lebowitz, M.D. (1981) Respiratory Symptoms and Disease Related to Alcohol Con- sumption. American Review of Respiratory Diseases 123:16-19.
Mueller, R.E., D.L. Kelbe, J . Plummer, and S.H. Walker (1971) The Prevalence of Chronic Bronchitis, Chronic Airway Obstruction and Respiratory Symptoms in a Colorado City. American Review ofResp ira tory Diseases 103:209-228.
Olejnicek, M., J. Meluzin, A. Pokorny, and D. Tlach (1974) Problematika Vlekleho Zapalu Priedusiek u Mestskeho Obyvatelstva. ki t rni lek. 20(2):116-123.
Orie, N.G.M. and R. van d e r Lende (1970) Bronchit is III, Ch.C. Thomas (Ed.) (FRG: Assen).
Pedrizet, S., 0. Strauss , and J. Cooreman (1978) Apport d e la Methode Epidemiolo- gique dans la Conaissance des Bronchit6s Chroniques. Rev. Pract. 28(9):653- 665.
Pohyb obyvatelstva v SSR (1983) S o u . S ta t i s t i cky Urad (Bratislava). 325 pp.
Press , P. and C. Rufener-Press (1974) Epidemiologie d e l a Bronchit6 Chronique. D v . Therap. 34(3): 140-144.
Pride, N.B. (1977) Chronic Bronchitis and Emphysema: Recent Trends. Practi- t ioner 219(12):640-647.
Protivinski, R. (1968) Morbiditat und Mortalitat d e r Chronischen Bronchitis in V e r - schiedenen Europaischen Landern. In K.Th. Bopp and T.A. Hertle (eds.) Chronische Bronchit is (Stuttgart and N e w York: F.K. Schattaner). 537 pp.
Rankin, J.G., G.S. Gale, P . Wilkinson et al. (1969) Relationship Between Smoking and Pulmonary Disease in Alcoholism. American Review of Respiratory Diseases 99:390-398.

Reid, D.D. (1969) The Beginning of Bronchitis. Proc. R. Soc. Mad. 62:311.
Reid, D.D. and C.M. Fletcher (1971) International Studies in Chronic Respiratory Disease. British Medical B u l l e t i n 27(59).
Schmidt. P.O. (1979) Fazit fiir Praxis. In Obstructive A temwegserkrankungen (G. Witztrock). 159 pp.
Shigan, E.N. (1977) Alternat ive A n a l y s i s of m e r e n t Methods for Es t ima t ing R e v a l e n c e Rate. RR-77-40 (Laxenburg, Austria: International Institute f o r Applied Systems Analysis).
Snider, G.L. (1984) Two Decades of Research in t h e Pathogenesis of Emphysema. Schweiz . med. Wschr. 114:898-906.
Snider, G.L. and A.L. Korthy (1978) Internal Surface Area and Number of Respira- to ry Air Spaces in Edlastase-Induced Emphysema in Hamsters. American Re- v iew o fResp i ra to ry Diseases 117:685-693.
Stejskal. J.. J. Kaupa, and M. Sedlak (1983) The Occurrence of Chronic Bronchitis in a Group of Inhabitants of District Prievidza. S t u d i a Pneum. Phtiseol. Cech. 43(4):244-251.
Stoto, M. (1985) Changes in Adul t Smoking Behavior in t h e Uni ted States: 2955 to 2983. WP-85-53 (Laxenburg, Austria: International Institute f o r Applied Systems Analysis).
Sylla, A. (1978) L u n g e n k r a n k h e i t e n Bd. i. (Leipzig: G. Thieme). 513 pp.
Tager, J. and F. Speizer (1975) Role of Infection in Chronic Bronchitis. Eng land Journal of Medicine 292(13):563-571.
Tashkin, D.P. et al. (1984) The UCLA Population Studies of COPD. American Review of Resp i ra to ry Diseases 130:707-715.
Virsik, K.. A. Bajan, 1. Badalik, M. Vagac, and S. Litomericky (1976) Chronicka Bronchitida v Podunajskej Oblasti. S t u d i a Pneumol. Phtiseol. Cechoslova. 36(7):447-452.
Vyslouzil, Z. et al. (1975) Vyskyt Chronicke bronchitidy u Maldistvych. S t u d i a Fneumol. Phtiseol. Cech. 35(9):591-595.
Warner. K.E (1983) Reactions t o Perceived Risk: Changes in t h e Behavior of Cigarette Smokers. In V.T. Carello, W.B. Flamm, J.V. Rodricks, and R.G. Tar- diff (Eds.) Zhe A n a l y s i s of Actual Versus Perceived R i s k s (New York: Plei- num Press) . 262 pp.
WHO (1979) Controll ing t h e Smoking Epidemics Technical Report Ser ies , No. 636 (Geneva: World Health Organization). 87 pp.
WHO (1980) E a r l y Detection of Chronic L u n g Diseases. Report on a Meeting (Copenhagen: World Health Organization). 32 pp.
WHO (1982) R t a l S t a t i s t i c s a n d Causes of Death (Geneva: World Health Organiza- tion). 471 pp.
Yarnell, J. W .G. and A.S. Leger (1981) Respiratory Infections and the i r Influence on Lung Function in Children: A Multiple Regression Analysis. Thorax 36:847- 851.
Zacek, A. (1984) Metody s t u d i a Z d r a v i a Nemoci v Populaci (Avicenum). 402 pp.

Appendix: Program Listing
5 REM NEW VERSION DF COPD PROGR AM
10 REM I IASA NOVEMBER 2 6 , 1 9 8 4 2 0 D I M P ( 2 1 , 4 > ,M1 (4> ,M2(4> , N 5 ( 2 1
, 4 > , U ( 2 0 > 3 0 D I M L1(4,4>,N(4,4>,R1(3,4>,Nl
( 2 1 , 4 > , N 2 ( 2 1 , 4 > , N 3 ( 2 1 , 4 > ,N4( 2 1 , 4 >
3 1 D I M D 4 ( 4 > ,M(4> 33 D I M MX(4 ) ,RX(3 ,4> , L X ( 4 > 3 5 FOR I = I TO 4 : M X ( I > = 100 :LX
(I> = 1 0 0 : NEXT I 36 FOR I = I TO 3: FOR J = I TO
4 : R X ( I , J > = 100 : NEXT J: NEXT I
40 A = FRE ( 0 ) : PRINT "VOLNA PAM AT:" ;A
50 REM ........................ ---
5 1 REM P ( T , J> SLOVAK POPULATION BY AGE
5 2 REM B NUMBER DF NEklBORNS I N SSR 1 9 8 3
5 3 REM M 1 ( J > COPD MORTALITY I N SSR 1 9 8 3
5 4 REM M 2 ( J > GENERAL MORTALITY WITHOUT
55 REM COPD CASES I N SSR, 1 9 8 3
5 6 REM U ( T > % OF CHANGE I N MORT A L I T Y
57 REM I N FORCASTED YEARS 58 REM N ( I , J> PROPORTI ON OF SLO
VAK POPU 59 REM LAT ION I N R ISK 6 0 REM 1=1 WITHOUT R I S K '
6 1 REM 1=2 CIGARETTES SMOKING
6 2 REM 1=3 L IV INGAJORKING I N A 1 R-POLL
63 REM UTED ENVIRONMENT 6 4 REM I = 4 FREQUENT LIPPER-A1 R
WAYS I N 65 REM FECTI ONS 66 REM R L ( I , J > COEF.OF TRANSIT1
ON FROM 67 REM GROUP WITHOUT AN
Y R ISK 6 8 REM TO THE R ISK GROU
PS
6 9 REM 1=1 SMOKING 7 0 REM 1=2 INFECT1 ONS 7 1 REM I = 3 AIR-POLLUTION 7 2 REM L l ( 1 , J ) R I S K OF GETTING S
I C K FROM 7 3 REM COPD FOR PEOPLE 7 4 REM 1=1 WITHOUT R ISK 75 REM 1=2 C I GARETTES SMOKING
76 REM 1=3 INFECTIONS 77 REM I = 4 AIR-POLLUTION 78 REM N l ( T , J > FORECAST OF PEOP
L E WITH0 79 REM OUT R ISK 8 0 REM N 2 ( T , J > FORECAST OF W O K
ERS I N 8 1 REM SSR 8 2 REM N 3 ( T , J ) FORECAST OF PEOP
L E WITH 83 REM FREQUENT INFECT1
ON S 8 4 REM N 4 ( T , J> FORECAST DF PEOP
L E I N 85 REM A 1 R-POLLUTI ON 86 REM T T I M E OF FORECAST I N YE
ARS 37 REM J AGE GR0UPS:O-19;20-39;
40 -59 ; 88 REM 60&MORE 9 0 REM MX( I > 1=4 FACTOR TO C H W
GE MORTALITY 9 1 REM RX( I > 1=4 FACTOR TO CHAN
GE TRANSIT ION INTO R ISK GROU PS
92 REM LX( I > 1=4 FACTOR TO CHAN GE TRANSIT1 ON INTO GROUP OF ILL
1 0 0 REM ........................ ---------
1 0 5 PRINT "TEST SCENARIOS?(Y/N>" ;: INPUT SCB: I F MID% (SC8, 1 , 1 ) = " Y n THEN GOSUB 4 0 0 0
1 1 0 DATA 1 7 3 6 , 1 6 1 9 , 1 0 7 0 , 7 3 1 : REM SLOVAK POPULATION I N 1 9 8 3 I
N THOUSANDS 1 2 0 FOR I = 1 TO 4 : READ P ( l , I > :
1 2 2 N 1 ( 1 , 1 > = P ( 1 , 1 > * 0 .51 : FOR I = 2 TO 4 : N l ( l , I > = P ( 1 , I ) * 0 . 3 4 : NEXT I: REM I N I T I A L N UMBER OF PEOPLE WITHOUT ANY R I S K
1 2 5 REM PRINT TAB( 7 > ; P ( l , l > ; TA B ( 2 2 > ; P ( 1 , 2 > ; T
130 B = 1 1 2 7 5 0 : REM #OF BIRTH I N 1 9 8 3
1 4 0 REM MI-#OF COPD DEATHS;M2-# TOTAL # OF DEATH WITHOUT COP D CASES
150 DATA 167 ,96 ,336 ,1663 : REM #OF COPD DEATHS
160 FOR I = 1 TO 4: READ M l ( 1 ) : D 5 ( I ) = M l ( I > : M l ( I > = M l ( I > / P ( 1 , I ) : NEXT I
1 6 1 REM D5( I) - NUMBER OF DEATH S FROM COPD I N AGE GROUPS
1 7 0 DATA 3342 ,1912 ,6735 ,33269 : REM NUMBER OF ALL DEATHS
180 FOR I = 1 TO 4: READ M 2 ( I > : D 4 ( I > = M 2 ( I ) : M 2 ( 1 > = M 2 ( I > / P ( l , I > : M ( I > = M 2 ( I > - M l ( I > :
NEXT I 190 REM ----- CYCLE TO COUNT POP
ULATION FORECAST-------- 1 9 2 DATA 0 .99 ,1 ,1 ,1 .01 ,1 .01 , 1 . 0 2
,1.02,1.02,1.02,1.03,1.03,1. 0 3 , l . 03 ,1 .04,1 . 04 ,1 . 04 ,1 .04 , 1 . 0 4 , l . 04 ,1 . 0 4
1 9 4 FOR I = 1 TO 20: READ U( I > : NEXT I: REM %OF MORTALITY DEVELO PMENT FORECAST
2 0 0 FOR J = 2 TO 21 : REM 2 0 YEA RS FORECAST
2 0 2 I F MY = J THEN FOR K = 1 TO 4 : M l ( K > = M l ( K ) * MX / 100 : NEXT K
2 1 0 P ( J , l > = P ( J - 1 , 1 > + B - ( 0 . 0 5 * P ( J - 1 , 1 > > - ( M 2 ( 1 > * U ( J - 1 ) + ( M 1 ( 1 > * X / 1 0 0 ) > * PC J - 1 , 1 > : REM POPULA T I O N I N AGE 0-19
2 2 0 FOR K = 2 TO 3: REM FOR THE 2ND AND THE 3RD AGE GROUP
2 3 0 P ( J , K > = P ( J - 1 ,K) + ( 0 . 0 5 * P ( J - l , K - 1 ) ) - ( 0 . 0 5 * P( J - 1 , K ) ) - (M2(K) * U ( J - 1 ) + M 1 ( K > > * P ( J - 1 , K ) : NEXT K
240 P ( J , 4 > = P ( J - 1 ,4 ) + ( 0 . 0 5 * P ( J - 1 , 3 1 1 - ( M 2 ( 4 > * U ( J - 1 ) + M l ( 4 ) * X / 1 0 0 ) * P ( J - 1 , 4 > : REM POPULATION I N A GE 60 & OVER
2 4 2 REM PRINT TAB( 7 ) ; P ( J , 1 > ; TA B ( I 2 2 > ; P ( J , 2 > ; T AB( 3 8 > ; P ( J , 3 ) ; TAB( 4 8 ) ;P( J , 4 >
2 5 0 NEXT J 2 6 0 DATA 1 4 3 , 2 9 8 ,276 ,382 : REM
#OF COPD CASESIN SSR I N 1 9 8 3

2 7 0 FOR I = 1 TO 4: READ N5( 1 , I ) : N 5 ( 1 , 1 > = N 5 ( 1 , I > * 1000 : NEXT I
280 DATA 0 .02 ,0 .1 ,0 .2 ,0 .25 : REM RISK OF GETTING SICK FROM T
HE GROUP OF HEALTHY 2 9 0 DATA 0 .05 ,0 .3 ,0 .6 ,0 .75 : REM
RISK OF GETTING SICK FROM S MOKING
300 DATA 0 .1 ,0 .2 ,0 .25 ,0 .3 : REM RISK OF GETTING SICK FROM A I R-POLLUTI ON
3 1 0 DATA 0 .39 ,0 ,0 ,0 : REM RISK OF GETTING SICK FROM REPEATE D RESPIRATORY INFECTIONS I N CHI LDHOOD
3 2 0 FOR I = 1 TO 4 : FOR J = 1 TO 4 : READ L l ( I , J > : NEXT J: NEXT I
3 2 9 DATA 0 .88 ,0 .52 ,0 .42 ,0 .14 330 DATA 0.164,O. 5327,O. 5848,O.
4938 : REM PROPORTION OF POP ULATION WITH SMOKING
3 4 0 DATA 0 .31 ,0 .31 ,0 .31 ,0 .32 : REM PROPORTION OF POPULATION UN
DER A1 R-POLLUTI ON 3 5 0 DATA 0 .30,0,0,0: REM PROP0
RTION OF POPULATION WITH FRE QUENT RESPI RATORY DISEGSES I N CHILDHOOD
356 FOR K = 1 TO 4: READ X ( K > : NEXT K
3 6 0 FOR I = 1 TO 3: FOR J = 1 TO 4 : READ N ( I , J >
3 6 2 N ( 1 , J ) = N ( I , J > * X ( J > 3 6 4 ND(T J: NEXT I 3 7 0 FOR J = 1 TO 4:N2( 1 , J) = N ( 1
, J> * P ( l ,J> :N3(1 ,J> = N ( 2 , J * P t l , J > : N 4 ( 1 , J > = N ( 3 , J ) *
P ( l , J > : NEXT J: REM ABSOLUT EPLE I N RISK
3 7 9 DATA 50,30 ,30 ,30 3 8 0 DATA 0 .69 ,0 .06 ,0 .09 ,0 .04 : REM
COEF.OF TRANSITION FROM GRO UP WITHOUT SMOKING TO SMOKIN G
390 DATA 0.0005,O .002,0 .002,0 .O 0 5 5 : REM COEF.OF TRANSITION
FROM GROUP WITHOUT RISK TO A1 R-POLLUTI ON
4 0 0 DATA 0 .08 ,0 ,0 ,0 : REM COEF. OF TRANSITION FROM GROUP WIT HOUT RISK TO NURSERY
4 0 5 FOR K = 1 TO 4 : READ X ( K > : NEXT K

410 FOR I = 1 T O 3 : FOR J = 1 TO 4: READ R l ( 1 ,J)
412 I F I = 2 THEN R l ( 1 , J ) = R l ( 1 , JZ * X ( J )
413 NEXT J: NEXT I 500 REM ------ # OF SICK,# OF PE
OPLE I N RISK-------------
510 FOR T = 2 TO 21: REM YEARS
511 I F LY = T THEN FOR K1 = 1 TO 4: FOR K2 = 1 TO 4 : L l ( K l , K 2 ) = L l ( K l , K 2 ) * LX(K2) / 100: NEXT K2: NEXT K1
514 I F RY = T THEN FOR K1 = 1 TO 3 : FOR K2 = 1 TO 4 :R l (K l ,K2> = R l ( K l , K 2 ) * RX(Kl,K2) / 1
00: NEXT K2: NEXT K1 520 FOR J = 1 TO 4: REM AGE GRO
UPS 530 R = R l ( 1 , J ) + R l ( 2 , J ) + R l ( 3 ,
J) 531 P = B: I F J > 1 THEN P = 0.05
* N l ( T - 1 , J - 1 ) 533 N l ( T , J ) = N l ( T - 1,J) + P - (
R + L l ( 1 , J ) ) * N I ( T - 1 ,J ) - (0 .05 * N1(T - 1 ,J ) ) - (M2(J ) * N l ( T - 1 , J ) )
534 I F J = 2 THEN N I ( T , J ) = N l ( T ,J) + 0.05 * N4(T - 1 , J ) : REM RECOVERING FROM RESP.DISEAS
ES 536 I F J = 1 THEN P = 0 537 I F J > 1 THEN P = 0.05 * N2(
T - 1 , J - 1 ) 538 I F J = 2 THEN P = P + 0.05 *
N4<T - l , J - 1 ) 540 N2(T ,J ) = N2(T - 1,J ) + R l ( 1 ,
J) * N l ( T , J ) + P - ( L l ( 2 , J ) * N2(T - 1 , J ) ) - ( 0 . 0 5 * N2(T - 1 , J ) ) - (M(J> * N2(T - 1 , J ) )
542 I F J > 1 THEN P = 0.05 * N3( T - 1 ,J - 1 )
550 N3(T,J) = N3(T - 1 ,J) + R l ( 2 , J) * N l ( T , J ) + P - ( L l ( 3 , J ) * N3(T - 1, J ) ) - (0 .05 * N3(T - 1 , J ) ) - (M(J ) * N3(T - 1 , J ) )
552 I F J > 1 THEN N4(T ,J ) = 0: GOTO 562
560 N4(T ,J ) = N4(T - 1 ,J ) + R l ( 3 , J) * N I ( T , J ) + P - ( L l ( 4 , J ) * N4(T - 1 ,J)) - (0 .05 * N4(T - 1 , J ) ) - (M(J ) * N4(T - 1 , J ) )
5 6 2 I F J > 1 THEN P = 0 . 0 5 * N5( T - l , J - 1 )
570 N 5 ( T , J ) = N 5 ( T - 1 , J) + L l ( 1 , J) * N l ( T - 1 , J ) + L l ( 2 , J ) * N 2 ( T - 1 , J ) + L l ( 3 , J ) * N 3 ( T - 1 , J ) + L l ( 4 , J ) * N 4 ( T - 1
,J) + P - ( N 5 ( T - 1 , J ) * (MI (J) t M ( J > > >
400 NEXT J: NEXT T 410 HOME 620 PRINT "PRESS";: INVERSE : PRINT
" G " ; : NORMAL : PRINT " I F Y OU PREFER RESULTS I N GRAPHS"
630 INPUT A%:PP% = MID% (A%, 1 , l > : I F PPQ = " G" THEN GOTO 1 500
1000 REM ------- PRINTOUTS------- -- 1001 PR# 1: PRINT 1010 PRINT TAB( 1 1 ) " I N P U T
D A T A " : PRINT TAB( 1 1 ) ; " F OR SLOVAKIA 1783" : FOR I = 1
TO 40: PRINT " " " ;: NEXT I: PRINT : PRINT : PRINT
1011 PRINT "NOTE" : P R I M TAB( 6 > ; "RISK GROUP#l - WITHOUT R I SKU: PRINT TAB( 1 7 > ; " # 2 - S MOKERS": PRINT TAB( 1 7 > ; " # 3 - A I R - POLLUTION " : PRINT TAB( 1 7 ) ; " # 4 - RESPIRATORY
INFECT1 ONS" : 1 0 1 2 PRINT : PRINT : PRINT TAB(
1 0 ) ; " P 0 P U L A T I 0 N " : FOR I = 1 TO 40 : PRINT ".";: NEXT I:: PRINT : PRINT
1 0 1 4 PRINT TAB( 6 > ; " 0 - 1 9 " ; TAB( 1 7 ) ; " 2 0 - 3 9 " ; TAB( 29 ) ; " 4 0 - 5 9 " ; TAB( 3 9 ) ;" 60 -"
1 0 1 5 PRINT TAB( 4 > ; P ( l , l > ; TAB( 1 5 > ; P ( 1 , 2 > ; TAB( 2 7 > ; P ( 1 , 3 > : TAB( 3 9 > ; P ( 1 , 4 >
1 0 1 6 PRINT : PRINT : PRINT "NUMB ER OF N E W B 0 R N S:" ;B: PRINT : PRINT
1 0 1 7 PRINT TAB( 1 1 ) ; " M 0 R T A L I T Y " : PRINT TAB( 11) ; "W ITHOUT COPD CASES": FOR I = 1 TO 40: PRINT ".";: NEXT I:
PRINT 1 0 1 8 PRINT TAB( 6 ) ; "O - 1 9 " ; TAB(
1 7 > ; " 2 0 - 3 9 " ; TAB( 2 9 > ; " 4 0 - 5 9 " ; TAB( 3 9 ) ; " 60 -"
1 0 1 9 PRINT TAB( 4 > ; D S ( ' l > ; TAB( 1 5 ) ; D 5 i 2 ) ; TAB( 2 7 ) ; D5( 3 ) ; TAB( 39 ) ;D5(4>

1020 PRINT : PRINT : PRINT TAB( 11);"M 0 R T A L I T Y " : PRINT TAB( 11 ) ; " SPECI F I C FOR COPD " : FOR I = 1 TO 40: PRINT " . " ; : NEXT I: PRINT
1021 PRINT TAB( 6) ; "O - 1 9 " ; TAB( 17) ; "20 - 3 9 " ; TAB( 29 ) ; "40 - 59" ; TAB( 3 9 ) ; " 60 -"
1022 PRINT TAB( 4 > ; 0 4 ( 1 > ; TAB( 15) ;04(2> ; TAB( 27) ;04(3> ; TAB( 39>;D4(4>: PRINT : PRINT
1023 PRINT TAB( 16) ;"R I S K n : PRINT TAB( 12);"OF GETTING SICK": FOR I = 1 TO 40: PRINT " . " ; : NEXT I: PRINT : PRINT
1025 PRINT "RISK"; TAB( 6);"O - 19" ; TAB( 17) ; "20 - 39" ; TAB( 29) ;"40 - 59" ; TAB( 39) ;" 60 -"
1027 PRINT " # I " ; TAB( 4>;L1(1 ,1) ; TAB( 15> ;L1 (1 ,2> ; TAB( 27) ;L1(1,3) ; TAB( 39) ;L1(1 ,4>
1029 PRINT "#2" ; TAB( 4> ;L1 (2 ,1> ; TAB( 15) ;L1(2 ,2) ; TAB( 27) ;L1(2 ,3>; TAB( 39>;L1(2 ,4)
1030 PRINT " # 3 " ; TAB( 4>;L1(3 ,1> ; TAB( 15) ;L1(3 ,2>; TAB( 27) ;L1(3 ,3>; TAB( 39) ;L1(3,4)
1031 PRINT " # 4 " ; TAB( 4>;L1(4 ,1> ; TAB( 15) ;L1(4 ,2>; TAB( 27) ;L1 (4 ,3 ) ; TAB( 39>;L1(4 ,4>: PRINT : PRINT
1035 PRINT TAB( 3 ) ; " P R 0 P 0 R T I 0 N OF POPULATION": PRINT TAB( 1 7 ) ; " I N RISK": FOR I =
1 TO 40: PRINT " . " ; : NEXT I : PRINT : PRINT
1037 PRINT "RISK"; TAB( 6);"O - 19" ; TAB( 17) ; " 20 - 39" ; TAB( 29>; "40 - 5 9 " ; TAB( 39) ; "60 , u
1039 PRINT "#2" ; TAB( 4) ;N( 1 , l ) ; TAB( 15) ;N( 1,2) ; TAB( 27) ;N
(1 ,3) ; TAB( 39) ;N( 1,4> 1040 PRINT " # 3 " ; TAB( 4) ;N(2 ,1) ;
TAB( 15) ;N(2 ,2) ; TAB( 27);N ( 2 , 3 ) ; TAB( 39) ;N(2,4>
1041 PRINT "444"; TAB( 4>;N(3 ,1) ; TAB( 15) ;N(3 ,2) ; TAB( 27);N
(3 ,3) ; TAB( 39) ;N(3,4) 1042 PRINT : PRINT 1045 PRINT TAB( 6);"COEF.OF T R
A N S I T I O N " : PRINT "FR OM GROUP WITHOUT RISK TO ONE WITH RISK": FOR I = 1 TO 40 : PRINT " . " ; : NEXT I : PRINT : PRINT
1 0 4 7 PRINT " R I S K " ; TAB( 6 ) ; " 0 - 1 9 " ; TAB( 1 7 > ; " 2 0 - 3 9 " ; TAB( 29) ; " 4 0 - 5 9 " ; TAB( 39) ; " 6 0 -
1 0 4 8 PRINT "442"; TAB( 4 > ; R X ( l , l > ; TAB( 1 5 ) ;RX(1 , 2 ) ; TAB( 2 7 ) ;RX(1 ,3> ; TAB( 3 9 ) ; R X ( 1 , 4 )
1 0 4 9 PRINT "443"; TAB( 4 ) ; R 1 ( 2 , 1 ) ; TAB( 1 5 > ; R 1 ( 2 , 2 ) ; TAB( 2 7 ) ; R 1 ( 2 , 3 > ; TAB( 3 9 > ; R 1 ( 2 , 4 >
1050 PRINT " # 4 " ; TAB( 4 > ; R 1 ( 3 , 1 > ; TAB( 1 5 > ; R 1 ( 3 , 2 > ; TAB( 2 7 ) ; R 1 ( 3 , 3 > ; TAB( 3 9 > ; R 1 ( 3 , 4 > : PRINT : PRINT
1051 PRINT : PRINT : PRINT TAB( 2 ) ; " C O P D M O R B I D I T
Y " ; : FDR I = 1 TO 40 : PRINT ".";: NEXT I: PRINT
1 0 5 3 P R I M TAB( 6 ) ; " O - 1 9 " ; TAB( 1 7 > ; " 2 0 - 3 9 " ; TAB( 2 9 > ; " 4 0 - 5 9 " ; TAB( 3 9 ) ; " 60 -"
1 0 5 5 PRINT TAB( 4 ) ;N5( 1 , l ) ; TAB( 1 5 ) ; N 5 ( 1 ,2> ; TAB( 2 7 ) ;N5(1 , 3 > ; TAB( 3 9 ) ;N5( 1 , 4 >
1 0 5 7 FOR I = 1 TO 4 0 : PRINT " * " ; : NEXT I: PRINT : PRINT : PRINT
1060 I F SC9 < > " Y n THEN 1110 1 0 6 2 PRINT TAB( 5 ) " s C E N A R
I 0 T E S T E D : " 1 0 6 4 PRINT TAB( 3 ) ;"CHANGE I N T
REATMENT EFFECTIVENESS: " 1 0 6 6 PRINT TAB( 6 ) ; " 0 - 1 9 " ; TAB(
1 7 ) ; " 2 0 - 3 9 " ; TAB( 2 9 ) ; " 4 0 - 5 9 " ; TAB( 3 9 ) ;" 60 -"
1 0 6 5 PRINT TAB( 4 > ; M X ( 1 > ; TAB( 1 5 ) ;MX( 2) ; TAB( 27) ;MX( 3 ) ; TAB( 3 9 ) ;MX( 4 )
1 0 6 9 PRINT "YEAR OF CHANGE:";MY: PRINT : PRINT
1070 PRINT TAB( 09);"CHANGE I N R ISK FACTORS"
1 0 7 2 PRINT " R I S K " ; TAB( 6 ) ; " 0 - 1 9 " ; TAB( 1 7 > ; " 2 0 - 3 9 " ; TAB( 2 9 > ; " 4 0 - 5 9 " ; TAB( 3 9 > ; " 6 0 - 11
1 0 7 5 PRINT " # 3 " ; TAB( 4>;f?X(2,1) ; TAB( 1 5 ) ; R X ( 2 , 2 > ; TAB( 2 7 ) ;RX(2 ,3> ; TAB( 39) ;RX(2,4>
1 0 7 6 PRINT " # 4 " ; TAB( 4);f?X(3,1> ; TAB( 1 5 > ; R X ( 3 , 2 > ; TAB( 2 7 ) ;RX(3 ,3> ; TAB( 3 9 > ; R X ( 3 , 4 > :
1 0 7 8 PRINT "YEAR OF CHANGE:";RY 1080 PRINT : PRINT 1 0 8 2 PRINT TAB( 10);"CHANGE I N
PREVENT I ON : "
1054 PRINT TAB( 6 > ; " 0 - 1 9 " ; TAB(
1058 PRINT "YEAR OF CHANGE:" ;LY 1090 PRINT : PRINT : PRINT 1110 PRINT TAB( 3);"FORECASTS 0
F PEOPLE UNDER DIFFERENT" 1112 PRINT TAB( 1 0 ) ; " H E A L T
H R I S K " 1114 FOR I = 1 TO 40: PRINT " * " ;
: NEXT I 11 1 6 PRINT : PRINT : PRINT 1117 PRINT TAB( 13);"W I T H 0
U T " : PRINT : PRINT 1118 PRINT "YE"; TAB( 15);"AGE G
ROUPS" 1120 PRINT "AR"; TAB( 6) ; "O - 19
" ; TAB( 17 ) ; "20 - 3 9 " ; TAB( 29> ; "40 -59 " ; TAB( 3 9 ) ; " 60 - 11
1122 FOR I = 1 TO 49: PRINT " . " ; : NEXT I: PRINT
1200 FOR T = 1 TO 21 1210 PRINT T - 1 ; TAB( 4) ; ~ l (T,I
1 ; TAB( 1 5 > ; N l ( T , 2 ) ; TAB( 27 > ; N l ( T , 3 ) ; TAB( 3 9 > ; N l ( T , 4 )
1220 NEXT T 1222 PRINT : PRINT : PRINT TAB(
8);"CIGARETTE S M 0 K I N G " : PRINT : PRINT
1224 PRINT "YEH; TAB( 1S);"AGE G ROUPS"
1226 PRINT "AR"; TAB( 6 > ; " 0 - 19 " ; TAB( 17 ) ; "20 - 39" ; TAB( 29 ) ; "40 -59 " ; TAB( 3 9 ) ; " 60 ,"
1228 FOR I = 1 TO 49: PRINT " . " ; : NEXT I: PRINT
1230 FOR T = 1 TO 21 1232 PRINT T - 1 ; TAB( 4 ) ;N2(T,1
1 ; TAB( 15) ;N2(T,2); TAB( 27 >;N2(T,3) ; TAB( 39);N2(T,4)
1234 NEXT T 1240 PRINT : PRINT : PRINT TAB(
7 ) ; " A I R - P O L L U T I 0 N " : PRINT : PRINT
1242 PRINT "YE" ; TAB( 15) ;"AGE G ROUPS"
1244 PRINT "ARM; TAB( 6);"O - 19 " ; TAB( 1 7 ) ; " 2 0 - 3 9 " ; TAB( 29> ; "40 -59 " ; TAB( 39 ) ; " 60 - 81

1246 FOR I = 1 TO 49: PRINT " . " ; : NEXT I: PRINT
1248 FOR T = 1 TO 21 1250 PRINT T - 1 ; TAB( 4 ) ;N3(T,1
> ; TAB( 15>;N3(T ,2> ; TAB( 27 > ;N3(T ,3 i ; TAB( 39) ;N3(T,4>
1252 NEXT T 1260 PRINT : PRINT : PRINT TAB(
5);"FREQ.RESP.I N F E C T I 0 N Sn: PRINT : PRINT
1262 PRINT "YE"; TAB( 15);"AGE G ROUPSn
1264 PRINT "ARM; TAB( 6 > ; " 0 - 19 " ; TAB( 17) ; "20 - 39" ; TAB( 29>; "40-59" ; TAB( 3 9 ) ; " 60 , "
1266 FOR I = 1 TO 49: PRINT " ."; : NEXT I: PRINT
1268 FOR T = 1 TO 21 1270 PRINT T - 1 ; TAB( 4 ) ;N4(T,1
> ; TAB( 15) ;N4(T,2>; TAB( 27 > ;N4(T, 3 ) ; TAB( 39) ;N4(T, 4)
1272 NEXT T 1280 PRINT : PRINT : PRINT TAB(
14);"FORECAST OFn: PRINT TAB( 7 ) ; " C O P D M O R B I D I T
Y" 1282 FOR I = 1 TO 40: PRINT " ^ " i
: NEXT I: PRINT : PRINT 1284 PRINT "YE" ; TAB( 15) ;"AGE G
ROUPS" 1256 PRINT 'AR"; TAB( 6 i ; " O - 19
" ; TAB( 17) ; " 20 - 39" ; TAB( 29>; "40-59" ; TAB( 3 9 ) ; " 60 ,"
1288 FOR I = 1 TO 49: PRINT " . " ; : NEXT I: PRINT
1290 FOR T = 1 TO 21 1292 PRINT T - 1 ; TAB( 4) ;N5(T,1
1 ; TAB( 15) ;N5(T,2>; TAB( 27 > ;N5(T,3> ; TAB( 39) ;N5(T,4>
1274 NEXT T 1300 PRINT : PRINT : PRINT TAB(
14);"FORECAST OF": PRINT TAB( 5 ) ; " P O P U L A T I O N I N
S S R " 1302 FOR I = 1 TO 40: PRINT " ^ " i
: NEXT I: PRINT : PRINT 1304 PRINT "YE" ; TAB( 15) ;"AGE G
ROUPS" 1306 PRINT "AR"; TAB( 6 ) ; " 0 - 19
" ; TAB( 17) ; " 20 - 3 9 " ; TAB( 29) ; "40-59" ; TAB( 39) ;" 60 - u
1308 FOR I = 1 TO 49: PRINT " . " ; : NEXT I: PRINT

1310 FOR T = 1 1 0 21 1312 PRINT T - 1; TAB( 4) ;P(T,1>
; TAB( 1 5 > ; P ( T , 2 > ; TAB( 2 7 ) ; P(T,3> ; TAB( 39) ;P(T,4>
1314 NEXT T 1400 REM FOR1 = 1 TO 4: PRINT N1
(20 ,I> + N2(20,1 > + N3(20 ,1> + N 4 ( 2 0 , I > + N5 (20 ,1> : NEXT I
1499 GOT0 2000 1500 REM 1505 MX = 0:MN = 200000000 1510 FOR T = 1 TO 21: FOR J = 1 TO
4:P(T,J> = INT (P (T ,J> / 10 o o o o >
1515 I F P (T ,J> > MX THEN MX = P( T , J >
1520 I F P(T, J> < MN THEN MN = P( T , J >
1525 NEXT J: NEXT T 1530 D = 75 / MX 1539 MX = 0:MN = 2000000 1540 FOR T = 1 TO 21: FOR J = 1 TO
4:N2(T,J> = INT (N2(T, J> / 10000>
1541 I F N2(T, J> > MX THEN MX = N 2(T , J>
1542 I F N2(T, J> < MN THEN MN = N 2(T ,J>
1545 NEXT J: NEXT T 1546 D l = 75 / MX 1549 MX = 0 1550 FOR T = 1 TO 21: FOR J = 1 TO
4:N5(T,J) = INT (N5(T,J) / 100000)
1551 I F N5(T, J) > MX THEN MX = N S(T,J>
1555 NEXT J: NEXT T 1556 D2 = 75 MX 1600 HGR : HCOLOR= 3: ROT= 0 : SCALE=
1 1610 HPLOT 0,O TO 0,75 TO 130,75
TO 130,O TO 0,O 1620 HPLOT 149,O TO 149,75 TO 27
9,75 TO 279,O TO 149,O 1630 HPLOT 0 ,84 TO 0,159 TO 130,
159 TO 130,84 TO 0,84 1700 ZN8 = "POPULATION FORECASTn:
X = 15:Y = 7 : GOSUB 1800 1710 ZN8 = "SM0KERS":X = 174:Y =
7: GOSUB 1800 1720 Z N I = "COPD CASES" : X = 15:Y =
91 : GOSUB 1800 1790 GOT0 1900 1800 FOR I 1 = 1 TO LEN ( Z N I > : I I
= ASC ( M I D I ( Z N B , I l , l > > - 31: I F I 1 < 1 THEN I 1 = 1
1 8 1 0 DRAW I 1 AT X + 6 * I 1 , Y : NEXT I 1 : RETURN
1 9 0 0 FOR T = 1 TO 2 1 : FOR J = 1 TO 4
1 9 0 5 I F J = 1 THEN HCOLOR= 2 1 9 0 6 I F J = 2 THEN HCOLOR= 3 1 9 0 7 I F J = 3 THEN HCOLOR= 5 1 9 0 8 I F J = 4 THEN HCOLOR= 6 1 9 1 0 X I = ( T - 1 ) * 6 :X2 = T * 6 :
Y1 = 7 5 - ( P ( T - 1 , J ) * D) :Y 2 = 75 - ( P ( T , J > * D >
1 9 5 0 HPLOT X I ,Y1 TO X2 ,Y2 1 9 6 0 X I = 1 4 9 + ( T - 1 ) * 6 :X2 =
T * 6 + 1 4 9 : Y l = 75 - ( N 2 ( T - 1 , J ) * D 1 > : Y 2 = 75 - ( N 2 ( T , J ) * D l )
1 9 6 3 HPLOT X 1 , Y l TO X2,Y2 1 9 7 0 X I = ( T - 1 ) * 6 : X 2 = T * 6 :
Y1 = 1 5 9 - ( N 5 ( T - 1 ,J> * D2 > :Y2 = 1 5 9 - ( N 5 ( T , J) * D2)
1 9 7 5 HPLOT X 1 , Y l TO X2,Y2 1 9 8 0 NEXT J: NEXT T 2 0 0 0 PR# 0 2 0 0 1 GOTO 1 0 0 0 0 4 0 0 0 REM PREPAI R SCEIVARI OS 4 0 0 1 HOME : PRINT : PRINT : PRINT
: PRINT 4 0 1 0 PRINT "FOLLOWING SCENARIOS
ARE TO TEST: " 4 0 1 1 PRINT TAB( 1 5 ) ;"CHANGE I N
TREATMENT EFFECTIVENESSu 4 0 1 2 PRINT TAB( 15);"CHANGE I N
R I SK FACTORS" 4 0 1 3 PRINT TAB( 1 5 ) ;"CHANGE I N
PREVENT1 ON" 4 0 3 0 PRINT "ENTER % OF CHANGE OF
TREATMENT : " 4 0 3 1 PRINT " 0 -19 : " ; : INPUT A%: I F
A% = " " THEN 4 0 3 4 4 0 3 2 MX(1 ) = VAL ( MID% (A%,1 ,3>
)
4 0 3 4 PRINT " 2 0 - 3 9 : " ; : INPUT A%: I F A% = " " THEN 4 0 3 8
4 0 3 6 MX(2 ) = VAL ( MID% (A%,1 , 3 > )
4 0 3 8 PRINT " 4 0 - 6 0 : " ; : INPUT A%: I F A% = " " THEN 4 0 4 2
4 0 3 9 MX(3 ) = VAL ( MID% (A%,1 ,3> )
4 0 4 2 PRINT " 6 0 - :";: INPUT A%: I F A% = " " THEN 4 0 5 0
4 0 4 3 MX(4 ) = VAL ( MID% (A%,1 ,3>
4 0 4 5 PRINT "ENTER YEAR OF CHANGE ( 1 - 2 0 ) " ; : INPUT MY: I F MY >
20 THEN 4 0 4 5

4 0 4 9 PRINT : PRINT 4 0 5 0 PRINT "ENTER % OF CHANGE I N
SMOKING HABITS: " 4 0 5 1 PRINT " 0 - 1 9 : " ; : INPUT A%: I F
A% = " " THEN 4 0 5 4 4 0 5 2 R X ( 1 , l ) = VAL ( MID% ( A % , l ,
3 ) > 4 0 5 4 PRINT " 2 0 - 3 9 : " ; : INPUT A%: I F
AS = " " THEN 4 0 5 8 4 0 5 6 R X ( 1 , 2 > = VAL ( MID% ( A % , l ,
3 ) > 4 0 5 8 PRINT " 4 0 - 6 0 : " ; : INPUT A%: I F
A% = " " THEN 4 0 6 2 4 0 5 9 RX(1 ,3> = VAL ( M I D I (A%,1,
3) > 4 0 6 2 PRINT " 6 0 - : " ; : INPUT A s : I F
A% = " " THEN 4 0 7 0 4 0 6 3 RX(1 ,4> = VAL ( M I D % (A%,1,
3 ) > 4 0 7 0 PRINT "ENTER % OF CHANGE I N
AIR-POLLUTION:" 4 0 7 1 PRINT ' 0 - 1 9 : " ; : INPUT A%: I F
A% = " " THEN 4 0 7 4 4 0 7 2 R X ( 2 , l ) = VAL ( MID% (A%,1 ,
3 ) > 4 0 7 4 PRINT " 2 0 - 3 9 : " ; : INPUT A%: I F
A% = " " THEN 4 0 7 8 4 0 7 6 RX(2 ,2 ) = VAL ( MID% (A%,1,
3 ) 4 0 7 8 PRINT " 4 0 - 6 0 : " ; : INPUT A%: I F
A% = " " THEN 4 0 8 2 4 0 7 9 R X ( 2 , 3 > = VAL ( MID% (A%,1,
3 ) > 4 0 8 2 PRINT " 6 0 - : " ; : INPUT A%: I F
A% = " ' THEN 4 0 9 0 4 0 8 3 RX(2 ,4> = VAL ( MID% ( A % , l ,
3) > 4 0 8 9 PRINT : P R I N T 4 0 9 0 PRINT "ENTER % OF CHANGE I N
FRE0.RESP.DIS. IN CHILDHODD: 11
4 0 9 1 PRINT " 0 - 1 9 : " ; : INPUT A%: I F A% = " " THEN 4 1 0 5
4 0 9 2 R X ( 3 , 1 > = VAL ( MID% (A%,1, 3) >
4 1 0 5 PRINT "ENTER YEAR OF CHANGE ( 1 - 2 0 ) : " ; : INPUT RY: I F RY >
2 0 THEN 4 1 0 5 4 1 1 0 PRINT "ENTER % OF CHANGE I N
EFFECTIVENESSu: PRINT ' I N PREVENT1 ON"
4 1 1 1 PRINT " 0 -19 : ' ; : INPUT A%: I F A% = " " THEN 4 1 1 4
4 1 1 2 L X ( 1 ) = VAL ( MID% (A%,1 ,3> )

4 1 1 4 PRINT " 2 0 - 3 9 : " ; : INPUT k8: I F A 8 = " " THEN 4 1 1 8
4 1 1 6 L X ( 2 ) = VAL ( MID% (A%,1 ,3 ) )
4 1 1 8 PRINT " 4 0 - 6 0 : " ; : INPUT AS: I F AS = " " THEN 4 1 2 2
4 1 1 9 L X ( 3 ) = VAL ( MID% (A%,1,3) )
4 1 2 2 PRINT " 6 0 - :";: INPUT A%: I F A 3 = " " THEN 4130
4 1 2 3 L X ( 4 ) = VAL ( M I D 3 ( A 3 , 1 , 3 ) )
4 1 2 5 PRINT "ENTER YEAR OF CHANGE ( 1 - 2 0 ) " ; : INPUT LY : I F LY >
20 THEN 4 1 2 5 4 1 3 0 REM 5 0 0 0 RETURN 1 0 0 0 0 END