Embed Size (px)
Citation preview
The future of tourism in Iceland Part I: Context – Icelandic tourism today
September 2013
Part I - context tourism in Iceland.pptx 1
Copyr
ight
© 2
013 b
y T
he B
osto
n C
onsultin
g G
roup,
Inc.
All
rights
reserv
ed.
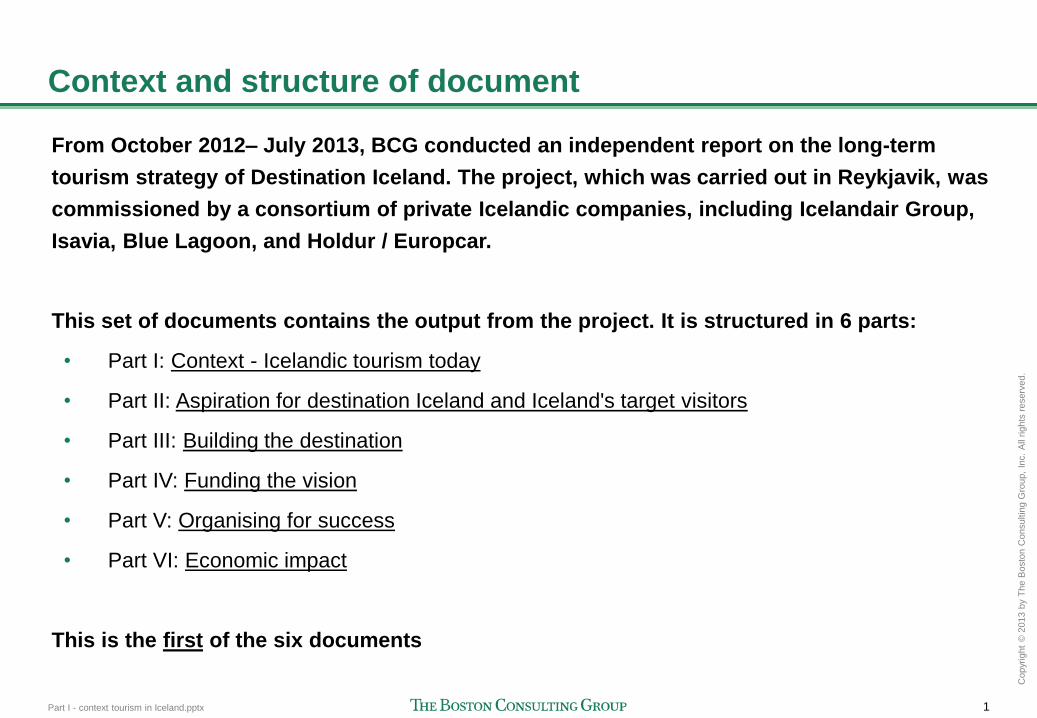
Context and structure of document
From October 2012– July 2013, BCG conducted an independent report on the long-term
tourism strategy of Destination Iceland. The project, which was carried out in Reykjavik, was
commissioned by a consortium of private Icelandic companies, including Icelandair Group,
Isavia, Blue Lagoon, and Holdur / Europcar.
This set of documents contains the output from the project. It is structured in 6 parts:
• Part I: Context - Icelandic tourism today
• Part II: Aspiration for destination Iceland and Iceland's target visitors
• Part III: Building the destination
• Part IV: Funding the vision
• Part V: Organising for success
• Part VI: Economic impact
This is the first of the six documents
Part I - context tourism in Iceland.pptx 2
Copyr
ight
© 2
013 b
y T
he B
osto
n C
onsultin
g G
roup,
Inc.
All
rights
reserv
ed.
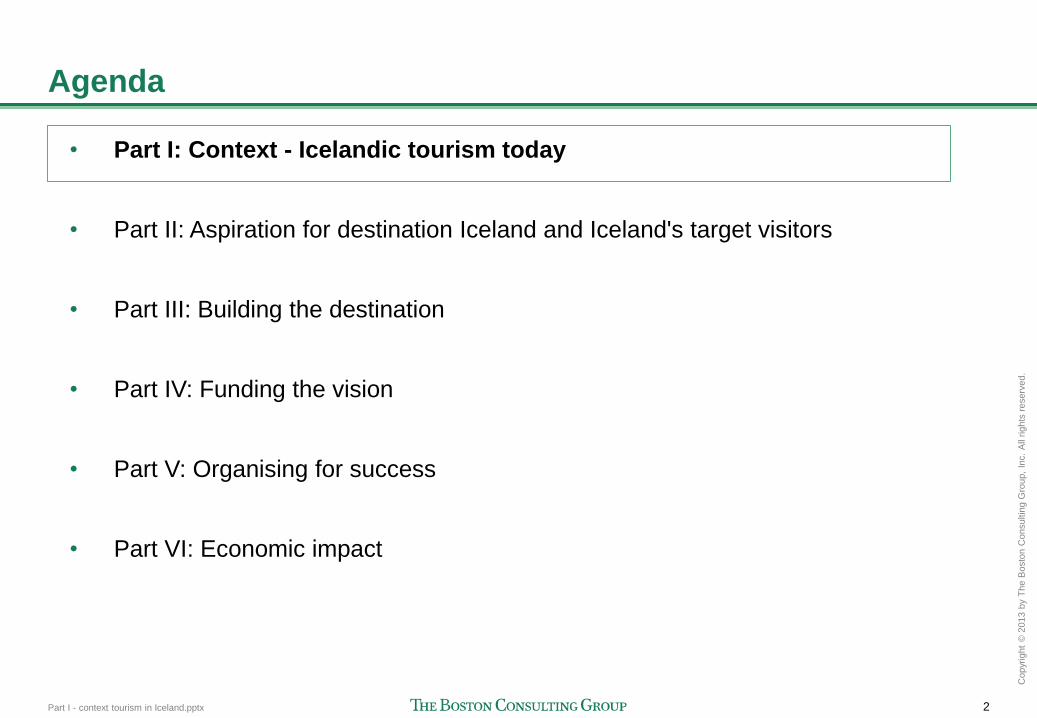
Agenda
• Part I: Context - Icelandic tourism today
• Part II: Aspiration for destination Iceland and Iceland's target visitors
• Part III: Building the destination
• Part IV: Funding the vision
• Part V: Organising for success
• Part VI: Economic impact
Part I - context tourism in Iceland.pptx 3
Copyr
ight
© 2
013 b
y T
he B
osto
n C
onsultin
g G
roup,
Inc.
All
rights
reserv
ed.
Total tourism spend
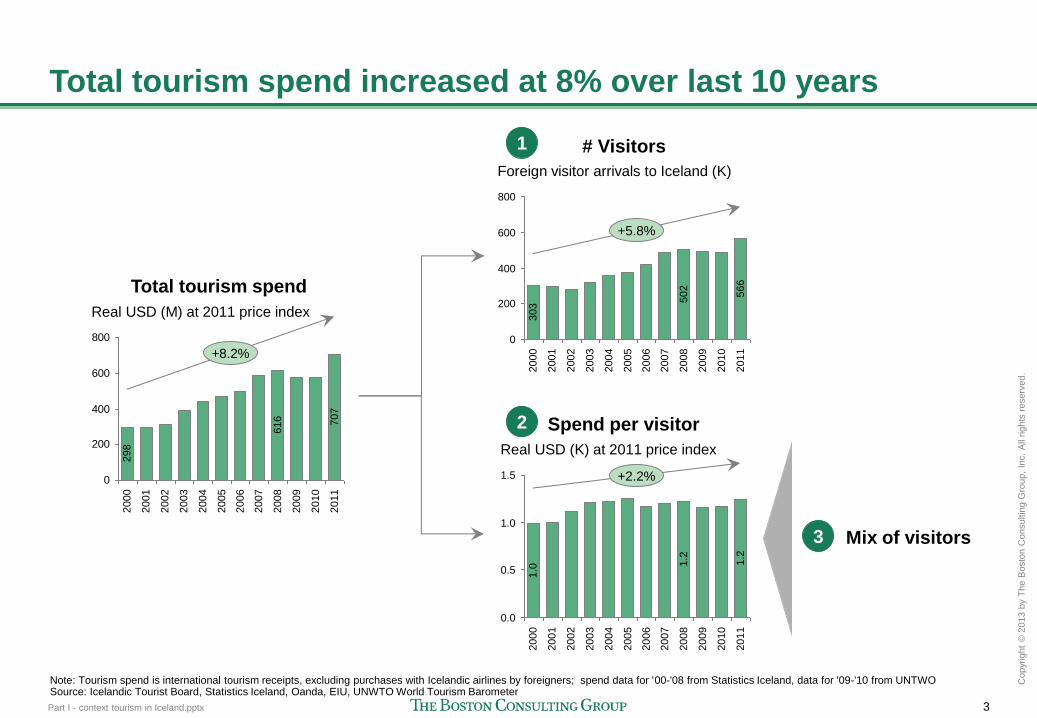
Total tourism spend increased at 8% over last 10 years
0
200
400
600
800
Real USD (M) at 2011 price index
2005
2001
+8.2%
2011
707
2009
2008
616
2007
2006
2000
298
2003
2004
2010
2002
Note: Tourism spend is international tourism receipts, excluding purchases with Icelandic airlines by foreigners; spend data for '00-'08 from Statistics Iceland, data for '09-'10 from UNTWO Source: Icelandic Tourist Board, Statistics Iceland, Oanda, EIU, UNWTO World Tourism Barometer
Spend per visitor
Real USD (K) at 2011 price index
2005
1.5
1.0
2001
0.5
+2.2%
2011
1.2
2009
2008
1.2
2007
2006
2004
2003
2000
1.0
0.0
2010
2002
# Visitors
800
2005
600
400
2001
200
+5.8%
2011
566
2009
2008
502
2007
2006
2004
2003
2000
303
Foreign visitor arrivals to Iceland (K)
0
2010
2002
1
2
Mix of visitors 3
Part I - context tourism in Iceland.pptx 4
Copyr
ight
© 2
013 b
y T
he B
osto
n C
onsultin
g G
roup,
Inc.
All
rights
reserv
ed.
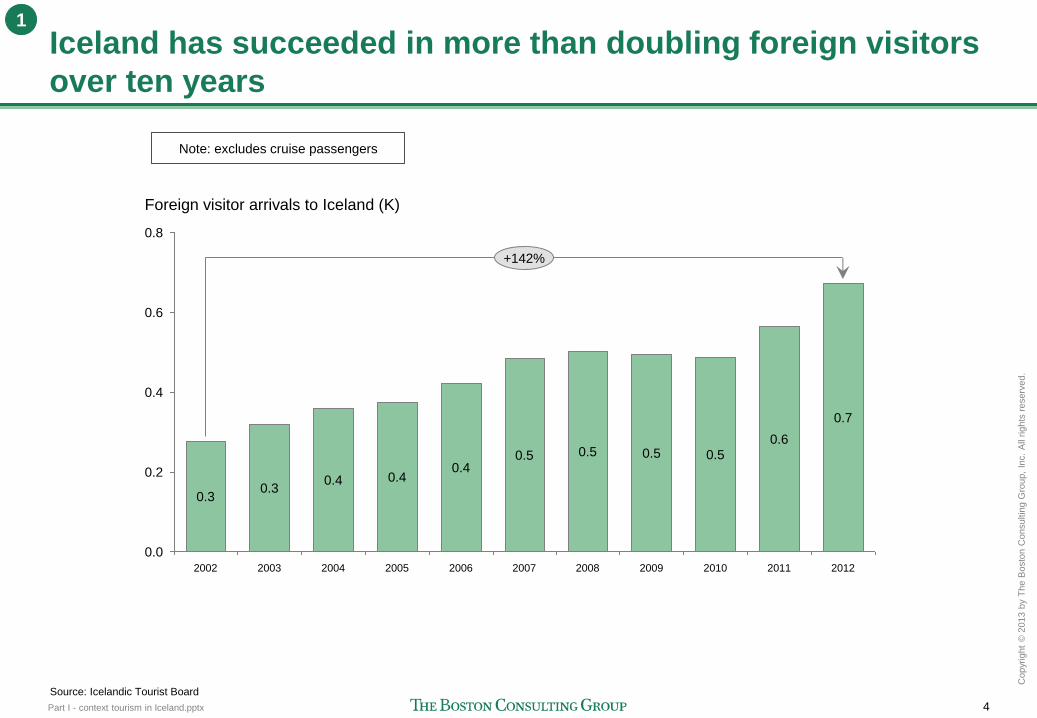
Iceland has succeeded in more than doubling foreign visitors
over ten years
Source: Icelandic Tourist Board
0.4
0.2
0.6
0.8
0.0
Foreign visitor arrivals to Iceland (K)
+142%
0.7
0.4 0.4 0.3
0.3
2012 2011
0.6
2008
0.5
2007
0.5
2006
0.4
2003 2005 2004 2010 2002 2009
0.5 0.5
1
Note: excludes cruise passengers
Part I - context tourism in Iceland.pptx 5
Copyr
ight
© 2
013 b
y T
he B
osto
n C
onsultin
g G
roup,
Inc.
All
rights
reserv
ed.
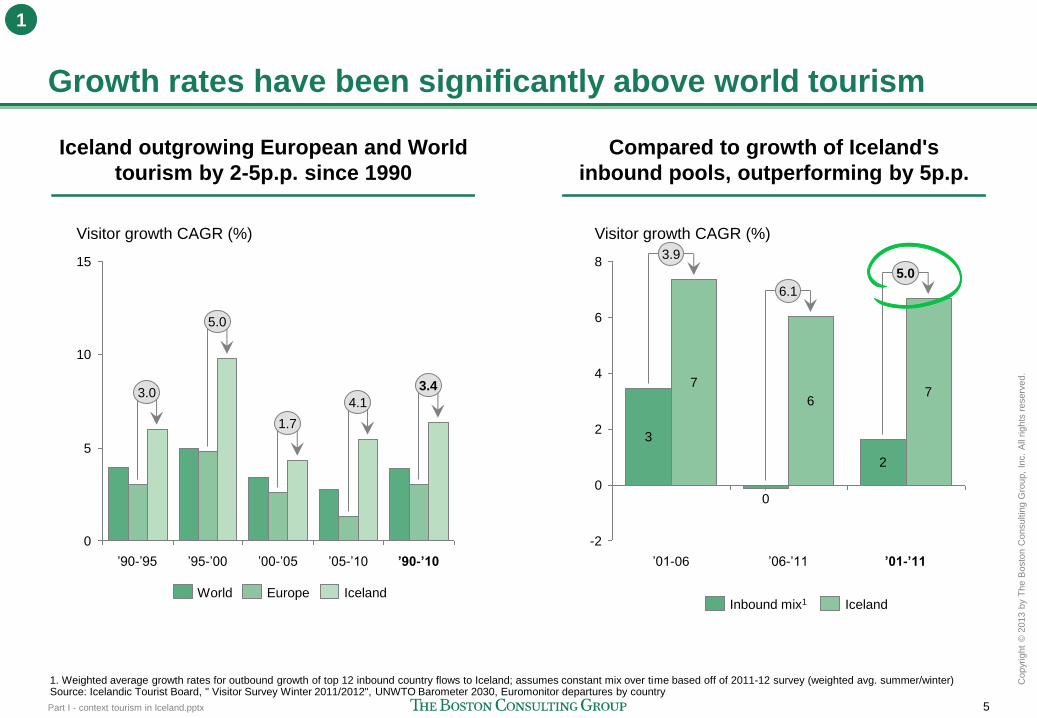
Growth rates have been significantly above world tourism
15
4.1
Visitor growth CAGR (%)
5.0
’90-’10
3.0
’90-’95 ’95-’00
10
’05-’10 ’00-’05
1.7
3.4
5
0
World Iceland Europe
Iceland outgrowing European and World
tourism by 2-5p.p. since 1990
Compared to growth of Iceland's
inbound pools, outperforming by 5p.p.
1. Weighted average growth rates for outbound growth of top 12 inbound country flows to Iceland; assumes constant mix over time based off of 2011-12 survey (weighted avg. summer/winter) Source: Icelandic Tourist Board, " Visitor Survey Winter 2011/2012", UNWTO Barometer 2030, Euromonitor departures by country
0
3
7 4
2
3.9
-2
’01-06
2
6
’06-’11
Visitor growth CAGR (%)
0
8
6
’01-’11
7
6.1
5.0
Iceland Inbound mix1
1
Part I - context tourism in Iceland.pptx 6
Copyr
ight
© 2
013 b
y T
he B
osto
n C
onsultin
g G
roup,
Inc.
All
rights
reserv
ed.
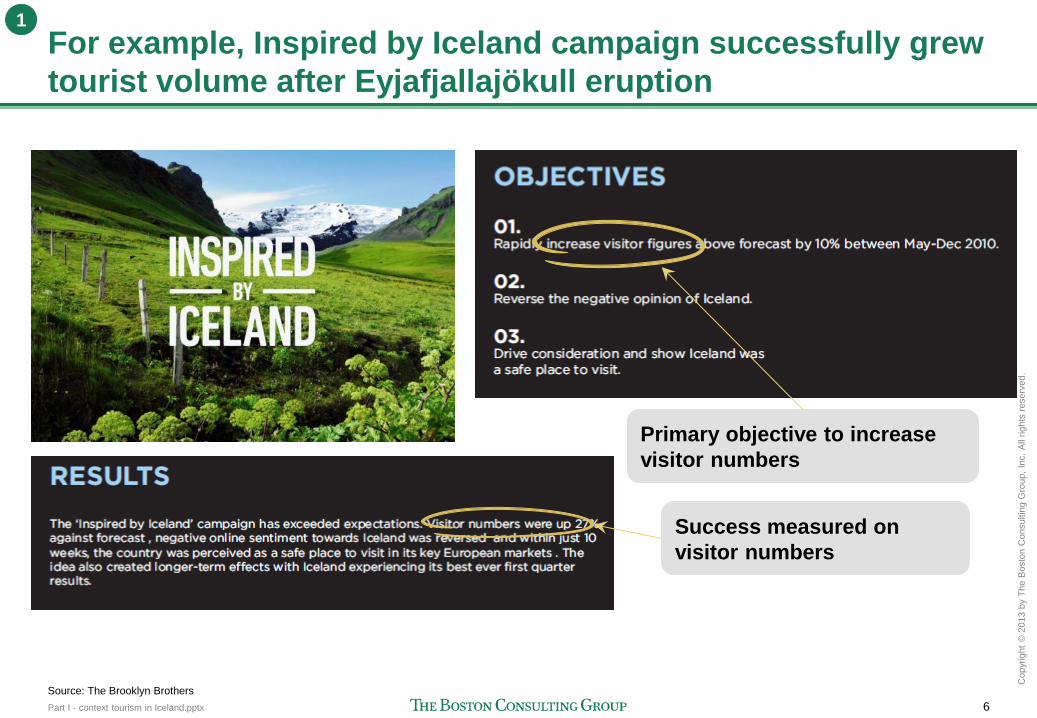
For example, Inspired by Iceland campaign successfully grew
tourist volume after Eyjafjallajökull eruption
Source: The Brooklyn Brothers
Primary objective to increase
visitor numbers
Success measured on
visitor numbers
1
Part I - context tourism in Iceland.pptx 7
Copyr
ight
© 2
013 b
y T
he B
osto
n C
onsultin
g G
roup,
Inc.
All
rights
reserv
ed.
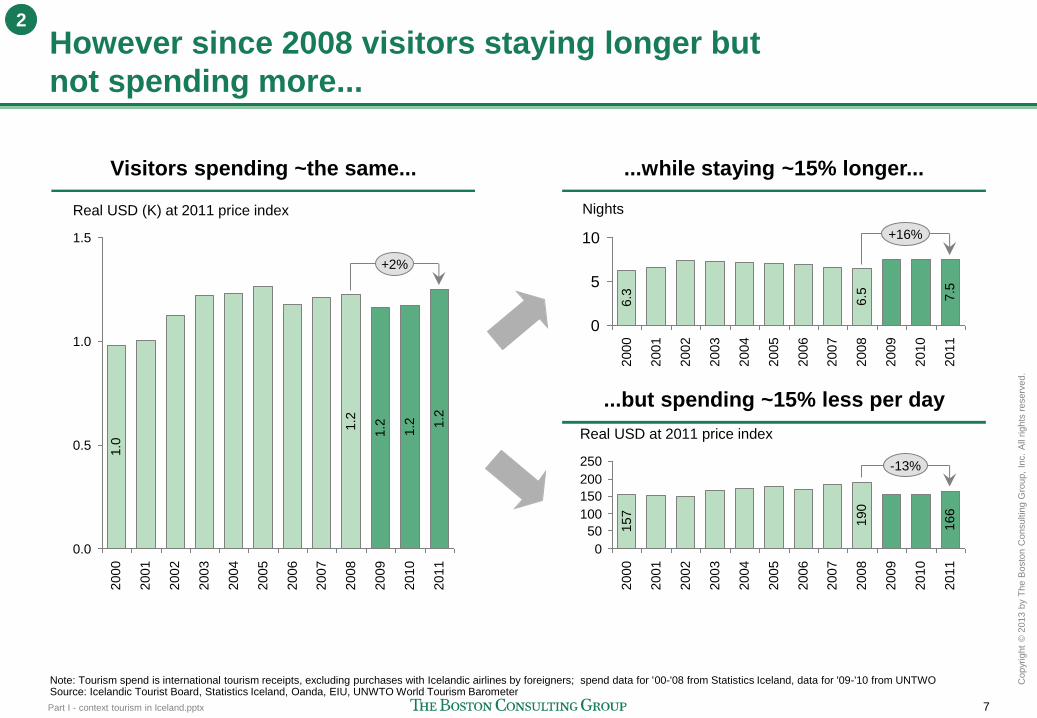
However since 2008 visitors staying longer but
not spending more...
Note: Tourism spend is international tourism receipts, excluding purchases with Icelandic airlines by foreigners; spend data for '00-'08 from Statistics Iceland, data for '09-'10 from UNTWO Source: Icelandic Tourist Board, Statistics Iceland, Oanda, EIU, UNWTO World Tourism Barometer
2002
2001
2003
-13%
2011
166
2010
2009
2008
190
2007
2006
2005
2004
157
2000
200
100
50
150
Real USD at 2011 price index
250
0
0
7.5
2009
Nights
2002
10
5
+16%
2011
2010
2008
6.5
2007
2006
2005
2004
2003
2001
2000
6.3
Visitors spending ~the same... ...while staying ~15% longer...
...but spending ~15% less per day
Real USD (K) at 2011 price index
1.5
1.0
0.5
0.0
2011
1.2
2010
+2%
2009
2008
1.2
2007
2006
2005
2004
2003
2002
2001
2000
1.0
1.2
1.2
2
Part I - context tourism in Iceland.pptx 8
Copyr
ight
© 2
013 b
y T
he B
osto
n C
onsultin
g G
roup,
Inc.
All
rights
reserv
ed.
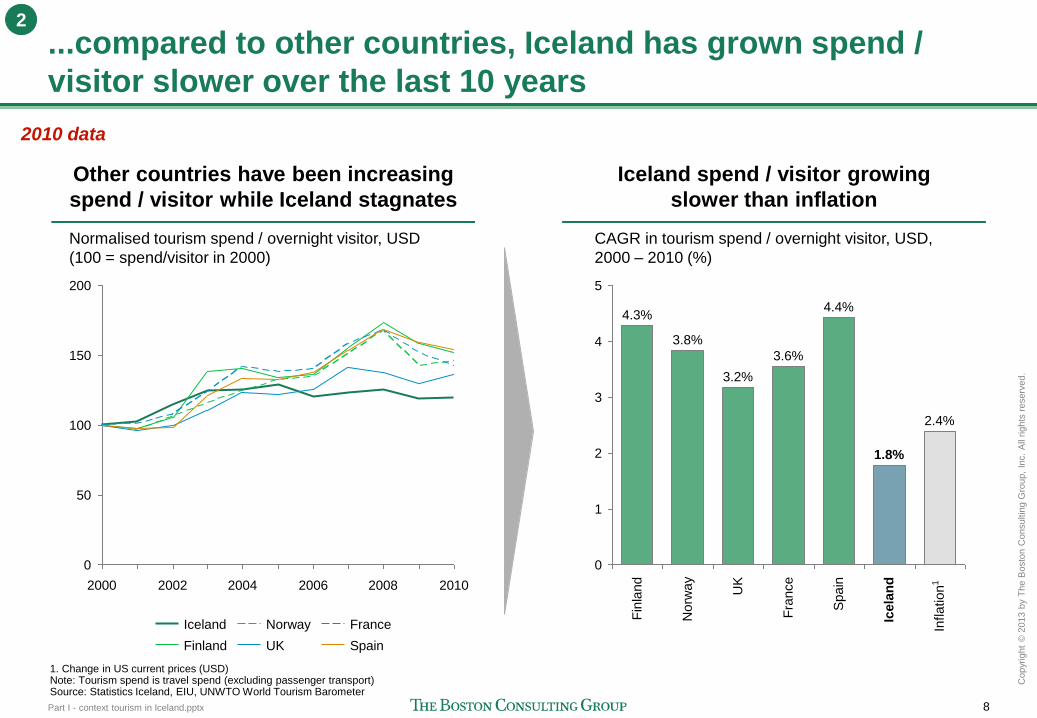
...compared to other countries, Iceland has grown spend /
visitor slower over the last 10 years
Normalised tourism spend / overnight visitor, USD
(100 = spend/visitor in 2000)
0
150
100
50
2010 2008 2006 2004 2002 2000
200
France
Finland
Iceland
UK
Norway
Spain
Other countries have been increasing
spend / visitor while Iceland stagnates
Iceland spend / visitor growing
slower than inflation
2010 data
4.3%
2
Fra
nce
CAGR in tourism spend / overnight visitor, USD,
2000 – 2010 (%)
Spain
1.8%
1
Icela
nd
4
2.4%
Inflation
1
3.6%
5
Fin
land
Norw
ay
UK
3
3.8%
3.2%
4.4%
0
1. Change in US current prices (USD) Note: Tourism spend is travel spend (excluding passenger transport) Source: Statistics Iceland, EIU, UNWTO World Tourism Barometer
2
Part I - context tourism in Iceland.pptx 9
Copyr
ight
© 2
013 b
y T
he B
osto
n C
onsultin
g G
roup,
Inc.
All
rights
reserv
ed.
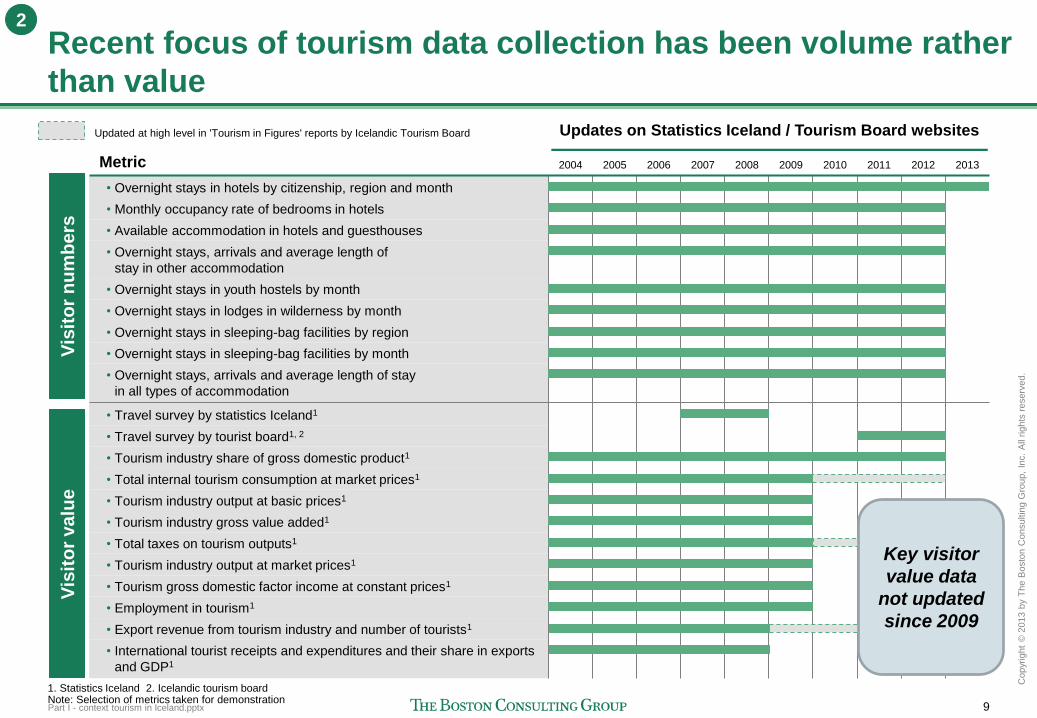
Recent focus of tourism data collection has been volume rather
than value
2004 2005 2006 2007 2008 2009 2010 2011 2012 2013
• Tourism industry share of gross domestic product1
• Tourism industry output at basic prices1
• Tourism industry gross value added1
• Total internal tourism consumption at market prices1
Metric
• Overnight stays, arrivals and average length of
stay in other accommodation
• Total taxes on tourism outputs1
• Export revenue from tourism industry and number of tourists1
• Travel survey by statistics Iceland1
• Overnight stays in lodges in wilderness by month
• Overnight stays in youth hostels by month
• Travel survey by tourist board1, 2
• Overnight stays in sleeping-bag facilities by month
• Overnight stays in hotels by citizenship, region and month
• Monthly occupancy rate of bedrooms in hotels
• International tourist receipts and expenditures and their share in exports
and GDP1
• Tourism gross domestic factor income at constant prices1
• Overnight stays, arrivals and average length of stay
in all types of accommodation
• Tourism industry output at market prices1
• Overnight stays in sleeping-bag facilities by region
• Employment in tourism1
• Available accommodation in hotels and guesthouses
Vis
ito
r n
um
be
rs
Vis
ito
r va
lue
1. Statistics Iceland 2. Icelandic tourism board Note: Selection of metrics taken for demonstration
Updates on Statistics Iceland / Tourism Board websites Updated at high level in 'Tourism in Figures' reports by Icelandic Tourism Board
Key visitor
value data
not updated
since 2009
2
Part I - context tourism in Iceland.pptx 10
Copyr
ight
© 2
013 b
y T
he B
osto
n C
onsultin
g G
roup,
Inc.
All
rights
reserv
ed.
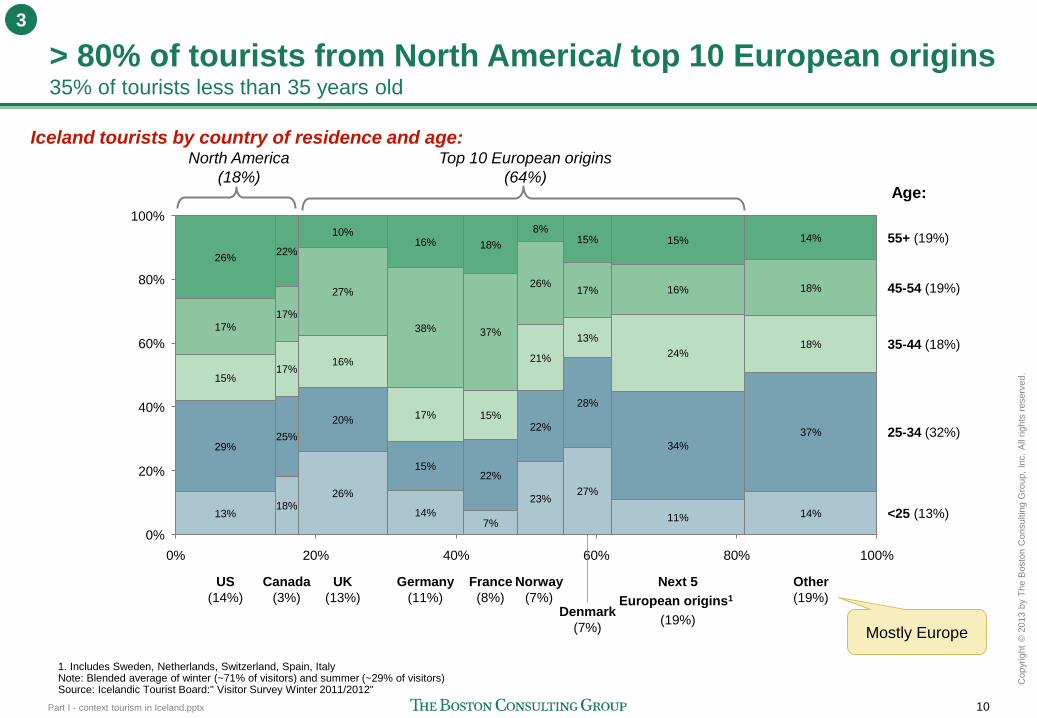
> 80% of tourists from North America/ top 10 European origins 35% of tourists less than 35 years old
40%
60%
80%
0%
100%
0%
40%
20%
20%
60%
100% 80%
27%
28%
13%
17%
15%
Norway
(7%)
23%
22%
21%
26%
France
(8%)
7%
22%
US
(14%)
13%
29%
15%
17%
26%
15%
37%
18%
Germany
(11%)
14%
15%
17%
38%
16%
UK
(13%)
26%
20%
27%
10%
Canada
(3%)
18%
25%
17%
17%
22%
16%
<25 (13%)
25-34 (32%)
Next 5
European origins1
(19%)
35-44 (18%)
45-54 (19%)
55+ (19%)
Other
(19%)
14%
37%
18%
18%
14% 8%
11%
34%
24%
16%
15%
Denmark
(7%)
1. Includes Sweden, Netherlands, Switzerland, Spain, Italy Note: Blended average of winter (~71% of visitors) and summer (~29% of visitors) Source: Icelandic Tourist Board:" Visitor Survey Winter 2011/2012"
Age:
Mostly Europe
Iceland tourists by country of residence and age: North America
(18%)
Top 10 European origins
(64%)
3
Part I - context tourism in Iceland.pptx 11
Copyr
ight
© 2
013 b
y T
he B
osto
n C
onsultin
g G
roup,
Inc.
All
rights
reserv
ed.
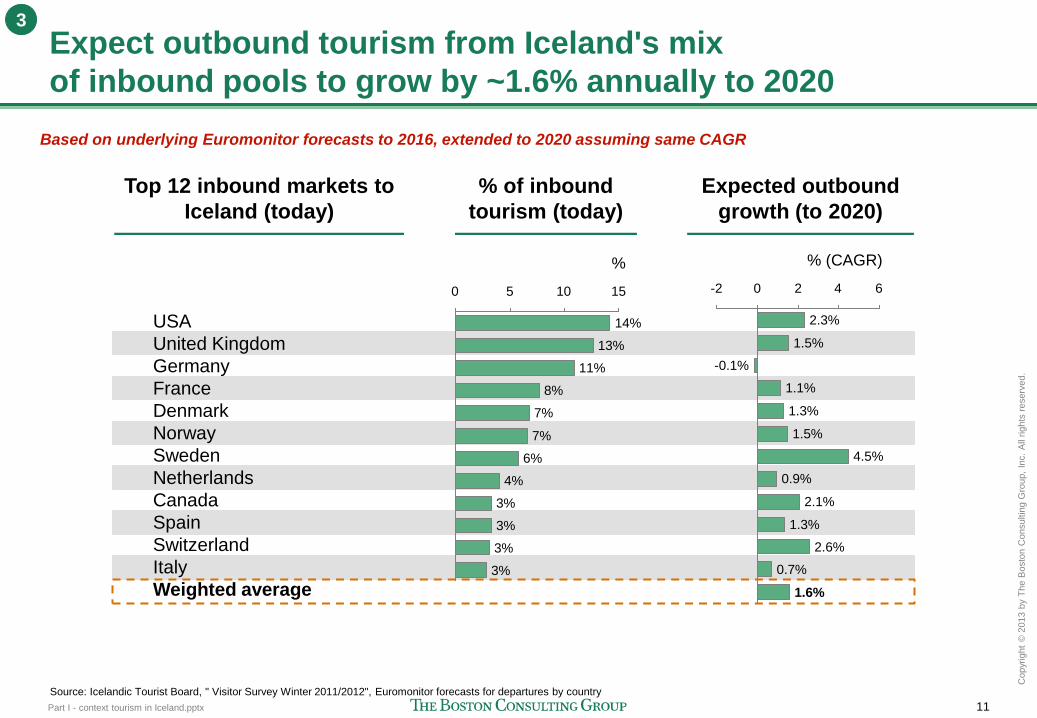
Expect outbound tourism from Iceland's mix
of inbound pools to grow by ~1.6% annually to 2020
Based on underlying Euromonitor forecasts to 2016, extended to 2020 assuming same CAGR
Source: Icelandic Tourist Board, " Visitor Survey Winter 2011/2012", Euromonitor forecasts for departures by country
Top 12 inbound markets to
Iceland (today)
USA
United Kingdom
Germany
France
Denmark
Norway
Sweden
Netherlands
Canada
Spain
Switzerland
Italy
Weighted average
% of inbound
tourism (today)
Expected outbound
growth (to 2020)
14%
%
3%
3%
3%
5 0 10 15
7%
7%
8%
11%
13%
6%
4%
3%
0.7%
0
% (CAGR)
2.6%
1.3%
2.1%
0.9%
4.5%
1.5%
1.3%
1.1%
-0.1%
1.5%
2.3%
-2 2 4 6
1.6%
3
Part I - context tourism in Iceland.pptx 12
Copyr
ight
© 2
013 b
y T
he B
osto
n C
onsultin
g G
roup,
Inc.
All
rights
reserv
ed.
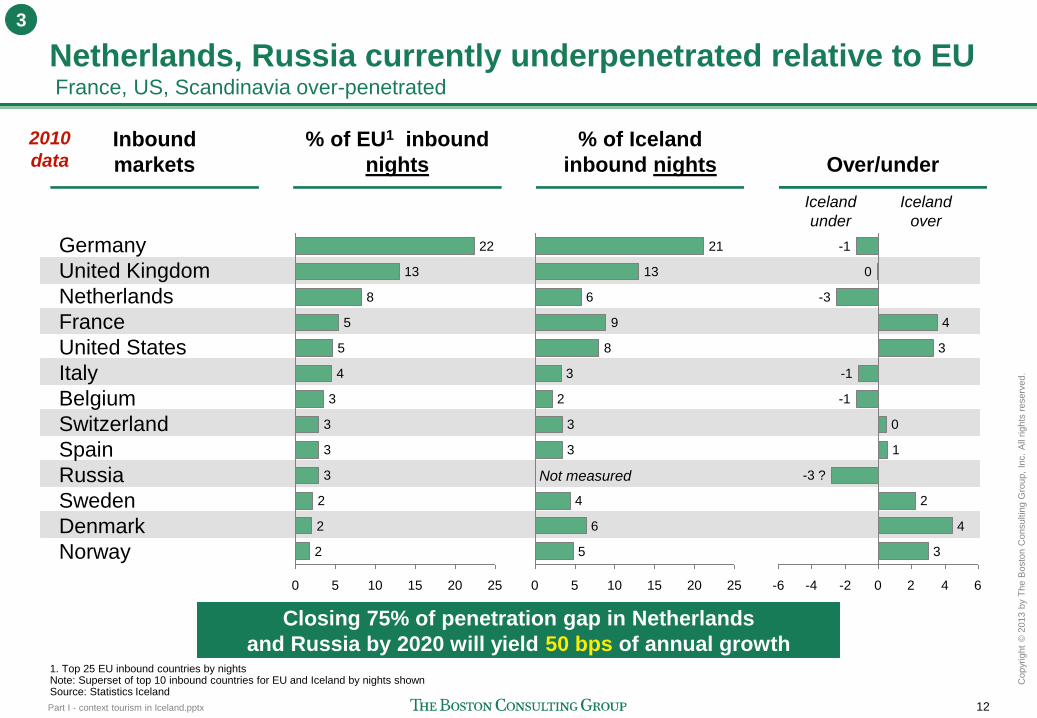
Netherlands, Russia currently underpenetrated relative to EU France, US, Scandinavia over-penetrated
Inbound
markets
Germany
United Kingdom
Netherlands
France
United States
Italy
Belgium
Switzerland
Spain
Russia
Sweden
Denmark
Norway
% of EU1 inbound
nights
% of Iceland
inbound nights Over/under
1. Top 25 EU inbound countries by nights Note: Superset of top 10 inbound countries for EU and Iceland by nights shown Source: Statistics Iceland
25 20 15 10 5 0
2
2
2
3
3
3
3
4
5
5
8
13
22
25 20 15 10 5 0
5
6
4
3
3
2
3
8
9
6
13
21
6 4 2 0 -2 -4 -6
3
4
2
-3 ?
1
0
-1
-1
3
4
-3
0
-1
Not measured
2010
data
Iceland
over
Iceland
under
Closing 75% of penetration gap in Netherlands
and Russia by 2020 will yield 50 bps of annual growth
3
Part I - context tourism in Iceland.pptx 13
Copyr
ight
© 2
013 b
y T
he B
osto
n C
onsultin
g G
roup,
Inc.
All
rights
reserv
ed.
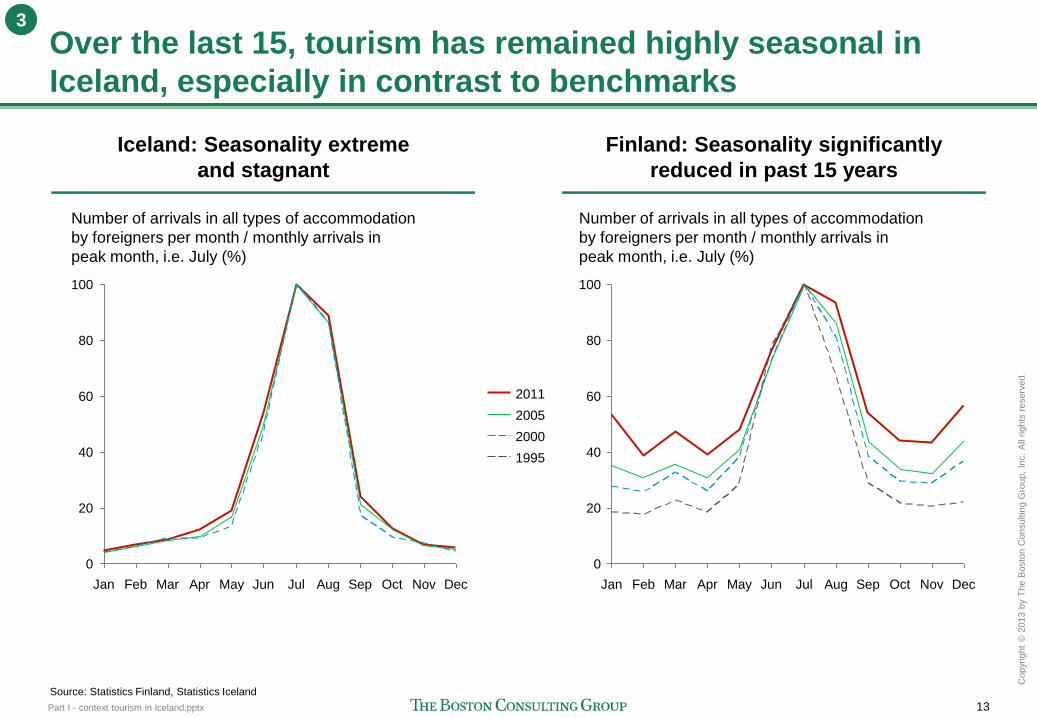
Over the last 15, tourism has remained highly seasonal in
Iceland, especially in contrast to benchmarks
Dec Nov Oct Sep Aug Jul Jun May Apr Mar Feb Jan
Number of arrivals in all types of accommodation
by foreigners per month / monthly arrivals in
peak month, i.e. July (%)
100
80
60
40
20
0
Finland: Seasonality significantly
reduced in past 15 years
Iceland: Seasonality extreme
and stagnant
Apr May Mar Feb Jan
Number of arrivals in all types of accommodation
by foreigners per month / monthly arrivals in
peak month, i.e. July (%)
100
80
60
40
20
0
Dec Nov Oct Sep Aug Jul Jun
1995
2000
2005
2011
Source: Statistics Finland, Statistics Iceland
3
Part I - context tourism in Iceland.pptx 14
Copyr
ight
© 2
013 b
y T
he B
osto
n C
onsultin
g G
roup,
Inc.
All
rights
reserv
ed.
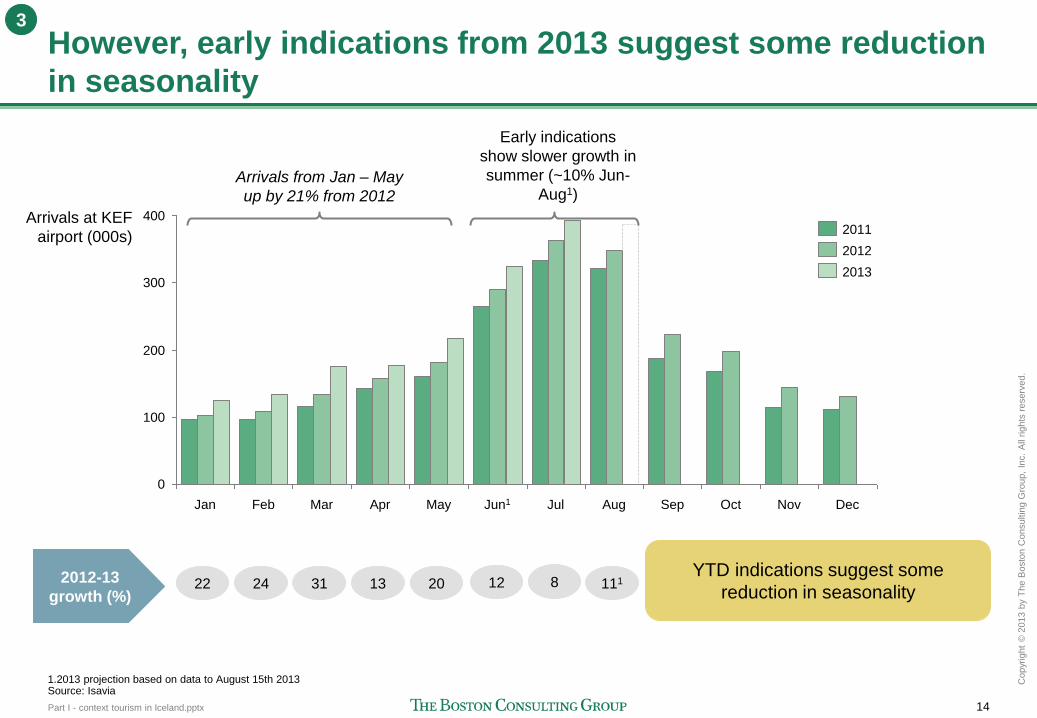
However, early indications from 2013 suggest some reduction
in seasonality
0
400
300
100
200
Arrivals at KEF
airport (000s)
Jan Dec Nov Oct Sep Aug Jul Jun1 May Apr Mar Feb
2013
2012
2011
1.2013 projection based on data to August 15th 2013 Source: Isavia
2012-13
growth (%) 22 24 31 13
YTD indications suggest some
reduction in seasonality 20 12
Arrivals from Jan – May
up by 21% from 2012
Early indications
show slower growth in
summer (~10% Jun-
Aug1)
8
3
111
Part I - context tourism in Iceland.pptx 15
Copyr
ight
© 2
013 b
y T
he B
osto
n C
onsultin
g G
roup,
Inc.
All
rights
reserv
ed.
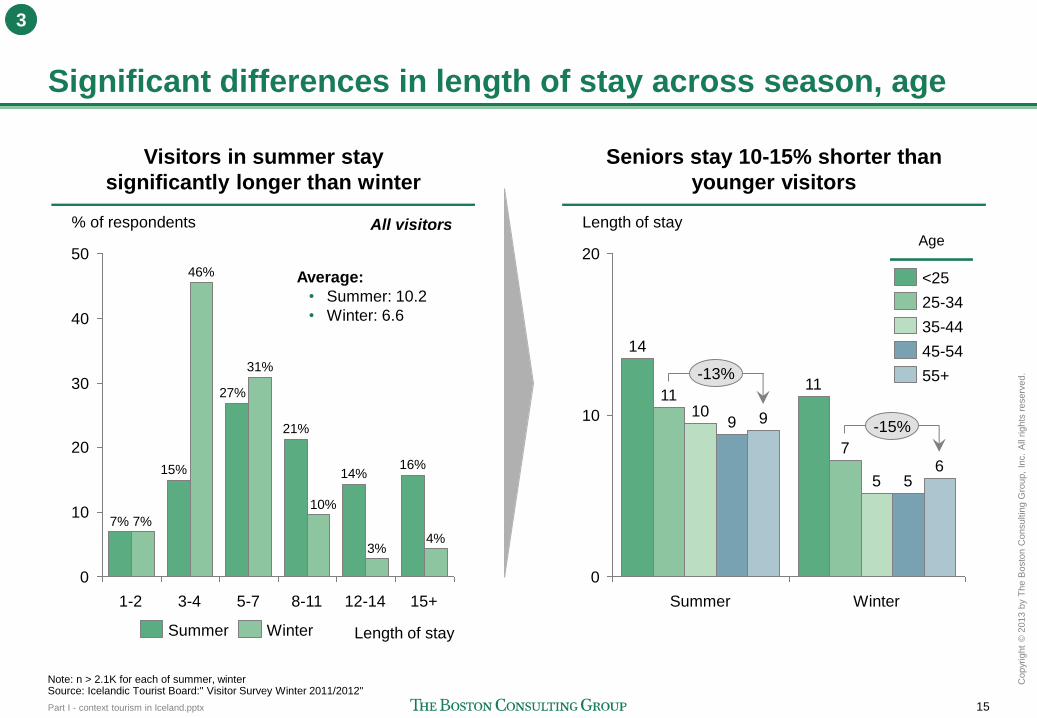
Significant differences in length of stay across season, age
% of respondents
50
40
30
20
10
0
Length of stay
15+
4%
16%
12-14
3%
14%
8-11
10%
21%
5-7
31%
27%
3-4
46%
15%
1-2
7% 7%
Note: n > 2.1K for each of summer, winter Source: Icelandic Tourist Board:" Visitor Survey Winter 2011/2012"
All visitors Length of stay
20
10
0
-15%
-13%
Winter
6 5 5
7
11
Summer
9 9 10
11
14
Visitors in summer stay
significantly longer than winter
Seniors stay 10-15% shorter than
younger visitors
Winter Summer
Average:
• Summer: 10.2
• Winter: 6.6
55+
45-54
35-44
25-34
<25
Age
3
Part I - context tourism in Iceland.pptx 16
Copyr
ight
© 2
013 b
y T
he B
osto
n C
onsultin
g G
roup,
Inc.
All
rights
reserv
ed.
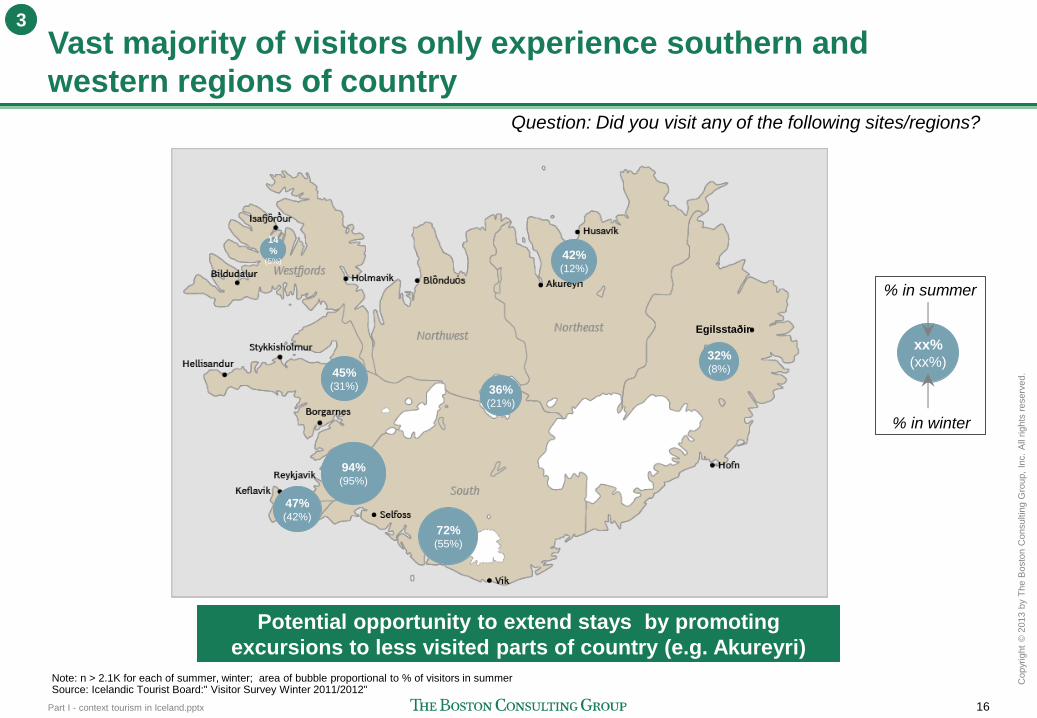
Vast majority of visitors only experience southern and
western regions of country Question: Did you visit any of the following sites/regions?
Potential opportunity to extend stays by promoting
excursions to less visited parts of country (e.g. Akureyri)
Note: n > 2.1K for each of summer, winter; area of bubble proportional to % of visitors in summer Source: Icelandic Tourist Board:" Visitor Survey Winter 2011/2012"
3
xx%
(xx%)
% in summer
% in winter
Egilsstaðir
94% (95%)
47% (42%)
14
% (5%)
45% (31%)
72% (55%)
36% (21%)
32% (8%)
42% (12%)
Egilsstaðir