Embed Size (px)
Citation preview
MEGH
1
The Future of the Wax Industry
MEGH
2
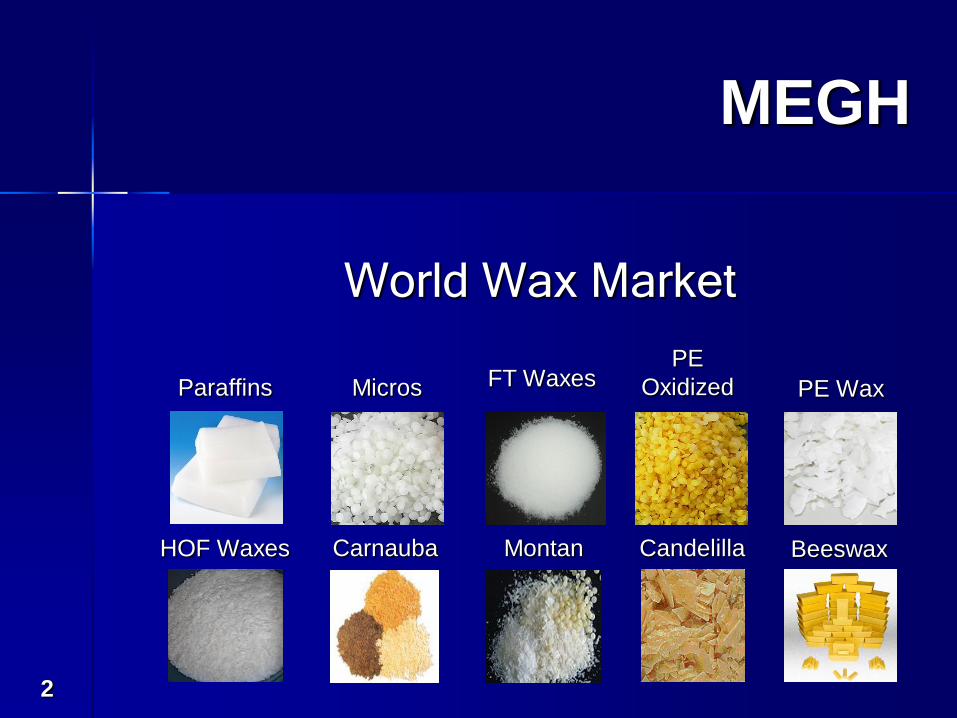
MontanCarnauba BeeswaxCandelillaHOF Waxes
PE Wax
PE
OxidizedParaffins Micros FT Waxes
World Wax Market
MEGH
3
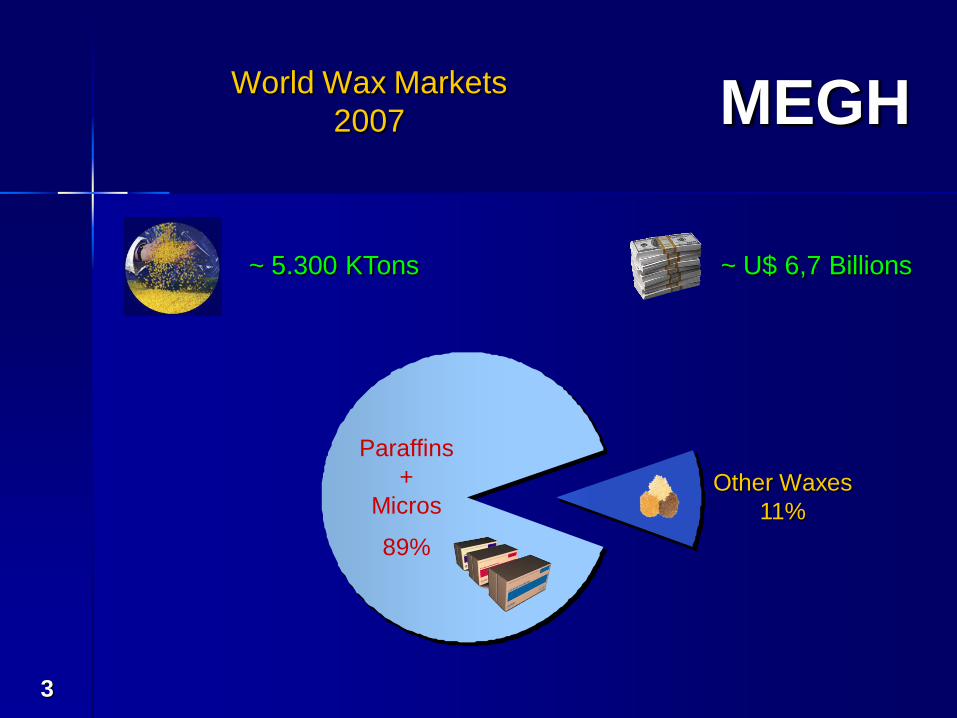
World Wax Markets
2007
Paraffins
+
Micros
89%
Other Waxes
11%
~ U$ 6,7 Billions~ 5.300 KTons
MEGH
4
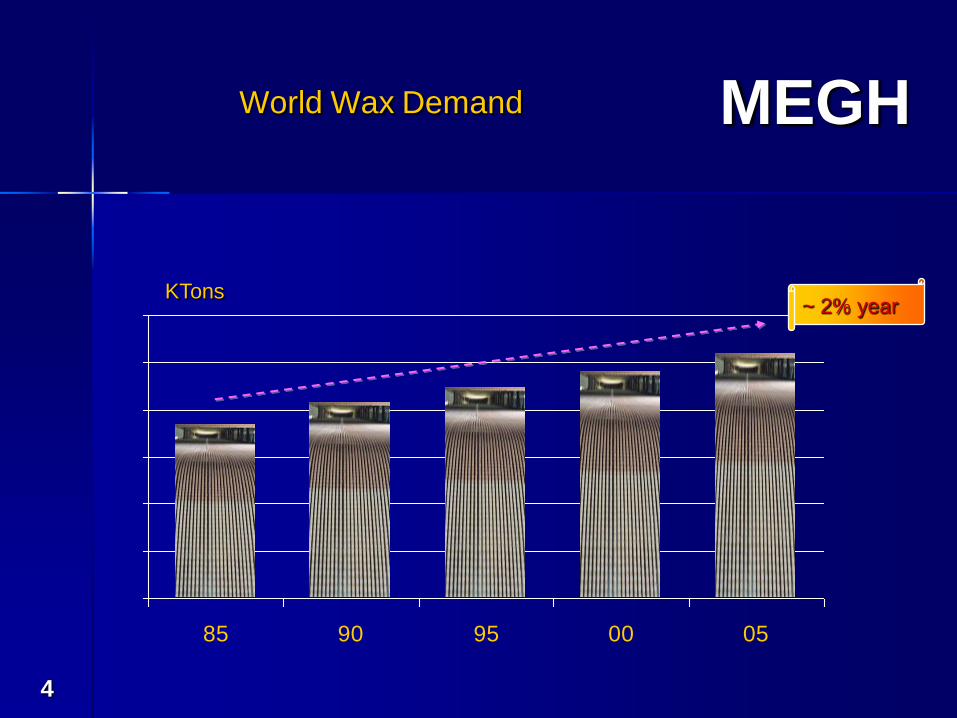
85 90 95 00 05
KTons
World Wax Demand
~ 2% year
MEGH
5
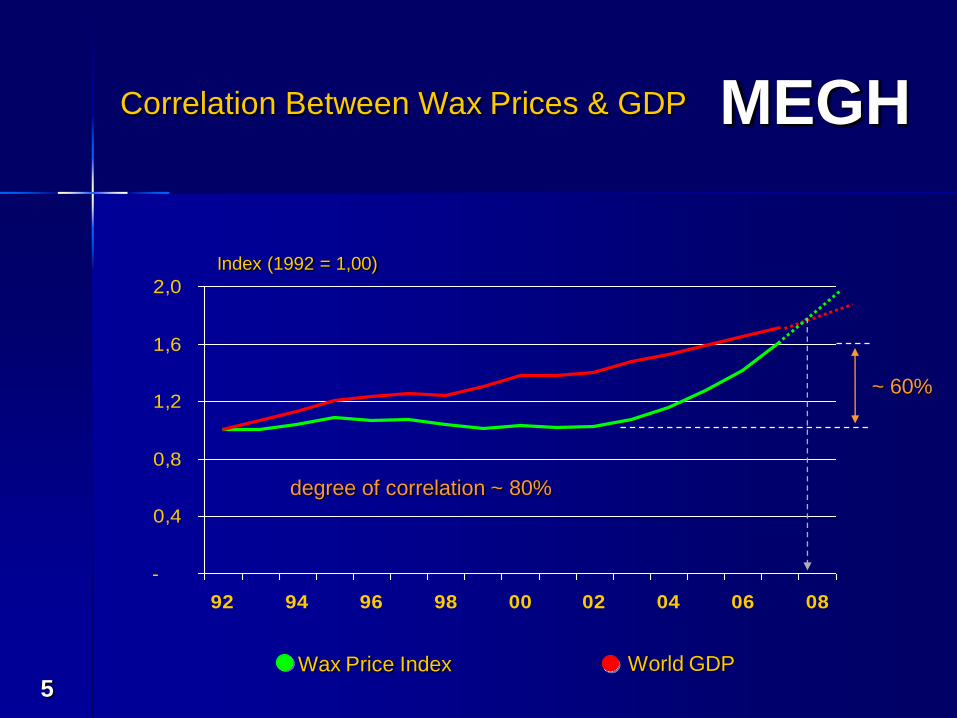
-
0,4
0,8
1,2
1,6
2,0
92 94 96 98 00 02 04 06 08
Wax Price Index World GDP
Index (1992 = 1,00)
Correlation Between Wax Prices & GDP
degree of correlation ~ 80%
~ 60%
MEGH
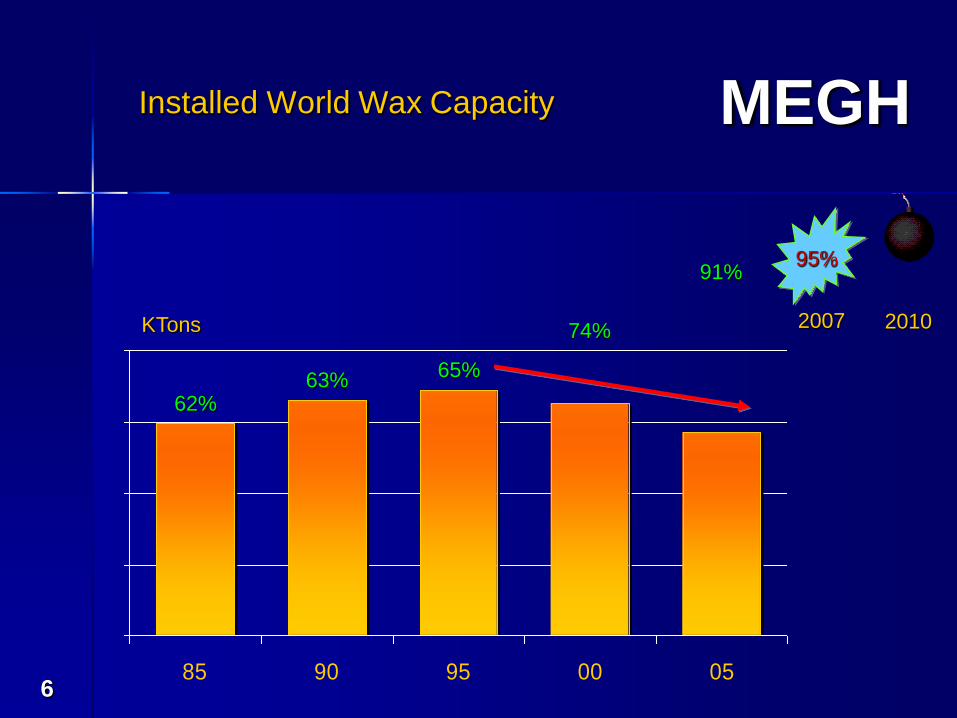
685 90 95 00 05
KTons
Installed World Wax Capacity
62%63%
65%
74%
91%95%
2007 2010
MEGH
7
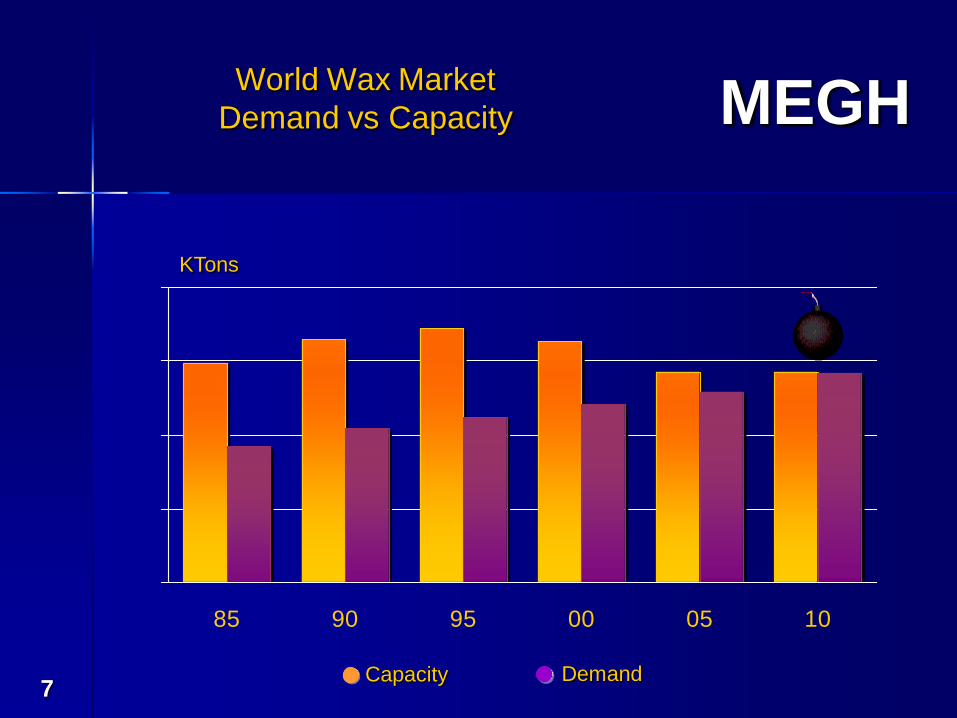
85 90 95 00 05 10
Capacity Demand
KTons
World Wax Market
Demand vs Capacity
MEGH
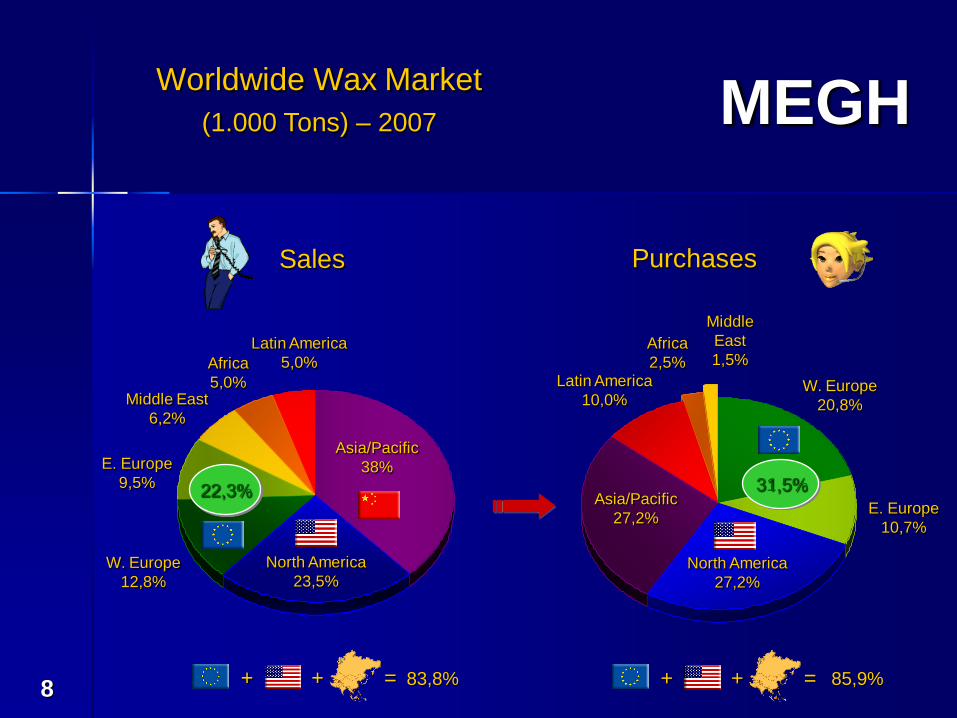
8
22,3%
North America
23,5%W. Europe
12,8%
E. Europe
9,5%
Middle East
6,2%
Africa
5,0%
Latin America
5,0%
Asia/Pacific
38%
North America
27,2%
Asia/Pacific
27,2%
W. Europe
20,8%
E. Europe
10,7%
Middle
East
1,5%Africa
2,5%Latin America
10,0%
31,5%
Sales
Worldwide Wax Market
(1.000 Tons) – 2007
Purchases
83,8% 85,9%+ + = + + =
MEGH
9
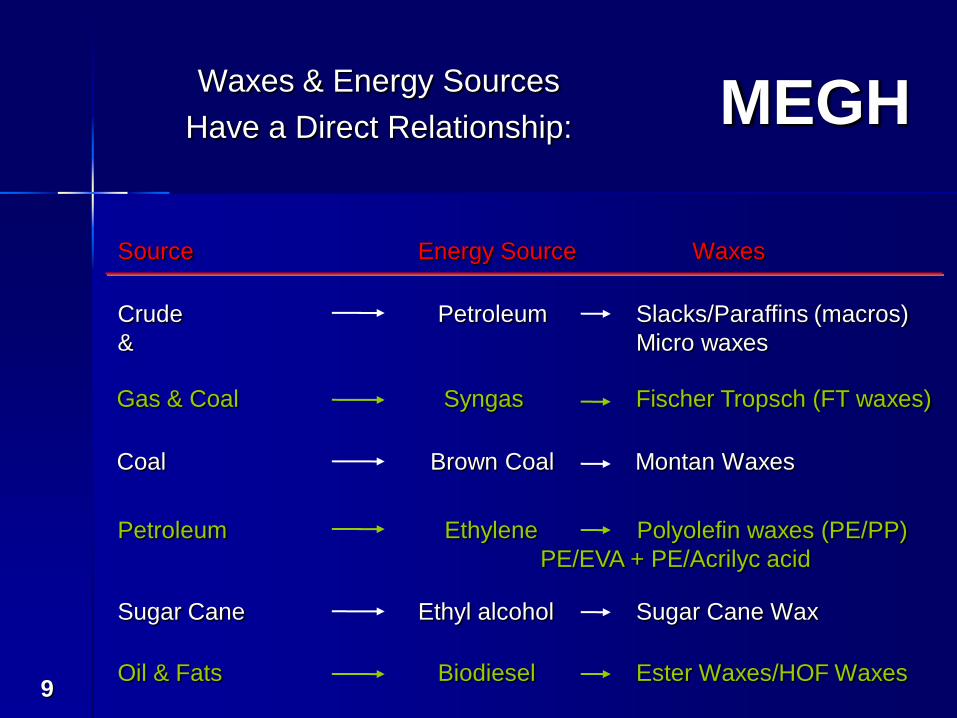
Waxes & Energy Sources
Have a Direct Relationship:
Source Energy Source Waxes
Coal Brown Coal Montan Waxes
Petroleum Ethylene Polyolefin waxes (PE/PP)
PE/EVA + PE/Acrilyc acid
Sugar Cane Ethyl alcohol Sugar Cane Wax
Oil & Fats Biodiesel Ester Waxes/HOF Waxes
Gas & Coal Syngas Fischer Tropsch (FT waxes)
Crude Petroleum Slacks/Paraffins (macros)
& Micro waxes
MEGH
10
Theorem 01
Once we know the different energy sector trends, we can begin to
understand the world wax trends.
MEGH
11
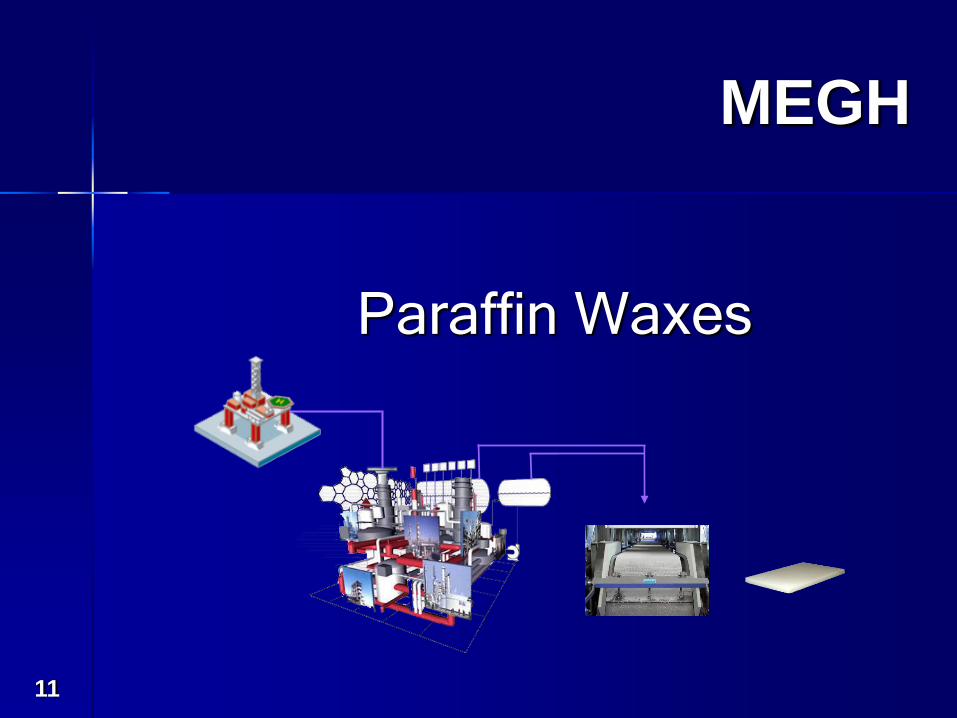
Paraffin Waxes
MEGH
12
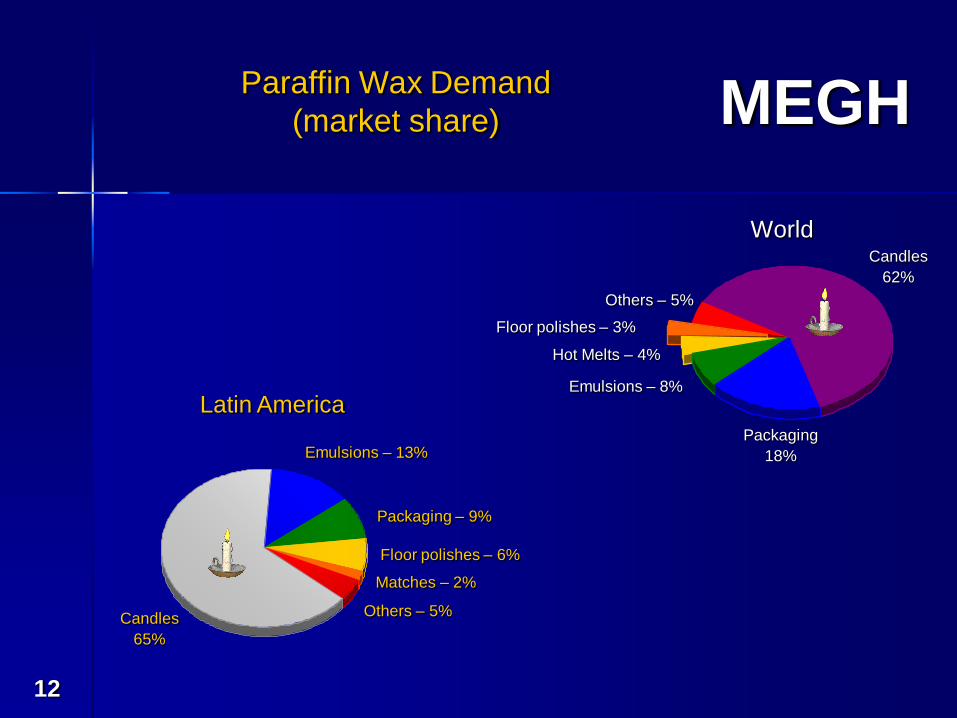
Candles
62%
Packaging
18%
Emulsions – 8%
Hot Melts – 4%
Floor polishes – 3%
Others – 5%
Paraffin Wax Demand
(market share)
World
Latin America
Candles
65%
Emulsions – 13%
Packaging – 9%
Floor polishes – 6%
Others – 5%
Matches – 2%
MEGH
13
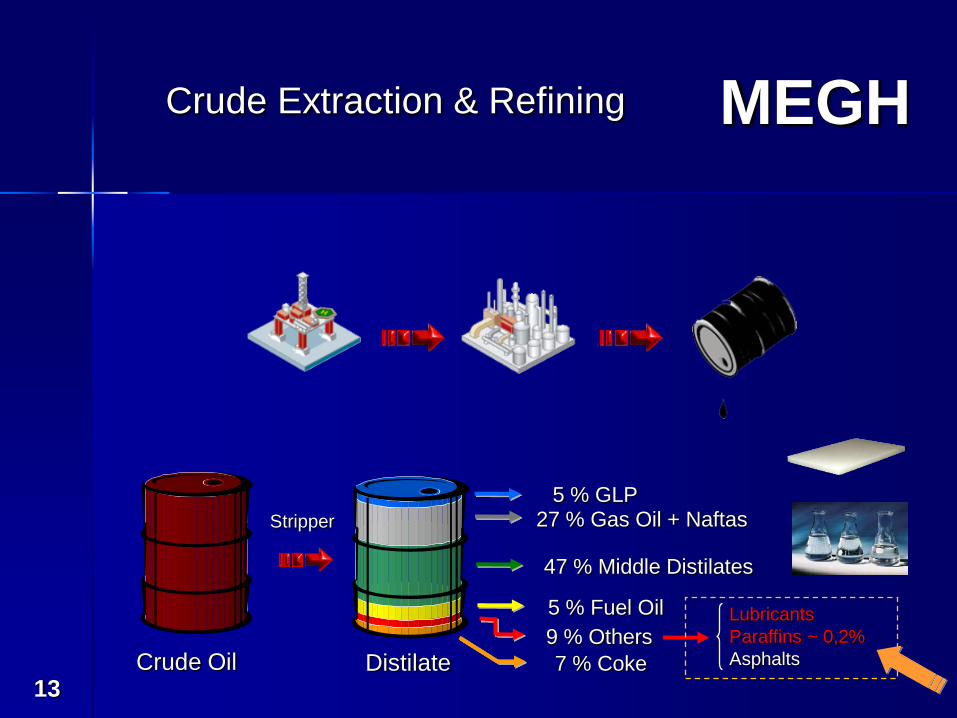
Crude Extraction & Refining
Crude Oil
5 % GLP
Distilate
27 % Gas Oil + Naftas
47 % Middle Distilates
5 % Fuel Oil
9 % Others
7 % Coke
Stripper
Lubricants
Paraffins ~ 0,2%
Asphalts
MEGH
14
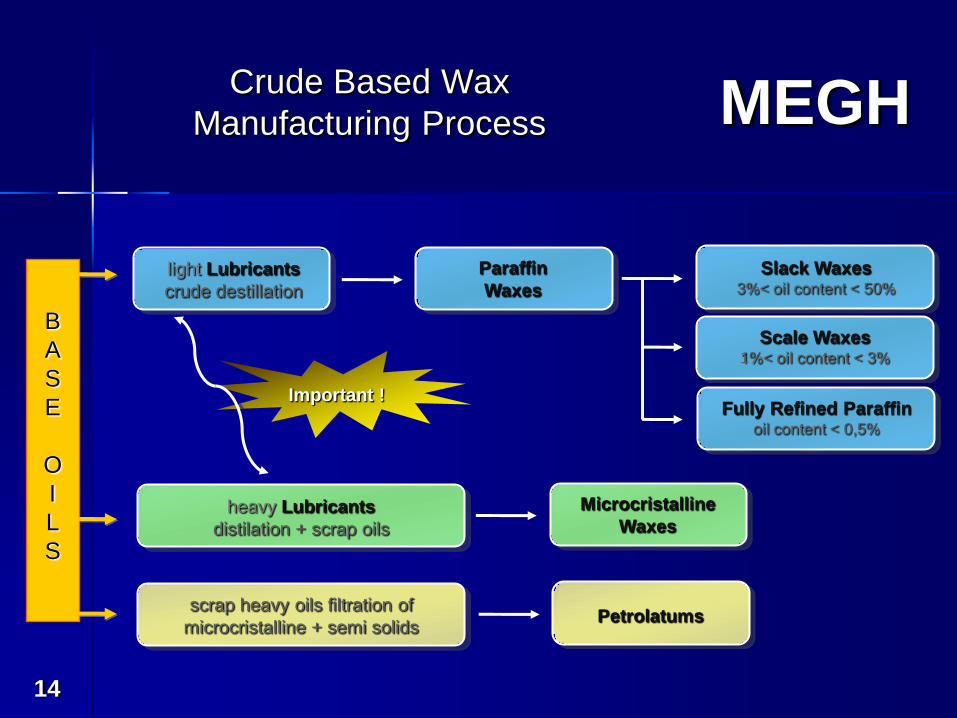
Crude Based Wax
Manufacturing Process
light Lubricants
crude destillation
Paraffin
Waxes
Slack Waxes3%< oil content < 50%
Scale Waxes1%< oil content < 3%
Fully Refined Paraffinoil content < 0,5%
heavy Lubricants
distilation + scrap oils
Microcristalline
Waxes
scrap heavy oils filtration of
microcristalline + semi solidsPetrolatums
Important !
B
A
S
E
O
I
L
S
MEGH
15
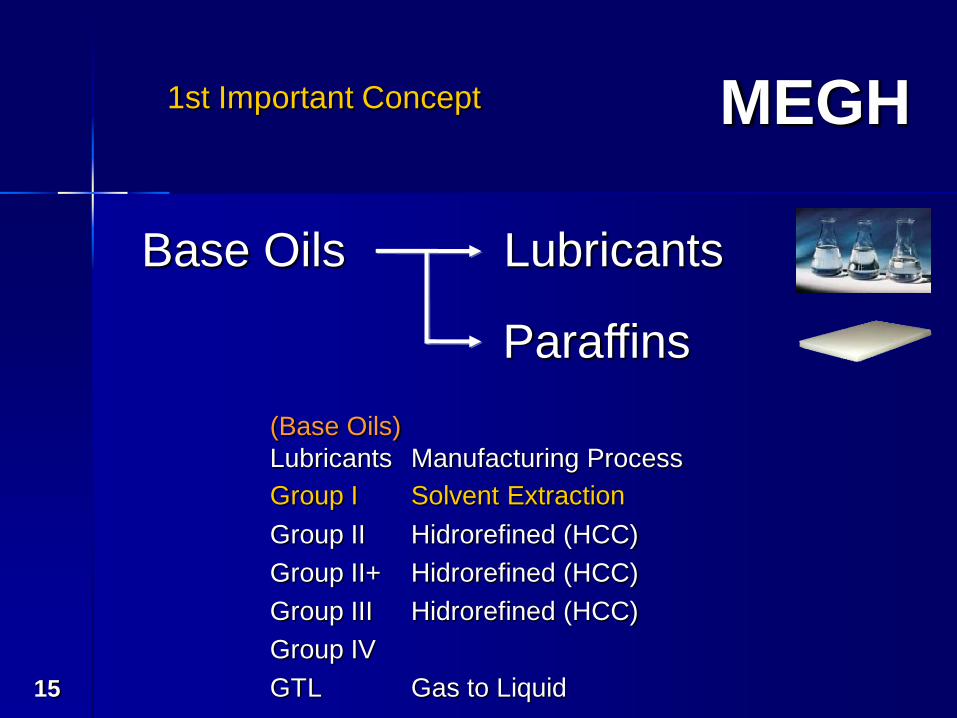
Base Oils Lubricants
Paraffins
1st Important Concept
(Base Oils)
Lubricants Manufacturing Process
Group I Solvent Extraction
Group II Hidrorefined (HCC)
Group II+ Hidrorefined (HCC)
Group III Hidrorefined (HCC)
Group IV
GTL Gas to Liquid
MEGH
16
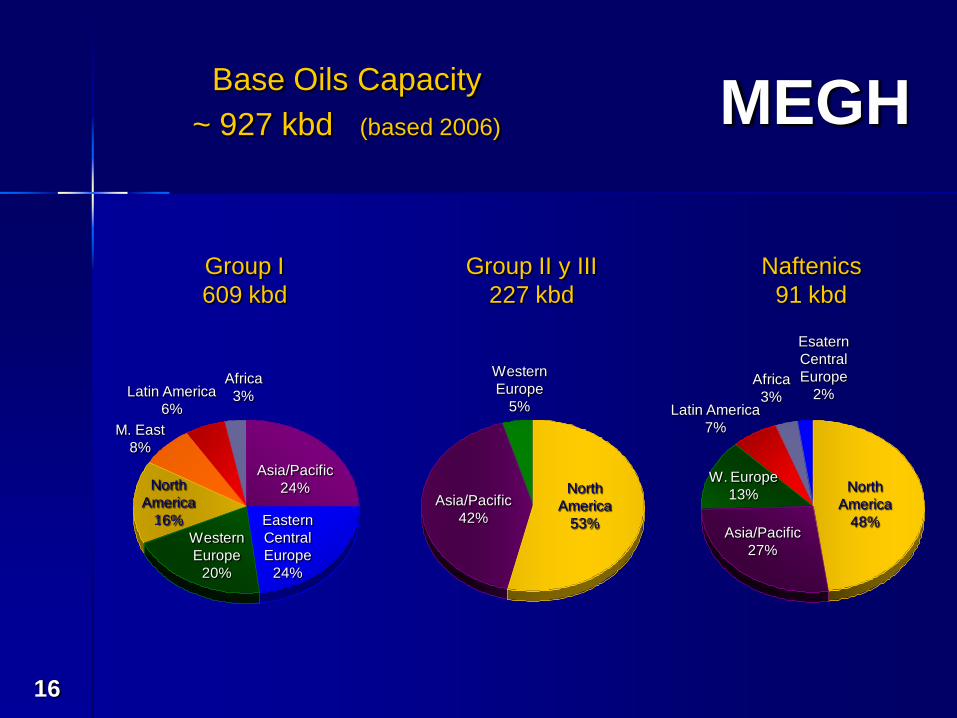
Base Oils Capacity
~ 927 kbd (based 2006)
Asia/Pacific
24%
Eastern
Central
Europe
24%
Western
Europe
20%
North
America
16%
M. East
8%
Latin America
6%
Africa
3%
Group I
609 kbd
Asia/Pacific
42%
North
America
53%
Western
Europe
5%
Group II y III
227 kbd
North
America
48%Asia/Pacific
27%
W. Europe
13%
Latin America
7%
Africa
3%
Esatern
Central
Europe
2%
Naftenics
91 kbd
MEGH
17
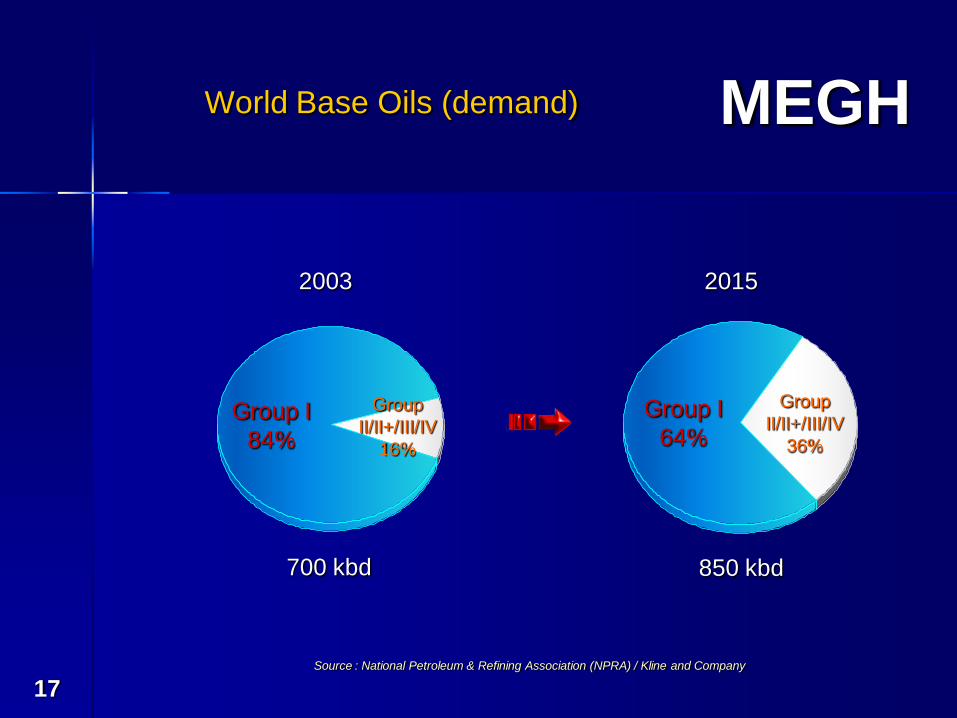
World Base Oils (demand)
2003 2015
Group I
84%
Group I
64%
Group
II/II+/III/IV
16%
Group
II/II+/III/IV
36%
700 kbd 850 kbd
Source : National Petroleum & Refining Association (NPRA) / Kline and Company
MEGH
18
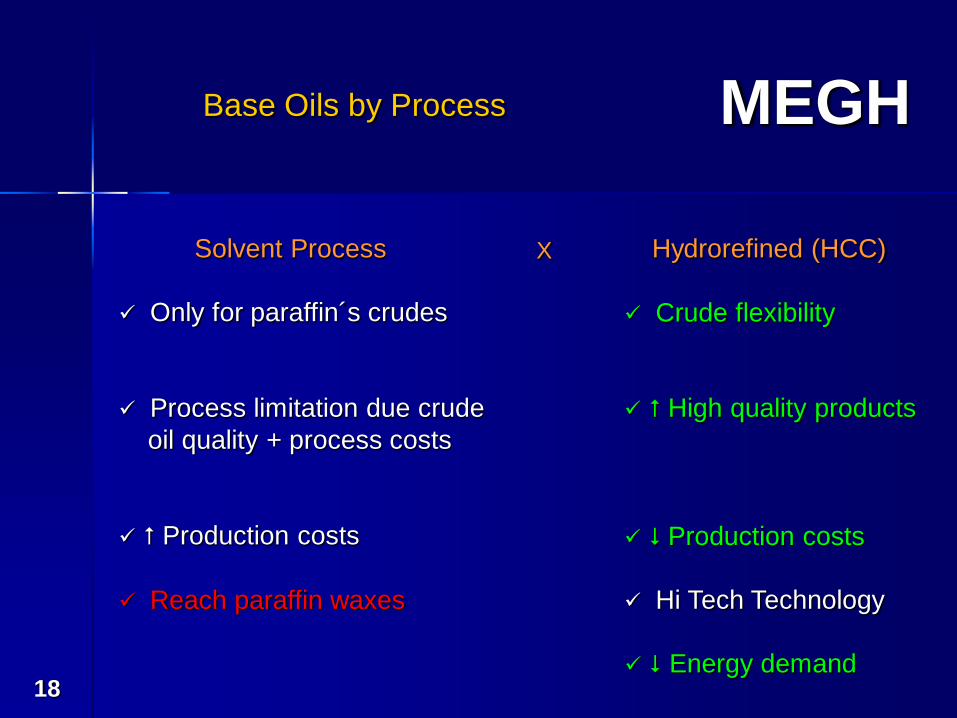
Base Oils by Process
Hydrorefined (HCC)Solvent Process X
Only for paraffin´s crudes
Process limitation due crude
oil quality + process costs
Production costs
Reach paraffin waxes
Crude flexibility
High quality products
Production costs
Hi Tech Technology
Energy demand
MEGH
19
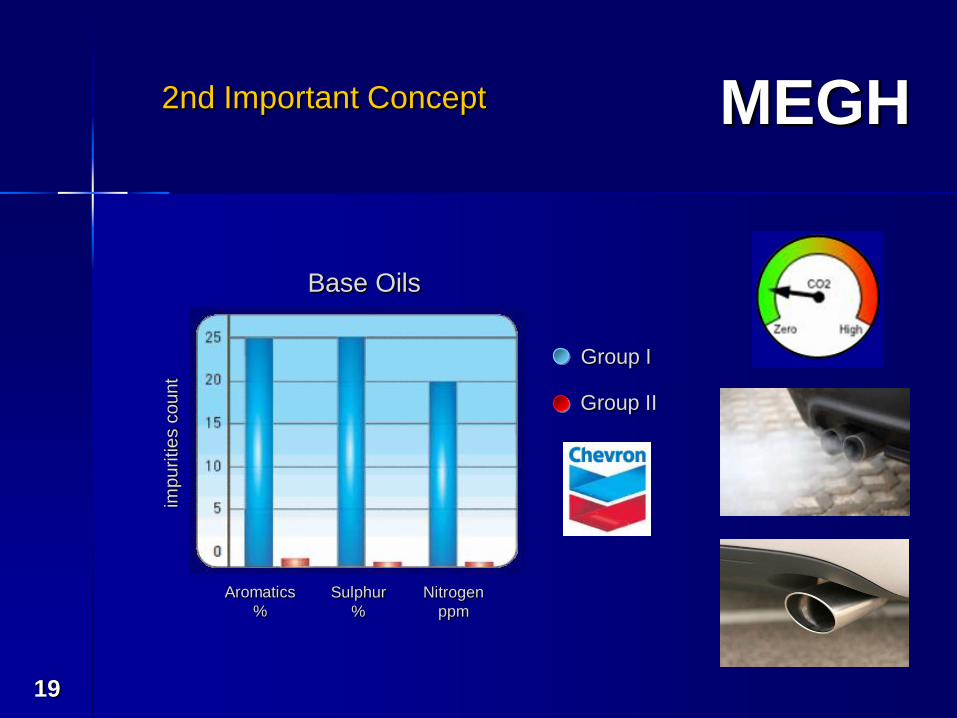
2nd Important Concept
impurities c
ount
Group I
Group II
Aromatics
%
Sulphur
%
Nitrogen
ppm
Base Oils
MEGH
20
MEGH
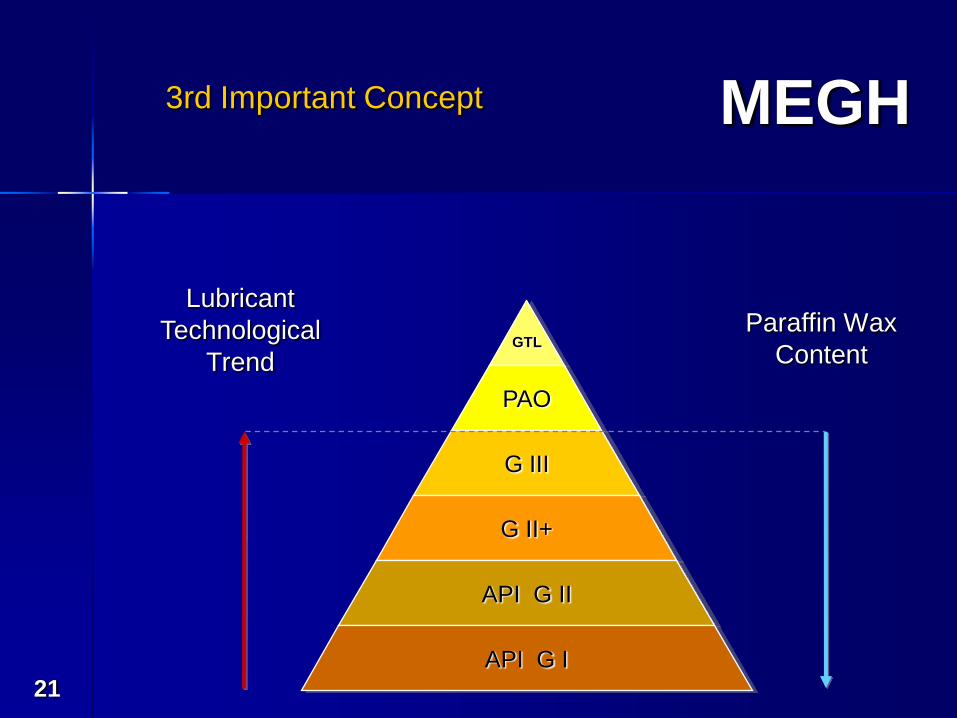
21
GTL
PAO
G III
G II+
API G II
API G I
3rd Important Concept
Lubricant
Technological
Trend
Paraffin Wax
Content
MEGH
22
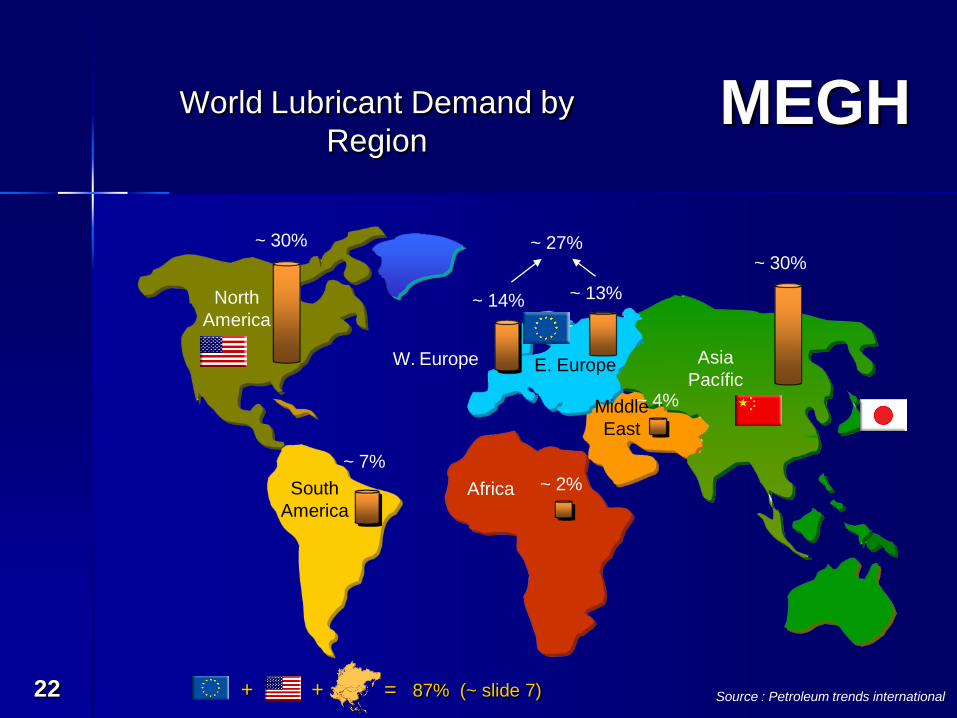
World Lubricant Demand by
Region
Source : Petroleum trends international
North
America
South
America
Asia
Pacífic
Africa
Middle
East
W. Europe E. Europe
~ 30%
~ 30%
~ 14% ~ 13%
~ 27%
~ 7%
~ 4%
~ 2%
87% (~ slide 7)+ + =
MEGH
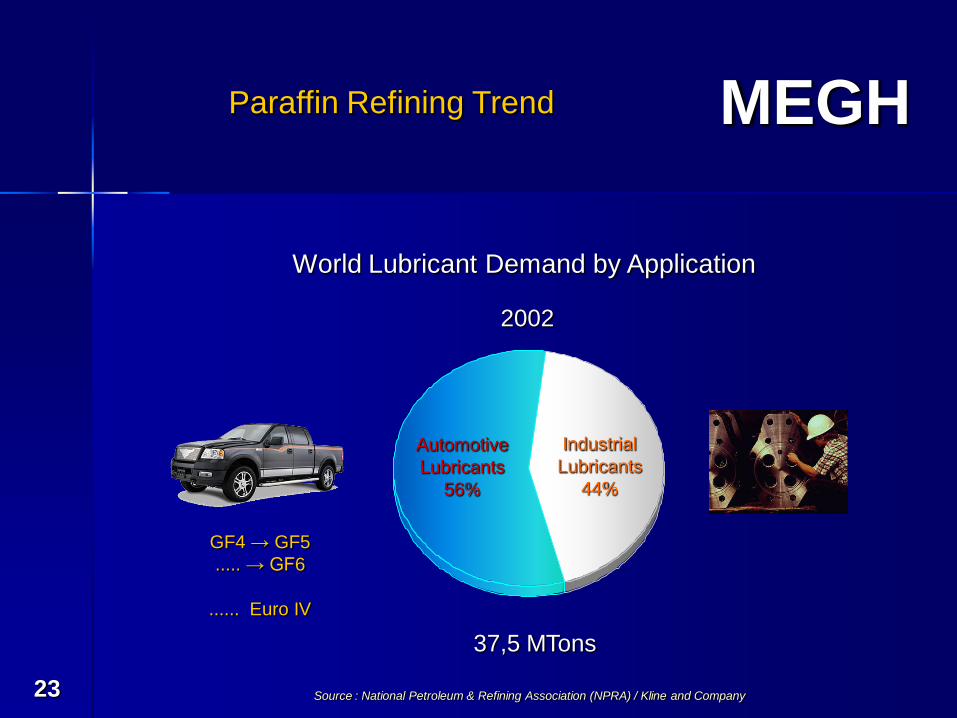
23
World Lubricant Demand by Application
2002
Automotive
Lubricants
56%
Industrial
Lubricants
44%
37,5 MTons
Paraffin Refining Trend
GF4 → GF5
..... → GF6
...... Euro IV
Source : National Petroleum & Refining Association (NPRA) / Kline and Company

MEGH
24
GTL
PAO
G III
G II+
API G II
API G I
GF 4
GF 6
Paraffin Refining Trend
Lubricant
Technological
Trend
Paraffin Wax
Content
MEGH
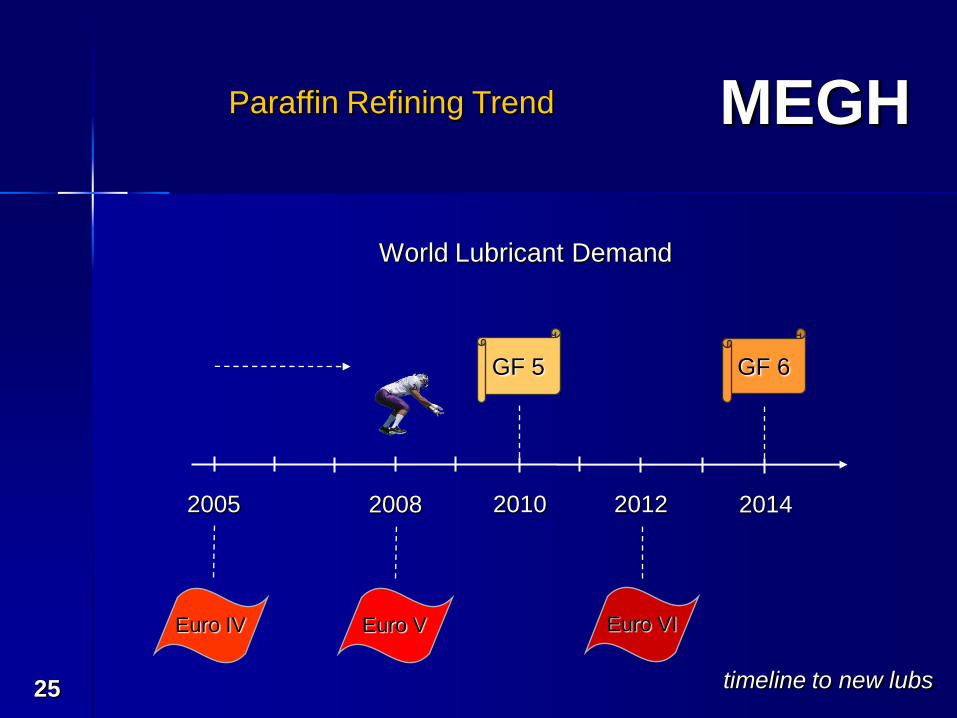
25
World Lubricant Demand
2005 2008 2010 2012 2014
GF 6
Euro IV Euro V Euro VI
GF 5
timeline to new lubs
Paraffin Refining Trend
MEGH
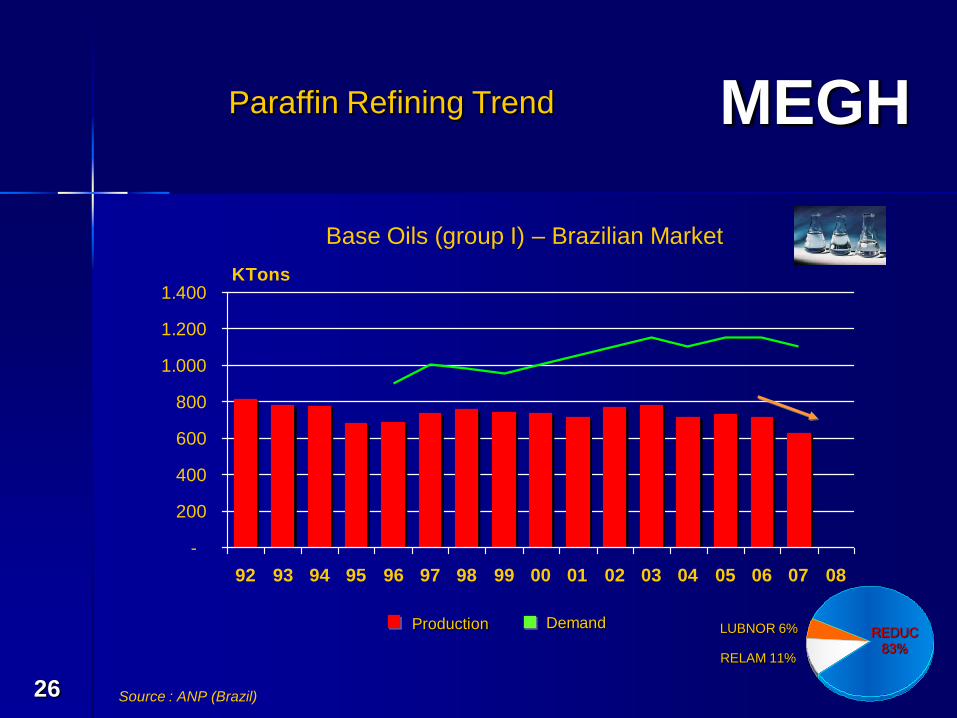
26
-
200
400
600
800
1.000
1.200
1.400
92 93 94 95 96 97 98 99 00 01 02 03 04 05 06 07 08
KTons
Production Demand
Base Oils (group I) – Brazilian Market
REDUC
83%RELAM 11%
LUBNOR 6%
Source : ANP (Brazil)
Paraffin Refining Trend
MEGH
27
Equation Analysis:
+ +
Paraffin Refining Trend
MEGH
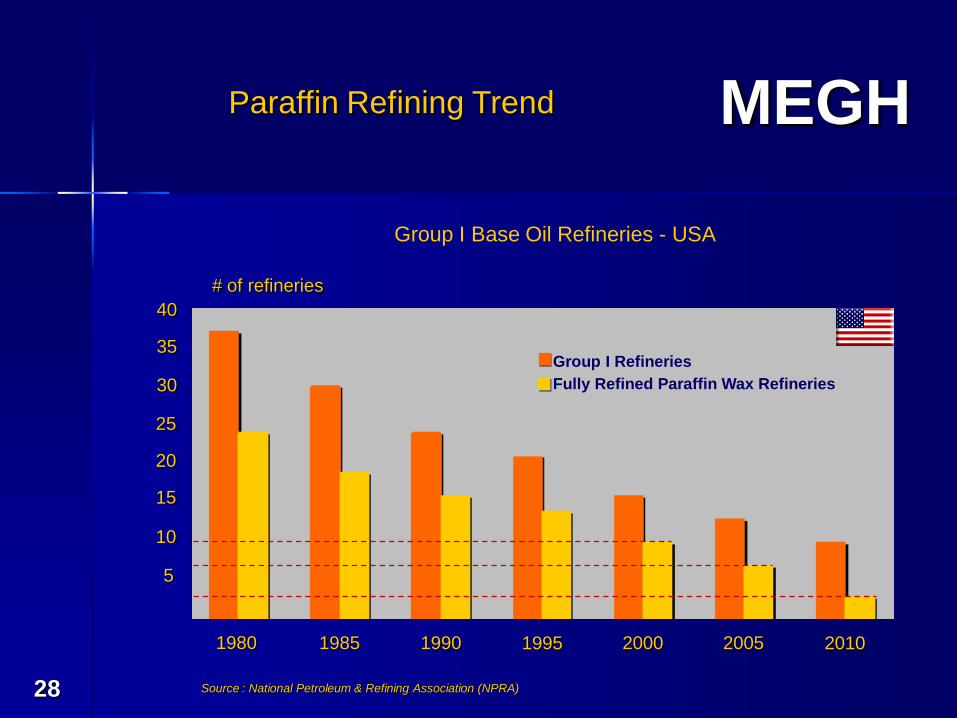
28
Group I Refineries
Fully Refined Paraffin Wax Refineries
# of refineries
1980 1985 1990 1995 2000 2005 2010
10
5
15
20
25
30
35
40
Group I Base Oil Refineries - USA
Source : National Petroleum & Refining Association (NPRA)
Paraffin Refining Trend
MEGH
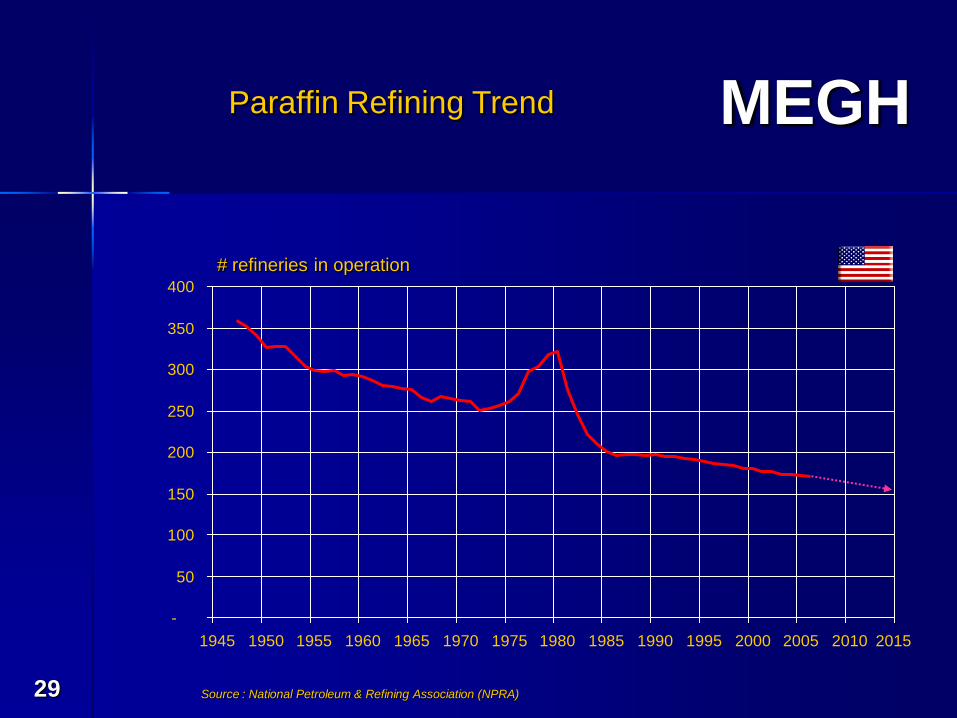
29
-
50
100
150
200
250
300
350
400
1945 1950 1955 1960 1965 1970 1975 1980 1985 1990 1995 2000 2005 2010
# refineries in operation
2015
Source : National Petroleum & Refining Association (NPRA)
Paraffin Refining Trend
MEGH
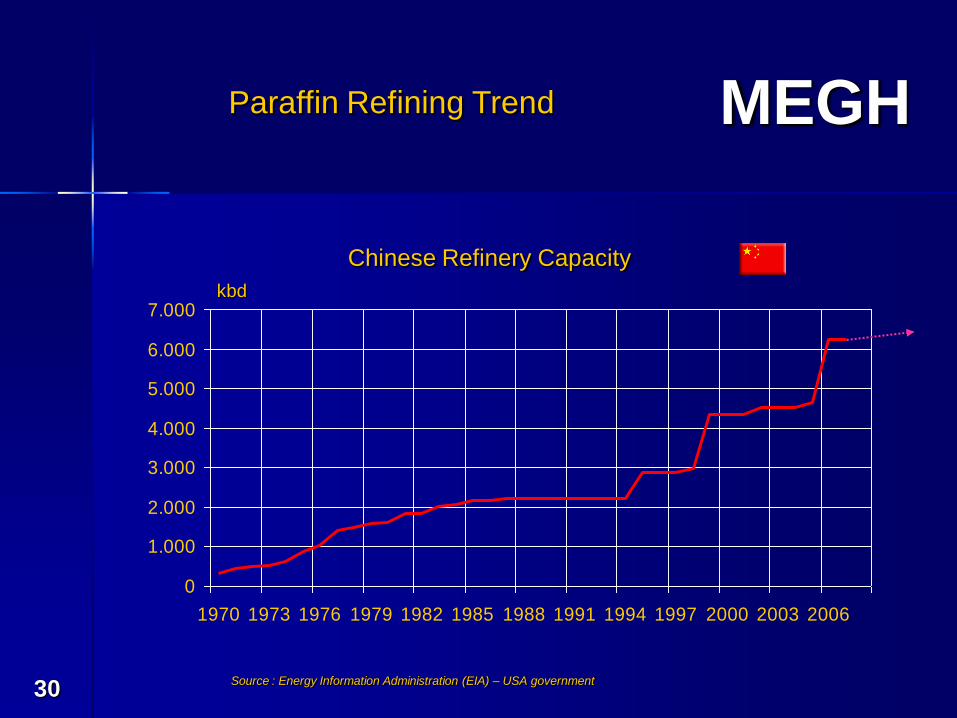
30
0
1.000
2.000
3.000
4.000
5.000
6.000
7.000
1970 1973 1976 1979 1982 1985 1988 1991 1994 1997 2000 2003 2006
Chinese Refinery Capacity
kbd
Source : Energy Information Administration (EIA) – USA government
Paraffin Refining Trend
MEGH
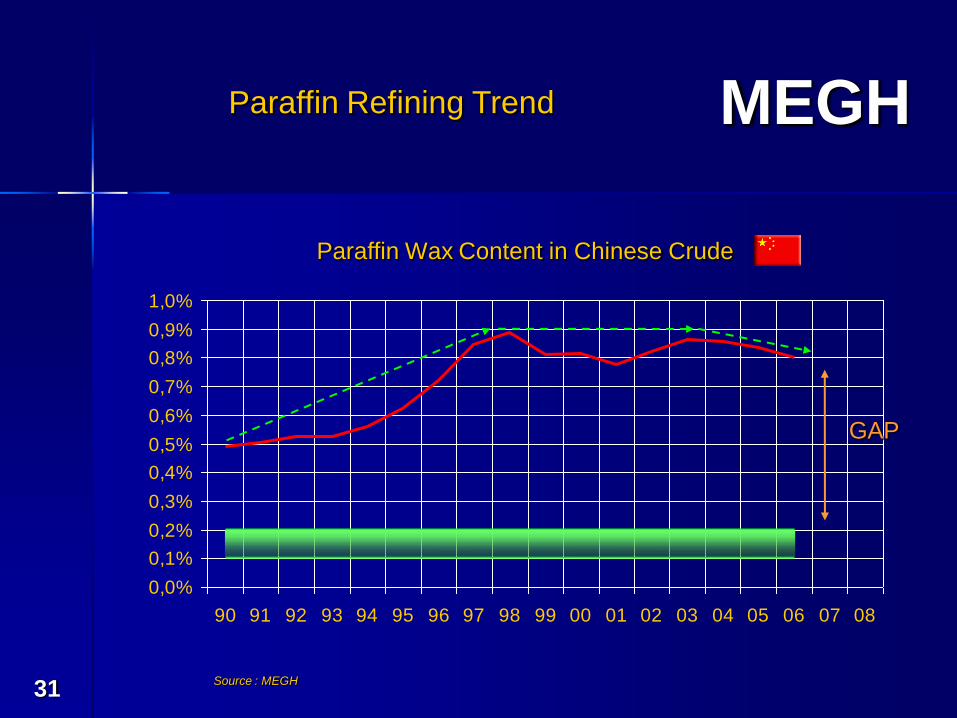
31
0,0%
0,1%
0,2%
0,3%
0,4%
0,5%
0,6%
0,7%
0,8%
0,9%
1,0%
90 91 92 93 94 95 96 97 98 99 00 01 02 03 04 05 06 07 08
Source : MEGH
Paraffin Wax Content in Chinese Crude
GAP
Paraffin Refining Trend
MEGH
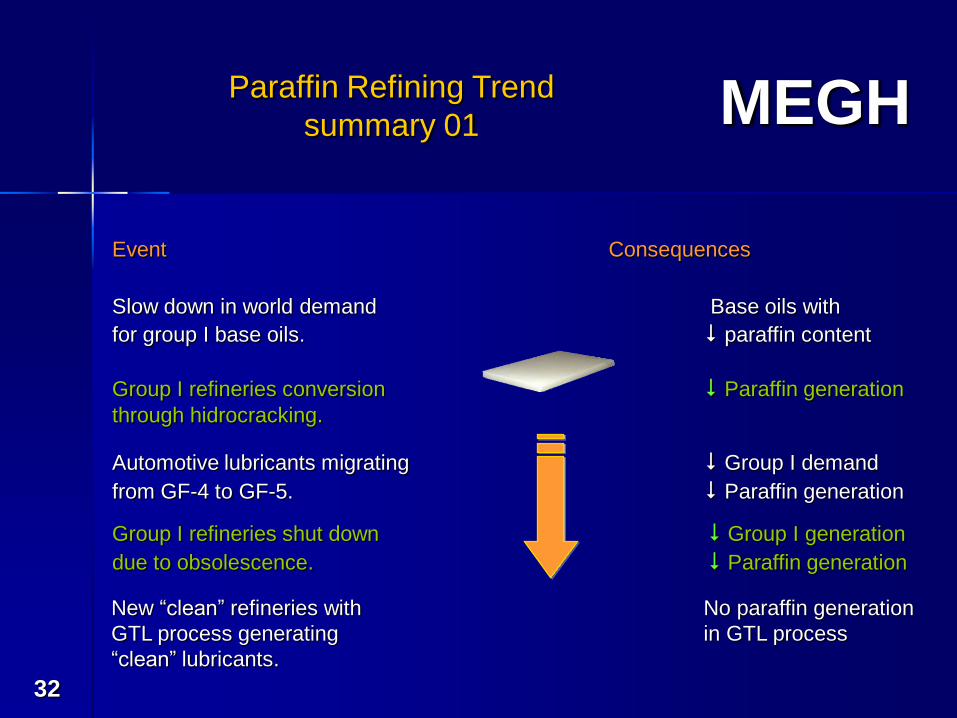
32
Slow down in world demand Base oils with
for group I base oils. paraffin content
Event Consequences
Group I refineries conversion Paraffin generation
through hidrocracking.
Automotive lubricants migrating Group I demand
from GF-4 to GF-5. Paraffin generation
Group I refineries shut down Group I generation
due to obsolescence. Paraffin generation
New “clean” refineries with No paraffin generation
GTL process generating in GTL process
“clean” lubricants.
Paraffin Refining Trend
summary 01
MEGH
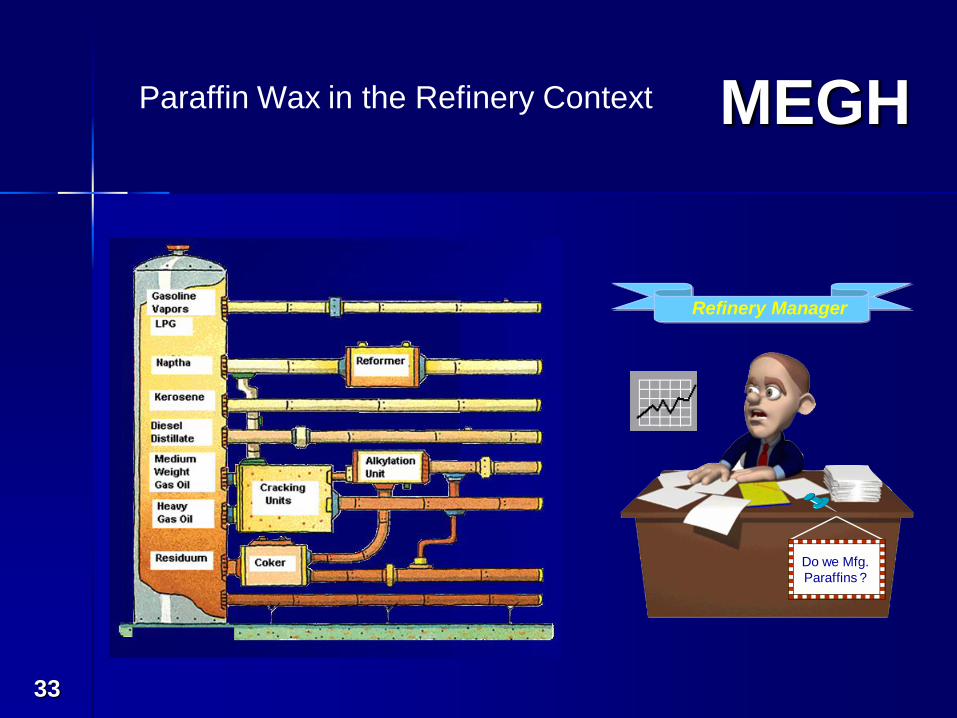
33
Paraffin Wax in the Refinery Context
Refinery Manager
Do we Mfg.
Paraffins ?
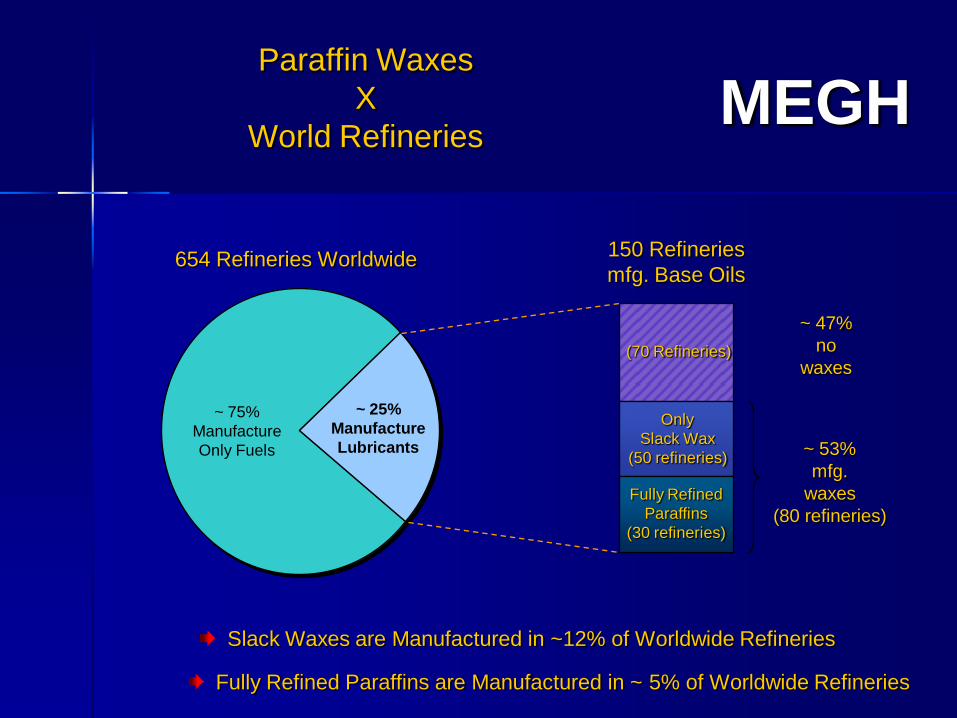
MEGHParaffin Waxes
X
World Refineries
~ 75%
Manufacture
Only Fuels
~ 25%
Manufacture
Lubricants
150 Refineries
mfg. Base Oils
~ 47%
no
waxes
Only
Slack Wax
(50 refineries)~ 53%
mfg.
waxes
(80 refineries)
654 Refineries Worldwide
Slack Waxes are Manufactured in ~12% of Worldwide Refineries
Fully Refined Paraffins are Manufactured in ~ 5% of Worldwide Refineries
Fully Refined
Paraffins
(30 refineries)
(70 Refineries)
MEGH
35
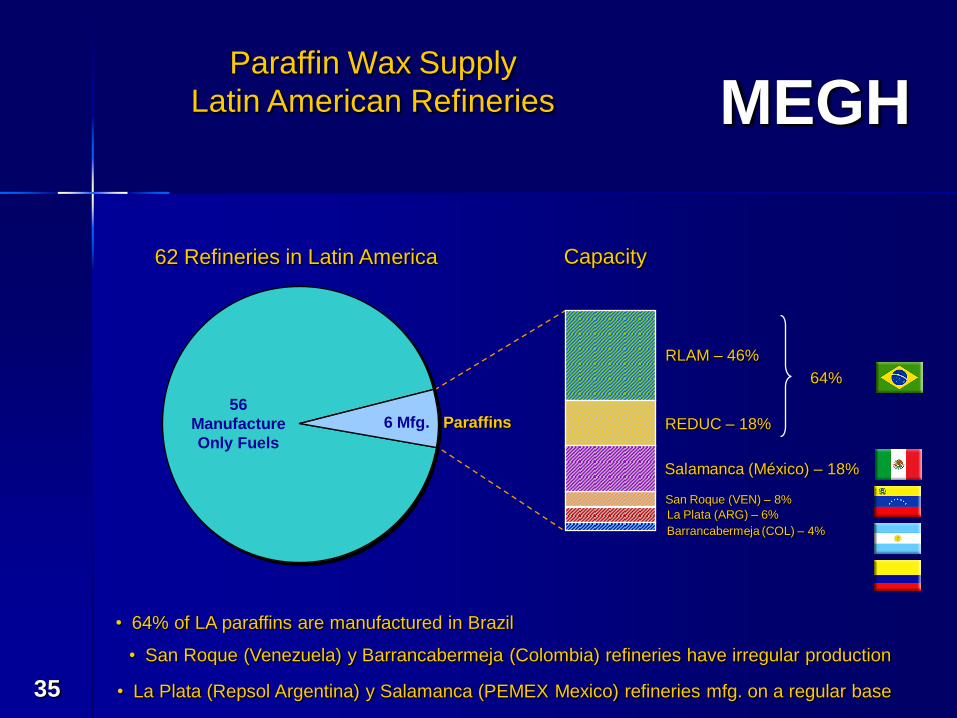
62 Refineries in Latin America
Paraffin Wax Supply
Latin American Refineries
6 Mfg. Paraffins
RLAM – 46%
REDUC – 18%
San Roque (VEN) – 8%
La Plata (ARG) – 6%
Barrancabermeja (COL) – 4%
Capacity
64%
56
Manufacture
Only Fuels
• 64% of LA paraffins are manufactured in Brazil
• San Roque (Venezuela) y Barrancabermeja (Colombia) refineries have irregular production
• La Plata (Repsol Argentina) y Salamanca (PEMEX Mexico) refineries mfg. on a regular base
Salamanca (México) – 18%
MEGH
36
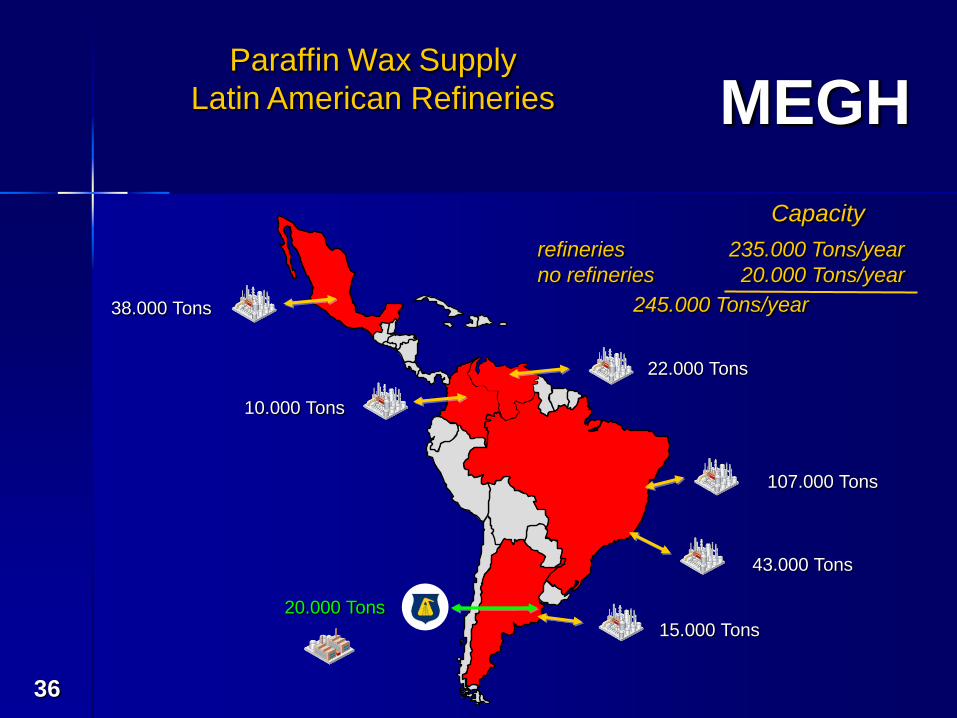
107.000 Tons
43.000 Tons
15.000 Tons
10.000 Tons
38.000 Tons
20.000 Tons
refineries 235.000 Tons/year
no refineries 20.000 Tons/year
245.000 Tons/year
Capacity
22.000 Tons
Paraffin Wax Supply
Latin American Refineries
MEGH
37
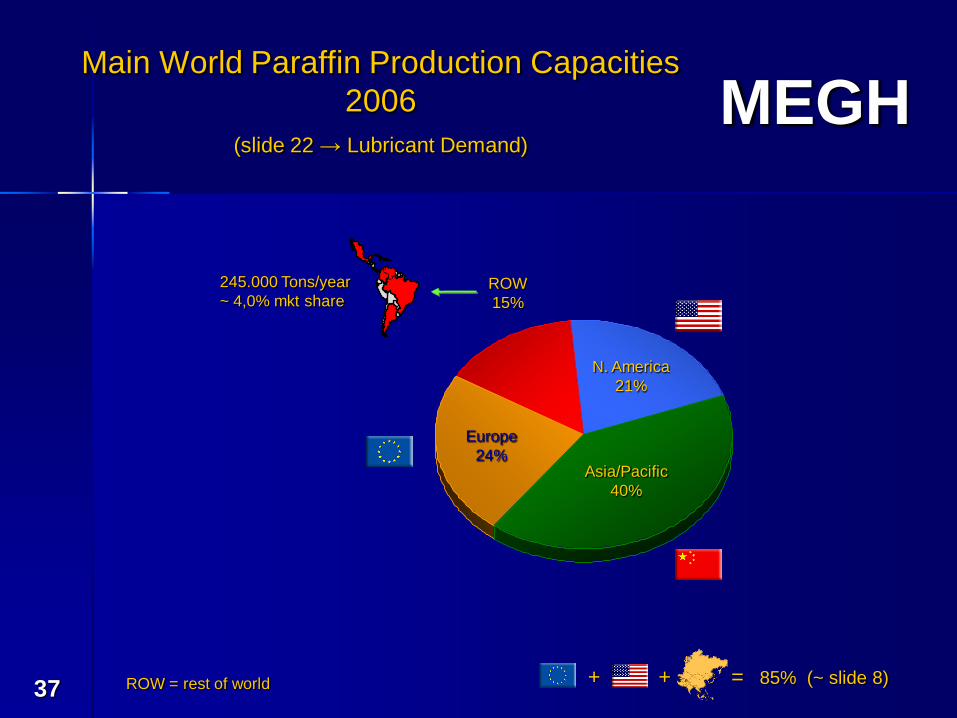
Main World Paraffin Production Capacities
2006
(slide 22 → Lubricant Demand)
245.000 Tons/year
~ 4,0% mkt share
ROW = rest of world
Asia/Pacific
40%
N. America
21%
Europe
24%
ROW
15%
85% (~ slide 8)+ + =
MEGH
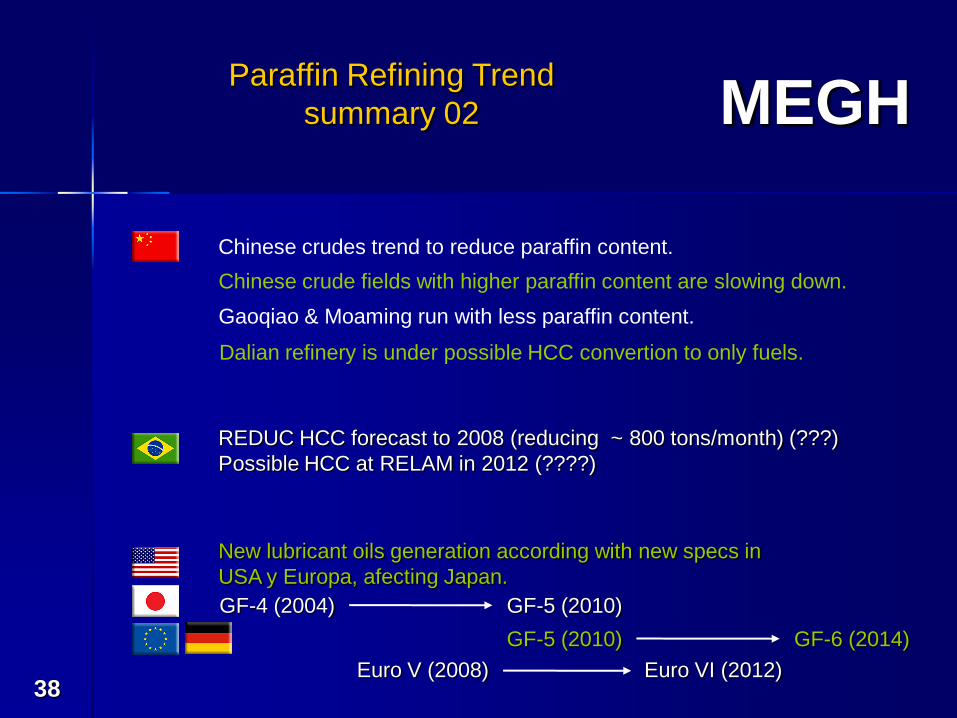
38
Chinese crudes trend to reduce paraffin content.
Chinese crude fields with higher paraffin content are slowing down.
Gaoqiao & Moaming run with less paraffin content.
Dalian refinery is under possible HCC convertion to only fuels.
REDUC HCC forecast to 2008 (reducing ~ 800 tons/month) (???)
Possible HCC at RELAM in 2012 (????)
New lubricant oils generation according with new specs in
USA y Europa, afecting Japan.
GF-4 (2004) GF-5 (2010)
Paraffin Refining Trend
summary 02
GF-5 (2010) GF-6 (2014)
Euro V (2008) Euro VI (2012)
MEGH
39 IV Enafave – João Pessoa (PB), november 2006
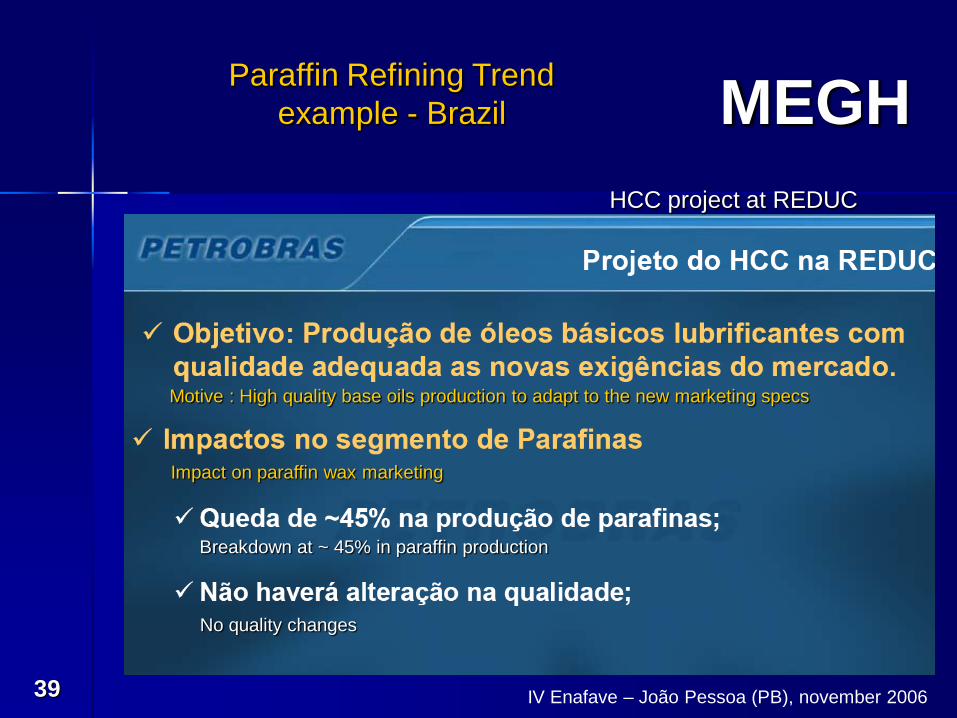
Paraffin Refining Trend
example - Brazil
HCC project at REDUC
Motive : High quality base oils production to adapt to the new marketing specs
Impact on paraffin wax marketing
Breakdown at ~ 45% in paraffin production
No quality changes
MEGH
40
0,60
0,65
0,70
0,75
0,80
0,85
92 94 96 98 00 02 04 06 08
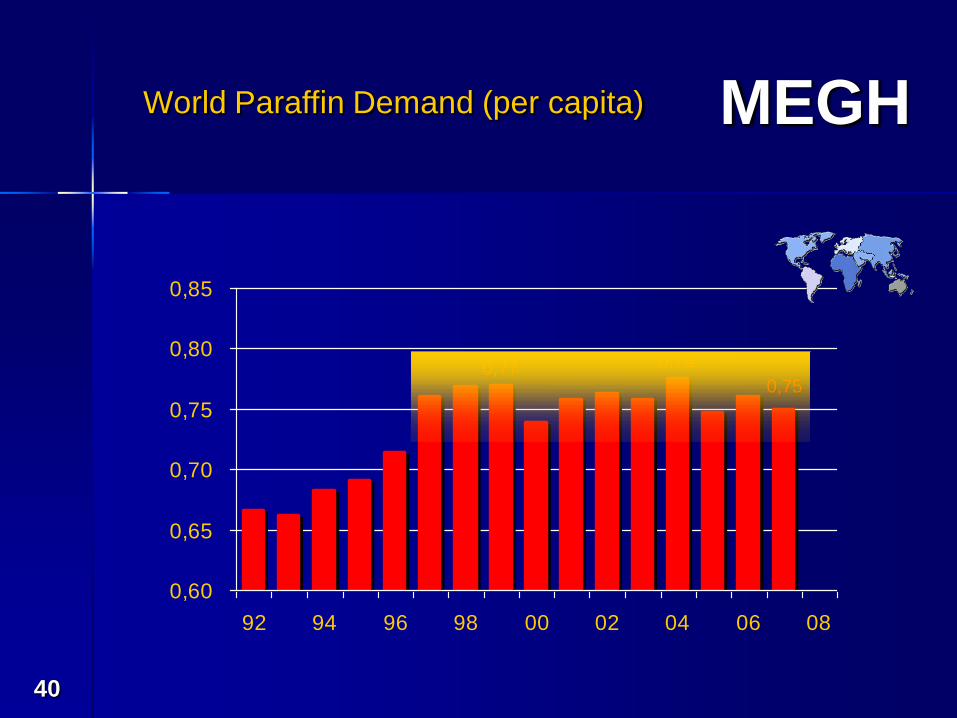
World Paraffin Demand (per capita)
0,75
0,780,77
MEGH
41
-
1.000
2.000
3.000
4.000
5.000
75 78 81 84 87 90 93 96 99 02 05 08
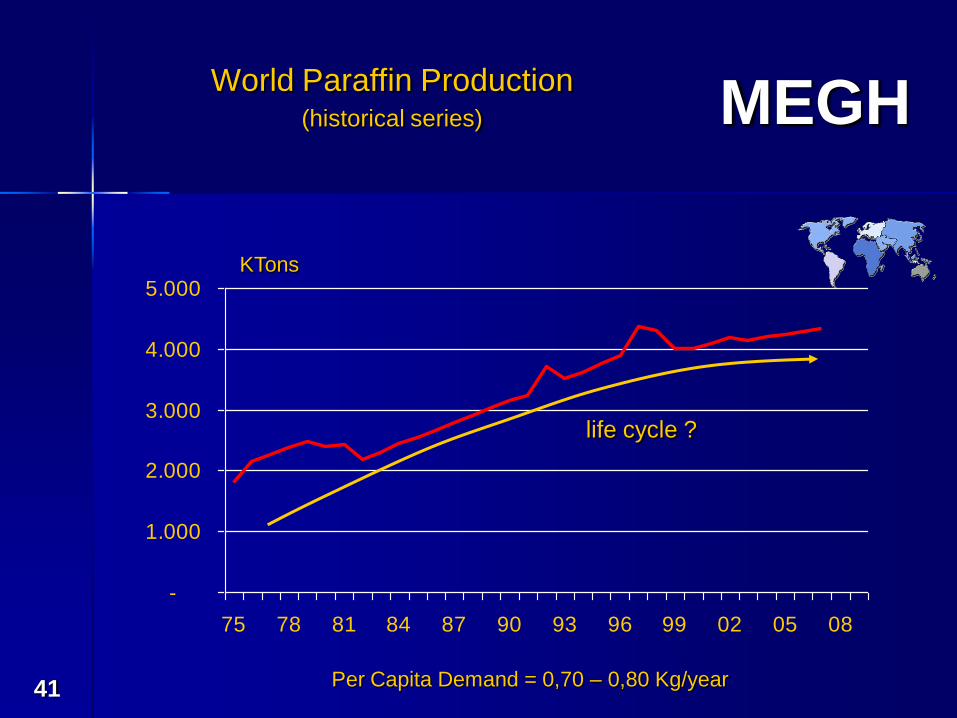
KTons
World Paraffin Production(historical series)
life cycle ?
Per Capita Demand = 0,70 – 0,80 Kg/year
MEGH
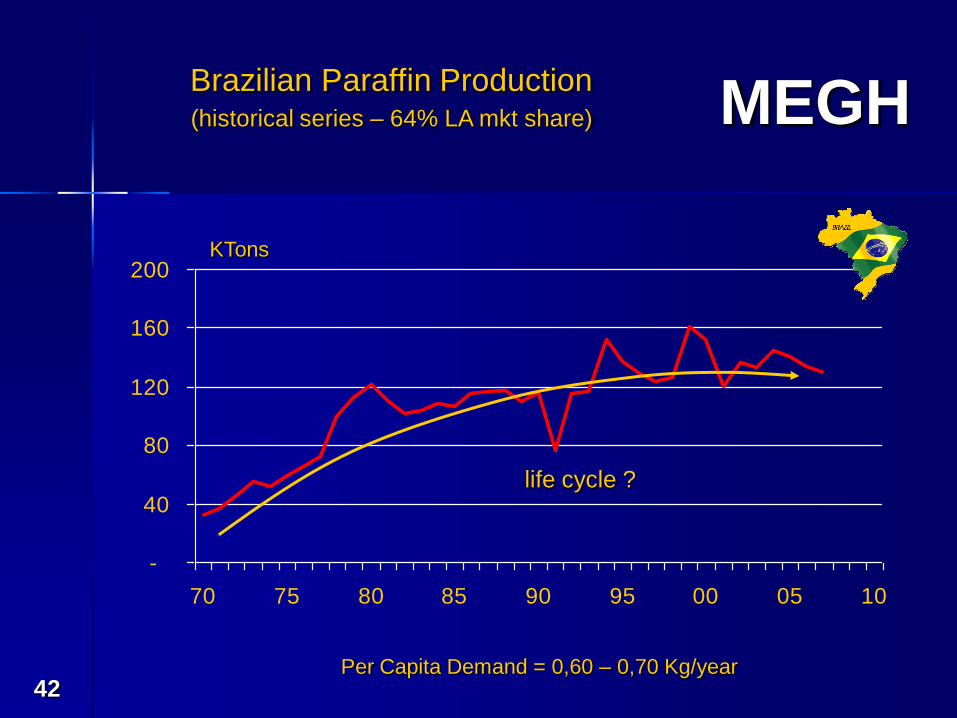
42
-
40
80
120
160
200
70 75 80 85 90 95 00 05 10
KTons
life cycle ?
Per Capita Demand = 0,60 – 0,70 Kg/year
Brazilian Paraffin Production(historical series – 64% LA mkt share)
MEGH
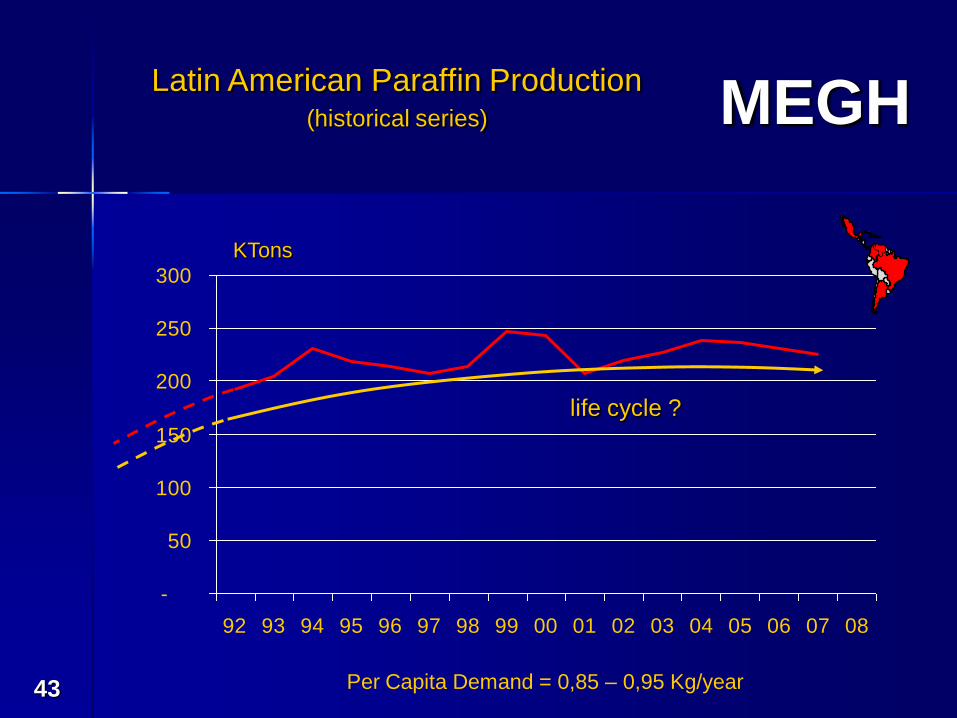
43
-
50
100
150
200
250
300
92 93 94 95 96 97 98 99 00 01 02 03 04 05 06 07 08
KTons
Per Capita Demand = 0,85 – 0,95 Kg/year
Latin American Paraffin Production(historical series)
life cycle ?
MEGH
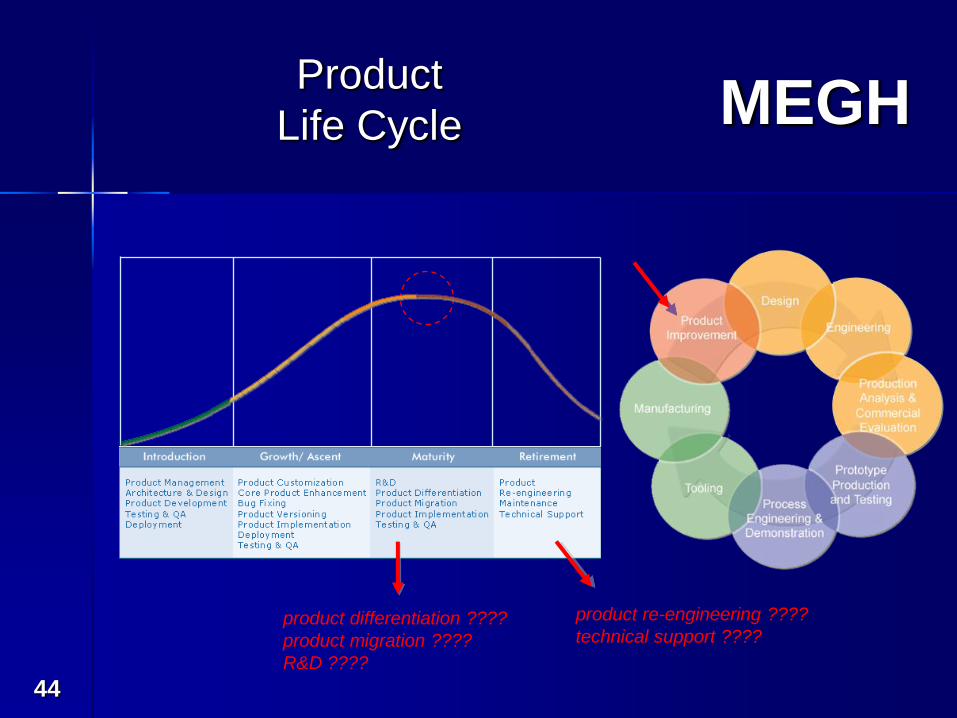
44
Product
Life Cycle
product differentiation ????
product migration ????
R&D ????
product re-engineering ????
technical support ????
MEGH
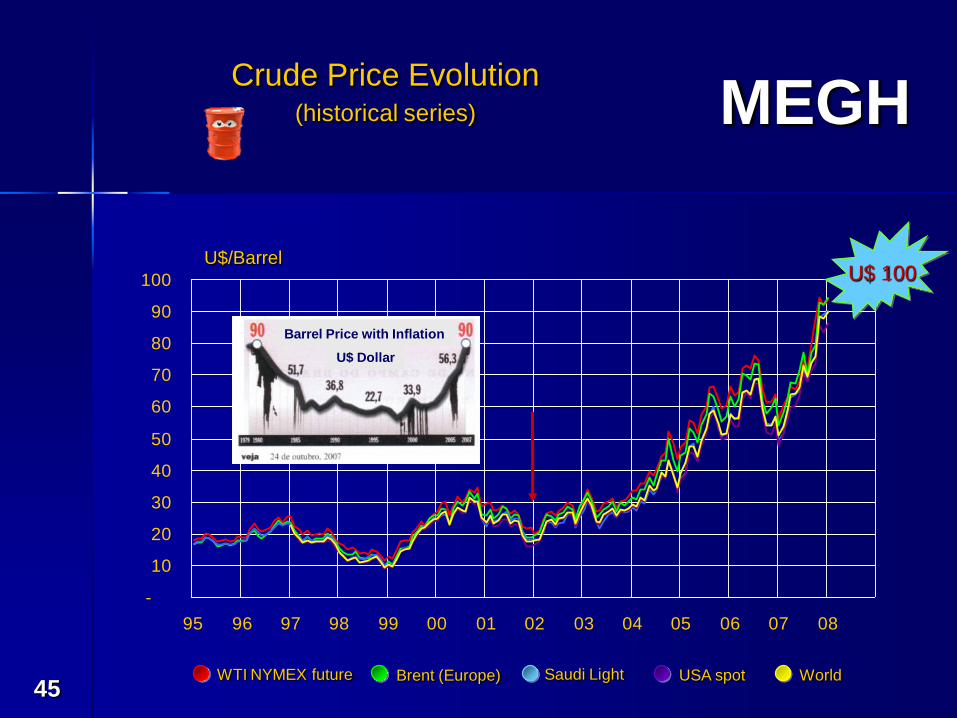
45
-
10
20
30
40
50
60
70
80
90
100
95 96 97 98 99 00 01 02 03 04 05 06 07 08
U$/Barrel
Crude Price Evolution(historical series)
U$ 100
Brent (Europe)WTI NYMEX future USA spotSaudi Light World
Barrel Price with Inflation
U$ Dollar
MEGH
46
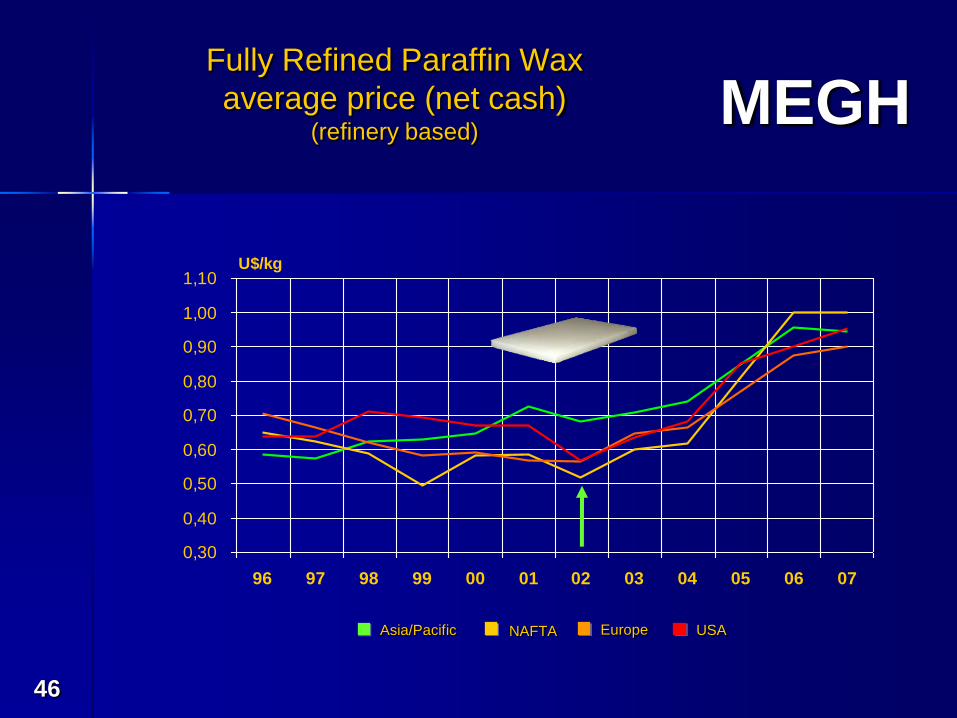
0,30
0,40
0,50
0,60
0,70
0,80
0,90
1,00
1,10
96 97 98 99 00 01 02 03 04 05 06 07
U$/kg
Asia/Pacific NAFTA USAEurope
Fully Refined Paraffin Wax
average price (net cash)(refinery based)
MEGH
47
• The future of paraffin waxes will depend of which technology will
be used to manufacture lubricants (GTL/Fischer Tropsch).
• Cracking of heavy fractions, generating lighter fuels (Hidrocracking).
• Petroleum waxes are passing through their maturity phase going
to a decline phase in their life cycle.
• Paraffin demand has shown signs of slowing down in the last years.
• Substitute waxes are already a reality (ex: GTL waxes / HOFs).
Paraffin Refining Trend
Conclusions
MEGH
48
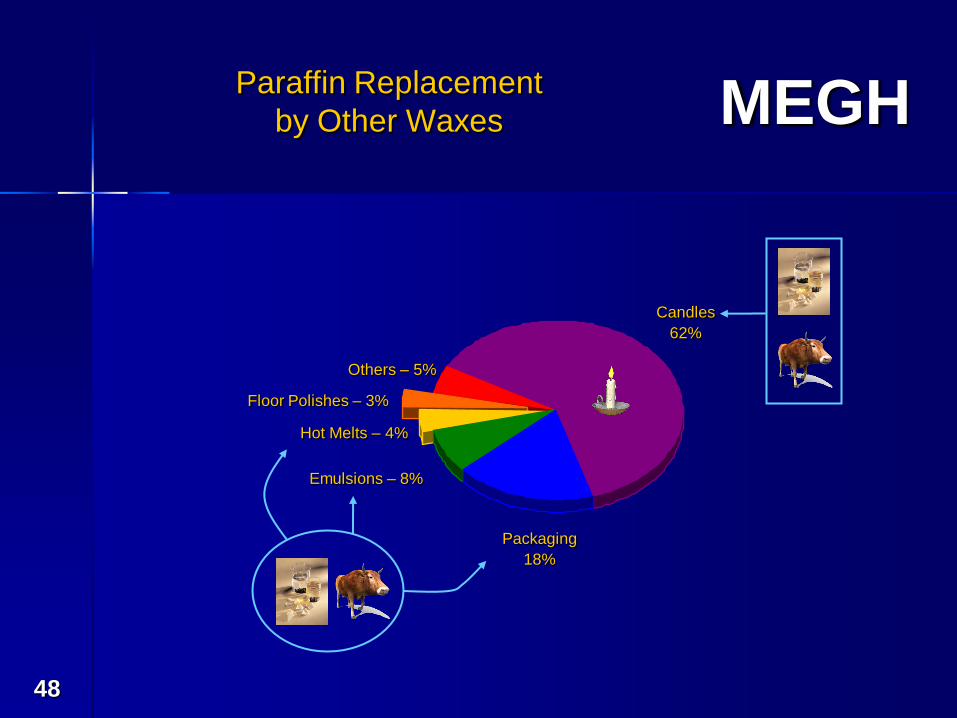
Floor Polishes – 3%
Candles
62%
Packaging
18%
Emulsions – 8%
Hot Melts – 4%
Others – 5%
Paraffin Replacement
by Other Waxes
MEGH
49
Oils & Fats
MEGH
50
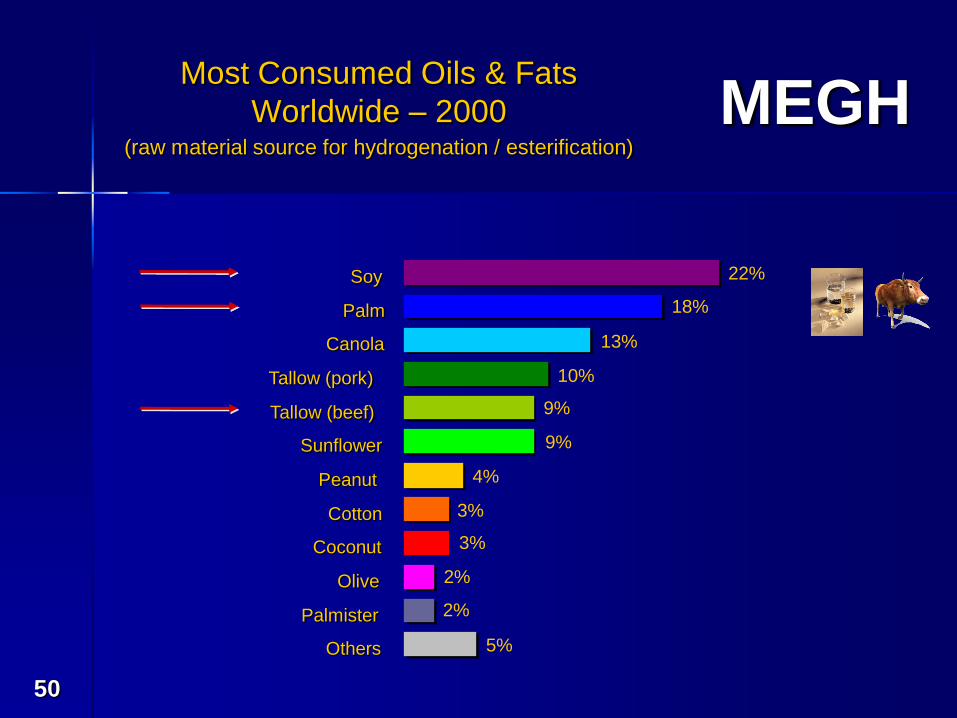
Tallow (pork)
5%
2%
2%
3%
3%
4%
9%
9%
10%
13%
18%
22%Soy
Palm
Canola
Tallow (beef)
Sunflower
Peanut
Cotton
Coconut
Olive
Palmister
Others
Most Consumed Oils & Fats
Worldwide – 2000(raw material source for hydrogenation / esterification)
MEGH
51
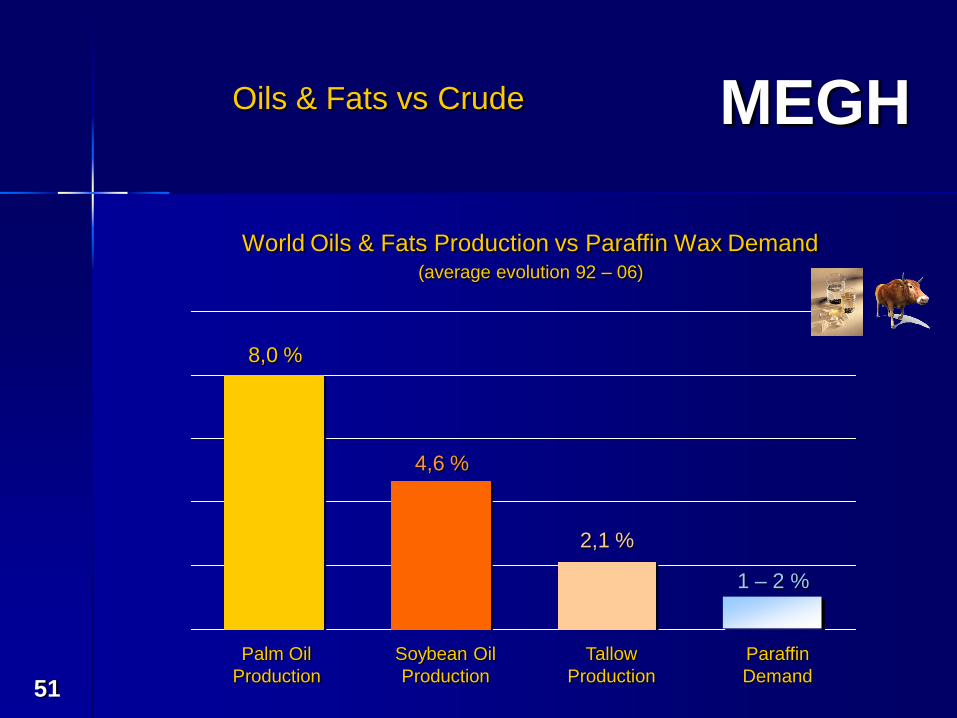
1 – 2 %
2,1 %
4,6 %
8,0 %
Palm Oil
Production
Soybean Oil
Production
Tallow
Production
Paraffin
Demand
World Oils & Fats Production vs Paraffin Wax Demand(average evolution 92 – 06)
Oils & Fats vs Crude
MEGH
52
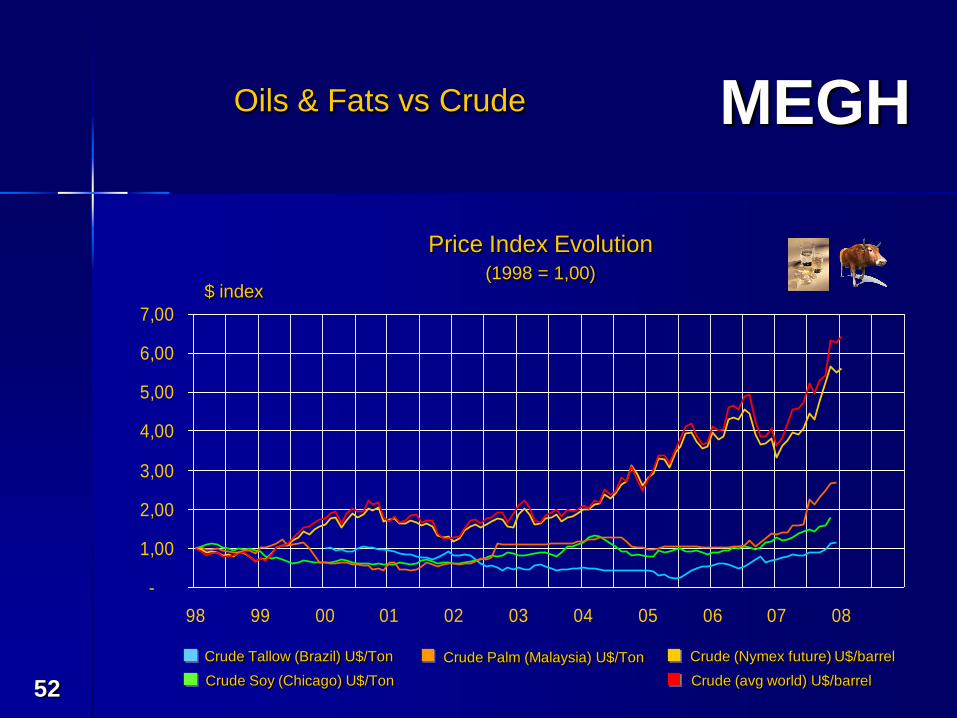
-
1,00
2,00
3,00
4,00
5,00
6,00
7,00
98 99 00 01 02 03 04 05 06 07 08
Crude Tallow (Brazil) U$/Ton
Crude Soy (Chicago) U$/Ton
Crude Palm (Malaysia) U$/Ton Crude (Nymex future) U$/barrel
Crude (avg world) U$/barrel
$ index
Price Index Evolution(1998 = 1,00)
Oils & Fats vs Crude
MEGH
53
Biodiesel
MEGH
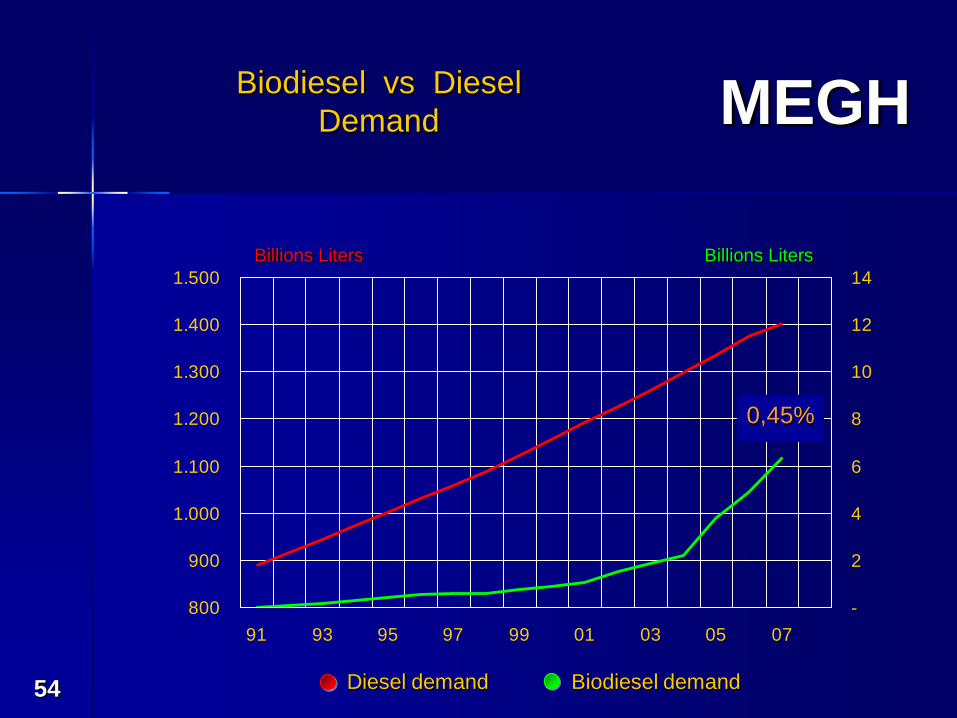
54
Biodiesel vs Diesel
Demand
800
900
1.000
1.100
1.200
1.300
1.400
1.500
91 93 95 97 99 01 03 05 07
-
2
4
6
8
10
12
14
Billions Liters Billions Liters
Biodiesel demandDiesel demand
0,45%
MEGH
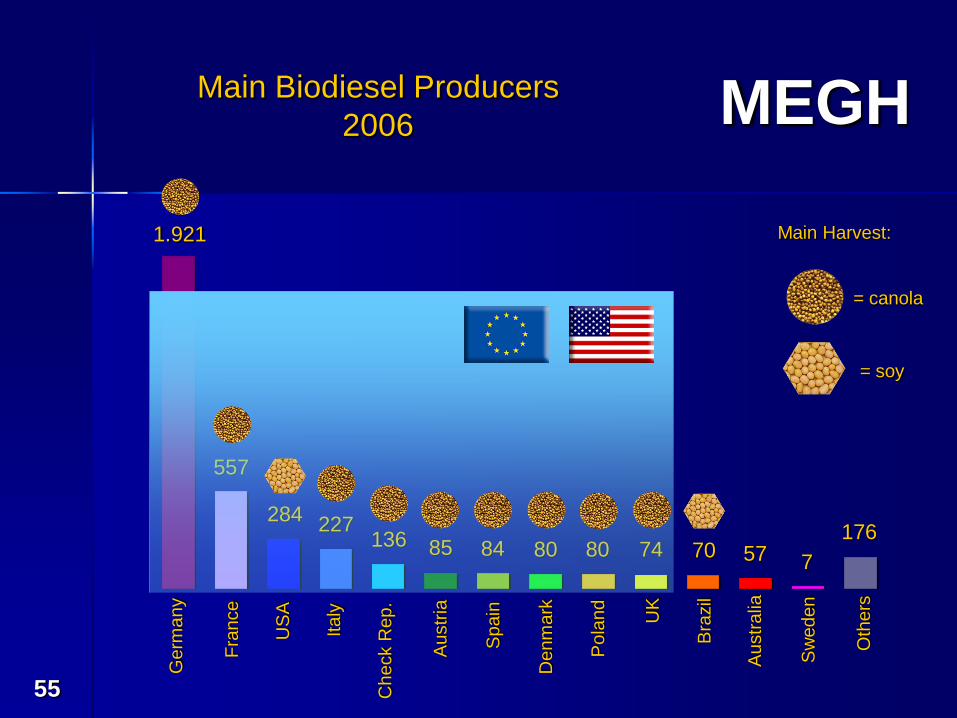
55
Main Biodiesel Producers
2006
Germ
any
Fra
nce
US
A
Italy
Check R
ep.
Austr
ia
Spain
Denm
ark
Pola
nd
UK
Bra
zil
Austr
alia
Sw
eden
Oth
ers
1.921
557
284227
136 85 84 80 80 74 70 57 7
176
= soy
= canola
Main Harvest:
MEGH
56
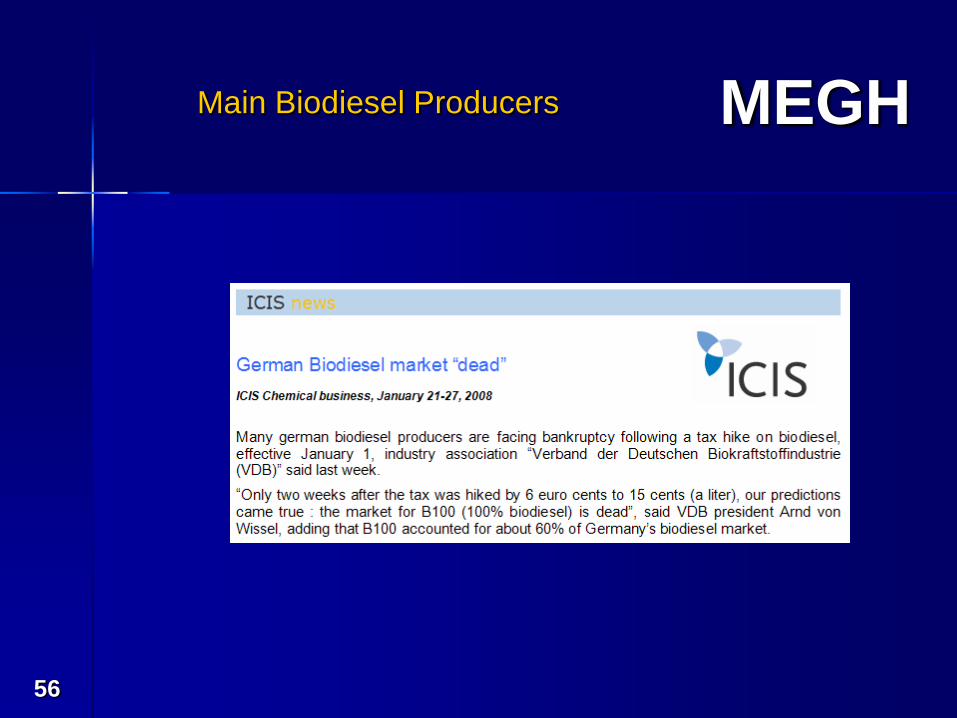
Main Biodiesel Producers
MEGH
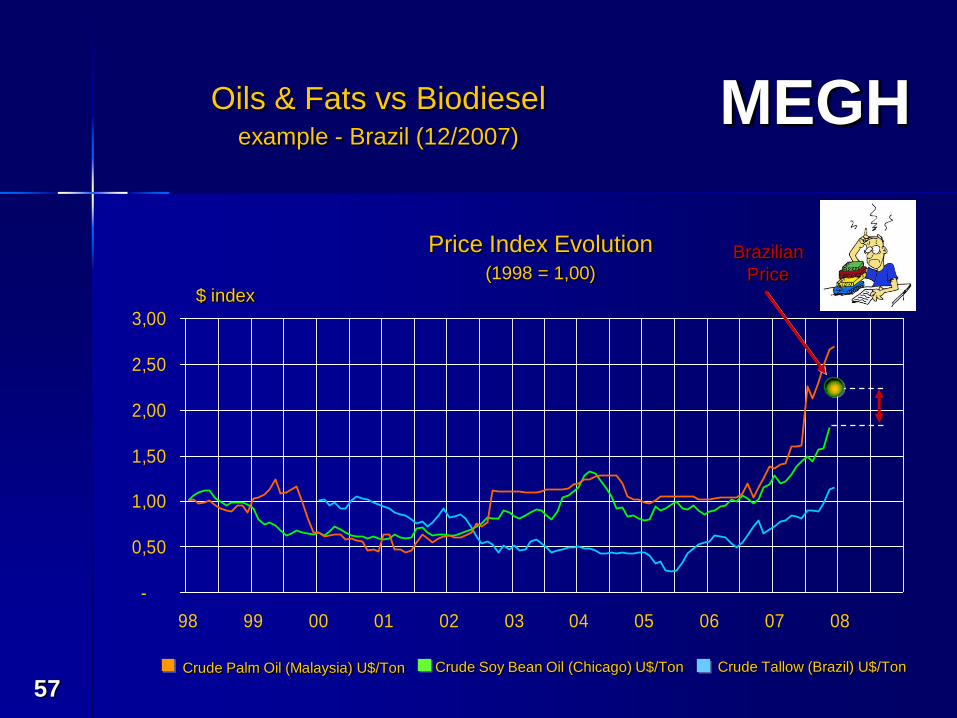
57
-
0,50
1,00
1,50
2,00
2,50
3,00
98 99 00 01 02 03 04 05 06 07 08
Crude Tallow (Brazil) U$/TonCrude Soy Bean Oil (Chicago) U$/TonCrude Palm Oil (Malaysia) U$/Ton
$ index
Price Index Evolution(1998 = 1,00)
Oils & Fats vs Biodieselexample - Brazil (12/2007)
Brazilian
Price
MEGH
58
Holy Hope
Candle Mfg.
MEGH
59
MEGH
60


![Megh Boleche Jabo Jabo by Humayun Ahmed [Part.2]easytoload.yolasite.com/resources/Megh Boleche Jabo Jabo.pdf · For More Books & Music VisitFor More Books & Music Visit MurchOna Forum](https://img.pdfslide.us/doc/110x75/5abbfe677f8b9a8f058d1915/megh-boleche-jabo-jabo-by-humayun-ahmed-part2-boleche-jabo-jabopdffor-more-books.jpg)


![Megh Boleche Jabo Jabo by Humayun Ahmed[Part[1].1]](https://img.pdfslide.us/doc/110x75/55292ad94a795977158b4656/megh-boleche-jabo-jabo-by-humayun-ahmedpart11.jpg)


![Megh Boleche Jabo Jabo by Humayun Ahmed[Part.2].PDF](https://img.pdfslide.us/doc/110x75/563dbb60550346aa9aaca20b/megh-boleche-jabo-jabo-by-humayun-ahmedpart2pdf.jpg)