Embed Size (px)
Citation preview
SEPTEMBER 1999 ECN-C--99-052
THE FUTURE OF THE PETROCHEMICAL INDUSTRY
A MARKAL-MATTER Analysis
B.J. GroenendaalD.J. Gielen
2 ECN-C--99-052
AcknowledgementThis study is a part of the MATTER project (MATerials Technologies for CO2 Emission Reduc-tion) funded by the National Research Programme on Climate Change and Global Air Pollution,and the Netherlands Energy Research Foundation, ECN project number 7.7164.
AbstractThis report discusses the MARKAL-MATTER results regarding the impact of greenhouse gaspolicies on the petrochemical industry in Western Europe from an integrated chain perspective.The MARKAL-MATTER model gives insight in how different technologies might develop in thenext decades at different emission permit prices. This report first describes the present situation inthe petrochemical industry. Next, techno-economic emissions reduction options are discussed.The results of this modelling study show that up to 75% emission reduction can be achieved inthe life cycle of petrochemicals through various emission reduction strategies. However, signifi-cantly costs are involved with these strategies and the R&D effort should focus on new and non-traditional research areas.
ECN-C--99-052 3
CONTENTS
SUMMARY 6
1. INTRODUCTION 10
2. PRESENT SITUATION 132.1 Feedstocks 142.2 Petrochemical intermediate products 142.3 Petrochemical product applications 142.4 Energy balances of the petrochemical industry 162.5 Conclusions 16
3. TECHNO-ECONOMIC EMISSION REDUCTION OPTIONS 173.1 Energy related GHG reduction strategies 173.2 Feedstock substitution strategies 183.3 Changing materials use 203.4 Reduction of industrial N2O emissions 25
4. MODELING THE ENERGY AND MATERIALS SYSTEM 274.1 The MARKAL model 274.2 MATTER: Western European MARKAL 274.3 Materials and waste materials selection 28
5. RESULTS: THE IMPACT OF GHG POLICIES 305.1 Refineries 305.2 Petrochemical industry 315.3 Waste handling 375.4 Price impacts 395.5 Final energy use and GHG emissions 42
6. CONCLUSIONS 476.1 Relevant energy and material flows 476.2 The relation between energy and material flows and GHG emissions 476.3 Technologically feasible strategies 486.4 Cost-effective strategies 486.5 The integrated production complex problem 496.6 Selection of production locations: the carbon leakage issue 496.7 R&D planning for the period beyond 2010 506.8 Accounting issues 50
ANNEX A THE MATTER MARKAL MODEL 51
ANNEX B REFINERY AND PETROCHEMICAL TECHNOLOGIES ANDMATERIALS USED IN THE MARKAL-MATTER MODEL 58
REFERENCES 64
4 ECN-C--99-052
GLOSSARY
ABS Acrylonitrile Butadiene StyreneAES Alkyl Ether SulphateBTX Benzene Toluene XyleneCPW Clean Plastic WasteDRP Deutsche Reifen ProduktionDFE Design For EnvironmentDMT DiMethylTerephthalateECN Netherlands Energy Research FoundationFCC Fluid Catalic CrackingGHG GreenHouse GasIEA International Energy AgencyLPG Liquefied Petroleum GasMARKAL MARKet ALlocationMATTER MATerials Technologies for greenhouse gas Emission ReductionMEK MethylEthylKetonMPW Mixed Plastic WasteMSW Municipal solid WasteMTBE MethylTriButhylEthyleneMTO Methanol to OlefinsNEU-CO2 Non Energy Use- CO2
NOP-MLK Dutch national research programme on global air pollution and climate changeOECD Organisation for Economic Co-operation and DevelopmentO-Xylene Ortho XyleneP-Xylene Para XylenePA PolyAmidePBD PolyButhylene DiethylenePE PolyEthylenePET PolyEthylene TerephthalatePFC PerFluoroCarbonsPO PolyOlefinsPP PolyPropylenePS PolyStyrenePUR PolyURethanePVC PolyVinylChlorideSAN Styrene AcryloNitrileSBR Styrene Butadiene RubberTPA TerePhthalic AcidUF Urea FormaldehydeUNFCCC United Nations Framework Convention on Climate ChangeVCM VinylChloride Monomer
DefinitionsRefineries: large industries that convert crude oil into oil products. Only the oil products that are
used in the petrochemical industry are mentioned in this study.Petrochemical industry: large industries that convert oil products into petrochemicals. In this
study fossil-based transportation fuels are considered to be non-petrochemicals.Transportation fuels produced in the petrochemical industry based on biomassare considered to be petrochemicals.

ECN-C--99-052 5
Carbon leakage is the relocation of industrial activities from countries with strong GHG emissionreduction policies to countries with no or weak GHG emission reduction policies,thus off-setting the emission reduction.
6 ECN-C--99-052
SUMMARY
This report is a product of the MATTER project (MATerials Technologies for greenhouse gasEmission Reduction). MATTER is a joint project of the Netherlands Energy Research foundationECN and 4 other Dutch institutes. The MARKAL model calculations that are presented in thisstudy are part of the ECN contribution in this project. This model covers all energy flows andmaterial flows in the Western European economy ‘from the cradle to the grave’ for the period1990-2050. The results in this report are based on model version 5.0.
GoalsThe goal of the MATTER project is the analysis of the potential contribution of materials policiesfor greenhouse gas (GHG) emission reduction. The emphasis is on techno-economic optimisation.Energy and materials systems must be analysed together because they interact.
The emphasis in this study is on long-term solutions. The reason for this broad time horizon isthat only significant GHG emission reduction will have a significant impact on the systems con-figuration. However, such a goal can only be achieved within a time frame of severaldecades because of the long life of the existing capital equipment. Moreover, new technology isrequired to achieve a significant GHG emission reduction. The development rate of this technol-ogy is another limiting factor. Especially this R&D perspective may be relevant for industries.
The goal of this report is the presentation of modelling results to an industry audience. The em-phasis is on the model results and on the development of industry strategies, based on these re-sults. The development of industry strategies is made on the basis of an integrated chainmanagement perspective ‘from cradle to grave’.
FocusThis report focuses on the petrochemical industry. It covers the production of plastics, solventsand detergents. The production of fertilisers, lubricants and asphalt are excluded from this cate-gory. There is a strong link between the petrochemical industry and the refining sector. Thepetrochemical industry nowadays gets its feedstocks from the refineries. Beside feedstocks refineries produce intermediates used by the petrochemical industry.
This report focuses on the effect of increasing greenhouse gas emission permit prices on petro-chemical industries. The effect of five cases, a base case, a 20• /t case, a 50• /t case, a 100• /tcase and a 200• /t CO2 case will be discussed. It is assumed that the permit prices graduallygrow from no penalty in 1990 to the penalty set in 2020. Although the highest two permit pricesseem rather unrealistic, permit prices could be an instrument to fulfil the goals set in the Kyotoprotocol.
The following questions will be answered in this report:1. What are the relevant energy and material flows in Western Europe in the life cycle of petro-
chemical products from a GHG perspective?2. What is the relation between these flows and GHG emissions? (Chapter 2)3. Which options exist to reduce these emissions in the next 3 decades? (Chapter 2)4. Does it make sense from a Western European cost-effectiveness perspective to reduce these
emissions? (Chapter 3)5. How far can these emissions be reduced at acceptable costs? (Chapter 5)6. Which problems must be solved in order to achieve this emission reduction? (Chapter 6)7. Which recommendations can be formulated for R&D and investment decisions? (Chapter 6)
ECN-C--99-052 7
Chapter 2 describes the present situation of Western Europe petrochemical industry. In Chapter 3the different techno-economic emission reduction options for the petrochemical industry to reduceits greenhouse gas (GHG) emissions are discussed. A number of strategies (groups of optionswith similar characteristics) have been suggested in order to mitigate CO2 emissions. Chapter 4describes how the energy and materials system of the petrochemical industry is modelled. There-fore the MARKAL (MARKet ALlocation) linear programming model is discussed. With theMARKAL linear programming model the impact of carbon emission penalties is studied in thisMATTER (MATerials Technologies for greenhouse gas Emission Reduction) project. The resultsof the MATTER calculations are presented in Chapter 5. The conclusions can be found in Chap-ter 6. The main conclusions are presented underneath.
ResultsThe current petrochemical complex is based on oil and gas derived feedstocks (naphtha, gas oil,LPG, ethane, aromatic fractions). The steam cracking of these feedstocks is the basis for the pet-rochemical industry. Increasing quantities of intermediates are recovered from refineries. Afterfractionation, different components are converted into plastics, fibers, solvents, resins, detergentsand other products. Total production amounted in 1994 to 42.4 Mt products (excluding lubri-cants and energy products such as pyrolysis gasoline). Plastics and resins constitute 67% of thistotal production. The petrochemical industry consumes approximately 3 EJ final energy, 8% ofthe total Western European final energy use. This energy use is forecast to increase in the future,both in a situation without GHG policy and (even more) in a situation with GHG policies. Thestrong growth due to GHG policies can be attributed to an increased production of methanol andethanol (as fuels for the transportation sector). The production of other petrochemical products isonly to a limited extent affected by GHG policies.
The potential GHG emissions increase from approximately 250 Mt in 1990 to 370 Mt in 2030(an increase by 48%). However, the actual emissions amount only 320 Mt in 2030, of which ap-proximately 60 Mt can be attributed to the waste incineration, so the actual emission allocated tothe petrochemical industry is approximately 260 Mt. 60 Mt is related to the production of adipicacid. The remaining 200 Mt is related to the energy use in the industry and the production ofshort life petrochemical production. The petrochemical industry contributes approximately 4% tothe total Western European emission of 5100 Mt in 2030.
Until 2010, Western European industry will not be affected significantly by the GHG emissionreductions. However, beyond 2010, further emission reductions will affect the petrochemical in-dustry and iron and other industries like steel, aluminium, paper and wood etc. As a consequence,the emissions will be reduced significantly for most materials. Therefore, the emission reductionthat can be achieved through materials substitution is limited.
The changing structure of the energy supply system must also be considered. For example thechanging electricity production affects the potential for GHG emission reduction through energyrecovery from plastic waste. The market for transportation fuels will be affected by a change to-wards biofuels and electricity in the transportation sector. This will affect the availability ofnaphtha, currently a by-product of oil refining.
Nowadays the Western European petrochemical industry contributes to GHG-emission reductionthrough N2O mitigation technologies. These technologies are introduced in the production processof Adipic acid. The total contribution is approximately 60 Mt CO2 equivalents in 2030 (com-pared to the base case). Basically two main strategies can be discerned for the petrochemical in-dustry with regard to CO2 emissions related to feedstock use:• renewable feedstocks,• recycling of waste plastics.
8 ECN-C--99-052
The industry will be significantly affected by any GHG penalty. Actual emissions will declinefrom 320 Mt in the base case to 250 Mt in case of a 50 • /t CO2 penalty. This is a decline of22%, compared to a decline of 50% for the whole economy. At a penalty of 200 • /t CO2 emis-sions decline with 125 Mt, this is a decline of 61%, compared to a decline of 75% for the wholeeconomy. The 50 • /t CO2 penalty scenario should be considered as an scenario causing somepain without extreme impacts on the economical structure, while the 200 • /t penalty representsan extreme scenario. At GHG penalties of 100 • /t and more, the energy and carbon feedstockinput changes from fossil fuels to biomass.
The main GHG emission reduction strategy is feedstock substitution (65% of the GHG emissionreduction), followed by N2O emission mitigation (15%), recycling/energy recovery (10%) and in-creased materials efficiency (10%). The development of such strategies will require significantR&D efforts, but can simultaneously enhance the sustainability of this industry sector.
The integration of the refinery sector and the petrochemical industry is currently one of the strongcompetitive advantages compared with steel and paper/board industry. Significant changes can beexpected in the transportation fuels market from GHG-emission of 100• /t and higher. This willaffect the availability of naphtha, gas and gas oil. It is an important incentive to develop alterna-tive carbon sources, materials, products and product applications.
ImplicationsThe threat for industry is that these new production processes are not dependent upon the existingpetrochemical structure. Agricultural processing industries and pulp and paper industries are ex-amples of non-petrochemical sectors that make inroads into this market. Especially the pulp pro-duction has a significant resource base of 20-30 Mt ligning per year, which is an attractive sourceof cheap biomass feedstocks. The agricultural overproduction in Western Europe and the immi-nent expansion towards the east will result in a strong drive to find new applications for this agri-cultural land. It is recommended for the petrochemical industry to participate in this trend throughthe development of new production routes.
The industry has developed many new plastic waste recycling technologies during the last decade.GHG emission permit prices can increase the cost-effectiveness of these recycling strategies sig-nificantly. However, the waste plastic market has a decidedly different structure than the naphthamarket. It is recommended to develop a reliable supply structure before any activities in this fieldare developed.
Given the international character of many materials producing industries, carbon leakage1 is a se-rious threat. Policy makers are sensitive to such problems. Three scenarios can be drawn: first,industries outside Western Europe are subjected to similar emission reduction policies, second,petrochemical industry is exempted from GHG emission reduction policies, third, a system oftradable emission permits in Western Europe is developed. In the third case, industries can evenbenefit from such GHG policies, if their initial emissions are high. When the industries canachieve emission reductions at lower costs than elsewhere, they can sell permits at a profit.Looking at likely competitors, emission reductions in the United States are even more difficult toachieve than emission reductions in Western Europe. The situation for producers in the MiddleEast is not clear because it is uncertain whether these countries will participate in GHG emissionreduction schemes.
1 Carbon leakage is the replacement of industrial activities to countries with strong GHG emission reduction
policies to counties with no or weak GHG emission reduction policies.
ECN-C--99-052 9
Within Europe, the market potential in Eastern Europe and the imminent participation of thesecountries in the European Union will pose an important incentive for new production capacity inthe east. An additional advantage is that this region has sufficient land for a future agrificationstrategy.
Biomass is a renewable carbon source with a neutral CO2 balance. Basically, four routes can beconsidered how biomass can be integrated into the petrochemical complex:1. Feedstock substitution: biomass for oil and natural gas feedstocks for the production of inter-
mediates such as ethylene, butadiene, etc.2. Fermentation of biomass to ethanol and methanol.3. New bioplastics, bio-solvents etc. based on naturally occurring molecules.4. Substitution of plastics by wood products such as sawn wood, wood panels or paper.
The model calculations indicate that the first two routes seem the most attractive. A mix of py-rolysis processes and fermentation must be applied in order to achieve maximum substitution ofexisting petrochemicals. Some of these processes have been proven on a commercial scale. Forother technologies still major research is required in order to introduce them.
Recycling is the other important strategy to reduce the feedstock consumption. Current wastepolicies aim for increased incineration with energy recovery as a substitute for waste disposal.This will result in increased GHG emissions. A number of different recycling technologies areavailable and suitable for different waste qualities to produce different materials. An optimal mixfrom a GHG emission point of view consists of a mix of back-to-polymer, back-to-monomer andback-to-feedstock technologies at the expense of energy recovery technologies such as waste in-cineration. Most of these technologies have already been developed on a commercial scale. Theintroduction of a collection system seems merely a matter of process economics, which can be in-fluenced by emission permit prices.
The current IPCC emission accounting guidelines are not clear with regard to the CO2 emissionaccounting for the petrochemical industry. Different countries apply different accounting meth-ods. Such differences can give future problems because they can affect the competitive positionof national industries in a Europe-wide operating industry. International co-ordination of emissionaccounting guidelines with regard to petrochemicals is currently proceeding in the framework ofthe NEU-CO2 project that is funded by the Environment and Climate programme of the EuropeanUnion (http://www.eu.fhg.de, 1999). It is recommended that the industry participate in this proj-ect.
MATTER model calculations show that the petrochemical industry is one of the few industriesthat may actually improve its export position if GHG permit prices would be introduced. The ex-port of carbon containing petrochemical products is accounted for as carbon export. The industrycan negotiate an exemption from GHG permit prices for the non-energy use of fossil fuels. Ifbiomass is used as a feedstock, this should be considered as a net carbon storage that deserves asubsidy equal to the penalty on emissions.
10 ECN-C--99-052
1. INTRODUCTION
This report is a product of the MATTER project (MATerials Technologies for greenhouse gasEmission Reduction). This project is part of the Dutch national research programme on global airpollution and climate change (NOP-MLK). MATTER is a joint project of the Netherlands En-ergy Research foundation ECN and 4 other Dutch institutes. The MARKAL model calculationsthat are presented in this study are part of the ECN contribution to this project.
The goal of the MATTER project is the analysis of the potential contribution of materials policiesfor greenhouse gas (GHG) emission reduction. The emphasis is on techno-economic optimisation.While energy systems engineering for GHG emission reduction has received a lot of attention, lit-tle attention has been paid up till now to the potential for materials systems engineering (coveringthe life cycle of all materials in the economy).
Energy and materials systems must be analysed together because they interact. For example en-ergy is used for the industrial production of materials, the materials selection of transportationequipment influences the energy efficiency, waste materials can be used for energy recovery.
ECN has developed an integrated energy and materials systems engineering model for WesternEurope, called the MATTER model. This model covers all energy flows and material flows in theWestern European economy ‘from cradle to grave’ for the period 1990-2050. The results in thisreport are based on model version 5.0, documented on the MATTER Internet site(http://www.ecn.nl/unit_bs/etsap/markal/matter/, 1999).
The emphasis in this study is on long-term solutions. The reason for this broad time horizon isthat only significant GHG emission reduction will prevent climate change and such a goal canonly be achieved within a time frame of several decades because of the long life of the existingcapital equipment. Moreover, new technology is required to achieve a significant GHG emissionreduction. The development rate of this technology is another limiting factor. Especially thisR&D perspective may be relevant for industries.
The goal of this report is the presentation of modelling results to an industry audience. This is adifference with earlier work, which focused on the government/academic audience. The emphasisis on the model results and on the development of industry strategies, based on these results. Thedevelopment of industry strategies is made on the basis of an integrated chain management per-spective (Dutch Chemical Industry, 1991). The documentation of the model structure, input dataetc. in this report is limited. More extensive documentation can be found in a large number ofpublications and on the Internet (http://www.ecn.nl/unit_bs/etsap/markal/ matter/, 1999).
This report focuses on the petrochemical industry. It covers the production of plastics, solventsand detergents. There is a strong link between the petrochemical industry and the refining sector.The petrochemical industry nowadays gets its feedstocks from the refineries; the feedstocks con-sist of standard refinery products. Beside feedstocks refineries produce intermediates which areused in the petrochemical industry. The petrochemical industry produces pyrolyse gas oil, whichare used in the refineries. The production of fertilisers, lubricants and asphalt are excluded fromthis study, this interaction is accounted for in the results.
The method in this study to analyse and optimise GHG emission reduction is to use increasinggreenhouse gas emission penalties on petrochemical industries. This is done for analytical pur-pose, not to advocate taxation policies. The permit prices are only used to find least cost solutions
ECN-C--99-052 11
for various policy targets. The results of five cases in the MARKAL-MATTER model have beenanalysed. There is a base case that represents the business as usual situation with no penalties onCO2 emissions. The other four cases describe the impact of increasing emission permit prices (20,50, 100 and 200• /t CO2) on the systems configuration of the petrochemical industry. Althoughthe high penalties may seem rather unrealistic at the moment, they are in line with 50-75% emis-sion reduction in the next 30 years. It is assumed that the permit prices gradually grow from nopenalty in 1990 to the full penalty set in 2020 (see also Box 1).
Box 1: Interpretation of results
The analyses in this report are based on the results of the MARKAL MATTER model.They represent an approach where the whole energy and materials system ‘from cradle tograve’ is optimised at once. As a consequence, the results represent the outcome of generalpolicy approaches that choose the optimal set of options from a Western European re-gional perspective. The results do not represent the results of separate sectional policies,which can be applied independently. Note that the emission penalties, which are shown inthis report, do not represent the emission reduction costs for individual sectors. In manycases, it is more cost-effective to reduce emissions through technological change instead ofpaying the penalties. Earlier analyses have shown that for the economy as a whole, the av-erage costs represent approximately one fifth of the marginal costs (Gielen, 1999). If in-dustries get tradable emission permits and they can reduce their emissions at costs lowerthan the value of the permit (i.e. below the marginal costs of the whole economy), theymay even make a profit out of GHG emission policies.
MARKAL is a linear programming model, that minimises an objective function (i.c. total dis-counted costs) under constraints (e.g. the attainment of certain production levels, the availabilityof certain technologies, certain environmental policy constraints etc.). The economy is modelledas a system of interdependent technical processes. These process descriptions implicitly yield avery detailed input-output structure linking several hundreds of processes that are included in themodel in a dynamic perspective, covering the total life cycle for both energy and materials. Manyproducts and services can be generated through a number of alternative (sets of) processes thatfeature different costs and different GHG emissions. Process routes are selected on the bases ofcosts (a simulation of the market situation).
A discussion if emission permit prices are the most likely instrument to reduce the greenhouse gasemissions is beyond the scope of this study. In this study it is assumed that in the coming decadesactions have to be taken to reduce the GHG emissions. Whether these actions are driven throughregulation or pricing makes no difference for the energy and materials system configuration foundin this study. It merely shows what these configurations look like under serious emission reduc-tion requirements. With this information, industries can prepare themselves for possible farreaching GHG emission targets.
The following questions will be answered in this report:1. What are the relevant energy and material flows in Western Europe in the life cycle of petro-
chemical products from a GHG perspective? (Chapter 2)2. What is the relation between these flows and GHG emissions? (Chapter 2)3. Which techno-economic options exist to reduce these emissions in the next 3 decades?
(Chapter 3)4. Does it make sense from a Western European cost-effectiveness perspective to reduce these
emissions? (Chapter 5)5. How far can these emissions be reduced at acceptable costs? (Chapter 5)6. Which problems must be solved in order to achieve this emission reduction? (Chapter 6)
12 ECN-C--99-052
7. Which recommendations can be formulated for R&D and for investment decisions? (Chapter6).
ECN-C--99-052 13
2. PRESENT SITUATION
The petrochemical industry converts oil products and natural gas into petrochemicals. In thischapter an introduction of the petrochemical industry is given. The analysis includes both thefeedstock and the waste side of the life cycle of petrochemical products. In this study plasticwaste handling processes are seen as petrochemical activities. Crude oil is the feedstock for refin-eries of which the petrochemical industry feedstocks are made of. Refineries deliver oil productslike naphtha as feedstock to the petrochemical industry.
STEAM
BUTADIENE
PROPYLENE
BENZENE
ETHYLENE
FUELS
STYRENE
VCM
SBR
ABS/SAN
PROP. OXIDE
PP
PS
PE
PVC
ETH. OXIDE
1.80
7.28
3.00
-0.155.47
3.20
-0.20
-0.15
1.48
9.73
2.58
2.805.26
16.45
1.20
REFINERIES
3.00
0.60 EXPORT4.88 USE
6.10
2.20
CRACKINGNAPHTHA
GASOILLPG
35.277.582.80
ACRYLONITR.
0.91
0.15
0.31
PBD
0.55 USE
1.00 USE
3.17
TOLUENE
O-XYLENE
P-XYLENE
PHENOL
PA
0.91
0.51
PHEN. RESIN
DMT0.91 PET
1.60 1.97 USE
PHT. ANHYD.0.51
ACETONE
I-PROPANOL 0.55 USE
0.39
8.73
METHANE
METHANE METHANOL FORMALDEHYDE UF-RESINS
OTHER-2.6
MTBE
OTHER
1.3
UREA MELAMINE
AMMONIA
5.0
LUBRICANTS
BITUMEN
CARBONBLACK
16.0
3.0
0.50
0.50
PETROLEUM
1.5
13.8
NATURAL GAS
OIL
6.8
79.9
XYLENES
3.42
1.25 USE
CYCLOHEX.
N-BENZENE
1.04
0.41
BUTYLENE MEK
2.00
NGL 2.96
HYDROGEN
-0.15
-0.81 EXPORT4.09 USE
TPA1.00
0.91
CUMENE1.05
1.38
0.75 USE
-0.12 EXPORT5.36 USE
9.73 USE
0.28 USEBUTANOL0.28
OTHER0.480.58
OTHER0.50
ANILINE0.67
-0.14 EXPORT
0.64 USE
0.95
0.67
3.70
MTBE
2.09
OTHER
3.03
0.46
0.74
0.14
0.29
OTHER0.49
OTHER
1.12
ETHANOL0.29
0.45 USE
1.57 USE
M-XYLENES2.00
0.33
ACETIC ACID0.62
1.67
1.19
1.39 0.61
0.69
0.40
0.570.20 USE
OTHER4.39
CO2
3.93
9.87 EMISSION
2.96
45.65
PLASTICS
FUELS
SOLVENTS
ELASTOMERES
ELASTOMERES
ELASTOMERES
ELASTOMERES
SOLVENTS
OTHER
PLASTICS, FIBERS
PLASTICS
PLASTICS
PLASTICS
SOLVENTS
FIBERS
SOLVENTS
PLASTICS, FOAMS
DETERGENTS, OTHER
DETERGENTS,
FIBERS, PLASTICS
PLASTICS
PLASTICS
SOLVENTS
FOAM, SOLVENTS,
SOLVENTS, OTHER
OTHER
PLASTICS, FIBERS
LUBRICATION
ASPHALT
ANODES
ELASTOMERES
SOLVENTS, PLASTICS,
FUEL
RESINS
RESINS, SOLVENTS,
RESINS
FERTILISER
FUEL
SOLVENTS, PLASTICS,
OTHERS
OTHER
OTHER
OTHER
OTHER
END PRODUCTFEEDSTOCK
OTHER
1.13
OTHER
COKES
-0.12 EXPORT
2.49 USE
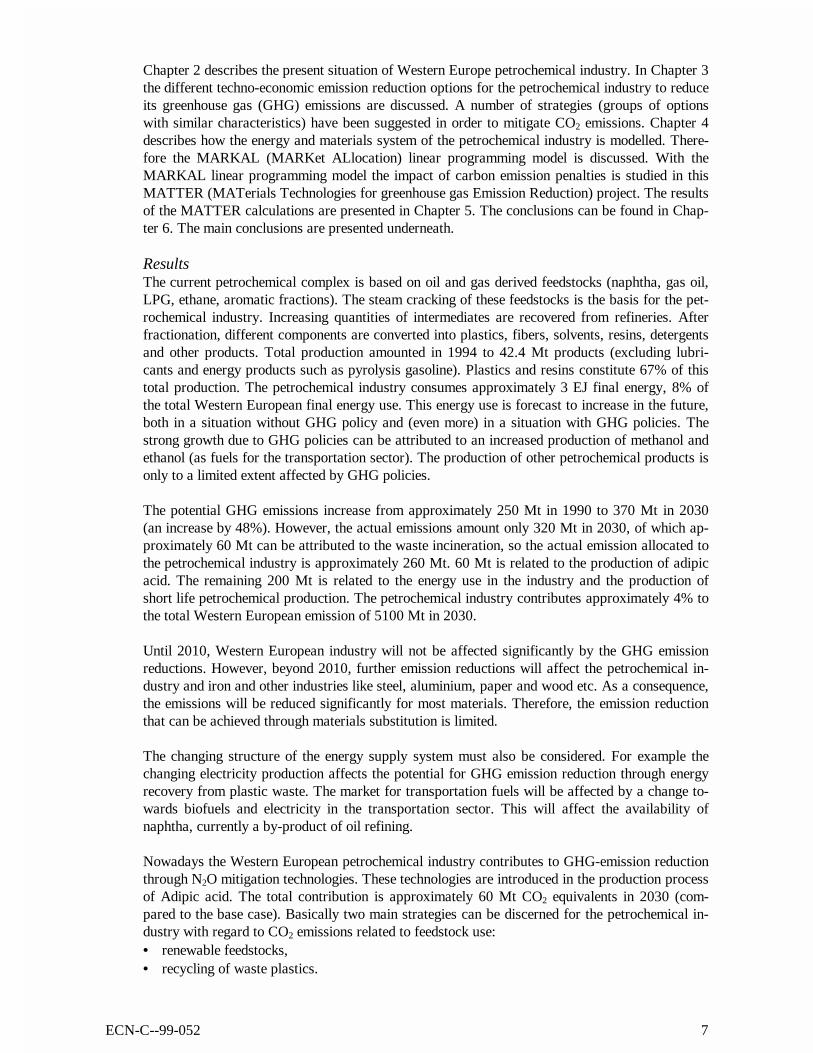
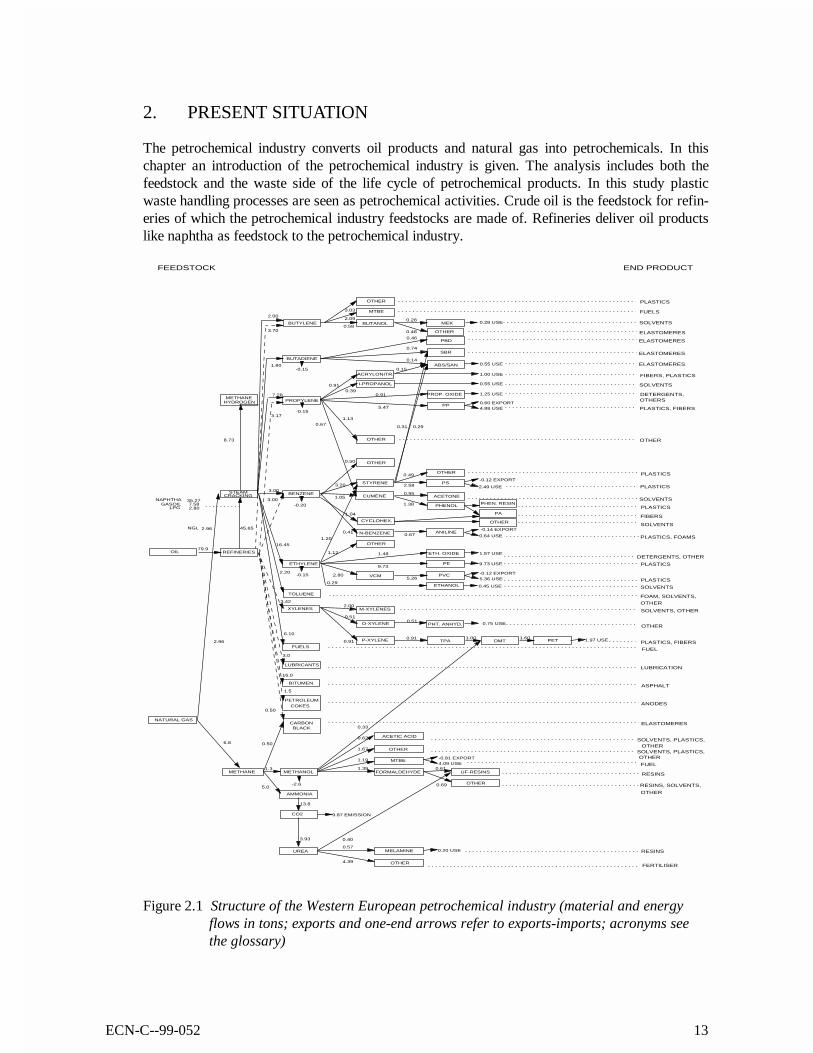
Figure 2.1 Structure of the Western European petrochemical industry (material and energyflows in tons; exports and one-end arrows refer to exports-imports; acronyms seethe glossary)
14 ECN-C--99-052
Figure 2.1 shows the energy and material flows of the supply side for the petrochemical industry.The oil input in the refineries in Figure 2.1 is the part of refinery input, which is refined to petro-chemical feedstocks or petrochemical products. The oil input for transportation fuels is excludedfrom this figure. The left side of the Figure 2.1 reports the feedstocks and the right side the endproducts. Some end products are out of the scope of this study like fuels, asphalt, anodes and fer-tilisers. These products are imputed to other economic sectors like transportation, steel industryor agriculture. Refineries and some basic petrochemical technologies convert feedstocks into in-termediates.
2.1 Feedstocks
Refineries convert crude oil into oil products part of which is used for petrochemical processing.Refineries can use different qualities of feedstock oil. Lighter crude oil types are preferred be-cause of high value end products. Returns from the petrochemical industry are also used by therefining industry. Naphtha is the main feedstock in the West-European petrochemical industry. Itis used in the basic petrochemical steam cracking process. It amounts to 35 Mt (see Figure 2.1).Naphtha consists of refinery products in the 30°C to 210°C distillation range. Gas oil is the sec-ond most important feedstock for the petrochemical steam cracking process. It amounts to 8 Mt(see Figure 2.1). Gas oil is primarily a medium distillate, distilling between 180°C and 380°C.Gas oil used as petrochemical feedstock includes also heavy gas oils that distil between 380°Cand 540°C. Liquefied Petroleum Gas (LPG) is the third most important feedstock, it amounts to 3Mt (see Figure 2.1). LPG consists of light saturated paraffinic hydrocarbons that are derivedfrom the refinery processes, crude oil stabilisation and natural gas processing plants. They consistmainly of propane (C3H8) and butane (C4H10) or a combination of the two. Ethane from naturalgas is the fourth input for the steam cracking processes. With 3 Mt its share is of the same mag-nitude as the LPG share.
2.2 Petrochemical intermediate products
Steam cracking is the key process in the petrochemical industry, producing ethylene, propylene,butylene and benzene. The bulk of the intermediates are gaseous or liquid. These intermediatesare converted into a whole range of polymers (plastics), solvents, resins, fibres, detergents, am-monia and other synthetic organic compounds. The petrochemical energy and material balances inthis study excludes urea, lubricants, bitumen, petroleum cokes and fuel products. These productsare generally not accounted for in petrochemical energy and material statistics.
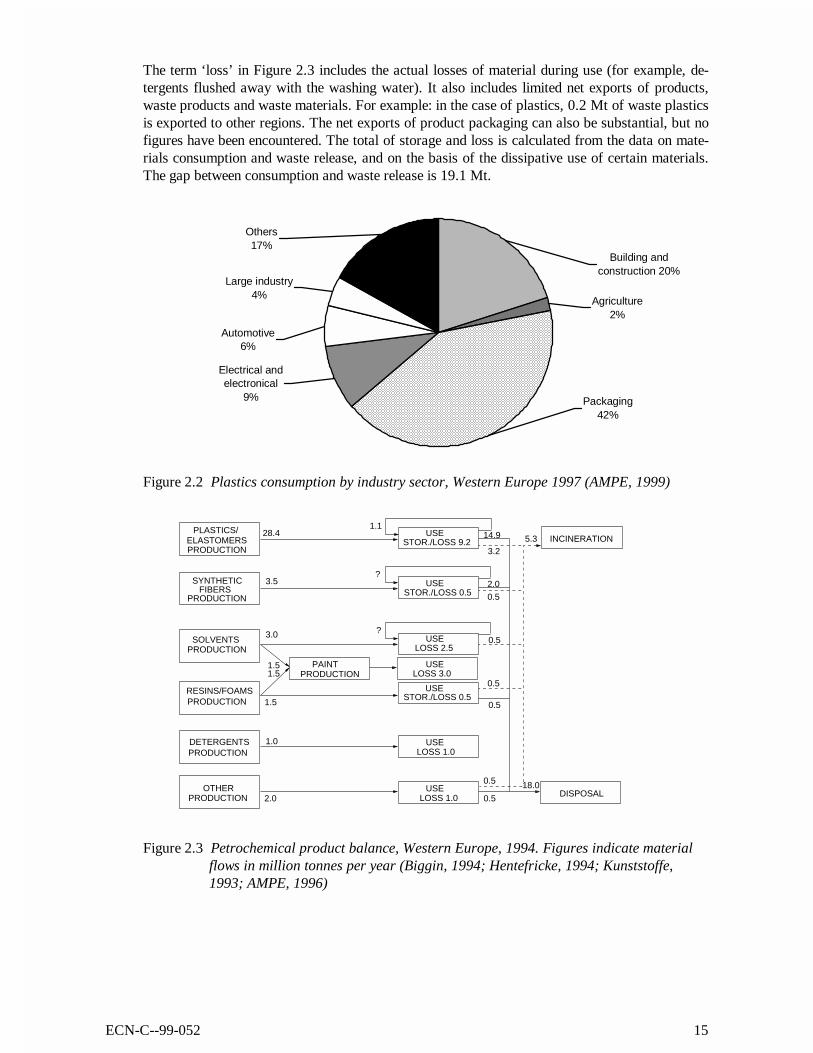
2.3 Petrochemical product applications
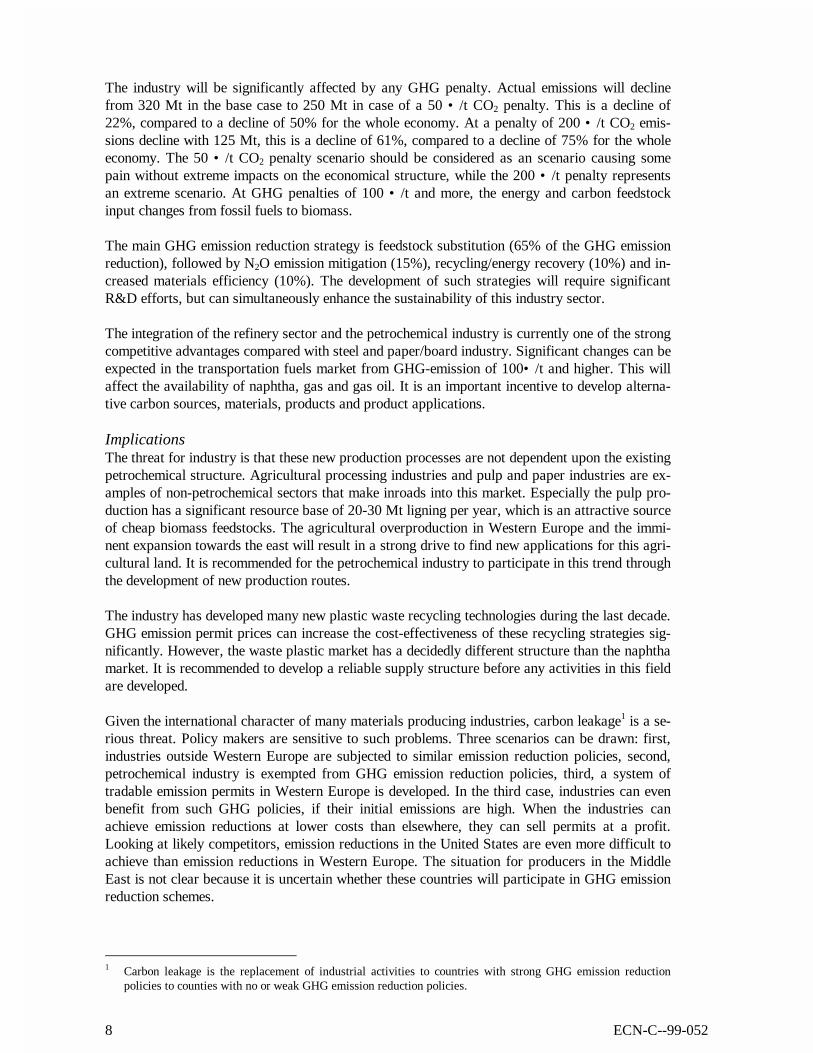
Plastics constitute the single most important category of petrochemical products. The plastics areused in several sectors. The most important application on a mass base is packaging, followed bybuilding/construction (see Figure 2.2). These two applications and rest category together con-sume almost 60% of the total Western-European plastic use.
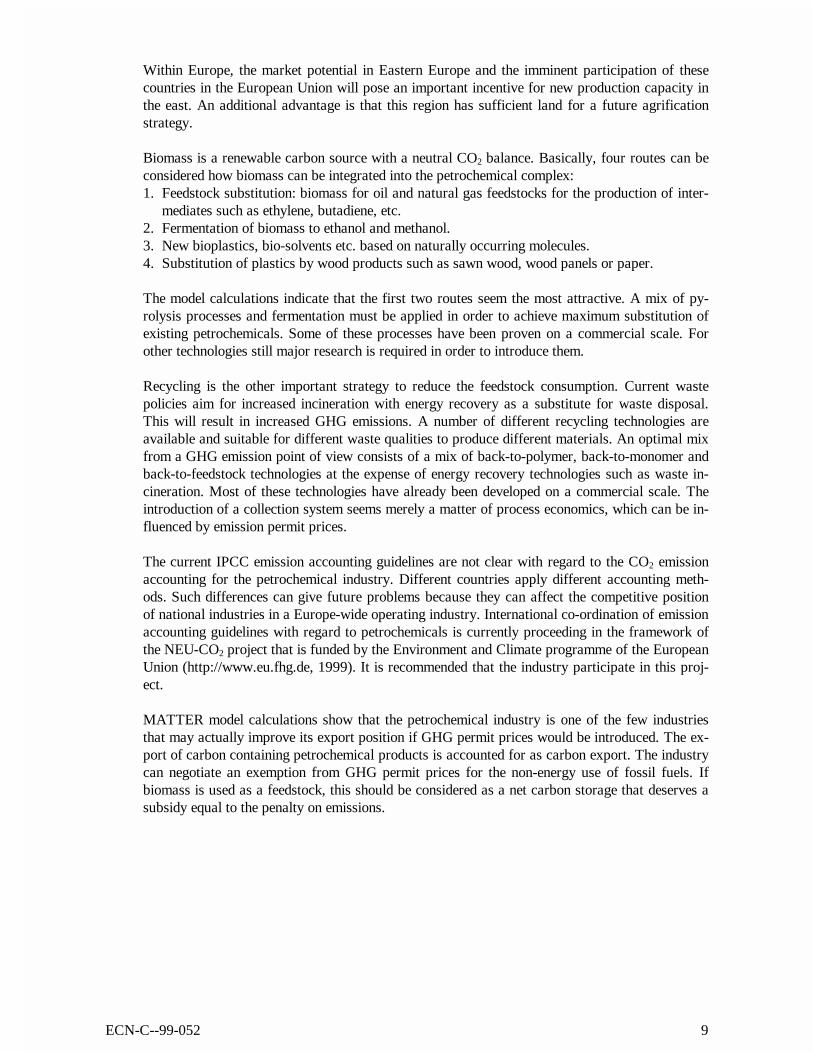
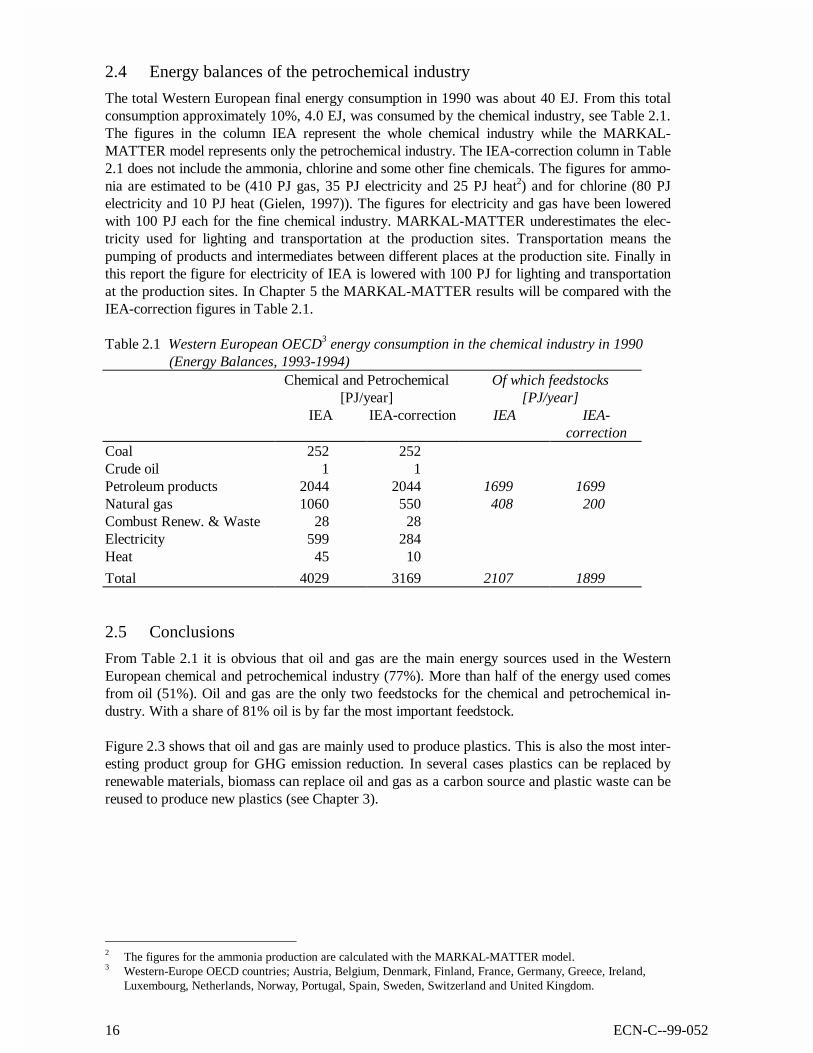
A considerable discrepancy exists between materials consumption and the release of waste mate-rials for plastics and elastomeres (see Figure 2.3). This is due to the increasing stock of materialsin products. A total of 4 Mt of plastics are stored per year in the product group ‘buildings andconstructions’ alone.
In 1994 18 Mt of the plastic waste was disposed of in landfill sites (see Figure 2.3). Some energyis recovered in waste incineration installations. 5 million tonnes of plastic waste were incinerated.Disposal results in considerable amounts of fossil carbon being stored in landfill sites.
ECN-C--99-052 15
The term ‘loss’ in Figure 2.3 includes the actual losses of material during use (for example, de-tergents flushed away with the washing water). It also includes limited net exports of products,waste products and waste materials. For example: in the case of plastics, 0.2 Mt of waste plasticsis exported to other regions. The net exports of product packaging can also be substantial, but nofigures have been encountered. The total of storage and loss is calculated from the data on mate-rials consumption and waste release, and on the basis of the dissipative use of certain materials.The gap between consumption and waste release is 19.1 Mt.
Large industry4%
Others17%
Automotive6%
Electrical and electronical
9% Packaging42%
Agriculture2%
Building and construction 20%
Figure 2.2 Plastics consumption by industry sector, Western Europe 1997 (AMPE, 1999)
PLASTICS/
SYNTHETICFIBERS
SOLVENTS
DETERGENTS
OTHER
28.4
3.5
3.0
RESINS/FOAMS1.5
PAINT
1.0
1.51.5
USESTOR./LOSS 9.2
1.1
USESTOR./LOSS 0.5
USELOSS 2.5
USELOSS 3.0
USE
USELOSS 1.0
USELOSS 1.0 DISPOSAL
INCINERATION3.2
14.9
2.0
0.5
0.5
0.5
0.5
0.52.0
0.5
STOR./LOSS 0.5
5.3
18.0
?
?
ELASTOMERSPRODUCTION
PRODUCTION
PRODUCTION
PRODUCTION
PRODUCTION
PRODUCTION
PRODUCTION
Figure 2.3 Petrochemical product balance, Western Europe, 1994. Figures indicate materialflows in million tonnes per year (Biggin, 1994; Hentefricke, 1994; Kunststoffe,1993; AMPE, 1996)
16 ECN-C--99-052
2.4 Energy balances of the petrochemical industry
The total Western European final energy consumption in 1990 was about 40 EJ. From this totalconsumption approximately 10%, 4.0 EJ, was consumed by the chemical industry, see Table 2.1.The figures in the column IEA represent the whole chemical industry while the MARKAL-MATTER model represents only the petrochemical industry. The IEA-correction column in Table2.1 does not include the ammonia, chlorine and some other fine chemicals. The figures for ammo-nia are estimated to be (410 PJ gas, 35 PJ electricity and 25 PJ heat2) and for chlorine (80 PJelectricity and 10 PJ heat (Gielen, 1997)). The figures for electricity and gas have been loweredwith 100 PJ each for the fine chemical industry. MARKAL-MATTER underestimates the elec-tricity used for lighting and transportation at the production sites. Transportation means thepumping of products and intermediates between different places at the production site. Finally inthis report the figure for electricity of IEA is lowered with 100 PJ for lighting and transportationat the production sites. In Chapter 5 the MARKAL-MATTER results will be compared with theIEA-correction figures in Table 2.1.
Table 2.1 Western European OECD3 energy consumption in the chemical industry in 1990(Energy Balances, 1993-1994)
Chemical and Petrochemical[PJ/year]
Of which feedstocks[PJ/year]
IEA IEA-correction IEA IEA-correction
Coal 252 252Crude oil 1 1Petroleum products 2044 2044 1699 1699Natural gas 1060 550 408 200Combust Renew. & Waste 28 28Electricity 599 284Heat 45 10
Total 4029 3169 2107 1899
2.5 Conclusions
From Table 2.1 it is obvious that oil and gas are the main energy sources used in the WesternEuropean chemical and petrochemical industry (77%). More than half of the energy used comesfrom oil (51%). Oil and gas are the only two feedstocks for the chemical and petrochemical in-dustry. With a share of 81% oil is by far the most important feedstock.
Figure 2.3 shows that oil and gas are mainly used to produce plastics. This is also the most inter-esting product group for GHG emission reduction. In several cases plastics can be replaced byrenewable materials, biomass can replace oil and gas as a carbon source and plastic waste can bereused to produce new plastics (see Chapter 3).
2 The figures for the ammonia production are calculated with the MARKAL-MATTER model.3 Western-Europe OECD countries; Austria, Belgium, Denmark, Finland, France, Germany, Greece, Ireland,
Luxembourg, Netherlands, Norway, Portugal, Spain, Sweden, Switzerland and United Kingdom.
ECN-C--99-052 17
3. TECHNO-ECONOMIC EMISSION REDUCTION OPTIONS
This chapter discusses possible routes for the petrochemical industry to reduce its greenhouse gas(GHG) emissions. A number of strategies (groups of options with similar characteristics) havebeen suggested in order to mitigate CO2 emissions (Bruce, Lee, Haites, 1996; Watson, Zinyow-era, Moss, 1996). For reducing other greenhouse gases the emphasis is on end-of-pipe technologyand on substitution (Beeldman et al., 1998). Each reduction option has its own point of impact inthe petrochemical industry. The following analysis is split into 4 sections:1. energy related strategies,2. feedstock substitution strategies,3. material strategies,4. reduction of N2O emissions.
3.1 Energy related GHG reduction strategies
A number of GHG emission reduction options exist in relation to CO2 emissions from energy use:1. increased energy efficiency,2. fuel substitution,3. end of pipe strategies: CO2 removal and underground storage.
The energy strategies and materials strategies are closely linked in the case of the petrochemicalindustry because most fossil fuels are used both as energy carrier and as feedstock within thesame process.
The bulk of the fossil fuels are used for feedstock purposes (see Table 2.1). As a consequence,the potential for energy related GHG emission reduction is limited. Moreover, the efficiency ofmost petrochemical processes is already comparatively high. This is especially the case for thekey steam cracking process.
Increased energy efficiencyCurrent trends in the petrochemical industry are aiming for increased efficiency based on a num-ber of different approaches:• Pinch technology.• Process integration, e.g. CHP (co-production of electricity and process steam).• New process routes based on new catalysts (e.g. gas phase polymerisation instead of high-
pressure polymerisation).• New process routes based on new technologies for material production (e.g. high temperature
steam cracking).• New separation technology (e.g. membranes, freeze/melt crystallisation).
The potential for increased energy efficiency is limited. Estimates indicate a potential of 10-20%(based on: EU DGXVII, 1997; Patel et al., 1999; Little, 1998). The data that are applied in thisstudy are based on Joosten (1998).
18 ECN-C--99-052
Fuel substitutionThe petrochemical industry applies mainly oil products and natural gas for its heating purposes.These could be substituted by renewable energy carriers or by electricity based on CO2-free en-ergy sources. These options have been considered. The most important processes are modelledseparately (e.g. production of ethylene on the basis of biomass, including biomass heating) seesection 3.4. Other energy demand is modelled as a single category (e.g. ‘low temperature heat’),where different energy carriers can be applied.
CO2 removal and underground storageBecause of the use of the carbon fraction of the oil input as a feedstock for plastics and other pet-rochemicals, the potential for CO2 removal from off-gases is limited. According to one source,CO2 could be recovered from steam crackers at a cost price of approximately 50 • per tonneCO2 (excluding transportation and storage, additionally 10• per tonne CO2) (Farla, Hendriks,Blok, 1992). The potential is in the range of 25 Mt CO2. However, no more recent source hasbeen found for this option. For this reason, it is not analysed in more detail. An interesting optionexists with regard to CO2 removal from ethylene oxide production. Per tonne of ethylene oxide,0.88 tonne of CO2 is produced as by-product. Only de-hydration and compression are necessary.The total Western European ethylene oxide production amounted to 1.6 Mt in 1992, so the po-tential for CO2 removal and storage is only 1.2 Mt CO2. This is of secondary importance for theindustry as a whole. As a consequence, it is not considered in more detail. In conclusion, the po-tential for end-of-pipe technology with regard to CO2 is limited for the petrochemical industry.More attractive is the application of end-of-pipe technology for N2O emissions in the adipic acidproduction (see Section 3.4).
3.2 Feedstock substitution strategies
Because the bulk of the fossil fuels are used as feedstock, feedstock substitution is an importantGHG emission reduction strategy. This because of the feedstock part of the fossil fuels is used toproduce products. A part of the products is incinerated after it has been used (see Figure 2.3).
Steam crackingNaphtha is the main feedstock for Western Europe steam crackers. Beside naphtha, gas oil, eth-ane and LPG are important fossil feedstocks. The steam crackers produce valuable products suchas ethylene and propylene and a C4 fraction containing buthene and butadiene. Besides valuableproducts, methane, hydrogen and fuel oil are produced which, are used as fuels for the process.Furthermore, ethane and propane are produced, which are recycled to the reactor to increase theethylene and propylene yields. Recycle streams are 67%, 14%, 5% and 4% compared to feed-stock input for ethane, LPG, naphtha and gas oil cracking respectively (Straton, Hemming, Te-per, 1983). Cracking efficiency on mass base is 85%, 65%, 56% and 48% compared to feedstockinput for ethane, LPG, naphtha and gas (Straton, Hemming, Teper, 1983; Chauvel, LeFebre,1989). Therefore, from GHG emission point of view ethane cracking is preferred.
A part of the crackers in Europe have the possibility to switch between fossil feedstocks. Themajority of these flexible crackers can either use naphtha or gas oils. Some of them can also useLPG but, due to limited LPG storage facilities, opportunities are limited (Zehnder, 1998). Flexi-ble crackers demand larger investments but have the possibility to use the feedstock which ischeapest at the moment, or which produces the current most valuable output products. This canalso be an advantage in a situation when the industry is confronted with emission restrictions.
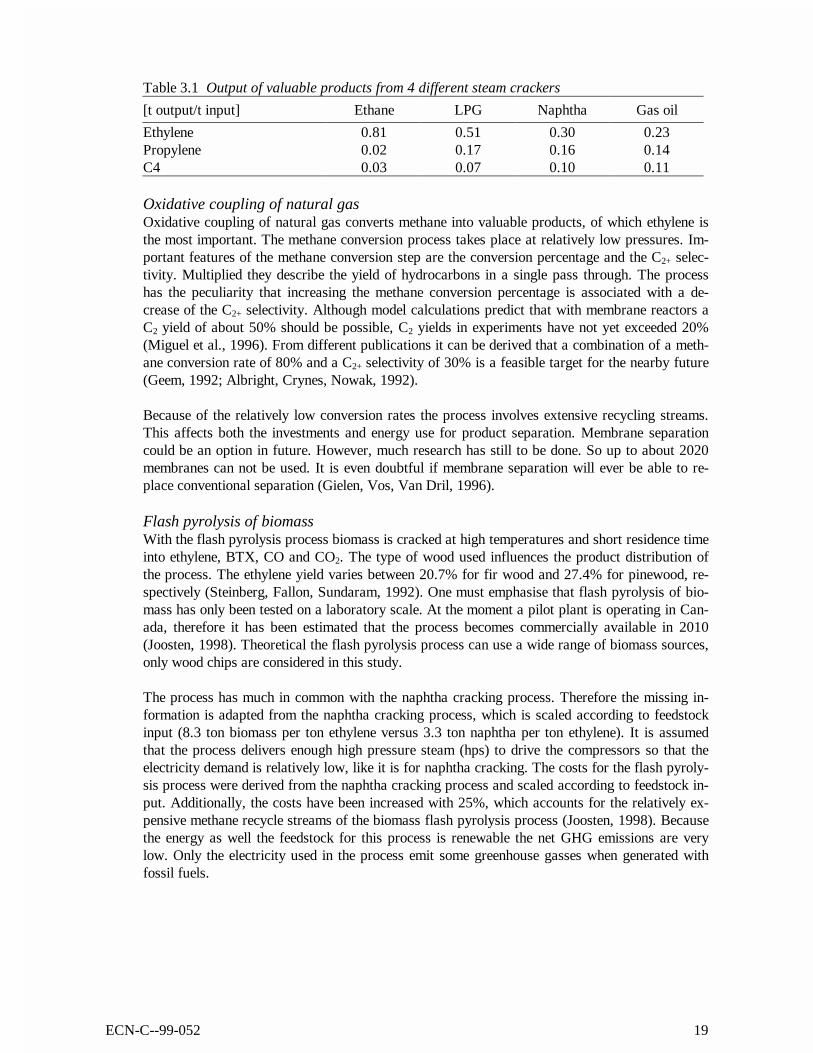
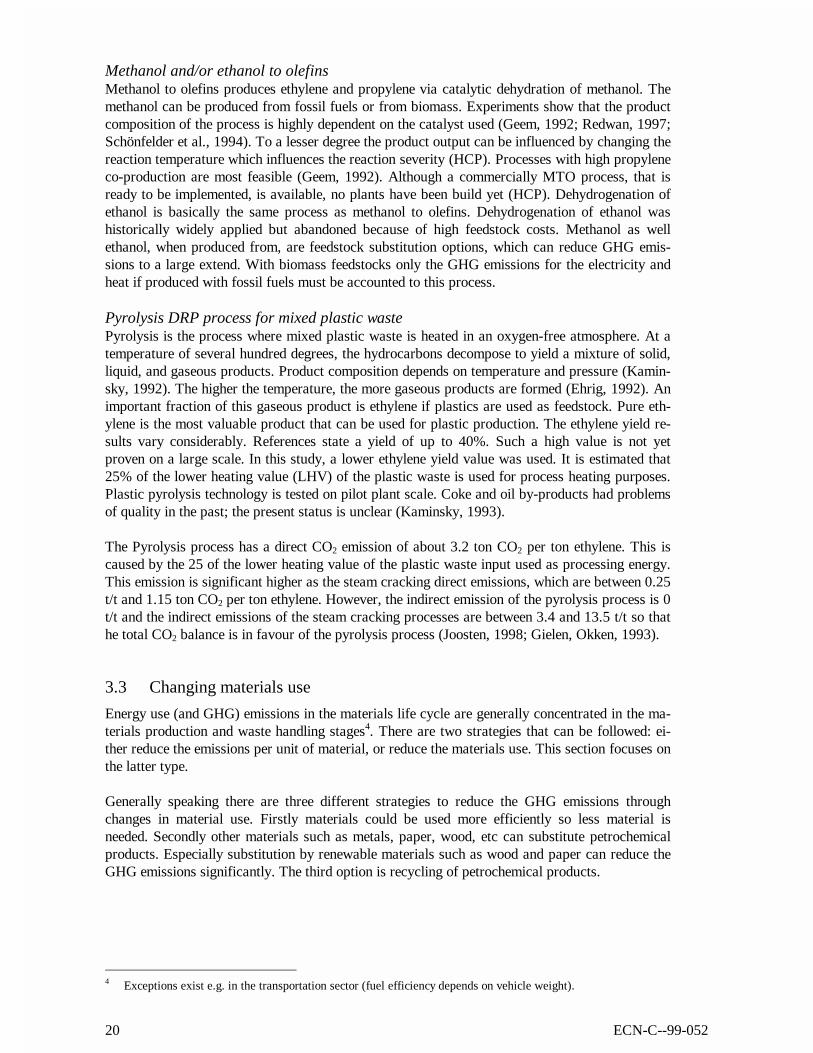
The shares of the output products depend on the feedstock type. Hitherto, ethylene has been themost valuable product followed by propylene and C4. In Table 3.1 the yields of the valuableproducts are presented (Phyllipsen, Worrell, Blok, 1995).
ECN-C--99-052 19
Table 3.1 Output of valuable products from 4 different steam crackers
[t output/t input] Ethane LPG Naphtha Gas oil
Ethylene 0.81 0.51 0.30 0.23Propylene 0.02 0.17 0.16 0.14C4 0.03 0.07 0.10 0.11
Oxidative coupling of natural gasOxidative coupling of natural gas converts methane into valuable products, of which ethylene isthe most important. The methane conversion process takes place at relatively low pressures. Im-portant features of the methane conversion step are the conversion percentage and the C2+ selec-tivity. Multiplied they describe the yield of hydrocarbons in a single pass through. The processhas the peculiarity that increasing the methane conversion percentage is associated with a de-crease of the C2+ selectivity. Although model calculations predict that with membrane reactors aC2 yield of about 50% should be possible, C2 yields in experiments have not yet exceeded 20%(Miguel et al., 1996). From different publications it can be derived that a combination of a meth-ane conversion rate of 80% and a C2+ selectivity of 30% is a feasible target for the nearby future(Geem, 1992; Albright, Crynes, Nowak, 1992).
Because of the relatively low conversion rates the process involves extensive recycling streams.This affects both the investments and energy use for product separation. Membrane separationcould be an option in future. However, much research has still to be done. So up to about 2020membranes can not be used. It is even doubtful if membrane separation will ever be able to re-place conventional separation (Gielen, Vos, Van Dril, 1996).
Flash pyrolysis of biomassWith the flash pyrolysis process biomass is cracked at high temperatures and short residence timeinto ethylene, BTX, CO and CO2. The type of wood used influences the product distribution ofthe process. The ethylene yield varies between 20.7% for fir wood and 27.4% for pinewood, re-spectively (Steinberg, Fallon, Sundaram, 1992). One must emphasise that flash pyrolysis of bio-mass has only been tested on a laboratory scale. At the moment a pilot plant is operating in Can-ada, therefore it has been estimated that the process becomes commercially available in 2010(Joosten, 1998). Theoretical the flash pyrolysis process can use a wide range of biomass sources,only wood chips are considered in this study.
The process has much in common with the naphtha cracking process. Therefore the missing in-formation is adapted from the naphtha cracking process, which is scaled according to feedstockinput (8.3 ton biomass per ton ethylene versus 3.3 ton naphtha per ton ethylene). It is assumedthat the process delivers enough high pressure steam (hps) to drive the compressors so that theelectricity demand is relatively low, like it is for naphtha cracking. The costs for the flash pyroly-sis process were derived from the naphtha cracking process and scaled according to feedstock in-put. Additionally, the costs have been increased with 25%, which accounts for the relatively ex-pensive methane recycle streams of the biomass flash pyrolysis process (Joosten, 1998). Becausethe energy as well the feedstock for this process is renewable the net GHG emissions are verylow. Only the electricity used in the process emit some greenhouse gasses when generated withfossil fuels.
20 ECN-C--99-052
Methanol and/or ethanol to olefinsMethanol to olefins produces ethylene and propylene via catalytic dehydration of methanol. Themethanol can be produced from fossil fuels or from biomass. Experiments show that the productcomposition of the process is highly dependent on the catalyst used (Geem, 1992; Redwan, 1997;Schönfelder et al., 1994). To a lesser degree the product output can be influenced by changing thereaction temperature which influences the reaction severity (HCP). Processes with high propyleneco-production are most feasible (Geem, 1992). Although a commercially MTO process, that isready to be implemented, is available, no plants have been build yet (HCP). Dehydrogenation ofethanol is basically the same process as methanol to olefins. Dehydrogenation of ethanol washistorically widely applied but abandoned because of high feedstock costs. Methanol as wellethanol, when produced from, are feedstock substitution options, which can reduce GHG emis-sions to a large extend. With biomass feedstocks only the GHG emissions for the electricity andheat if produced with fossil fuels must be accounted to this process.
Pyrolysis DRP process for mixed plastic wastePyrolysis is the process where mixed plastic waste is heated in an oxygen-free atmosphere. At atemperature of several hundred degrees, the hydrocarbons decompose to yield a mixture of solid,liquid, and gaseous products. Product composition depends on temperature and pressure (Kamin-sky, 1992). The higher the temperature, the more gaseous products are formed (Ehrig, 1992). Animportant fraction of this gaseous product is ethylene if plastics are used as feedstock. Pure eth-ylene is the most valuable product that can be used for plastic production. The ethylene yield re-sults vary considerably. References state a yield of up to 40%. Such a high value is not yetproven on a large scale. In this study, a lower ethylene yield value was used. It is estimated that25% of the lower heating value (LHV) of the plastic waste is used for process heating purposes.Plastic pyrolysis technology is tested on pilot plant scale. Coke and oil by-products had problemsof quality in the past; the present status is unclear (Kaminsky, 1993).
The Pyrolysis process has a direct CO2 emission of about 3.2 ton CO2 per ton ethylene. This iscaused by the 25 of the lower heating value of the plastic waste input used as processing energy.This emission is significant higher as the steam cracking direct emissions, which are between 0.25t/t and 1.15 ton CO2 per ton ethylene. However, the indirect emission of the pyrolysis process is 0t/t and the indirect emissions of the steam cracking processes are between 3.4 and 13.5 t/t so thathe total CO2 balance is in favour of the pyrolysis process (Joosten, 1998; Gielen, Okken, 1993).
3.3 Changing materials use
Energy use (and GHG) emissions in the materials life cycle are generally concentrated in the ma-terials production and waste handling stages4. There are two strategies that can be followed: ei-ther reduce the emissions per unit of material, or reduce the materials use. This section focuses onthe latter type.
Generally speaking there are three different strategies to reduce the GHG emissions throughchanges in material use. Firstly materials could be used more efficiently so less material isneeded. Secondly other materials such as metals, paper, wood, etc can substitute petrochemicalproducts. Especially substitution by renewable materials such as wood and paper can reduce theGHG emissions significantly. The third option is recycling of petrochemical products.
4 Exceptions exist e.g. in the transportation sector (fuel efficiency depends on vehicle weight).
ECN-C--99-052 21
However, caution must be exercised when following this generic guideline. Higher GHG emis-sions during primary materials production may also be offset by GHG emission reductions in thewaste stage, e.g. because of recycling. If a certain option affects several of the product life cyclestages by increasing emissions in one part of the life cycle and decreasing emissions in the otherpart, a life cycle analysis approach is required for proper assessment. If flows of energy and ma-terials are exchanged between the life cycle of the individual material/product and the other partsof the energy and materials system, a systems approach is required for proper assessment.
As a consequence of this complexity, design rules can only be used to develop ideas. There is noinitial preference for specific design strategies. Design for Environment (DFE) emphasises theimportance of an increased product life. Options such as increased reliability/durability, easiermaintenance/repair, modular structures, classic design or a strong product/user relation are men-tioned. The assessment of these options requires extensive design knowledge and this is onlyavailable at the very detailed product level. Moreover, classic design and a strong product/userrelation are considered to be options that influence the production performance. Consequently, theassessment of their potential requires a social sciences approach, beyond the scope of this techno-economic optimisation.
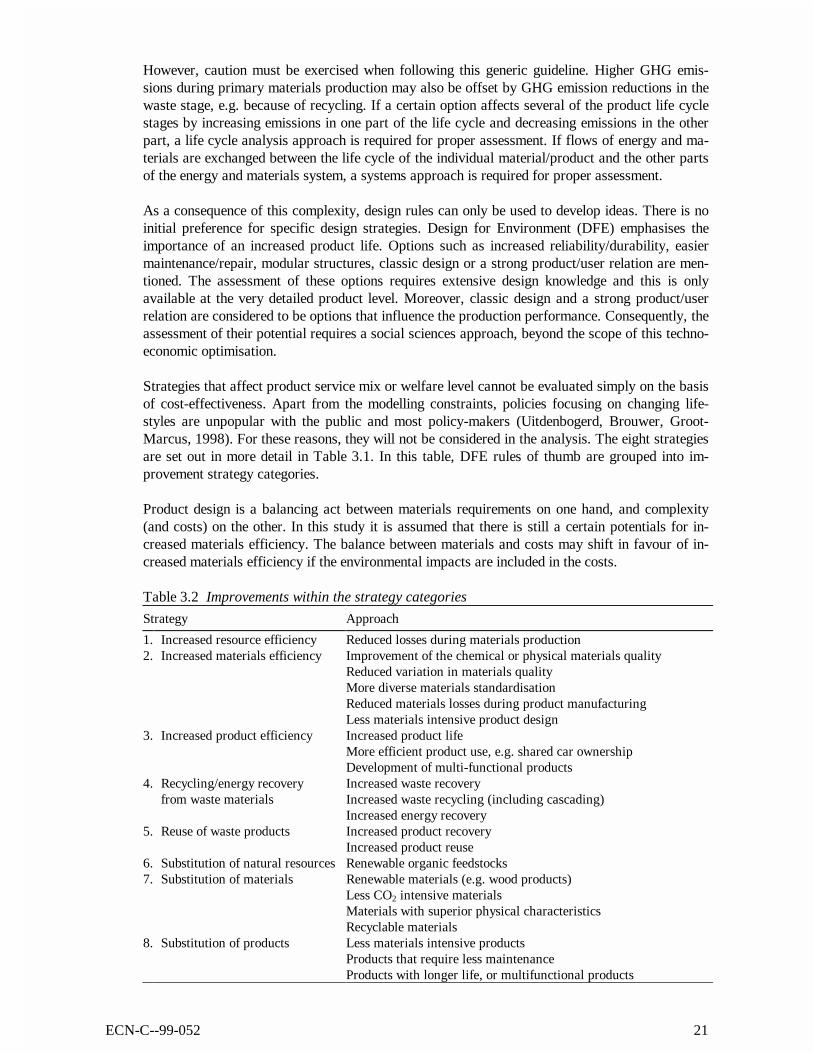
Strategies that affect product service mix or welfare level cannot be evaluated simply on the basisof cost-effectiveness. Apart from the modelling constraints, policies focusing on changing life-styles are unpopular with the public and most policy-makers (Uitdenbogerd, Brouwer, Groot-Marcus, 1998). For these reasons, they will not be considered in the analysis. The eight strategiesare set out in more detail in Table 3.1. In this table, DFE rules of thumb are grouped into im-provement strategy categories.
Product design is a balancing act between materials requirements on one hand, and complexity(and costs) on the other. In this study it is assumed that there is still a certain potentials for in-creased materials efficiency. The balance between materials and costs may shift in favour of in-creased materials efficiency if the environmental impacts are included in the costs.
Table 3.2 Improvements within the strategy categories
Strategy Approach
1. Increased resource efficiency Reduced losses during materials production2. Increased materials efficiency Improvement of the chemical or physical materials quality
Reduced variation in materials qualityMore diverse materials standardisationReduced materials losses during product manufacturingLess materials intensive product design
3. Increased product efficiency Increased product lifeMore efficient product use, e.g. shared car ownershipDevelopment of multi-functional products
4. Recycling/energy recovery Increased waste recoveryfrom waste materials Increased waste recycling (including cascading)
Increased energy recovery5. Reuse of waste products Increased product recovery
Increased product reuse6. Substitution of natural resources Renewable organic feedstocks7. Substitution of materials Renewable materials (e.g. wood products)
Less CO2 intensive materialsMaterials with superior physical characteristicsRecyclable materials
8. Substitution of products Less materials intensive productsProducts that require less maintenanceProducts with longer life, or multifunctional products
22 ECN-C--99-052
The minimum amount of material for a design is not only determined by the materials properties,but also by the processing equipment: what size can be processed, which shapes can be manu-factured. These limitations are especially relevant for the short-term improvement potential, butless relevant on the long term, because equipment must be replaced anyway.
Many products, especially those manufactured in small series, are not engineered for minimummaterials consumption. Rules of thumb, or trial and error procedures, are in such cases used todetermine the minimum amount of material. Examples show that significant savings can still beachieved. Input data for products are discussed in (McKeever, Anderson, 1988; Brezet, Van He-mel, 1997; Philips, 1992).
Three strategies (1, 2 and 3) from Table 3.2 will not be discussed in this report. These efficiencystrategies are complex issues that require a detailed discussion, and such a discussion is beyondthe scope of this study. For more information about the MARKAL-MATTER model see AnnexA, or the MARKAL-MATTER Internet site (http://www.ecn.nl/ unit_bs/etsap/ markal/matter/,1999). Strategy 6 is already been discussed. Strategies 4 and 5 have partly been discussed inparagraph 3.2 but get more attention in this paragraph. The strategies 7 and 8 are the strategieson which the MARKAL-MATTER models focuses. Strategy 7 includes switch from plastics towood or to plastics from renewable feedstock. Also plastics which are recyclable belong to thisgroup. Strategy 8 includes options like thinner materials with the same strength or materials thatfulfil the needs of the traditional material with less maintenance. If some kind of carbon emissionpenalty is set the strategies 7 and 8 can become important for the petrochemical industry.
This paragraph focuses further on a number of recycling techniques because a number of newplastic waste recycling technologies have been developed in the last decade, especially in Ger-many because of the packaging legislation that specifies certain recycling rates. Eight types ofplastic waste management options are modelled, each capable of handling a certain waste quality.The eight types are; re-extrusion, solvent separation, pyrolysis DRP process (see Paragraph 3.2),Hydrogenation VEBA process, plastic waste injection in blast furnaces, plastic waste incinerationin cement kilns, grate firing and disposal. Also a separation in three different plastic waste typesis made, clean plastic waste (CPW), mixed plastic waste (MPW) and plastics in municipal solidwaste (MSW). Clean plastic waste can be processed with technologies that require low qualitywaste inputs (e.g. incineration), but the other way around is impossible without an upgrading ef-fort. Every upgrading technology has energy input so that the overall recycling efficiency de-clines. Only re-extrusion is suitable for CPW, a large group of solvent separation, pyrolysis, hy-drogenation, blast furnaces and cement kilns are capable of MPW processing. Grate firing anddisposal are suitable for plastics in MSW. Clean Plastic waste is called High Quality Waste inFigure 3.1, which shows the different plastic waste management strategies.

ECN-C--99-052 23
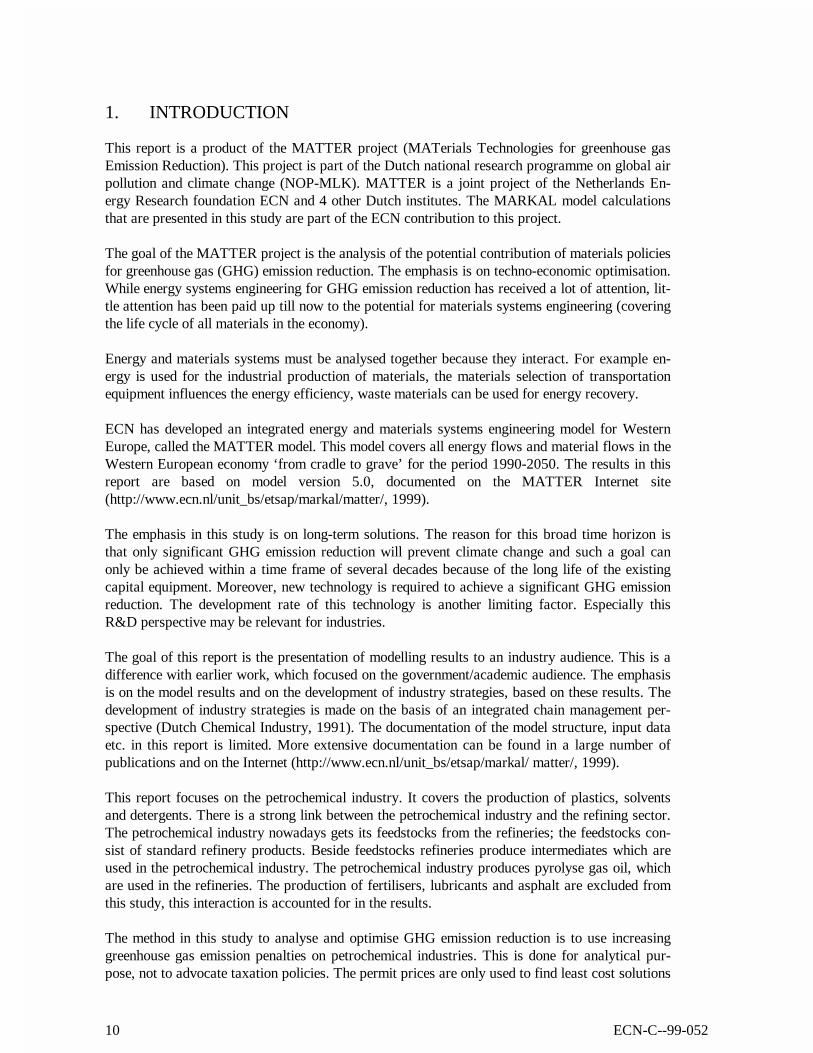
Figure 3.1 Model structure for polyethylene, the most important plastic type
Figure 3.1 shows a waste cascade for plastics. Three types of plastic waste are modelled. Thefirst one is clean plastic waste, representing pure plastics that can be re-extruded to yield poly-mers. The second type is mixed plastic waste. Mixed plastics, e.g. shredder residues, can only berecycled to high-grade polymers after separation. The third type is plastic in municipal solidwaste, e.g. food packaging. Grate incineration and disposal are options for treatment of this wastestream. The upgrading process is modelled by ‘dummy’ processes, which convert clean plasticwaste into mixed plastic waste and mixed plastic waste into plastics in municipal solid waste.Upgrading is modelled as a sorting process that converts plastics in municipal solid waste into‘mixed plastic waste’. The cost for this sorting process is based on the German DSD (DualesSystem Deutschland).
Re-extrusionRe-extrusion technology is only applicable for clean plastic waste types. The plastic is groundand extruded. The material output quality depends to a large extent on the waste input quality,additives can improve the output quality (Menges, Michaeli, Bittner, 1992; Ehrig, 1992). Ifmixed plastics are used as input, the resulting material will only be suitable for a limited numberof applications. Re-extrusion recycles the plastics to the production process. In the productionprocess new plastic products are made from a mixture of new and recycled plastic. The net GHGemissions are lower for the re-extrusion process. This is caused by the emission effect of thesaved fossil feedstocks, which are larger than the extra GHG emissions due to the extra energyneeded for this process.
ETHYLENE
POLYMERISATION
POLYETHYLENE
PRODUCTS
HQ WASTE
PYROLYSIS DRP COKE
OIL
ELECTRICITY
MIXED PLASTIC
PLASTICSSORTING
HYDROGENATION VEBA
BLAST FURNACES
CEMENT KILNS
INCINERATION
DISPOSAL
RE-EXTRUSION
SOLVENT SEPARATION
DISPOSAL
PACKAGINGSVEHICLES
BUILDINGSOTHERUSE
PRODUCTION
WASTE HANDLING
COMPETINGMATERIALS/PRODUCTS ASSEMBLY
CRACKING
ETHANE
CRACKING
GAS OIL
CRACKING
NAPHTHA
CRACKING
LPG
MTO
METHANOL
OX. COUPLING
GAS
FLASH PYROLYSIS
BIOMASS
FCC OFFGASSES
CRUDE OIL
DEHYDROGENATION
ETHANOL
WASTE
IN MSW

24 ECN-C--99-052
Solvent separationThis process is based on the difference in solvability of plastics in organic solvents. The processuses selective dissolution at increasing temperatures and flash devolatilisation to separate mixedplastics into component polymers with pigments and fillers predominantly removed. The processhas been developed on a pilot plant scale, it is uncertain what results will be achieved on indus-trial plant scale (Visalli, 1992; Schurr, Schneider, 1998).
Hydrogenation VEBA processMixed plastic waste can be treated with hydrogen to produce feedstock such as a naphtha-likeproduct and a hydrogenation residue that can be used in coke production. A pilot plant has beenset up in Germany and the construction of a large-scale plant is scheduled. The technology can becharacterised as a thermal hydrocracking/hydrogenation process. The reactions take place in aliquid phase reactor and a gas phase reactor at temperatures of 400-450°C and a pressure of upto 250 bar. The main problem at present is the feeding of plastics into the reactor. Data for hy-drogen consumption are still uncertain, but they would seem to be significantly higher (as mightbe expected on the basis of the plastics chemical structure) (Niemann, Wenzel, 1993).
Blast furnacesPlastic waste is injected in blast furnaces to serve as reduction agent for absorbing oxygen fromironoxide. Normally, heavy oil is used for this purpose. By injection of plastic waste, a part of theheavy oil is saved (Patel, 1996). It is disputable whether the process has to be regarded as mate-rial substitution or not. Heavy oil or plastic waste injection does not primarily aim at combustionfor heat production, but at obtaining a chemical reaction in which the reduction agent is materi-ally involved. Therefore, in this study this process is considered as material recycling. Mixedplastic waste injection into blast furnaces is currently practised on pilot plant scale in Germany(Janz, 1996; Lindenberg et al., 1996). Cost data have not been encountered. Because the addi-tional equipment is similar to the equipment for incineration in cement kilns, the same cost datahave been used.
Plastic waste incineration in cement kilnsIncineration of waste types in cement kilns is widely spread over the whole of Europe. Mixedplastic waste incineration in cement kilns was developed in Italy. The application of plastic wasterequires special waste injection equipment due to its low weight. Investment costs for storage,transportation, and injection equipment is approximately 40• /t plastic waste capacity. Cost oflabour, etc., is an additional 10• /t (Knopf, 1995).
Grate firing (municipal solid waste)Current grate firing systems achieve an efficiency of 20-22%. Higher efficiencies are possible ifthe incineration plant is coupled to combined cycle power plants. Low temperature steam fromthe incineration plant is further heated in the power plant and subsequently used in a steam tur-bine. Such combined plants can achieve an efficiency of 28% for the incineration part. One suchplant has been built in the Netherlands and is currently operating (Van der Knijff, 1995).
Disposal (municipal solid waste)Disposal costs are largely determined by government intervention. There are large differencesfrom one country to another. It is expected that disposal in landfills will become increasingly dif-ficult. This study assumes that disposal costs will increase from 50• /t in 1990 to 150• /t in2010. After 2010 the disposal costs will subsequently increase to 200• /t in 2040. Products canalso be seen as a way of disposal. This is because the carbon in the products is fixed and won’tbe emitted to the atmosphere in short or long time. Therefore the carbon in plastic products canbe seen as being disposed.
ECN-C--99-052 25
The advantage of recycling technologies from a GHG emission point of view depends on the ref-erence technology (incineration or disposal) (Gielen, Okken, 1993; 1994). The main saving is thefeedstock energy of the plastics, which constitutes two thirds of the energy input into primaryplastics production. If only renewable feedstocks are used in plastic production, the GHG emis-sion reduction effect from recycling becomes negligible.
3.4 Reduction of industrial N2O emissions
Western-European adipic acid production amounted in 1992 to 650 kt (Weissermel, 1994).Adipic acid is produced in 10-20 industrial plants. Adipic acid is an intermediate in the produc-tion of nylon 6.6. Its chemical structure is COOH(CH2)4COOH. It is produced from cyclohexanethat is converted into a mixture of cyclohexanol and cyclohexenone by catalytic oxidation. Themixture is catalytically converted into adipic acid. Two catalyst systems are applied. One usesHNO3, the other one uses oxygen. In the system that uses HNO3, significant amounts of N2O aregenerated as by-product. The N2O- concentration in the off-gases is 20 volume % (Weissermel,1994; Ayres, 1996). In 1998 ca. 2 million tons of adipic acid is produced. The manufacture ofadipic acid also results in the production of offgases containing ca. 0.3 ton of nitrous oxide perton of adipic acid (equivalent to 90 t CO2/t) (Chemical Week, 1999; Castellan et al., 1991). From1991 the major producers of adipic acid start to develop and implement technologies to reduceN2O emissions. In 1990 the emissions for Western Europe equals 40 - 60 Mtons CO2 equivalents.If oxygen is used, no N2O is produced. However, this new process is not yet widely applied.Other new process routes start from butadiene. In conclusion, alternative process routes can onthe long term easily reduce the N2O emissions in adipic acid production.
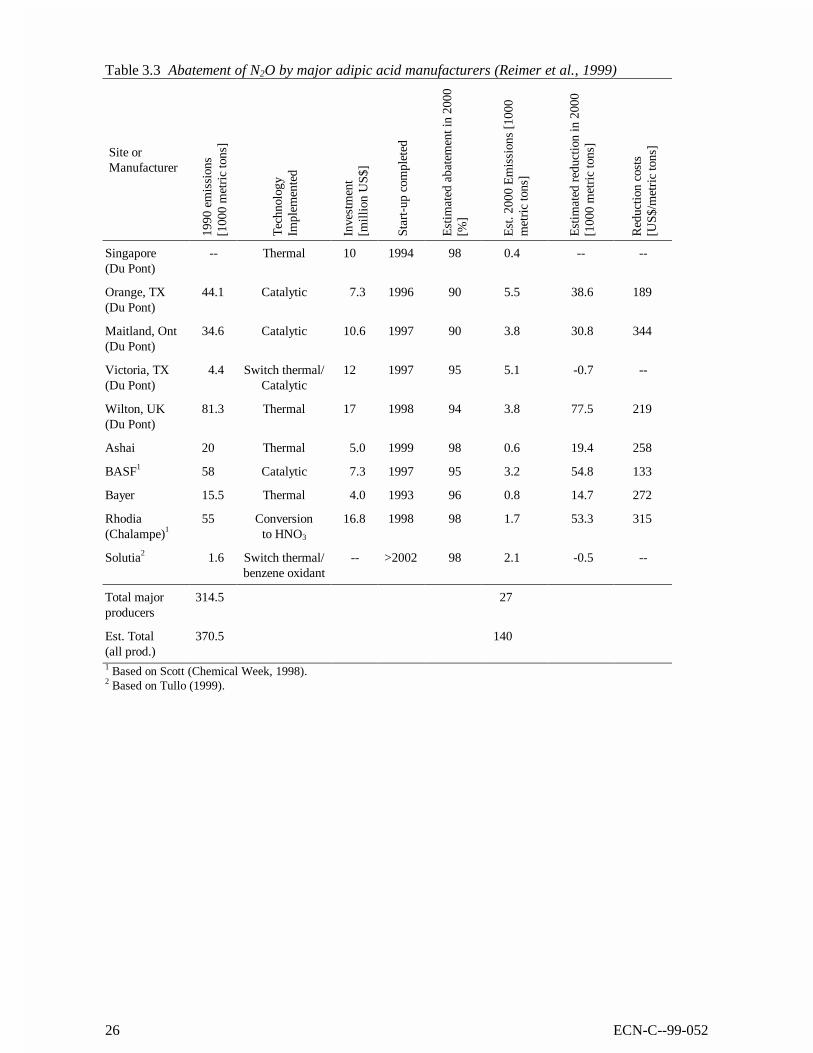
In conclusion, removal of N2O in exhaust gases poses the most attractive alternative. In 1999N2O abatement facilities are now operating at nearly all sites of the major adipic acid producers5.The industry is using three different technologies; advanced thermal destruction, catalytic de-struction and conversion of N2O to nitric acid, see Table 3.3. All technologies have demonstratedthe capability to very efficiently abate N2O emissions, 90 - 98% emission reductions. Technologychoice is a matter determined by individual sit economics. Based on Table 3.3 emission reductioncosts are below 1• /t CO2 equivalents (Gielen et al., 1998).
5
Although in 1999 nearly all adipic acid producing sites are operating N2O abatement facilities, the Base Case in2030 still emits 50 Mt CO2 equivalent/year N2O. In reality the N2O emissions will probably decline sharp from2000 onwards. The newest N2O abatement technologies are not modelled in the MARKAL-MATTER causelack of data in the period constructing the model.
26 ECN-C--99-052
Table 3.3 Abatement of N2O by major adipic acid manufacturers (Reimer et al., 1999)
Site orManufacturer
1990
em
issi
ons
[100
0 m
etri
c to
ns]
Tec
hnol
ogy
Impl
emen
ted
Inve
stm
ent
[mill
ion
US$
]
Star
t-up
com
plet
ed
Est
imat
ed a
bate
men
t in
2000
[%]
Est
. 200
0 E
mis
sion
s [1
000
met
ric
tons
]
Est
imat
ed r
educ
tion
in 2
000
[100
0 m
etri
c to
ns]
Red
uctio
n co
sts
[US$
/met
ric
tons
]
Singapore(Du Pont)
-- Thermal 10 1994 98 0.4 -- --
Orange, TX(Du Pont)
44.1 Catalytic 7.3 1996 90 5.5 38.6 189
Maitland, Ont(Du Pont)
34.6 Catalytic 10.6 1997 90 3.8 30.8 344
Victoria, TX(Du Pont)
4.4 Switch thermal/Catalytic
12 1997 95 5.1 -0.7 --
Wilton, UK(Du Pont)
81.3 Thermal 17 1998 94 3.8 77.5 219
Ashai 20 Thermal 5.0 1999 98 0.6 19.4 258
BASF1 58 Catalytic 7.3 1997 95 3.2 54.8 133
Bayer 15.5 Thermal 4.0 1993 96 0.8 14.7 272
Rhodia(Chalampe)1
55 Conversionto HNO3
16.8 1998 98 1.7 53.3 315
Solutia2 1.6 Switch thermal/benzene oxidant
-- >2002 98 2.1 -0.5 --
Total majorproducers
314.5 27
Est. Total(all prod.)
370.5 140
1 Based on Scott (Chemical Week, 1998).2 Based on Tullo (1999).
ECN-C--99-052 27
4. MODELING THE ENERGY AND MATERIALS SYSTEM
4.1 The MARKAL model
The MARKAL linear programming model is a representation of (part of) the economy of a re-gion. The economy is modelled as a system, represented by processes and physical and monetaryflows between these processes. These processes represent all activities that are necessary to pro-vide products and services. Many products and services can be generated through a number ofalternative (chains of) processes. The model contains a database of several hundred processes,covering the whole life cycle for both energy and materials. The model calculates the least-costsystem configuration that meets certain energy, materials and product demand. This system con-figuration is characterised by process capacities, activities and flows.
Processes and model constraints are input data that must be provided by the model user. Con-straints are determined by the maximum introduction rate of new processes, the availability ofresources, environmental policy goals, etceteras (Gielen, 1998).
Processes are characterised by their physical inputs and outputs of energy and materials, by theircosts, and by their environmental impacts. From the GHG emission, carbon dioxide, methane,nitrous oxide and perfluorcarbons are considered. Waste volumes and land requirements are otherenvironmental impacts that are considered. Emissions are accounted for in physical units. Emis-sions are valued in financial terms on the basis of a CO2-equivalent penalty level, which is set bythe model user. Upstream emissions are in the MARKAL methodology transferred in the processchain through the increased prices (or marginal costs) of energy, materials and products. AnnexA gives a more detailed description of the MARKAL model.
4.2 MATTER: Western European MARKAL
Approximately one third of all greenhouse gases emissions can be attributed to the materials sys-tem. Changes in material flows can influence the GHG emissions significantly. The WesternEuropean MARKAL-MATTER model6 has been developed within the MATTER project (Mate-rials Technologies for GHG Emission Reduction) in order to study these strategies in more detail.The model covers more than 25 energy carriers and 125 materials. More than 50 products repre-sent the applications of these materials and 30 categories of waste materials are modelled.
This study focuses on the petrochemical industry in Western European because this sector can beseen as a closed system. The import and export flows are small compared to the total amount ofpetrochemical products used in Western Europe. Policy by governments or the industry its selfare relatively unaffected by developments in other parts of the world.
Improvement options in the energy system are considered simultaneously with the material systemsolutions. Integrated assessment of improvements in the energy system and the materials systemis important because different reduction strategies influence each other’s efficiency. For exampleif the reference electricity production becomes less CO2 intensive, electricity production in wasteincineration plants becomes a less attractive option. As a consequence of such interactions, theassessment of the potential and the cost-effectiveness of reduction strategies require an integrated
6 Western-Europe are the OECD countries; Austria, Belgium, Denmark, Finland, France, Germany, Greece, Ire-
land, Luxembourg, Netherlands, Norway, Portugal, Spain, Sweden, Switzerland and United Kingdom.
28 ECN-C--99-052
system approach. Apart from the slow capital replacement rate, a dynamic approach is requiredbecause of the time lag between materials consumption and waste release beyond the product life.For example, changing materials consumption in one year can influence the recycling potential infuture years. Moreover, GHG emission reduction will take decades because the remaining life ofstanding capital equipment must be considered. Changing technology, changing consumptionpatterns, changing resource prices and changing environmental policy goals are other issues thatmust be considered in a dynamic analysis. Annex A gives more information about the MATTERmodels that have been developed and the MARKAL-MATTER model which, is used for thisstudy.
4.3 Materials and waste materials selection
The selection of materials is based on the analysis in (van Duin, 1997; Gielen, 1998). The selec-tion covers all key groups of materials from a GHG emission point of view: ceramic materials,inorganic materials, metals, natural organic materials, plastics and other synthetic organic mate-rials. These groups of materials are further disagregated in this analysis. A list of materials thatare separately modelled is shown in Table B.9 in Annex B. Also a list of all waste materials isprovided in Table B.8 in Annex B.
The level of detail for materials and products is to a large extent determined by their relevancefrom a GHG-emission point of view. The general rule that has been applied is that all materialflows with an upstream GHG emission that equals at least 0.1% of the total Western EuropeanGHG emission are separately modelled (which corresponds to approximately 5 Mt CO2 equiva-lents per year). A material flow or product group is further based on the uniformity of the pro-duction processes, the uniformity of the applications and the availability of statistical data re-garding material flows.
From a CO2 emission point of view, the energy intensity has been used as an important indicatorfor the selection process. From a CH4 emission point of view, the natural organic materials (paperand board, wood products, other natural fibres) deserve special attention because of CH4 forma-tion during their decomposition in landfill sites. Regarding N2O, industrial production processesof nitric acid, Adipic acid and Caprolactam have been modelled separately. Finally PFC emis-sions related to primary aluminium smelting have been considered.
In Table B.9 in Annex B a list of all waste materials that are separately modelled in MARKAL-MATTER is shown. Three types of materials from Annex B have no waste material equivalent.First, intermediates have no waste equivalent (see Table B.6 in Annex B). Second, some materialsare consumed or dissipated during their use phase. Examples of such materials are fertilisers. Athird group consists of waste materials that are irrelevant from a GHG emission point of view,because they can neither be recycled (with significant GHG benefits) or be used for energy recov-ery. For example, used concrete is not separately modelled. Its recycling as concrete filler is notrelevant from a GHG emission point of view. Its disposal has been accounted for through a dis-posal fee.
Several waste material qualities have been modelled if the quality of the waste material limits therecycling potential. The waste quality depends on the product category for which the material isapplied. For example the bulk of plastic packaging ends up in Municipal Solid Waste (MSW).The technological potential and the economics of plastic waste recycling are highly dependent onthe quality of the waste flow.
ECN-C--99-052 29
The modelled waste materials are characterised by their fixed chemical composition, Clean poly-styrene waste, clean polythene waste etceteras. Instead of modelling aggregated waste streamssuch as household waste, shedder waste, demolition waste etceteras. This approach providessome insight into the changing waste flow composition. Especially over a period of decades thecomposition will change significantly. As a consequence, its potential for energy recovery and forrecycling will change also. The waste material approach with different waste qualities allowsmodelling of waste cascades. An example of a cascade within the model is shown in Figure 3.1 inthe previous chapter.
30 ECN-C--99-052
5. RESULTS: THE IMPACT OF GHG POLICIES
5.1 Refineries
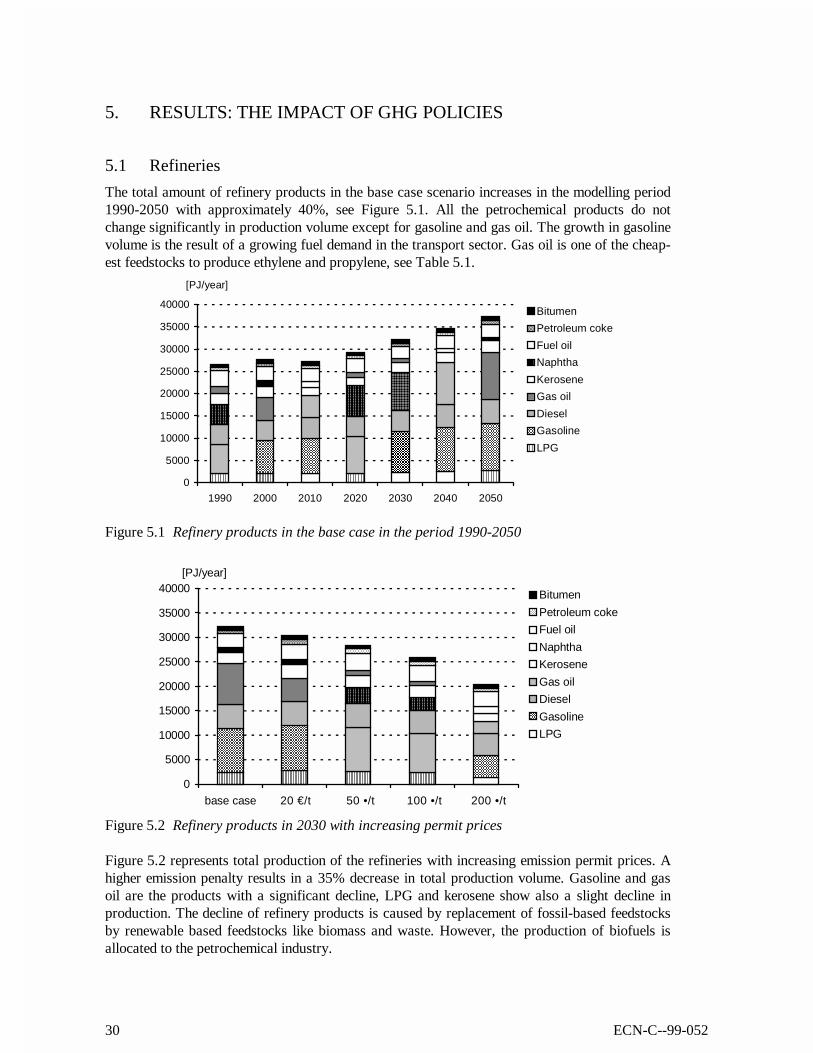
The total amount of refinery products in the base case scenario increases in the modelling period1990-2050 with approximately 40%, see Figure 5.1. All the petrochemical products do notchange significantly in production volume except for gasoline and gas oil. The growth in gasolinevolume is the result of a growing fuel demand in the transport sector. Gas oil is one of the cheap-est feedstocks to produce ethylene and propylene, see Table 5.1.
0
5000
10000
15000
20000
25000
30000
35000
40000
1990 2000 2010 2020 2030 2040 2050
[PJ/year]
Bitumen
Petroleum coke
Fuel oil
Naphtha
Kerosene
Gas oil
Diesel
Gasoline
LPG
Figure 5.1 Refinery products in the base case in the period 1990-2050
0
5000
10000
15000
20000
25000
30000
35000
40000
base case 20 €/t 50 •/t 100 •/t 200 •/t
[PJ/year]
Bitumen
Petroleum coke
Fuel oil
Naphtha
Kerosene
Gas oil
Diesel
Gasoline
LPG
Figure 5.2 Refinery products in 2030 with increasing permit prices
Figure 5.2 represents total production of the refineries with increasing emission permit prices. Ahigher emission penalty results in a 35% decrease in total production volume. Gasoline and gasoil are the products with a significant decline, LPG and kerosene show also a slight decline inproduction. The decline of refinery products is caused by replacement of fossil-based feedstocksby renewable based feedstocks like biomass and waste. However, the production of biofuels isallocated to the petrochemical industry.
ECN-C--99-052 31
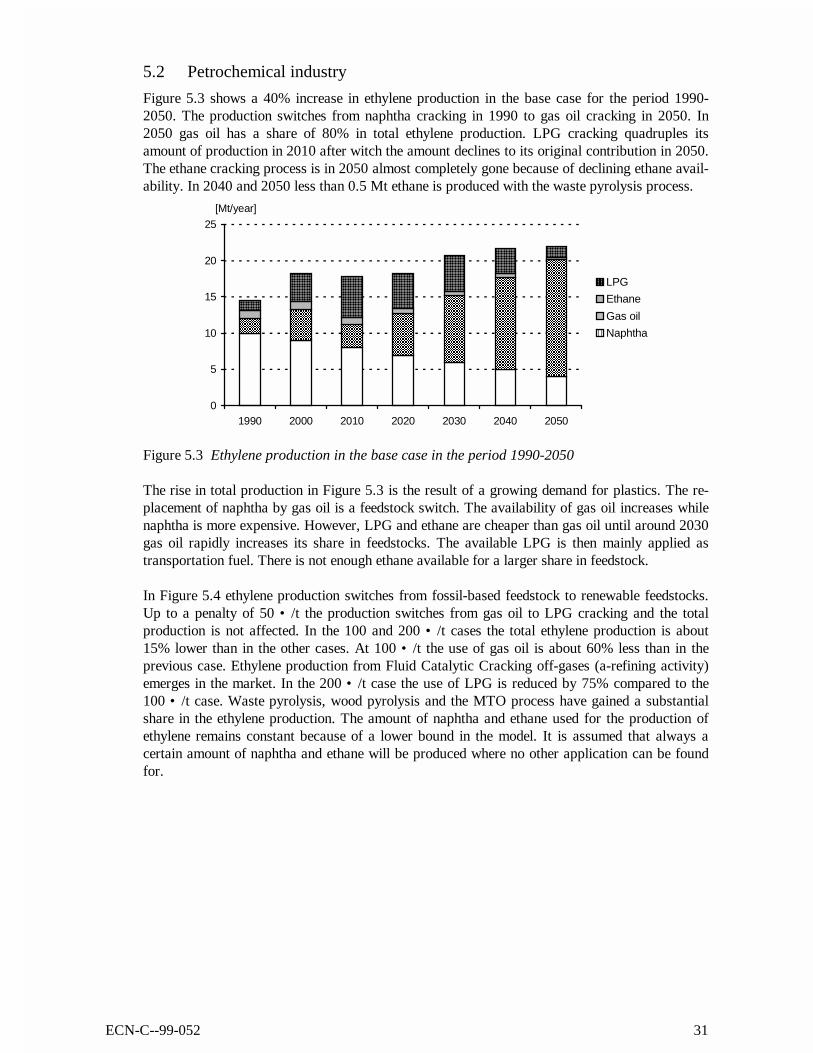
5.2 Petrochemical industry
Figure 5.3 shows a 40% increase in ethylene production in the base case for the period 1990-2050. The production switches from naphtha cracking in 1990 to gas oil cracking in 2050. In2050 gas oil has a share of 80% in total ethylene production. LPG cracking quadruples itsamount of production in 2010 after witch the amount declines to its original contribution in 2050.The ethane cracking process is in 2050 almost completely gone because of declining ethane avail-ability. In 2040 and 2050 less than 0.5 Mt ethane is produced with the waste pyrolysis process.
0
5
10
15
20
25
1990 2000 2010 2020 2030 2040 2050
[Mt/year]
LPG
Ethane
Gas oil
Naphtha
Figure 5.3 Ethylene production in the base case in the period 1990-2050
The rise in total production in Figure 5.3 is the result of a growing demand for plastics. The re-placement of naphtha by gas oil is a feedstock switch. The availability of gas oil increases whilenaphtha is more expensive. However, LPG and ethane are cheaper than gas oil until around 2030gas oil rapidly increases its share in feedstocks. The available LPG is then mainly applied astransportation fuel. There is not enough ethane available for a larger share in feedstock.
In Figure 5.4 ethylene production switches from fossil-based feedstock to renewable feedstocks.Up to a penalty of 50 • /t the production switches from gas oil to LPG cracking and the totalproduction is not affected. In the 100 and 200 • /t cases the total ethylene production is about15% lower than in the other cases. At 100 • /t the use of gas oil is about 60% less than in theprevious case. Ethylene production from Fluid Catalytic Cracking off-gases (a-refining activity)emerges in the market. In the 200 • /t case the use of LPG is reduced by 75% compared to the100 • /t case. Waste pyrolysis, wood pyrolysis and the MTO process have gained a substantialshare in the ethylene production. The amount of naphtha and ethane used for the production ofethylene remains constant because of a lower bound in the model. It is assumed that always acertain amount of naphtha and ethane will be produced where no other application can be foundfor.
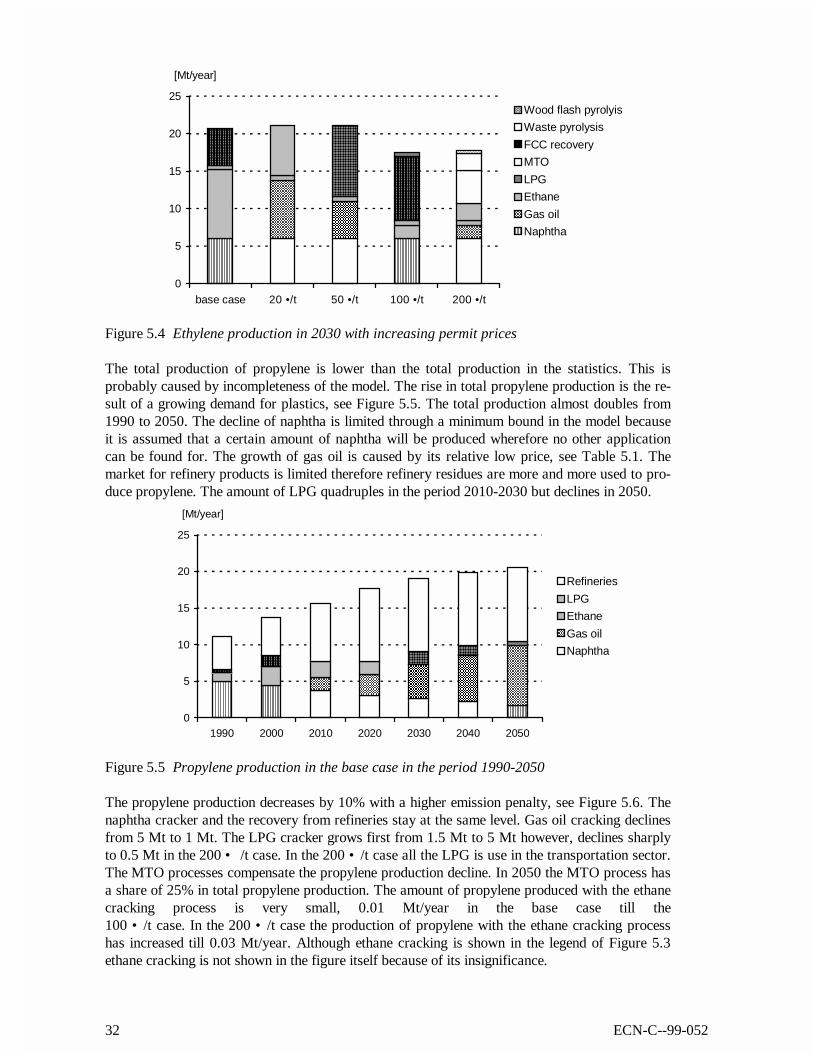
32 ECN-C--99-052
0
5
10
15
20
25
base case 20 •/t 50 •/t 100 •/t 200 •/t
[Mt/year]
Wood flash pyrolyis
Waste pyrolysis
FCC recovery
MTO
LPG
Ethane
Gas oil
Naphtha
Figure 5.4 Ethylene production in 2030 with increasing permit prices
The total production of propylene is lower than the total production in the statistics. This isprobably caused by incompleteness of the model. The rise in total propylene production is the re-sult of a growing demand for plastics, see Figure 5.5. The total production almost doubles from1990 to 2050. The decline of naphtha is limited through a minimum bound in the model becauseit is assumed that a certain amount of naphtha will be produced wherefore no other applicationcan be found for. The growth of gas oil is caused by its relative low price, see Table 5.1. Themarket for refinery products is limited therefore refinery residues are more and more used to pro-duce propylene. The amount of LPG quadruples in the period 2010-2030 but declines in 2050.
0
5
10
15
20
25
1990 2000 2010 2020 2030 2040 2050
[Mt/year]
Refineries
LPG
Ethane
Gas oil
Naphtha
Figure 5.5 Propylene production in the base case in the period 1990-2050
The propylene production decreases by 10% with a higher emission penalty, see Figure 5.6. Thenaphtha cracker and the recovery from refineries stay at the same level. Gas oil cracking declinesfrom 5 Mt to 1 Mt. The LPG cracker grows first from 1.5 Mt to 5 Mt however, declines sharplyto 0.5 Mt in the 200 • /t case. In the 200 • /t case all the LPG is use in the transportation sector.The MTO processes compensate the propylene production decline. In 2050 the MTO process hasa share of 25% in total propylene production. The amount of propylene produced with the ethanecracking process is very small, 0.01 Mt/year in the base case till the100 • /t case. In the 200 • /t case the production of propylene with the ethane cracking processhas increased till 0.03 Mt/year. Although ethane cracking is shown in the legend of Figure 5.3ethane cracking is not shown in the figure itself because of its insignificance.
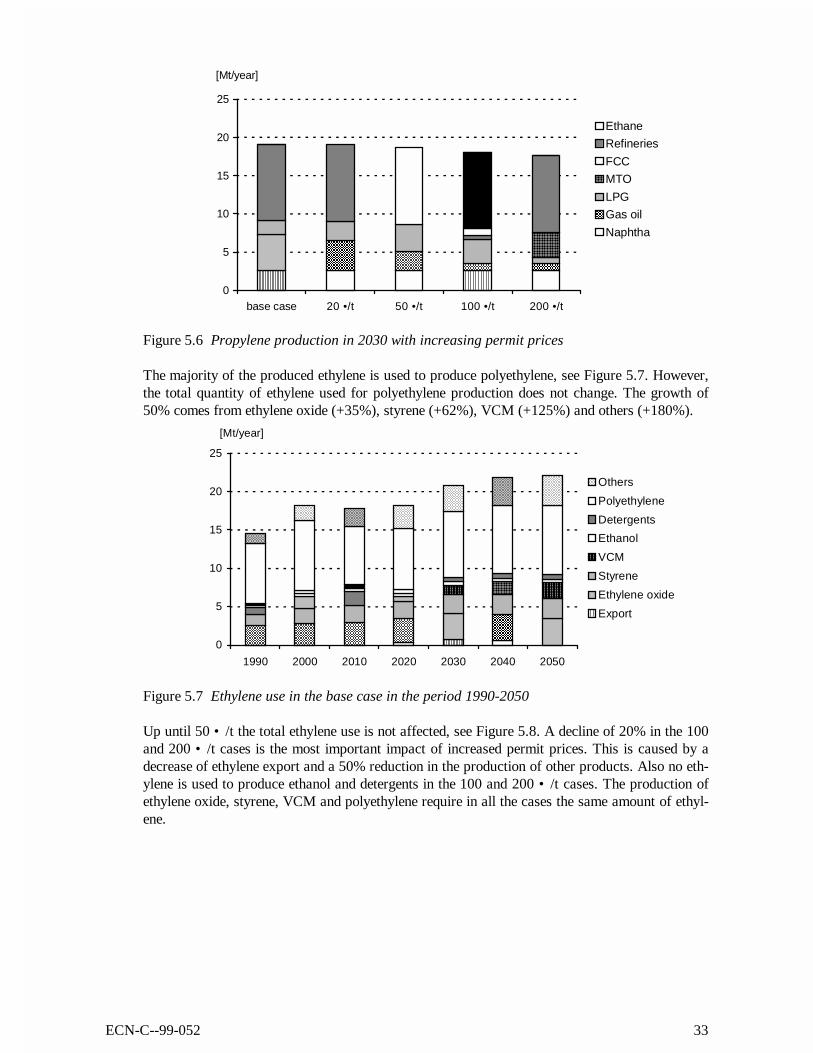
ECN-C--99-052 33
0
5
10
15
20
25
base case 20 •/t 50 •/t 100 •/t 200 •/t
[Mt/year]
Ethane
Refineries
FCC
MTO
LPG
Gas oil
Naphtha
Figure 5.6 Propylene production in 2030 with increasing permit prices
The majority of the produced ethylene is used to produce polyethylene, see Figure 5.7. However,the total quantity of ethylene used for polyethylene production does not change. The growth of50% comes from ethylene oxide (+35%), styrene (+62%), VCM (+125%) and others (+180%).
0
5
10
15
20
25
1990 2000 2010 2020 2030 2040 2050
[Mt/year]
Others
Polyethylene
Detergents
Ethanol
VCM
Styrene
Ethylene oxide
Export
Figure 5.7 Ethylene use in the base case in the period 1990-2050
Up until 50 • /t the total ethylene use is not affected, see Figure 5.8. A decline of 20% in the 100and 200 • /t cases is the most important impact of increased permit prices. This is caused by adecrease of ethylene export and a 50% reduction in the production of other products. Also no eth-ylene is used to produce ethanol and detergents in the 100 and 200 • /t cases. The production ofethylene oxide, styrene, VCM and polyethylene require in all the cases the same amount of ethyl-ene.
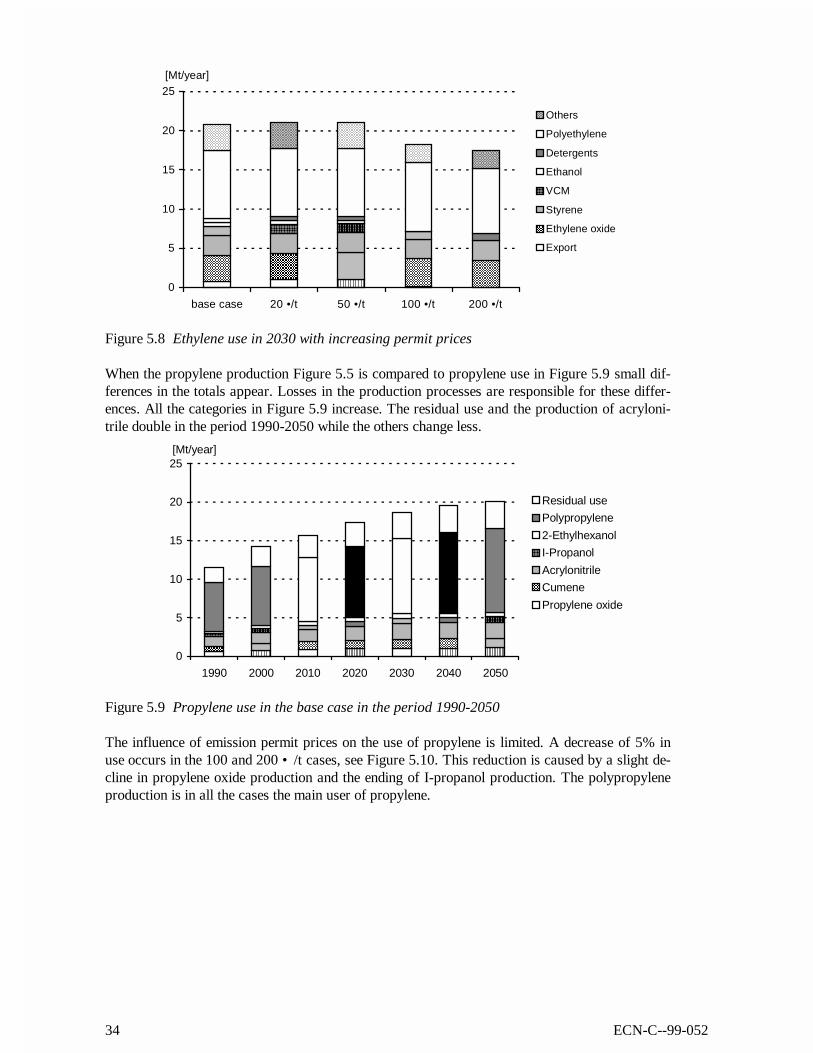
34 ECN-C--99-052
0
5
10
15
20
25
base case 20 •/t 50 •/t 100 •/t 200 •/t
[Mt/year]
Others
Polyethylene
Detergents
Ethanol
VCM
Styrene
Ethylene oxide
Export
Figure 5.8 Ethylene use in 2030 with increasing permit prices
When the propylene production Figure 5.5 is compared to propylene use in Figure 5.9 small dif-ferences in the totals appear. Losses in the production processes are responsible for these differ-ences. All the categories in Figure 5.9 increase. The residual use and the production of acryloni-trile double in the period 1990-2050 while the others change less.
0
5
10
15
20
25
1990 2000 2010 2020 2030 2040 2050
[Mt/year]
Residual use
Polypropylene
2-Ethylhexanol
I-Propanol
Acrylonitrile
Cumene
Propylene oxide
Figure 5.9 Propylene use in the base case in the period 1990-2050
The influence of emission permit prices on the use of propylene is limited. A decrease of 5% inuse occurs in the 100 and 200 • /t cases, see Figure 5.10. This reduction is caused by a slight de-cline in propylene oxide production and the ending of I-propanol production. The polypropyleneproduction is in all the cases the main user of propylene.
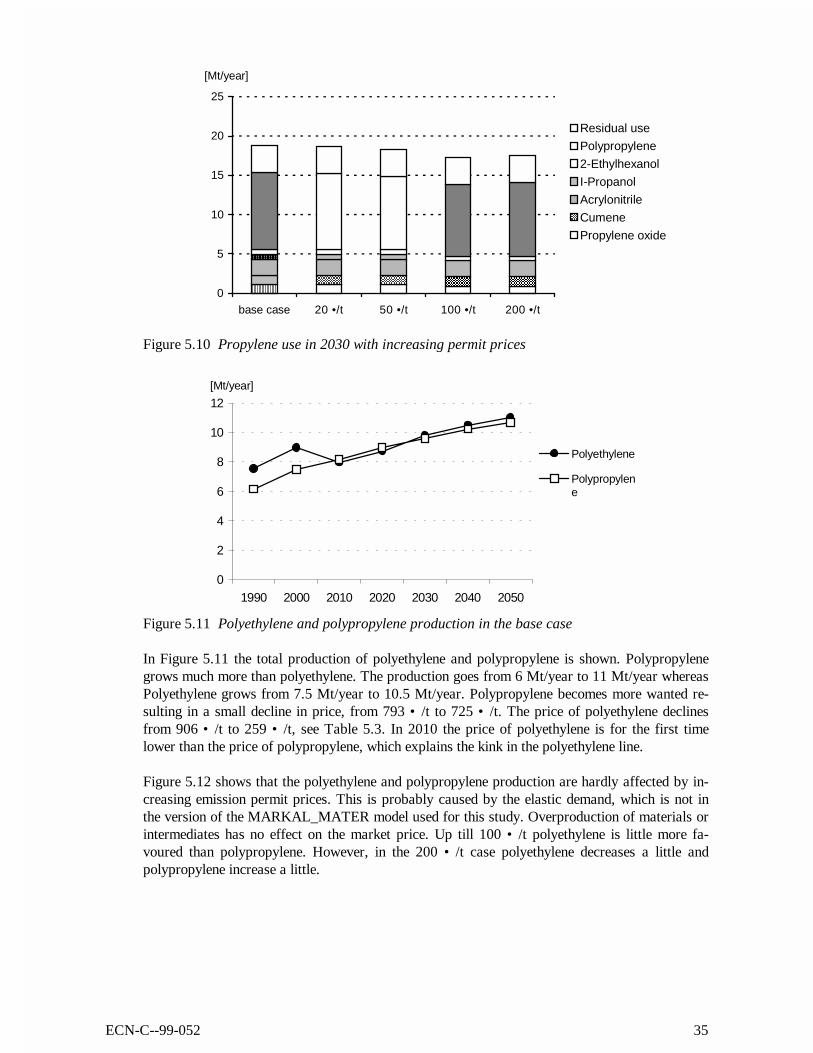
ECN-C--99-052 35
0
5
10
15
20
25
base case 20 •/t 50 •/t 100 •/t 200 •/t
[Mt/year]
Residual use
Polypropylene
2-Ethylhexanol
I-Propanol
Acrylonitrile
Cumene
Propylene oxide
Figure 5.10 Propylene use in 2030 with increasing permit prices
0
2
4
6
8
10
12
1990 2000 2010 2020 2030 2040 2050
[Mt/year]
Polyethylene
Polypropylene
Figure 5.11 Polyethylene and polypropylene production in the base case
In Figure 5.11 the total production of polyethylene and polypropylene is shown. Polypropylenegrows much more than polyethylene. The production goes from 6 Mt/year to 11 Mt/year whereasPolyethylene grows from 7.5 Mt/year to 10.5 Mt/year. Polypropylene becomes more wanted re-sulting in a small decline in price, from 793 • /t to 725 • /t. The price of polyethylene declinesfrom 906 • /t to 259 • /t, see Table 5.3. In 2010 the price of polyethylene is for the first timelower than the price of polypropylene, which explains the kink in the polyethylene line.
Figure 5.12 shows that the polyethylene and polypropylene production are hardly affected by in-creasing emission permit prices. This is probably caused by the elastic demand, which is not inthe version of the MARKAL_MATER model used for this study. Overproduction of materials orintermediates has no effect on the market price. Up till 100 • /t polyethylene is little more fa-voured than polypropylene. However, in the 200 • /t case polyethylene decreases a little andpolypropylene increase a little.
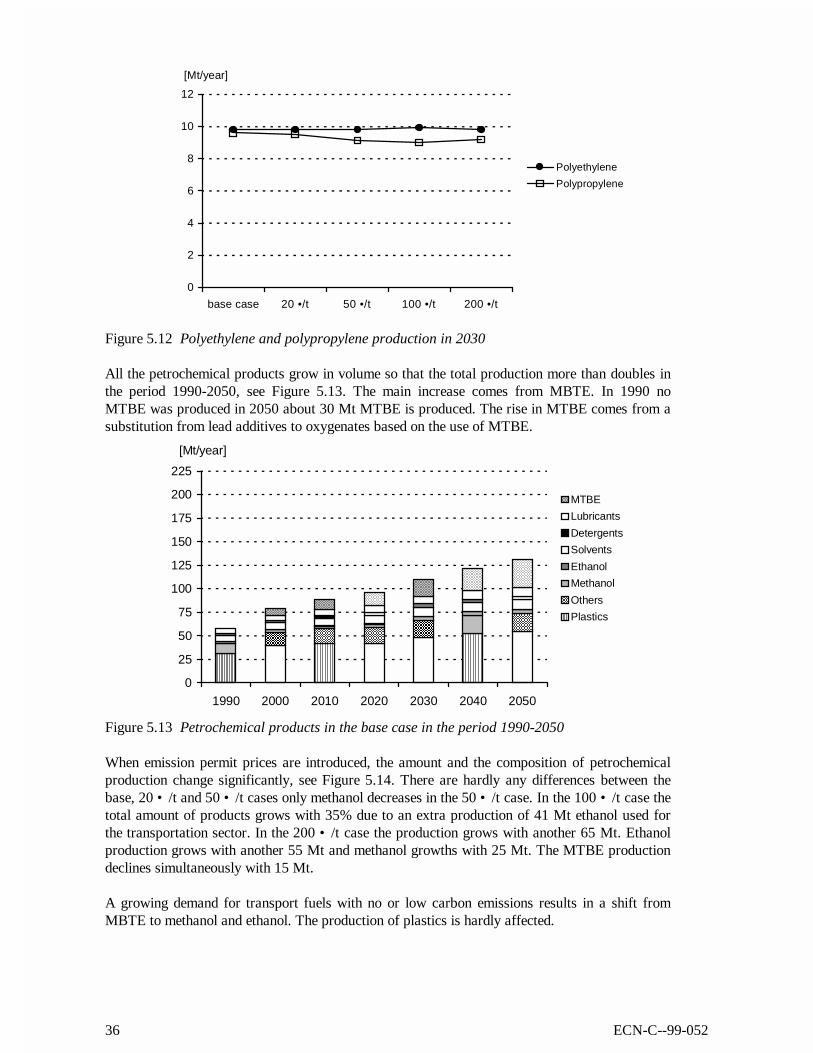
36 ECN-C--99-052
0
2
4
6
8
10
12
base case 20 •/t 50 •/t 100 •/t 200 •/t
[Mt/year]
Polyethylene
Polypropylene
Figure 5.12 Polyethylene and polypropylene production in 2030
All the petrochemical products grow in volume so that the total production more than doubles inthe period 1990-2050, see Figure 5.13. The main increase comes from MBTE. In 1990 noMTBE was produced in 2050 about 30 Mt MTBE is produced. The rise in MTBE comes from asubstitution from lead additives to oxygenates based on the use of MTBE.
0
25
50
75
100
125
150
175
200
225
1990 2000 2010 2020 2030 2040 2050
[Mt/year]
MTBE
Lubricants
Detergents
Solvents
Ethanol
Methanol
Others
Plastics
Figure 5.13 Petrochemical products in the base case in the period 1990-2050
When emission permit prices are introduced, the amount and the composition of petrochemicalproduction change significantly, see Figure 5.14. There are hardly any differences between thebase, 20 • /t and 50 • /t cases only methanol decreases in the 50 • /t case. In the 100 • /t case thetotal amount of products grows with 35% due to an extra production of 41 Mt ethanol used forthe transportation sector. In the 200 • /t case the production grows with another 65 Mt. Ethanolproduction grows with another 55 Mt and methanol growths with 25 Mt. The MTBE productiondeclines simultaneously with 15 Mt.
A growing demand for transport fuels with no or low carbon emissions results in a shift fromMBTE to methanol and ethanol. The production of plastics is hardly affected.
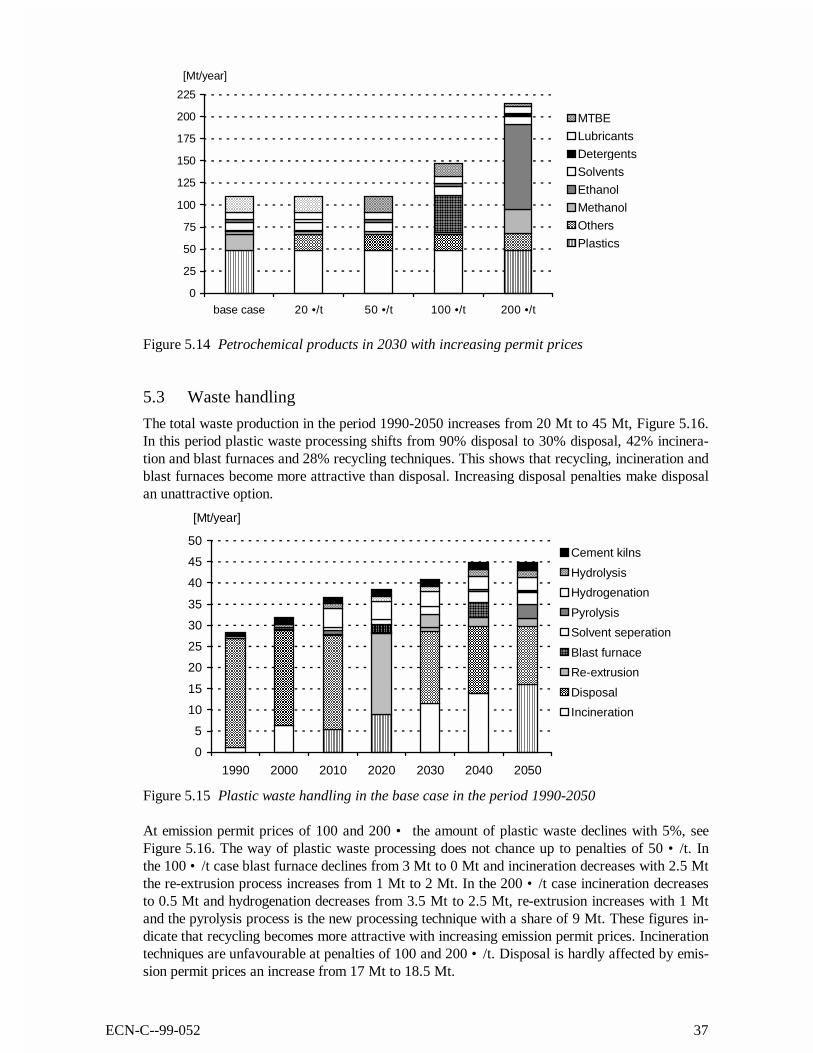
ECN-C--99-052 37
0
25
50
75
100
125
150
175
200
225
base case 20 •/t 50 •/t 100 •/t 200 •/t
[Mt/year]
MTBE
Lubricants
Detergents
Solvents
Ethanol
Methanol
Others
Plastics
Figure 5.14 Petrochemical products in 2030 with increasing permit prices
5.3 Waste handling
The total waste production in the period 1990-2050 increases from 20 Mt to 45 Mt, Figure 5.16.In this period plastic waste processing shifts from 90% disposal to 30% disposal, 42% incinera-tion and blast furnaces and 28% recycling techniques. This shows that recycling, incineration andblast furnaces become more attractive than disposal. Increasing disposal penalties make disposalan unattractive option.
0
5
10
15
20
25
30
35
40
45
50
1990 2000 2010 2020 2030 2040 2050
[Mt/year]
Cement kilns
Hydrolysis
Hydrogenation
Pyrolysis
Solvent seperation
Blast furnace
Re-extrusion
Disposal
Incineration
Figure 5.15 Plastic waste handling in the base case in the period 1990-2050
At emission permit prices of 100 and 200 • the amount of plastic waste declines with 5%, seeFigure 5.16. The way of plastic waste processing does not chance up to penalties of 50 • /t. Inthe 100 • /t case blast furnace declines from 3 Mt to 0 Mt and incineration decreases with 2.5 Mtthe re-extrusion process increases from 1 Mt to 2 Mt. In the 200 • /t case incineration decreasesto 0.5 Mt and hydrogenation decreases from 3.5 Mt to 2.5 Mt, re-extrusion increases with 1 Mtand the pyrolysis process is the new processing technique with a share of 9 Mt. These figures in-dicate that recycling becomes more attractive with increasing emission permit prices. Incinerationtechniques are unfavourable at penalties of 100 and 200 • /t. Disposal is hardly affected by emis-sion permit prices an increase from 17 Mt to 18.5 Mt.
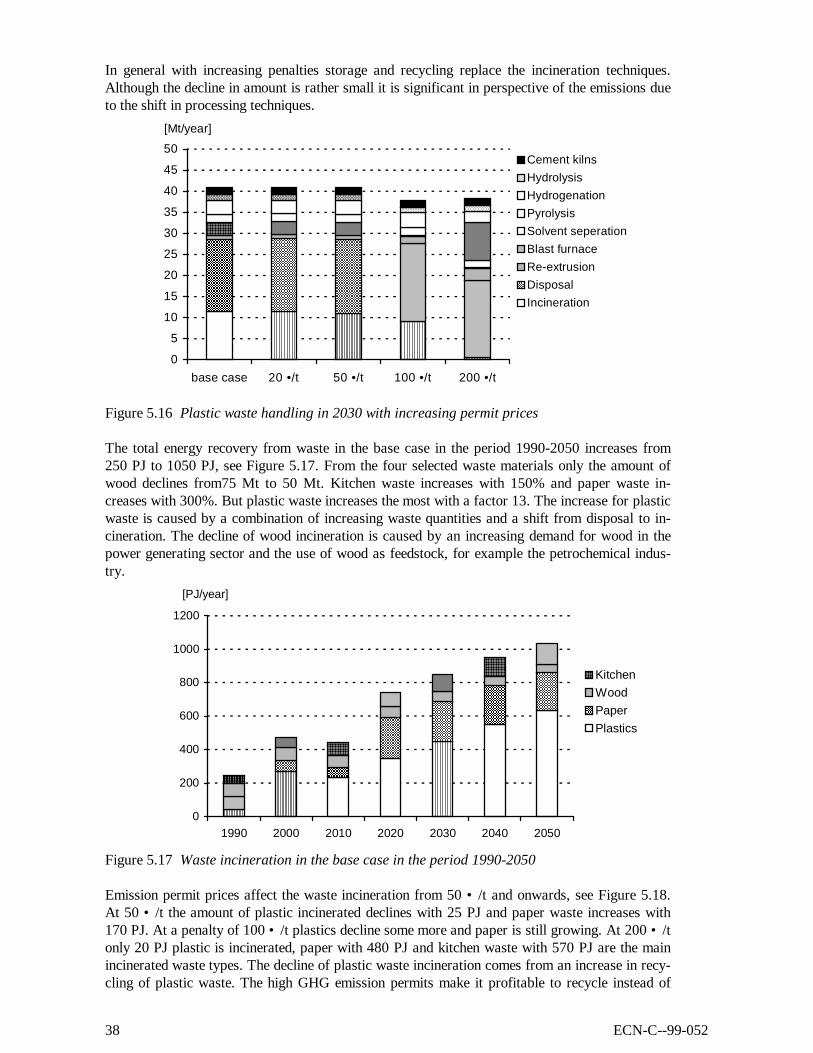
38 ECN-C--99-052
In general with increasing penalties storage and recycling replace the incineration techniques.Although the decline in amount is rather small it is significant in perspective of the emissions dueto the shift in processing techniques.
0
5
10
15
20
25
30
35
40
45
50
base case 20 •/t 50 •/t 100 •/t 200 •/t
[Mt/year]
Cement kilns
Hydrolysis
Hydrogenation
Pyrolysis
Solvent seperation
Blast furnace
Re-extrusion
Disposal
Incineration
Figure 5.16 Plastic waste handling in 2030 with increasing permit prices
The total energy recovery from waste in the base case in the period 1990-2050 increases from250 PJ to 1050 PJ, see Figure 5.17. From the four selected waste materials only the amount ofwood declines from75 Mt to 50 Mt. Kitchen waste increases with 150% and paper waste in-creases with 300%. But plastic waste increases the most with a factor 13. The increase for plasticwaste is caused by a combination of increasing waste quantities and a shift from disposal to in-cineration. The decline of wood incineration is caused by an increasing demand for wood in thepower generating sector and the use of wood as feedstock, for example the petrochemical indus-try.
0
200
400
600
800
1000
1200
1990 2000 2010 2020 2030 2040 2050
[PJ/year]
Kitchen
Wood
Paper
Plastics
Figure 5.17 Waste incineration in the base case in the period 1990-2050
Emission permit prices affect the waste incineration from 50 • /t and onwards, see Figure 5.18.At 50 • /t the amount of plastic incinerated declines with 25 PJ and paper waste increases with170 PJ. At a penalty of 100 • /t plastics decline some more and paper is still growing. At 200 • /tonly 20 PJ plastic is incinerated, paper with 480 PJ and kitchen waste with 570 PJ are the mainincinerated waste types. The decline of plastic waste incineration comes from an increase in recy-cling of plastic waste. The high GHG emission permits make it profitable to recycle instead of
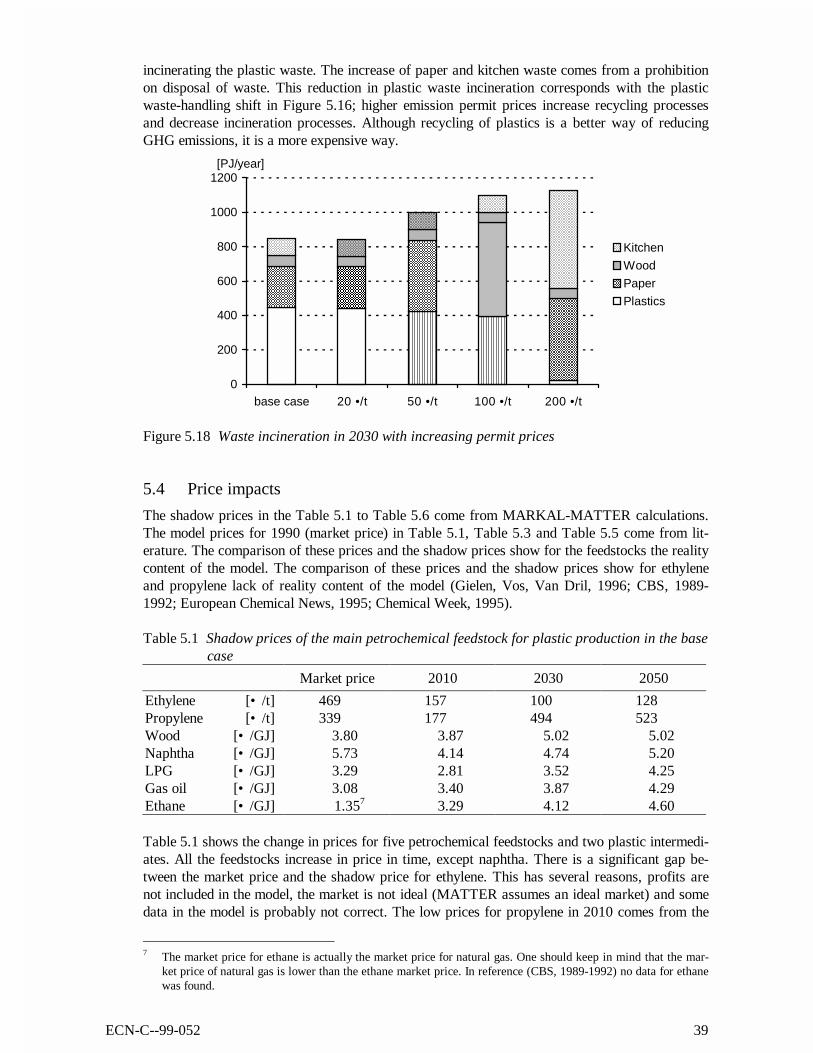
ECN-C--99-052 39
incinerating the plastic waste. The increase of paper and kitchen waste comes from a prohibitionon disposal of waste. This reduction in plastic waste incineration corresponds with the plasticwaste-handling shift in Figure 5.16; higher emission permit prices increase recycling processesand decrease incineration processes. Although recycling of plastics is a better way of reducingGHG emissions, it is a more expensive way.
0
200
400
600
800
1000
1200
base case 20 •/t 50 •/t 100 •/t 200 •/t
[PJ/year]
Kitchen
Wood
Paper
Plastics
Figure 5.18 Waste incineration in 2030 with increasing permit prices
5.4 Price impacts
The shadow prices in the Table 5.1 to Table 5.6 come from MARKAL-MATTER calculations.The model prices for 1990 (market price) in Table 5.1, Table 5.3 and Table 5.5 come from lit-erature. The comparison of these prices and the shadow prices show for the feedstocks the realitycontent of the model. The comparison of these prices and the shadow prices show for ethyleneand propylene lack of reality content of the model (Gielen, Vos, Van Dril, 1996; CBS, 1989-1992; European Chemical News, 1995; Chemical Week, 1995).
Table 5.1 Shadow prices of the main petrochemical feedstock for plastic production in the basecase
Market price 2010 2030 2050
Ethylene [• /t] 469 157 100 128Propylene [• /t] 339 177 494 523Wood [• /GJ] 3.80 3.87 5.02 5.02Naphtha [• /GJ] 5.73 4.14 4.74 5.20LPG [• /GJ] 3.29 2.81 3.52 4.25Gas oil [• /GJ] 3.08 3.40 3.87 4.29Ethane [• /GJ] 1.357 3.29 4.12 4.60
Table 5.1 shows the change in prices for five petrochemical feedstocks and two plastic intermedi-ates. All the feedstocks increase in price in time, except naphtha. There is a significant gap be-tween the market price and the shadow price for ethylene. This has several reasons, profits arenot included in the model, the market is not ideal (MATTER assumes an ideal market) and somedata in the model is probably not correct. The low prices for propylene in 2010 comes from the
7 The market price for ethane is actually the market price for natural gas. One should keep in mind that the mar-
ket price of natural gas is lower than the ethane market price. In reference (CBS, 1989-1992) no data for ethanewas found.
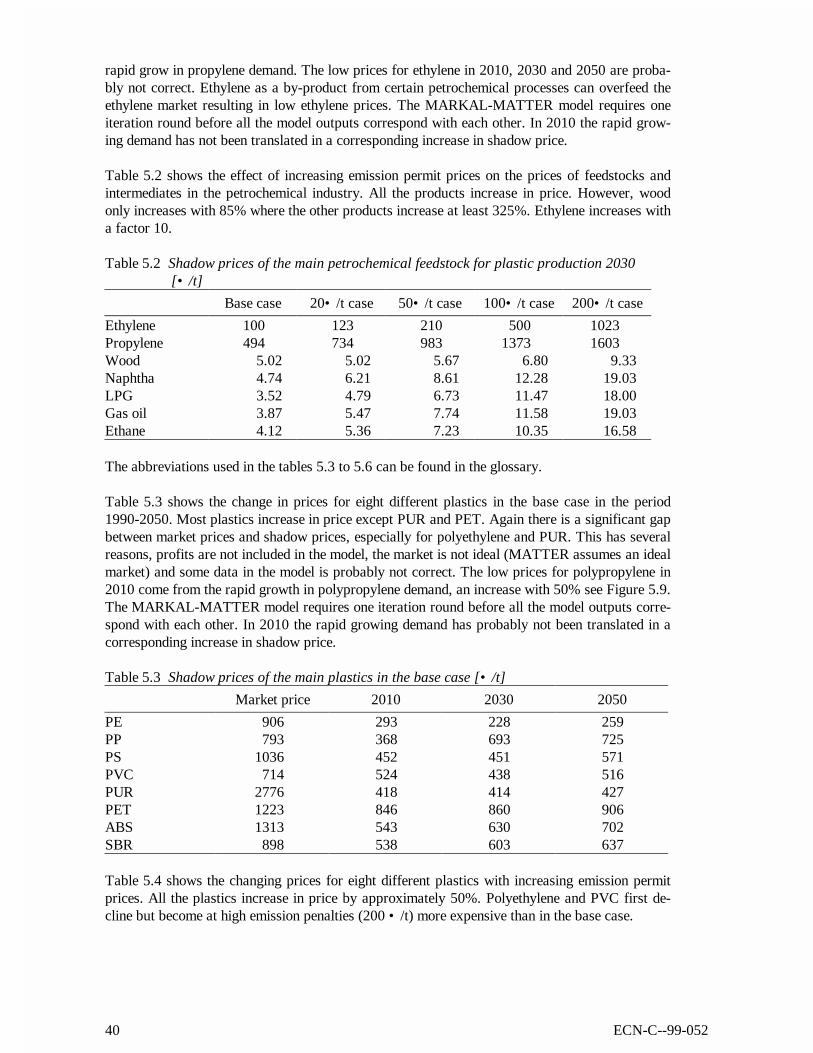
40 ECN-C--99-052
rapid grow in propylene demand. The low prices for ethylene in 2010, 2030 and 2050 are proba-bly not correct. Ethylene as a by-product from certain petrochemical processes can overfeed theethylene market resulting in low ethylene prices. The MARKAL-MATTER model requires oneiteration round before all the model outputs correspond with each other. In 2010 the rapid grow-ing demand has not been translated in a corresponding increase in shadow price.
Table 5.2 shows the effect of increasing emission permit prices on the prices of feedstocks andintermediates in the petrochemical industry. All the products increase in price. However, woodonly increases with 85% where the other products increase at least 325%. Ethylene increases witha factor 10.
Table 5.2 Shadow prices of the main petrochemical feedstock for plastic production 2030[• /t]
Base case 20• /t case 50• /t case 100• /t case 200• /t case
Ethylene 100 123 210 500 1023Propylene 494 734 983 1373 1603Wood 5.02 5.02 5.67 6.80 9.33Naphtha 4.74 6.21 8.61 12.28 19.03LPG 3.52 4.79 6.73 11.47 18.00Gas oil 3.87 5.47 7.74 11.58 19.03Ethane 4.12 5.36 7.23 10.35 16.58
The abbreviations used in the tables 5.3 to 5.6 can be found in the glossary.
Table 5.3 shows the change in prices for eight different plastics in the base case in the period1990-2050. Most plastics increase in price except PUR and PET. Again there is a significant gapbetween market prices and shadow prices, especially for polyethylene and PUR. This has severalreasons, profits are not included in the model, the market is not ideal (MATTER assumes an idealmarket) and some data in the model is probably not correct. The low prices for polypropylene in2010 come from the rapid growth in polypropylene demand, an increase with 50% see Figure 5.9.The MARKAL-MATTER model requires one iteration round before all the model outputs corre-spond with each other. In 2010 the rapid growing demand has probably not been translated in acorresponding increase in shadow price.
Table 5.3 Shadow prices of the main plastics in the base case [• /t]
Market price 2010 2030 2050
PE 906 293 228 259PP 793 368 693 725PS 1036 452 451 571PVC 714 524 438 516PUR 2776 418 414 427PET 1223 846 860 906ABS 1313 543 630 702SBR 898 538 603 637
Table 5.4 shows the changing prices for eight different plastics with increasing emission permitprices. All the plastics increase in price by approximately 50%. Polyethylene and PVC first de-cline but become at high emission penalties (200 • /t) more expensive than in the base case.
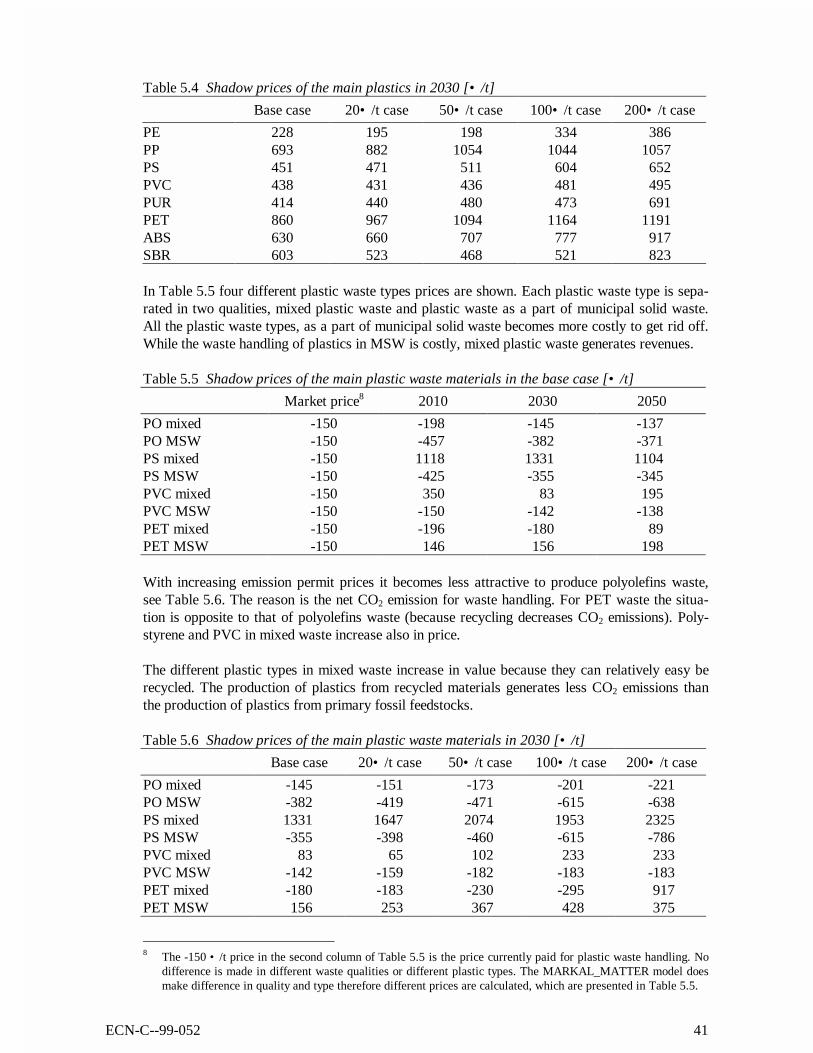
ECN-C--99-052 41
Table 5.4 Shadow prices of the main plastics in 2030 [• /t]
Base case 20• /t case 50• /t case 100• /t case 200• /t case
PE 228 195 198 334 386PP 693 882 1054 1044 1057PS 451 471 511 604 652PVC 438 431 436 481 495PUR 414 440 480 473 691PET 860 967 1094 1164 1191ABS 630 660 707 777 917SBR 603 523 468 521 823
In Table 5.5 four different plastic waste types prices are shown. Each plastic waste type is sepa-rated in two qualities, mixed plastic waste and plastic waste as a part of municipal solid waste.All the plastic waste types, as a part of municipal solid waste becomes more costly to get rid off.While the waste handling of plastics in MSW is costly, mixed plastic waste generates revenues.
Table 5.5 Shadow prices of the main plastic waste materials in the base case [• /t]
Market price8 2010 2030 2050
PO mixed -150 -198 -145 -137PO MSW -150 -457 -382 -371PS mixed -150 1118 1331 1104PS MSW -150 -425 -355 -345PVC mixed -150 350 83 195PVC MSW -150 -150 -142 -138PET mixed -150 -196 -180 89PET MSW -150 146 156 198
With increasing emission permit prices it becomes less attractive to produce polyolefins waste,see Table 5.6. The reason is the net CO2 emission for waste handling. For PET waste the situa-tion is opposite to that of polyolefins waste (because recycling decreases CO2 emissions). Poly-styrene and PVC in mixed waste increase also in price.
The different plastic types in mixed waste increase in value because they can relatively easy berecycled. The production of plastics from recycled materials generates less CO2 emissions thanthe production of plastics from primary fossil feedstocks.
Table 5.6 Shadow prices of the main plastic waste materials in 2030 [• /t]
Base case 20• /t case 50• /t case 100• /t case 200• /t case
PO mixed -145 -151 -173 -201 -221PO MSW -382 -419 -471 -615 -638PS mixed 1331 1647 2074 1953 2325PS MSW -355 -398 -460 -615 -786PVC mixed 83 65 102 233 233PVC MSW -142 -159 -182 -183 -183PET mixed -180 -183 -230 -295 917PET MSW 156 253 367 428 375
8 The -150 • /t price in the second column of Table 5.5 is the price currently paid for plastic waste handling. No
difference is made in different waste qualities or different plastic types. The MARKAL_MATTER model doesmake difference in quality and type therefore different prices are calculated, which are presented in Table 5.5.
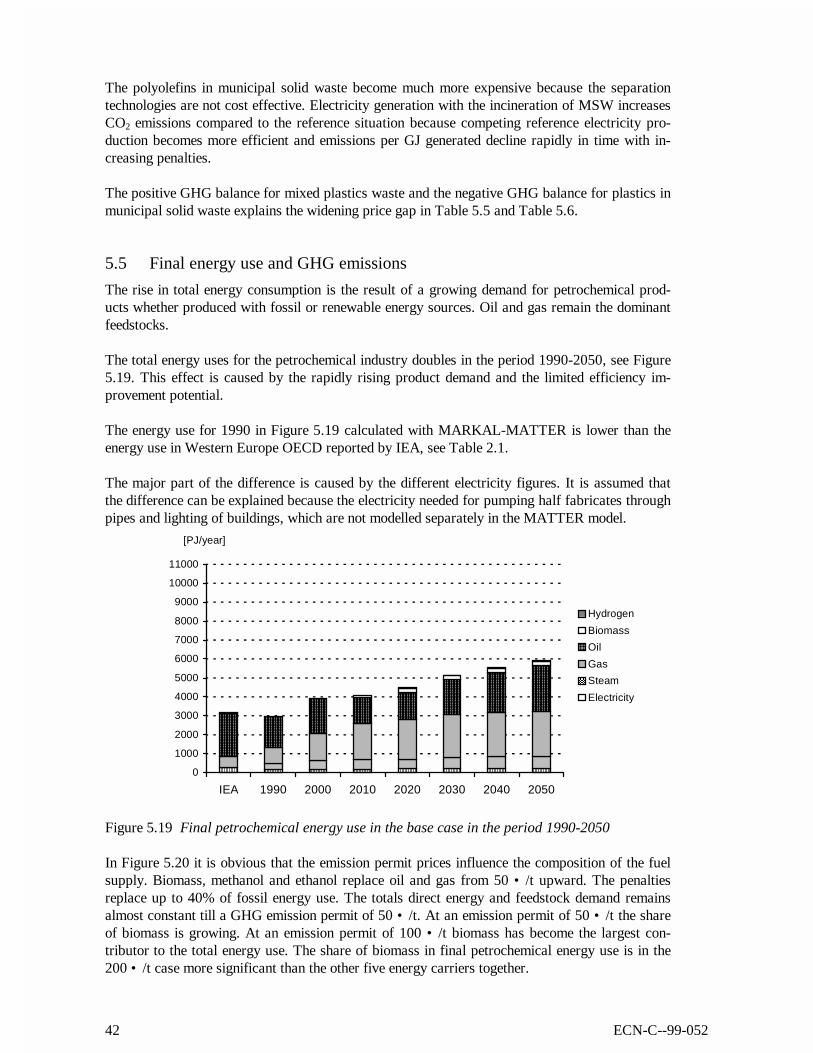
42 ECN-C--99-052
The polyolefins in municipal solid waste become much more expensive because the separationtechnologies are not cost effective. Electricity generation with the incineration of MSW increasesCO2 emissions compared to the reference situation because competing reference electricity pro-duction becomes more efficient and emissions per GJ generated decline rapidly in time with in-creasing penalties.
The positive GHG balance for mixed plastics waste and the negative GHG balance for plastics inmunicipal solid waste explains the widening price gap in Table 5.5 and Table 5.6.
5.5 Final energy use and GHG emissions
The rise in total energy consumption is the result of a growing demand for petrochemical prod-ucts whether produced with fossil or renewable energy sources. Oil and gas remain the dominantfeedstocks.
The total energy uses for the petrochemical industry doubles in the period 1990-2050, see Figure5.19. This effect is caused by the rapidly rising product demand and the limited efficiency im-provement potential.
The energy use for 1990 in Figure 5.19 calculated with MARKAL-MATTER is lower than theenergy use in Western Europe OECD reported by IEA, see Table 2.1.
The major part of the difference is caused by the different electricity figures. It is assumed thatthe difference can be explained because the electricity needed for pumping half fabricates throughpipes and lighting of buildings, which are not modelled separately in the MATTER model.
0
1000
2000
3000
4000
5000
6000
7000
8000
9000
10000
11000
IEA 1990 2000 2010 2020 2030 2040 2050
[PJ/year]
Hydrogen
Biomass
Oil
Gas
Steam
Electricity
Figure 5.19 Final petrochemical energy use in the base case in the period 1990-2050
In Figure 5.20 it is obvious that the emission permit prices influence the composition of the fuelsupply. Biomass, methanol and ethanol replace oil and gas from 50 • /t upward. The penaltiesreplace up to 40% of fossil energy use. The totals direct energy and feedstock demand remainsalmost constant till a GHG emission permit of 50 • /t. At an emission permit of 50 • /t the shareof biomass is growing. At an emission permit of 100 • /t biomass has become the largest con-tributor to the total energy use. The share of biomass in final petrochemical energy use is in the200 • /t case more significant than the other five energy carriers together.
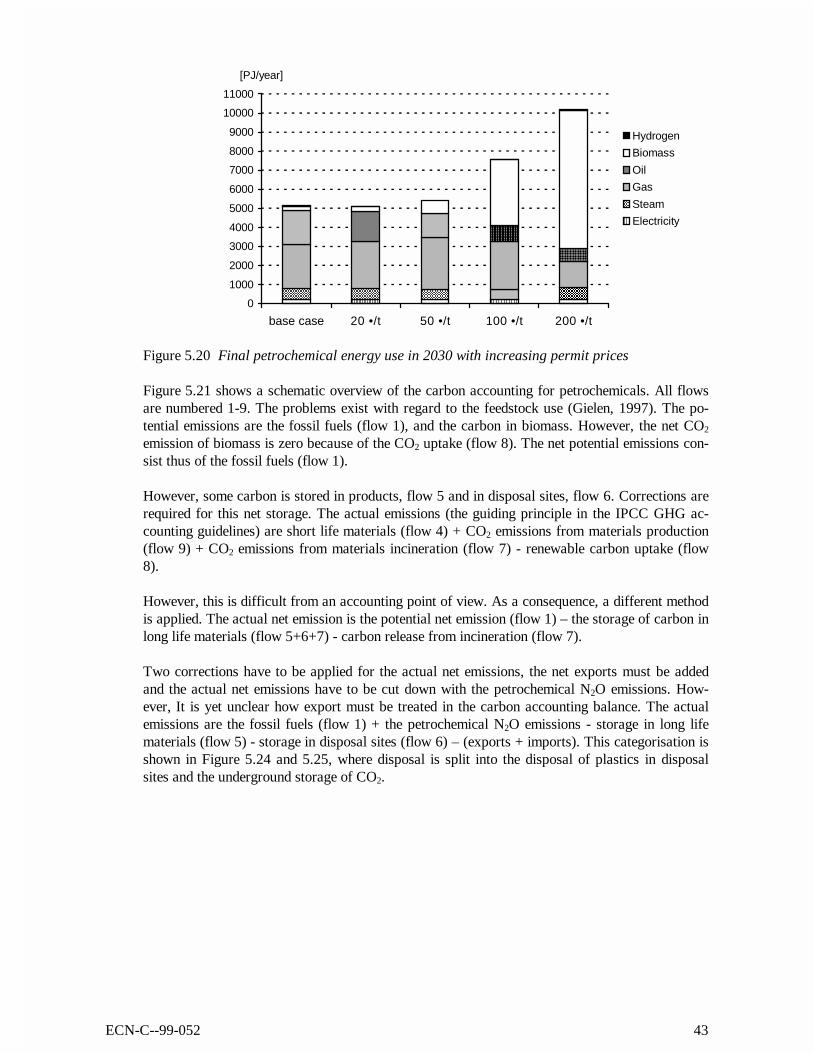
ECN-C--99-052 43
0
1000
2000
3000
4000
5000
6000
7000
8000
9000
10000
11000
base case 20 •/t 50 •/t 100 •/t 200 •/t
[PJ/year]
Hydrogen
Biomass
Oil
Gas
Steam
Electricity
Figure 5.20 Final petrochemical energy use in 2030 with increasing permit prices
Figure 5.21 shows a schematic overview of the carbon accounting for petrochemicals. All flowsare numbered 1-9. The problems exist with regard to the feedstock use (Gielen, 1997). The po-tential emissions are the fossil fuels (flow 1), and the carbon in biomass. However, the net CO2
emission of biomass is zero because of the CO2 uptake (flow 8). The net potential emissions con-sist thus of the fossil fuels (flow 1).
However, some carbon is stored in products, flow 5 and in disposal sites, flow 6. Corrections arerequired for this net storage. The actual emissions (the guiding principle in the IPCC GHG ac-counting guidelines) are short life materials (flow 4) + CO2 emissions from materials production(flow 9) + CO2 emissions from materials incineration (flow 7) - renewable carbon uptake (flow8).
However, this is difficult from an accounting point of view. As a consequence, a different methodis applied. The actual net emission is the potential net emission (flow 1) – the storage of carbon inlong life materials (flow 5+6+7) - carbon release from incineration (flow 7).
Two corrections have to be applied for the actual net emissions, the net exports must be addedand the actual net emissions have to be cut down with the petrochemical N2O emissions. How-ever, It is yet unclear how export must be treated in the carbon accounting balance. The actualemissions are the fossil fuels (flow 1) + the petrochemical N2O emissions - storage in long lifematerials (flow 5) - storage in disposal sites (flow 6) – (exports + imports). This categorisation isshown in Figure 5.24 and 5.25, where disposal is split into the disposal of plastics in disposalsites and the underground storage of CO2.
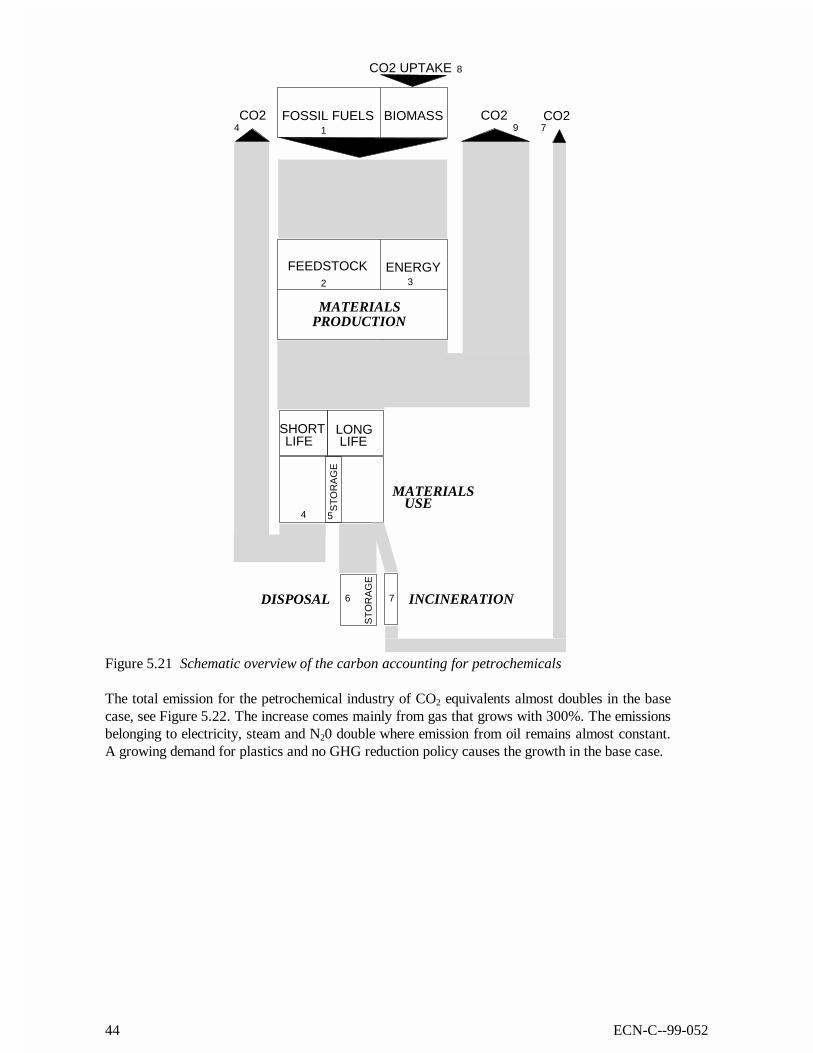
44 ECN-C--99-052
MATERIALS
FEEDSTOCK ENERGY
USE
SHORTLIFE
LONGLIFE
DISPOSAL INCINERATION
ST
OR
AG
E
ST
OR
AG
E
FOSSIL FUELS BIOMASS CO2 CO2CO2
CO2 UPTAKE
MATERIALS
PRODUCTION
1
2 3
4 5
6 7
4 9 7
8
Figure 5.21 Schematic overview of the carbon accounting for petrochemicals
The total emission for the petrochemical industry of CO2 equivalents almost doubles in the basecase, see Figure 5.22. The increase comes mainly from gas that grows with 300%. The emissionsbelonging to electricity, steam and N20 double where emission from oil remains almost constant.A growing demand for plastics and no GHG reduction policy causes the growth in the base case.
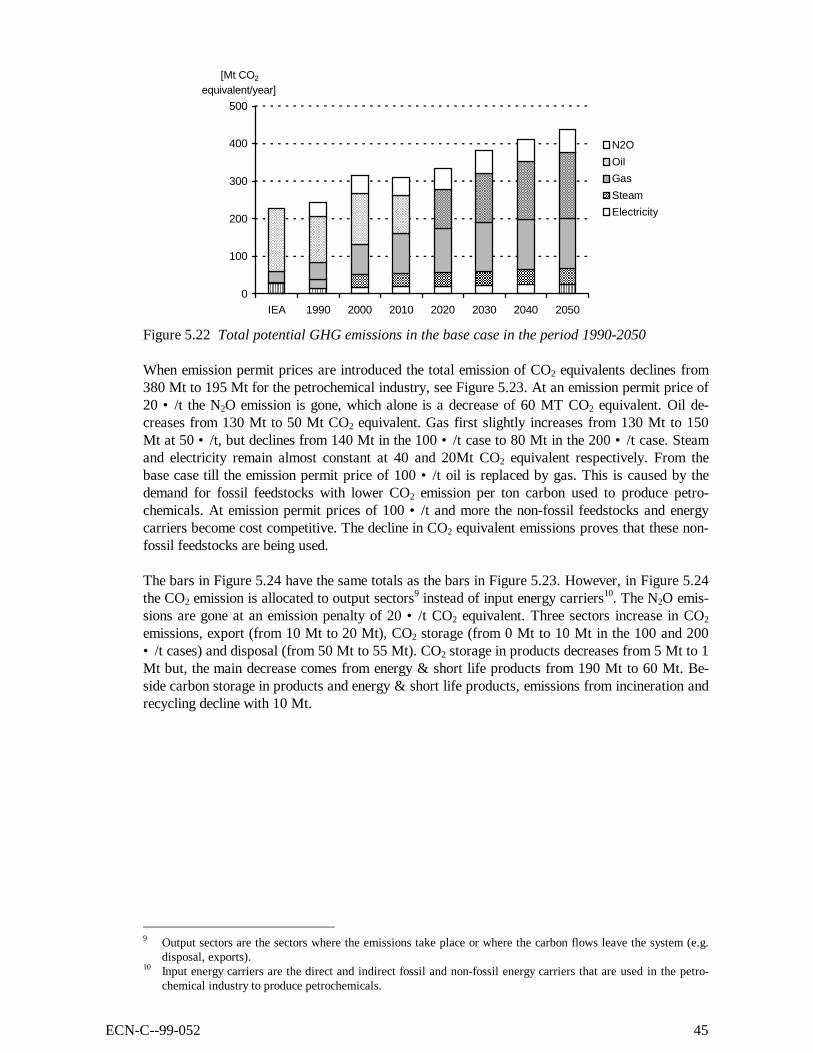
ECN-C--99-052 45
0
100
200
300
400
500
IEA 1990 2000 2010 2020 2030 2040 2050
[Mt CO2
equivalent/year]
N2O
Oil
Gas
Steam
Electricity
Figure 5.22 Total potential GHG emissions in the base case in the period 1990-2050
When emission permit prices are introduced the total emission of CO2 equivalents declines from380 Mt to 195 Mt for the petrochemical industry, see Figure 5.23. At an emission permit price of20 • /t the N2O emission is gone, which alone is a decrease of 60 MT CO2 equivalent. Oil de-creases from 130 Mt to 50 Mt CO2 equivalent. Gas first slightly increases from 130 Mt to 150Mt at 50 • /t, but declines from 140 Mt in the 100 • /t case to 80 Mt in the 200 • /t case. Steamand electricity remain almost constant at 40 and 20Mt CO2 equivalent respectively. From thebase case till the emission permit price of 100 • /t oil is replaced by gas. This is caused by thedemand for fossil feedstocks with lower CO2 emission per ton carbon used to produce petro-chemicals. At emission permit prices of 100 • /t and more the non-fossil feedstocks and energycarriers become cost competitive. The decline in CO2 equivalent emissions proves that these non-fossil feedstocks are being used.
The bars in Figure 5.24 have the same totals as the bars in Figure 5.23. However, in Figure 5.24the CO2 emission is allocated to output sectors9 instead of input energy carriers10. The N2O emis-sions are gone at an emission penalty of 20 • /t CO2 equivalent. Three sectors increase in CO2
emissions, export (from 10 Mt to 20 Mt), CO2 storage (from 0 Mt to 10 Mt in the 100 and 200• /t cases) and disposal (from 50 Mt to 55 Mt). CO2 storage in products decreases from 5 Mt to 1Mt but, the main decrease comes from energy & short life products from 190 Mt to 60 Mt. Be-side carbon storage in products and energy & short life products, emissions from incineration andrecycling decline with 10 Mt.
9 Output sectors are the sectors where the emissions take place or where the carbon flows leave the system (e.g.
disposal, exports).10 Input energy carriers are the direct and indirect fossil and non-fossil energy carriers that are used in the petro-
chemical industry to produce petrochemicals.

46 ECN-C--99-052
0
100
200
300
400
500
base case 20 euro/t 50 euro/t 100 euro/t 200 euro/t
[Mt CO2
equivalent/year]
N2O
Oil
Gas
Steam
Electricity
Figure 5.23 Total potential GHG emissions in 2030 with increasing permit prices11
0
100
200
300
400
500
base case 20 •/t 50 •/t 100 •/t 200 •/t
[Mt CO2
equivalent/year]
CO2 storage
Export
Storage in products
Disposal
Energy & short life
Incineration & recycling
Nitrous oxide
Figure 5.24 GHG balance in 2030 per sector in CO2 equivalent/year with increasing permitprices
The carbon and nitrous oxide emissions from ‘energy and short life’, ‘incineration and recycling’and ‘nitrous oxide’ together is the total emission of CO2 equivalents/year for the petrochemicalindustry. The amount of CO2 being stored slightly increases with increasing emission permitprices, 56 Mt in the base case and 63 Mt in the 200 • /t case. The CO2 emission decreases from315 Mt in the base case to 110 Mt in the 200 • /t case.
11 See footnote 5 on page 23.
ECN-C--99-052 47
6. CONCLUSIONS
The following questions have been raised in Chapter 1:1. What are the relevant energy and material flows in Western Europe in the life cycle of petro-
chemical products from a GHG perspective? (Chapter 2)2. What is the relation between these flows and GHG emissions? (Chapter 2)3. Which techno-economic options exist to reduce these emissions in the next 3 decades? (Chap-
ter 3)4. Does it make sense from a Western European cost-effectiveness perspective to reduce these
emissions? (Chapter 5)5. How far can these emissions be reduced at acceptable costs? (Chapter 5)6. Which problems must be solved in order to achieve this emission reduction? (Chapter 6)7. Which recommendations can be formulated for R&D and for investment decisions? (Chapter
6)
6.1 Relevant energy and material flows
The current petrochemical complex is based on oil and gas derived feedstocks (naphtha, gas oil,LPG, ethane, aromatic fractions). The steam cracking of these feedstocks is the basis for the pet-rochemical industry. Increasing quantities of intermediates are recovered from refineries. Afterfractionation, different components are converted into plastics, fibers, solvents, resins, detergentsand other products. Total production in 1994 amounted to 42.4 Mt products (excluding lubri-cants and energy products such as pyrolysis gasoline). Plastics and resins constitute 67% of thistotal production. The petrochemical industry consumes approximately 3 EJ final energy, 8% ofthe total Western European final energy use. This energy use is forecast to increase in the future,both in a situation without GHG policy and (even more) in a situation with GHG policies. Thisgrowing energy use is a product of significantly increasing production and moderately increasingenergy efficiency and a change in product mix to more energy intensive products. The stronggrowth due to GHG policies can be attributed to an increased production of methanol and ethanol(as fuels for the transportation sector). One can argue whether this production should be consid-ered as part of the petrochemical industry or as part of the refining sector. The production ofother petrochemical products is only to a limited extent affected by GHG policies (see below).
6.2 The relation between energy and material flows and GHG emissions
From a GHG emission point of view the industry has a unique position because a significant partof this energy is used as feedstock, which does not result in CO2 emissions in the productionstage. Only in the use stage (for dissipative applications) and in the waste handling stage (e.g.plastics incineration) do these processes contribute to GHG emissions. The potential GHG emis-sions increase from approximately 250 Mt in 1990 to 370 Mt in 2030 (an increase by 48%).However, the actual emissions amount only 320 Mt in 2030, of which approximately 60 Mt canbe attributed to the waste incineration, so the actual emission allocated to the petrochemical in-dustry is approximately 260 Mt. 60 Mt is related to the production of adipic acid. The remaining200 Mt is related to the energy use in the industry (including the upstream emissions in electricityproduction) and the production of short life petrochemical production (of which emissions are al-located to the petrochemical industry). The petrochemical industry contributes approximately 4%to the total Western European emission of 5100 Mt in 2030.
48 ECN-C--99-052
6.3 Technologically feasible strategies
Greenhouse gas emission reduction will have significant impact on the selection of feedstocks, theselection of process technologies and the waste management strategies for petrochemical prod-ucts. The industry should consider such impacts in the formulation of strategies. Until 2010,Western European industry will not be affected significantly by the GHG emission reductionsthat have been agreed within the framework of UNFCCC in Kyoto December 1997. However,beyond 2010, further emission reductions can be expected. These reductions will affect the petro-chemical industry and iron and steel, aluminium, paper and wood etc. As a consequence, thecompetition between these materials will be affected by these strategies. However, the emissionscan be reduced significantly for most materials. As a consequence, the emission reduction thatcan be achieved through materials substitution is limited.
Not only the emission reduction for competing materials must be considered. The changingstructure of the energy supply system must also be considered. For example the changing elec-tricity production affects the potential for GHG emission reduction through energy recovery fromplastic waste. The market for transportation fuels will be affected by a change towards biofuelsand electricity in the transportation sector. This will affect the availability of naphtha, currently aby-product of oil refining.
6.4 Cost-effective strategies
Nowadays the Western European petrochemical industry contributes to GHG-emission reductionthrough N2O mitigation technologies. These technologies are introduced in the production processof Adipic acid. The total contribution is approximately 60 Mt CO2 equivalents in 2030 (com-pared to the base case).
Basically two main strategies can be discerned for the petrochemical industry with regard to CO2
emissions related to feedstock use:• renewable feedstocks,• recycling of waste plastics.
Both strategies are to some extending already part of the current industrial practice. A significantpart of the oleochemistry is based on natural resources, which are applied for the production ofdetergents etc. Natural solvents and natural lubricants make inroads into the market that used tobe a petrochemical market. These trends will be accelerated by GHG emission reduction policies.
The industry will be significantly affected by any GHG penalty. Actual emissions will declinefrom 320 Mt in the base case to 250 Mt in case of a 50 • /t CO2 penalty. This is a decline of22%, compared to a decline of 50% for the whole economy. At a 200 • /t CO2 penalty emissionsdecline with 125 Mt, this is a decline of 61%, compared to a decline of 75% for the whole econ-omy. The 50 • /t CO2 penalty should be considered a realistic scenario, while the 200 • /t penaltyrepresents an extreme scenario.
The main GHG emission reduction strategy is feedstock substitution (65% of the GHG emissionreduction), followed by N2O emission mitigation (15%), recycling/energy recovery (10%) and in-creased materials efficiency (10%).
ECN-C--99-052 49
At GHG penalties of 100• /t and more, the energy and carbon feedstock input changes from fos-sil fuels to biomass. Part of this biomass is directly used in fermentation and pyrolysis processes.Another part is first converted into methanol and ethanol and subsequently applied. The develop-ment of such strategies will require significant R&D efforts, but can simultaneously enhance thesustainability of this industry sector.
6.5 The integrated production complex problem
The integration of the refinery sector and the petrochemical industry is currently one of the strongcompetitive advantages compared with steel and paper/board industry. Significant changes can beexpected in the transportation fuels market from GHG-emission of 100 • /t and higher. This willaffect the availability of naphtha, gas and gas oil. It is an important incentive to develop alterna-tive carbon sources, materials, products and product applications.
The threat for industry is that these new production processes are not dependent upon the existingpetrochemical structure. Agricultural processing industries and pulp and paper industries are ex-amples of non-petrochemical sectors that make inroads into this market. Especially the pulp pro-duction has a significant resource base of 20-30 Mt lignin per year which is currently incinerated,but which poses an attractive source of cheap biomass feedstocks. The agricultural overproduc-tion in Western Europe and the imminent expansion of the European Union towards the east willresult in a strong drive to find new applications for this agricultural land. The materials marketmay pose such a market. It is recommended for the petrochemical industry to participate in thistrend through the development of new production routes.
The industry has developed much new plastic waste recycling technologies during the last decade.However, most of these technologies are not cost-effective in the current market conditions. GHGemission permit prices can increase the cost-effectiveness of these strategies significantly. As aconsequence, recycling strategies will benefit from serious GHG emission reduction beyond 2010.However, the waste plastic market has a decidedly different structure than the naphtha market. Itis recommended to develop a reliable supply structure before any activities in this field are devel-oped.
6.6 Selection of production locations: the carbon leakage issue
Given the international character of many materials producing industries, carbon leakage (reloca-tion of industries to regions with less stringent emission reduction policies) is a serious threat.Policy makers are sensitive to such problems. Three scenarios can be drawn: first, industries out-side Western Europe are subjected to similar emission reduction policies, second, petrochemicalindustry is exempted from GHG emission reduction policies, third, a system of tradable emissionpermits in Western Europe is developed. In the third case, it is important which initial distributionof permits is applied. Industries can even benefit from such GHG policies, if their initial emis-sions are high but they can achieve emission reductions at lower costs than elsewhere, so they cansell permits at a profit. Looking at likely competitors, emission reductions in the United States areeven more difficult to achieve than emission reductions in Western Europe. The situation for pro-ducers in the Middle East is not clear because it is uncertain whether these countries will partici-pate in GHG emission reduction schemes.
Within Europe, the market potential in Eastern Europe and the imminent participation of thesecountries in the European Union will pose an important incentive for new production capacity inthe east. An additional advantage is that this region has sufficient land for a future agrificationstrategy.
50 ECN-C--99-052
6.7 R&D planning for the period beyond 2010
Biomass is a renewable carbon source with a neutral CO2 balance. Carbon derived directly fromthe atmosphere seems a less attractive carbon source. Basically, four routes can be consideredhow biomass can be integrated into the petrochemical complex:1. Feedstock substitution: biomass for oil and natural gas feedstocks for the production of inter-
mediates such as ethylene, butadiene, etc.2. Fermentation of biomass to ethanol and methanol.3. New bioplastics, bio-solvents etc. based on naturally occurring molecules.4. Substitution of plastics by wood products such as sawn wood, wood panels or paper.
The model calculations indicate that the first two routes seem the most attractive. A mix of py-rolysis processes and fermentation must be applied in order to achieve maximum substitution ofexisting petrochemicals. Some of these processes have been proven on a commercial scale. Theirintroduction seems merely a matter of process economics, which can be influenced by permitprices. For other technologies such as flash pyrolysis, the technological feasibility is still uncer-tain and major research is required in order to introduce such technologies.
Recycling is the other important strategy that can be applied in order to reduce the feedstock con-sumption. Current recycling rates are rather low. Current waste policies aim for increased incin-eration with energy recovery as a substitute for waste disposal. This will result in increased GHGemissions. A number of different recycling technologies are available and suitable for differentwaste qualities to produce different materials. For different waste quality types, different wastemanagement technologies must be applied to achieve optimal conversion rates. An optimal mixfrom a GHG emission point of view consists of a mix of back-to-polymer, back-to-monomer andback-to-feedstock technologies at the expense of energy recovery technologies such as waste in-cineration. Most of these technologies have already been developed on a commercial scale. Theintroduction of a collection system seems merely a matter of process economics, which can be in-fluenced by emission permit prices.
6.8 Accounting issues
The current IPCC emission accounting guidelines are not clear with regard to the CO2 emissionaccounting for the petrochemical industry. Different countries apply different accounting meth-ods. Especially the treatment of exports and the allocation of emissions for short life materials toeconomic sectors is not clear. Such differences can give future problems because they can affectthe competitive position of national industries in a Europe-wide operating industry. Internationalco-ordination of emission accounting guidelines with regard to petrochemicals is currently pro-ceeding in the framework of the NEU-CO2 project that is funded by the Environment and Climateprogramme of the European Union (http://www.eu.fhg.de./nenergy/). It is recommended that theindustry participate in this project.
Matter model calculations show that the petrochemical industry is one of the few industries thatmay actually improve its export position if GHG permit prices would be introduced. The exportof carbon containing petrochemical products is accounted for as carbon export. The industry cannegotiate an exemption from GHG permit prices for the non-energy use of fossil fuels. If biomassis used as a feedstock, this should be considered as a net carbon storage that deserves a subsidyequal to the penalty on emissions.
ECN-C--99-052 51
ANNEX A THE MATTER MARKAL MODEL
The Essentials of a MARKAL modelAt present MARKAL is one of the most widely applied models for analysing the impacts of GHGemission reduction policies, although its results often have to be completed using top down mod-els (like General Equilibrium models) in addition. A MARKAL model12 is a representation of(part of) the economy of a particular region. The economy is modelled as a system of interde-pendent technical processes. These processes are characterised by their physical and economicproperties which determine the physical and monetary flows between these processes within that(part of the) economy of a region. It is a linear programming model, that maximises an objectivefunction (e.g. costs) under constraints (e.g. the attainment of certain production levels, the avail-ability of certain technologies, certain environmental policy constraints etc.). In the followingparagraphs the processes and the optimisation procedure are briefly described.
ProcessesProcesses or technical options are the building blocks of a MARKAL model. They are character-ised by, their physical inputs and outputs of energy and materials, their costs, and by other char-acteristics (in this study their GHG emissions and waste volumes). Beside the building blocks themodel does calculations for a certain time period, the modelling period. The modelling period issplit into a number of periods generally covering 5 or 10 years.
These process descriptions implicitly yield a very detailed input-output structure linking severalhundreds of processes that are included in the model in a dynamic perspective, covering the totallife cycle for both energy and materials. Of course not all substance flows in the entire economyare analysed. First, not all processes in the economy are included in the model. Secondly not allemissions are included in the description of the processes. This study for example is confined toGHG emissions. Other applications of a MARKAL model concentrate on other aspects of thesame processes.
Processes represent all activities that are necessary to provide certain products and services, inthis study: the provision of energy and materials. These processes are listed in Volume 3 of thisstudy. Many products and services can be generated through a number of alternative (sets of)processes that feature different costs and different GHG emissions.
Process descriptions follow a standard format, consisting of two data sheets. One sheet describesthe physical inputs and outputs (of energy and materials). The other characterises the economicdata and the other process data. The input data structure depends to some extent on the processthat is characterised. Data for different types of power plants, conversion processes, and end-usetechnologies are characterised in different ways. A schematic example of the input for conversionprocesses is shown in Table A.1. The data input is divided into nine time periods (column heading1 to 9). The length of the time period is set by the user of the model and is usually 5 or 10 years(10 years in this model version). One column is reserved for time-independent variables (TID).The physical data do not represent the total mass and energy balance where input equals output(because of flows that are not accounted for). The cost characteristics of the processes are di-vided into investment costs (which are proportional to the installed capacity), fixed annual costs
12 The MARKAL linear programming model was developed 20 years ago within the international IEA/ETSAP
framework (International Energy Agency/Energy Technology Systems Analysis Programme). More than 50 in-stitutes in 27 countries use nowadays MARKAL. MARKAL is an acronym for MARKet ALlocation. At presentit is the most widely used model for analysing the impacts of GHG emission reduction policies, although its re-sults often have to be completed using top down models (like General Equilibrium models) in addition.
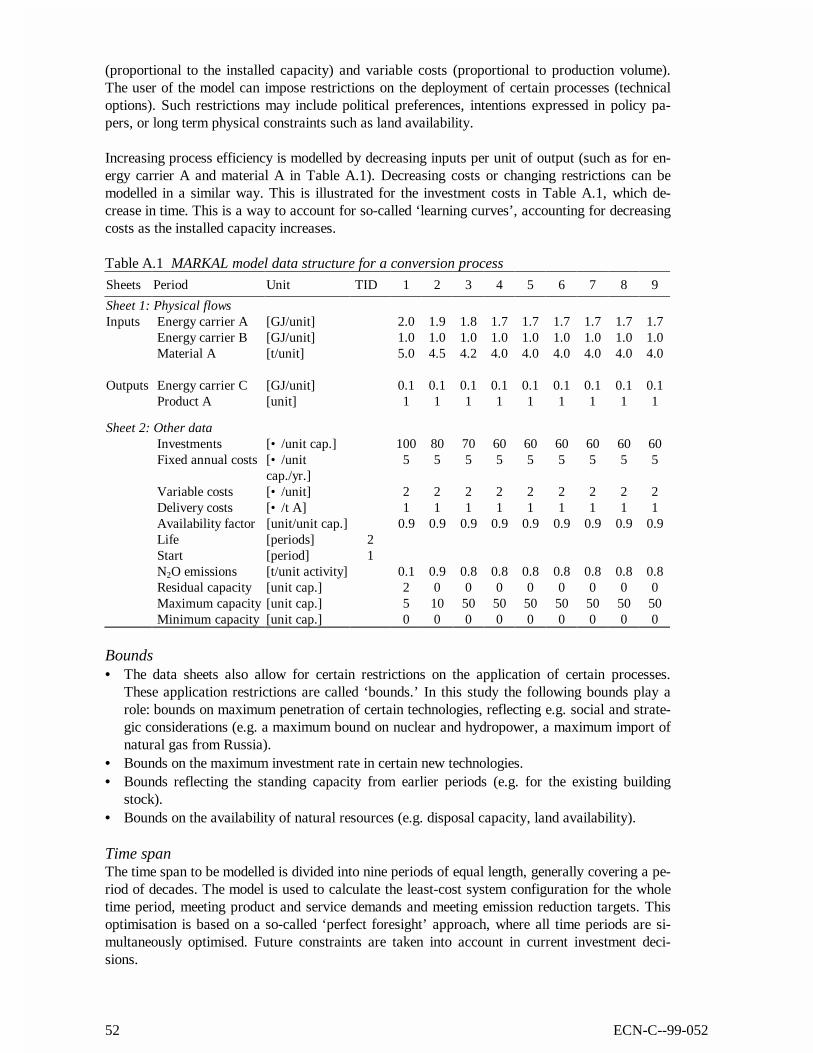
52 ECN-C--99-052
(proportional to the installed capacity) and variable costs (proportional to production volume).The user of the model can impose restrictions on the deployment of certain processes (technicaloptions). Such restrictions may include political preferences, intentions expressed in policy pa-pers, or long term physical constraints such as land availability.
Increasing process efficiency is modelled by decreasing inputs per unit of output (such as for en-ergy carrier A and material A in Table A.1). Decreasing costs or changing restrictions can bemodelled in a similar way. This is illustrated for the investment costs in Table A.1, which de-crease in time. This is a way to account for so-called ‘learning curves’, accounting for decreasingcosts as the installed capacity increases.
Table A.1 MARKAL model data structure for a conversion process
Sheets Period Unit TID 1 2 3 4 5 6 7 8 9
Sheet 1: Physical flowsInputs Energy carrier A [GJ/unit] 2.0 1.9 1.8 1.7 1.7 1.7 1.7 1.7 1.7
Energy carrier B [GJ/unit] 1.0 1.0 1.0 1.0 1.0 1.0 1.0 1.0 1.0Material A [t/unit] 5.0 4.5 4.2 4.0 4.0 4.0 4.0 4.0 4.0
Outputs Energy carrier C [GJ/unit] 0.1 0.1 0.1 0.1 0.1 0.1 0.1 0.1 0.1Product A [unit] 1 1 1 1 1 1 1 1 1
Sheet 2: Other dataInvestments [• /unit cap.] 100 80 70 60 60 60 60 60 60Fixed annual costs [• /unit
cap./yr.]5 5 5 5 5 5 5 5 5
Variable costs [• /unit] 2 2 2 2 2 2 2 2 2Delivery costs [• /t A] 1 1 1 1 1 1 1 1 1Availability factor [unit/unit cap.] 0.9 0.9 0.9 0.9 0.9 0.9 0.9 0.9 0.9Life [periods] 2Start [period] 1N2O emissions [t/unit activity] 0.1 0.9 0.8 0.8 0.8 0.8 0.8 0.8 0.8Residual capacity [unit cap.] 2 0 0 0 0 0 0 0 0Maximum capacity [unit cap.] 5 10 50 50 50 50 50 50 50Minimum capacity [unit cap.] 0 0 0 0 0 0 0 0 0
Bounds• The data sheets also allow for certain restrictions on the application of certain processes.
These application restrictions are called ‘bounds.’ In this study the following bounds play arole: bounds on maximum penetration of certain technologies, reflecting e.g. social and strate-gic considerations (e.g. a maximum bound on nuclear and hydropower, a maximum import ofnatural gas from Russia).
• Bounds on the maximum investment rate in certain new technologies.• Bounds reflecting the standing capacity from earlier periods (e.g. for the existing building
stock).• Bounds on the availability of natural resources (e.g. disposal capacity, land availability).
Time spanThe time span to be modelled is divided into nine periods of equal length, generally covering a pe-riod of decades. The model is used to calculate the least-cost system configuration for the wholetime period, meeting product and service demands and meeting emission reduction targets. Thisoptimisation is based on a so-called ‘perfect foresight’ approach, where all time periods are si-multaneously optimised. Future constraints are taken into account in current investment deci-sions.
ECN-C--99-052 53
In summaryThe user of the model determines the processes from the database that will enter the calculations;he or she also determines the constraints for the individual processes, as well as constraints forthe whole region. Constraints are determined by the demand for products and services, the maxi-mum introduction rate of new processes, the availability of resources, environmental policy goalsfor energy use and for emissions etc. Processes are characterised by their physical inputs andoutputs of energy and material, by their costs, and by their environmental impacts. Environmentalimpacts are endogenised in the process costs and the costs of energy and material flows betweenprocesses. The time scale is chosen according to the questions analysed. Since most of the proc-esses take a long time to reach their maximum penetration (often at the expense of others), suchtime horizons tend to cover several decades, in this study until 2030.
The calculation of least cost combinations (LCCs) of processes /technical optionsMARKAL requires as input projections of energy service demands - for example room space tobe heated or vehicle-miles to be travelled, for example - and projected resource costs. In themodel used (MARKAL MATTER), also the materials demand for these services are included.
Then, a reference case is defined in which; for example, no measures are required to reduce car-bon dioxide emissions. This is the base case scenario. A series of runs is then made with succes-sive emission permit prices. These penalties affect the selection of least-cost processes (see be-low). Because of the underlying detailed input output relations (imputed by means of the datasheets), interdependencies between the various processes or technical options are taken into ac-count. The model thus automatically calculates the combined effects of these interdependent op-tions. Moreover, the integrated dynamic systems approach ensures also that interactions betweentechnical options in one period and interactions between periods are reflected.
In each case, the model will find the least expensive combination (least cost combinations, LCCs)of technologies that meet that requirement - up to the limits of feasibility -. But with each furtherrestriction the total energy (energy materials) system cost will increase13. Thus, the total futurecost of emission reductions is calculated according to how severe such restrictions may become.These can be plotted as continuous abatement cost curves. In addition, the marginal cost of emis-sion reduction in each time period14 is determined. These curves can also be read as the reductionsthat can be achieved at various levels of costs (GHG permit prices). This is of special interest inestablishing abatement policy because it can be interpreted as the minimum amount of carbontax, or the minimum price of GHG permits that would be needed to achieve this level of abate-ment.
13 In the linear programming approach all processes are characterised as black boxes with a linear relation be-
tween inputs and outputs of energy and materials, costs and emissions. Economies of scale are not taken intoaccount for any given process type.
14 More precisely, the costs of the most expensive technology that must be applied in order to meet the predeter-mined level of emissions is calculated. So, actually the model calculations give us the cost of the marginal tech-nology. All other technologies that are part of the least cost combination (LCC) cost less per unit of emissionreduction. Those who can apply these more cost effective technologies will, when they are confronted with a taxor with a price of tradable permits, apply that technology, to avoid paying the tax or to free permits they can sellon the market. As a consequence more expensive technologies will not be deployed.
54 ECN-C--99-052
Some uses of MARKAL are:• to identify least-cost energy systems,• to identify cost-effective responses to restrictions on emissions,• to perform prospective analysis of long-term energy balances under different scenarios,• to evaluate new technologies and priorities for R&D,• to evaluate the effects of regulations or prices (taxes, tradable permits, subsidies), or both,• to project inventories of greenhouse gas emissions,• to estimate the value of regional co-operation.
The inclusion of materials life cyclesA distinction is made between an energy and a materials system in the most recent MARKALversions. MARKAL has originally been used as an energy systems analysis tool. Conventionalenergy system models cover the conversion of primary energy into final energy and the subse-quent final energy use in economic sectors. Of course they include industrial use of energy e.g. toproduce materials, and will therefore include for example energy efficiency gains in the produc-tion of a material. But conventional energy system studies do not analyse the effects of changes inmaterials life cycles such as materials substitution, increased materials efficiency and recycling.
In MATTER-MARKAL (the model used in this study), however, all bulk material flows are in-cluded. They include all substances without relevant physical shape (not being consumer or in-vestment goods) that are not defined as energy carriers15. The model covers more than 50 types ofenergy carriers and 150 materials, which means a substantial enlargement of more traditionalMARKAL models. More than 100 products represent the applications of these materials. 30categories of waste materials are modelled. These materials are characterised by their physicalcharacteristics and by their quality. This means that a large number of technical options (proc-esses) are added to the database of energy options. Identifying these options requires for eachbulk material a rather detailed analysis of the flow of that particular substance through the econ-omy ‘from cradle to grave’.
The inclusion of materials technical options is important for a number of reasons• By adding materials flows, the model chooses from a more comprehensive set of technological
improvement options when calculating the least cost combinations. As a result a typicalMATTER-MARKAL estimate of the least costs for attaining a certain GHG emission targettend to be lower than a typical MARKAL estimate. In fact the differences in the obtained leastcost combinations are quite substantial.
• Because the energy and materials systems are intricately interwoven, technical improvementsinfluence each other strongly. Ignoring technical improvement options in materials life cyclesmay lead to an overestimation of the effects of energy options16 and misguided policy choices.
• It is extremely difficult, if possible at all, to foresee the effects of these interdependencies ifone does not apply a formalised model that is based on rather detailed information concerningthe interrelationships between the various technical options.
• It requires a comprehensive analysis of energy and materials flows to identify the appropriatepoints of impact for policy measures (in particular regulatory approaches) and to identify un-expected responses to policy actions.
15 With the exception of consumer food products.16 For example, a technical change that reduces the emissions of electricity generation, will make the substitution
from steel to aluminium (which primary production uses much electricity) more attractive. At the same time, itwill reduce the environmental improvements that would result from using secondary aluminium instead of pri-mary aluminium; (Secondary aluminium requires only 5% of the energy needed for primary material). Anotherexample: If spaces are well insulated, an improvement of the efficiency of the heating system will have a lesspronounced effect on overall emissions than in the case of poorly insulated buildings.
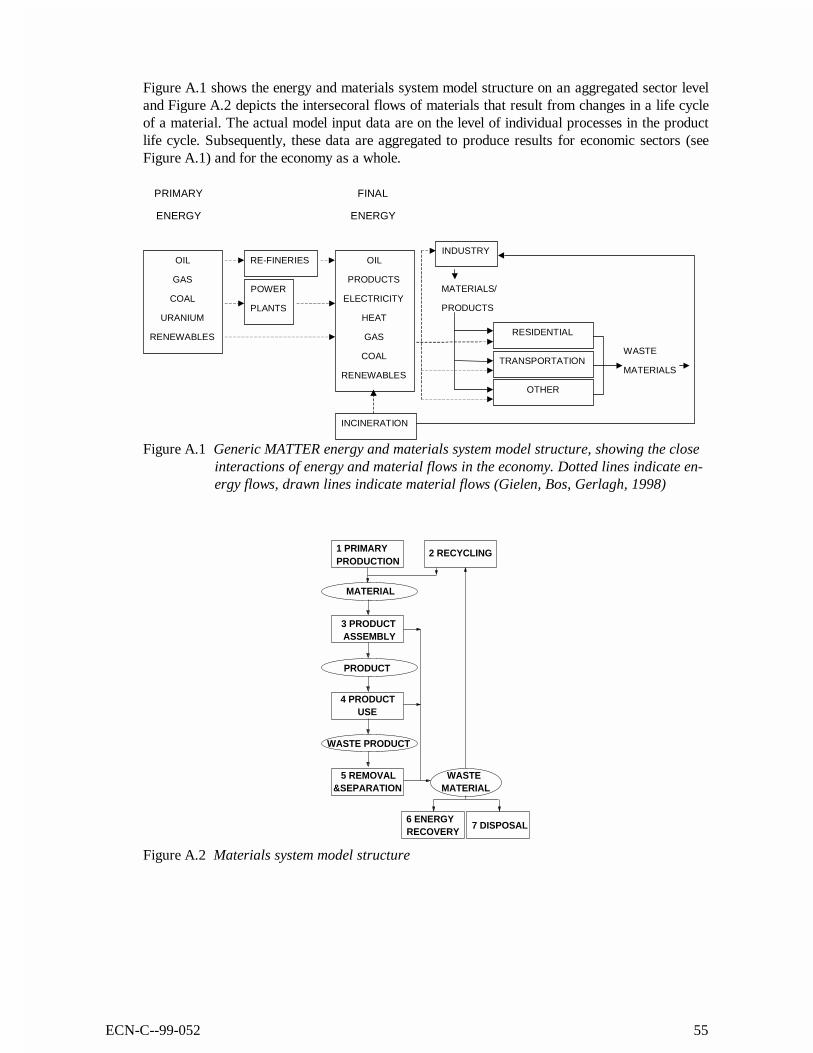
ECN-C--99-052 55
Figure A.1 shows the energy and materials system model structure on an aggregated sector leveland Figure A.2 depicts the intersecoral flows of materials that result from changes in a life cycleof a material. The actual model input data are on the level of individual processes in the productlife cycle. Subsequently, these data are aggregated to produce results for economic sectors (seeFigure A.1) and for the economy as a whole.
Figure A.1 Generic MATTER energy and materials system model structure, showing the closeinteractions of energy and material flows in the economy. Dotted lines indicate en-ergy flows, drawn lines indicate material flows (Gielen, Bos, Gerlagh, 1998)
1 PRIMARYPRODUCTION
2 RECYCLING
MATERIAL
3 PRODUCTASSEMBLY
PRODUCT
4 PRODUCTUSE
WASTE PRODUCT
5 REMOVAL&SEPARATION
WASTE
6 ENERGYRECOVERY
7 DISPOSAL
MATERIAL
Figure A.2 Materials system model structure
MATERIALS/
PRODUCTS
OIL
PRODUCTS
ELECTRICITY
HEAT
GAS
COAL
RENEWABLES
OIL
GAS
COAL
URANIUM
RENEWABLES RESIDENTIAL
POWER
PLANTS
TRANSPORTATION
INCINERATION
INDUSTRY
OTHER
PRIMARY
ENERGY
WASTE
MATERIALS
FINAL
ENERGY
RE-FINERIES
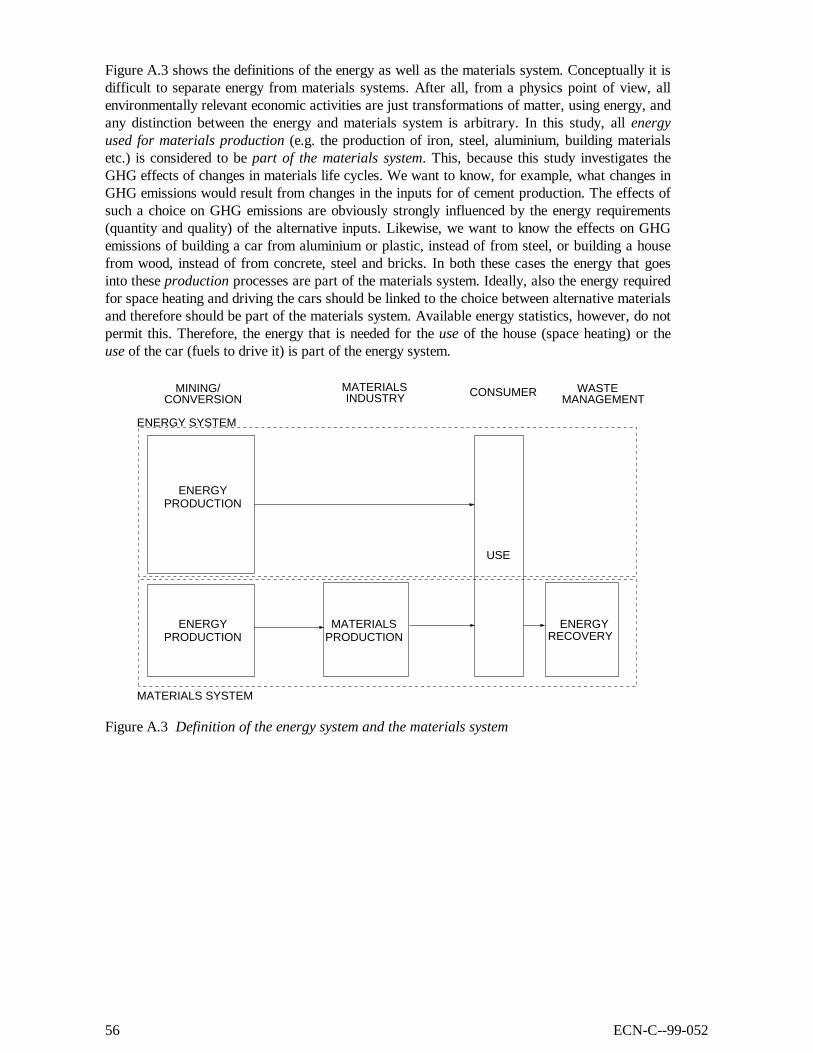
56 ECN-C--99-052
Figure A.3 shows the definitions of the energy as well as the materials system. Conceptually it isdifficult to separate energy from materials systems. After all, from a physics point of view, allenvironmentally relevant economic activities are just transformations of matter, using energy, andany distinction between the energy and materials system is arbitrary. In this study, all energyused for materials production (e.g. the production of iron, steel, aluminium, building materialsetc.) is considered to be part of the materials system. This, because this study investigates theGHG effects of changes in materials life cycles. We want to know, for example, what changes inGHG emissions would result from changes in the inputs for of cement production. The effects ofsuch a choice on GHG emissions are obviously strongly influenced by the energy requirements(quantity and quality) of the alternative inputs. Likewise, we want to know the effects on GHGemissions of building a car from aluminium or plastic, instead of from steel, or building a housefrom wood, instead of from concrete, steel and bricks. In both these cases the energy that goesinto these production processes are part of the materials system. Ideally, also the energy requiredfor space heating and driving the cars should be linked to the choice between alternative materialsand therefore should be part of the materials system. Available energy statistics, however, do notpermit this. Therefore, the energy that is needed for the use of the house (space heating) or theuse of the car (fuels to drive it) is part of the energy system.
ENERGYPRODUCTION
ENERGYPRODUCTION
MATERIALSPRODUCTION
USE
ENERGYRECOVERY
ENERGY SYSTEM
MATERIALS SYSTEM
MINING/CONVERSION
MATERIALSINDUSTRY CONSUMER WASTE
MANAGEMENT
Figure A.3 Definition of the energy system and the materials system
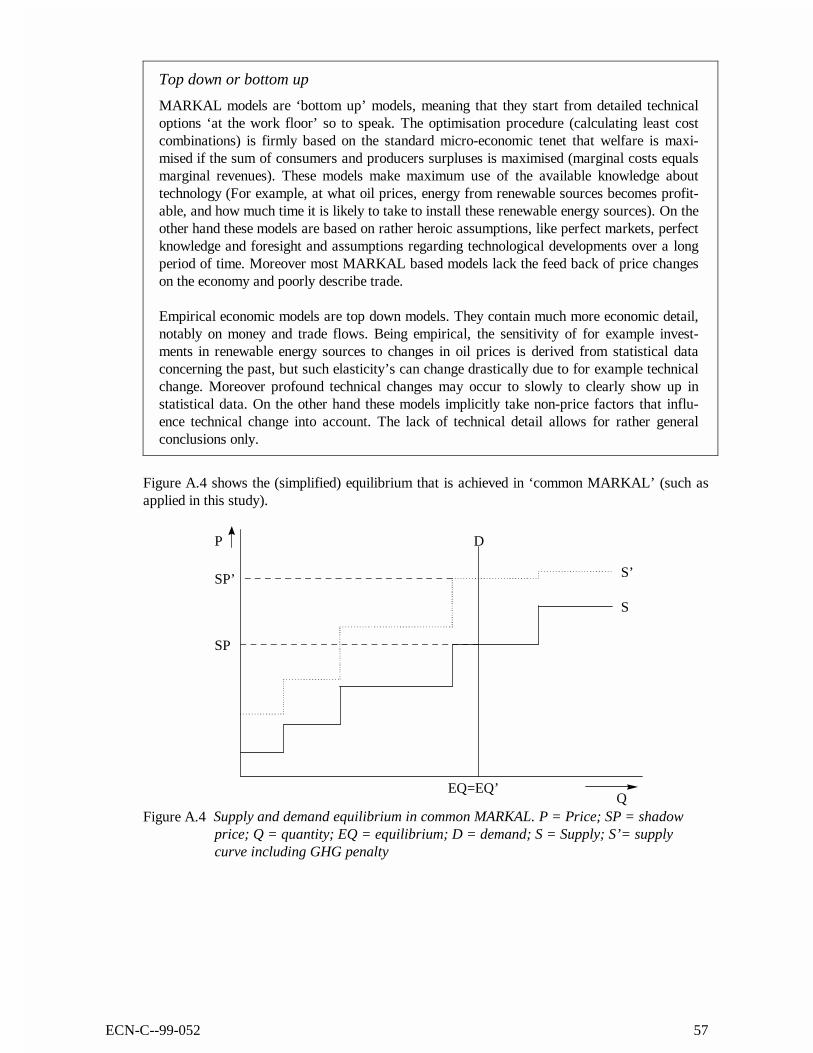
ECN-C--99-052 57
Top down or bottom up
MARKAL models are ‘bottom up’ models, meaning that they start from detailed technicaloptions ‘at the work floor’ so to speak. The optimisation procedure (calculating least costcombinations) is firmly based on the standard micro-economic tenet that welfare is maxi-mised if the sum of consumers and producers surpluses is maximised (marginal costs equalsmarginal revenues). These models make maximum use of the available knowledge abouttechnology (For example, at what oil prices, energy from renewable sources becomes profit-able, and how much time it is likely to take to install these renewable energy sources). On theother hand these models are based on rather heroic assumptions, like perfect markets, perfectknowledge and foresight and assumptions regarding technological developments over a longperiod of time. Moreover most MARKAL based models lack the feed back of price changeson the economy and poorly describe trade.
Empirical economic models are top down models. They contain much more economic detail,notably on money and trade flows. Being empirical, the sensitivity of for example invest-ments in renewable energy sources to changes in oil prices is derived from statistical dataconcerning the past, but such elasticity’s can change drastically due to for example technicalchange. Moreover profound technical changes may occur to slowly to clearly show up instatistical data. On the other hand these models implicitly take non-price factors that influ-ence technical change into account. The lack of technical detail allows for rather generalconclusions only.
Figure A.4 shows the (simplified) equilibrium that is achieved in ‘common MARKAL’ (such asapplied in this study).
D
S’
S
SP’
SP
P
QEQ=EQ’
Figure A.4 Supply and demand equilibrium in common MARKAL. P = Price; SP = shadowprice; Q = quantity; EQ = equilibrium; D = demand; S = Supply; S’= supplycurve including GHG penalty
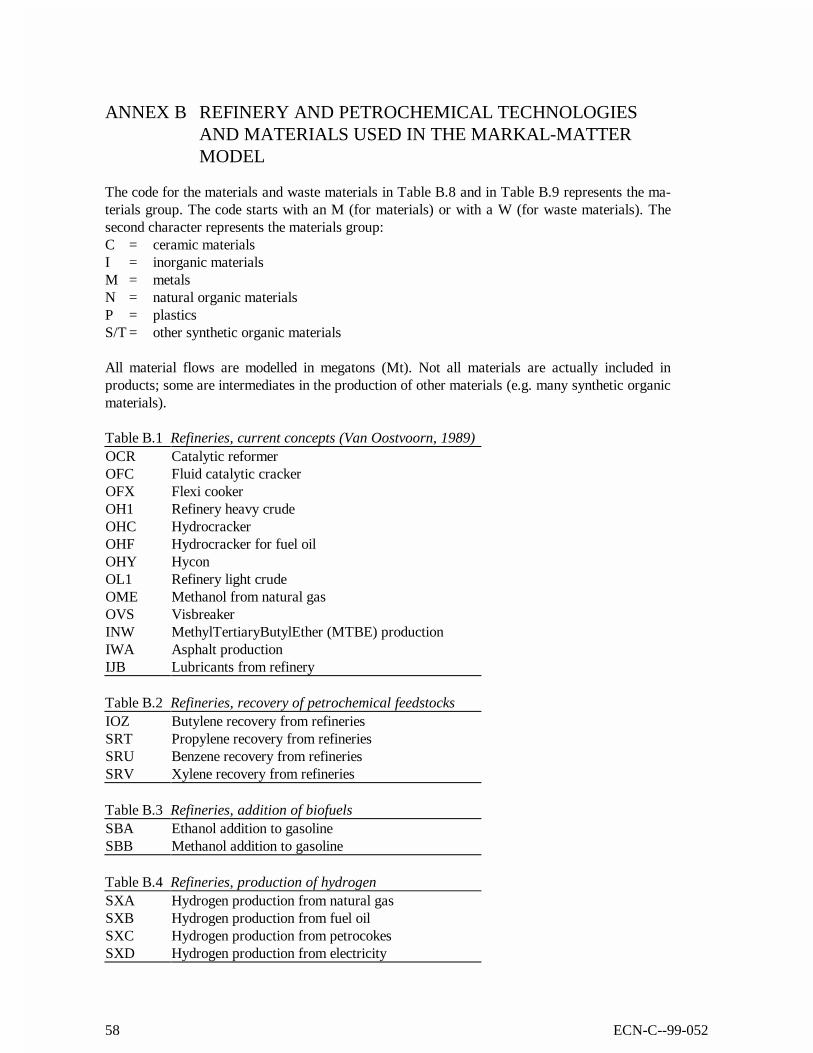
58 ECN-C--99-052
ANNEX B REFINERY AND PETROCHEMICAL TECHNOLOGIESAND MATERIALS USED IN THE MARKAL-MATTERMODEL
The code for the materials and waste materials in Table B.8 and in Table B.9 represents the ma-terials group. The code starts with an M (for materials) or with a W (for waste materials). Thesecond character represents the materials group:C = ceramic materialsI = inorganic materialsM = metalsN = natural organic materialsP = plasticsS/T = other synthetic organic materials
All material flows are modelled in megatons (Mt). Not all materials are actually included inproducts; some are intermediates in the production of other materials (e.g. many synthetic organicmaterials).
Table B.1 Refineries, current concepts (Van Oostvoorn, 1989)OCR Catalytic reformerOFC Fluid catalytic crackerOFX Flexi cookerOH1 Refinery heavy crudeOHC HydrocrackerOHF Hydrocracker for fuel oilOHY HyconOL1 Refinery light crudeOME Methanol from natural gasOVS VisbreakerINW MethylTertiaryButylEther (MTBE) productionIWA Asphalt productionIJB Lubricants from refinery
Table B.2 Refineries, recovery of petrochemical feedstocksIOZ Butylene recovery from refineriesSRT Propylene recovery from refineriesSRU Benzene recovery from refineriesSRV Xylene recovery from refineries
Table B.3 Refineries, addition of biofuelsSBA Ethanol addition to gasolineSBB Methanol addition to gasoline
Table B.4 Refineries, production of hydrogenSXA Hydrogen production from natural gasSXB Hydrogen production from fuel oilSXC Hydrogen production from petrocokesSXD Hydrogen production from electricity
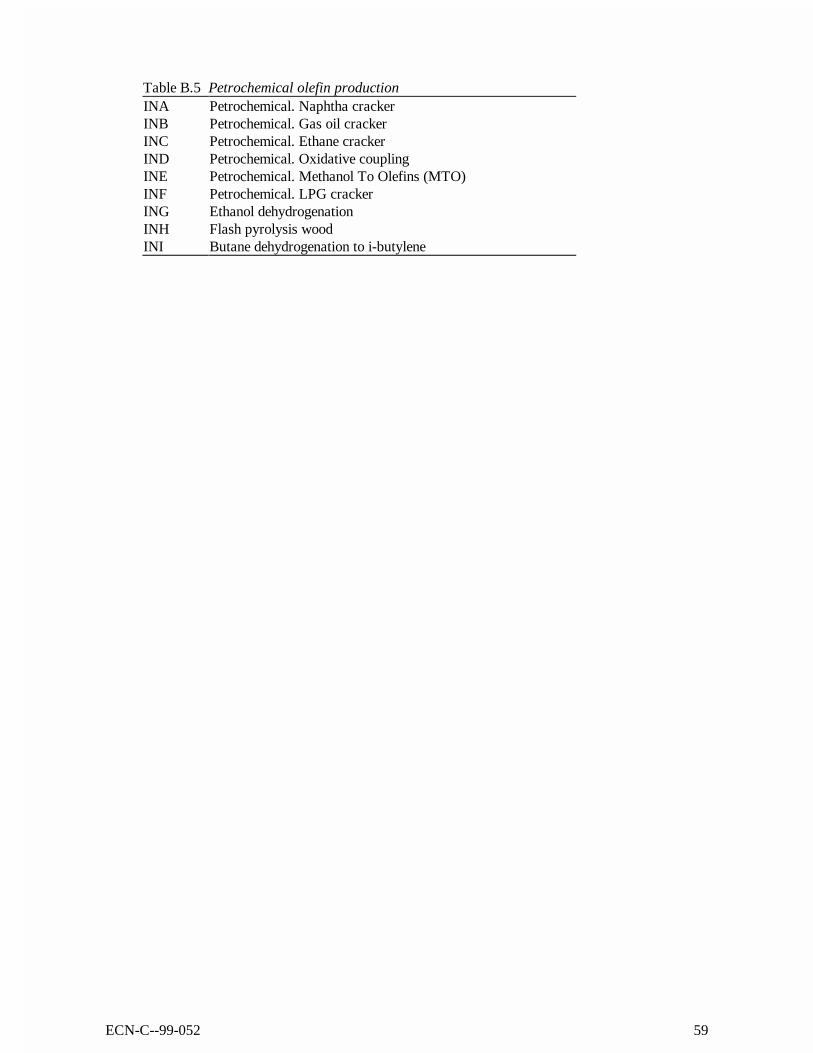
ECN-C--99-052 59
Table B.5 Petrochemical olefin productionINA Petrochemical. Naphtha crackerINB Petrochemical. Gas oil crackerINC Petrochemical. Ethane crackerIND Petrochemical. Oxidative couplingINE Petrochemical. Methanol To Olefins (MTO)INF Petrochemical. LPG crackerING Ethanol dehydrogenationINH Flash pyrolysis woodINI Butane dehydrogenation to i-butylene
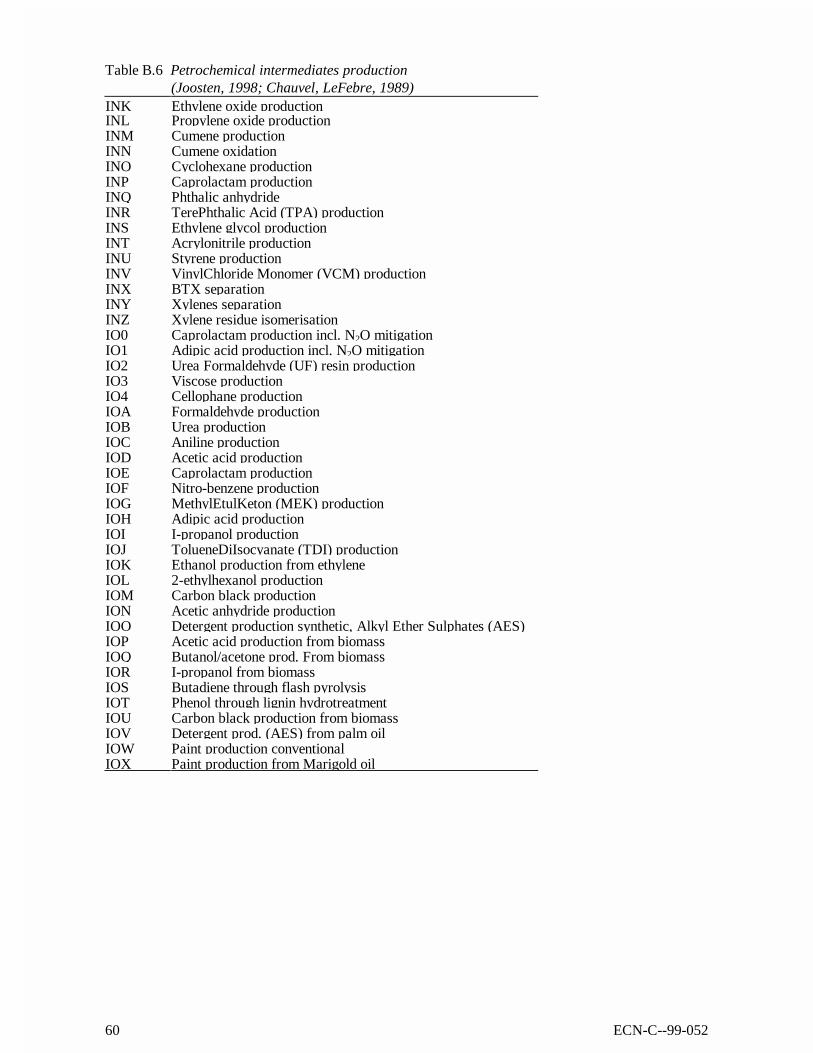
60 ECN-C--99-052
Table B.6 Petrochemical intermediates production(Joosten, 1998; Chauvel, LeFebre, 1989)
INK Ethylene oxide productionINL Propylene oxide productionINM Cumene productionINN Cumene oxidationINO Cyclohexane productionINP Caprolactam productionINQ Phthalic anhydrideINR TerePhthalic Acid (TPA) productionINS Ethylene glycol productionINT Acrylonitrile productionINU Styrene productionINV VinylChloride Monomer (VCM) productionINX BTX separationINY Xylenes separationINZ Xylene residue isomerisationIO0 Caprolactam production incl. N2O mitigationIO1 Adipic acid production incl. N2O mitigationIO2 Urea Formaldehyde (UF) resin productionIO3 Viscose productionIO4 Cellophane productionIOA Formaldehyde productionIOB Urea productionIOC Aniline productionIOD Acetic acid productionIOE Caprolactam productionIOF Nitro-benzene productionIOG MethylEtulKeton (MEK) productionIOH Adipic acid productionIOI I-propanol productionIOJ TolueneDiIsocyanate (TDI) productionIOK Ethanol production from ethyleneIOL 2-ethylhexanol productionIOM Carbon black productionION Acetic anhydride productionIOO Detergent production synthetic, Alkyl Ether Sulphates (AES)IOP Acetic acid production from biomassIOQ Butanol/acetone prod. From biomassIOR I-propanol from biomassIOS Butadiene through flash pyrolysisIOT Phenol through lignin hydrotreatmentIOU Carbon black production from biomassIOV Detergent prod. (AES) from palm oilIOW Paint production conventionalIOX Paint production from Marigold oil
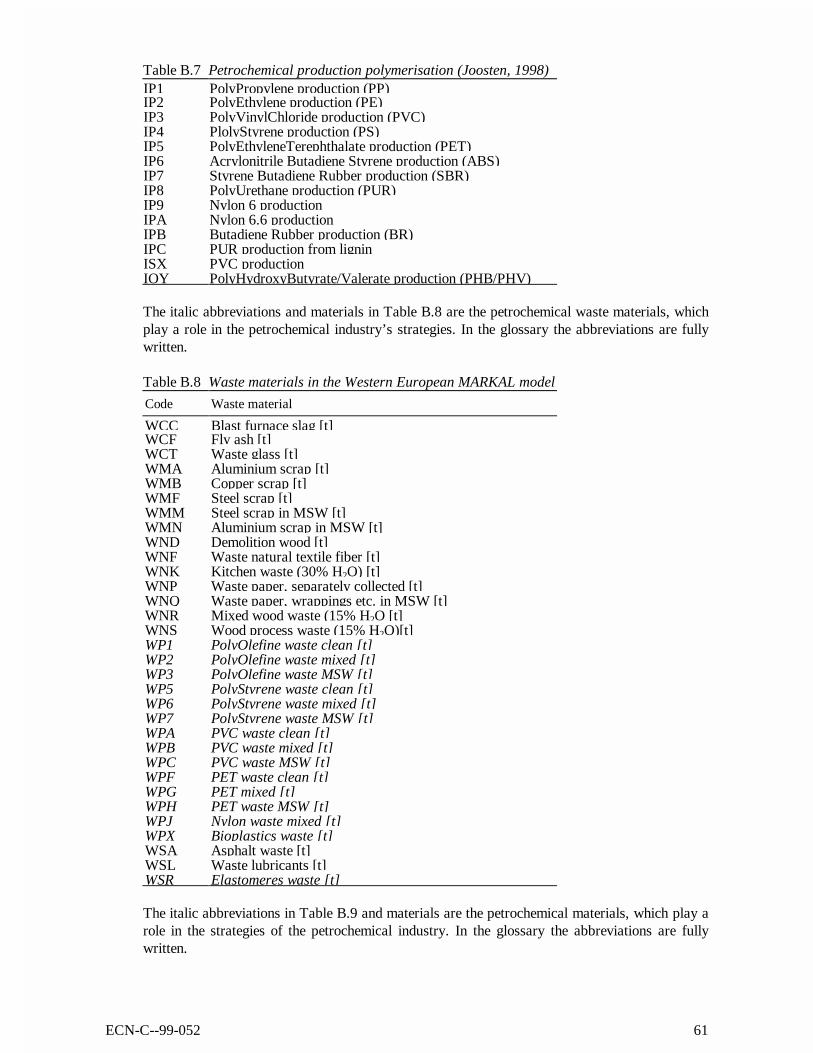
ECN-C--99-052 61
Table B.7 Petrochemical production polymerisation (Joosten, 1998)IP1 PolyPropylene production (PP)IP2 PolyEthylene production (PE)IP3 PolyVinylChloride production (PVC)IP4 PlolyStyrene production (PS)IP5 PolyEthyleneTerephthalate production (PET)IP6 Acrylonitrile Butadiene Styrene production (ABS)IP7 Styrene Butadiene Rubber production (SBR)IP8 PolyUrethane production (PUR)IP9 Nylon 6 productionIPA Nylon 6.6 productionIPB Butadiene Rubber production (BR)IPC PUR production from ligninISX PVC productionIOY PolyHydroxyButyrate/Valerate production (PHB/PHV)
The italic abbreviations and materials in Table B.8 are the petrochemical waste materials, whichplay a role in the petrochemical industry’s strategies. In the glossary the abbreviations are fullywritten.
Table B.8 Waste materials in the Western European MARKAL model
Code Waste material
WCC Blast furnace slag [t]WCF Fly ash [t]WCT Waste glass [t]WMA Aluminium scrap [t]WMB Copper scrap [t]WMF Steel scrap [t]WMM Steel scrap in MSW [t]WMN Aluminium scrap in MSW [t]WND Demolition wood [t]WNF Waste natural textile fiber [t]WNK Kitchen waste (30% H2O) [t]WNP Waste paper, separately collected [t]WNQ Waste paper, wrappings etc. in MSW [t]WNR Mixed wood waste (15% H2O [t]WNS Wood process waste (15% H2O)[t]WP1 PolyOlefine waste clean [t]WP2 PolyOlefine waste mixed [t]WP3 PolyOlefine waste MSW [t]WP5 PolyStyrene waste clean [t]WP6 PolyStyrene waste mixed [t]WP7 PolyStyrene waste MSW [t]WPA PVC waste clean [t]WPB PVC waste mixed [t]WPC PVC waste MSW [t]WPF PET waste clean [t]WPG PET mixed [t]WPH PET waste MSW [t]WPJ Nylon waste mixed [t]WPX Bioplastics waste [t]WSA Asphalt waste [t]WSL Waste lubricants [t]WSR Elastomeres waste [t]
The italic abbreviations in Table B.9 and materials are the petrochemical materials, which play arole in the strategies of the petrochemical industry. In the glossary the abbreviations are fullywritten.

62 ECN-C--99-052
Table B.9 Materials in the Western European MARKAL model
Code Material Code material
MCA Concrete building blocks [t] MPA Cellophane [t]MCB Bricks [t] MPB PHB/PHV (biopol) [t]MCC Cement [t] MPC Butadiene Rubber (BR) [t]MCD Ready mix concrete [t concr. equiv.] MPE PolyEthylene [t]MCE Prefab concrete [t concr. equiv.] MPF Acrylonitrile Butadiene Styrene [t]MCH High strength cement [t conv. cem. equi] MPG Styrene Butadiene Rubber [t]MCK Portland cement clinker [t] MPM Nylon 6.6 [t]MCL Sand-lime bricks [t] MPN Nylon 6 [t]MCM Marble and granite stones [t] MPP PolyPropylene [t]MCQ Quicklime (CaO) [t] MPR UF Resins [t]MCS Floor tiles + stoneware [t] MPS PolyStyrene [t]MCT Glass [t] MPT PolyEthylene Terephthalate [t]MCY Gypsum [t] MPU PVC [t excl. Additives]MCZ Kaolin [t] MPV PVC [t incl. additives]MIA Nitric acid [t] MPW PUR [t]MIC Chlorine [t] MSA Asphalt [t]MIF Ammonia [t NH3 equiv.] MSB Benzene [t]MIK Potash [t K2O equiv.] MSC Caprolactam [t]MIN NaOH [t] MSD Detergents [t]MIP Phosphoric acid [t P2O5 equiv.] MSE Ethylene [t]MIS Soda [t] MSF Propylene [t]MIZ Sodium chloride [t] MSG C4-fraction [t]MMA Aluminium [t] MSH Butadiene [t]MMB Copper cathode [t] MSI Butylene [t]MMC Cast iron [t] MSJ BTX [t]MMD Dri quality steel [t] MSK Toluene [t]MMF Direct reduced iron [t] MSL Lubricants [t]MMH High quality crude steel [t] MSM Cyclohexane [t]MMI Iron [t] MSN Cumene [t]MML Low quality crude steel [t] MSO DiEthylene glycol [t]MMM Medium quality crude steel [t] MSP Paint [t paint equivalents]MMN Reinforcement steel [t] MSQ Xylenes (mixed) [t]MMO Hot rolled section steel [t] MSR Natural elastomeres (rubber) [t]MMP Hot rolled coil steel [t] MST Ethylene oxide [t]MMQ Cold rolled coil steel [t] MSU Ethylene glycol [t]MMR Cold rolled coil AT&F steel [t] MSV Propylene oxide [t]MMS Cold rolled coil F&P steel [t] MSW Acrylonitrile [t]MMT Heavy plate steel [t] MSX P-Xylene [t]MMU Wire rod steel [t] MSY O-Xylene [t]MMV Alloy steel [t] MSZ Xylene residue [t]MMW Galvanized/tinplate steel [t] MTA TerePhthalic Acid [t]MMX Copper concentrate [t] MTB Butanol [t]MMY Semi-finished copper [t] MTC Acetone [t]MNA Compost (15% H2O) [t] MTD Phenol [t]MNB Roundwood (15% H2O) [t] MTE Phthalic Anhydride [t]MNC Chipboard [t] MTF Styrene [t]MNF Fiber board [t] MTG Vinyl Chloride Monomer (VCM) [t]MNG Gravel and sand [t] MTH Formaldehyde [t]MNK Palm kernel oil [t] MTI Urea [t]MNL Marigold flower oil [t] MTJ Aniline [t]MNM High quality waste paper pulp [t] MTK Acetic acid [t]MNN Low quality waste paper pulp [t] MTL HexaMethyleneDiAmine [t]MNO Mechanical pulp [t] MTM Nitro-Benzene [t]MNP Packaging paper and sanitary paper [t] MTN Methyl Ethyl Keton (MEK) [t]MNQ Graphic paper [t] MTO Adipic acid [t]MNR Newsprint [t] MTP I-Propanol [t]MNS Wool [t] MTP Toluenediisocyanate [t]MNT Sawn tropical hardwood (15% H2O) [t] MTQ 2-Ethylhexanol [t]MNU Chemical pulp [t] MTS Carbon black [t]MNV Viscose/rayon [t] MTU Surfactant (AES) [t]
ECN-C--99-052 63
MNW Other sawn wood/plywood (15% H2O) [t] MTV acetic anhydride [t]SIN Sinter [t iron equiv.] ORE Iron ore [t]PEL Pellets [t iron equiv.] OXY Oxygen [t]
64 ECN-C--99-052
REFERENCES
Albright, L.F., B.L. Crynes, S. Nowak: Novel Production Methods for Ethylene, lighthydrocarbons and aromatics, Marcel Dekker, New York, 1992.
Anonymous: Adipic Acid/Adiponitrile, Chemical Week, P. 31 (March. 10, 1999).
Arthur D. Little: Breakthrough Industrial Energy Conservation Technologies, Phase 2 –Promoting Development and Implementation. Final report to Novem, Arthur D. LittleInternational, Inc., Rotterdam, May 1998.
Association of Plastics Manufacturers in Europe (APME): Plastics consumption and recoveryin Western Europe 1994. Brussels, Belgium, 1996.
Association of Plastics Manufacturers in Europe (APME): Plastics, a material of choice forthe 21st century. Insight into Plastics Consumption and Recovery in Western Europe1997. Brussels, Belgium, 1999.
Association of the Dutch Chemical Industry: Integrated Substance Chain Management.Leidschendam, the Netherlands, December 1991.
Ayres, R.U., L.W. Ayres: Industrial Ecology. Towards Closing the Materials Cycle. EdwardElgar, Cheltenham, UK, 1996, pp. 146.
Biggin, I.S.: The Coatings Scene in Europe. Polymers Paint Colour Journal. 184, pp. 288-289, June 15, 1994.
Brezet, J.C., C.G. van Hemel: Ecodesign: a promising approach to sustainable productionand consumption. UNEP, Paris, France, 1997. ISBN 92.807.1631.x.
Bruce, J.P., H. Lee and E. Haites (eds.): Climate Change 1995. The Economic and SocialDimensions of Climate Change. Contribution of WG III to the Second AssessmentReport of the IPCC. Cambridge University Press, MA, USA, 1996.
Castellan, A., J.C.J. Bart, and S. Cavallaro: Synthesis of adipic Acid via Nitric Acid Oxidationof Cycohexanol in a Two-Step Continuous Process, Catal. Today 9, pp. 301-322 (1991).
Centraal Bureau voor de Statistiek: Jaarstatistiek voor de buitenlandse handel. SDU,‘s Gravenhage.,1989-1992 (in Dutch).
Chauvel, A., G. Lefebre: Petrochemical Processes. Volume 1+2. Editions Technip, Paris,1989.
Chauvel, A., G. Lefebre: Petrochemical Processes, vol. 1: Synthesis-gas Derivates and majorHydrocarbons; vol. 2: Major oxygenated and Nitrated Derivates, Editions Technip,Paris, 1989.
Chemical Week, 22 March 1995, pp. 51.
Duin, R. van: Production and consumption of materials in Western Europe in the year 2000.An overview of materials with CO2 relevance. Bureau B&G, Emst, July 1997.
ECN/RIVM: Optiedocument voor emissiereductie van broeikasgassen. Inventarisatie in hetkader van de Uitvoeringsnota Klimaatbeleid. ECN-C-98-082. Petten, Oktober 1998.
Ehrig, J. (ed.): Plastics recycling. Hanser Verlag, Munich, Germany, 1992.
Ehrig, R. (ed.): Plastics Recycling. München, Hanser Verlag, 1992.
Energy balances of OECD countries 1993-1994, Table 87.
EU DG XVII: ATLAS Project. Energy technology information base 1980-2010. ETSU,Harwell, UK, 03/12/1997.
European Chemical News, 27 March - 2 April 1995, pp. 9.
Farla, J., C. Hendriks, and K. Blok: Carbon dioxide recovery from industrial processes. STS,
ECN-C--99-052 65
Utrecht University, December 1992.
Geem, P.C. van: Nieuwe routes naar etheen (in Dutch), Proces Technologie, april 1992.
Gielen D.J.,: Western European Materials as Sources and Sinks of CO2: an MFA perspective.Journal of Industrial Ecology, Volume 2, Number 2, 1998.
Gielen D.J.: Materialising Dematerialisation. Integrated energy and Materials SystemsEngineering for GHG Emission Mitigation. Design for Sustainability Program, DelftUniversity of Technology, April 1999, pp. 159.
Gielen D.J.: Potential CO2 emisisons in the Netherlands due to carbon storage in materialsand products. Ambio vol. 26, no. 2, March 1997, pp. 101-106.
Gielen D.J.: Technology Characterisation for Ceramic and Inorganic Materials. Input Datafor Western European MARKAL. ECN-C--97-064, Petten, September 1997.
Gielen, D.J., D. Vos, and A.W.N. van Dril: The Petrochemical industry and its Energy use.Prospects for the Dutch Energy Intensive Industry. ECN-C--96-029, Petten, April 1996.
Gielen, D.J., P.A. Okken: CO2 reduction through materials chain management. In: EnergyTechnologies to Reduce CO2 Emissions in Europe: Prospects, Competition, Synergy.IEA/OECD, Paris, 1994.
Gielen, D.J., P.A. Okken: The invloed van kunststofrecycling op de Nederlandse CO2-emissie.(The impact of plastic waste recycling on the Dutch CO2 emissions). ECN-C--93-051.Petten, September 1993.
Gielen, D.J., P.R. Koutstaal, T. Kram, and S.N.M. van Rooijen: Post-Kyoto. Effects on theClimate Policy of the European Union. ECN-C--98-040. Petten, June 1998.
Gielen, D.J., T. Gerlagh, and A.J.M. Bos: MATTER 1.0. A MARKAL Energy and MaterialsSystem Model Characterisation. ECN-C--98-065. Petten, September 1998.
HCP, Petrochemical Processes, Hydrocarbon processing, divers years.
Hentefricke, K.: ‘The European Market for Solvents’, Polymers Paint Colour Journal. 184,pp. 292-294, June 15, 1994.
Janz, J.: Kunststoffverwertung im Hochofen - Ein Beitrag zum ökologischen undökonomischen Recycling von Altkunststoffen. (The use of waste plastic in blastfurnaces). In: Energetische und stoffliche Nutzung von Abfällen und NachwachsendenRohstoffen. Conference proceedings 22-24 April 1996. Report no. 9603. DGMK,Hamburg, Germany.
Joosten, L.A.J.: Process data descriptions for the production of synthetic organic materials.Input data for the MATTER study. Utrecht University, NW&S rep. no. 98028, June1998.
Kaminsky, W.: Possibilities and Limits of Pyrolysis. In H. Höcker: Recycling of Polymers.Makromol. Chem., Makromol. Symp. no. 57. Basel, Hüthig & Wepf, 1992.
Kaminsky, W.: Re-use of rubber and plastics by pyrolysis. Paper presented at Recycle 1993,Davos, Switzerland, 22nd-26th March 1993.
Knijff, A. van der: AVI-STEG. Paper presented at the Algemene Energie Consulenten AECseminar Alternative waste management technologies, 23 May 1995, the Netherlands.
Knopf, H.J.: Thermische Verwertung von Kunststofabfällen in Zementöfen. (Energy recoveryfrom plastic waste in cement kilns). In: Brandrup et al.: Die Wiederverwertung vonKunststoffen. Hanser Verlag, Munich, Germany, 1995, pp. 847-864.
Kunststoffe: Special edition October 1993, pp. 725-824.
Lindenberg, H.U., H. de Haas, W. Juchhoff, J. Janz, G. Reimer, W. Weiss: RohstofflichesRecycling von Kunststoffen als Reduktionsmittel im Hochofen. (Energy recovery fromplastic waste in blast furnaces). Stahl und Eisen vol. 116, no. 8, 1996, pp. 89-93.
Lu, Y., A.G. Dixon, W.R. Moser, Y.H. Ma: Analysis and Optimisation of gross-flow Reactors
66 ECN-C--99-052
for Oxidative Coupling of Methane, Ind. Eng. Res. 36. 1997, pp. 365-372.
McKeever, D. R. Anderson: Timber products used to build US single family houses in 1988.Forest Products Journal vol. 42, no. 4, pp. 11-18.
Menges, G., W. Michaeli, M. Bittner (eds): Recycling von Kunststoffen. Hanser Verlag,Munich, Germany, 1992.
Miguel, J.P.X., J. Coronas, M. Menendez, and J. Santamaria: Methane Oxidative couplingover different alkali doped catalyst: a comparison of ceramic membrane reactors andconventional fixed bed reactors, React. Kinet, Catal. Lett., 59(2), 1996, pp.277-248.
Niemann, K., F. Wenzel: The VEBA-COMBI-CRACKING-Technology: An update. FuelProcessing Technology, 35, pp. 1-20, 1993.
Oostvoorn F. van, et.al.: SERUM. Een model van de Nederlandse raffinage-industrie. ESC-49.Petten, Oktober 1989.
Patel, M., E. Jochem, F. Marscheider-Weidemann, P. Radgen, N. von Thienen: C-Ströme.Material- und Energieströme des nichtenergetischen Verbrauchs über den Lebenszyklusund CO2-Minderung durch Produkte der Chemischen Industrie - Stand undPerspektiven. Band 1: Abschätzungen für das Gasamtsystem. FHG-ISI, Karlsruhe,Germany, June 1999.
Patel, M., Fraunhofer Institut für systemtechnik und Innovationsforschung, Karlsruhe,unpublished internal report, 1996.
Philips, A.: From Green to Gold. Information brochure. Eindhoven, not dated.
Phylipsen, D., E. Worrell, K. Blok: Parameters affecting energy consumption in thepetrochemical industry, ECEEE Summer Study 1995, Utrecht University, Department ofScience, Technology and Society, Utrecht, 1995.
Redwan D.S.: Methanol conversion to olefins over high-silica zeolites in continuous flowfixed-bed-reactor, Petroleum Science and Technology, 15 (1&2), 1997, pp. 19-36.
Reimer, R.A., C.S. slaten, M. Seapan, T.A. Koch, and V.G. Triner: Adipic Acid Industry –N2O Abatement, Implementation of Technologies for Abatement of N2O Emissionsassociated with Adipic Acid manufacture, DRAFT, July 1999.
Schönfelder, H., J. Hinderer, J. Werther, F.J. Keil: Methanol to olefins – Prediction of theperformance of a circulating fluidised-bed reactor on the basis of kinetic experimentsin a fixed-bed reactor, Chemical Engineering Science 49 (24B), 1994, pp. 960-963.
Schurr, U., M. Schneider: Selektive Inlösungnahme. (Selective dissolution). Kunststoffe vol. 83no.11, pp. 910-914.
Scott, A.: Chemical Week, p. 21, 52, 7 January 1998.
See the project internet site http://www.ecn.nl/unit_bs/etsap/markal/matter/.
See the project internet site http://www.eu.fhg.de/nenergy/.
See the project internet site http://www.eu.fhg.de/nenergy/.
Steinberg, M., P.T. Fallon, and M.S. Sundaram: The flash pyrolysis and methanolysis ofbiomass (wood) for production of ethylene, benzene and methanol. Novel productionmethods for ethylene, light hydrocarbons and aromatics, Marcel Dekker, New York,1992.
Stratton, A., D.F. Hemming, M. Teper: Ethylene production from oil, gas and coal derivedfeedstock, IEA Coal Research, London, 1983.
Tullo, A.: Solutia Postpones Massive Phenol Plant as Market Weakens, Chem. Mktg. Rep.,pp. 3, 3 May 1999.
Uitdenbogerd, D.E., N.M. Brouwer, J.P. Groot-Marcus: Domestic energy saving potentials forfood and textiles. An empirical study. Report no. 2. Household and Consumer studies,Wageningen Agricultural University, the Netherlands, 1998.
ECN-C--99-052 67
Visalli, J.R.: Recycling individual polymers from mixed plastic wastes. Rensselaer PolytechnicInstitute, Troy NY, USA, June 1992.
Watson, R., M.C. Zinyowera, R.H. Moss, D.J. Dokken (eds.): Climate Change 1995. Impacts,Adaptations and Mitigation of Climate Change: Scientific-technical Analysis.Contribution of Working Group II to the Second Assessment Report of the IPCC.Cambridge University Press, Cambridge, UK, 1996.
Weissermel, K., H.J. Arpe: Industrial Organic Chemistry (in Dutch). VCH. Weinheim, 1994.
Zehnder, S., What are Western Europe’s petrochemical feedstock options?, Hydrocarbonprocessing, February 1998.