Embed Size (px)
Citation preview
259 Glen Osmond RdFrewville South Australia 5063
Telephone: 08 8338 2340Fax: 08 8338 2360
email: [email protected]
The Future of Plastic Carry Bagsin South Australia œ A Ban or Levy
Prepared for: Paul Vogel and Vaughan Levitzke
Project No: 6798
Date: 18th July 2003
CONTENTS
Section 1 Introduction.................................................................................... 1
...................................................................... 3Section 2 Executive Summary
2.1 Executive Summary ..................................................................................... 4
Section 3 Analysis.......................................................................................... 8
3.2 Present Level of Plastic Carry Bags Usage............................................... 13
3.3 Satisfaction with Present Level of Use of Plastic Carry Bags.................... 19
3.4 Importance of Environmental Protection.................................................... 27
3.5 Incidence of Reusing Plastic Carry Bags................................................... 32
3.6 Level of Agreement with Statements ......................................................... 38
3.7 Legislation or Business to Curb Problem................................................... 51
3.8 Ban or Levy ................................................................................................ 61
3.9 Preferred Extent of Ban œ If Ban in Place .................................................. 64
3.1 Perceived Environmental Problem of Present Use and Disposalof Plastic Carry Bags ................................................................................... 9
Number of Plastic Bags Used Per Week .......................................................... 16
Feelings Towards Use of Plastic Bags ............................................................. 23
Number of Plastic Carry Bags Reused/Recycled.............................................. 36
Statement of Greatest Concern ........................................................................ 46
Suggested Ways in Which Retailers and Businesses Could FixEnvironmental Problem Caused by Plastic Carry Bags .................................... 54
3.10 Preferred Alternatives to Plastic Carry Bags ............................................. 67
3.11 Influence of Ban on Shopping Behaviour .................................................. 79
3.12 Preferred Bag Types to Apply Levy ........................................................... 89
Maximum Price Prepared to Pay Per Plastic Carry Bag ................................... 92
3.13 Influence of Charge or Levy on Shopping Behaviour ................................ 94
3.14 Willingness to Pay Extra for Biodegradable Plastic Carry Bag................ 101
3.15 Informed Preference for Ban or Levy....................................................... 105
Appendix 1: About The Research ........................................................................................ 109
Appendix 2: Additional Comments ....................................................................................... 112
Appendix 3: Sampling Tolerance ......................................................................................... 115
Appendix 4: Questionnaire................................................................................................... 117
Appendix 5: How To Read The Computer Tabulations ....................................................... 124
For enquiries on this report please contact Zing Hai Tan, Prue Jay or Belinda Woite.
S:\CE\Executive\Marketing\Andrea Day\Web Stuff\EPA Plastic Bags SA Survey.doc
Section 1Introduction
- 1 -
Background
1.1 The key purpose of the research was to examine the general public‘s
perception of plastic bags and strategies associated with limiting or
banning plastic carry bags in 4 states œ NSW, Queensland, SA and
ACT.
1.2 This report specifically outlines the findings of the South Australian
component.
Methodology
1.3 Between the 1st and the 7th of July 2003, 503 telephone interviews were
conducted with a random selection of South Australian residents. 400
interviews were conducted with metropolitan Adelaide residents and 103
interviews were conducted with residents of regional South Australia.
- 2 -
Section 2Executive Summary
- 3 -
2.1 Executive Summary
The research has revealed that the South Australian general public
would support a ban of plastic carry bags assuming that environment
friendly alternative bags were made available to the public, over a
charge or levy on plastic carry bags at the point of sale.
Calico, or woven cotton bags for multiple use (83% happy to use) was
the preferred alternative that respondents would be happy to use in
place of conventional plastic carry bags, followed by starch based
biodegradable bags generally for single use (58%) and/or paper bags
(50%).
The present use and disposal of plastic bags was perceived to be a
problem by the overwhelming majority (94%) of respondents, with more
than three quarters (78%) considering it to be a major problem.
While the greatest proportion (59%) of respondents stated that their
present use of plastic bags is about the same as it was 12 months ago,
almost one third (31%) of all survey participants claimed that they now
use less plastic carry bags than they did 12 months ago.
Over the past year, the number of plastic carry bags used per week has
decreased by approximately 1.4 bags, from an average 9.3 bags per
week a year ago to 7.9 bags a week now.
More than half (57%) of all respondents were satisfied with their present
level of use of carry bags, however, only 14% stated that they were very
satisfied. Almost three in ten (29%) interviewees were dissatisfied with
their present level of use of plastic carry bags.
There is a general desire to reduce the number of plastic bags being
used, with the greatest proportion (64%) of respondents stating that they
feel they should be using fewer plastic bags. Another 34% of
respondents feel that they should continue to use about the same
number of plastic carry bags.
- 4 -
The protection of the environment is also of high importance, with the
overwhelming majority (99%) of respondents considering the protection
of the environmental to be important to them personally.
In regard to reusing and recycling of plastic bags, the research has
revealed that a significantly high proportion (89%) of respondents reuse
plastic carry bags as bin liners, 75% reuse them as general carry bags
and 33% reuse them as lunch bags. While more than one in five (22%)
respondents claimed to reuse plastic carry bags when shopping, this
was the least likely way in which the plastic carry bags were reused.
On average, respondents claimed they would reuse 7.5 bags and would
recycle 1.5 bags out of 10.
Respondents were more likely to agree with the statement —plastic bags
entangle and harm marine life and other animals“ (93%) than —plastic
carry bags are not biodegradable and are difficult to break down“ (67%).
Clearly, legislation is the preferred way in which South Australian survey
respondents would prefer the plastic bags problem to be resolved, with
the greatest proportion of respondents stating that Government should
introduce legislation to fix the problem (59%). Almost one quarter (23%)
of all interviewees thought that the problem should be left to retailers and
businesses, while another 18% were not sure.
The three main suggested ways in which respondents though retailers
and businesses could fix environmental problems caused by plastic
bags were:
• Provide paper bags (32%)
• Provide biodegradable bags (26%)
• Offer alternatives to plastic bags (20%)
As an initial response, a ban on non-biodegradable bags with
environmentally friendly bags made available to the public (70%) was
the preferred of two options, with only 20% of respondents stating that
- 5 -
they would prefer a charge or levy on plastic carry bags at the point of
sale.
If a ban were to be placed on plastic carry bags, the greatest proportion
(60%) would like the ban to cover all types of plastic carry bags.
The results reveal that ban on conventional non-biodegradable plastic
carry bags is unlikely to have any significant influence on shopping
behaviour, with the majority (94%) of respondents agreeing that there
would be no change to their shopping pattern. It was also revealed that
a charge or levy would not have any significant impact on shopping
patterns (91% indicated it would not change their shopping pattern).
If a charge was the options to be adopted, respondents indicated that
they would be prepared to pay an average 8.6 cents per plastic carry
bag.
More than two thirds (68%) of all respondents stated that they would be
prepared to pay an extra 2 or 3 cents for a biodegradable plastic carry
bag, with 40% stating that they would definitely pay an extra 2 or 3 cents
for such a bag.
Respondents were read the following.
The major difference between a ban on plastic carry bags as
opposed to a charge or levy is that a ban is a once-off solution that
seeks to take the offending plastic carry bags out of circulation,
while a charge or levy is an on-going tax to minimise the number of
plastic carry bags in use. Both have their advantages and
disadvantages.
They were asked to think about the issue in more depth and if they
would prefer to see:
• A ban on non-biodegradable plastic carry bags with environment
friendly alternative bags available to the public.
• A charge or levy on plastic carry bags at the point of sale.
- 6 -
A ban was clearly the preferred option (73%, compared to 21% who
were in favour of the levy).
It should be noted that while support for a ban was very strong, it was
conveyed in the context of environment friendly alternative bags being
available to the public at the same time.
- 7 -
Section 3Analysis
- 8 -
This section outlines the key findings of the research.
3.1 Perceived Environmental Problem of Present Use and Disposal of Plastic Carry Bags
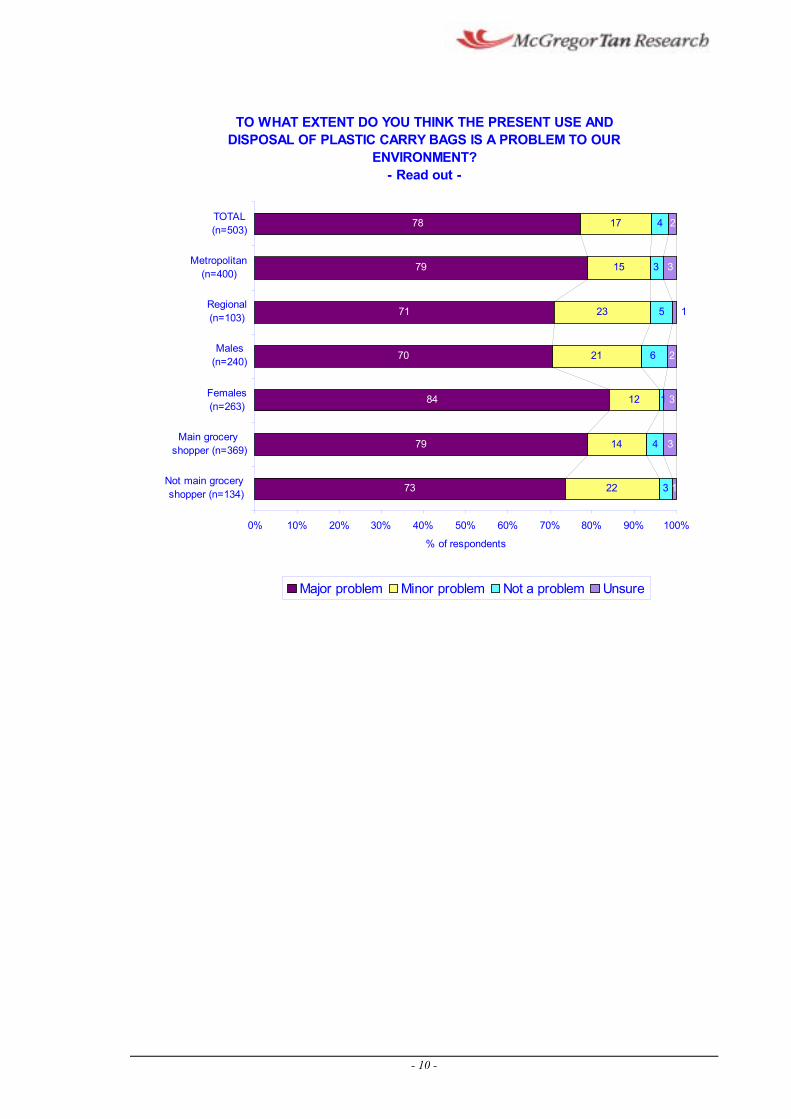
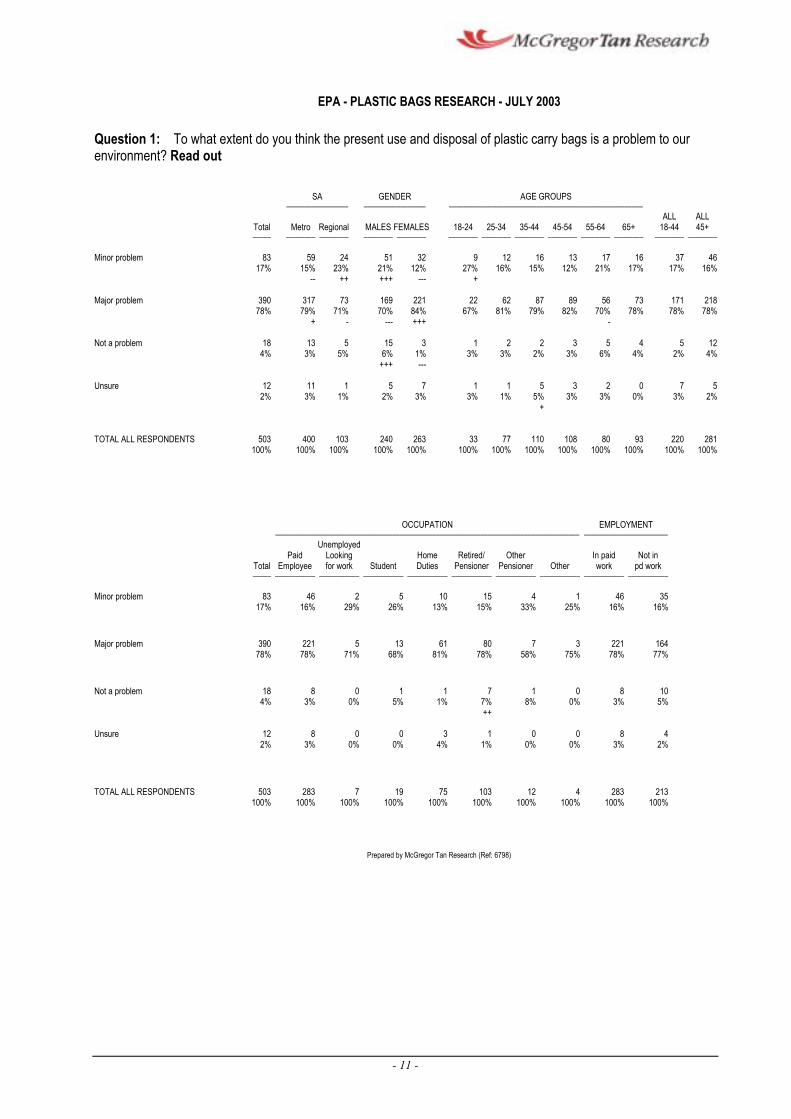
3.1.1 All respondents were asked to what extent they think the present use
and disposal of plastic carry bags is a problem to our environment.
3.1.2 The present use and disposal of plastic bags was perceived to be a
problem by the overwhelming majority (94%) of respondents, with more
than three quarters (78%) considering it to be a major problem.
3.1.3 Females (84%) were significantly more likely to perceive the current use
and disposal of plastic carry bags to be a major problem than male
respondents (70%).
3.1.4 Respondents from lower income households were the least likely to
think that the present use and disposal of plastic carry bags is a major problem to our environment (68% of those whose household income
was $15,001-$25,000 and 70% of those whose household income was
less than $15,000).
3.1.5 While 17% of all respondents considered the current use and disposal of
plastic carry bags to be a minor problem, younger respondents, aged
18 to 24 years, were significantly more likely to view the present use and
disposal of plastic bags as being a minor problem (27%) to our
environment.
3.1.6 Only 4% of respondents considered the present use and disposal of
plastic bags to not be a problem to our environment, with males (6%)
and retired respondents (7%) most likely to cite this response.
- 9 -
TO WHAT EXTENT DO YOU THINK THE PRESENT USE AND DISPOSAL OF PLASTIC CARRY BAGS IS A PROBLEM TO OUR
ENVIRONMENT? - Read out -
TOTAL(n=503)
Metropolitan(n=400)
Regional
73
79
84
70
71
79
78
22
14
12
21
23
15
17
4
5
4
3
1
6
3
3
2
1
3
2
3
1(n=103)
Males(n=240)
Females(n=263)
Main groceryshopper (n=369)
Not main grocery shopper (n=134)
0% 10% 20% 30% 40% 50% 60% 70% 80% 90% 100%
% of respondents
Major problem Minor problem Not a problem Unsure
- 10 -
-- ---
---
---
EPA - PLASTIC BAGS RESEARCH - JULY 2003
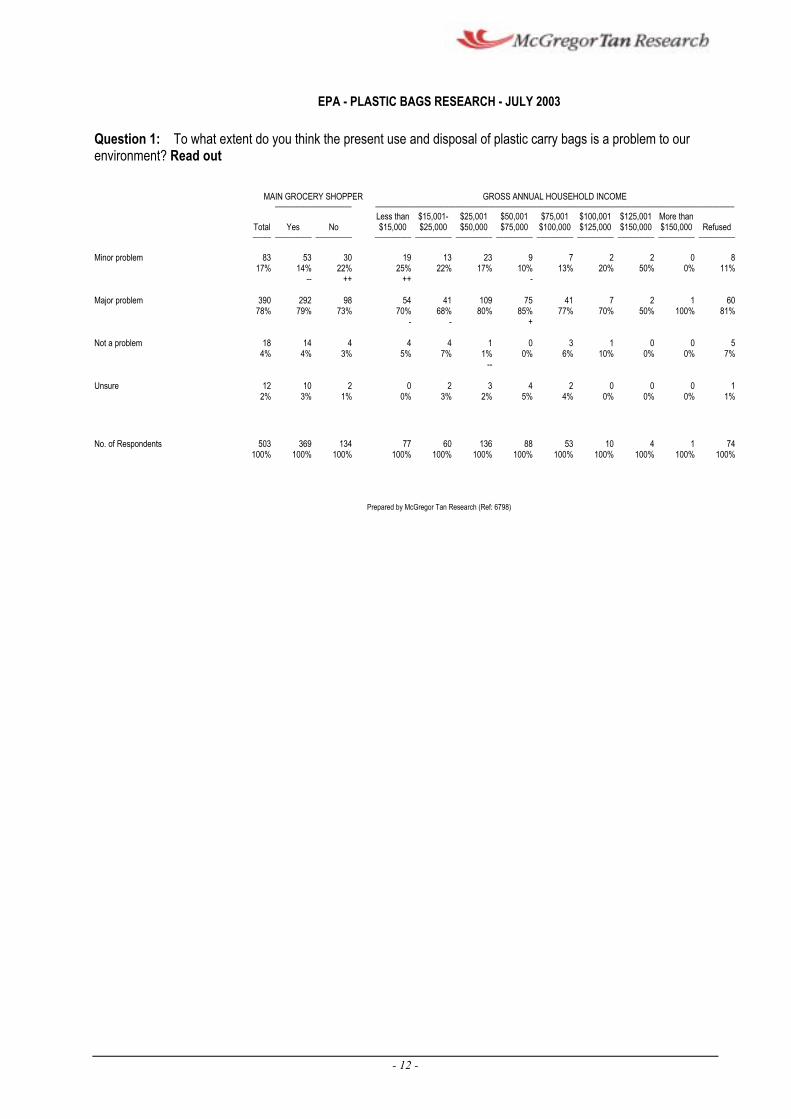
Question 1: To what extent do you think the present use and disposal of plastic carry bags is a problem to our environment? Read out
SA GENDER AGE GROUPS œœœœœœœœœœœœœœœœœ œœœœœœœœœœœœœœœœœ œœœœœœœœœœœœœœœœœœœœœœœœœœœœœœœœœœœœœœœœœœœœœœœœœœœœœ
ALL ALL Total Metro Regional MALES FEMALES 18-24 25-34 35-44 45-54 55-64 65+ 18-44 45+ œœœœœ œœœœœœœœ œœœœœœœœ œœœœœœœœ œœœœœœœœ œœœœœœœœ œœœœœœœœ œœœœœœœœ œœœœœœœœ œœœœœœœœ œœœœœœœœ œœœœœœœœ œœœœœœœœ
Minor problem 83 17%
59 15%
24 23%
51 21%
32 12%
9 27%
12 16%
16 15%
13 12%
17 21%
16 17%
37 17%
46 16%
++ +++ +
Major problem 390 78%
317 79%
73 71%
169 70%
221 84%
22 67%
62 81%
87 79%
89 82%
56 70%
73 78%
171 78%
218 78%
+ - +++ -
Not a problem 18 4%
13 3%
5 5%
15 6%
3 1%
1 3%
2 3%
2 2%
3 3%
5 6%
4 4%
5 2%
12 4%
+++
Unsure 12 11 1 5 7 1 1 5 3 2 0 7 5 2% 3% 1% 2% 3% 3% 1% 5% 3% 3% 0% 3% 2%
+
TOTAL ALL RESPONDENTS 503 400 103 240 263 33 77 110 108 80 93 220 281 100% 100% 100% 100% 100% 100% 100% 100% 100% 100% 100% 100% 100%
OCCUPATION EMPLOYMENT œœœœœœœœœœœœœœœœœœœœœœœœœœœœœœœœœœœœœœœœœœœœœœœœœœœœœœœœœœœœœœœœœœœœœœœœœœœœœœœœœœœ œœœœœœœœœœœœœœœœœœœœœœœ
Unemployed Paid Looking Home Retired/ Other In paid Not in
Total Employee for work Student Duties Pensioner Pensioner Other work pd work œœœœœ œœœœœœœœœœœ œœœœœœœœœœœ œœœœœœœœœœœ œœœœœœœœœœœ œœœœœœœœœœœ œœœœœœœœœœœ œœœœœœœœœœœ œœœœœœœœœœœ œœœœœœœœœœœ
Minor problem 83 46 2 5 10 15 4 1 46 35 17% 16% 29% 26% 13% 15% 33% 25% 16% 16%
Major problem 390 221 5 13 61 80 7 3 221 164 78% 78% 71% 68% 81% 78% 58% 75% 78% 77%
Not a problem 18 8 0 1 1 7 1 0 8 10 4% 3% 0% 5% 1% 7% 8% 0% 3% 5%
++
Unsure 12 8 0 0 3 1 0 0 8 4 2% 3% 0% 0% 4% 1% 0% 0% 3% 2%
TOTAL ALL RESPONDENTS 503 283 7 19 75 103 12 4 283 213 100% 100% 100% 100% 100% 100% 100% 100% 100% 100%
Prepared by McGregor Tan Research (Ref: 6798)
- 11 -
--
--
EPA - PLASTIC BAGS RESEARCH - JULY 2003
Question 1: To what extent do you think the present use and disposal of plastic carry bags is a problem to our environment? Read out
MAIN GROCERY SHOPPER GROSS ANNUAL HOUSEHOLD INCOME œœœœœœœœœœœœœœœœœœœœœ œœœœœœœœœœœœœœœœœœœœœœœœœœœœœœœœœœœœœœœœœœœœœœœœœœœœœœœœœœœœœœœœœœœœœœœœœœœœœœœœœœœœœœœœœœœœœœœœœœ
Less than $15,001- $25,001 $50,001 $75,001 $100,001 $125,001 More than Total Yes No $15,000 $25,000 $50,000 $75,000 $100,000 $125,000 $150,000 $150,000 Refused œœœœœ œœœœœœœœœœ œœœœœœœœœœ œœœœœœœœœœ œœœœœœœœœœ œœœœœœœœœœ œœœœœœœœœœ œœœœœœœœœœ œœœœœœœœœœ œœœœœœœœœœ œœœœœœœœœœ œœœœœœœœœœ
Minor problem 83 17%
53 14%
30 22%
19 25%
13 22%
23 17%
9 10%
7 13%
2 20%
2 50%
0 0%
8 11%
++ ++ -
Major problem 390 78%
292 79%
98 73%
54 70%
41 68%
109 80%
75 85%
41 77%
7 70%
2 50%
1 100%
60 81%
- - +
Not a problem 18 4%
14 4%
4 3%
4 5%
4 7%
1 1%
0 0%
3 6%
1 10%
0 0%
0 0%
5 7%
Unsure 12 10 2 0 2 3 4 2 0 0 0 1 2% 3% 1% 0% 3% 2% 5% 4% 0% 0% 0% 1%
No. of Respondents 503 369 134 77 60 136 88 53 10 4 1 74 100% 100% 100% 100% 100% 100% 100% 100% 100% 100% 100% 100%
Prepared by McGregor Tan Research (Ref: 6798)
- 12 -
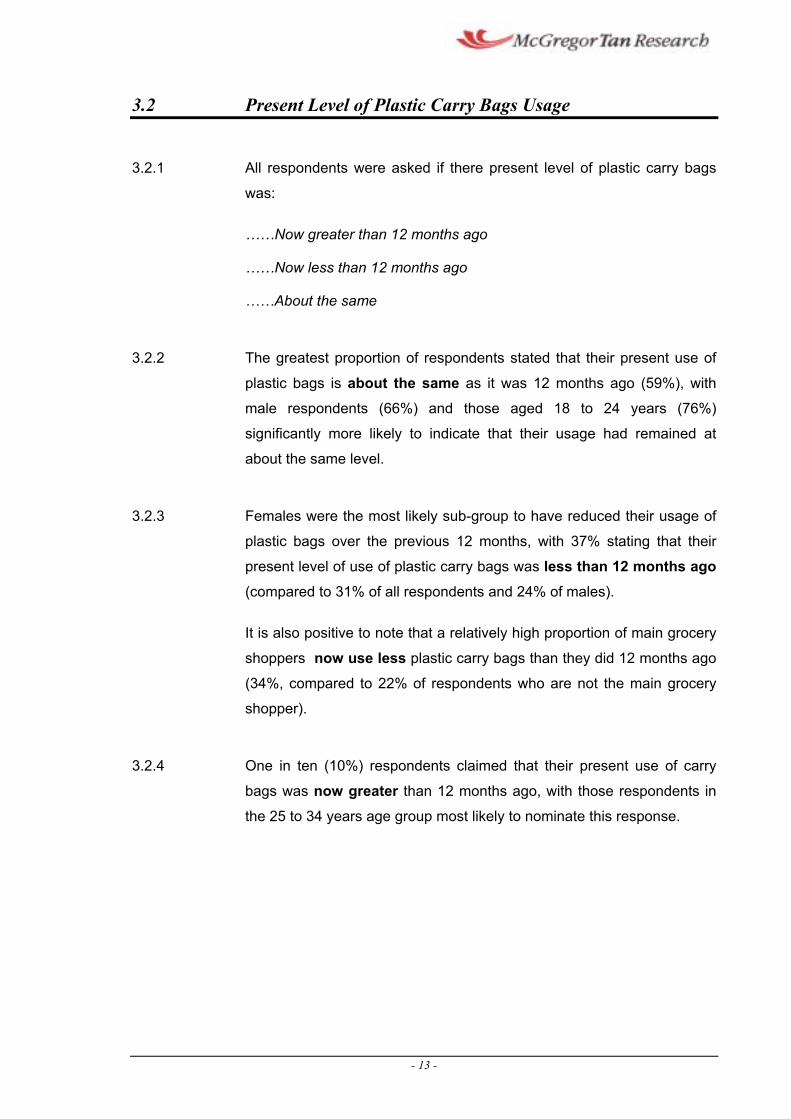
3.2 Present Level of Plastic Carry Bags Usage
3.2.1 All respondents were asked if there present level of plastic carry bags
was:
……Now greater than 12 months ago
……Now less than 12 months ago
……About the same
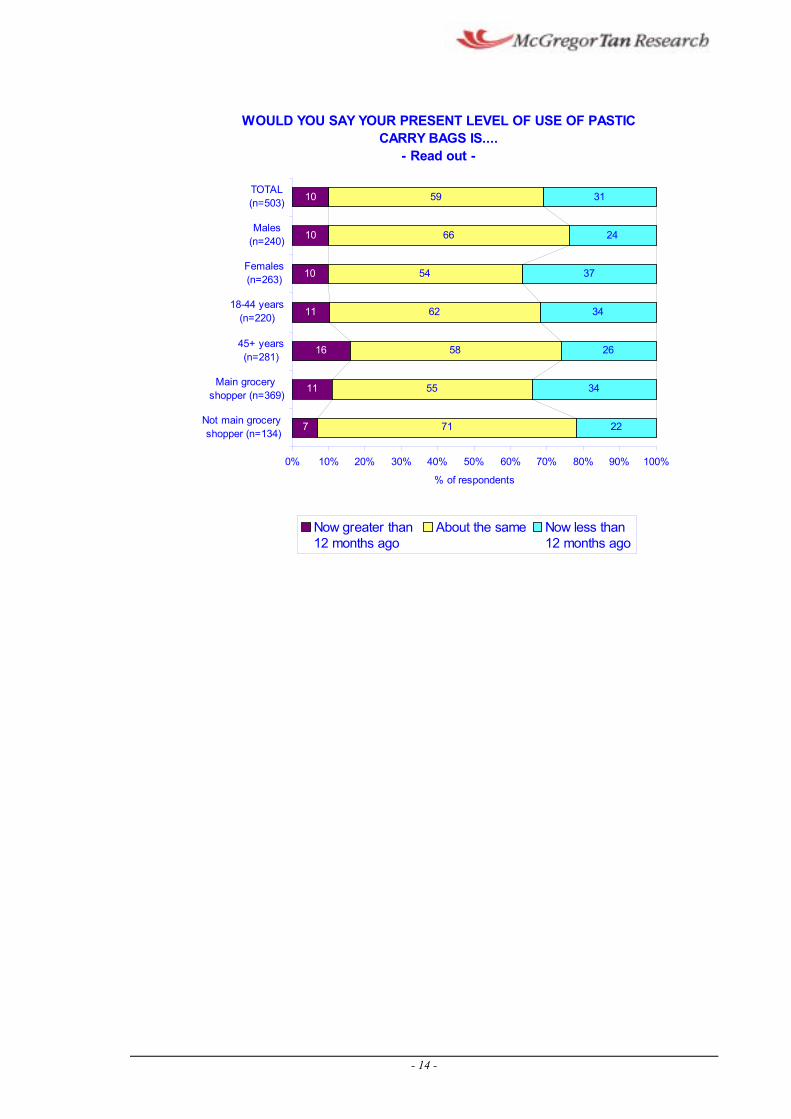
3.2.2 The greatest proportion of respondents stated that their present use of
plastic bags is about the same as it was 12 months ago (59%), with
male respondents (66%) and those aged 18 to 24 years (76%)
significantly more likely to indicate that their usage had remained at
about the same level.
3.2.3 Females were the most likely sub-group to have reduced their usage of
plastic bags over the previous 12 months, with 37% stating that their
present level of use of plastic carry bags was less than 12 months ago (compared to 31% of all respondents and 24% of males).
It is also positive to note that a relatively high proportion of main grocery
shoppers now use less plastic carry bags than they did 12 months ago
(34%, compared to 22% of respondents who are not the main grocery
shopper).
3.2.4 One in ten (10%) respondents claimed that their present use of carry
bags was now greater than 12 months ago, with those respondents in
the 25 to 34 years age group most likely to nominate this response.
- 13 -
WOULD YOU SAY YOUR PRESENT LEVEL OF USE OF PASTICCARRY BAGS IS....
- Read out -
7
11
16
11
10
10
10
71
55
58
62
54
66
59
22
34
26
34
37
24
31
i (
i (
(
(
(
(
(
Not ma n grocery shopper n=134)
Ma n grocery shopper n=369)
45+ years n=281)
18-44 years n=220)
Females n=263)
Males n=240)
TOTAL n=503)
0% 10% 20% 30% 40% 50% 60% 70% 80% 90% 100%
% of respondents
lNow greater than 12 months ago
About the same Now ess than 12 months ago
- 14 -
--- --
---
EPA - PLASTIC BAGS RESEARCH - JULY 2003
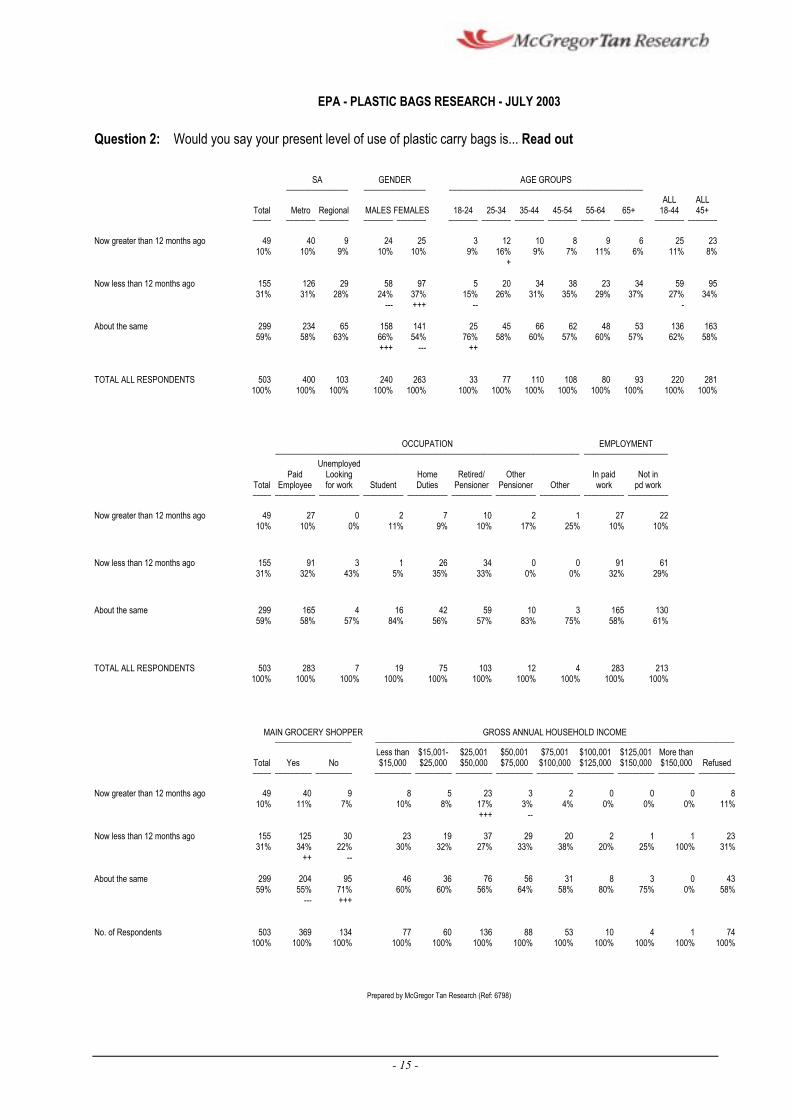
Question 2: Would you say your present level of use of plastic carry bags is... Read out
SA GENDER AGE GROUPS œœœœœœœœœœœœœœœœœ œœœœœœœœœœœœœœœœœ œœœœœœœœœœœœœœœœœœœœœœœœœœœœœœœœœœœœœœœœœœœœœœœœœœœœœ
ALL ALL Total Metro Regional MALES FEMALES 18-24 25-34 35-44 45-54 55-64 65+ 18-44 45+ œœœœœ œœœœœœœœ œœœœœœœœ œœœœœœœœ œœœœœœœœ œœœœœœœœ œœœœœœœœ œœœœœœœœ œœœœœœœœ œœœœœœœœ œœœœœœœœ œœœœœœœœ œœœœœœœœ
Now greater than 12 months ago 49 10%
40 10%
9 9%
24 10%
25 10%
3 9%
12 16%
10 9%
8 7%
9 11%
6 6%
25 11%
23 8%
+
Now less than 12 months ago 155 31%
126 31%
29 28%
58 24%
97 37%
5 15%
20 26%
34 31%
38 35%
23 29%
34 37%
59 27%
95 34%
+++ -
About the same 299 234 65 158 141 25 45 66 62 48 53 136 163 59% 58% 63% 66% 54% 76% 58% 60% 57% 60% 57% 62% 58%
+++ ++
TOTAL ALL RESPONDENTS 503 400 103 240 263 33 77 110 108 80 93 220 281 100% 100% 100% 100% 100% 100% 100% 100% 100% 100% 100% 100% 100%
OCCUPATION EMPLOYMENT œœœœœœœœœœœœœœœœœœœœœœœœœœœœœœœœœœœœœœœœœœœœœœœœœœœœœœœœœœœœœœœœœœœœœœœœœœœœœœœœœœœ œœœœœœœœœœœœœœœœœœœœœœœ
Unemployed Paid Looking Home Retired/ Other In paid Not in
Total Employee for work Student Duties Pensioner Pensioner Other work pd work œœœœœ œœœœœœœœœœœ œœœœœœœœœœœ œœœœœœœœœœœ œœœœœœœœœœœ œœœœœœœœœœœ œœœœœœœœœœœ œœœœœœœœœœœ œœœœœœœœœœœ œœœœœœœœœœœ
Now greater than 12 months ago 49 27 0 2 7 10 2 1 27 22 10% 10% 0% 11% 9% 10% 17% 25% 10% 10%
Now less than 12 months ago 155 91 3 1 26 34 0 0 91 61 31% 32% 43% 5% 35% 33% 0% 0% 32% 29%
About the same 299 165 4 16 42 59 10 3 165 130 59% 58% 57% 84% 56% 57% 83% 75% 58% 61%
TOTAL ALL RESPONDENTS 503 283 7 19 75 103 12 4 283 213 100% 100% 100% 100% 100% 100% 100% 100% 100% 100%
MAIN GROCERY SHOPPER GROSS ANNUAL HOUSEHOLD INCOME œœœœœœœœœœœœœœœœœœœœœ œœœœœœœœœœœœœœœœœœœœœœœœœœœœœœœœœœœœœœœœœœœœœœœœœœœœœœœœœœœœœœœœœœœœœœœœœœœœœœœœœœœœœœœœœœœœœœœœœœ
Less than $15,001- $25,001 $50,001 $75,001 $100,001 $125,001 More than Total Yes No $15,000 $25,000 $50,000 $75,000 $100,000 $125,000 $150,000 $150,000 Refused œœœœœ œœœœœœœœœœ œœœœœœœœœœ œœœœœœœœœœ œœœœœœœœœœ œœœœœœœœœœ œœœœœœœœœœ œœœœœœœœœœ œœœœœœœœœœ œœœœœœœœœœ œœœœœœœœœœ œœœœœœœœœœ
Now greater than 12 months ago 49 40 9 8 5 23 3 2 0 0 0 8 10% 11% 7% 10% 8% 17% 3% 4% 0% 0% 0% 11%
+++ --
Now less than 12 months ago 155 125 30 23 19 37 29 20 2 1 1 23 31% 34% 22% 30% 32% 27% 33% 38% 20% 25% 100% 31%
++ --
About the same 299 204 59% 55%
---
95 46 36 76 56 31 8 3 0 43 71% 60% 60% 56% 64% 58% 80% 75% 0% 58% +++
No. of Respondents 503 369 134 77 60 136 88 53 10 4 1 74 100% 100% 100% 100% 100% 100% 100% 100% 100% 100% 100% 100%
Prepared by McGregor Tan Research (Ref: 6798)
- 15 -
Number of Plastic Bags Used Per Week
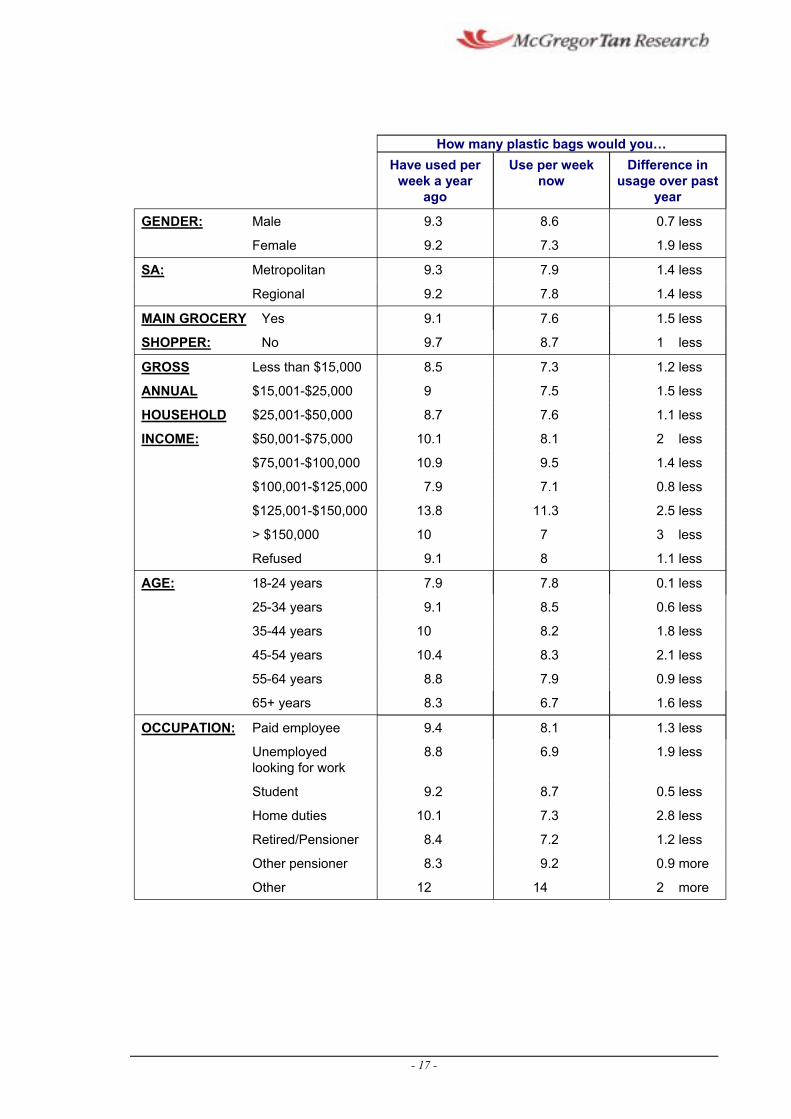
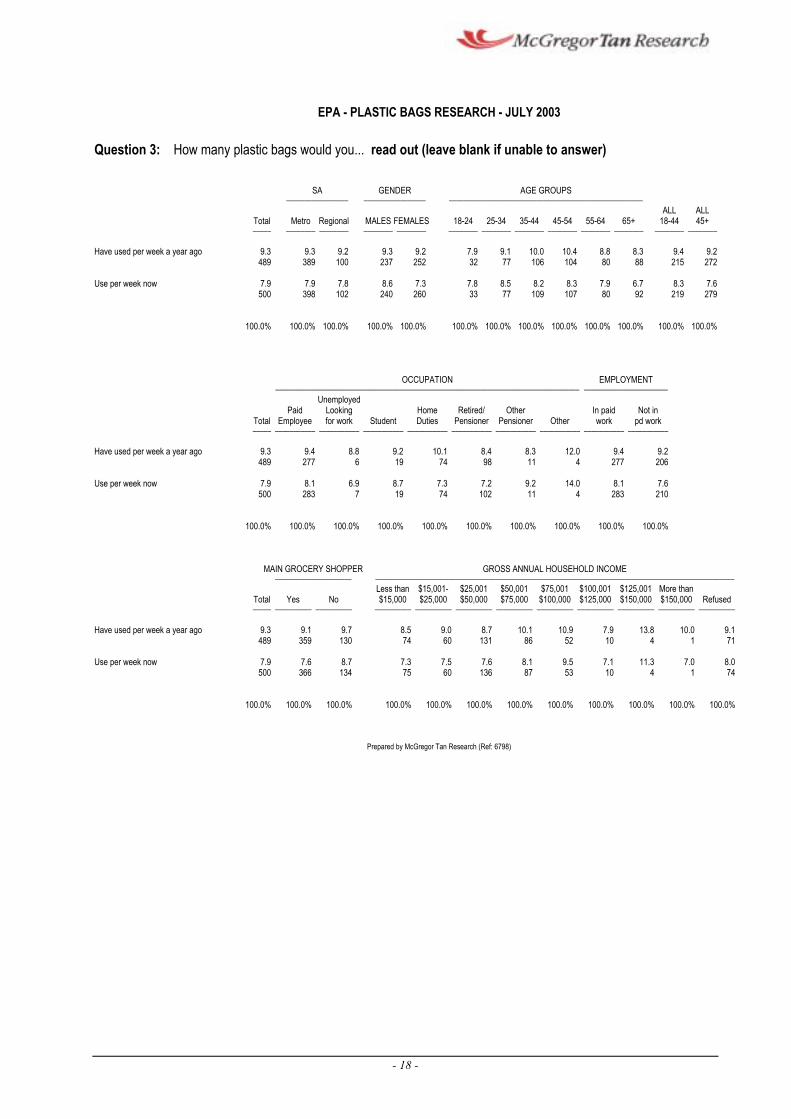
3.2.5 The number of plastic bags used per week has decreased by
approximately 1.4 bags over the last year, from an average 9.3 bags per week a year ago to 7.9 bags a week now.
3.2.6 As shown in the following table, those most likely to have reduced the
number of bags they use per week from a year ago were:
¢ Those in home duties (use 2.8 less than a year ago)
¢ Females (1.9 less)
¢ Those aged 45 to 54 years (2.1 less)
¢ Those whose household income was $125,001-$150,000 (2.5 less)
3.2.7 Younger respondents, aged 18 to 24 years (0.1 less) and students (0.5
less) were amongst the least likely to have significantly reduced their
usage of plastic carry bags.
- 16 -
ago
Male 9.3 0.7 less
Female 9.2 1.9 less
SA: 9.3 1.4 less
9.2 1.4 less
Yes 7.6
SHOPPER: No 9.7 1
GROSS 7.3
9 7.5
7.6
10.1 2 less
10.9 1.4 less
7.9 0.8 less
13.8 11.3
10 7 3 less
8
AGE: 7.8
8.5
1.8 less
10.4 2.1 less
7.9
6.7
Paid employee 9.4 1.3 less
8.8 1.9 less
Student 9.2 0.5 less
10.1 2.8 less
7.2
9.2
Other 12 14 2 more
How many plastic bags would you… Have used per
week a year Use per week
now Difference in
usage over past year
GENDER: 8.6
7.3
Metropolitan 7.9
Regional 7.8
MAIN GROCERY 9.1 1.5 less
8.7 less
Less than $15,000 8.5 1.2 less
ANNUAL $15,001-$25,000 1.5 less
HOUSEHOLD $25,001-$50,000 8.7 1.1 less
INCOME: $50,001-$75,000 8.1
$75,001-$100,000 9.5
$100,001-$125,000 7.1
$125,001-$150,000 2.5 less
> $150,000
Refused 9.1 1.1 less
18-24 years 7.9 0.1 less
25-34 years 9.1 0.6 less
35-44 years 10 8.2
45-54 years 8.3
55-64 years 8.8 0.9 less
65+ years 8.3 1.6 less
OCCUPATION: 8.1
Unemployed looking for work
6.9
8.7
Home duties 7.3
Retired/Pensioner 8.4 1.2 less
Other pensioner 8.3 0.9 more
- 17 -
EPA - PLASTIC BAGS RESEARCH - JULY 2003
Question 3: How many plastic bags would you... read out (leave blank if unable to answer)
SA GENDER AGE GROUPS œœœœœœœœœœœœœœœœœ œœœœœœœœœœœœœœœœœ œœœœœœœœœœœœœœœœœœœœœœœœœœœœœœœœœœœœœœœœœœœœœœœœœœœœœ
ALL ALL Total Metro Regional MALES FEMALES 18-24 25-34 35-44 45-54 55-64 65+ 18-44 45+ œœœœœ œœœœœœœœ œœœœœœœœ œœœœœœœœ œœœœœœœœ œœœœœœœœ œœœœœœœœ œœœœœœœœ œœœœœœœœ œœœœœœœœ œœœœœœœœ œœœœœœœœ œœœœœœœœ
Have used per week a year ago 9.3 489
9.3 389
9.2 100
9.3 237
9.2 252
7.9 32
9.1 77
10.0 106
10.4 104
8.8 80
8.3 88
9.4 215
9.2 272
Use per week now 7.9 500
7.9 398
7.8 102
8.6 240
7.3 260
7.8 33
8.5 77
8.2 109
8.3 107
7.9 80
6.7 92
8.3 219
7.6 279
100.0% 100.0% 100.0% 100.0% 100.0% 100.0% 100.0% 100.0% 100.0% 100.0% 100.0% 100.0% 100.0%
OCCUPATION EMPLOYMENT œœœœœœœœœœœœœœœœœœœœœœœœœœœœœœœœœœœœœœœœœœœœœœœœœœœœœœœœœœœœœœœœœœœœœœœœœœœœœœœœœœœ œœœœœœœœœœœœœœœœœœœœœœœ
Unemployed Paid Looking Home Retired/ Other In paid Not in
Total Employee for work Student Duties Pensioner Pensioner Other work pd work œœœœœ œœœœœœœœœœœ œœœœœœœœœœœ œœœœœœœœœœœ œœœœœœœœœœœ œœœœœœœœœœœ œœœœœœœœœœœ œœœœœœœœœœœ œœœœœœœœœœœ œœœœœœœœœœœ
Have used per week a year ago 9.3 9.4 8.8 9.2 10.1 8.4 8.3 12.0 9.4 9.2 489 277 6 19 74 98 11 4 277 206
Use per week now 7.9 8.1 6.9 8.7 7.3 7.2 9.2 14.0 8.1 7.6 500 283 7 19 74 102 11 4 283 210
100.0% 100.0% 100.0% 100.0% 100.0% 100.0% 100.0% 100.0% 100.0% 100.0%
MAIN GROCERY SHOPPER GROSS ANNUAL HOUSEHOLD INCOME œœœœœœœœœœœœœœœœœœœœœ œœœœœœœœœœœœœœœœœœœœœœœœœœœœœœœœœœœœœœœœœœœœœœœœœœœœœœœœœœœœœœœœœœœœœœœœœœœœœœœœœœœœœœœœœœœœœœœœœœ
Less than $15,001- $25,001 $50,001 $75,001 $100,001 $125,001 More than Total Yes No $15,000 $25,000 $50,000 $75,000 $100,000 $125,000 $150,000 $150,000 Refused œœœœœ œœœœœœœœœœ œœœœœœœœœœ œœœœœœœœœœ œœœœœœœœœœ œœœœœœœœœœ œœœœœœœœœœ œœœœœœœœœœ œœœœœœœœœœ œœœœœœœœœœ œœœœœœœœœœ œœœœœœœœœœ
Have used per week a year ago 9.3 9.1 9.7 8.5 9.0 8.7 10.1 10.9 7.9 13.8 10.0 9.1 489 359 130 74 60 131 86 52 10 4 1 71
Use per week now 7.9 7.6 8.7 7.3 7.5 7.6 8.1 9.5 7.1 11.3 7.0 8.0 500 366 134 75 60 136 87 53 10 4 1 74
100.0% 100.0% 100.0% 100.0% 100.0% 100.0% 100.0% 100.0% 100.0% 100.0% 100.0% 100.0%
Prepared by McGregor Tan Research (Ref: 6798)
- 18 -
3.3 Satisfaction with Present Level of Use of Plastic Carry Bags
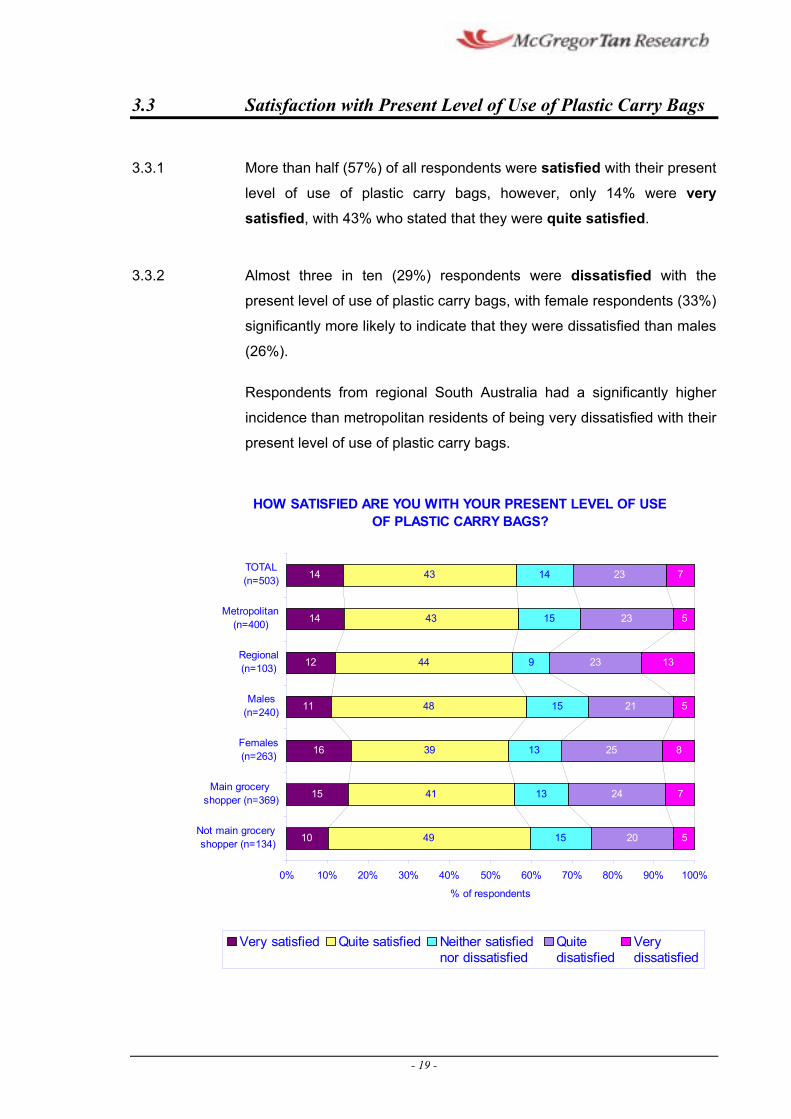
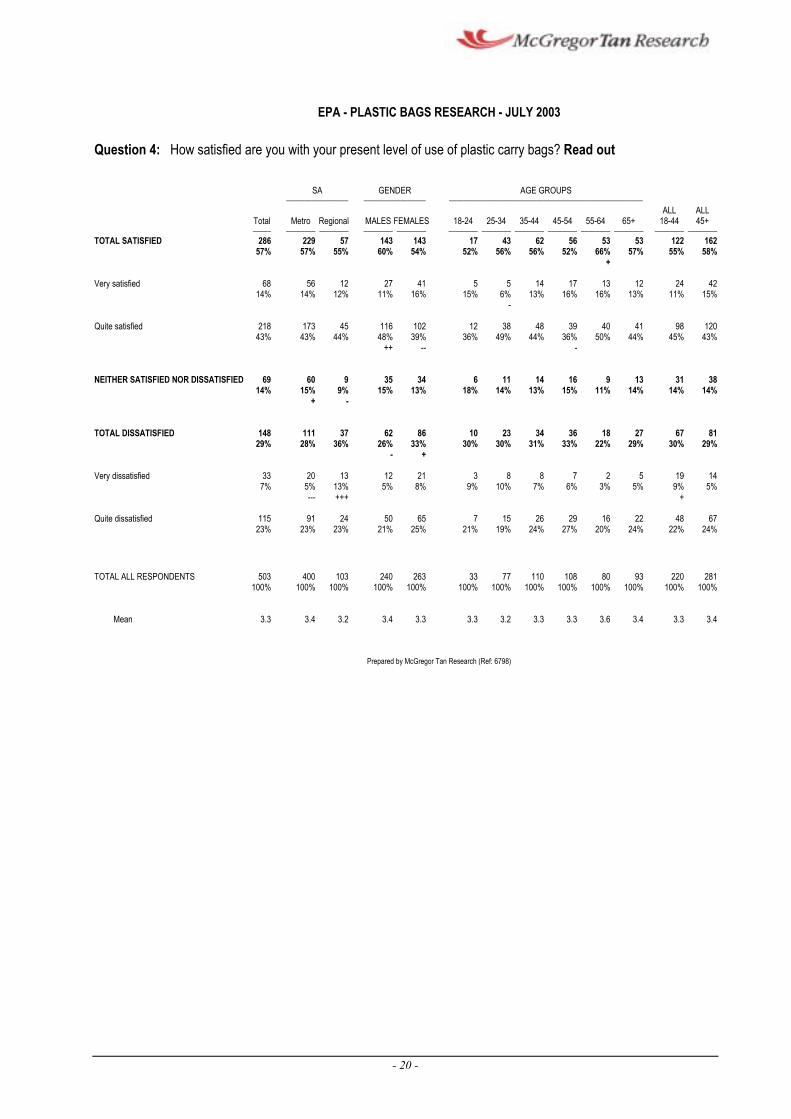
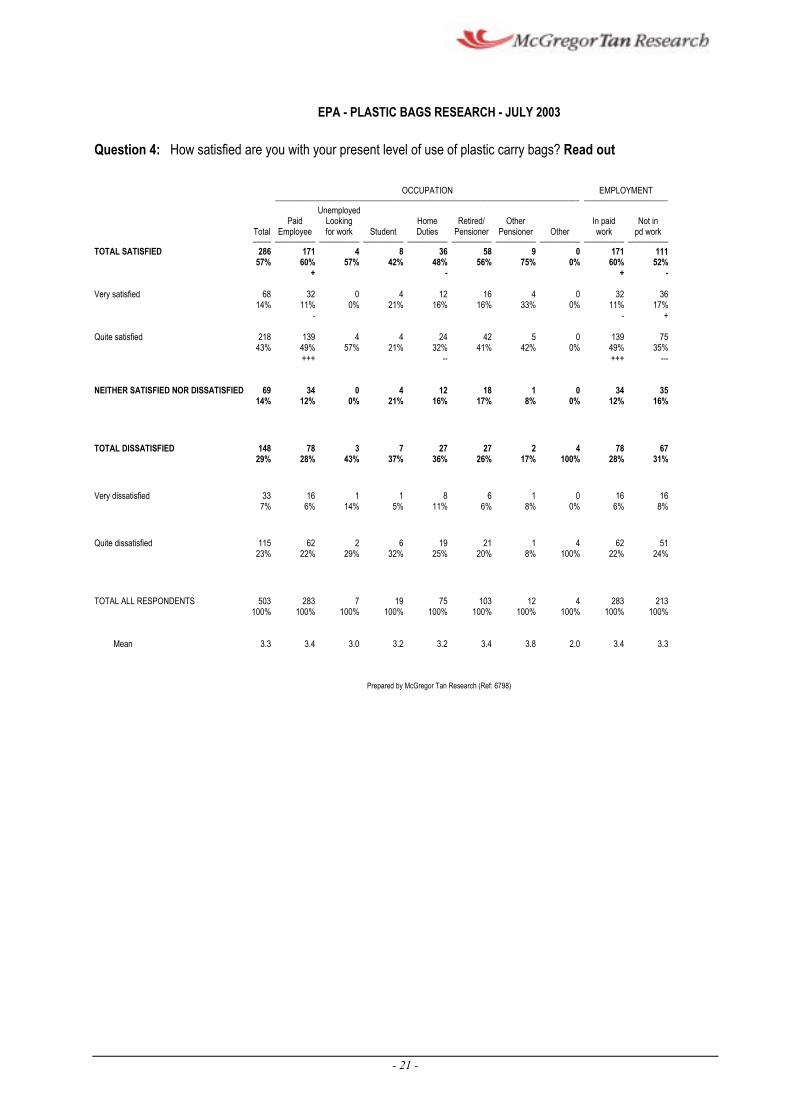
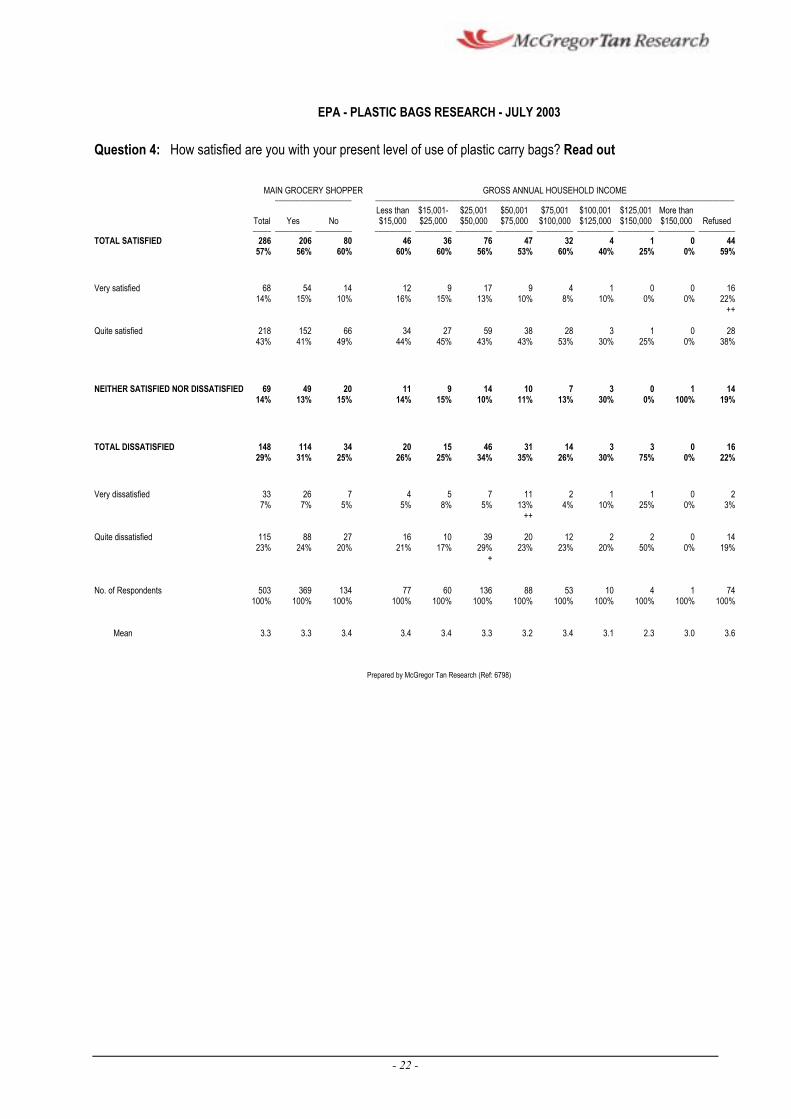
3.3.1 More than half (57%) of all respondents were satisfied with their present
level of use of plastic carry bags, however, only 14% were very satisfied, with 43% who stated that they were quite satisfied.
3.3.2 Almost three in ten (29%) respondents were dissatisfied with the
present level of use of plastic carry bags, with female respondents (33%)
significantly more likely to indicate that they were dissatisfied than males
(26%).
Respondents from regional South Australia had a significantly higher
incidence than metropolitan residents of being very dissatisfied with their
present level of use of plastic carry bags.
HOW SATISFIED ARE YOU WITH YOUR PRESENT LEVEL OF USE OF PLASTIC CARRY BAGS?
TOTAL(n=503)
Metropolitan(n=400)
Regional(n=103)
Males(n=240)
Females(n=263)
Main groceryshopper (n=369)
Not main groceryshopper (n=134) 10
15
16
11
12
14
14
49
41
39
48
44
43
43
15
13
13
15
9
15
14
20
24
25
21
23
23
23
5
7
8
5
13
5
7
0% 10% 20% 30% 40% 50% 60% 70% 80% 90% 100%
% of respondents
Very satisfied Quite satisfied Neither satisfied Quite Very nor dissatisfied disatisfied dissatisfied
- 19 -
EPA - PLASTIC BAGS RESEARCH - JULY 2003
Question 4: How satisfied are you with your present level of use of plastic carry bags? Read out
SA GENDER AGE GROUPS œœœœœœœœœœœœœœœœœ œœœœœœœœœœœœœœœœœ œœœœœœœœœœœœœœœœœœœœœœœœœœœœœœœœœœœœœœœœœœœœœœœœœœœœœ
ALL ALL Total Metro Regional MALES FEMALES 18-24 25-34 35-44 45-54 55-64 65+ 18-44 45+ œœœœœ œœœœœœœœ œœœœœœœœ œœœœœœœœ œœœœœœœœ œœœœœœœœ œœœœœœœœ œœœœœœœœ œœœœœœœœ œœœœœœœœ œœœœœœœœ œœœœœœœœ œœœœœœœœ
TOTAL SATISFIED 286 229 57 143 143 17 43 62 56 53 53 122 162 57% 57% 55% 60% 54% 52% 56% 56% 52% 66% 57% 55% 58%
+
Very satisfied 68 56 12 27 41 5 5 14 17 13 12 24 42 14% 14% 12% 11% 16% 15% 6% 13% 16% 16% 13% 11% 15%
-
Quite satisfied 218 173 45 116 102 43% 43% 44% 48% 39%
++ --
12 38 48 39 40 41 98 120 36% 49% 44% 36% 50% 44% 45% 43%
-
NEITHER SATISFIED NOR DISSATISFIED 69 60 9 35 34 6 11 14 16 9 13 31 38 14% 15% 9% 15% 13% 18% 14% 13% 15% 11% 14% 14% 14%
+ -
TOTAL DISSATISFIED 148 111 37 62 86 10 23 34 36 18 27 67 81 29% 28% 36% 26% 33% 30% 30% 31% 33% 22% 29% 30% 29%
- +
Very dissatisfied 33 20 13 7% 5% 13%
--- +++
12 21 3 8 8 7 2 5 19 14 5% 8% 9% 10% 7% 6% 3% 5% 9% 5%
+
Quite dissatisfied 115 91 24 50 65 7 15 26 29 16 22 48 67 23% 23% 23% 21% 25% 21% 19% 24% 27% 20% 24% 22% 24%
TOTAL ALL RESPONDENTS 503 400 103 240 263 33 77 110 108 80 93 220 281 100% 100% 100% 100% 100% 100% 100% 100% 100% 100% 100% 100% 100%
Mean 3.3 3.4 3.2 3.4 3.3 3.3 3.2 3.3 3.3 3.6 3.4 3.3 3.4
Prepared by McGregor Tan Research (Ref: 6798)
- 20 -
-- ---
EPA - PLASTIC BAGS RESEARCH - JULY 2003
Question 4: How satisfied are you with your present level of use of plastic carry bags? Read out
OCCUPATION EMPLOYMENT œœœœœœœœœœœœœœœœœœœœœœœœœœœœœœœœœœœœœœœœœœœœœœœœœœœœœœœœœœœœœœœœœœœœœœœœœœœœœœœœœœœ œœœœœœœœœœœœœœœœœœœœœœœ
Unemployed Paid Looking Home Retired/ Other In paid Not in
Total Employee for work Student Duties Pensioner Pensioner Other work pd work œœœœœ œœœœœœœœœœœ œœœœœœœœœœœ œœœœœœœœœœœ œœœœœœœœœœœ œœœœœœœœœœœ œœœœœœœœœœœ œœœœœœœœœœœ œœœœœœœœœœœ œœœœœœœœœœœ
TOTAL SATISFIED 286 171 4 8 36 58 9 0 171 111 57% 60% 57% 42% 48% 56% 75% 0% 60% 52%
+ - + -
Very satisfied 68 14%
32 11%
0 0%
4 21%
12 16%
16 16%
4 33%
0 0%
32 11%
36 17%
- - +
Quite satisfied 218 139 4 4 24 42 5 0 139 75 43% 49% 57% 21% 32% 41% 42% 0% 49% 35%
+++ +++
NEITHER SATISFIED NOR DISSATISFIED 69 34 0 4 12 18 1 0 34 35 14% 12% 0% 21% 16% 17% 8% 0% 12% 16%
TOTAL DISSATISFIED 148 78 3 7 27 27 2 4 78 67 29% 28% 43% 37% 36% 26% 17% 100% 28% 31%
Very dissatisfied 33 16 1 1 8 6 1 0 16 16 7% 6% 14% 5% 11% 6% 8% 0% 6% 8%
Quite dissatisfied 115 62 2 6 19 21 1 4 62 51 23% 22% 29% 32% 25% 20% 8% 100% 22% 24%
TOTAL ALL RESPONDENTS 503 283 7 19 75 103 12 4 283 213 100% 100% 100% 100% 100% 100% 100% 100% 100% 100%
Mean 3.3 3.4 3.0 3.2 3.2 3.4 3.8 2.0 3.4 3.3
Prepared by McGregor Tan Research (Ref: 6798)
- 21 -
EPA - PLASTIC BAGS RESEARCH - JULY 2003
Question 4: How satisfied are you with your present level of use of plastic carry bags? Read out
MAIN GROCERY SHOPPER GROSS ANNUAL HOUSEHOLD INCOME œœœœœœœœœœœœœœœœœœœœœ œœœœœœœœœœœœœœœœœœœœœœœœœœœœœœœœœœœœœœœœœœœœœœœœœœœœœœœœœœœœœœœœœœœœœœœœœœœœœœœœœœœœœœœœœœœœœœœœœœ
Less than $15,001- $25,001 $50,001 $75,001 $100,001 $125,001 More than Total Yes No $15,000 $25,000 $50,000 $75,000 $100,000 $125,000 $150,000 $150,000 Refused œœœœœ œœœœœœœœœœ œœœœœœœœœœ œœœœœœœœœœ œœœœœœœœœœ œœœœœœœœœœ œœœœœœœœœœ œœœœœœœœœœ œœœœœœœœœœ œœœœœœœœœœ œœœœœœœœœœ œœœœœœœœœœ
TOTAL SATISFIED 286 206 80 46 36 76 47 32 4 1 0 44 57% 56% 60% 60% 60% 56% 53% 60% 40% 25% 0% 59%
Very satisfied 68 54 14 12 9 17 9 4 1 0 0 1614% 15% 10% 16% 15% 13% 10% 8% 10% 0% 0% 22%
++
Quite satisfied 218 152 66 34 27 59 38 28 3 1 0 28 43% 41% 49% 44% 45% 43% 43% 53% 30% 25% 0% 38%
NEITHER SATISFIED NOR DISSATISFIED 69 49 20 11 9 14 10 7 3 0 1 14 14% 13% 15% 14% 15% 10% 11% 13% 30% 0% 100% 19%
TOTAL DISSATISFIED 148 114 34 20 15 46 31 14 3 3 0 16 29% 31% 25% 26% 25% 34% 35% 26% 30% 75% 0% 22%
Very dissatisfied 33 26 7 4 5 7 11 2 1 1 0 2 7% 7% 5% 5% 8% 5% 13% 4% 10% 25% 0% 3%
++
Quite dissatisfied 115 88 27 16 10 39 20 12 2 2 0 14 23% 24% 20% 21% 17% 29% 23% 23% 20% 50% 0% 19%
+
No. of Respondents 503 369 134 77 60 136 88 53 10 4 1 74 100% 100% 100% 100% 100% 100% 100% 100% 100% 100% 100% 100%
Mean 3.3 3.3 3.4 3.4 3.4 3.3 3.2 3.4 3.1 2.3 3.0 3.6
Prepared by McGregor Tan Research (Ref: 6798)
- 22 -
Feelings Towards Use of Plastic Bags
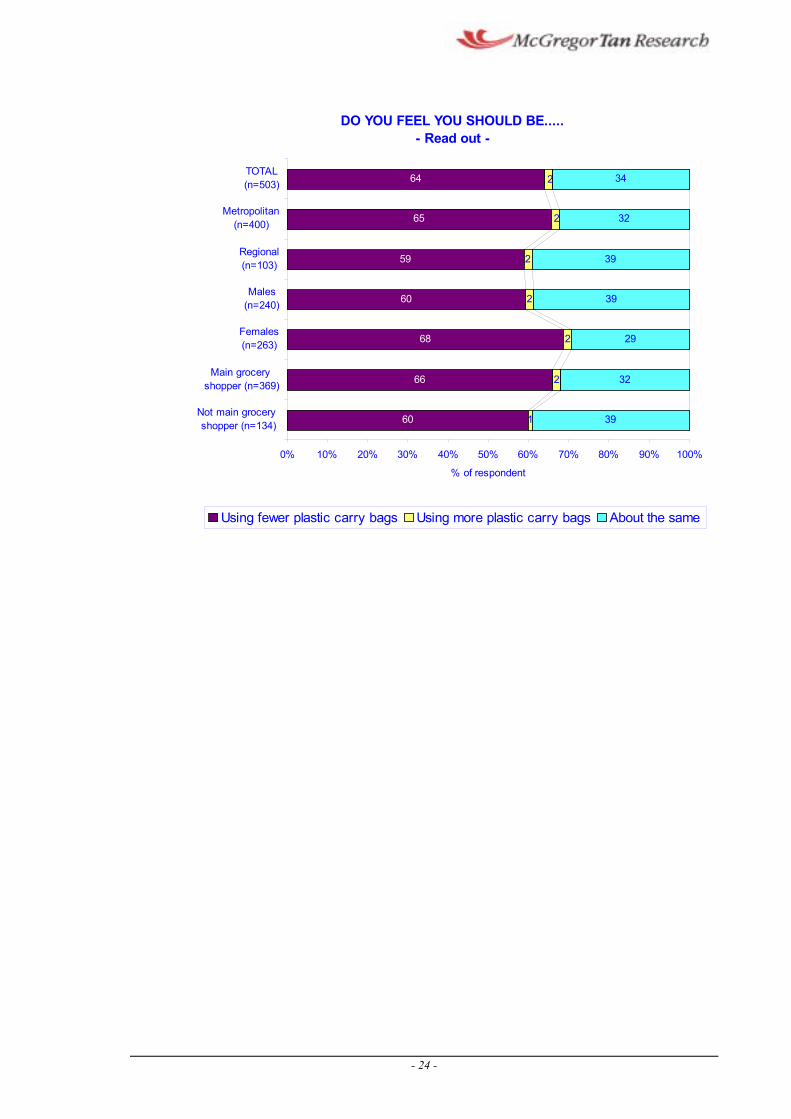
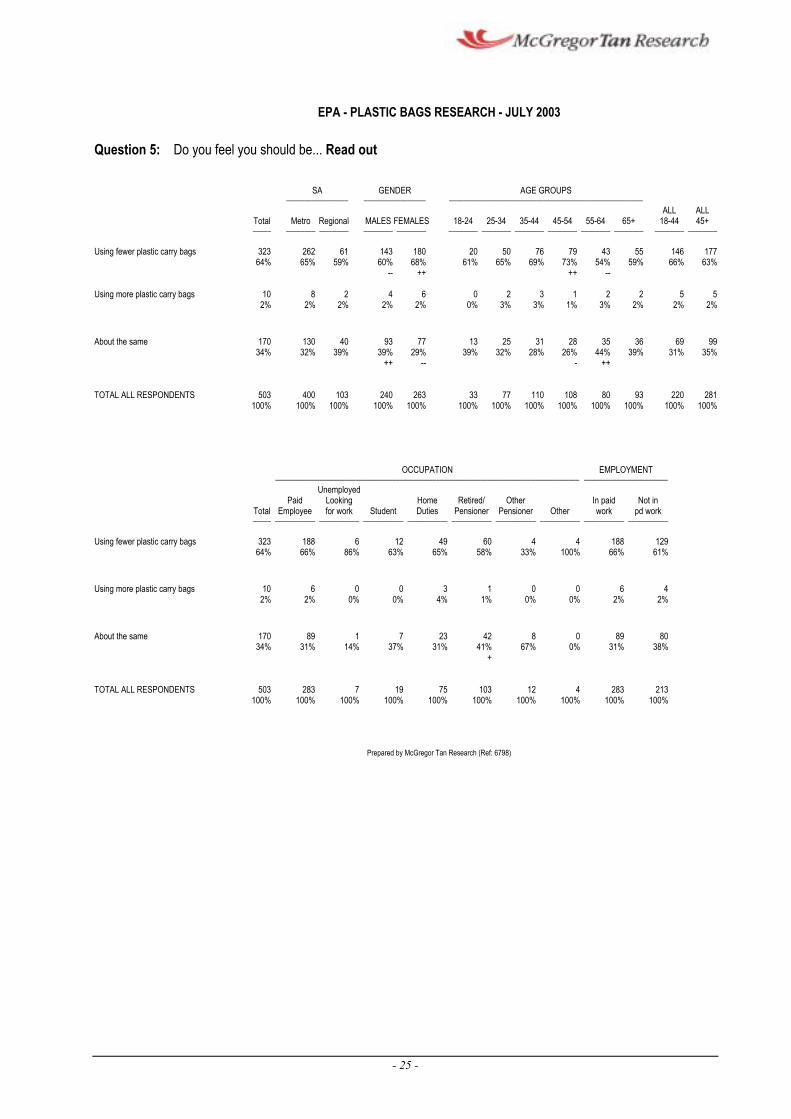
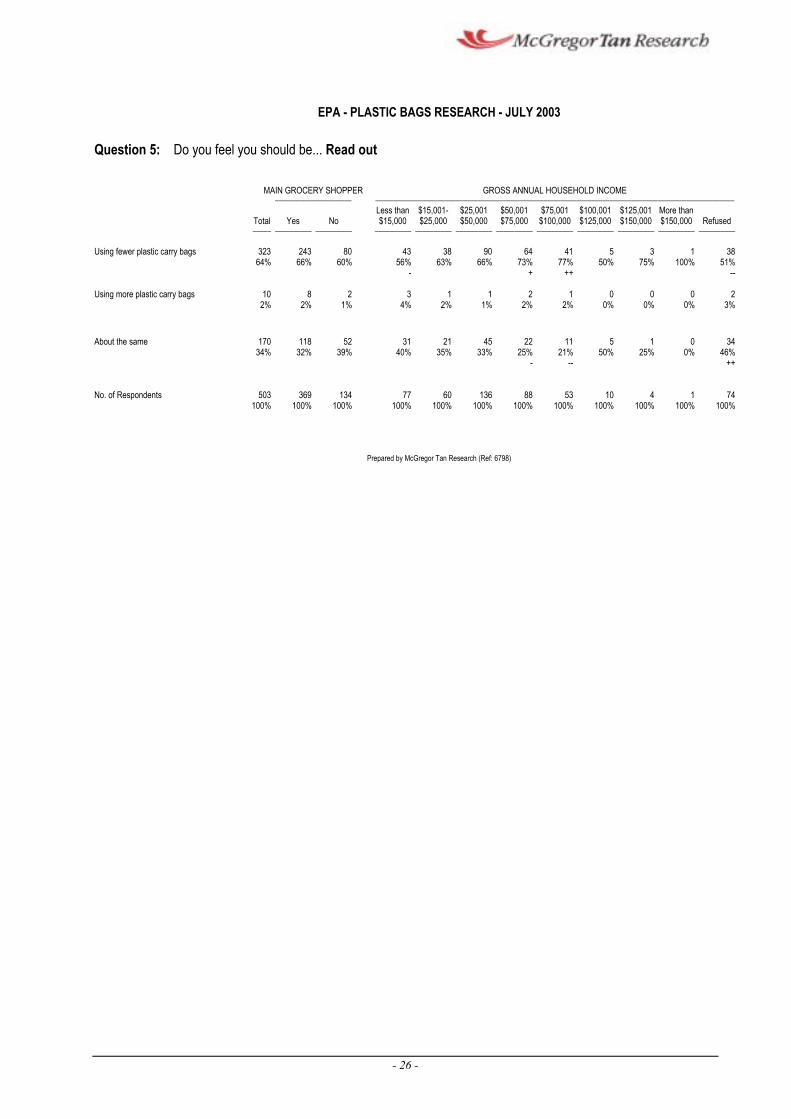
3.3.3 All respondents were asked if they feel they should be:
……Using fewer plastic carry bags
……Using more plastic carry bags
……About the same
3.3.4 The greatest proportion (64%) of respondents felt that they should be
using fewer plastic bags, particularly females (68%) and those aged 45
to 54 years (73%).
Least likely to indicate that they feel they should be using fewer plastic
bags were:
¢ Those respondents aged 55 to 64 years (54%)
¢ Those whose household income was less than $15,000 (56%)
¢ Males (60%)
3.3.5 One third (34%) of all respondents feel that they should continue to use
about the same number of plastic carry bags.
- 23 -
DO YOU FEEL YOU SHOULD BE..... - Read out -
TOTAL (n=503)
Metropolitan (n=400)
Regional (n=103)
Males (n=240)
Females (n=263)
Main grocery shopper (n=369)
Not main grocery shopper (n=134) 60
66
68
60
59
65
64
39
32
29
39
39
32
34
2
2
1
2
2
2
2
0% 10% 20% 30% 40% 50% 60% 70% 80% 90% 100%
% of respondent
i i i iUs ng fewer plast c carry bags Us ng more plast c carry bags About the same
- 24 -
-- --
EPA - PLASTIC BAGS RESEARCH - JULY 2003
Question 5: Do you feel you should be... Read out
SA GENDER AGE GROUPS œœœœœœœœœœœœœœœœœ œœœœœœœœœœœœœœœœœ œœœœœœœœœœœœœœœœœœœœœœœœœœœœœœœœœœœœœœœœœœœœœœœœœœœœœ
ALL ALL Total Metro Regional MALES FEMALES 18-24 25-34 35-44 45-54 55-64 65+ 18-44 45+ œœœœœ œœœœœœœœ œœœœœœœœ œœœœœœœœ œœœœœœœœ œœœœœœœœ œœœœœœœœ œœœœœœœœ œœœœœœœœ œœœœœœœœ œœœœœœœœ œœœœœœœœ œœœœœœœœ
Using fewer plastic carry bags 323 64%
262 65%
61 59%
143 60%
180 68%
20 61%
50 65%
76 69%
79 73%
43 54%
55 59%
146 66%
177 63%
++ ++
Using more plastic carry bags 10 2%
8 2%
2 2%
4 2%
6 2%
0 0%
2 3%
3 3%
1 1%
2 3%
2 2%
5 2%
5 2%
About the same 170 130 40 93 77 34% 32% 39% 39% 29%
++ --
13 25 31 28 35 36 69 99 39% 32% 28% 26% 44% 39% 31% 35%
- ++
TOTAL ALL RESPONDENTS 503 400 103 240 263 33 77 110 108 80 93 220 281 100% 100% 100% 100% 100% 100% 100% 100% 100% 100% 100% 100% 100%
OCCUPATION EMPLOYMENT œœœœœœœœœœœœœœœœœœœœœœœœœœœœœœœœœœœœœœœœœœœœœœœœœœœœœœœœœœœœœœœœœœœœœœœœœœœœœœœœœœœ œœœœœœœœœœœœœœœœœœœœœœœ
Unemployed Paid Looking Home Retired/ Other In paid Not in
Total Employee for work Student Duties Pensioner Pensioner Other work pd work œœœœœ œœœœœœœœœœœ œœœœœœœœœœœ œœœœœœœœœœœ œœœœœœœœœœœ œœœœœœœœœœœ œœœœœœœœœœœ œœœœœœœœœœœ œœœœœœœœœœœ œœœœœœœœœœœ
Using fewer plastic carry bags 323 188 6 12 49 60 4 4 188 129 64% 66% 86% 63% 65% 58% 33% 100% 66% 61%
Using more plastic carry bags 10 6 0 0 3 1 0 0 6 4 2% 2% 0% 0% 4% 1% 0% 0% 2% 2%
About the same 170 89 1 7 23 42 8 0 89 80 34% 31% 14% 37% 31% 41% 67% 0% 31% 38%
+
TOTAL ALL RESPONDENTS 503 283 7 19 75 103 12 4 283 213 100% 100% 100% 100% 100% 100% 100% 100% 100% 100%
Prepared by McGregor Tan Research (Ref: 6798)
- 25 -
--
EPA - PLASTIC BAGS RESEARCH - JULY 2003
Question 5: Do you feel you should be... Read out
MAIN GROCERY SHOPPER GROSS ANNUAL HOUSEHOLD INCOME œœœœœœœœœœœœœœœœœœœœœ œœœœœœœœœœœœœœœœœœœœœœœœœœœœœœœœœœœœœœœœœœœœœœœœœœœœœœœœœœœœœœœœœœœœœœœœœœœœœœœœœœœœœœœœœœœœœœœœœœ
Less than $15,001- $25,001 $50,001 $75,001 $100,001 $125,001 More than Total Yes No $15,000 $25,000 $50,000 $75,000 $100,000 $125,000 $150,000 $150,000 Refused œœœœœ œœœœœœœœœœ œœœœœœœœœœ œœœœœœœœœœ œœœœœœœœœœ œœœœœœœœœœ œœœœœœœœœœ œœœœœœœœœœ œœœœœœœœœœ œœœœœœœœœœ œœœœœœœœœœ œœœœœœœœœœ
Using fewer plastic carry bags 323 64%
243 66%
80 60%
43 56%
38 63%
90 66%
64 73%
41 77%
5 50%
3 75%
1 100%
38 51%
- + ++
Using more plastic carry bags 10 2%
8 2%
2 1%
3 4%
1 2%
1 1%
2 2%
1 2%
0 0%
0 0%
0 0%
2 3%
About the same 170 118 52 31 21 45 22 11 5 1 0 34 34% 32% 39% 40% 35% 33% 25% 21% 50% 25% 0% 46%
- -- ++
No. of Respondents 503 369 134 77 60 136 88 53 10 4 1 74 100% 100% 100% 100% 100% 100% 100% 100% 100% 100% 100% 100%
Prepared by McGregor Tan Research (Ref: 6798)
- 26 -
3.4 Importance of Environmental Protection
3.4.1 All respondents were asked how important the protection of the
environment was to them personally.
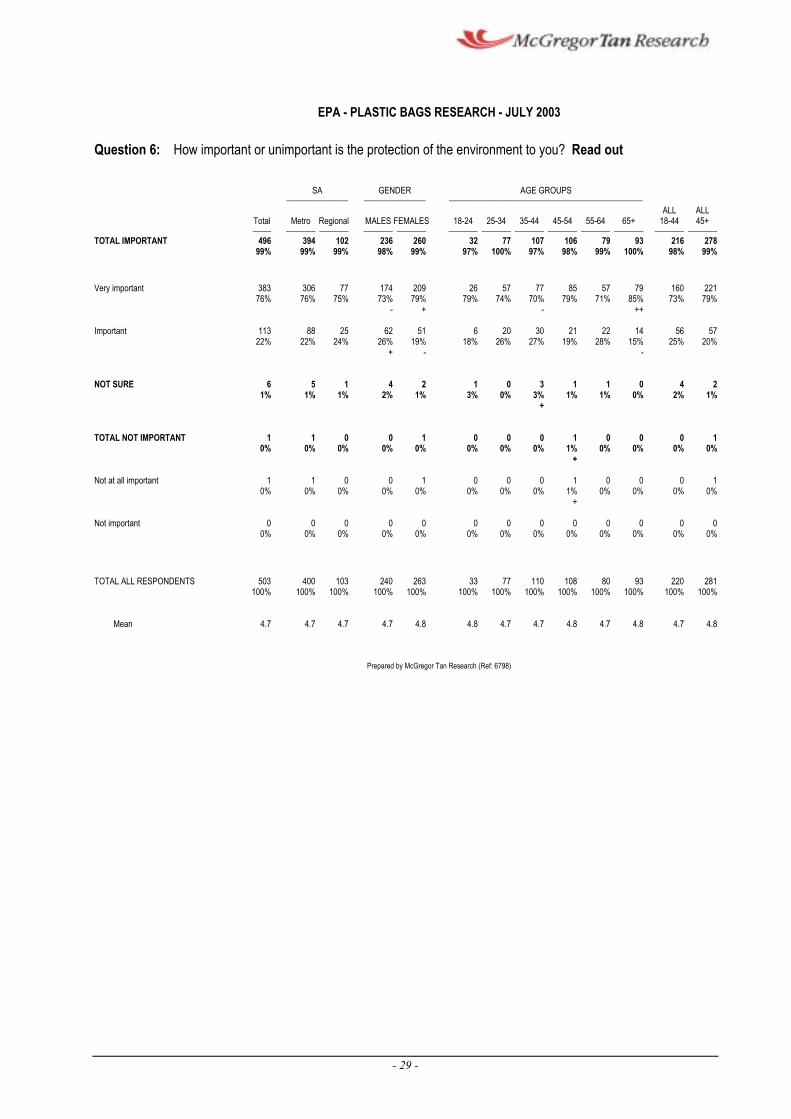
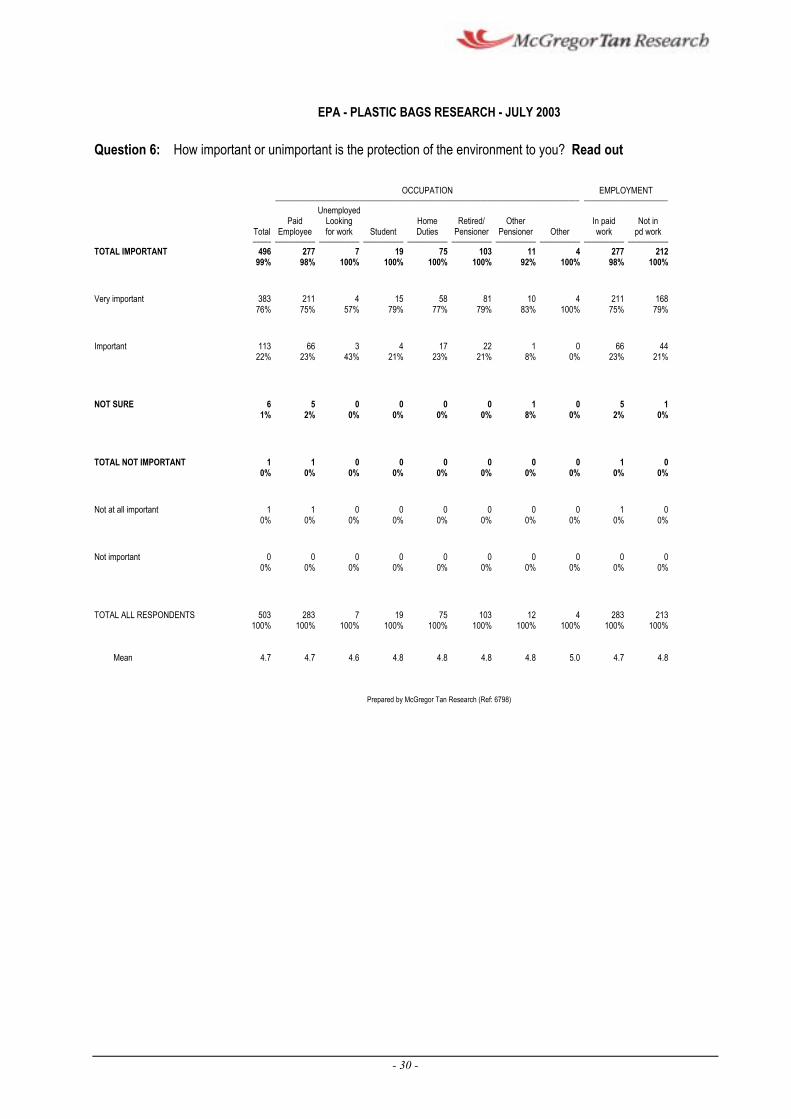
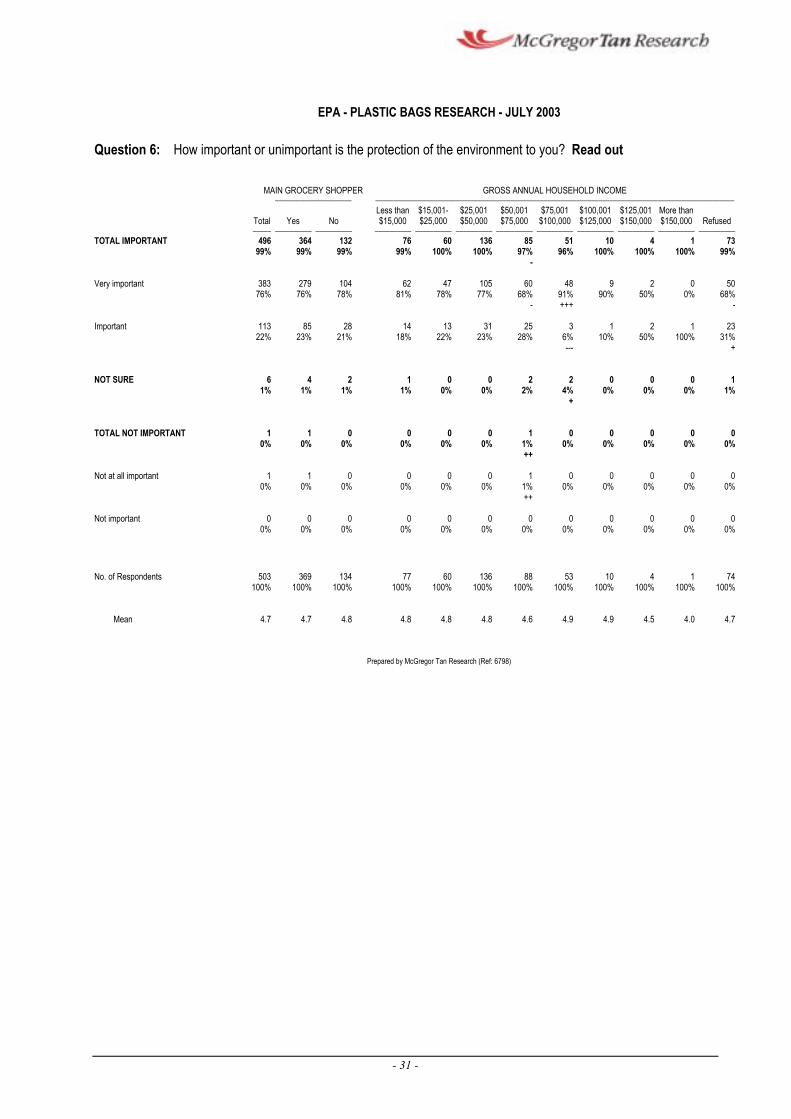
3.4.2 It is positive to note that the overwhelming majority (99%) of
respondents considered the protection of the environment to be
important, with 76% considering it to be very important and 22% quite important.
Sub-groups with significantly higher incidences of stating that the
protection of the environment was very important to them were:
¢ Those whose household income was $75,001 to $100,000 (91%)
¢ Older respondents, aged 65 years or above (85%)
¢ Females (79%)
3.4.3 Only 1 respondent stated that the protection of the environment was not important to them, while another 6 respondents (1%) were not sure.
- 27 -
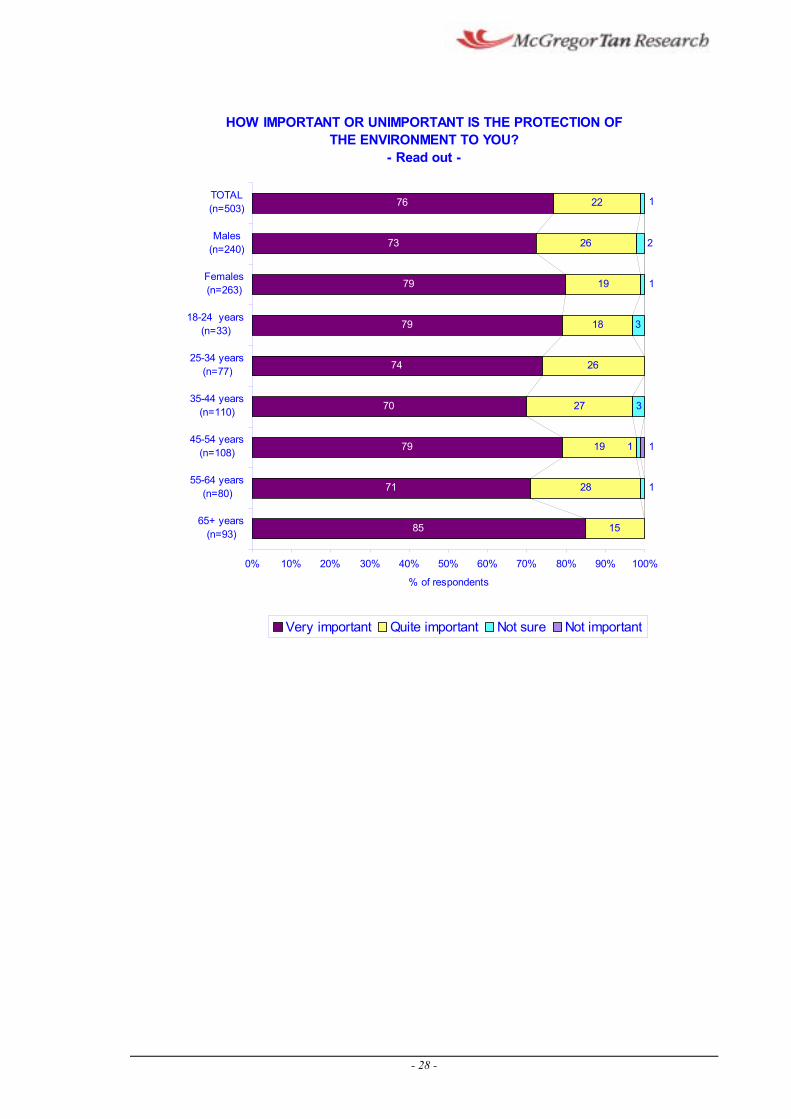
HOW IMPORTANT OR UNIMPORTANT IS THE PROTECTION OFTHE ENVIRONMENT TO YOU?
- Read out -
85
71
79
70
74
79
79
73
76
15
28
19
27
26
18
19
26
22
3
1
2
3
1
1
1 1
(
(
(
(
(
(
(
(
(
65+ years n=93)
55-64 years n=80)
45-54 years n=108)
35-44 years n=110)
25-34 years n=77)
18-24 years n=33)
Females n=263)
Males n=240)
TOTAL n=503)
0% 10% 20% 30% 40% 50% 60% 70% 80% 90% 100%
% of respondents
i i iVery mportant Qu te important Not sure Not mportant
- 28 -
EPA - PLASTIC BAGS RESEARCH - JULY 2003
Question 6: How important or unimportant is the protection of the environment to you? Read out
SA GENDER AGE GROUPS œœœœœœœœœœœœœœœœœ œœœœœœœœœœœœœœœœœ œœœœœœœœœœœœœœœœœœœœœœœœœœœœœœœœœœœœœœœœœœœœœœœœœœœœœ
ALL ALL Total Metro Regional MALES FEMALES 18-24 25-34 35-44 45-54 55-64 65+ 18-44 45+ œœœœœ œœœœœœœœ œœœœœœœœ œœœœœœœœ œœœœœœœœ œœœœœœœœ œœœœœœœœ œœœœœœœœ œœœœœœœœ œœœœœœœœ œœœœœœœœ œœœœœœœœ œœœœœœœœ
TOTAL IMPORTANT 496 394 102 236 260 32 77 107 106 79 93 216 278 99% 99% 99% 98% 99% 97% 100% 97% 98% 99% 100% 98% 99%
Very important 383 306 77 174 209 76% 76% 75% 73% 79%
- +
26 57 77 85 57 79 160 221 79% 74% 70% 79% 71% 85% 73% 79%
- ++
Important 113 88 25 62 51 22% 22% 24% 26% 19%
+ -
6 20 30 21 22 14 56 57 18% 26% 27% 19% 28% 15% 25% 20%
-
NOT SURE 6 5 1 4 2 1 0 3 1 1 0 4 2 1% 1% 1% 2% 1% 3% 0% 3% 1% 1% 0% 2% 1%
+
TOTAL NOT IMPORTANT 1 1 0 0 1 0 0 0 1 0 0 0 1 0% 0% 0% 0% 0% 0% 0% 0% 1% 0% 0% 0% 0%
+
Not at all important 1 1 0 0 1 0 0 0 1 0 0 0 1 0% 0% 0% 0% 0% 0% 0% 0% 1% 0% 0% 0% 0%
+
Not important 0 0 0 0 0 0 0 0 0 0 0 0 0 0% 0% 0% 0% 0% 0% 0% 0% 0% 0% 0% 0% 0%
TOTAL ALL RESPONDENTS 503 400 103 240 263 33 77 110 108 80 93 220 281 100% 100% 100% 100% 100% 100% 100% 100% 100% 100% 100% 100% 100%
Mean 4.7 4.7 4.7 4.7 4.8 4.8 4.7 4.7 4.8 4.7 4.8 4.7 4.8
Prepared by McGregor Tan Research (Ref: 6798)
- 29 -
EPA - PLASTIC BAGS RESEARCH - JULY 2003
Question 6: How important or unimportant is the protection of the environment to you? Read out
OCCUPATION EMPLOYMENT œœœœœœœœœœœœœœœœœœœœœœœœœœœœœœœœœœœœœœœœœœœœœœœœœœœœœœœœœœœœœœœœœœœœœœœœœœœœœœœœœœœ œœœœœœœœœœœœœœœœœœœœœœœ
Unemployed Paid Looking Home Retired/ Other In paid Not in
Total Employee for work Student Duties Pensioner Pensioner Other work pd work œœœœœ œœœœœœœœœœœ œœœœœœœœœœœ œœœœœœœœœœœ œœœœœœœœœœœ œœœœœœœœœœœ œœœœœœœœœœœ œœœœœœœœœœœ œœœœœœœœœœœ œœœœœœœœœœœ
TOTAL IMPORTANT 496 277 7 19 75 103 11 4 277 212 99% 98% 100% 100% 100% 100% 92% 100% 98% 100%
Very important 383 211 4 15 58 81 10 4 211 168 76% 75% 57% 79% 77% 79% 83% 100% 75% 79%
Important 113 66 3 4 17 22 1 0 66 44 22% 23% 43% 21% 23% 21% 8% 0% 23% 21%
NOT SURE 6 5 0 0 0 0 1 0 5 1 1% 2% 0% 0% 0% 0% 8% 0% 2% 0%
TOTAL NOT IMPORTANT 1 1 0 0 0 0 0 0 1 0 0% 0% 0% 0% 0% 0% 0% 0% 0% 0%
Not at all important 1 1 0 0 0 0 0 0 1 0 0% 0% 0% 0% 0% 0% 0% 0% 0% 0%
Not important 0 0 0 0 0 0 0 0 0 0 0% 0% 0% 0% 0% 0% 0% 0% 0% 0%
TOTAL ALL RESPONDENTS 503 283 7 19 75 103 12 4 283 213 100% 100% 100% 100% 100% 100% 100% 100% 100% 100%
Mean 4.7 4.7 4.6 4.8 4.8 4.8 4.8 5.0 4.7 4.8
Prepared by McGregor Tan Research (Ref: 6798)
- 30 -
EPA - PLASTIC BAGS RESEARCH - JULY 2003
Question 6: How important or unimportant is the protection of the environment to you? Read out
MAIN GROCERY SHOPPER GROSS ANNUAL HOUSEHOLD INCOME œœœœœœœœœœœœœœœœœœœœœ œœœœœœœœœœœœœœœœœœœœœœœœœœœœœœœœœœœœœœœœœœœœœœœœœœœœœœœœœœœœœœœœœœœœœœœœœœœœœœœœœœœœœœœœœœœœœœœœœœ
Less than $15,001- $25,001 $50,001 $75,001 $100,001 $125,001 More than Total Yes No $15,000 $25,000 $50,000 $75,000 $100,000 $125,000 $150,000 $150,000 Refused œœœœœ œœœœœœœœœœ œœœœœœœœœœ œœœœœœœœœœ œœœœœœœœœœ œœœœœœœœœœ œœœœœœœœœœ œœœœœœœœœœ œœœœœœœœœœ œœœœœœœœœœ œœœœœœœœœœ œœœœœœœœœœ
TOTAL IMPORTANT 496 364 132 76 60 136 85 51 10 4 1 73 99% 99% 99% 99% 100% 100% 97% 96% 100% 100% 100% 99%
-
Very important 383 279 104 62 47 105 60 48 9 2 0 50 76% 76% 78% 81% 78% 77% 68% 91% 90% 50% 0% 68%
- +++ -
Important 113 85 28 14 13 31 25 3 1 2 1 23 22% 23% 21% 18% 22% 23% 28% 6% 10% 50% 100% 31%
--- +
NOT SURE 6 4 2 1 0 0 2 2 0 0 0 1 1% 1% 1% 1% 0% 0% 2% 4% 0% 0% 0% 1%
+
TOTAL NOT IMPORTANT 1 1 0 0 0 0 1 0 0 0 0 0 0% 0% 0% 0% 0% 0% 1% 0% 0% 0% 0% 0%
++
Not at all important 1 1 0 0 0 0 1 0 0 0 0 0 0% 0% 0% 0% 0% 0% 1% 0% 0% 0% 0% 0%
++
Not important 0 0 0 0 0 0 0 0 0 0 0 0 0% 0% 0% 0% 0% 0% 0% 0% 0% 0% 0% 0%
No. of Respondents 503 369 134 77 60 136 88 53 10 4 1 74 100% 100% 100% 100% 100% 100% 100% 100% 100% 100% 100% 100%
Mean 4.7 4.7 4.8 4.8 4.8 4.8 4.6 4.9 4.9 4.5 4.0 4.7
Prepared by McGregor Tan Research (Ref: 6798)
- 31 -
3.5 Incidence of Reusing Plastic Carry Bags
3.5.1 All respondents were asked if they had reused any of their plastic carry
bags in the previous month.
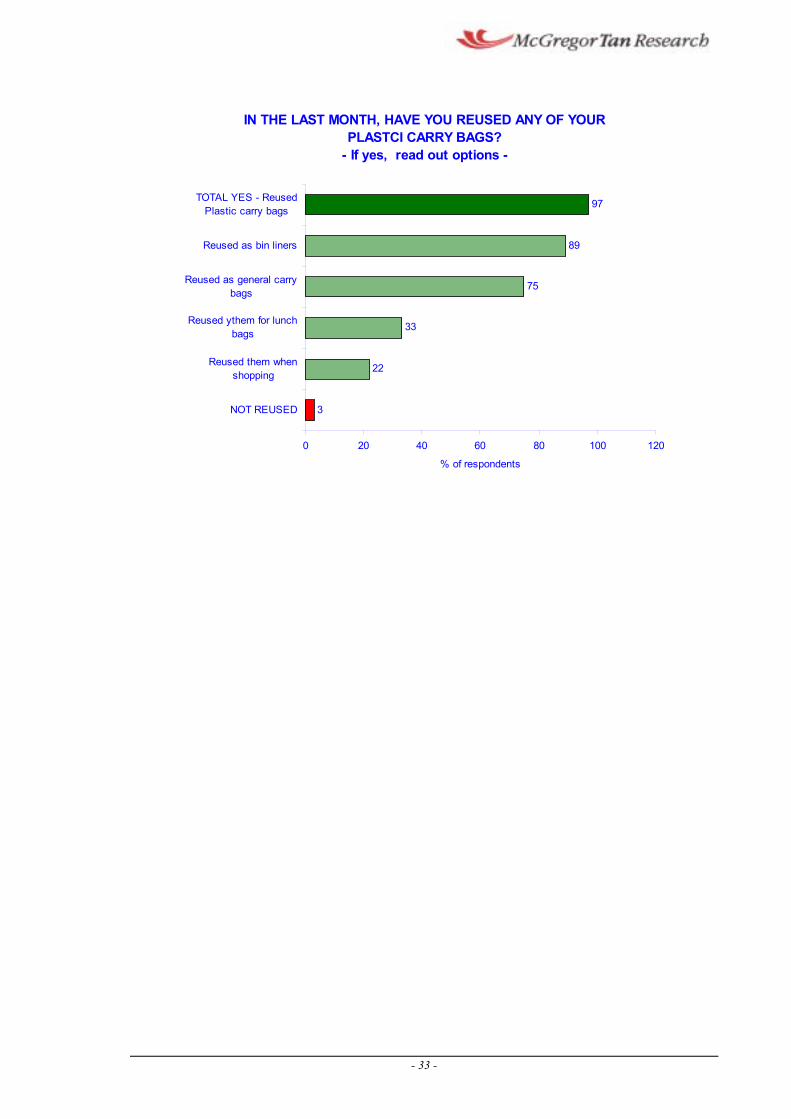
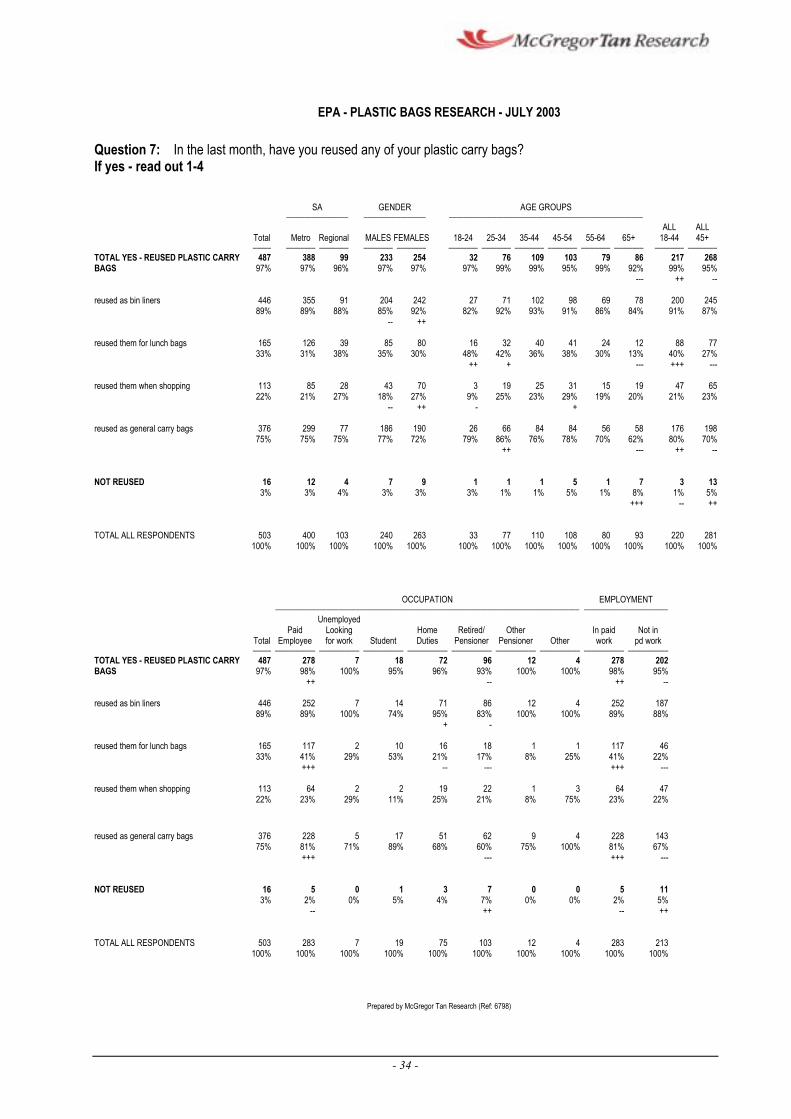
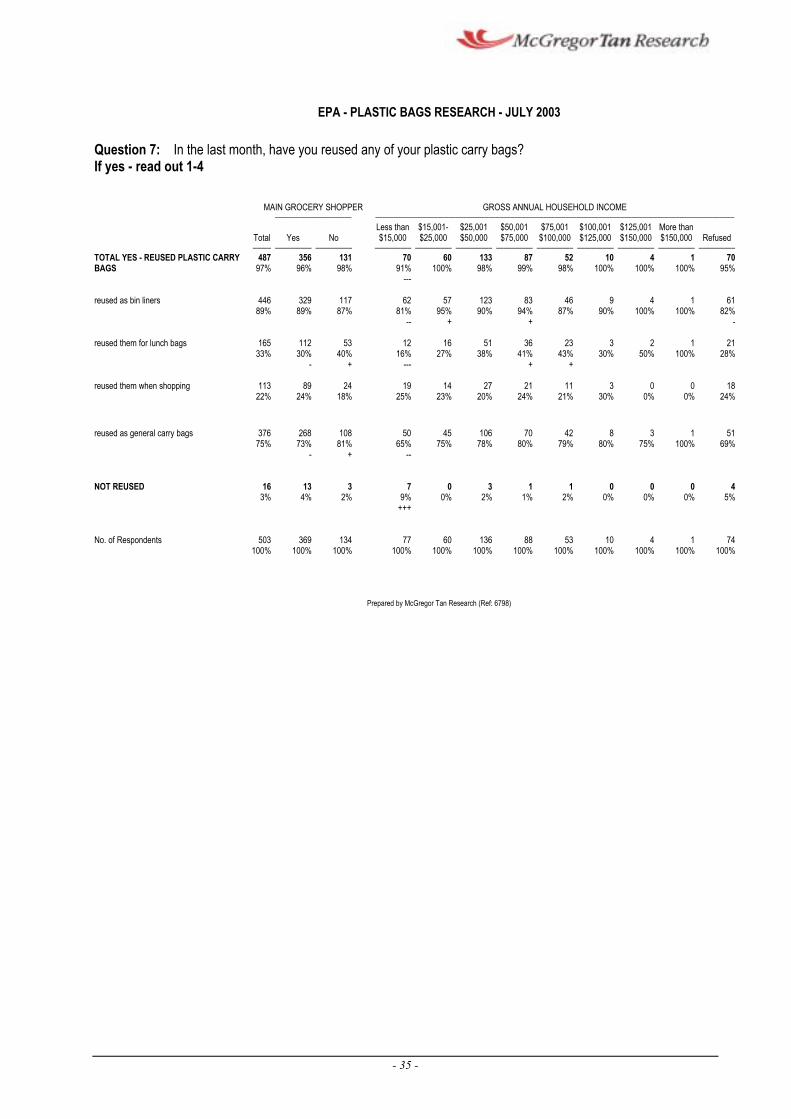
3.5.2 The overwhelming majority (97%) had reused plastic carry bags in the
previous month with most reusing the plastic bags as bin liners.
3.5.3 Three quarters (75%) of all respondents had reused plastic carry bags
as general carry bags.
3.5.4 One third (33%) of all respondents had reused plastic carry bags as
lunch bags, particularly younger respondents, aged 18 to 24 years
(48%).
3.5.5 While more than one in five respondents (22%) claimed to have reused
plastic carry bags when shopping, this was the least likely way in which
the plastic carry bags were reused.
Female respondents (27%) and those aged 45 to 54 years (29%) had
the highest incidences of reusing plastic carry bags when shopping.
- 32 -
IN THE LAST MONTH, HAVE YOU REUSED ANY OF YOUR PLASTCI CARRY BAGS?
- If yes, read out options -
TOTAL YES - Reused 97Plastic carry bags
89iReused as bin l ners
Reused as general carry bags
Reused ythem for lunch bags
Reused them when shopping
NOT REUSED 3
0 20 40 60 80 100 120
% of respondents
22
33
75
- 33 -
--- --
--
--- ---
--
--- --
EPA - PLASTIC BAGS RESEARCH - JULY 2003
Question 7: In the last month, have you reused any of your plastic carry bags? If yes - read out 1-4
SA GENDER AGE GROUPS œœœœœœœœœœœœœœœœœ œœœœœœœœœœœœœœœœœ œœœœœœœœœœœœœœœœœœœœœœœœœœœœœœœœœœœœœœœœœœœœœœœœœœœœœ
ALL ALL Total Metro Regional MALES FEMALES 18-24 25-34 35-44 45-54 55-64 65+ 18-44 45+ œœœœœ œœœœœœœœ œœœœœœœœ œœœœœœœœ œœœœœœœœ œœœœœœœœ œœœœœœœœ œœœœœœœœ œœœœœœœœ œœœœœœœœ œœœœœœœœ œœœœœœœœ œœœœœœœœ
TOTAL YES - REUSED PLASTIC CARRY 487 388 99 233 254 32 76 109 103 79 86 217 268 BAGS 97% 97% 96% 97% 97% 97% 99% 99% 95% 99% 92% 99% 95%
++
reused as bin liners 446 355 91 204 242 27 71 102 98 69 78 200 245 89% 89% 88% 85% 92% 82% 92% 93% 91% 86% 84% 91% 87%
++
reused them for lunch bags 165 33%
126 31%
39 38%
85 35%
80 30%
16 48%
32 42%
40 36%
41 38%
24 30%
12 13%
88 40%
77 27%
++ + +++
reused them when shopping 113 22%
85 21%
28 27%
43 18%
70 27%
3 9%
19 25%
25 23%
31 29%
15 19%
19 20%
47 21%
65 23%
++ - +
reused as general carry bags 376 75%
299 75%
77 75%
186 77%
190 72%
26 79%
66 86%
84 76%
84 78%
56 70%
58 62%
176 80%
198 70%
++ ++
NOT REUSED 16 12 4 7 9 1 1 1 5 1 7 3 13 3% 3% 4% 3% 3% 3% 1% 1% 5% 1% 8% 1% 5%
+++ -- ++
TOTAL ALL RESPONDENTS 503 400 103 240 263 33 77 110 108 80 93 220 281 100% 100% 100% 100% 100% 100% 100% 100% 100% 100% 100% 100% 100%
OCCUPATION EMPLOYMENT œœœœœœœœœœœœœœœœœœœœœœœœœœœœœœœœœœœœœœœœœœœœœœœœœœœœœœœœœœœœœœœœœœœœœœœœœœœœœœœœœœœ œœœœœœœœœœœœœœœœœœœœœœœ
Unemployed Paid Looking Home Retired/ Other In paid Not in
Total Employee for work Student Duties Pensioner Pensioner Other work pd work œœœœœ œœœœœœœœœœœ œœœœœœœœœœœ œœœœœœœœœœœ œœœœœœœœœœœ œœœœœœœœœœœ œœœœœœœœœœœ œœœœœœœœœœœ œœœœœœœœœœœ œœœœœœœœœœœ
TOTAL YES - REUSED PLASTIC CARRY 487 278 BAGS 97% 98%
++
7 18 72 96 12 4 278 202 100% 95% 96% 93% 100% 100% 98% 95%
-- ++ --
reused as bin liners 446 252 7 14 71 89% 89% 100% 74% 95%
+
86 12 4 252 187 83% 100% 100% 89% 88%
-
reused them for lunch bags 165 117 2 10 16 18 1 1 117 4633% 41% 29% 53% 21% 17% 8% 25% 41% 22%
+++ -- --- +++ ---
reused them when shopping 113 64 2 2 19 22 1 3 64 47 22% 23% 29% 11% 25% 21% 8% 75% 23% 22%
reused as general carry bags 376 228 5 17 51 62 9 4 228 143 75% 81% 71% 89% 68% 60% 75% 100% 81% 67%
+++ --- +++ ---
NOT REUSED 16 5 0 1 3 7 0 0 5 11 3% 2% 0% 5% 4% 7% 0% 0% 2% 5%
-- ++ -- ++
TOTAL ALL RESPONDENTS 503 283 7 19 75 103 12 4 283 213 100% 100% 100% 100% 100% 100% 100% 100% 100% 100%
Prepared by McGregor Tan Research (Ref: 6798)
- 34 -
---
EPA - PLASTIC BAGS RESEARCH - JULY 2003
Question 7: In the last month, have you reused any of your plastic carry bags? If yes - read out 1-4
MAIN GROCERY SHOPPER GROSS ANNUAL HOUSEHOLD INCOME œœœœœœœœœœœœœœœœœœœœœ œœœœœœœœœœœœœœœœœœœœœœœœœœœœœœœœœœœœœœœœœœœœœœœœœœœœœœœœœœœœœœœœœœœœœœœœœœœœœœœœœœœœœœœœœœœœœœœœœœ
Less than $15,001- $25,001 $50,001 $75,001 $100,001 $125,001 More than Total Yes No $15,000 $25,000 $50,000 $75,000 $100,000 $125,000 $150,000 $150,000 Refused œœœœœ œœœœœœœœœœ œœœœœœœœœœ œœœœœœœœœœ œœœœœœœœœœ œœœœœœœœœœ œœœœœœœœœœ œœœœœœœœœœ œœœœœœœœœœ œœœœœœœœœœ œœœœœœœœœœ œœœœœœœœœœ
TOTAL YES - REUSED PLASTIC CARRY 487 356 131 70 60 133 87 52 10 4 1 70 BAGS 97% 96% 98% 91% 100% 98% 99% 98% 100% 100% 100% 95%
reused as bin liners 446 329 117 62 89% 89% 87% 81%
--
57 123 83 46 9 4 1 61 95% 90% 94% 87% 90% 100% 100% 82%
+ + -
reused them for lunch bags 165 112 53 33% 30% 40%
- +
12 16 51 36 23 3 2 1 21 16% 27% 38% 41% 43% 30% 50% 100% 28%
--- + +
reused them when shopping 113 89 24 19 14 27 21 11 3 0 0 18 22% 24% 18% 25% 23% 20% 24% 21% 30% 0% 0% 24%
reused as general carry bags 376 268 108 75% 73% 81%
- +
50 45 106 70 42 8 3 1 51 65% 75% 78% 80% 79% 80% 75% 100% 69%
--
NOT REUSED 16 13 3 7 0 3 1 1 0 0 0 4 3% 4% 2% 9% 0% 2% 1% 2% 0% 0% 0% 5%
+++
No. of Respondents 503 369 134 77 60 136 88 53 10 4 1 74 100% 100% 100% 100% 100% 100% 100% 100% 100% 100% 100% 100%
Prepared by McGregor Tan Research (Ref: 6798)
- 35 -
Number of Plastic Carry Bags Reused/Recycled
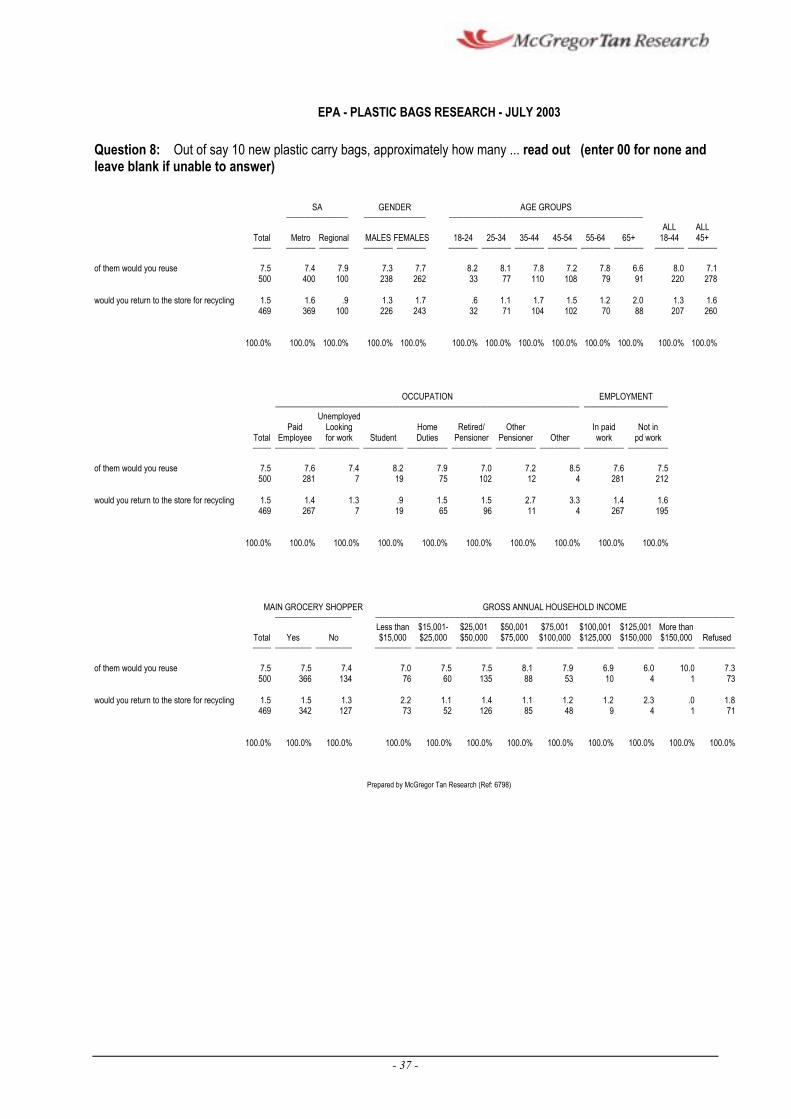
3.5.6 Respondents were asked, out of say 10 new plastic carry bags, how
many:
…….of them would they reuse
…….would they return to the store for recycling
3.5.7 On average, respondents claimed they would reuse 7.5 bags out of 10
and would recycle 1.5 bags.
3.5.8 Those most likely to return plastic carry bags to the store for recycling
were:
¢ Those whose household income was less than $75,000 (2.2 bags)
¢ Those aged 65 years or above (2 bags)
3.5.9 Least likely to return plastic carry bags to the store for recycling were:
¢ Students (0.9 bags)
¢ Young respondents, aged 18 to 24 years (0.6 bags)
¢ Regional respondents (0.9 bags)
- 36 -
EPA - PLASTIC BAGS RESEARCH - JULY 2003
Question 8: Out of say 10 new plastic carry bags, approximately how many ... read out (enter 00 for none and leave blank if unable to answer)
SA GENDER AGE GROUPS œœœœœœœœœœœœœœœœœ œœœœœœœœœœœœœœœœœ œœœœœœœœœœœœœœœœœœœœœœœœœœœœœœœœœœœœœœœœœœœœœœœœœœœœœ
ALL ALL Total Metro Regional MALES FEMALES 18-24 25-34 35-44 45-54 55-64 65+ 18-44 45+ œœœœœ œœœœœœœœ œœœœœœœœ œœœœœœœœ œœœœœœœœ œœœœœœœœ œœœœœœœœ œœœœœœœœ œœœœœœœœ œœœœœœœœ œœœœœœœœ œœœœœœœœ œœœœœœœœ
of them would you reuse 7.5 500
7.4 400
7.9 100
7.3 238
7.7 262
8.2 33
8.1 77
7.8 110
7.2 108
7.8 79
6.6 91
8.0 220
7.1 278
would you return to the store for recycling 1.5 469
1.6 369
.9 100
1.3 226
1.7 243
.6 32
1.1 71
1.7 104
1.5 102
1.2 70
2.0 88
1.3 207
1.6 260
100.0% 100.0% 100.0% 100.0% 100.0% 100.0% 100.0% 100.0% 100.0% 100.0% 100.0% 100.0% 100.0%
OCCUPATION EMPLOYMENT œœœœœœœœœœœœœœœœœœœœœœœœœœœœœœœœœœœœœœœœœœœœœœœœœœœœœœœœœœœœœœœœœœœœœœœœœœœœœœœœœœœ œœœœœœœœœœœœœœœœœœœœœœœ
Unemployed Paid Looking Home Retired/ Other In paid Not in
Total Employee for work Student Duties Pensioner Pensioner Other work pd work œœœœœ œœœœœœœœœœœ œœœœœœœœœœœ œœœœœœœœœœœ œœœœœœœœœœœ œœœœœœœœœœœ œœœœœœœœœœœ œœœœœœœœœœœ œœœœœœœœœœœ œœœœœœœœœœœ
of them would you reuse 7.5 7.6 7.4 8.2 7.9 7.0 7.2 8.5 7.6 7.5 500 281 7 19 75 102 12 4 281 212
would you return to the store for recycling 1.5 1.4 1.3 .9 1.5 1.5 2.7 3.3 1.4 1.6 469 267 7 19 65 96 11 4 267 195
100.0% 100.0% 100.0% 100.0% 100.0% 100.0% 100.0% 100.0% 100.0% 100.0%
MAIN GROCERY SHOPPER GROSS ANNUAL HOUSEHOLD INCOME œœœœœœœœœœœœœœœœœœœœœ œœœœœœœœœœœœœœœœœœœœœœœœœœœœœœœœœœœœœœœœœœœœœœœœœœœœœœœœœœœœœœœœœœœœœœœœœœœœœœœœœœœœœœœœœœœœœœœœœœ
Less than $15,001- $25,001 $50,001 $75,001 $100,001 $125,001 More than Total Yes No $15,000 $25,000 $50,000 $75,000 $100,000 $125,000 $150,000 $150,000 Refused œœœœœ œœœœœœœœœœ œœœœœœœœœœ œœœœœœœœœœ œœœœœœœœœœ œœœœœœœœœœ œœœœœœœœœœ œœœœœœœœœœ œœœœœœœœœœ œœœœœœœœœœ œœœœœœœœœœ œœœœœœœœœœ
of them would you reuse 7.5 7.5 7.4 7.0 7.5 7.5 8.1 7.9 6.9 6.0 10.0 7.3 500 366 134 76 60 135 88 53 10 4 1 73
would you return to the store for recycling 1.5 1.5 1.3 2.2 1.1 1.4 1.1 1.2 1.2 2.3 .0 1.8 469 342 127 73 52 126 85 48 9 4 1 71
100.0% 100.0% 100.0% 100.0% 100.0% 100.0% 100.0% 100.0% 100.0% 100.0% 100.0% 100.0%
Prepared by McGregor Tan Research (Ref: 6798)
- 37 -
3.6 Level of Agreement with Statements
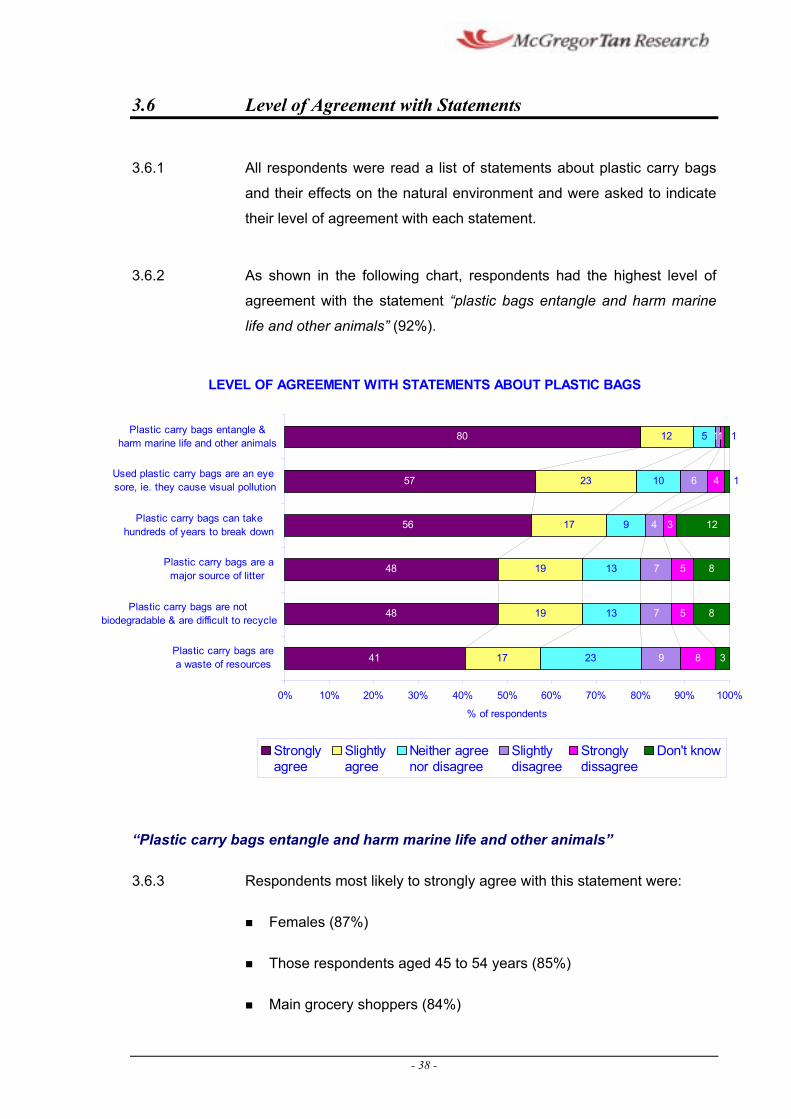
3.6.1 All respondents were read a list of statements about plastic carry bags
and their effects on the natural environment and were asked to indicate
their level of agreement with each statement.
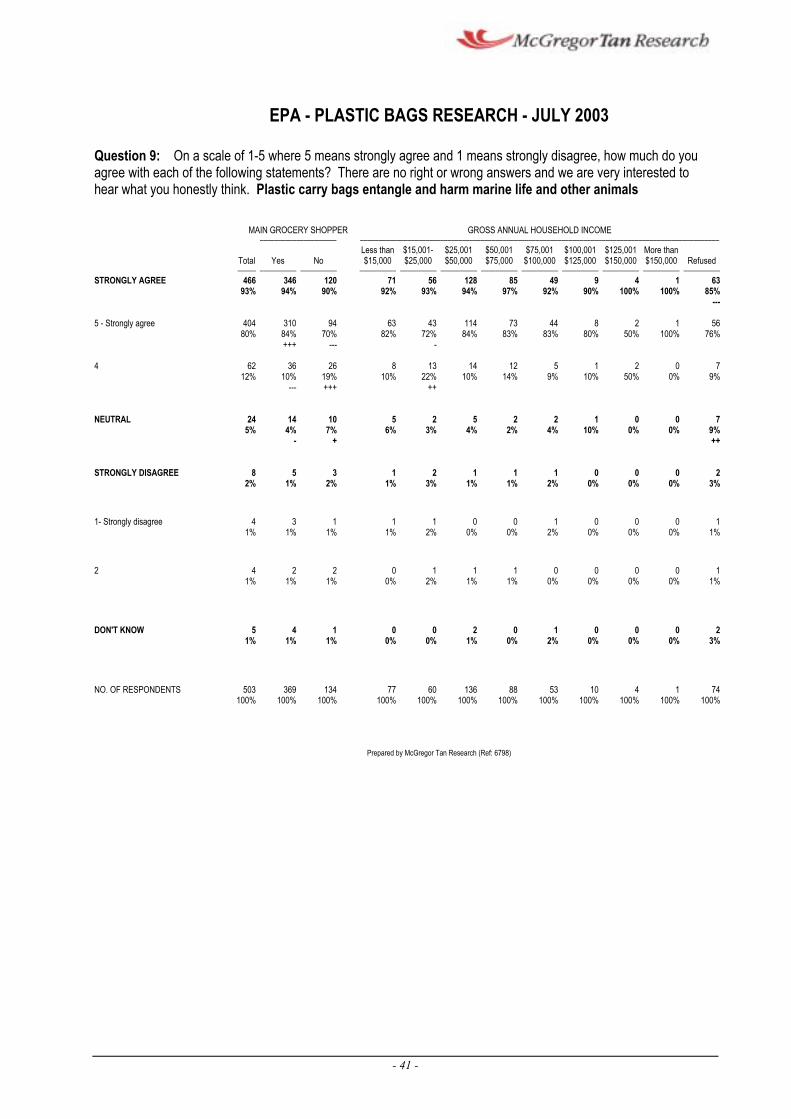
3.6.2 As shown in the following chart, respondents had the highest level of
agreement with the statement —plastic bags entangle and harm marine
life and other animals“ (92%).
LEVEL OF AGREEMENT WITH STATEMENTS ABOUT PLASTIC BAGS
Plastic carry bags entangle &
41
48
48
56
57
80
17
19
19
17
23
12
23
13
13
9
10
5
9
7
7
4
6
8
5
5
3
4
11
12
3
8
8
1harm marine life and other animals
Used plastic carry bags are an eye 1 sore, ie. they cause visual pollution
Plastic carry bags can take hundreds of years to break down
Plastic carry bags are a major source of litter
Plastic carry bags are not biodegradable & are difficult to recycle
Plastic carry bags are a waste of resources
0% 10% 20% 30% 40% 50% 60% 70% 80% 90% 100%
% of respondents
Strongly Slightly Neither agree Slightly Strongly Don't know agree agree nor disagree disagree dissagree
—Plastic carry bags entangle and harm marine life and other animals“
3.6.3 Respondents most likely to strongly agree with this statement were:
¢ Females (87%)
¢ Those respondents aged 45 to 54 years (85%)
¢ Main grocery shoppers (84%)
- 38 -
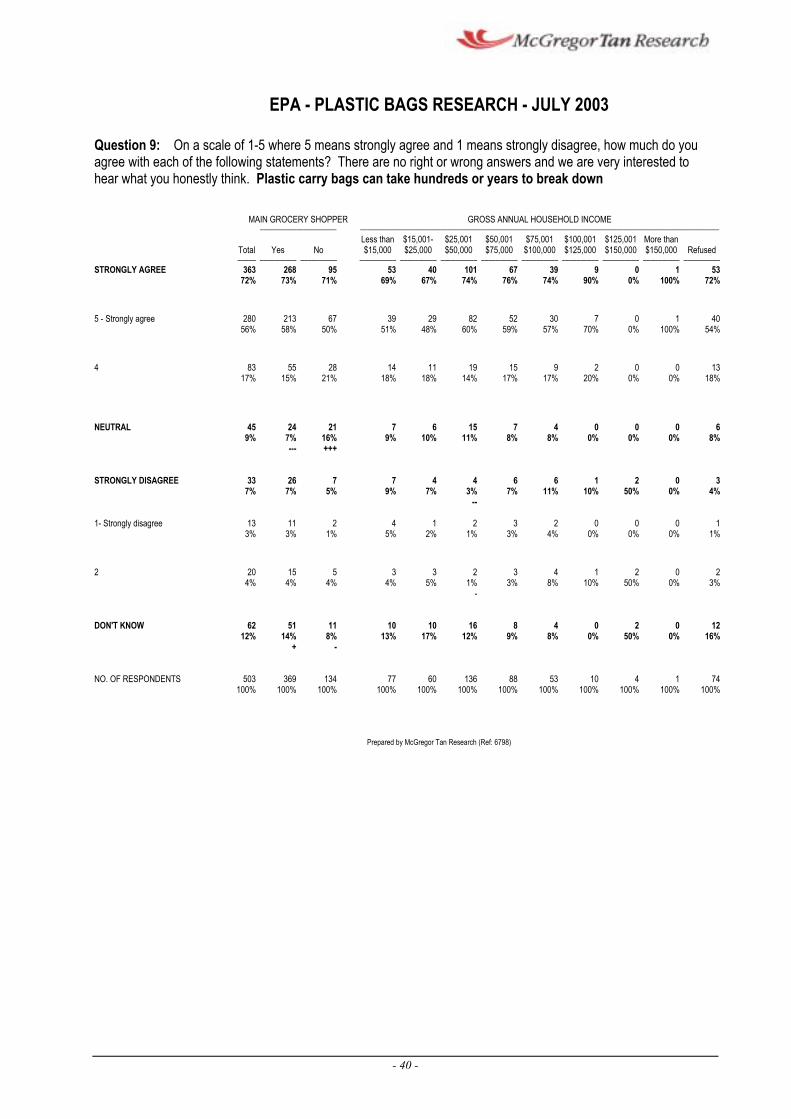
—Plastic carry bags take hundreds of years to break down“
3.6.4 Females (62%) had a significantly higher incidence of strongly agreeing
with this statement than male respondents (48%, compared to an
average 56%).
One in ten (10%) males and 8% of those in paid employment disagreed
with this statement.
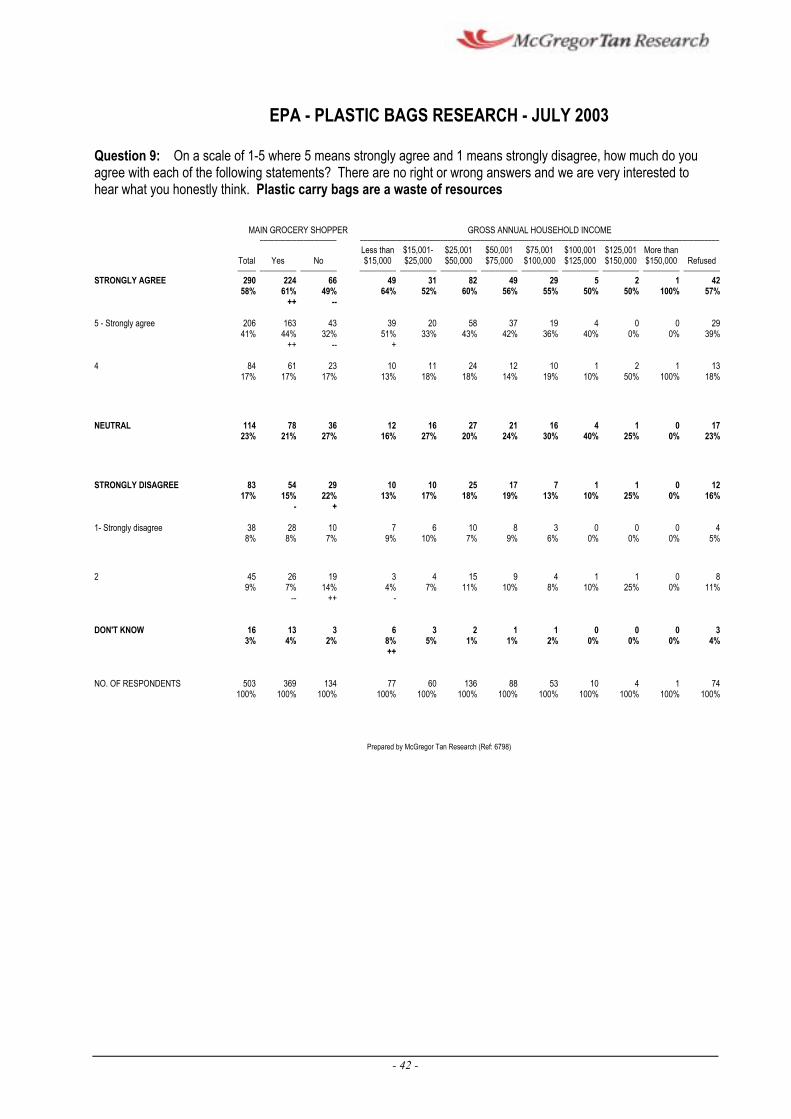
—Plastic carry bags are a waste of resources“
3.6.5 While 41% of respondents strongly agreed with this statement, higher
incidences of the following sub-groups strongly agreed:
¢ Those aged 65 years or above (52%)
¢ Those whose annual household income was < $15,000 (51%)
¢ Retired/Pensioners (50%)
¢ Females (47%)
¢ Main grocery shoppers (44%)
3.6.6 One in five (20%) male respondents disagreed that plastic bags are a
waste of resources.
—Used plastic carry bags are an eyesore, ie, they cause visual pollution“
3.6.7 Females (62%), were again the most likely to strongly agree with this
statement.
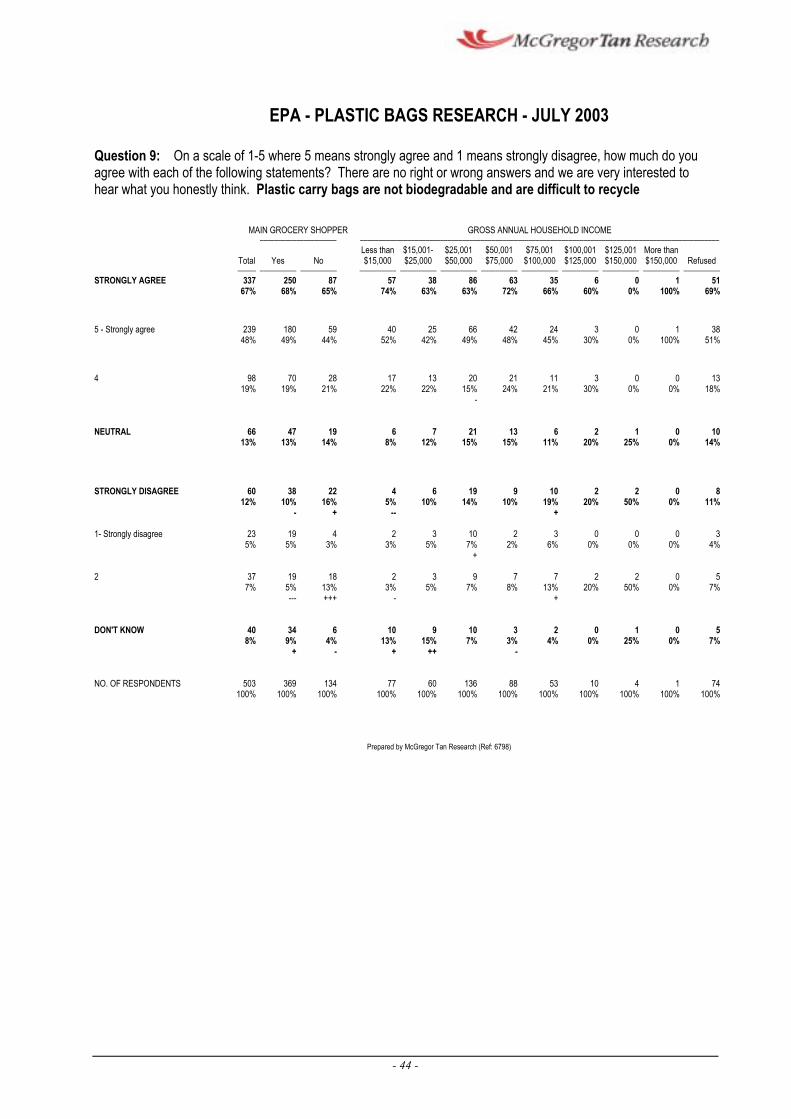
—“Plastic carry bags are not biodegradable and are difficult to recycle“
3.6.8 Those in paid employment had the highest incidence of disagreeing with
this statement (16%, compared to an average 12%).
3.6.9 Those respondents in paid employment were also the most likely to
disagree that —plastic bags are a major source of litter“ (16%,
compared to an average 12%).
- 39 -
--
EPA - PLASTIC BAGS RESEARCH - JULY 2003
Question 9: On a scale of 1-5 where 5 means strongly agree and 1 means strongly disagree, how much do you agree with each of the following statements? There are no right or wrong answers and we are very interested to hear what you honestly think. Plastic carry bags can take hundreds or years to break down
MAIN GROCERY SHOPPER GROSS ANNUAL HOUSEHOLD INCOME œœœœœœœœœœœœœœœœœœœœœ œœœœœœœœœœœœœœœœœœœœœœœœœœœœœœœœœœœœœœœœœœœœœœœœœœœœœœœœœœœœœœœœœœœœœœœœœœœœœœœœœœœœœœœœœœœœœœœœœœ
Less than $15,001- $25,001 $50,001 $75,001 $100,001 $125,001 More than Total Yes No $15,000 $25,000 $50,000 $75,000 $100,000 $125,000 $150,000 $150,000 Refused œœœœœ œœœœœœœœœœ œœœœœœœœœœ œœœœœœœœœœ œœœœœœœœœœ œœœœœœœœœœ œœœœœœœœœœ œœœœœœœœœœ œœœœœœœœœœ œœœœœœœœœœ œœœœœœœœœœ œœœœœœœœœœ
STRONGLY AGREE 363 268 95 53 40 101 67 39 9 0 1 53 72% 73% 71% 69% 67% 74% 76% 74% 90% 0% 100% 72%
5 - Strongly agree 280 213 67 39 29 82 52 30 7 0 1 40 56% 58% 50% 51% 48% 60% 59% 57% 70% 0% 100% 54%
4 83 55 28 14 11 19 15 9 2 0 0 13 17% 15% 21% 18% 18% 14% 17% 17% 20% 0% 0% 18%
NEUTRAL 45 24 21 7 6 15 7 4 0 0 0 6 9% 7% 16% 9% 10% 11% 8% 8% 0% 0% 0% 8%
--- +++
STRONGLY DISAGREE 33 26 7 7 4 4 6 6 1 2 0 3 7% 7% 5% 9% 7% 3% 7% 11% 10% 50% 0% 4%
1- Strongly disagree 13 11 2 4 1 2 3 2 0 0 0 1 3% 3% 1% 5% 2% 1% 3% 4% 0% 0% 0% 1%
2 20 15 5 3 3 2 3 4 1 2 0 2 4% 4% 4% 4% 5% 1% 3% 8% 10% 50% 0% 3%
-
DON'T KNOW 62 51 11 10 10 16 8 4 0 2 0 12 12% 14% 8% 13% 17% 12% 9% 8% 0% 50% 0% 16%
+ -
NO. OF RESPONDENTS 503 369 134 77 60 136 88 53 10 4 1 74 100% 100% 100% 100% 100% 100% 100% 100% 100% 100% 100% 100%
Prepared by McGregor Tan Research (Ref: 6798)
- 40 -
---
EPA - PLASTIC BAGS RESEARCH - JULY 2003
Question 9: On a scale of 1-5 where 5 means strongly agree and 1 means strongly disagree, how much do you agree with each of the following statements? There are no right or wrong answers and we are very interested to hear what you honestly think. Plastic carry bags entangle and harm marine life and other animals
MAIN GROCERY SHOPPER GROSS ANNUAL HOUSEHOLD INCOME œœœœœœœœœœœœœœœœœœœœœ œœœœœœœœœœœœœœœœœœœœœœœœœœœœœœœœœœœœœœœœœœœœœœœœœœœœœœœœœœœœœœœœœœœœœœœœœœœœœœœœœœœœœœœœœœœœœœœœœœ
Less than $15,001- $25,001 $50,001 $75,001 $100,001 $125,001 More than Total Yes No $15,000 $25,000 $50,000 $75,000 $100,000 $125,000 $150,000 $150,000 Refused œœœœœ œœœœœœœœœœ œœœœœœœœœœ œœœœœœœœœœ œœœœœœœœœœ œœœœœœœœœœ œœœœœœœœœœ œœœœœœœœœœ œœœœœœœœœœ œœœœœœœœœœ œœœœœœœœœœ œœœœœœœœœœ
STRONGLY AGREE 466 346 120 71 56 128 85 49 9 4 1 63 93% 94% 90% 92% 93% 94% 97% 92% 90% 100% 100% 85%
5 - Strongly agree 404 310 94 80% 84% 70%
+++ ---
63 43 114 73 44 8 2 1 56 82% 72% 84% 83% 83% 80% 50% 100% 76%
-
4 62 36 26 12% 10% 19%
--- +++
8 13 14 12 5 1 2 0 7 10% 22% 10% 14% 9% 10% 50% 0% 9%
++
NEUTRAL 24 14 10 5% 4% 7%
- +
5 2 5 2 2 1 0 0 7 6% 3% 4% 2% 4% 10% 0% 0% 9%
++
STRONGLY DISAGREE 8 5 3 1 2 1 1 1 0 0 0 2 2% 1% 2% 1% 3% 1% 1% 2% 0% 0% 0% 3%
1- Strongly disagree 4 3 1 1 1 0 0 1 0 0 0 1 1% 1% 1% 1% 2% 0% 0% 2% 0% 0% 0% 1%
2 4 2 2 0 1 1 1 0 0 0 0 1 1% 1% 1% 0% 2% 1% 1% 0% 0% 0% 0% 1%
DON'T KNOW 5 4 1 0 0 2 0 1 0 0 0 2 1% 1% 1% 0% 0% 1% 0% 2% 0% 0% 0% 3%
NO. OF RESPONDENTS 503 369 134 77 60 136 88 53 10 4 1 74 100% 100% 100% 100% 100% 100% 100% 100% 100% 100% 100% 100%
Prepared by McGregor Tan Research (Ref: 6798)
- 41 -
EPA - PLASTIC BAGS RESEARCH - JULY 2003
Question 9: On a scale of 1-5 where 5 means strongly agree and 1 means strongly disagree, how much do you agree with each of the following statements? There are no right or wrong answers and we are very interested to hear what you honestly think. Plastic carry bags are a waste of resources
MAIN GROCERY SHOPPER GROSS ANNUAL HOUSEHOLD INCOME œœœœœœœœœœœœœœœœœœœœœ œœœœœœœœœœœœœœœœœœœœœœœœœœœœœœœœœœœœœœœœœœœœœœœœœœœœœœœœœœœœœœœœœœœœœœœœœœœœœœœœœœœœœœœœœœœœœœœœœœ
Less than $15,001- $25,001 $50,001 $75,001 $100,001 $125,001 More than Total Yes No $15,000 $25,000 $50,000 $75,000 $100,000 $125,000 $150,000 $150,000 Refused œœœœœ œœœœœœœœœœ œœœœœœœœœœ œœœœœœœœœœ œœœœœœœœœœ œœœœœœœœœœ œœœœœœœœœœ œœœœœœœœœœ œœœœœœœœœœ œœœœœœœœœœ œœœœœœœœœœ œœœœœœœœœœ
STRONGLY AGREE 290 224 66 49 31 82 49 29 5 2 1 42 58% 61% 49% 64% 52% 60% 56% 55% 50% 50% 100% 57%
++ --
5 - Strongly agree 206 163 43 41% 44% 32%
++ --
39 20 58 37 19 4 0 0 29 51% 33% 43% 42% 36% 40% 0% 0% 39%
+
4 84 61 23 10 11 24 12 10 1 2 1 13 17% 17% 17% 13% 18% 18% 14% 19% 10% 50% 100% 18%
NEUTRAL 114 78 36 12 16 27 21 16 4 1 0 17 23% 21% 27% 16% 27% 20% 24% 30% 40% 25% 0% 23%
STRONGLY DISAGREE 83 54 29 10 10 25 17 7 1 1 0 12 17% 15% 22% 13% 17% 18% 19% 13% 10% 25% 0% 16%
- +
1- Strongly disagree 38 28 10 7 6 10 8 3 0 0 0 4 8% 8% 7% 9% 10% 7% 9% 6% 0% 0% 0% 5%
2 45 26 19 9% 7% 14%
-- ++
3 4 15 9 4 1 1 0 8 4% 7% 11% 10% 8% 10% 25% 0% 11%
-
DON'T KNOW 16 13 3 6 3 2 1 1 0 0 0 3 3% 4% 2% 8% 5% 1% 1% 2% 0% 0% 0% 4%
++
NO. OF RESPONDENTS 503 369 134 77 60 136 88 53 10 4 1 74 100% 100% 100% 100% 100% 100% 100% 100% 100% 100% 100% 100%
Prepared by McGregor Tan Research (Ref: 6798)
- 42 -

EPA - PLASTIC BAGS RESEARCH - JULY 2003
Question 9: On a scale of 1-5 where 5 means strongly agree and 1 means strongly disagree, how much do you agree with each of the following statements? There are no right or wrong answers and we are very interested to hear what you honestly think. Used plastic carry bags are an eyesore, ie they cause visual pollution
MAIN GROCERY SHOPPER GROSS ANNUAL HOUSEHOLD INCOME œœœœœœœœœœœœœœœœœœœœœ œœœœœœœœœœœœœœœœœœœœœœœœœœœœœœœœœœœœœœœœœœœœœœœœœœœœœœœœœœœœœœœœœœœœœœœœœœœœœœœœœœœœœœœœœœœœœœœœœœ
Less than $15,001- $25,001 $50,001 $75,001 $100,001 $125,001 More than Total Yes No $15,000 $25,000 $50,000 $75,000 $100,000 $125,000 $150,000 $150,000 Refused œœœœœ œœœœœœœœœœ œœœœœœœœœœ œœœœœœœœœœ œœœœœœœœœœ œœœœœœœœœœ œœœœœœœœœœ œœœœœœœœœœ œœœœœœœœœœ œœœœœœœœœœ œœœœœœœœœœ œœœœœœœœœœ
STRONGLY AGREE 400 300 100 61 50 109 67 40 8 4 1 60 80% 81% 75% 79% 83% 80% 76% 75% 80% 100% 100% 81%
5 - Strongly agree 285 57%
216 59%
69 51%
48 62%
31 52%
80 59%
50 57%
32 60%
4 40%
3 75%
0 0%
37 50%
4 115 84 31 13 19 29 17 8 4 1 1 23 23% 23% 23% 17% 32% 21% 19% 15% 40% 25% 100% 31%
+ +
NEUTRAL 48 31 17 5 7 12 10 5 1 0 0 8 10% 8% 13% 6% 12% 9% 11% 9% 10% 0% 0% 11%
STRONGLY DISAGREE 48 32 16 9 3 13 9 8 1 0 0 5 10% 9% 12% 12% 5% 10% 10% 15% 10% 0% 0% 7%
1- Strongly disagree 19 4%
11 3%
8 6%
4 5%
1 2%
4 3%
4 5%
5 9%
0 0%
0 0%
0 0%
1 1%
++
2 29 21 8 5 2 9 5 3 1 0 0 4 6% 6% 6% 6% 3% 7% 6% 6% 10% 0% 0% 5%
DON'T KNOW 7 6 1 2 0 2 2 0 0 0 0 1 1% 2% 1% 3% 0% 1% 2% 0% 0% 0% 0% 1%
NO. OF RESPONDENTS 503 369 134 77 60 136 88 53 10 4 1 74 100% 100% 100% 100% 100% 100% 100% 100% 100% 100% 100% 100%
Prepared by McGregor Tan Research (Ref: 6798)
- 43 -
--
---
EPA - PLASTIC BAGS RESEARCH - JULY 2003
Question 9: On a scale of 1-5 where 5 means strongly agree and 1 means strongly disagree, how much do you agree with each of the following statements? There are no right or wrong answers and we are very interested to hear what you honestly think. Plastic carry bags are not biodegradable and are difficult to recycle
MAIN GROCERY SHOPPER GROSS ANNUAL HOUSEHOLD INCOME œœœœœœœœœœœœœœœœœœœœœ œœœœœœœœœœœœœœœœœœœœœœœœœœœœœœœœœœœœœœœœœœœœœœœœœœœœœœœœœœœœœœœœœœœœœœœœœœœœœœœœœœœœœœœœœœœœœœœœœœ
Less than $15,001- $25,001 $50,001 $75,001 $100,001 $125,001 More than Total Yes No $15,000 $25,000 $50,000 $75,000 $100,000 $125,000 $150,000 $150,000 Refused œœœœœ œœœœœœœœœœ œœœœœœœœœœ œœœœœœœœœœ œœœœœœœœœœ œœœœœœœœœœ œœœœœœœœœœ œœœœœœœœœœ œœœœœœœœœœ œœœœœœœœœœ œœœœœœœœœœ œœœœœœœœœœ
STRONGLY AGREE 337 250 87 57 38 86 63 35 6 0 1 51 67% 68% 65% 74% 63% 63% 72% 66% 60% 0% 100% 69%
5 - Strongly agree 239 48%
180 49%
59 44%
40 52%
25 42%
66 49%
42 48%
24 45%
3 30%
0 0%
1 100%
38 51%
4 98 70 28 17 13 20 21 11 3 0 0 13 19% 19% 21% 22% 22% 15% 24% 21% 30% 0% 0% 18%
-
NEUTRAL 66 47 19 6 7 21 13 6 2 1 0 10 13% 13% 14% 8% 12% 15% 15% 11% 20% 25% 0% 14%
STRONGLY DISAGREE 60 38 22 4 6 19 9 10 2 2 0 8 12% 10% 16% 5% 10% 14% 10% 19% 20% 50% 0% 11%
- + +
1- Strongly disagree 23 5%
19 5%
4 3%
2 3%
3 5%
10 7%
2 2%
3 6%
0 0%
0 0%
0 0%
3 4%
+
2 37 19 18 2 3 9 7 7 2 2 0 5 7% 5% 13% 3% 5% 7% 8% 13% 20% 50% 0% 7%
+++ - +
DON'T KNOW 40 34 6 10 9 10 3 2 0 1 0 5 8% 9% 4% 13% 15% 7% 3% 4% 0% 25% 0% 7%
+ - + ++ -
NO. OF RESPONDENTS 503 369 134 77 60 136 88 53 10 4 1 74 100% 100% 100% 100% 100% 100% 100% 100% 100% 100% 100% 100%
Prepared by McGregor Tan Research (Ref: 6798)
- 44 -
--
---
EPA - PLASTIC BAGS RESEARCH - JULY 2003
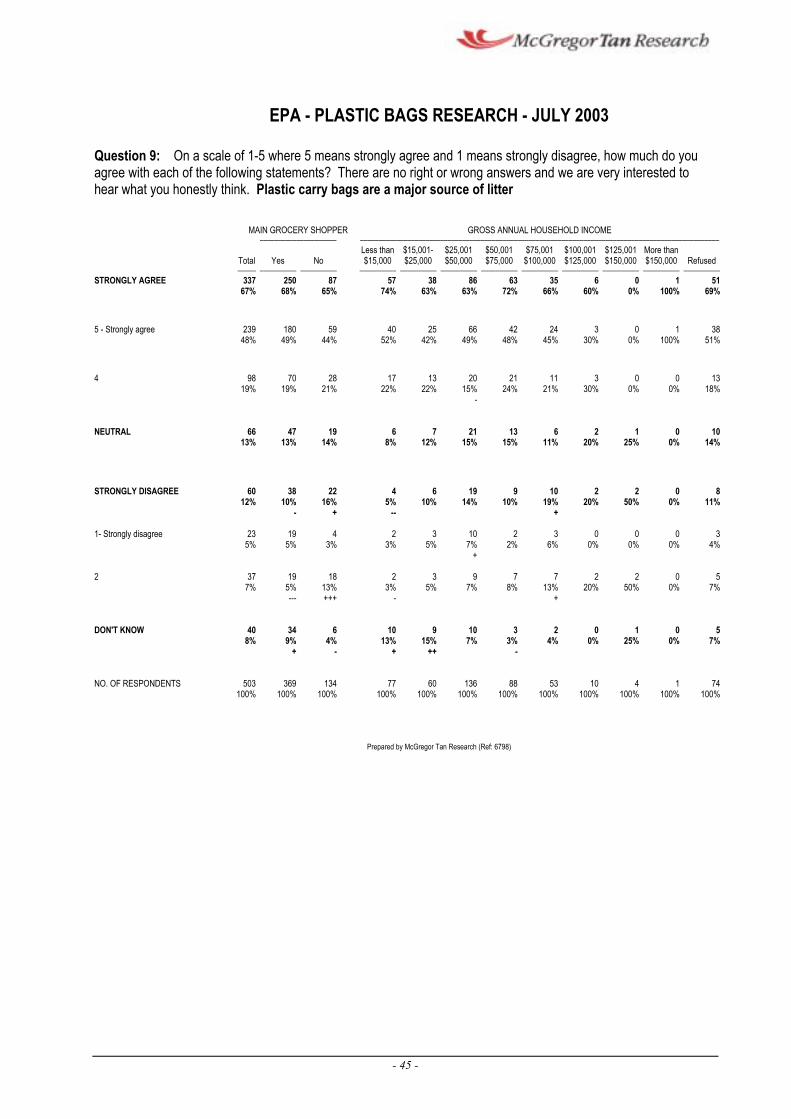
Question 9: On a scale of 1-5 where 5 means strongly agree and 1 means strongly disagree, how much do you agree with each of the following statements? There are no right or wrong answers and we are very interested to hear what you honestly think. Plastic carry bags are a major source of litter
MAIN GROCERY SHOPPER GROSS ANNUAL HOUSEHOLD INCOME œœœœœœœœœœœœœœœœœœœœœ œœœœœœœœœœœœœœœœœœœœœœœœœœœœœœœœœœœœœœœœœœœœœœœœœœœœœœœœœœœœœœœœœœœœœœœœœœœœœœœœœœœœœœœœœœœœœœœœœœ
Less than $15,001- $25,001 $50,001 $75,001 $100,001 $125,001 More than Total Yes No $15,000 $25,000 $50,000 $75,000 $100,000 $125,000 $150,000 $150,000 Refused œœœœœ œœœœœœœœœœ œœœœœœœœœœ œœœœœœœœœœ œœœœœœœœœœ œœœœœœœœœœ œœœœœœœœœœ œœœœœœœœœœ œœœœœœœœœœ œœœœœœœœœœ œœœœœœœœœœ œœœœœœœœœœ
STRONGLY AGREE 337 250 87 57 38 86 63 35 6 0 1 51 67% 68% 65% 74% 63% 63% 72% 66% 60% 0% 100% 69%
5 - Strongly agree 239 48%
180 49%
59 44%
40 52%
25 42%
66 49%
42 48%
24 45%
3 30%
0 0%
1 100%
38 51%
4 98 70 28 17 13 20 21 11 3 0 0 13 19% 19% 21% 22% 22% 15% 24% 21% 30% 0% 0% 18%
-
NEUTRAL 66 47 19 6 7 21 13 6 2 1 0 10 13% 13% 14% 8% 12% 15% 15% 11% 20% 25% 0% 14%
STRONGLY DISAGREE 60 38 22 4 6 19 9 10 2 2 0 8 12% 10% 16% 5% 10% 14% 10% 19% 20% 50% 0% 11%
- + +
1- Strongly disagree 23 5%
19 5%
4 3%
2 3%
3 5%
10 7%
2 2%
3 6%
0 0%
0 0%
0 0%
3 4%
+
2 37 19 18 2 3 9 7 7 2 2 0 5 7% 5% 13% 3% 5% 7% 8% 13% 20% 50% 0% 7%
+++ - +
DON'T KNOW 40 34 6 10 9 10 3 2 0 1 0 5 8% 9% 4% 13% 15% 7% 3% 4% 0% 25% 0% 7%
+ - + ++ -
NO. OF RESPONDENTS 503 369 134 77 60 136 88 53 10 4 1 74 100% 100% 100% 100% 100% 100% 100% 100% 100% 100% 100% 100%
Prepared by McGregor Tan Research (Ref: 6798)
- 45 -
Statement of Greatest Concern
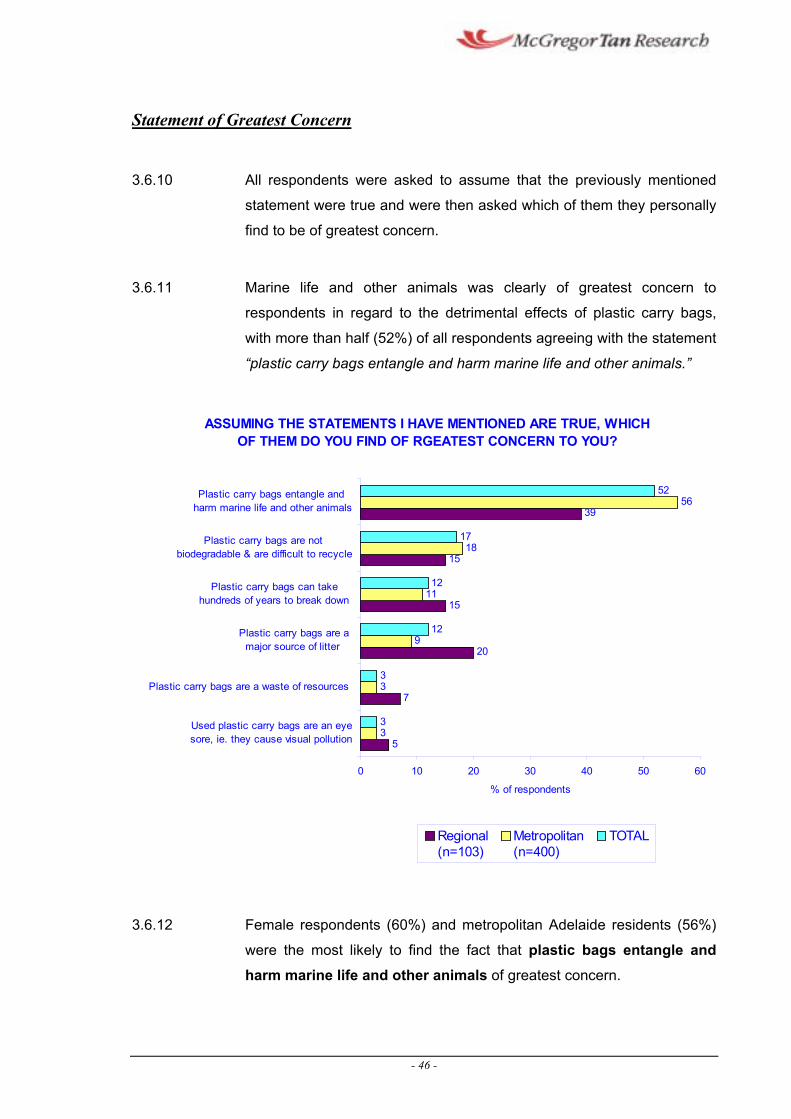
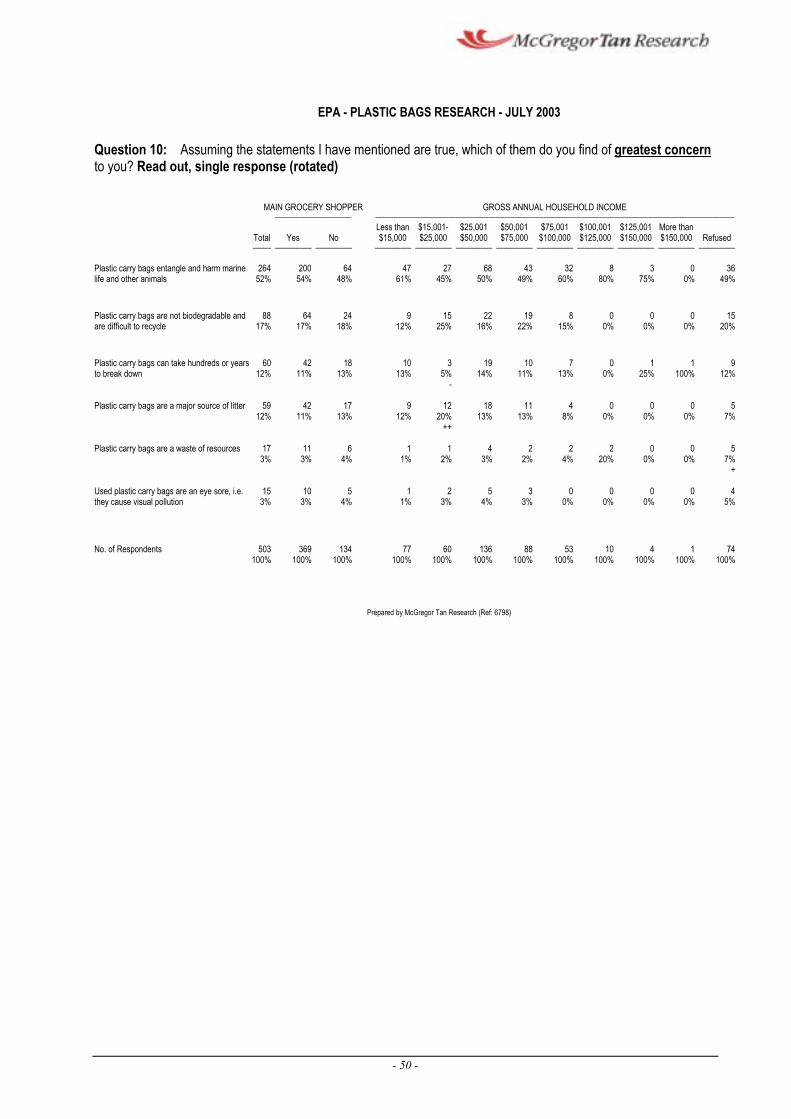
3.6.10 All respondents were asked to assume that the previously mentioned
statement were true and were then asked which of them they personally
find to be of greatest concern.
3.6.11 Marine life and other animals was clearly of greatest concern to
respondents in regard to the detrimental effects of plastic carry bags,
with more than half (52%) of all respondents agreeing with the statement
—plastic carry bags entangle and harm marine life and other animals.“
ASSUMING THE STATEMENTS I HAVE MENTIONED ARE TRUE, WHICH OF THEM DO YOU FIND OF RGEATEST CONCERN TO YOU?
52Plastic carry bags entangle and 56harm marine life and other animals 39
17Plastic carry bags are not 18biodegradable & are difficult to recycle 15
12Plastic carry bags can take 11hundreds of years to break down 15
12Plastic carry bags are a 9 major source of litter 20
3 Plastic carry bags are a waste of resources 3
7
3Used plastic carry bags are an eye 3 sore, ie. they cause visual pollution 5
0 10 20 30 40 50 60
% of respondents
Regional Metropolitan TOTAL (n=103) (n=400)
3.6.12 Female respondents (60%) and metropolitan Adelaide residents (56%)
were the most likely to find the fact that plastic bags entangle and harm marine life and other animals of greatest concern.
- 46 -
3.6.13 Respondents from regional South Australia (20%) had a significantly
higher than average incidence of perceiving plastic bags to be a major source of litter (compared to 9% of metropolitan respondents).
- 47 -
---
---
--
EPA - PLASTIC BAGS RESEARCH - JULY 2003
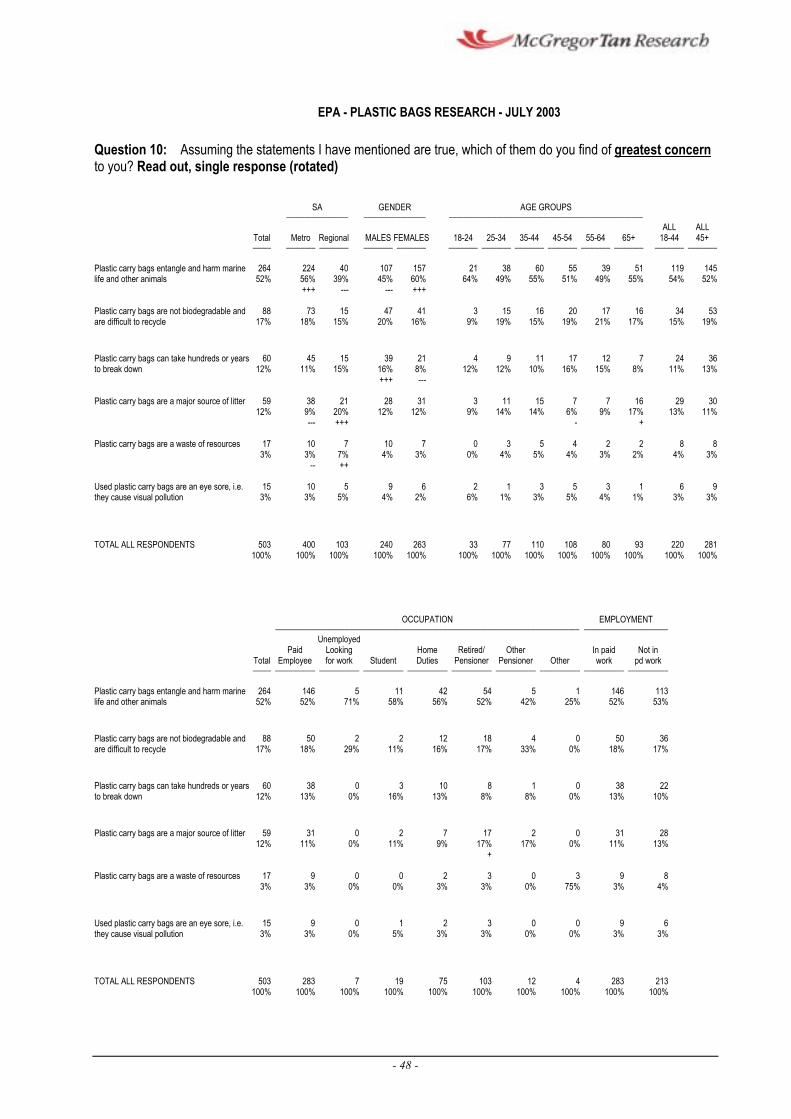
Question 10: Assuming the statements I have mentioned are true, which of them do you find of greatest concern to you? Read out, single response (rotated)
SA GENDER AGE GROUPS œœœœœœœœœœœœœœœœœ œœœœœœœœœœœœœœœœœ œœœœœœœœœœœœœœœœœœœœœœœœœœœœœœœœœœœœœœœœœœœœœœœœœœœœœ
ALL ALL Total Metro Regional MALES FEMALES 18-24 25-34 35-44 45-54 55-64 65+ 18-44 45+ œœœœœ œœœœœœœœ œœœœœœœœ œœœœœœœœ œœœœœœœœ œœœœœœœœ œœœœœœœœ œœœœœœœœ œœœœœœœœ œœœœœœœœ œœœœœœœœ œœœœœœœœ œœœœœœœœ
Plastic carry bags entangle and harm marine 264 224 40 107 157 21 38 60 55 39 51 119 145 life and other animals 52% 56% 39% 45% 60% 64% 49% 55% 51% 49% 55% 54% 52%
+++ --- --- +++
Plastic carry bags are not biodegradable and 88 73 15 47 41 3 15 16 20 17 16 34 53 are difficult to recycle 17% 18% 15% 20% 16% 9% 19% 15% 19% 21% 17% 15% 19%
Plastic carry bags can take hundreds or years to break down
60 12%
45 11%
15 15%
39 16%
21 8%
4 12%
9 12%
11 10%
17 16%
12 15%
7 8%
24 11%
36 13%
+++
Plastic carry bags are a major source of litter 59 12%
38 9%
21 20%
28 12%
31 12%
3 9%
11 14%
15 14%
7 6%
7 9%
16 17%
29 13%
30 11%
+++ - +
Plastic carry bags are a waste of resources 17 3%
10 3%
7 7%
10 4%
7 3%
0 0%
3 4%
5 5%
4 4%
2 3%
2 2%
8 4%
8 3%
++
Used plastic carry bags are an eye sore, i.e. they cause visual pollution
15 3%
10 3%
5 5%
9 4%
6 2%
2 6%
1 1%
3 3%
5 5%
3 4%
1 1%
6 3%
9 3%
TOTAL ALL RESPONDENTS 503 400 103 240 263 33 77 110 108 80 93 220 281 100% 100% 100% 100% 100% 100% 100% 100% 100% 100% 100% 100% 100%
OCCUPATION EMPLOYMENT œœœœœœœœœœœœœœœœœœœœœœœœœœœœœœœœœœœœœœœœœœœœœœœœœœœœœœœœœœœœœœœœœœœœœœœœœœœœœœœœœœœ œœœœœœœœœœœœœœœœœœœœœœœ
Unemployed Paid Looking Home Retired/ Other In paid Not in
Total Employee for work Student Duties Pensioner Pensioner Other work pd work œœœœœ œœœœœœœœœœœ œœœœœœœœœœœ œœœœœœœœœœœ œœœœœœœœœœœ œœœœœœœœœœœ œœœœœœœœœœœ œœœœœœœœœœœ œœœœœœœœœœœ œœœœœœœœœœœ
Plastic carry bags entangle and harm marine 264 146 5 11 42 54 5 1 146 113 life and other animals 52% 52% 71% 58% 56% 52% 42% 25% 52% 53%
Plastic carry bags are not biodegradable and 88 50 2 2 12 18 4 0 50 36 are difficult to recycle 17% 18% 29% 11% 16% 17% 33% 0% 18% 17%
Plastic carry bags can take hundreds or years 60 38 0 3 10 8 1 0 38 22 to break down 12% 13% 0% 16% 13% 8% 8% 0% 13% 10%
Plastic carry bags are a major source of litter 59 31 0 2 7 17 2 0 31 28 12% 11% 0% 11% 9% 17% 17% 0% 11% 13%
+
Plastic carry bags are a waste of resources 17 9 0 0 2 3 0 3 9 8 3% 3% 0% 0% 3% 3% 0% 75% 3% 4%
Used plastic carry bags are an eye sore, i.e. 15 9 0 1 2 3 0 0 9 6 they cause visual pollution 3% 3% 0% 5% 3% 3% 0% 0% 3% 3%
TOTAL ALL RESPONDENTS 503 283 7 19 75 103 12 4 283 213 100% 100% 100% 100% 100% 100% 100% 100% 100% 100%
- 48 -
Prepared by McGregor Tan Research (Ref: 6798)
- 49 -
EPA - PLASTIC BAGS RESEARCH - JULY 2003
Question 10: Assuming the statements I have mentioned are true, which of them do you find of greatest concern to you? Read out, single response (rotated)
MAIN GROCERY SHOPPER GROSS ANNUAL HOUSEHOLD INCOME œœœœœœœœœœœœœœœœœœœœœ œœœœœœœœœœœœœœœœœœœœœœœœœœœœœœœœœœœœœœœœœœœœœœœœœœœœœœœœœœœœœœœœœœœœœœœœœœœœœœœœœœœœœœœœœœœœœœœœœœ
Less than $15,001- $25,001 $50,001 $75,001 $100,001 $125,001 More than Total Yes No $15,000 $25,000 $50,000 $75,000 $100,000 $125,000 $150,000 $150,000 Refused œœœœœ œœœœœœœœœœ œœœœœœœœœœ œœœœœœœœœœ œœœœœœœœœœ œœœœœœœœœœ œœœœœœœœœœ œœœœœœœœœœ œœœœœœœœœœ œœœœœœœœœœ œœœœœœœœœœ œœœœœœœœœœ
Plastic carry bags entangle and harm marine 264 200 64 47 27 68 43 32 8 3 0 36 life and other animals 52% 54% 48% 61% 45% 50% 49% 60% 80% 75% 0% 49%
Plastic carry bags are not biodegradable and 88 64 24 9 15 22 19 8 0 0 0 15 are difficult to recycle 17% 17% 18% 12% 25% 16% 22% 15% 0% 0% 0% 20%
Plastic carry bags can take hundreds or years 60 42 18 10 3 19 10 7 0 1 1 9 to break down 12% 11% 13% 13% 5% 14% 11% 13% 0% 25% 100% 12%
-
Plastic carry bags are a major source of litter 59 12%
42 11%
17 13%
9 12%
12 20%
18 13%
11 13%
4 8%
0 0%
0 0%
0 0%
5 7%
++
Plastic carry bags are a waste of resources 17 3%
11 3%
6 4%
1 1%
1 2%
4 3%
2 2%
2 4%
2 20%
0 0%
0 0%
5 7%
+
Used plastic carry bags are an eye sore, i.e. they cause visual pollution
15 3%
10 3%
5 4%
1 1%
2 3%
5 4%
3 3%
0 0%
0 0%
0 0%
0 0%
4 5%
No. of Respondents 503 369 134 77 60 136 88 53 10 4 1 74 100% 100% 100% 100% 100% 100% 100% 100% 100% 100% 100% 100%
Prepared by McGregor Tan Research (Ref: 6798)
- 50 -
3.7 Legislation or Business to Curb Problem
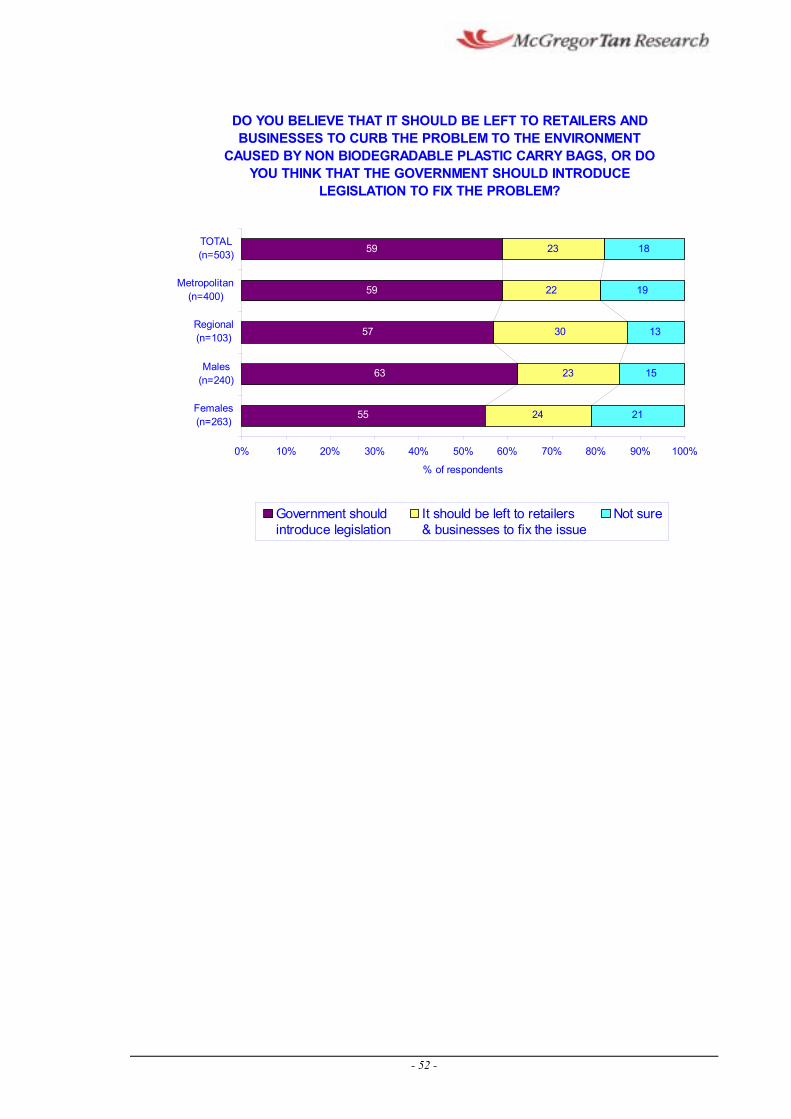
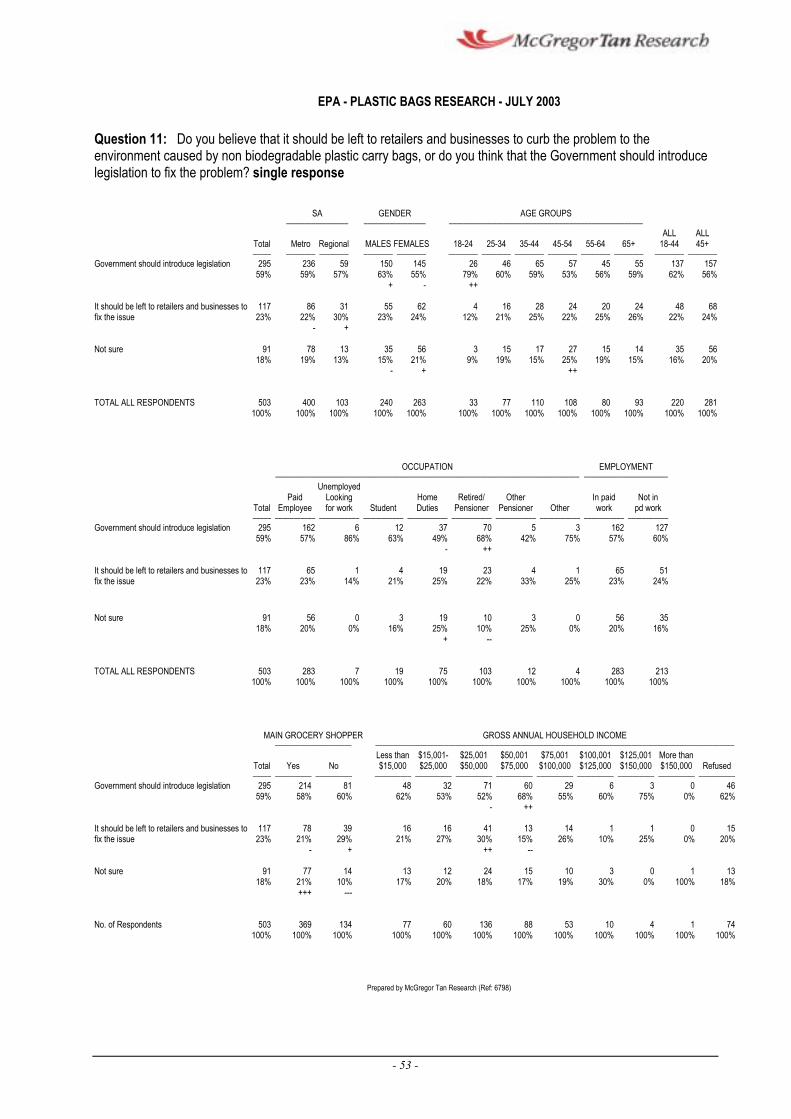
3.7.1 Respondents were asked if they believe that it should be left to retailers
and businesses to curb the problem to the environment caused by non
biodegradable plastic carry bags, or do they think that Government
should introduce legislation to fix the problem.
3.7.2 Clearly, legislation is the preferred way in which South Australian survey
respondents would prefer the plastic bag problem to be resolved. The
greatest proportion of respondents stated that Government should introduce legislation to fix the problem (59%), with young respondents,
aged 18 to 24 years (79%) and retired pensioners (68%) most likely to
cite this response.
3.7.3 Almost one quarter (23%) of interviewees thought that it should be left to retailers and businesses to fix the problem, while another 18% were
not sure.
3.7.4 A significantly higher than average (21%) proportion of respondents who
were the main grocery shopper commented that they were not sure if
legislation should be introduced or if the problem should be left to
retailers and businesses.
- 51 -
DO YOU BELIEVE THAT IT SHOULD BE LEFT TO RETAILERS AND BUSINESSES TO CURB THE PROBLEM TO THE ENVIRONMENT
CAUSED BY NON BIODEGRADABLE PLASTIC CARRY BAGS, OR DO YOU THINK THAT THE GOVERNMENT SHOULD INTRODUCE
LEGISLATION TO FIX THE PROBLEM?
55
63
57
59
59
24
23
30
22
23
21
15
13
19
18
(
(
(
i(
(
Females n=263)
Males n=240)
Regional n=103)
Metropol tan n=400)
TOTAL n=503)
0% 10% 20% 30% 40% 50% 60% 70% 80% 90% 100%
% of respondents
i ion I f il
fiGovernment should ntroduce legislat
t should be le t to reta ers & businesses to x the issue
Not sure
- 52 -
EPA - PLASTIC BAGS RESEARCH - JULY 2003
Question 11: Do you believe that it should be left to retailers and businesses to curb the problem to the environment caused by non biodegradable plastic carry bags, or do you think that the Government should introduce legislation to fix the problem? single response
SA GENDER AGE GROUPS œœœœœœœœœœœœœœœœœ œœœœœœœœœœœœœœœœœ œœœœœœœœœœœœœœœœœœœœœœœœœœœœœœœœœœœœœœœœœœœœœœœœœœœœœ
ALL ALL Total Metro Regional MALES FEMALES 18-24 25-34 35-44 45-54 55-64 65+ 18-44 45+ œœœœœ œœœœœœœœ œœœœœœœœ œœœœœœœœ œœœœœœœœ œœœœœœœœ œœœœœœœœ œœœœœœœœ œœœœœœœœ œœœœœœœœ œœœœœœœœ œœœœœœœœ œœœœœœœœ
Government should introduce legislation 295 59%
236 59%
59 57%
150 63%
145 55%
26 79%
46 60%
65 59%
57 53%
45 56%
55 59%
137 62%
157 56%
+ - ++
It should be left to retailers and businesses to 117 86 31 55 62 4 16 28 24 20 24 48 68 fix the issue 23% 22% 30% 23% 24% 12% 21% 25% 22% 25% 26% 22% 24%
- +
Not sure 91 78 13 35 56 3 15 17 27 15 14 35 56 18% 19% 13% 15% 21% 9% 19% 15% 25% 19% 15% 16% 20%
- + ++
TOTAL ALL RESPONDENTS 503 400 103 240 263 33 77 110 108 80 93 220 281 100% 100% 100% 100% 100% 100% 100% 100% 100% 100% 100% 100% 100%
OCCUPATION EMPLOYMENT œœœœœœœœœœœœœœœœœœœœœœœœœœœœœœœœœœœœœœœœœœœœœœœœœœœœœœœœœœœœœœœœœœœœœœœœœœœœœœœœœœœ œœœœœœœœœœœœœœœœœœœœœœœ
Unemployed Paid Looking Home Retired/ Other In paid Not in
Total Employee for work Student Duties Pensioner Pensioner Other work pd work œœœœœ œœœœœœœœœœœ œœœœœœœœœœœ œœœœœœœœœœœ œœœœœœœœœœœ œœœœœœœœœœœ œœœœœœœœœœœ œœœœœœœœœœœ œœœœœœœœœœœ œœœœœœœœœœœ
Government should introduce legislation 295 162 6 12 37 70 5 3 162 127 59% 57% 86% 63% 49% 68% 42% 75% 57% 60%
- ++
It should be left to retailers and businesses to 117 65 1 4 19 23 4 1 65 51 fix the issue 23% 23% 14% 21% 25% 22% 33% 25% 23% 24%
Not sure 91 56 0 3 19 18% 20% 0% 16% 25%
+
10 3 0 56 35 10% 25% 0% 20% 16%
--
TOTAL ALL RESPONDENTS 503 283 7 19 75 103 12 4 283 213 100% 100% 100% 100% 100% 100% 100% 100% 100% 100%
MAIN GROCERY SHOPPER GROSS ANNUAL HOUSEHOLD INCOME œœœœœœœœœœœœœœœœœœœœœ œœœœœœœœœœœœœœœœœœœœœœœœœœœœœœœœœœœœœœœœœœœœœœœœœœœœœœœœœœœœœœœœœœœœœœœœœœœœœœœœœœœœœœœœœœœœœœœœœœ
Less than $15,001- $25,001 $50,001 $75,001 $100,001 $125,001 More than Total Yes No $15,000 $25,000 $50,000 $75,000 $100,000 $125,000 $150,000 $150,000 Refused œœœœœ œœœœœœœœœœ œœœœœœœœœœ œœœœœœœœœœ œœœœœœœœœœ œœœœœœœœœœ œœœœœœœœœœ œœœœœœœœœœ œœœœœœœœœœ œœœœœœœœœœ œœœœœœœœœœ œœœœœœœœœœ
Government should introduce legislation 295 214 81 48 32 71 60 29 6 3 0 46 59% 58% 60% 62% 53% 52% 68% 55% 60% 75% 0% 62%
- ++
It should be left to retailers and businesses to 117 78 fix the issue 23% 21%
-
39 16 16 41 13 14 1 1 0 15 29% 21% 27% 30% 15% 26% 10% 25% 0% 20%
+ ++ --
Not sure 91 77 18% 21%
+++
14 13 12 24 15 10 3 0 1 13 10% 17% 20% 18% 17% 19% 30% 0% 100% 18%
---
No. of Respondents 503 369 134 77 60 136 88 53 10 4 1 74 100% 100% 100% 100% 100% 100% 100% 100% 100% 100% 100% 100%
Prepared by McGregor Tan Research (Ref: 6798)
- 53 -
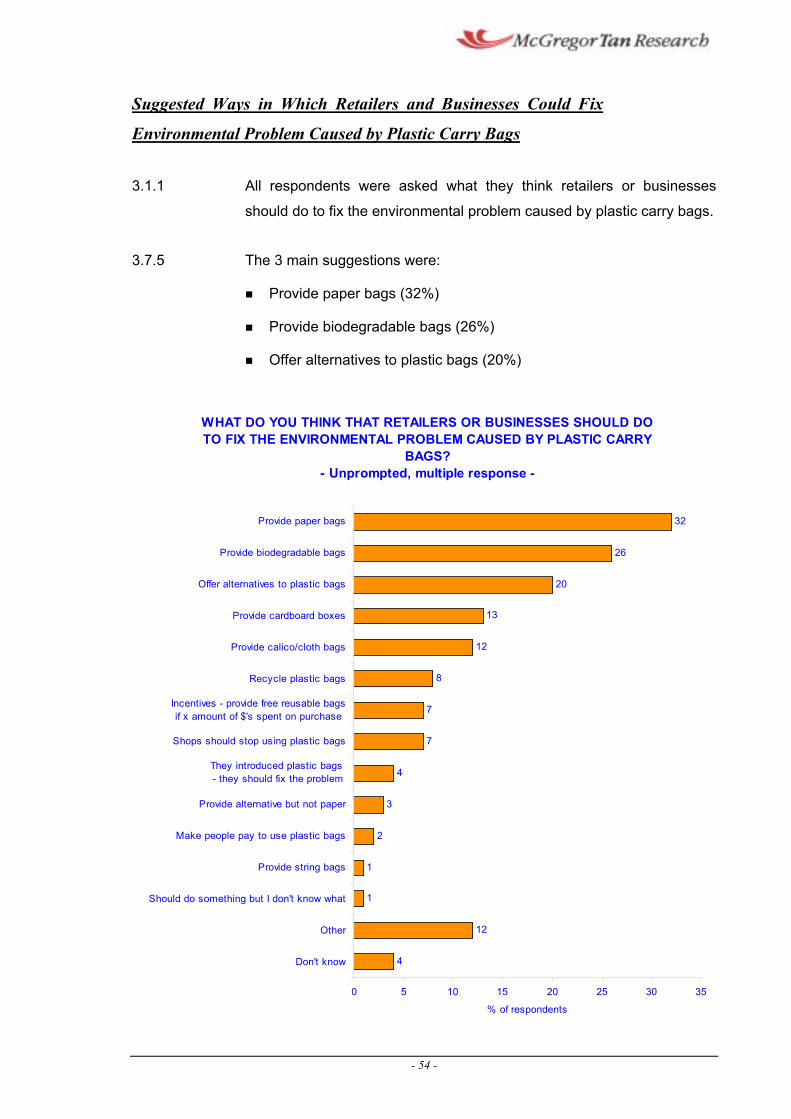
Suggested Ways in Which Retailers and Businesses Could Fix
Environmental Problem Caused by Plastic Carry Bags
3.1.1 All respondents were asked what they think retailers or businesses
should do to fix the environmental problem caused by plastic carry bags.
3.7.5 The 3 main suggestions were:
¢ Provide paper bags (32%)
¢ Provide biodegradable bags (26%)
¢ Offer alternatives to plastic bags (20%)
WHAT DO YOU THINK THAT RETAILERS OR BUSINESSES SHOULD DO TO FIX THE ENVIRONMENTAL PROBLEM CAUSED BY PLASTIC CARRY
BAGS? - Unprompted, multiple response -
Provide paper bags
Provide biodegradable bags
Offer alternatives to plastic bags
Provide cardboard boxes
Provide calico/cloth bags
Recycle plastic bags
Incentives - provide free reusable bagsif x amount of $'s spent on purchase
Shops should stop using plastic bags
They introduced plastic bags - they should fix the problem
Provide alternative but not paper
Make people pay to use plastic bags
Provide string bags
Should do something but I don't know what
Other
Don't know
0 5 10 15 20 25 30 35
4
12
1
1
2
3
4
7
7
8
12
13
20
26
32
% of respondents
- 54 -
3.1.2 While 7% of respondents cited incentives (such as providing reusable
plastic bags if x amount of money was spent), a higher than average
proportion of respondents aged 18 to 44 years nominated this response
(13%).
- 55 -
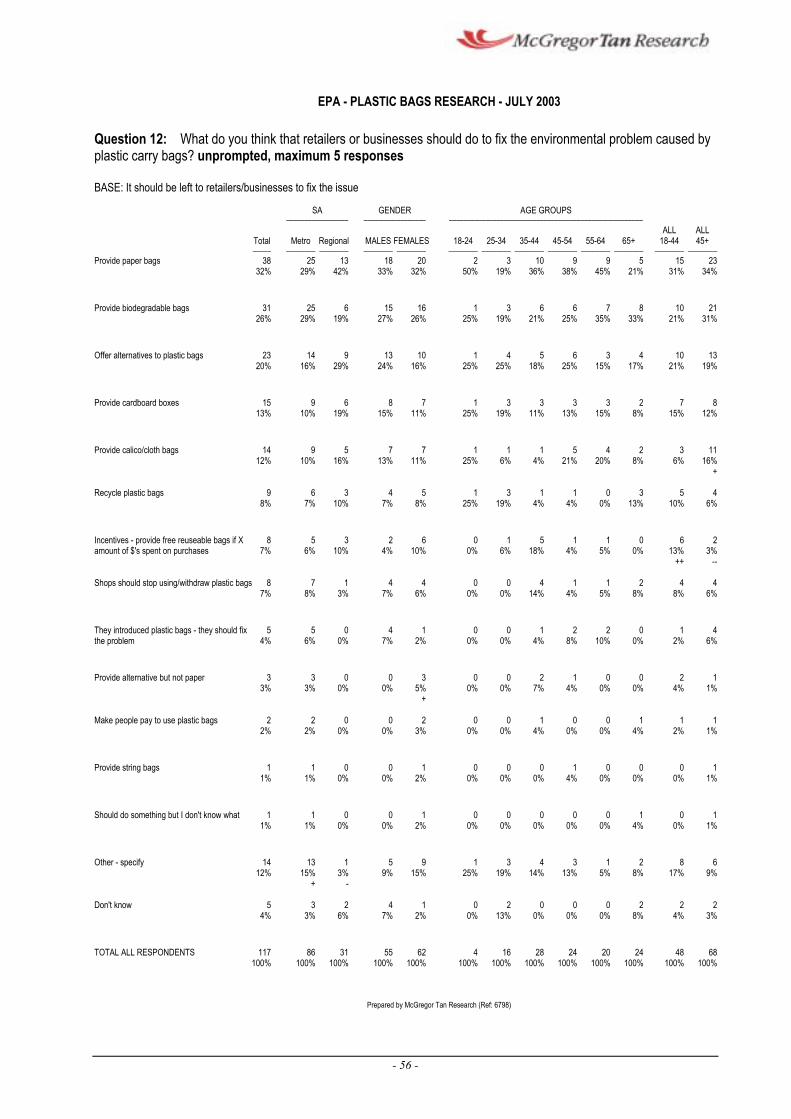
EPA - PLASTIC BAGS RESEARCH - JULY 2003
Question 12: What do you think that retailers or businesses should do to fix the environmental problem caused by plastic carry bags? unprompted, maximum 5 responses
BASE: It should be left to retailers/businesses to fix the issue
SA GENDER AGE GROUPS œœœœœœœœœœœœœœœœœ œœœœœœœœœœœœœœœœœ œœœœœœœœœœœœœœœœœœœœœœœœœœœœœœœœœœœœœœœœœœœœœœœœœœœœœ
ALL ALL Total Metro Regional MALES FEMALES 18-24 25-34 35-44 45-54 55-64 65+ 18-44 45+ œœœœœ œœœœœœœœ œœœœœœœœ œœœœœœœœ œœœœœœœœ œœœœœœœœ œœœœœœœœ œœœœœœœœ œœœœœœœœ œœœœœœœœ œœœœœœœœ œœœœœœœœ œœœœœœœœ
Provide paper bags 38 32%
25 29%
13 42%
18 33%
20 32%
2 50%
3 19%
10 36%
9 38%
9 45%
5 21%
15 31%
23 34%
Provide biodegradable bags 31 25 6 15 16 1 3 6 6 7 8 10 21 26% 29% 19% 27% 26% 25% 19% 21% 25% 35% 33% 21% 31%
Offer alternatives to plastic bags 23 14 9 13 10 1 4 5 6 3 4 10 13 20% 16% 29% 24% 16% 25% 25% 18% 25% 15% 17% 21% 19%
Provide cardboard boxes 15 9 6 8 7 1 3 3 3 3 2 7 8 13% 10% 19% 15% 11% 25% 19% 11% 13% 15% 8% 15% 12%
Provide calico/cloth bags 14 9 5 7 7 1 1 1 5 4 2 3 1112% 10% 16% 13% 11% 25% 6% 4% 21% 20% 8% 6% 16%
+
Recycle plastic bags 9 6 3 4 5 1 3 1 1 0 3 5 4 8% 7% 10% 7% 8% 25% 19% 4% 4% 0% 13% 10% 6%
Incentives - provide free reuseable bags if X 8 5 3 2 6 0 1 5 1 1 0 6 2 amount of $'s spent on purchases 7% 6% 10% 4% 10% 0% 6% 18% 4% 5% 0% 13% 3%
++ --
Shops should stop using/withdraw plastic bags 8 7 1 4 4 0 0 4 1 1 2 4 4 7% 8% 3% 7% 6% 0% 0% 14% 4% 5% 8% 8% 6%
They introduced plastic bags - they should fix 5 5 0 4 1 0 0 1 2 2 0 1 4 the problem 4% 6% 0% 7% 2% 0% 0% 4% 8% 10% 0% 2% 6%
Provide alternative but not paper 3 3 0 0 3 0 0 2 1 0 0 2 1 3% 3% 0% 0% 5% 0% 0% 7% 4% 0% 0% 4% 1%
+
Make people pay to use plastic bags 2 2 0 0 2 0 0 1 0 0 1 1 1 2% 2% 0% 0% 3% 0% 0% 4% 0% 0% 4% 2% 1%
Provide string bags 1 1 0 0 1 0 0 0 1 0 0 0 1 1% 1% 0% 0% 2% 0% 0% 0% 4% 0% 0% 0% 1%
Should do something but I don't know what 1 1 0 0 1 0 0 0 0 0 1 0 1 1% 1% 0% 0% 2% 0% 0% 0% 0% 0% 4% 0% 1%
Other - specify 14 13 1 5 9 1 3 4 3 1 2 8 6 12% 15% 3% 9% 15% 25% 19% 14% 13% 5% 8% 17% 9%
+ -
Don't know 5 3 2 4 1 0 2 0 0 0 2 2 2 4% 3% 6% 7% 2% 0% 13% 0% 0% 0% 8% 4% 3%
TOTAL ALL RESPONDENTS 117 86 31 55 62 4 16 28 24 20 24 48 68 100% 100% 100% 100% 100% 100% 100% 100% 100% 100% 100% 100% 100%
Prepared by McGregor Tan Research (Ref: 6798)
- 56 -
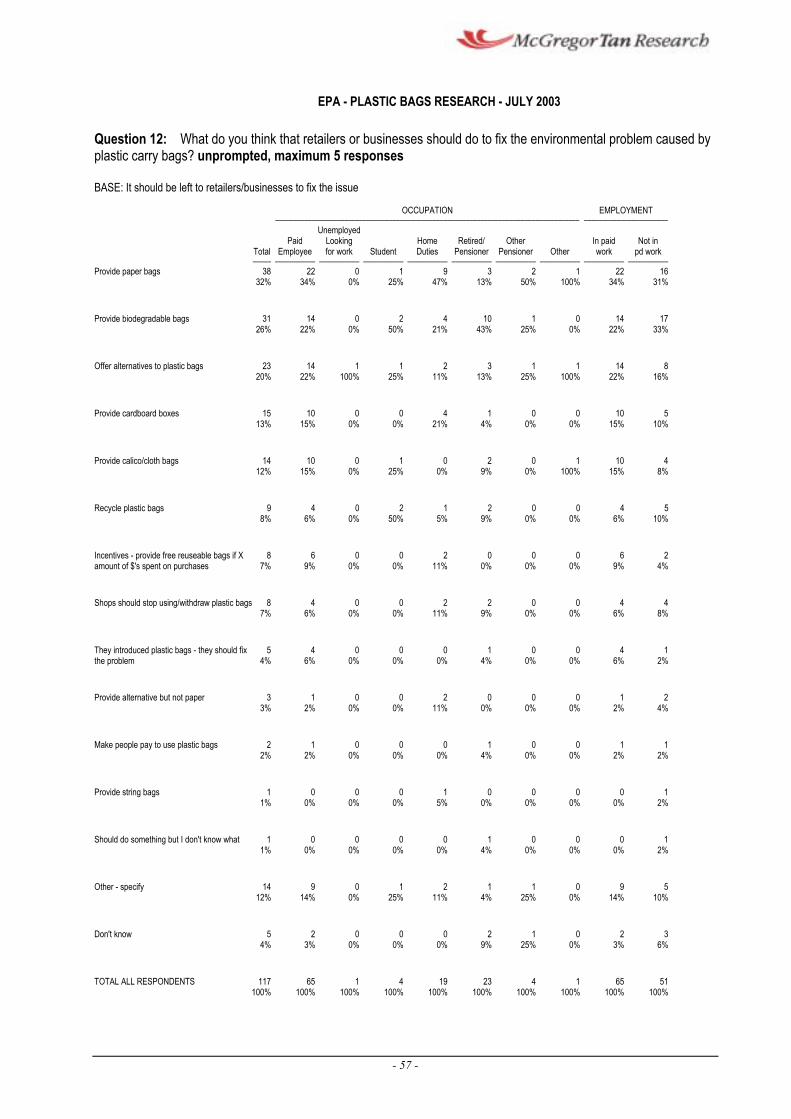
16
EPA - PLASTIC BAGS RESEARCH - JULY 2003
Question 12: What do you think that retailers or businesses should do to fix the environmental problem caused by plastic carry bags? unprompted, maximum 5 responses
BASE: It should be left to retailers/businesses to fix the issue
OCCUPATION EMPLOYMENT œœœœœœœœœœœœœœœœœœœœœœœœœœœœœœœœœœœœœœœœœœœœœœœœœœœœœœœœœœœœœœœœœœœœœœœœœœœœœœœœœœœ œœœœœœœœœœœœœœœœœœœœœœœ
Unemployed Paid Looking Home Retired/ Other In paid Not in
Total Employee for work Student Duties Pensioner Pensioner Other work pd work œœœœœ œœœœœœœœœœœ œœœœœœœœœœœ œœœœœœœœœœœ œœœœœœœœœœœ œœœœœœœœœœœ œœœœœœœœœœœ œœœœœœœœœœœ œœœœœœœœœœœ œœœœœœœœœœœ
Provide paper bags 38 22 0 1 9 3 2 1 22 32% 34% 0% 25% 47% 13% 50% 100% 34% 31%
Provide biodegradable bags 31 14 0 2 4 10 1 0 14 17 26% 22% 0% 50% 21% 43% 25% 0% 22% 33%
Offer alternatives to plastic bags 23 14 1 1 2 3 1 1 14 8 20% 22% 100% 25% 11% 13% 25% 100% 22% 16%
Provide cardboard boxes 15 10 0 0 4 1 0 0 10 5 13% 15% 0% 0% 21% 4% 0% 0% 15% 10%
Provide calico/cloth bags 14 10 0 1 0 2 0 1 10 4 12% 15% 0% 25% 0% 9% 0% 100% 15% 8%
Recycle plastic bags 9 4 0 2 1 2 0 0 4 5 8% 6% 0% 50% 5% 9% 0% 0% 6% 10%
Incentives - provide free reuseable bags if X 8 6 0 0 2 0 0 0 6 2 amount of $'s spent on purchases 7% 9% 0% 0% 11% 0% 0% 0% 9% 4%
Shops should stop using/withdraw plastic bags 8 4 0 0 2 2 0 0 4 4 7% 6% 0% 0% 11% 9% 0% 0% 6% 8%
They introduced plastic bags - they should fix 5 4 0 0 0 1 0 0 4 1 the problem 4% 6% 0% 0% 0% 4% 0% 0% 6% 2%
Provide alternative but not paper 3 1 0 0 2 0 0 0 1 2 3% 2% 0% 0% 11% 0% 0% 0% 2% 4%
Make people pay to use plastic bags 2 1 0 0 0 1 0 0 1 1 2% 2% 0% 0% 0% 4% 0% 0% 2% 2%
Provide string bags 1 0 0 0 1 0 0 0 0 1 1% 0% 0% 0% 5% 0% 0% 0% 0% 2%
Should do something but I don't know what 1 0 0 0 0 1 0 0 0 1 1% 0% 0% 0% 0% 4% 0% 0% 0% 2%
Other - specify 14 9 0 1 2 1 1 0 9 5 12% 14% 0% 25% 11% 4% 25% 0% 14% 10%
Don't know 5 2 0 0 0 2 1 0 2 3 4% 3% 0% 0% 0% 9% 25% 0% 3% 6%
TOTAL ALL RESPONDENTS 117 65 1 4 19 23 4 1 65 51 100% 100% 100% 100% 100% 100% 100% 100% 100% 100%
- 57 -

Prepared by McGregor Tan Research (Ref: 6798)
- 58 -
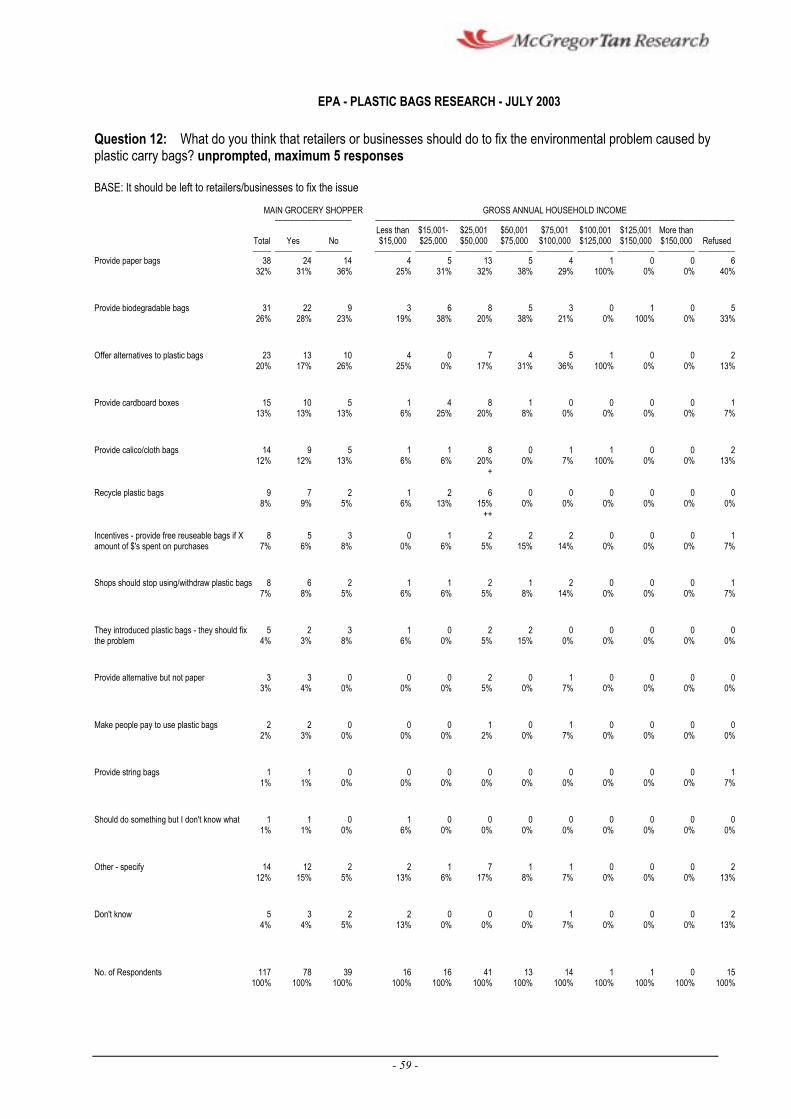
EPA - PLASTIC BAGS RESEARCH - JULY 2003
Question 12: What do you think that retailers or businesses should do to fix the environmental problem caused by plastic carry bags? unprompted, maximum 5 responses
BASE: It should be left to retailers/businesses to fix the issue
MAIN GROCERY SHOPPER GROSS ANNUAL HOUSEHOLD INCOME œœœœœœœœœœœœœœœœœœœœœ œœœœœœœœœœœœœœœœœœœœœœœœœœœœœœœœœœœœœœœœœœœœœœœœœœœœœœœœœœœœœœœœœœœœœœœœœœœœœœœœœœœœœœœœœœœœœœœœœœ
Less than $15,001- $25,001 $50,001 $75,001 $100,001 $125,001 More than Total Yes No $15,000 $25,000 $50,000 $75,000 $100,000 $125,000 $150,000 $150,000 Refused œœœœœ œœœœœœœœœœ œœœœœœœœœœ œœœœœœœœœœ œœœœœœœœœœ œœœœœœœœœœ œœœœœœœœœœ œœœœœœœœœœ œœœœœœœœœœ œœœœœœœœœœ œœœœœœœœœœ œœœœœœœœœœ
Provide paper bags 38 24 14 4 5 13 5 4 1 0 0 6 32% 31% 36% 25% 31% 32% 38% 29% 100% 0% 0% 40%
Provide biodegradable bags 31 22 9 3 6 8 5 3 0 1 0 5 26% 28% 23% 19% 38% 20% 38% 21% 0% 100% 0% 33%
Offer alternatives to plastic bags 23 13 10 4 0 7 4 5 1 0 0 2 20% 17% 26% 25% 0% 17% 31% 36% 100% 0% 0% 13%
Provide cardboard boxes 15 10 5 1 4 8 1 0 0 0 0 1 13% 13% 13% 6% 25% 20% 8% 0% 0% 0% 0% 7%
Provide calico/cloth bags 14 9 5 1 1 8 0 1 1 0 0 2 12% 12% 13% 6% 6% 20% 0% 7% 100% 0% 0% 13%
+
Recycle plastic bags 9 7 2 1 2 6 0 0 0 0 0 0 8% 9% 5% 6% 13% 15% 0% 0% 0% 0% 0% 0%
++
Incentives - provide free reuseable bags if X 8 5 3 0 1 2 2 2 0 0 0 1 amount of $'s spent on purchases 7% 6% 8% 0% 6% 5% 15% 14% 0% 0% 0% 7%
Shops should stop using/withdraw plastic bags 8 6 2 1 1 2 1 2 0 0 0 1 7% 8% 5% 6% 6% 5% 8% 14% 0% 0% 0% 7%
They introduced plastic bags - they should fix 5 2 3 1 0 2 2 0 0 0 0 0 the problem 4% 3% 8% 6% 0% 5% 15% 0% 0% 0% 0% 0%
Provide alternative but not paper 3 3 0 0 0 2 0 1 0 0 0 0 3% 4% 0% 0% 0% 5% 0% 7% 0% 0% 0% 0%
Make people pay to use plastic bags 2 2 0 0 0 1 0 1 0 0 0 0 2% 3% 0% 0% 0% 2% 0% 7% 0% 0% 0% 0%
Provide string bags 1 1 0 0 0 0 0 0 0 0 0 1 1% 1% 0% 0% 0% 0% 0% 0% 0% 0% 0% 7%
Should do something but I don't know what 1 1 0 1 0 0 0 0 0 0 0 0 1% 1% 0% 6% 0% 0% 0% 0% 0% 0% 0% 0%
Other - specify 14 12 2 2 1 7 1 1 0 0 0 2 12% 15% 5% 13% 6% 17% 8% 7% 0% 0% 0% 13%
Don't know 5 3 2 2 0 0 0 1 0 0 0 2 4% 4% 5% 13% 0% 0% 0% 7% 0% 0% 0% 13%
No. of Respondents 117 78 39 16 16 41 13 14 1 1 0 15 100% 100% 100% 100% 100% 100% 100% 100% 100% 100% 100% 100%
- 59 -

Prepared by McGregor Tan Research (Ref: 6798)
- 60 -
3.8 Ban or Levy
3.8.1 All interviewees were asked, as an initial response, would they prefer to
see:
……A ban on non-biodegradable plastic carry bags with environment
friendly bags made available to the public; or
……A charge or levy on plastic carry bags at the point of sale.
3.8.2 A ban on non-biodegradable bags was the preferred option, nominated
by 70% of respondents.
3.8.3 One in five (20%) respondents would prefer a charge or levy on plastic
carry bags at the point of sale, with another 10% who were not sure.
3.8.4 Sub-groups with the highest incidence of supporting the ban were:
¢ Those aged 35 to 44 years (77%)
¢ Those in home duties (81%)
¢ Those who annual household income was $50,001-$75,000 (78%)
3.8.5 Those with the highest incidence of supporting a charge or levy on
plastic carry bags were:
¢ Females (23%)
¢ Those aged 25 to 34 years (30%)
¢ Paid employees (24%)
- 61 -
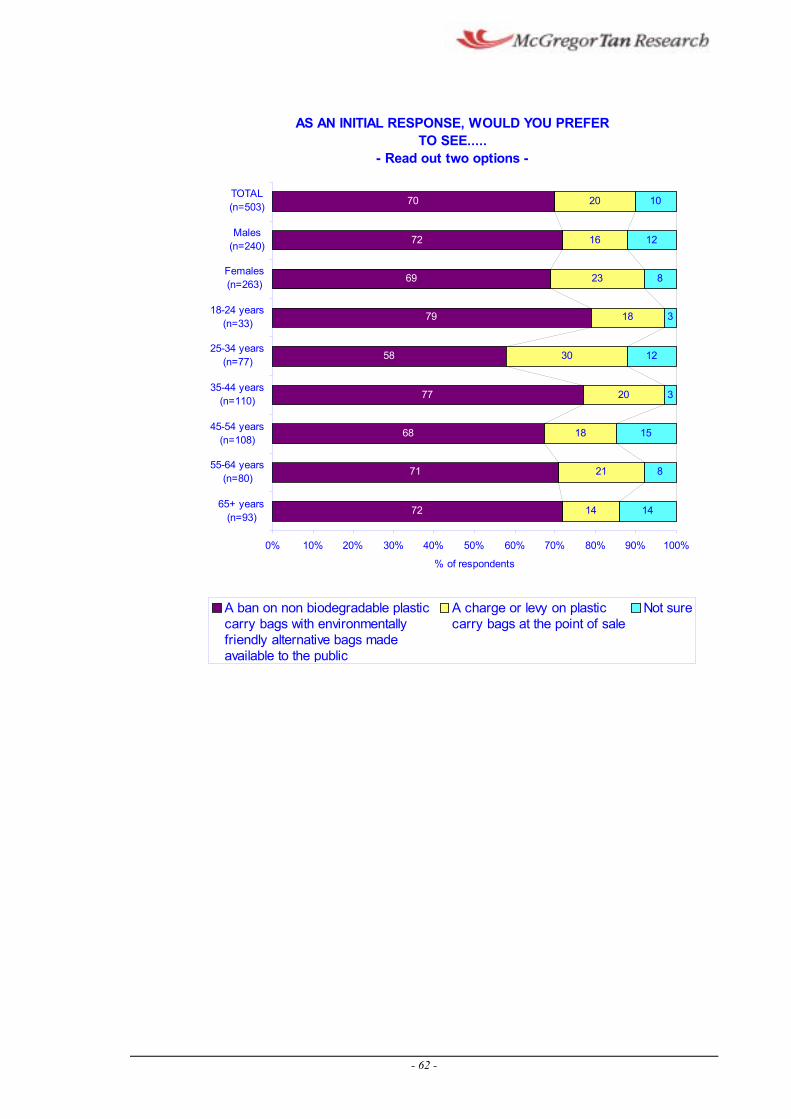
AS AN INITIAL RESPONSE, WOULD YOU PREFER TO SEE.....
- Read out two options -
TOTAL(n=503)
Males(n=240)
Females(n=263)
18-24 years (n=33)
25-34 years (n=77)
35-44 years (n=110)
45-54 years (n=108)
55-64 years (n=80)
65+ years(n=93)
72
71
68
77
58
79
69
72
70
14
21
18
20
30
18
23
16
20
14
8
15
12
3
8
12
10
3
0% 10% 20% 30% 40% 50% 60% 70% 80% 90% 100%
% of respondents
A ban on non biodegradable plastic A charge or levy on plastic Not sure carry bags with environmentally carry bags at the point of sale friendly alternative bags made available to the public
- 62 -
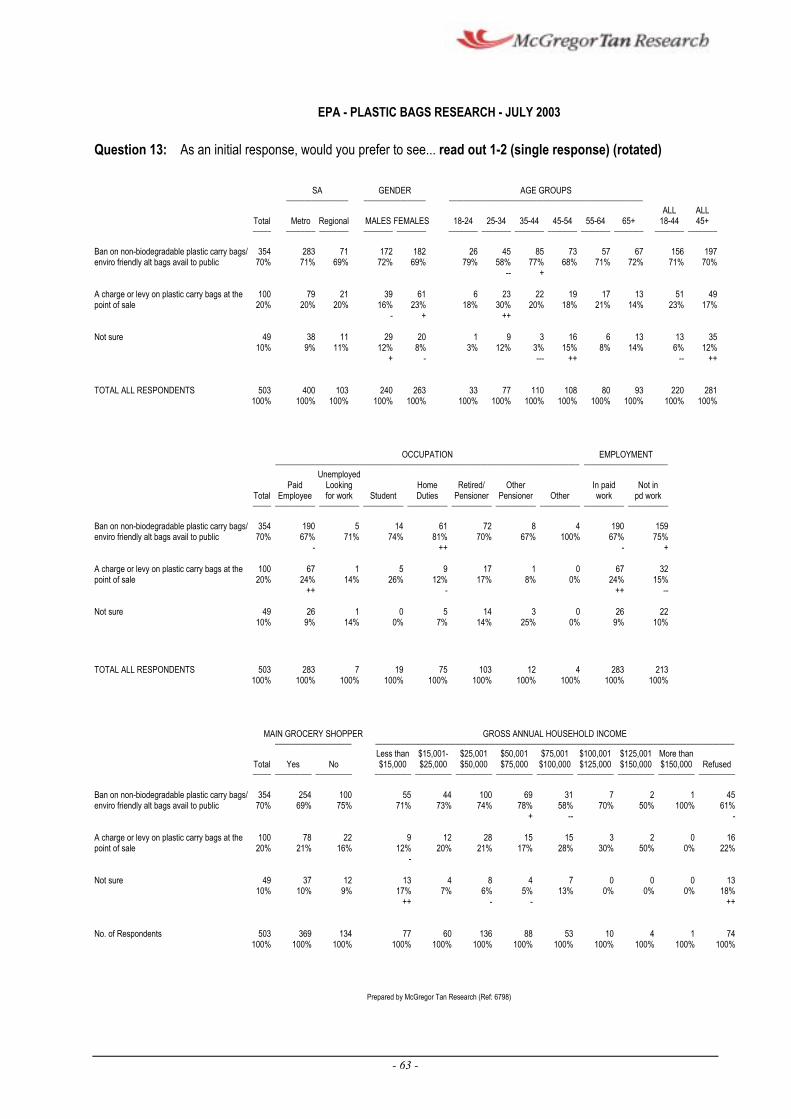
--
--- --
EPA - PLASTIC BAGS RESEARCH - JULY 2003
Question 13: As an initial response, would you prefer to see... read out 1-2 (single response) (rotated)
SA GENDER AGE GROUPS œœœœœœœœœœœœœœœœœ œœœœœœœœœœœœœœœœœ œœœœœœœœœœœœœœœœœœœœœœœœœœœœœœœœœœœœœœœœœœœœœœœœœœœœœ
ALL ALL Total Metro Regional MALES FEMALES 18-24 25-34 35-44 45-54 55-64 65+ 18-44 45+ œœœœœ œœœœœœœœ œœœœœœœœ œœœœœœœœ œœœœœœœœ œœœœœœœœ œœœœœœœœ œœœœœœœœ œœœœœœœœ œœœœœœœœ œœœœœœœœ œœœœœœœœ œœœœœœœœ
Ban on non-biodegradable plastic carry bags/ enviro friendly alt bags avail to public
354 70%
283 71%
71 69%
172 72%
182 69%
26 79%
45 58%
85 77%
73 68%
57 71%
67 72%
156 71%
197 70%
+
A charge or levy on plastic carry bags at the point of sale
100 20%
79 20%
21 20%
39 16%
61 23%
6 18%
23 30%
22 20%
19 18%
17 21%
13 14%
51 23%
49 17%
- + ++
Not sure 49 38 11 29 20 1 9 3 16 6 13 13 35 10% 9% 11% 12% 8% 3% 12% 3% 15% 8% 14% 6% 12%
+ - ++ ++
TOTAL ALL RESPONDENTS 503 400 103 240 263 33 77 110 108 80 93 220 281 100% 100% 100% 100% 100% 100% 100% 100% 100% 100% 100% 100% 100%
OCCUPATION EMPLOYMENT œœœœœœœœœœœœœœœœœœœœœœœœœœœœœœœœœœœœœœœœœœœœœœœœœœœœœœœœœœœœœœœœœœœœœœœœœœœœœœœœœœœ œœœœœœœœœœœœœœœœœœœœœœœ
Unemployed Paid Looking Home Retired/ Other In paid Not in
Total Employee for work Student Duties Pensioner Pensioner Other work pd work œœœœœ œœœœœœœœœœœ œœœœœœœœœœœ œœœœœœœœœœœ œœœœœœœœœœœ œœœœœœœœœœœ œœœœœœœœœœœ œœœœœœœœœœœ œœœœœœœœœœœ œœœœœœœœœœœ
Ban on non-biodegradable plastic carry bags/ 354 190 5 14 61 72 8 4 190 159 enviro friendly alt bags avail to public 70% 67% 71% 74% 81% 70% 67% 100% 67% 75%
- ++ - +
A charge or levy on plastic carry bags at the 100 67 1 5 9 17 1 0 67 32 point of sale 20% 24% 14% 26% 12% 17% 8% 0% 24% 15%
++ - ++ --
Not sure 49 26 1 0 5 14 3 0 26 22 10% 9% 14% 0% 7% 14% 25% 0% 9% 10%
TOTAL ALL RESPONDENTS 503 283 7 19 75 103 12 4 283 213 100% 100% 100% 100% 100% 100% 100% 100% 100% 100%
MAIN GROCERY SHOPPER GROSS ANNUAL HOUSEHOLD INCOME œœœœœœœœœœœœœœœœœœœœœ œœœœœœœœœœœœœœœœœœœœœœœœœœœœœœœœœœœœœœœœœœœœœœœœœœœœœœœœœœœœœœœœœœœœœœœœœœœœœœœœœœœœœœœœœœœœœœœœœœ
Less than $15,001- $25,001 $50,001 $75,001 $100,001 $125,001 More than Total Yes No $15,000 $25,000 $50,000 $75,000 $100,000 $125,000 $150,000 $150,000 Refused œœœœœ œœœœœœœœœœ œœœœœœœœœœ œœœœœœœœœœ œœœœœœœœœœ œœœœœœœœœœ œœœœœœœœœœ œœœœœœœœœœ œœœœœœœœœœ œœœœœœœœœœ œœœœœœœœœœ œœœœœœœœœœ
Ban on non-biodegradable plastic carry bags/ 354 254 100 55 44 100 69 31 7 2 1 45 enviro friendly alt bags avail to public 70% 69% 75% 71% 73% 74% 78% 58% 70% 50% 100% 61%
+ -- -
A charge or levy on plastic carry bags at the 100 78 22 9 12 28 15 15 3 2 0 16 point of sale 20% 21% 16% 12% 20% 21% 17% 28% 30% 50% 0% 22%
-
Not sure 49 37 12 13 10% 10% 9% 17%
++
4 8 4 7 0 0 0 13 7% 6% 5% 13% 0% 0% 0% 18%
- - ++
No. of Respondents 503 369 134 77 60 136 88 53 10 4 1 74 100% 100% 100% 100% 100% 100% 100% 100% 100% 100% 100% 100%
Prepared by McGregor Tan Research (Ref: 6798)
- 63 -
3.9 Preferred Extent of Ban œ If Ban in Place
3.9.1 Respondents were asked: If a ban were placed on plastic carry bags,
would you prefer to see the ban applied to:
……All types of plastic bags
……Supermarket type lightweight plastic carry bags only
……Heavy glossy typically branded plastic bags only
3.9.2 A total ban of all types of plastic carry bags was the preferred option,
nominated by 60% of respondents, with main grocery shoppers the most
likely to nominate this response (63%).
3.9.3 One quarter (26%) of all respondents supported banning supermarket type lightweight plastic carry bags only.
3.9.4 Fewer respondents (8%) were in favour of only banning the heavier glossy plastic bags.
- 64 -
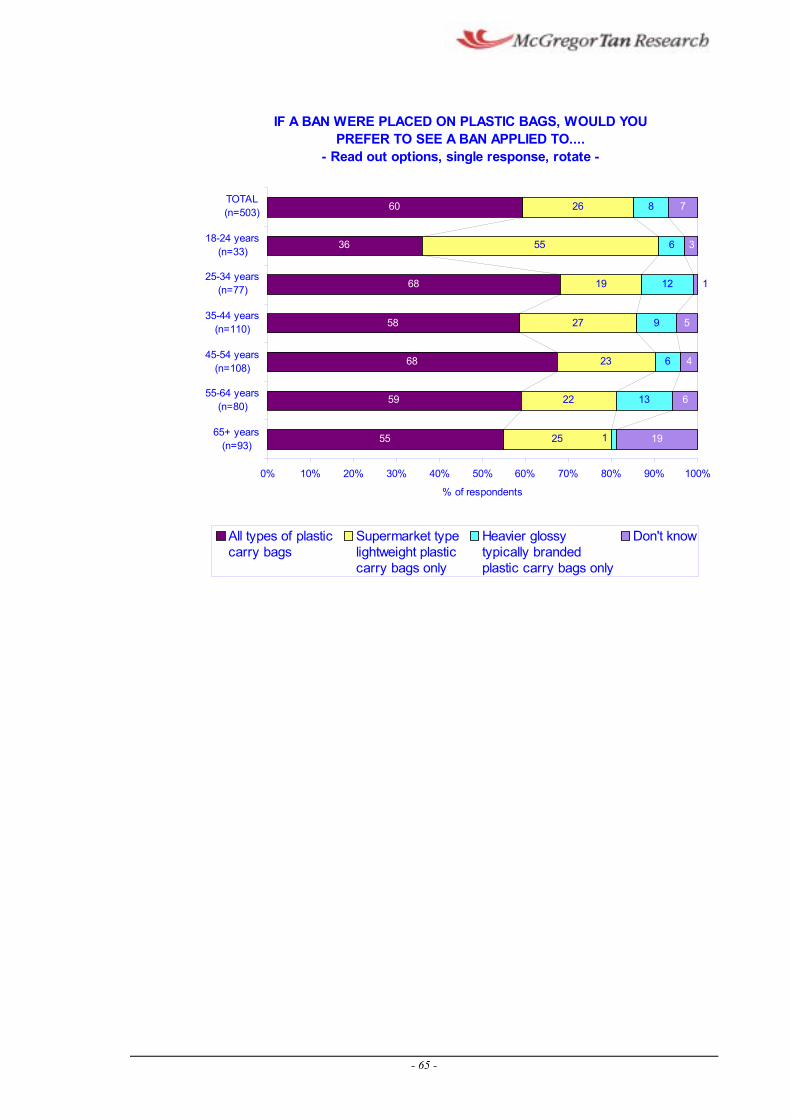
IF A BAN WERE PLACED ON PLASTIC BAGS, WOULD YOU PREFER TO SEE A BAN APPLIED TO....
- Read out options, single response, rotate -
TOTAL(n=503)
18-24 years (n=33)
25-34 years
55
59
68
58
68
36
60
25
22
23
27
19
55
26
13
6
9
12
6
8
19
6
4
5
3
7
1
1(n=77)
35-44 years (n=110)
45-54 years (n=108)
55-64 years (n=80)
65+ years(n=93)
0% 10% 20% 30% 40% 50% 60% 70% 80% 90% 100%
% of respondents
All types of plastic Supermarket type Heavier glossy Don't know carry bags lightweight plastic typically branded
carry bags only plastic carry bags only
- 65 -
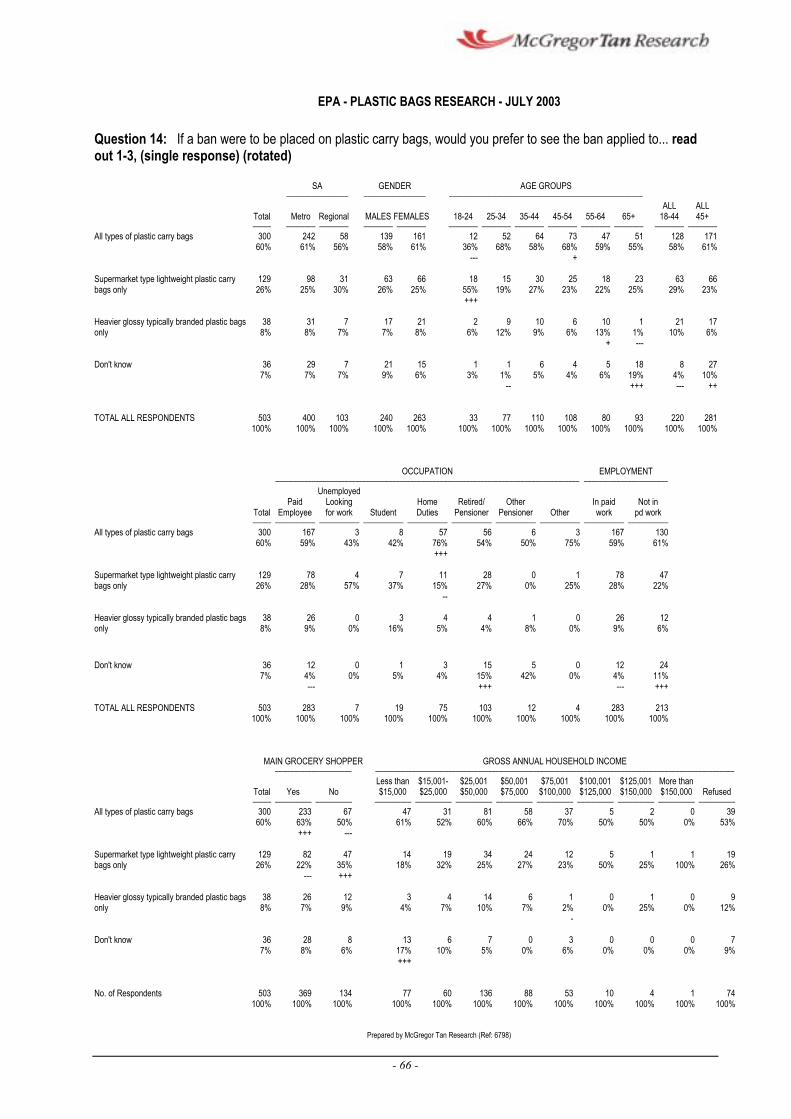
---
---
-- ---
--
EPA - PLASTIC BAGS RESEARCH - JULY 2003
Question 14: If a ban were to be placed on plastic carry bags, would you prefer to see the ban applied to... read out 1-3, (single response) (rotated)
SA GENDER AGE GROUPS œœœœœœœœœœœœœœœœœ œœœœœœœœœœœœœœœœœ œœœœœœœœœœœœœœœœœœœœœœœœœœœœœœœœœœœœœœœœœœœœœœœœœœœœœ
ALL ALL Total Metro Regional MALES FEMALES 18-24 25-34 35-44 45-54 55-64 65+ 18-44 45+ œœœœœ œœœœœœœœ œœœœœœœœ œœœœœœœœ œœœœœœœœ œœœœœœœœ œœœœœœœœ œœœœœœœœ œœœœœœœœ œœœœœœœœ œœœœœœœœ œœœœœœœœ œœœœœœœœ
All types of plastic carry bags 300 60%
242 61%
58 56%
139 58%
161 61%
12 36%
52 68%
64 58%
73 68%
47 59%
51 55%
128 58%
171 61%
+
Supermarket type lightweight plastic carry bags only
129 26%
98 25%
31 30%
63 26%
66 25%
18 55%
15 19%
30 27%
25 23%
18 22%
23 25%
63 29%
66 23%
+++
Heavier glossy typically branded plastic bags only
38 8%
31 8%
7 7%
17 7%
21 8%
2 6%
9 12%
10 9%
6 6%
10 13%
1 1%
21 10%
17 6%
+
Don't know 36 29 7 21 15 1 1 6 4 5 18 8 27 7% 7% 7% 9% 6% 3% 1% 5% 4% 6% 19% 4% 10%
+++ ++
TOTAL ALL RESPONDENTS 503 400 103 240 263 33 77 110 108 80 93 220 281 100% 100% 100% 100% 100% 100% 100% 100% 100% 100% 100% 100% 100%
OCCUPATION EMPLOYMENT œœœœœœœœœœœœœœœœœœœœœœœœœœœœœœœœœœœœœœœœœœœœœœœœœœœœœœœœœœœœœœœœœœœœœœœœœœœœœœœœœœœ œœœœœœœœœœœœœœœœœœœœœœœ
Unemployed Paid Looking Home Retired/ Other In paid Not in
Total Employee for work Student Duties Pensioner Pensioner Other work pd work œœœœœ œœœœœœœœœœœ œœœœœœœœœœœ œœœœœœœœœœœ œœœœœœœœœœœ œœœœœœœœœœœ œœœœœœœœœœœ œœœœœœœœœœœ œœœœœœœœœœœ œœœœœœœœœœœ
All types of plastic carry bags 300 167 3 8 57 56 6 3 167 130 60% 59% 43% 42% 76% 54% 50% 75% 59% 61%
+++
Supermarket type lightweight plastic carry 129 78 4 7 11 28 0 1 78 47 bags only 26% 28% 57% 37% 15% 27% 0% 25% 28% 22%
Heavier glossy typically branded plastic bags 38 26 0 3 4 4 1 0 26 12 only 8% 9% 0% 16% 5% 4% 8% 0% 9% 6%
Don't know 36 12 7% 4%
---
0 1 3 15 5 0 12 24 0% 5% 4% 15% 42% 0% 4% 11%
+++ --- +++
TOTAL ALL RESPONDENTS 503 283 7 19 75 103 12 4 283 213 100% 100% 100% 100% 100% 100% 100% 100% 100% 100%
MAIN GROCERY SHOPPER GROSS ANNUAL HOUSEHOLD INCOME œœœœœœœœœœœœœœœœœœœœœ œœœœœœœœœœœœœœœœœœœœœœœœœœœœœœœœœœœœœœœœœœœœœœœœœœœœœœœœœœœœœœœœœœœœœœœœœœœœœœœœœœœœœœœœœœœœœœœœœœ
Less than $15,001- $25,001 $50,001 $75,001 $100,001 $125,001 More than Total Yes No $15,000 $25,000 $50,000 $75,000 $100,000 $125,000 $150,000 $150,000 Refused œœœœœ œœœœœœœœœœ œœœœœœœœœœ œœœœœœœœœœ œœœœœœœœœœ œœœœœœœœœœ œœœœœœœœœœ œœœœœœœœœœ œœœœœœœœœœ œœœœœœœœœœ œœœœœœœœœœ œœœœœœœœœœ
All types of plastic carry bags 300 233 67 47 31 81 58 37 5 2 0 39 60% 63% 50% 61% 52% 60% 66% 70% 50% 50% 0% 53%
+++ ---
Supermarket type lightweight plastic carry 129 82 47 14 19 34 24 12 5 1 1 19 bags only 26% 22% 35% 18% 32% 25% 27% 23% 50% 25% 100% 26%
--- +++
Heavier glossy typically branded plastic bags 38 26 12 3 4 14 6 1 0 1 0 9 only 8% 7% 9% 4% 7% 10% 7% 2% 0% 25% 0% 12%
-
Don't know 36 28 8 13 6 7 0 3 0 0 0 7 7% 8% 6% 17% 10% 5% 0% 6% 0% 0% 0% 9%
+++
No. of Respondents 503 369 134 77 60 136 88 53 10 4 1 74 100% 100% 100% 100% 100% 100% 100% 100% 100% 100% 100% 100%
Prepared by McGregor Tan Research (Ref: 6798)
- 66 -
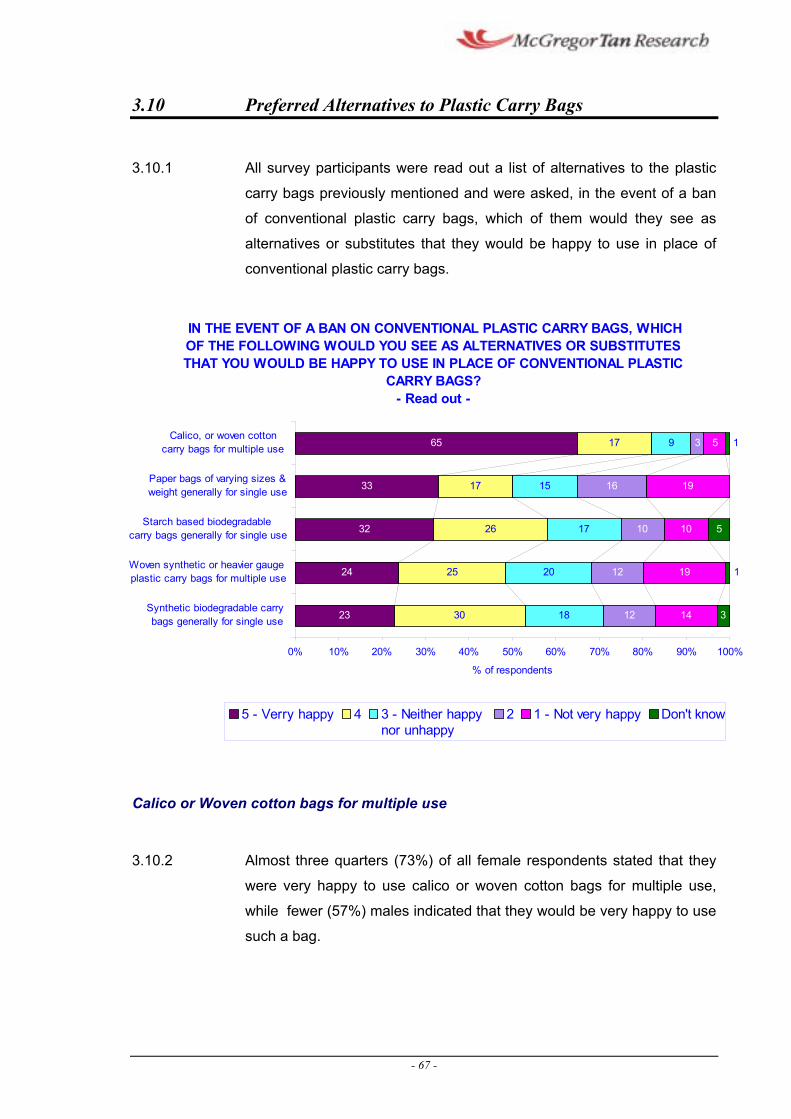
3.10 Preferred Alternatives to Plastic Carry Bags
3.10.1 All survey participants were read out a list of alternatives to the plastic
carry bags previously mentioned and were asked, in the event of a ban
of conventional plastic carry bags, which of them would they see as
alternatives or substitutes that they would be happy to use in place of
conventional plastic carry bags.
IN THE EVENT OF A BAN ON CONVENTIONAL PLASTIC CARRY BAGS, WHICH OF THE FOLLOWING WOULD YOU SEE AS ALTERNATIVES OR SUBSTITUTES THAT YOU WOULD BE HAPPY TO USE IN PLACE OF CONVENTIONAL PLASTIC
CARRY BAGS? - Read out -
Calico, or woven cotton
23
24
32
33
65
30
25
26
17
17
18
20
17
15
9
12
12
10
16
3
14
19
10
19
5
3
5
1carry bags for multiple use
Paper bags of varying sizes &weight generally for single use
Starch based biodegradable carry bags generally for single use
Woven synthetic or heavier gauge 1plastic carry bags for multiple use
Synthetic biodegradable carrybags generally for single use
0% 10% 20% 30% 40% 50% 60% 70% 80% 90% 100%
% of respondents
5 - Verry happy 4 3 - Neither happy 2 1 - Not very happy Don't know nor unhappy
Calico or Woven cotton bags for multiple use
3.10.2 Almost three quarters (73%) of all female respondents stated that they
were very happy to use calico or woven cotton bags for multiple use,
while fewer (57%) males indicated that they would be very happy to use
such a bag.
- 67 -
Young respondents, aged 18 to 24 years were the least likely to be very
happy to use this type of bag (45%).
Paper bags of varying sizes and weight generally for single use
3.10.3 Respondents from regional areas of South Australia were the most likely
to indicate that they would be very happy to use paper bags (63%,
compared to 46% of metropolitan respondents).
Starch based biodegradable carry bags generally for single use
3.10.4 Male respondents were most in favour of starch based biodegradable
bags (65% were happy to use, compared to 51% of females).
Woven synthetic or heavier gauge plastic carry bags for multiple use
3.10.5 These types of bags were most popular amongst younger respondents,
aged 18 to 44 years (54% happy to use, compared to 44% of those aged
45 years or above).
Synthetic biodegradable carry bags generally for single use
3.10.6 Male respondents (60% happy to use) were significantly more likely than
females (46%) to prefer this type of bag.
- 68 -
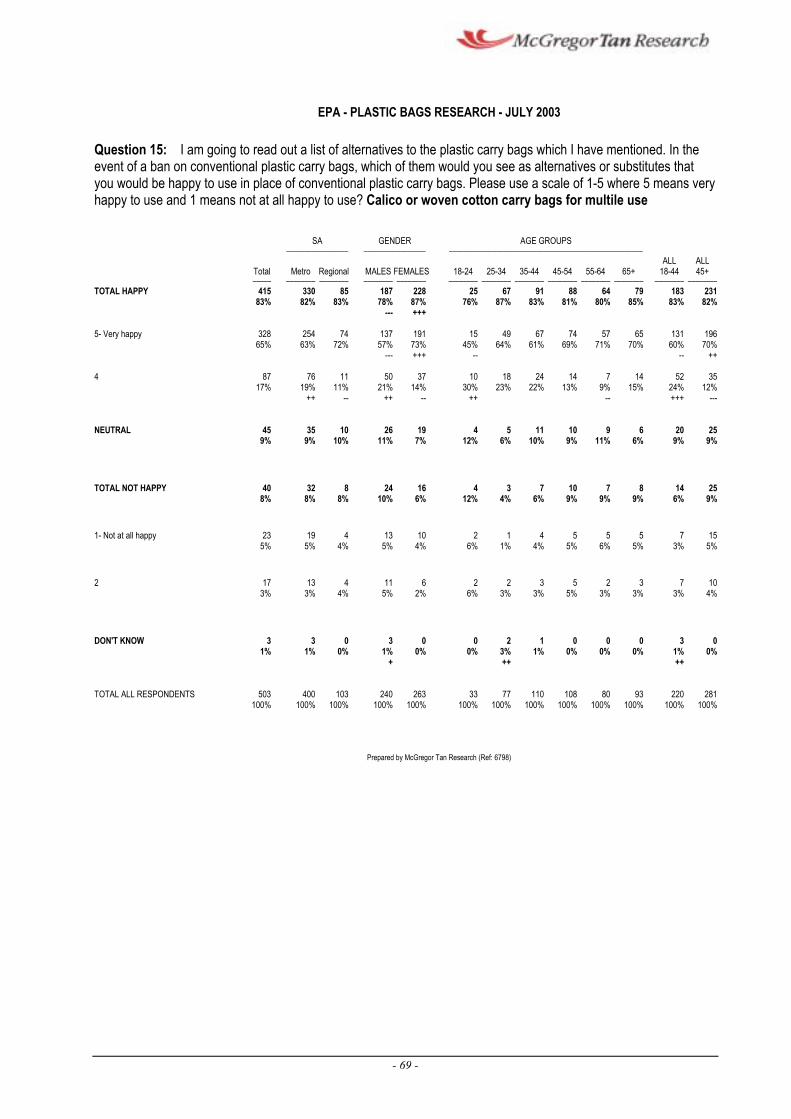
---
--- -- --
-- -- -- ---
EPA - PLASTIC BAGS RESEARCH - JULY 2003
Question 15: I am going to read out a list of alternatives to the plastic carry bags which I have mentioned. In the event of a ban on conventional plastic carry bags, which of them would you see as alternatives or substitutes that you would be happy to use in place of conventional plastic carry bags. Please use a scale of 1-5 where 5 means very happy to use and 1 means not at all happy to use? Calico or woven cotton carry bags for multile use
SA GENDER AGE GROUPS œœœœœœœœœœœœœœœœœ œœœœœœœœœœœœœœœœœ œœœœœœœœœœœœœœœœœœœœœœœœœœœœœœœœœœœœœœœœœœœœœœœœœœœœœ
ALL ALL Total Metro Regional MALES FEMALES 18-24 25-34 35-44 45-54 55-64 65+ 18-44 45+ œœœœœ œœœœœœœœ œœœœœœœœ œœœœœœœœ œœœœœœœœ œœœœœœœœ œœœœœœœœ œœœœœœœœ œœœœœœœœ œœœœœœœœ œœœœœœœœ œœœœœœœœ œœœœœœœœ
TOTAL HAPPY 415 330 85 187 228 25 67 91 88 64 79 183 231 83% 82% 83% 78% 87% 76% 87% 83% 81% 80% 85% 83% 82%
+++
5- Very happy 328 65%
254 63%
74 72%
137 57%
191 73%
15 45%
49 64%
67 61%
74 69%
57 71%
65 70%
131 60%
196 70%
+++ ++
4 87 76 11 50 37 10 18 24 14 7 14 52 35 17% 19% 11% 21% 14% 30% 23% 22% 13% 9% 15% 24% 12%
++ ++ ++ +++
NEUTRAL 45 35 10 26 19 4 5 11 10 9 6 20 25 9% 9% 10% 11% 7% 12% 6% 10% 9% 11% 6% 9% 9%
TOTAL NOT HAPPY 40 32 8 24 16 4 3 7 10 7 8 14 25 8% 8% 8% 10% 6% 12% 4% 6% 9% 9% 9% 6% 9%
1- Not at all happy 23 19 4 13 10 2 1 4 5 5 5 7 15 5% 5% 4% 5% 4% 6% 1% 4% 5% 6% 5% 3% 5%
2 17 13 4 11 6 2 2 3 5 2 3 7 10 3% 3% 4% 5% 2% 6% 3% 3% 5% 3% 3% 3% 4%
DON'T KNOW 3 3 0 3 0 1% 1% 0% 1% 0%
+
0 2 1 0 0 0 3 0 0% 3% 1% 0% 0% 0% 1% 0%
++ ++
TOTAL ALL RESPONDENTS 503 400 103 240 263 33 77 110 108 80 93 220 281 100% 100% 100% 100% 100% 100% 100% 100% 100% 100% 100% 100% 100%
Prepared by McGregor Tan Research (Ref: 6798)
- 69 -
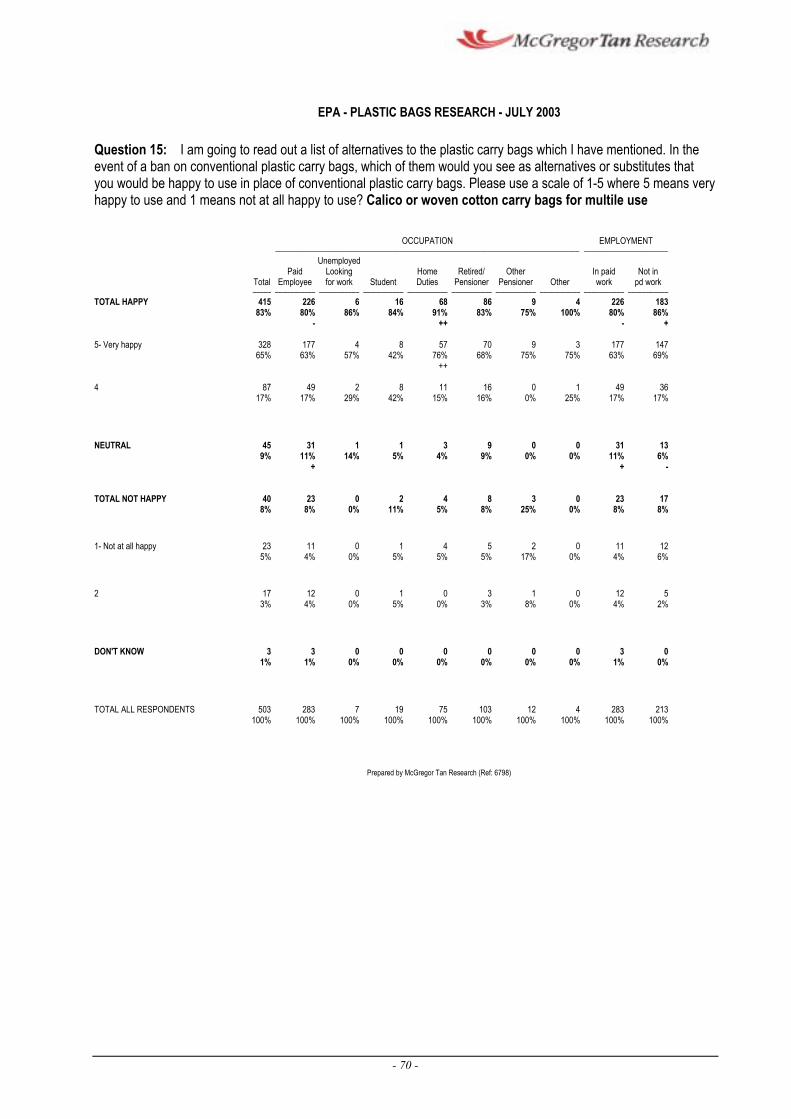
2
EPA - PLASTIC BAGS RESEARCH - JULY 2003
Question 15: I am going to read out a list of alternatives to the plastic carry bags which I have mentioned. In the event of a ban on conventional plastic carry bags, which of them would you see as alternatives or substitutes that you would be happy to use in place of conventional plastic carry bags. Please use a scale of 1-5 where 5 means very happy to use and 1 means not at all happy to use? Calico or woven cotton carry bags for multile use
OCCUPATION EMPLOYMENT œœœœœœœœœœœœœœœœœœœœœœœœœœœœœœœœœœœœœœœœœœœœœœœœœœœœœœœœœœœœœœœœœœœœœœœœœœœœœœœœœœœ œœœœœœœœœœœœœœœœœœœœœœœ
Unemployed Paid Looking Home Retired/ Other In paid Not in
Total Employee for work Student Duties Pensioner Pensioner Other work pd work œœœœœ œœœœœœœœœœœ œœœœœœœœœœœ œœœœœœœœœœœ œœœœœœœœœœœ œœœœœœœœœœœ œœœœœœœœœœœ œœœœœœœœœœœ œœœœœœœœœœœ œœœœœœœœœœœ
TOTAL HAPPY 415 226 6 16 68 86 9 4 226 183 83% 80% 86% 84% 91% 83% 75% 100% 80% 86%
- ++ - +
5- Very happy 328 65%
177 63%
4 57%
8 42%
57 76%
70 68%
9 75%
3 75%
177 63%
147 69%
++
4 87 49 2 8 11 16 0 1 49 36 17% 17% 29% 42% 15% 16% 0% 25% 17% 17%
NEUTRAL 45 31 9% 11%
+
1 1 3 9 0 0 31 13 14% 5% 4% 9% 0% 0% 11% 6%
+ -
TOTAL NOT HAPPY 40 23 0 2 4 8 3 0 23 17 8% 8% 0% 11% 5% 8% 25% 0% 8% 8%
1- Not at all happy 23 11 0 1 4 5 2 0 11 12 5% 4% 0% 5% 5% 5% 17% 0% 4% 6%
17 12 0 1 0 3 1 0 12 5 3% 4% 0% 5% 0% 3% 8% 0% 4% 2%
DON'T KNOW 3 3 0 0 0 0 0 0 3 0 1% 1% 0% 0% 0% 0% 0% 0% 1% 0%
TOTAL ALL RESPONDENTS 503 283 7 19 75 103 12 4 283 213 100% 100% 100% 100% 100% 100% 100% 100% 100% 100%
Prepared by McGregor Tan Research (Ref: 6798)
- 70 -
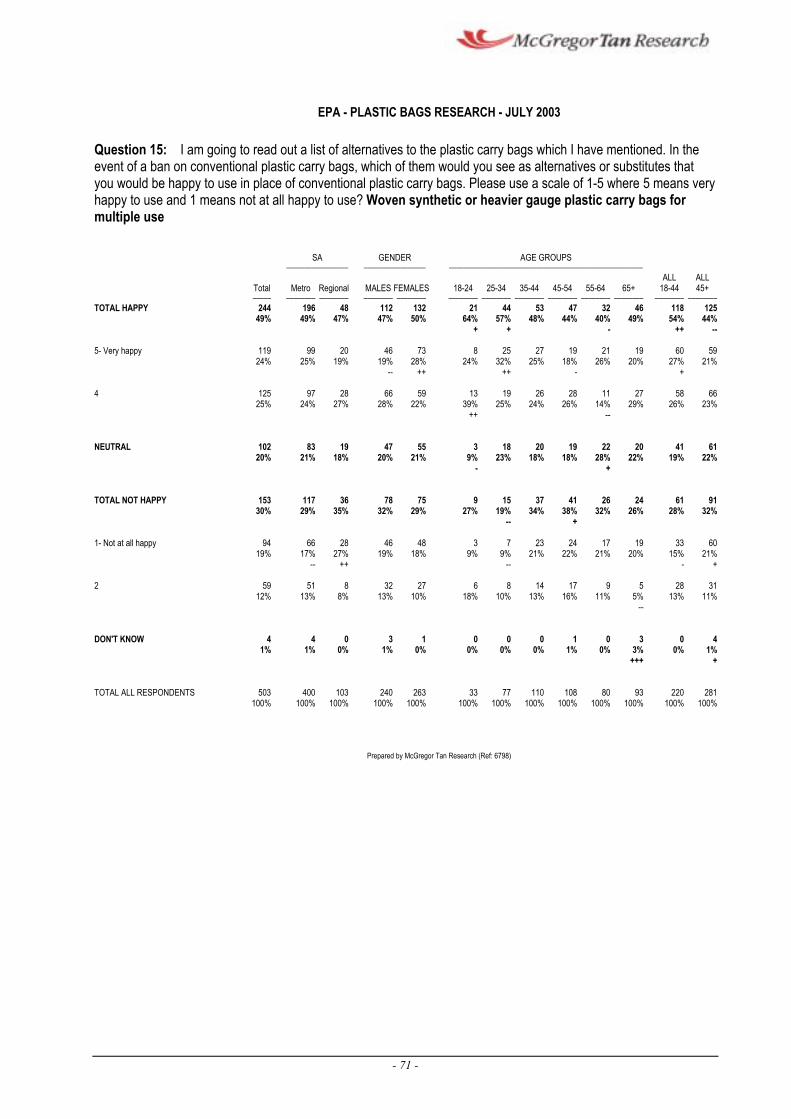
--
--
--
--
EPA - PLASTIC BAGS RESEARCH - JULY 2003
Question 15: I am going to read out a list of alternatives to the plastic carry bags which I have mentioned. In the event of a ban on conventional plastic carry bags, which of them would you see as alternatives or substitutes that you would be happy to use in place of conventional plastic carry bags. Please use a scale of 1-5 where 5 means very happy to use and 1 means not at all happy to use? Woven synthetic or heavier gauge plastic carry bags for multiple use
SA GENDER AGE GROUPS œœœœœœœœœœœœœœœœœ œœœœœœœœœœœœœœœœœ œœœœœœœœœœœœœœœœœœœœœœœœœœœœœœœœœœœœœœœœœœœœœœœœœœœœœ
ALL ALL Total Metro Regional MALES FEMALES 18-24 25-34 35-44 45-54 55-64 65+ 18-44 45+ œœœœœ œœœœœœœœ œœœœœœœœ œœœœœœœœ œœœœœœœœ œœœœœœœœ œœœœœœœœ œœœœœœœœ œœœœœœœœ œœœœœœœœ œœœœœœœœ œœœœœœœœ œœœœœœœœ
TOTAL HAPPY 244 196 48 112 132 21 44 53 47 32 46 118 125 49% 49% 47% 47% 50% 64% 57% 48% 44% 40% 49% 54% 44%
+ + - ++
5- Very happy 119 24%
99 25%
20 19%
46 19%
73 28%
8 24%
25 32%
27 25%
19 18%
21 26%
19 20%
60 27%
59 21%
++ ++ - +
4 125 97 28 66 59 13 19 26 28 11 27 58 66 25% 24% 27% 28% 22% 39% 25% 24% 26% 14% 29% 26% 23%
++
NEUTRAL 102 83 19 47 55 3 18 20 19 22 20 41 61 20% 21% 18% 20% 21% 9% 23% 18% 18% 28% 22% 19% 22%
- +
TOTAL NOT HAPPY 153 117 36 78 75 9 15 37 41 26 24 61 91 30% 29% 35% 32% 29% 27% 19% 34% 38% 32% 26% 28% 32%
-- +
1- Not at all happy 94 66 28 46 48 19% 17% 27% 19% 18%
-- ++
3 7 23 24 17 19 33 60 9% 9% 21% 22% 21% 20% 15% 21%
-- - +
2 59 51 8 32 27 6 8 14 17 9 5 28 31 12% 13% 8% 13% 10% 18% 10% 13% 16% 11% 5% 13% 11%
DON'T KNOW 4 4 0 3 1 0 0 0 1 0 3 0 41% 1% 0% 1% 0% 0% 0% 0% 1% 0% 3% 0% 1%
+++ +
TOTAL ALL RESPONDENTS 503 400 103 240 263 33 77 110 108 80 93 220 281 100% 100% 100% 100% 100% 100% 100% 100% 100% 100% 100% 100% 100%
Prepared by McGregor Tan Research (Ref: 6798)
- 71 -
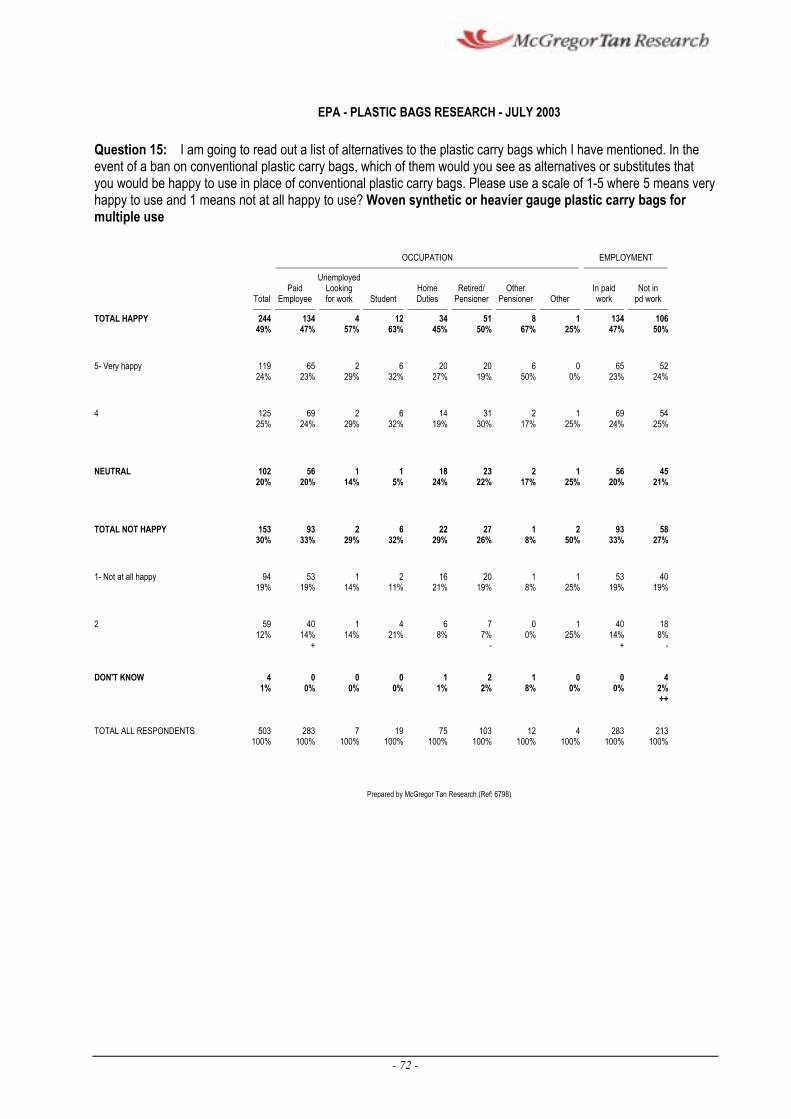
EPA - PLASTIC BAGS RESEARCH - JULY 2003
Question 15: I am going to read out a list of alternatives to the plastic carry bags which I have mentioned. In the event of a ban on conventional plastic carry bags, which of them would you see as alternatives or substitutes that you would be happy to use in place of conventional plastic carry bags. Please use a scale of 1-5 where 5 means very happy to use and 1 means not at all happy to use? Woven synthetic or heavier gauge plastic carry bags for multiple use
OCCUPATION EMPLOYMENT œœœœœœœœœœœœœœœœœœœœœœœœœœœœœœœœœœœœœœœœœœœœœœœœœœœœœœœœœœœœœœœœœœœœœœœœœœœœœœœœœœœ œœœœœœœœœœœœœœœœœœœœœœœ
Unemployed Paid Looking Home Retired/ Other In paid Not in
Total Employee for work Student Duties Pensioner Pensioner Other work pd work œœœœœ œœœœœœœœœœœ œœœœœœœœœœœ œœœœœœœœœœœ œœœœœœœœœœœ œœœœœœœœœœœ œœœœœœœœœœœ œœœœœœœœœœœ œœœœœœœœœœœ œœœœœœœœœœœ
TOTAL HAPPY 244 134 4 12 34 51 8 1 134 106 49% 47% 57% 63% 45% 50% 67% 25% 47% 50%
5- Very happy 119 65 2 6 20 20 6 0 65 52 24% 23% 29% 32% 27% 19% 50% 0% 23% 24%
4 125 69 2 6 14 31 2 1 69 54 25% 24% 29% 32% 19% 30% 17% 25% 24% 25%
NEUTRAL 102 56 1 1 18 23 2 1 56 45 20% 20% 14% 5% 24% 22% 17% 25% 20% 21%
TOTAL NOT HAPPY 153 93 2 6 22 27 1 2 93 58 30% 33% 29% 32% 29% 26% 8% 50% 33% 27%
1- Not at all happy 94 53 1 2 16 20 1 1 53 40 19% 19% 14% 11% 21% 19% 8% 25% 19% 19%
2 59 40 12% 14%
+
1 4 6 7 0 1 40 18 14% 21% 8% 7% 0% 25% 14% 8%
- + -
DON'T KNOW 4 0 0 0 1 2 1 0 0 41% 0% 0% 0% 1% 2% 8% 0% 0% 2%
++
TOTAL ALL RESPONDENTS 503 283 7 19 75 103 12 4 283 213 100% 100% 100% 100% 100% 100% 100% 100% 100% 100%
Prepared by McGregor Tan Research (Ref: 6798)
- 72 -
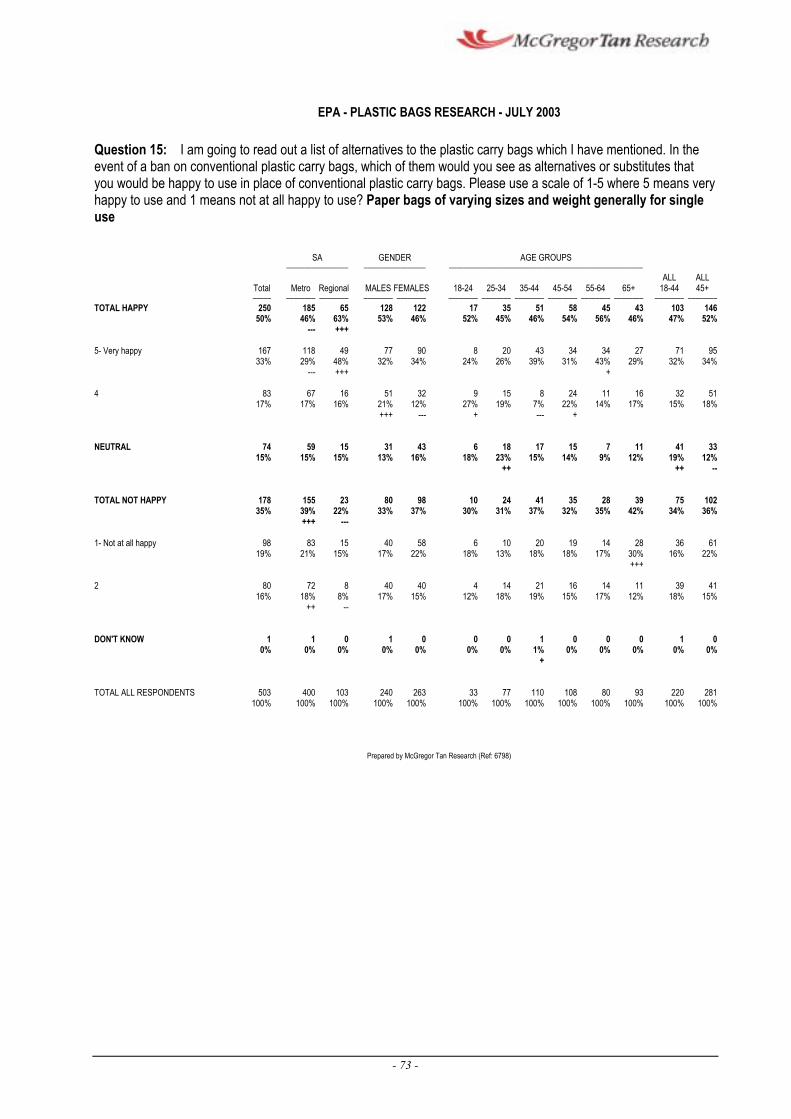
---
---
--- ---
EPA - PLASTIC BAGS RESEARCH - JULY 2003
Question 15: I am going to read out a list of alternatives to the plastic carry bags which I have mentioned. In the event of a ban on conventional plastic carry bags, which of them would you see as alternatives or substitutes that you would be happy to use in place of conventional plastic carry bags. Please use a scale of 1-5 where 5 means very happy to use and 1 means not at all happy to use? Paper bags of varying sizes and weight generally for single use
SA GENDER AGE GROUPS œœœœœœœœœœœœœœœœœ œœœœœœœœœœœœœœœœœ œœœœœœœœœœœœœœœœœœœœœœœœœœœœœœœœœœœœœœœœœœœœœœœœœœœœœ
ALL ALL Total Metro Regional MALES FEMALES 18-24 25-34 35-44 45-54 55-64 65+ 18-44 45+ œœœœœ œœœœœœœœ œœœœœœœœ œœœœœœœœ œœœœœœœœ œœœœœœœœ œœœœœœœœ œœœœœœœœ œœœœœœœœ œœœœœœœœ œœœœœœœœ œœœœœœœœ œœœœœœœœ
TOTAL HAPPY 250 185 65 128 122 17 35 51 58 45 43 103 146 50% 46% 63% 53% 46% 52% 45% 46% 54% 56% 46% 47% 52%
+++
5- Very happy 167 33%
118 29%
49 48%
77 32%
90 34%
8 24%
20 26%
43 39%
34 31%
34 43%
27 29%
71 32%
95 34%
+++ +
4 83 67 16 51 32 9 15 8 24 11 16 32 51 17% 17% 16% 21% 12% 27% 19% 7% 22% 14% 17% 15% 18%
+++ + +
NEUTRAL 74 59 15 31 43 6 18 17 15 7 11 41 33 15% 15% 15% 13% 16% 18% 23% 15% 14% 9% 12% 19% 12%
++ ++ --
TOTAL NOT HAPPY 178 155 23 80 98 10 24 41 35 28 39 75 102 35% 39% 22% 33% 37% 30% 31% 37% 32% 35% 42% 34% 36%
+++ ---
1- Not at all happy 98 83 15 40 58 6 10 20 19 14 28 36 61 19% 21% 15% 17% 22% 18% 13% 18% 18% 17% 30% 16% 22%
+++
2 80 72 8 40 40 4 14 21 16 14 11 39 41 16% 18% 8% 17% 15% 12% 18% 19% 15% 17% 12% 18% 15%
++ --
DON'T KNOW 1 1 0 1 0 0 0 1 0 0 0 1 0 0% 0% 0% 0% 0% 0% 0% 1% 0% 0% 0% 0% 0%
+
TOTAL ALL RESPONDENTS 503 400 103 240 263 33 77 110 108 80 93 220 281 100% 100% 100% 100% 100% 100% 100% 100% 100% 100% 100% 100% 100%
Prepared by McGregor Tan Research (Ref: 6798)
- 73 -

EPA - PLASTIC BAGS RESEARCH - JULY 2003
Question 15: I am going to read out a list of alternatives to the plastic carry bags which I have mentioned. In the event of a ban on conventional plastic carry bags, which of them would you see as alternatives or substitutes that you would be happy to use in place of conventional plastic carry bags. Please use a scale of 1-5 where 5 means very happy to use and 1 means not at all happy to use? Paper bags of varying sizes and weight generally for single use
OCCUPATION EMPLOYMENT œœœœœœœœœœœœœœœœœœœœœœœœœœœœœœœœœœœœœœœœœœœœœœœœœœœœœœœœœœœœœœœœœœœœœœœœœœœœœœœœœœœ œœœœœœœœœœœœœœœœœœœœœœœ
Unemployed Paid Looking Home Retired/ Other In paid Not in
Total Employee for work Student Duties Pensioner Pensioner Other work pd work œœœœœ œœœœœœœœœœœ œœœœœœœœœœœ œœœœœœœœœœœ œœœœœœœœœœœ œœœœœœœœœœœ œœœœœœœœœœœ œœœœœœœœœœœ œœœœœœœœœœœ œœœœœœœœœœœ
TOTAL HAPPY 250 143 4 9 35 50 6 3 143 103 50% 51% 57% 47% 47% 49% 50% 75% 51% 48%
5- Very happy 167 92 2 6 26 32 6 3 92 73 33% 33% 29% 32% 35% 31% 50% 75% 33% 34%
4 83 51 2 3 9 18 0 0 51 30 17% 18% 29% 16% 12% 17% 0% 0% 18% 14%
NEUTRAL 74 45 1 3 12 12 1 0 45 28 15% 16% 14% 16% 16% 12% 8% 0% 16% 13%
TOTAL NOT HAPPY 178 94 2 7 28 41 5 1 94 82 35% 33% 29% 37% 37% 40% 42% 25% 33% 38%
1- Not at all happy 98 48 0 3 19 23 5 0 48 5019% 17% 0% 16% 25% 22% 42% 0% 17% 23%
+
2 80 46 2 4 9 18 0 1 46 32 16% 16% 29% 21% 12% 17% 0% 25% 16% 15%
DON'T KNOW 1 1 0 0 0 0 0 0 1 0 0% 0% 0% 0% 0% 0% 0% 0% 0% 0%
TOTAL ALL RESPONDENTS 503 283 7 19 75 103 12 4 283 213 100% 100% 100% 100% 100% 100% 100% 100% 100% 100%
Prepared by McGregor Tan Research (Ref: 6798)
- 74 -
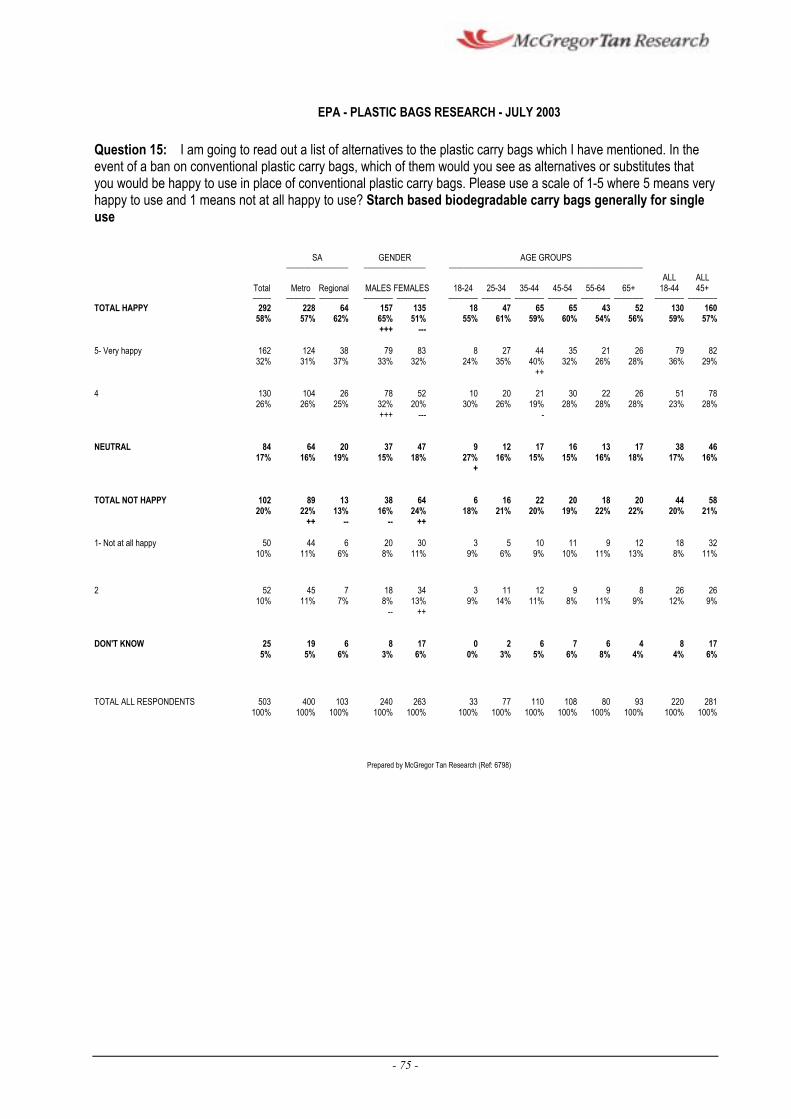
---
---
EPA - PLASTIC BAGS RESEARCH - JULY 2003
Question 15: I am going to read out a list of alternatives to the plastic carry bags which I have mentioned. In the event of a ban on conventional plastic carry bags, which of them would you see as alternatives or substitutes that you would be happy to use in place of conventional plastic carry bags. Please use a scale of 1-5 where 5 means very happy to use and 1 means not at all happy to use? Starch based biodegradable carry bags generally for single use
SA GENDER AGE GROUPS œœœœœœœœœœœœœœœœœ œœœœœœœœœœœœœœœœœ œœœœœœœœœœœœœœœœœœœœœœœœœœœœœœœœœœœœœœœœœœœœœœœœœœœœœ
ALL ALL Total Metro Regional MALES FEMALES 18-24 25-34 35-44 45-54 55-64 65+ 18-44 45+ œœœœœ œœœœœœœœ œœœœœœœœ œœœœœœœœ œœœœœœœœ œœœœœœœœ œœœœœœœœ œœœœœœœœ œœœœœœœœ œœœœœœœœ œœœœœœœœ œœœœœœœœ œœœœœœœœ
TOTAL HAPPY 292 228 64 157 135 18 47 65 65 43 52 130 160 58% 57% 62% 65% 51% 55% 61% 59% 60% 54% 56% 59% 57%
+++
5- Very happy 162 32%
124 31%
38 37%
79 33%
83 32%
8 24%
27 35%
44 40%
35 32%
21 26%
26 28%
79 36%
82 29%
++
4 130 104 26 78 52 10 20 21 30 22 26 51 78 26% 26% 25% 32% 20% 30% 26% 19% 28% 28% 28% 23% 28%
+++ -
NEUTRAL 84 64 20 37 47 9 12 17 16 13 17 38 46 17% 16% 19% 15% 18% 27% 16% 15% 15% 16% 18% 17% 16%
+
TOTAL NOT HAPPY 102 89 13 20% 22% 13%
++ --
38 64 6 16 22 20 18 20 44 58 16% 24% 18% 21% 20% 19% 22% 22% 20% 21%
-- ++
1- Not at all happy 50 44 6 20 30 3 5 10 11 9 12 18 32 10% 11% 6% 8% 11% 9% 6% 9% 10% 11% 13% 8% 11%
2 52 45 7 18 34 3 11 12 9 9 8 26 26 10% 11% 7% 8% 13% 9% 14% 11% 8% 11% 9% 12% 9%
-- ++
DON'T KNOW 25 19 6 8 17 0 2 6 7 6 4 8 17 5% 5% 6% 3% 6% 0% 3% 5% 6% 8% 4% 4% 6%
TOTAL ALL RESPONDENTS 503 400 103 240 263 33 77 110 108 80 93 220 281 100% 100% 100% 100% 100% 100% 100% 100% 100% 100% 100% 100% 100%
Prepared by McGregor Tan Research (Ref: 6798)
- 75 -
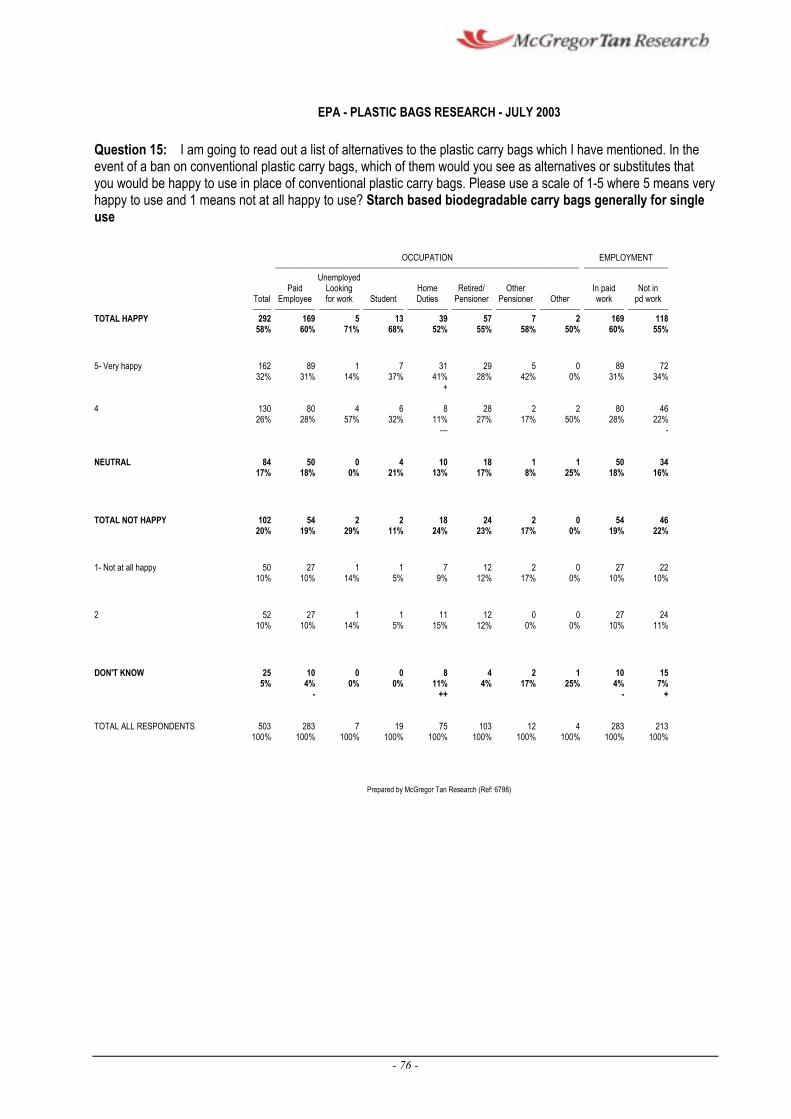
--- -
EPA - PLASTIC BAGS RESEARCH - JULY 2003
Question 15: I am going to read out a list of alternatives to the plastic carry bags which I have mentioned. In the event of a ban on conventional plastic carry bags, which of them would you see as alternatives or substitutes that you would be happy to use in place of conventional plastic carry bags. Please use a scale of 1-5 where 5 means very happy to use and 1 means not at all happy to use? Starch based biodegradable carry bags generally for single use
OCCUPATION EMPLOYMENT œœœœœœœœœœœœœœœœœœœœœœœœœœœœœœœœœœœœœœœœœœœœœœœœœœœœœœœœœœœœœœœœœœœœœœœœœœœœœœœœœœœ œœœœœœœœœœœœœœœœœœœœœœœ
Unemployed Paid Looking Home Retired/ Other In paid Not in
Total Employee for work Student Duties Pensioner Pensioner Other work pd work œœœœœ œœœœœœœœœœœ œœœœœœœœœœœ œœœœœœœœœœœ œœœœœœœœœœœ œœœœœœœœœœœ œœœœœœœœœœœ œœœœœœœœœœœ œœœœœœœœœœœ œœœœœœœœœœœ
TOTAL HAPPY 292 169 5 13 39 57 7 2 169 118 58% 60% 71% 68% 52% 55% 58% 50% 60% 55%
5- Very happy 162 89 1 7 31 29 5 0 89 72 32% 31% 14% 37% 41% 28% 42% 0% 31% 34%
+
4 130 80 4 6 8 28 2 2 80 46 26% 28% 57% 32% 11% 27% 17% 50% 28% 22%
NEUTRAL 84 50 0 4 10 18 1 1 50 34 17% 18% 0% 21% 13% 17% 8% 25% 18% 16%
TOTAL NOT HAPPY 102 54 2 2 18 24 2 0 54 46 20% 19% 29% 11% 24% 23% 17% 0% 19% 22%
1- Not at all happy 50 27 1 1 7 12 2 0 27 22 10% 10% 14% 5% 9% 12% 17% 0% 10% 10%
2 52 27 1 1 11 12 0 0 27 24 10% 10% 14% 5% 15% 12% 0% 0% 10% 11%
DON'T KNOW 25 10 5% 4%
-
0 0 8 4 2 1 10 15 0% 0% 11% 4% 17% 25% 4% 7%
++ - +
TOTAL ALL RESPONDENTS 503 283 7 19 75 103 12 4 283 213 100% 100% 100% 100% 100% 100% 100% 100% 100% 100%
Prepared by McGregor Tan Research (Ref: 6798)
- 76 -

---
EPA - PLASTIC BAGS RESEARCH - JULY 2003
Question 15: I am going to read out a list of alternatives to the plastic carry bags which I have mentioned. In the event of a ban on conventional plastic carry bags, which of them would you see as alternatives or substitutes that you would be happy to use in place of conventional plastic carry bags. Please use a scale of 1-5 where 5 means very happy to use and 1 means not at all happy to use? Synthetic biodegradable carry bags generally for single use
SA GENDER AGE GROUPS œœœœœœœœœœœœœœœœœ œœœœœœœœœœœœœœœœœ œœœœœœœœœœœœœœœœœœœœœœœœœœœœœœœœœœœœœœœœœœœœœœœœœœœœœ
ALL ALL Total Metro Regional MALES FEMALES 18-24 25-34 35-44 45-54 55-64 65+ 18-44 45+ œœœœœ œœœœœœœœ œœœœœœœœ œœœœœœœœ œœœœœœœœ œœœœœœœœ œœœœœœœœ œœœœœœœœ œœœœœœœœ œœœœœœœœ œœœœœœœœ œœœœœœœœ œœœœœœœœ
TOTAL HAPPY 265 206 59 143 122 19 47 58 54 40 46 124 140 53% 51% 57% 60% 46% 58% 61% 53% 50% 50% 49% 56% 50%
+++
5- Very happy 115 23%
86 22%
29 28%
61 25%
54 21%
6 18%
19 25%
26 24%
25 23%
18 22%
21 23%
51 23%
64 23%
4 150 120 30 82 68 13 28 32 29 22 25 73 76 30% 30% 29% 34% 26% 39% 36% 29% 27% 28% 27% 33% 27%
++ --
NEUTRAL 93 74 19 39 54 9 10 22 22 15 15 41 52 18% 19% 18% 16% 21% 27% 13% 20% 20% 19% 16% 19% 19%
TOTAL NOT HAPPY 132 108 24 52 80 5 19 26 30 24 27 50 81 26% 27% 23% 22% 30% 15% 25% 24% 28% 30% 29% 23% 29%
-- ++
1- Not at all happy 71 60 11 25 46 14% 15% 11% 10% 17%
-- ++
4 12 9 13 14 18 25 45 12% 16% 8% 12% 17% 19% 11% 16%
--
2 61 48 13 27 34 1 7 17 17 10 9 25 36 12% 12% 13% 11% 13% 3% 9% 15% 16% 13% 10% 11% 13%
-
DON'T KNOW 13 12 1 6 7 0 1 4 2 1 5 5 8 3% 3% 1% 3% 3% 0% 1% 4% 2% 1% 5% 2% 3%
+
TOTAL ALL RESPONDENTS 503 400 103 240 263 33 77 110 108 80 93 220 281 100% 100% 100% 100% 100% 100% 100% 100% 100% 100% 100% 100% 100%
Prepared by McGregor Tan Research (Ref: 6798)
- 77 -
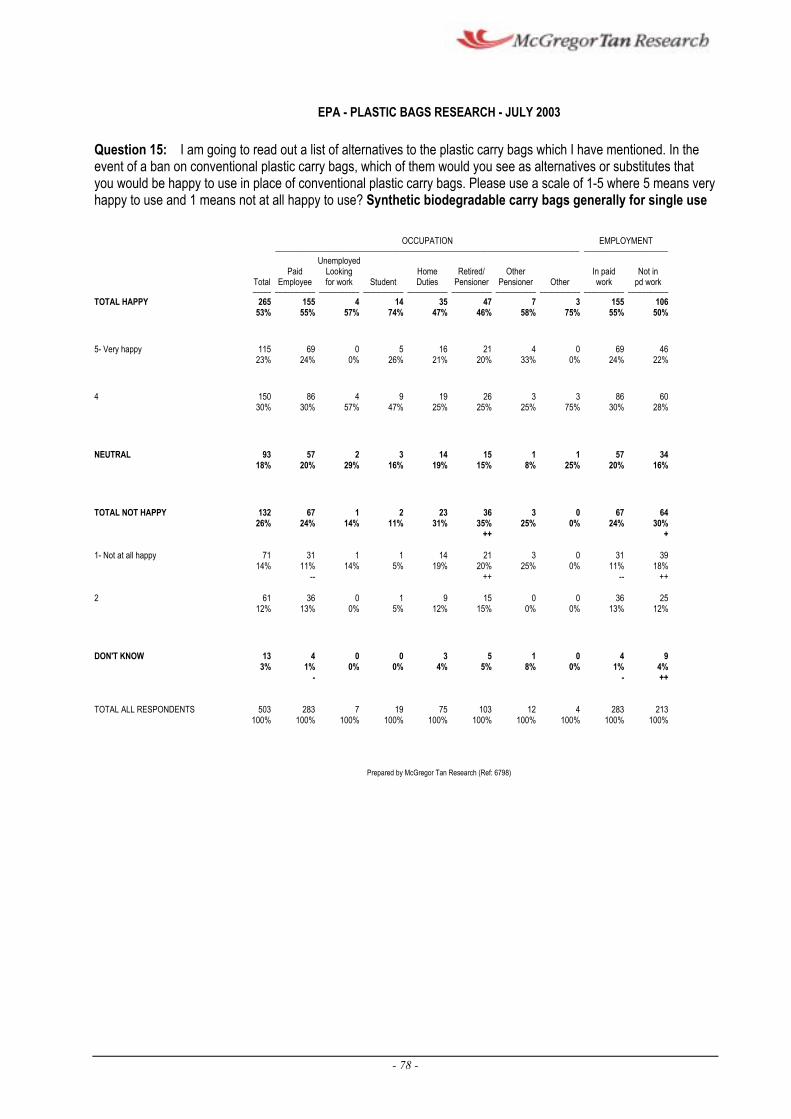
EPA - PLASTIC BAGS RESEARCH - JULY 2003
Question 15: I am going to read out a list of alternatives to the plastic carry bags which I have mentioned. In the event of a ban on conventional plastic carry bags, which of them would you see as alternatives or substitutes that you would be happy to use in place of conventional plastic carry bags. Please use a scale of 1-5 where 5 means very happy to use and 1 means not at all happy to use? Synthetic biodegradable carry bags generally for single use
OCCUPATION EMPLOYMENT œœœœœœœœœœœœœœœœœœœœœœœœœœœœœœœœœœœœœœœœœœœœœœœœœœœœœœœœœœœœœœœœœœœœœœœœœœœœœœœœœœœ œœœœœœœœœœœœœœœœœœœœœœœ
Unemployed Paid Looking Home Retired/ Other In paid Not in
Total Employee for work Student Duties Pensioner Pensioner Other work pd work œœœœœ œœœœœœœœœœœ œœœœœœœœœœœ œœœœœœœœœœœ œœœœœœœœœœœ œœœœœœœœœœœ œœœœœœœœœœœ œœœœœœœœœœœ œœœœœœœœœœœ œœœœœœœœœœœ
TOTAL HAPPY 265 155 4 14 35 47 7 3 155 106 53% 55% 57% 74% 47% 46% 58% 75% 55% 50%
5- Very happy 115 69 0 5 16 21 4 0 69 46 23% 24% 0% 26% 21% 20% 33% 0% 24% 22%
4 150 86 4 9 19 26 3 3 86 60 30% 30% 57% 47% 25% 25% 25% 75% 30% 28%
NEUTRAL 93 57 2 3 14 15 1 1 57 34 18% 20% 29% 16% 19% 15% 8% 25% 20% 16%
TOTAL NOT HAPPY 132 67 1 2 23 36 3 0 67 64 26% 24% 14% 11% 31% 35% 25% 0% 24% 30%
++ +
1- Not at all happy 71 31 1 14% 11% 14%
--
1 14 21 3 0 31 39 5% 19% 20% 25% 0% 11% 18%
++ -- ++
2 61 36 0 1 9 15 0 0 36 25 12% 13% 0% 5% 12% 15% 0% 0% 13% 12%
DON'T KNOW 13 43% 1%
-
0 0 3 5 1 0 4 9 0% 0% 4% 5% 8% 0% 1% 4%
- ++
TOTAL ALL RESPONDENTS 503 283 7 19 75 103 12 4 283 213 100% 100% 100% 100% 100% 100% 100% 100% 100% 100%
Prepared by McGregor Tan Research (Ref: 6798)
- 78 -
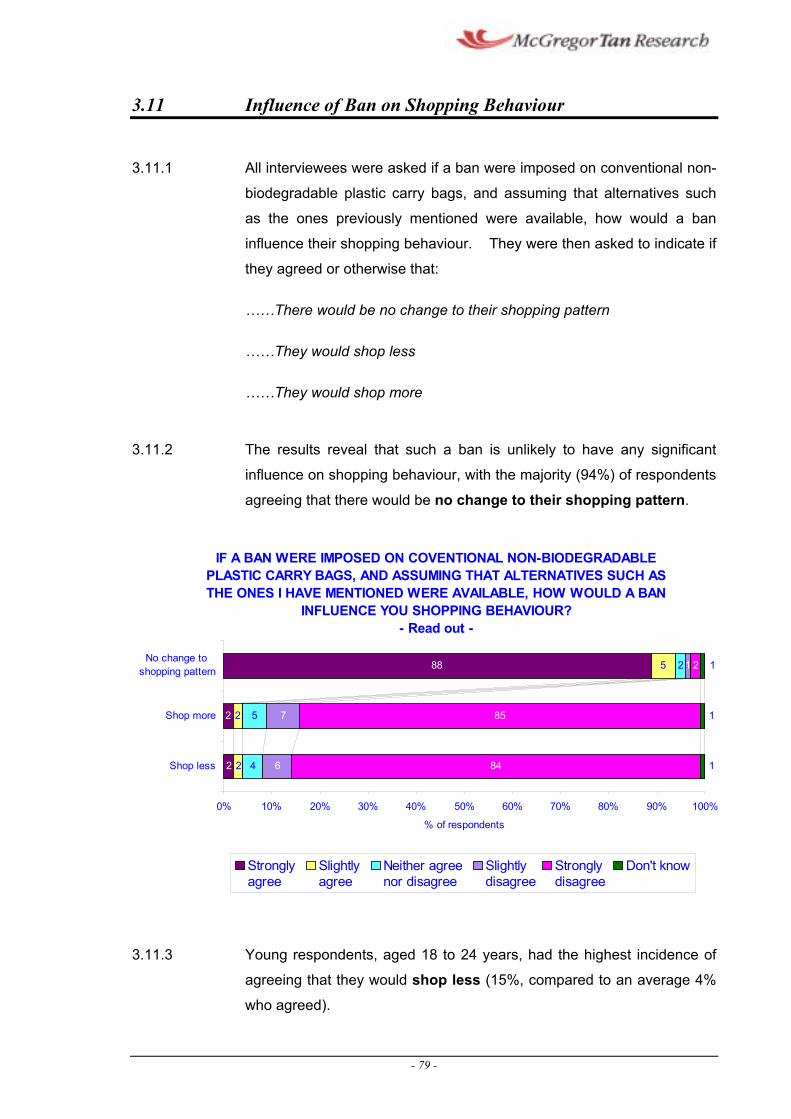
3.11 Influence of Ban on Shopping Behaviour
3.11.1 All interviewees were asked if a ban were imposed on conventional non-
biodegradable plastic carry bags, and assuming that alternatives such
as the ones previously mentioned were available, how would a ban
influence their shopping behaviour. They were then asked to indicate if
they agreed or otherwise that:
……There would be no change to their shopping pattern
……They would shop less
……They would shop more
3.11.2 The results reveal that such a ban is unlikely to have any significant
influence on shopping behaviour, with the majority (94%) of respondents
agreeing that there would be no change to their shopping pattern.
IF A BAN WERE IMPOSED ON COVENTIONAL NON-BIODEGRADABLE PLASTIC CARRY BAGS, AND ASSUMING THAT ALTERNATIVES SUCH AS THE ONES I HAVE MENTIONED WERE AVAILABLE, HOW WOULD A BAN
INFLUENCE YOU SHOPPING BEHAVIOUR? - Read out -
No change to 88 5
4
5
6
7
84
852
2 2
2
2 1 2 1shopping pattern
Shop more 1
Shop less 1
0% 10% 20% 30% 40% 50% 60% 70% 80% 90% 100%
% of respondents
Slightly i SlightlyStrongly agree agree
Ne ther agree nor disagree disagree
Strongly disagree
Don't know
3.11.3 Young respondents, aged 18 to 24 years, had the highest incidence of
agreeing that they would shop less (15%, compared to an average 4%
who agreed).
- 79 -
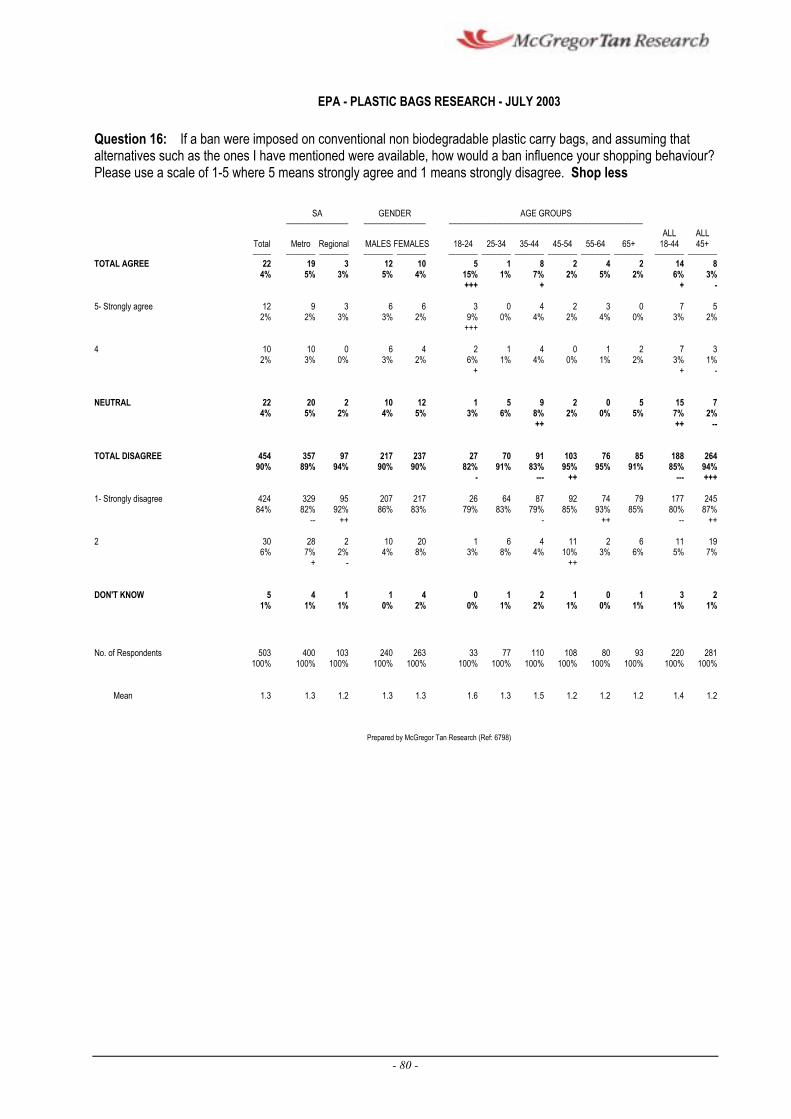
EPA - PLASTIC BAGS RESEARCH - JULY 2003
Question 16: If a ban were imposed on conventional non biodegradable plastic carry bags, and assuming that alternatives such as the ones I have mentioned were available, how would a ban influence your shopping behaviour? Please use a scale of 1-5 where 5 means strongly agree and 1 means strongly disagree. Shop less
SA GENDER AGE GROUPS œœœœœœœœœœœœœœœœœ œœœœœœœœœœœœœœœœœ œœœœœœœœœœœœœœœœœœœœœœœœœœœœœœœœœœœœœœœœœœœœœœœœœœœœœ
ALL ALL Total Metro Regional MALES FEMALES 18-24 25-34 35-44 45-54 55-64 65+ 18-44 45+ œœœœœ œœœœœœœœ œœœœœœœœ œœœœœœœœ œœœœœœœœ œœœœœœœœ œœœœœœœœ œœœœœœœœ œœœœœœœœ œœœœœœœœ œœœœœœœœ œœœœœœœœ œœœœœœœœ
TOTAL AGREE 22 19 3 12 10 5 1 8 2 4 2 14 8 4% 5% 3% 5% 4% 15% 1% 7% 2% 5% 2% 6% 3%
+++ + + -
5- Strongly agree 12 9 3 6 6 3 0 4 2 3 0 7 5 2% 2% 3% 3% 2% 9% 0% 4% 2% 4% 0% 3% 2%
+++
4 10 10 0 6 4 2 1 4 0 1 2 7 3 2% 3% 0% 3% 2% 6% 1% 4% 0% 1% 2% 3% 1%
+ + -
NEUTRAL 22 20 2 10 12 1 5 9 2 0 5 15 74% 5% 2% 4% 5% 3% 6% 8% 2% 0% 5% 7% 2%
++ ++ --
TOTAL DISAGREE 454 357 97 217 237 27 70 91 103 76 85 188 26490% 89% 94% 90% 90% 82% 91% 83% 95% 95% 91% 85% 94%
- --- ++ --- +++
1- Strongly disagree 424 329 95 207 217 84% 82% 92% 86% 83%
-- ++
26 64 87 92 74 79 177 245 79% 83% 79% 85% 93% 85% 80% 87%
- ++ -- ++
2 30 28 2 6% 7% 2%
+ -
10 20 1 6 4 11 2 6 11 19 4% 8% 3% 8% 4% 10% 3% 6% 5% 7%
++
DON'T KNOW 5 4 1 1 4 0 1 2 1 0 1 3 2 1% 1% 1% 0% 2% 0% 1% 2% 1% 0% 1% 1% 1%
No. of Respondents 503 400 103 240 263 33 77 110 108 80 93 220 281 100% 100% 100% 100% 100% 100% 100% 100% 100% 100% 100% 100% 100%
Mean 1.3 1.3 1.2 1.3 1.3 1.6 1.3 1.5 1.2 1.2 1.2 1.4 1.2
Prepared by McGregor Tan Research (Ref: 6798)
- 80 -

EPA - PLASTIC BAGS RESEARCH - JULY 2003
Question 16: If a ban were imposed on conventional non biodegradable plastic carry bags, and assuming that alternatives such as the ones I have mentioned were available, how would a ban influence your shopping behaviour? Please use a scale of 1-5 where 5 means strongly agree and 1 means strongly disagree. Shop less
OCCUPATION EMPLOYMENT œœœœœœœœœœœœœœœœœœœœœœœœœœœœœœœœœœœœœœœœœœœœœœœœœœœœœœœœœœœœœœœœœœœœœœœœœœœœœœœœœœœ œœœœœœœœœœœœœœœœœœœœœœœ
Unemployed Paid Looking Home Retired/ Other In paid Not in
Total Employee for work Student Duties Pensioner Pensioner Other work pd work œœœœœ œœœœœœœœœœœ œœœœœœœœœœœ œœœœœœœœœœœ œœœœœœœœœœœ œœœœœœœœœœœ œœœœœœœœœœœ œœœœœœœœœœœ œœœœœœœœœœœ œœœœœœœœœœœ
TOTAL AGREE 22 11 2 2 2 4 1 0 11 9 4% 4% 29% 11% 3% 4% 8% 0% 4% 4%
5- Strongly agree 12 7 2 0 2 1 0 0 7 3 2% 2% 29% 0% 3% 1% 0% 0% 2% 1%
4 10 4 0 2 0 3 1 0 4 6 2% 1% 0% 11% 0% 3% 8% 0% 1% 3%
NEUTRAL 22 13 1 0 4 4 0 0 13 8 4% 5% 14% 0% 5% 4% 0% 0% 5% 4%
TOTAL DISAGREE 454 258 4 17 65 95 11 4 258 192 90% 91% 57% 89% 87% 92% 92% 100% 91% 90%
1- Strongly disagree 424 243 4 15 61 88 9 4 243 177 84% 86% 57% 79% 81% 85% 75% 100% 86% 83%
2 30 15 0 2 4 7 2 0 15 15 6% 5% 0% 11% 5% 7% 17% 0% 5% 7%
DON'T KNOW 5 1 0 0 4 0 0 0 1 4 1% 0% 0% 0% 5% 0% 0% 0% 0% 2%
+++ +
No. of Respondents 503 283 7 19 75 103 12 4 283 213 100% 100% 100% 100% 100% 100% 100% 100% 100% 100%
Mean 1.3 1.3 2.4 1.4 1.3 1.3 1.4 1.0 1.3 1.3
Prepared by McGregor Tan Research (Ref: 6798)
- 81 -
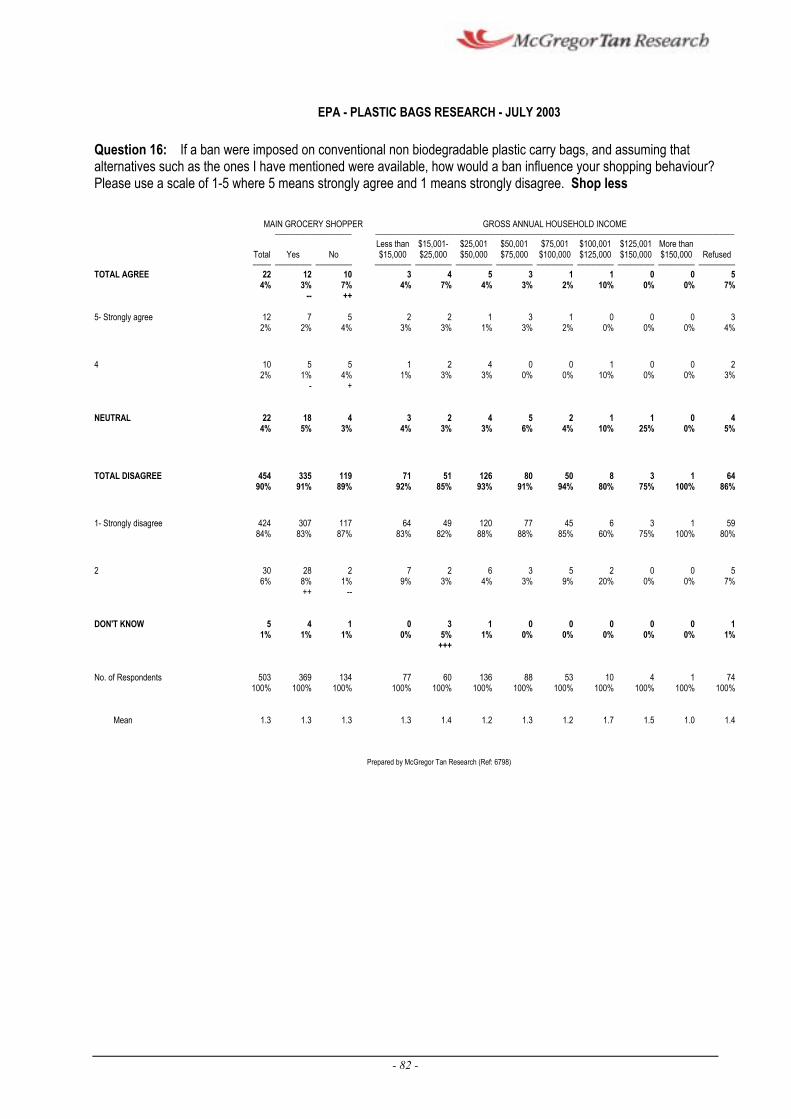
EPA - PLASTIC BAGS RESEARCH - JULY 2003
Question 16: If a ban were imposed on conventional non biodegradable plastic carry bags, and assuming that alternatives such as the ones I have mentioned were available, how would a ban influence your shopping behaviour? Please use a scale of 1-5 where 5 means strongly agree and 1 means strongly disagree. Shop less
MAIN GROCERY SHOPPER GROSS ANNUAL HOUSEHOLD INCOME œœœœœœœœœœœœœœœœœœœœœ œœœœœœœœœœœœœœœœœœœœœœœœœœœœœœœœœœœœœœœœœœœœœœœœœœœœœœœœœœœœœœœœœœœœœœœœœœœœœœœœœœœœœœœœœœœœœœœœœœ
Less than $15,001- $25,001 $50,001 $75,001 $100,001 $125,001 More than Total Yes No $15,000 $25,000 $50,000 $75,000 $100,000 $125,000 $150,000 $150,000 Refused œœœœœ œœœœœœœœœœ œœœœœœœœœœ œœœœœœœœœœ œœœœœœœœœœ œœœœœœœœœœ œœœœœœœœœœ œœœœœœœœœœ œœœœœœœœœœ œœœœœœœœœœ œœœœœœœœœœ œœœœœœœœœœ
TOTAL AGREE 22 12 4% 3%
--
10 3 4 5 3 1 1 0 0 5 7% 4% 7% 4% 3% 2% 10% 0% 0% 7% ++
5- Strongly agree 12 7 5 2 2 1 3 1 0 0 0 3 2% 2% 4% 3% 3% 1% 3% 2% 0% 0% 0% 4%
4 10 52% 1%
-
5 1 2 4 0 0 1 0 0 2 4% 1% 3% 3% 0% 0% 10% 0% 0% 3%
+
NEUTRAL 22 18 4 3 2 4 5 2 1 1 0 4 4% 5% 3% 4% 3% 3% 6% 4% 10% 25% 0% 5%
TOTAL DISAGREE 454 335 119 71 51 126 80 50 8 3 1 64 90% 91% 89% 92% 85% 93% 91% 94% 80% 75% 100% 86%
1- Strongly disagree 424 307 117 64 49 120 77 45 6 3 1 59 84% 83% 87% 83% 82% 88% 88% 85% 60% 75% 100% 80%
2 30 28 6% 8%
++
2 7 2 6 3 5 2 0 0 5 1% 9% 3% 4% 3% 9% 20% 0% 0% 7%
--
DON'T KNOW 5 4 1 0 3 1 0 0 0 0 0 1 1% 1% 1% 0% 5% 1% 0% 0% 0% 0% 0% 1%
+++
No. of Respondents 503 369 134 77 60 136 88 53 10 4 1 74 100% 100% 100% 100% 100% 100% 100% 100% 100% 100% 100% 100%
Mean 1.3 1.3 1.3 1.3 1.4 1.2 1.3 1.2 1.7 1.5 1.0 1.4
Prepared by McGregor Tan Research (Ref: 6798)
- 82 -
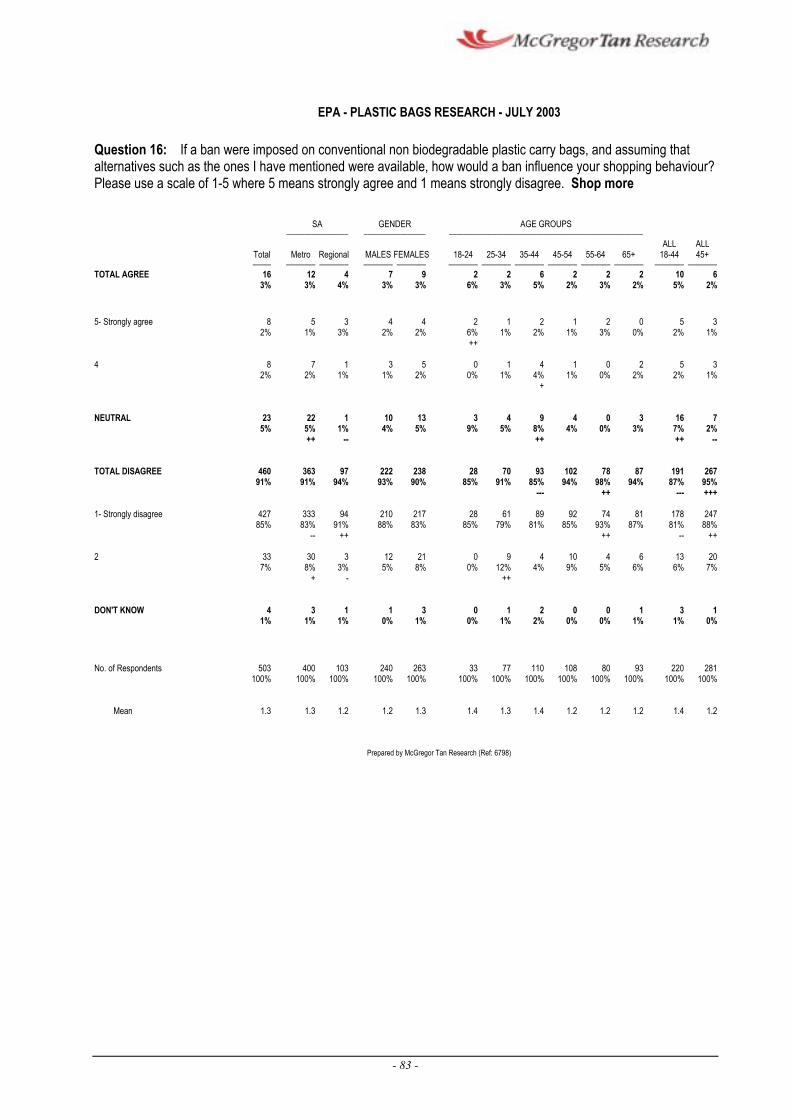
EPA - PLASTIC BAGS RESEARCH - JULY 2003
Question 16: If a ban were imposed on conventional non biodegradable plastic carry bags, and assuming that alternatives such as the ones I have mentioned were available, how would a ban influence your shopping behaviour? Please use a scale of 1-5 where 5 means strongly agree and 1 means strongly disagree. Shop more
SA GENDER AGE GROUPS œœœœœœœœœœœœœœœœœ œœœœœœœœœœœœœœœœœ œœœœœœœœœœœœœœœœœœœœœœœœœœœœœœœœœœœœœœœœœœœœœœœœœœœœœ
ALL ALL Total Metro Regional MALES FEMALES 18-24 25-34 35-44 45-54 55-64 65+ 18-44 45+ œœœœœ œœœœœœœœ œœœœœœœœ œœœœœœœœ œœœœœœœœ œœœœœœœœ œœœœœœœœ œœœœœœœœ œœœœœœœœ œœœœœœœœ œœœœœœœœ œœœœœœœœ œœœœœœœœ
TOTAL AGREE 16 12 4 7 9 2 2 6 2 2 2 10 6 3% 3% 4% 3% 3% 6% 3% 5% 2% 3% 2% 5% 2%
5- Strongly agree 8 5 3 4 4 2 1 2 1 2 0 5 3 2% 1% 3% 2% 2% 6% 1% 2% 1% 3% 0% 2% 1%
++
4 8 7 1 3 5 0 1 4 1 0 2 5 3 2% 2% 1% 1% 2% 0% 1% 4% 1% 0% 2% 2% 1%
+
NEUTRAL 23 22 1 5% 5% 1%
++ --
10 13 3 4 9 4 0 3 16 74% 5% 9% 5% 8% 4% 0% 3% 7% 2%
++ ++ --
TOTAL DISAGREE 460 363 97 222 238 28 70 93 102 78 87 191 26791% 91% 94% 93% 90% 85% 91% 85% 94% 98% 94% 87% 95%
--- ++ --- +++
1- Strongly disagree 427 333 94 210 217 85% 83% 91% 88% 83%
-- ++
28 61 89 92 74 81 178 247 85% 79% 81% 85% 93% 87% 81% 88%
++ -- ++
2 33 30 3 7% 8% 3%
+ -
12 21 0 9 4 10 4 6 13 20 5% 8% 0% 12% 4% 9% 5% 6% 6% 7%
++
DON'T KNOW 4 3 1 1 3 0 1 2 0 0 1 3 1 1% 1% 1% 0% 1% 0% 1% 2% 0% 0% 1% 1% 0%
No. of Respondents 503 400 103 240 263 33 77 110 108 80 93 220 281 100% 100% 100% 100% 100% 100% 100% 100% 100% 100% 100% 100% 100%
Mean 1.3 1.3 1.2 1.2 1.3 1.4 1.3 1.4 1.2 1.2 1.2 1.4 1.2
Prepared by McGregor Tan Research (Ref: 6798)
- 83 -
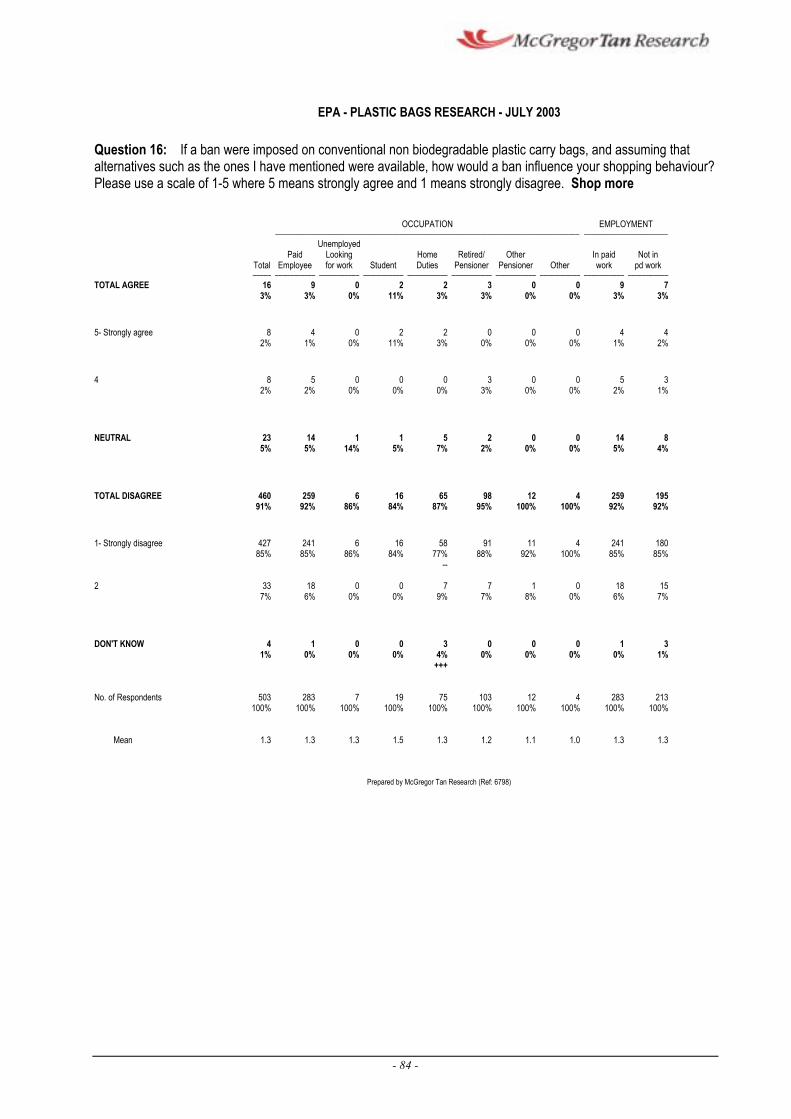
--
EPA - PLASTIC BAGS RESEARCH - JULY 2003
Question 16: If a ban were imposed on conventional non biodegradable plastic carry bags, and assuming that alternatives such as the ones I have mentioned were available, how would a ban influence your shopping behaviour? Please use a scale of 1-5 where 5 means strongly agree and 1 means strongly disagree. Shop more
OCCUPATION EMPLOYMENT œœœœœœœœœœœœœœœœœœœœœœœœœœœœœœœœœœœœœœœœœœœœœœœœœœœœœœœœœœœœœœœœœœœœœœœœœœœœœœœœœœœ œœœœœœœœœœœœœœœœœœœœœœœ
Unemployed Paid Looking Home Retired/ Other In paid Not in
Total Employee for work Student Duties Pensioner Pensioner Other work pd work œœœœœ œœœœœœœœœœœ œœœœœœœœœœœ œœœœœœœœœœœ œœœœœœœœœœœ œœœœœœœœœœœ œœœœœœœœœœœ œœœœœœœœœœœ œœœœœœœœœœœ œœœœœœœœœœœ
TOTAL AGREE 16 9 0 2 2 3 0 0 9 7 3% 3% 0% 11% 3% 3% 0% 0% 3% 3%
5- Strongly agree 8 4 0 2 2 0 0 0 4 4 2% 1% 0% 11% 3% 0% 0% 0% 1% 2%
4 8 5 0 0 0 3 0 0 5 3 2% 2% 0% 0% 0% 3% 0% 0% 2% 1%
NEUTRAL 23 14 1 1 5 2 0 0 14 8 5% 5% 14% 5% 7% 2% 0% 0% 5% 4%
TOTAL DISAGREE 460 259 6 16 65 98 12 4 259 195 91% 92% 86% 84% 87% 95% 100% 100% 92% 92%
1- Strongly disagree 427 241 6 16 58 91 11 4 241 180 85% 85% 86% 84% 77% 88% 92% 100% 85% 85%
2 33 18 0 0 7 7 1 0 18 15 7% 6% 0% 0% 9% 7% 8% 0% 6% 7%
DON'T KNOW 4 1 0 0 3 0 0 0 1 3 1% 0% 0% 0% 4% 0% 0% 0% 0% 1%
+++
No. of Respondents 503 283 7 19 75 103 12 4 283 213 100% 100% 100% 100% 100% 100% 100% 100% 100% 100%
Mean 1.3 1.3 1.3 1.5 1.3 1.2 1.1 1.0 1.3 1.3
Prepared by McGregor Tan Research (Ref: 6798)
- 84 -
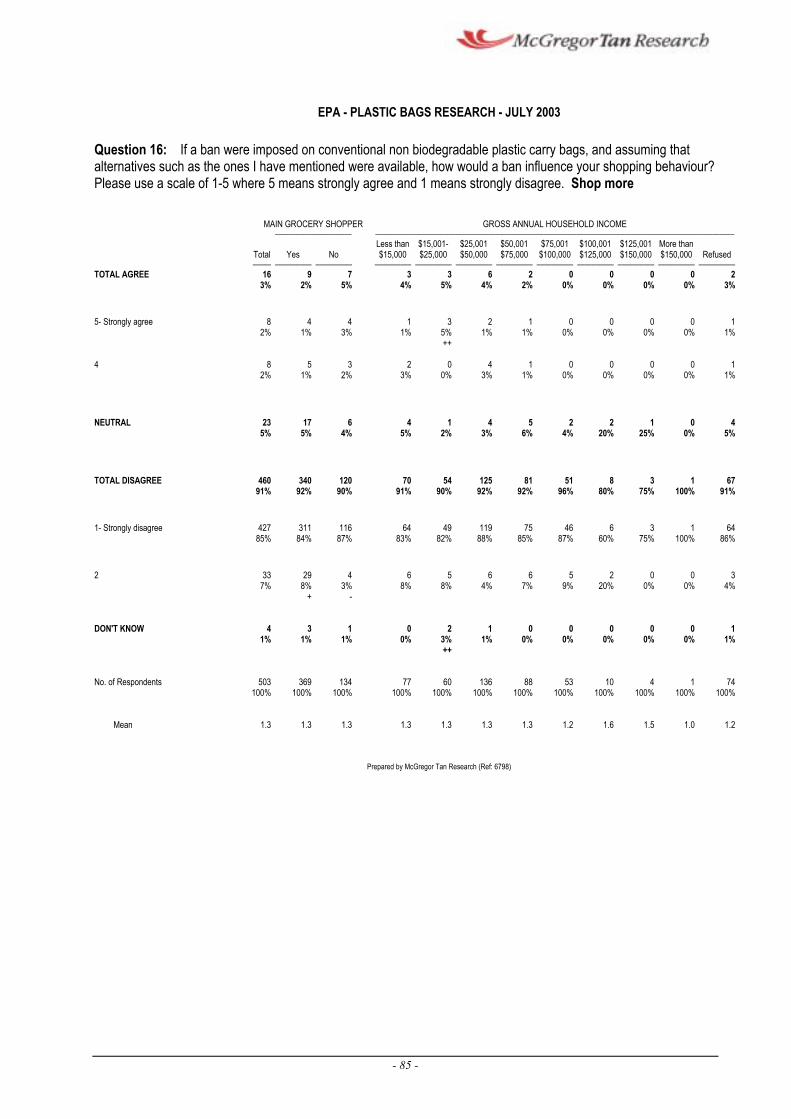
EPA - PLASTIC BAGS RESEARCH - JULY 2003
Question 16: If a ban were imposed on conventional non biodegradable plastic carry bags, and assuming that alternatives such as the ones I have mentioned were available, how would a ban influence your shopping behaviour? Please use a scale of 1-5 where 5 means strongly agree and 1 means strongly disagree. Shop more
MAIN GROCERY SHOPPER GROSS ANNUAL HOUSEHOLD INCOME œœœœœœœœœœœœœœœœœœœœœ œœœœœœœœœœœœœœœœœœœœœœœœœœœœœœœœœœœœœœœœœœœœœœœœœœœœœœœœœœœœœœœœœœœœœœœœœœœœœœœœœœœœœœœœœœœœœœœœœœ
Less than $15,001- $25,001 $50,001 $75,001 $100,001 $125,001 More than Total Yes No $15,000 $25,000 $50,000 $75,000 $100,000 $125,000 $150,000 $150,000 Refused œœœœœ œœœœœœœœœœ œœœœœœœœœœ œœœœœœœœœœ œœœœœœœœœœ œœœœœœœœœœ œœœœœœœœœœ œœœœœœœœœœ œœœœœœœœœœ œœœœœœœœœœ œœœœœœœœœœ œœœœœœœœœœ
TOTAL AGREE 16 9 7 3 3 6 2 0 0 0 0 2 3% 2% 5% 4% 5% 4% 2% 0% 0% 0% 0% 3%
5- Strongly agree 8 4 4 1 3 2 1 0 0 0 0 1 2% 1% 3% 1% 5% 1% 1% 0% 0% 0% 0% 1%
++
4 8 5 3 2 0 4 1 0 0 0 0 1 2% 1% 2% 3% 0% 3% 1% 0% 0% 0% 0% 1%
NEUTRAL 23 17 6 4 1 4 5 2 2 1 0 4 5% 5% 4% 5% 2% 3% 6% 4% 20% 25% 0% 5%
TOTAL DISAGREE 460 340 120 70 54 125 81 51 8 3 1 67 91% 92% 90% 91% 90% 92% 92% 96% 80% 75% 100% 91%
1- Strongly disagree 427 311 116 64 49 119 75 46 6 3 1 64 85% 84% 87% 83% 82% 88% 85% 87% 60% 75% 100% 86%
2 33 29 7% 8%
+
4 6 5 6 6 5 2 0 0 3 3% 8% 8% 4% 7% 9% 20% 0% 0% 4%
-
DON'T KNOW 4 3 1 0 2 1 0 0 0 0 0 1 1% 1% 1% 0% 3% 1% 0% 0% 0% 0% 0% 1%
++
No. of Respondents 503 369 134 77 60 136 88 53 10 4 1 74 100% 100% 100% 100% 100% 100% 100% 100% 100% 100% 100% 100%
Mean 1.3 1.3 1.3 1.3 1.3 1.3 1.3 1.2 1.6 1.5 1.0 1.2
Prepared by McGregor Tan Research (Ref: 6798)
- 85 -

EPA - PLASTIC BAGS RESEARCH - JULY 2003
Question 16: If a ban were imposed on conventional non biodegradable plastic carry bags, and assuming that alternatives such as the ones I have mentioned were available, how would a ban influence your shopping behaviour? Please use a scale of 1-5 where 5 means strongly agree and 1 means strongly disagree. No change to shopping pattern
SA GENDER AGE GROUPS œœœœœœœœœœœœœœœœœ œœœœœœœœœœœœœœœœœ œœœœœœœœœœœœœœœœœœœœœœœœœœœœœœœœœœœœœœœœœœœœœœœœœœœœœ
ALL ALL Total Metro Regional MALES FEMALES 18-24 25-34 35-44 45-54 55-64 65+ 18-44 45+ œœœœœ œœœœœœœœ œœœœœœœœ œœœœœœœœ œœœœœœœœ œœœœœœœœ œœœœœœœœ œœœœœœœœ œœœœœœœœ œœœœœœœœ œœœœœœœœ œœœœœœœœ œœœœœœœœ
TOTAL AGREE 471 375 96 224 247 30 73 101 102 77 86 204 265 94% 94% 93% 93% 94% 91% 95% 92% 94% 96% 92% 93% 94%
5- Strongly agree 445 358 87 209 236 27 69 98 95 73 81 194 249 88% 89% 84% 87% 90% 82% 90% 89% 88% 91% 87% 88% 89%
4 26 17 9 15 11 3 4 3 7 4 5 10 16 5% 4% 9% 6% 4% 9% 5% 3% 6% 5% 5% 5% 6%
- +
NEUTRAL 11 9 2 3 8 0 1 1 3 2 4 2 92% 2% 2% 1% 3% 0% 1% 1% 3% 3% 4% 1% 3%
- +
TOTAL DISAGREE 17 13 4 12 5 3% 3% 4% 5% 2%
+ -
3 1 7 3 1 2 11 6 9% 1% 6% 3% 1% 2% 5% 2%
+ + + -
1- Strongly disagree 11 7 4 9 2 2% 2% 4% 4% 1%
++ --
3 0 6 1 1 0 9 2 9% 0% 5% 1% 1% 0% 4% 1%
+++ +++ ++ --
2 6 6 0 3 3 0 1 1 2 0 2 2 4 1% 1% 0% 1% 1% 0% 1% 1% 2% 0% 2% 1% 1%
DON'T KNOW 4 3 1 1 3 0 2 1 0 0 1 3 1 1% 1% 1% 0% 1% 0% 3% 1% 0% 0% 1% 1% 0%
+
No. of Respondents 503 400 103 240 263 33 77 110 108 80 93 220 281 100% 100% 100% 100% 100% 100% 100% 100% 100% 100% 100% 100% 100%
Mean 4.8 4.8 4.7 4.7 4.8 4.5 4.9 4.7 4.8 4.9 4.8 4.7 4.8
Prepared by McGregor Tan Research (Ref: 6798)
- 86 -
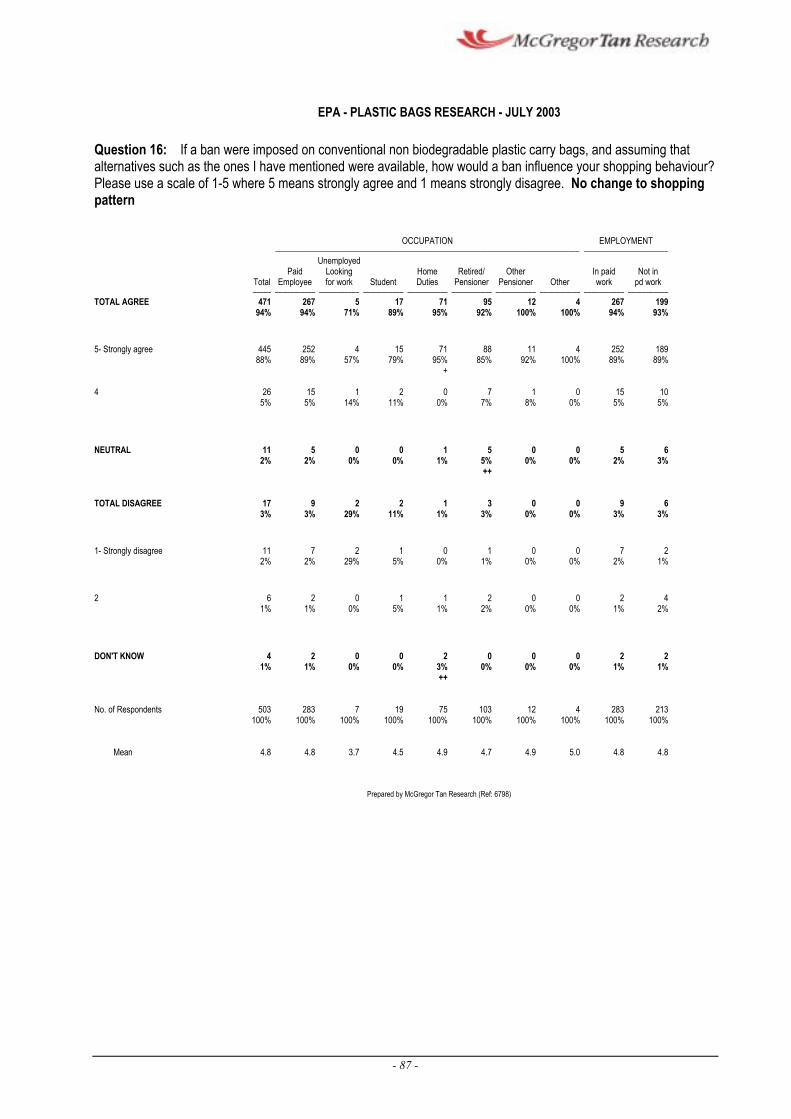
EPA - PLASTIC BAGS RESEARCH - JULY 2003
Question 16: If a ban were imposed on conventional non biodegradable plastic carry bags, and assuming that alternatives such as the ones I have mentioned were available, how would a ban influence your shopping behaviour? Please use a scale of 1-5 where 5 means strongly agree and 1 means strongly disagree. No change to shopping pattern
OCCUPATION EMPLOYMENT œœœœœœœœœœœœœœœœœœœœœœœœœœœœœœœœœœœœœœœœœœœœœœœœœœœœœœœœœœœœœœœœœœœœœœœœœœœœœœœœœœœ œœœœœœœœœœœœœœœœœœœœœœœ
Unemployed Paid Looking Home Retired/ Other In paid Not in
Total Employee for work Student Duties Pensioner Pensioner Other work pd work œœœœœ œœœœœœœœœœœ œœœœœœœœœœœ œœœœœœœœœœœ œœœœœœœœœœœ œœœœœœœœœœœ œœœœœœœœœœœ œœœœœœœœœœœ œœœœœœœœœœœ œœœœœœœœœœœ
TOTAL AGREE 471 267 5 17 71 95 12 4 267 199 94% 94% 71% 89% 95% 92% 100% 100% 94% 93%
5- Strongly agree 445 252 4 15 71 88 11 4 252 189 88% 89% 57% 79% 95% 85% 92% 100% 89% 89%
+
4 26 15 1 2 0 7 1 0 15 10 5% 5% 14% 11% 0% 7% 8% 0% 5% 5%
NEUTRAL 11 5 0 0 1 5 0 0 5 6 2% 2% 0% 0% 1% 5% 0% 0% 2% 3%
++
TOTAL DISAGREE 17 9 2 2 1 3 0 0 9 6 3% 3% 29% 11% 1% 3% 0% 0% 3% 3%
1- Strongly disagree 11 7 2 1 0 1 0 0 7 2 2% 2% 29% 5% 0% 1% 0% 0% 2% 1%
2 6 2 0 1 1 2 0 0 2 4 1% 1% 0% 5% 1% 2% 0% 0% 1% 2%
DON'T KNOW 4 2 0 0 2 0 0 0 2 2 1% 1% 0% 0% 3% 0% 0% 0% 1% 1%
++
No. of Respondents 503 283 7 19 75 103 12 4 283 213 100% 100% 100% 100% 100% 100% 100% 100% 100% 100%
Mean 4.8 4.8 3.7 4.5 4.9 4.7 4.9 5.0 4.8 4.8
Prepared by McGregor Tan Research (Ref: 6798)
- 87 -
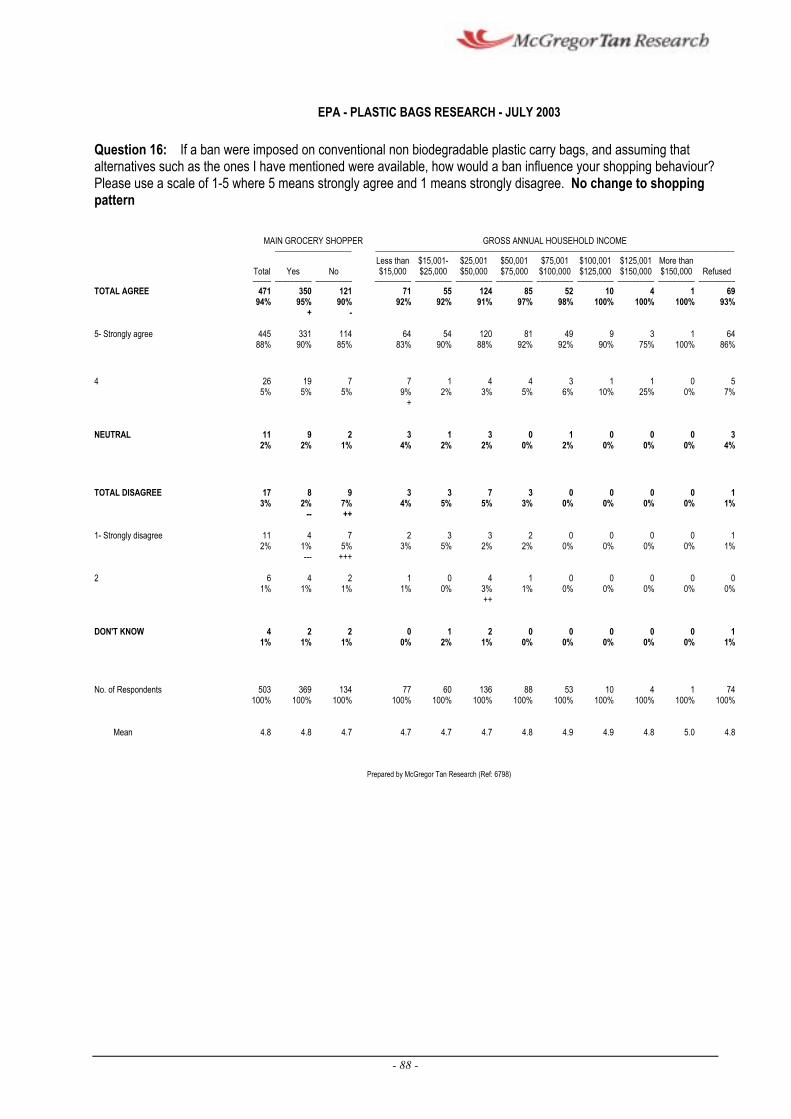
EPA - PLASTIC BAGS RESEARCH - JULY 2003
Question 16: If a ban were imposed on conventional non biodegradable plastic carry bags, and assuming that alternatives such as the ones I have mentioned were available, how would a ban influence your shopping behaviour? Please use a scale of 1-5 where 5 means strongly agree and 1 means strongly disagree. No change to shopping pattern
MAIN GROCERY SHOPPER GROSS ANNUAL HOUSEHOLD INCOME œœœœœœœœœœœœœœœœœœœœœ œœœœœœœœœœœœœœœœœœœœœœœœœœœœœœœœœœœœœœœœœœœœœœœœœœœœœœœœœœœœœœœœœœœœœœœœœœœœœœœœœœœœœœœœœœœœœœœœœœ
Less than $15,001- $25,001 $50,001 $75,001 $100,001 $125,001 More than Total Yes No $15,000 $25,000 $50,000 $75,000 $100,000 $125,000 $150,000 $150,000 Refused œœœœœ œœœœœœœœœœ œœœœœœœœœœ œœœœœœœœœœ œœœœœœœœœœ œœœœœœœœœœ œœœœœœœœœœ œœœœœœœœœœ œœœœœœœœœœ œœœœœœœœœœ œœœœœœœœœœ œœœœœœœœœœ
TOTAL AGREE 471 350 121 71 55 124 85 52 10 4 1 69 94% 95% 90% 92% 92% 91% 97% 98% 100% 100% 100% 93%
+ -
5- Strongly agree 445 88%
331 90%
114 85%
64 83%
54 90%
120 88%
81 92%
49 92%
9 90%
3 75%
1 100%
64 86%
4 26 19 7 7 1 4 4 3 1 1 0 5 5% 5% 5% 9% 2% 3% 5% 6% 10% 25% 0% 7%
+
NEUTRAL 11 9 2 3 1 3 0 1 0 0 0 3 2% 2% 1% 4% 2% 2% 0% 2% 0% 0% 0% 4%
TOTAL DISAGREE 17 8 3% 2%
--
9 3 3 7 3 0 0 0 0 1 7% 4% 5% 5% 3% 0% 0% 0% 0% 1% ++
1- Strongly disagree 11 4 7 2 3 3 2 0 0 0 0 1 2% 1% 5% 3% 5% 2% 2% 0% 0% 0% 0% 1%
--- +++
2 6 4 2 1 0 4 1 0 0 0 0 0 1% 1% 1% 1% 0% 3% 1% 0% 0% 0% 0% 0%
++
DON'T KNOW 4 2 2 0 1 2 0 0 0 0 0 1 1% 1% 1% 0% 2% 1% 0% 0% 0% 0% 0% 1%
No. of Respondents 503 369 134 77 60 136 88 53 10 4 1 74 100% 100% 100% 100% 100% 100% 100% 100% 100% 100% 100% 100%
Mean 4.8 4.8 4.7 4.7 4.7 4.7 4.8 4.9 4.9 4.8 5.0 4.8
Prepared by McGregor Tan Research (Ref: 6798)
- 88 -
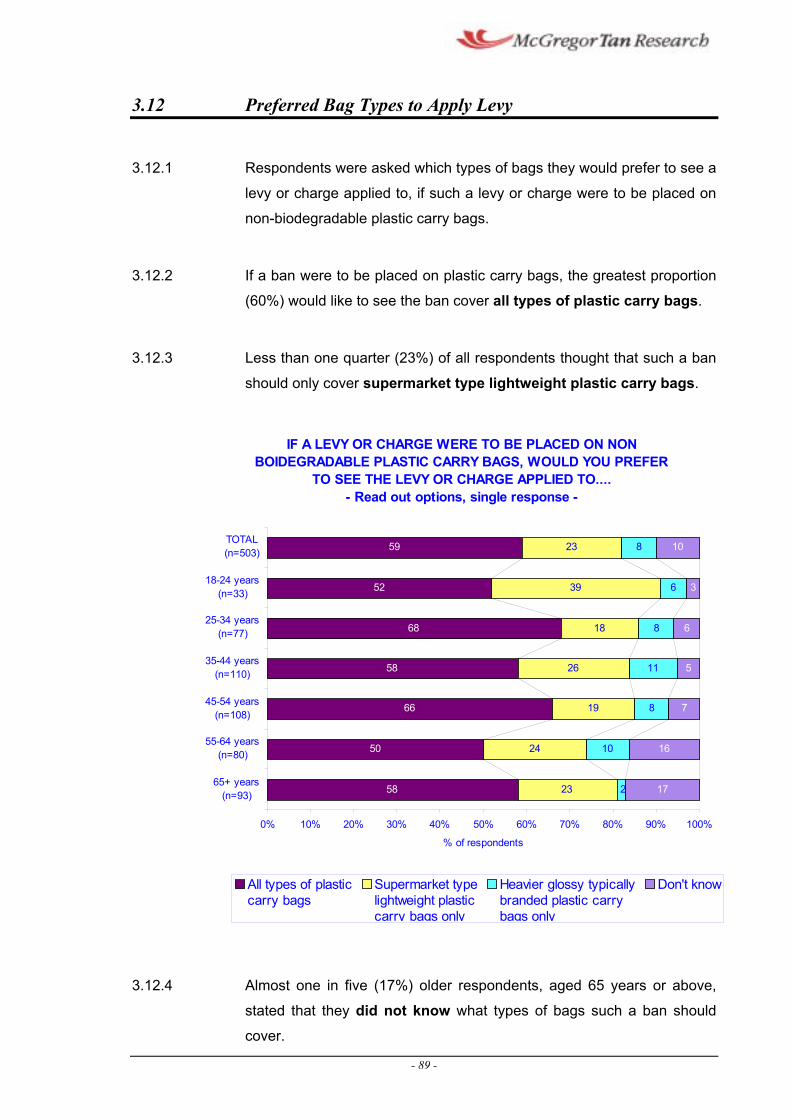
3.12 Preferred Bag Types to Apply Levy
3.12.1 Respondents were asked which types of bags they would prefer to see a
levy or charge applied to, if such a levy or charge were to be placed on
non-biodegradable plastic carry bags.
3.12.2 If a ban were to be placed on plastic carry bags, the greatest proportion
(60%) would like to see the ban cover all types of plastic carry bags.
3.12.3 Less than one quarter (23%) of all respondents thought that such a ban
should only cover supermarket type lightweight plastic carry bags.
IF A LEVY OR CHARGE WERE TO BE PLACED ON NON BOIDEGRADABLE PLASTIC CARRY BAGS, WOULD YOU PREFER
TO SEE THE LEVY OR CHARGE APPLIED TO.... - Read out options, single response -
TOTAL(n=503)
18-24 years(n=33)
25-34 years(n=77)
35-44 years(n=110)
45-54 years(n=108)
55-64 years(n=80)
65+ years(n=93) 58
50
66
58
68
52
59
23
24
19
26
18
39
23
2
10
8
11
8
6
8
17
16
7
5
6
3
10
0% 10% 20% 30% 40% 50% 60% 70% 80% 90% 100%
% of respondents
All types of plastic Supermarket type Heavier glossy typically Don't know carry bags lightweight plastic branded plastic carry
carry bags only bags only
3.12.4 Almost one in five (17%) older respondents, aged 65 years or above,
stated that they did not know what types of bags such a ban should
cover.
- 89 -
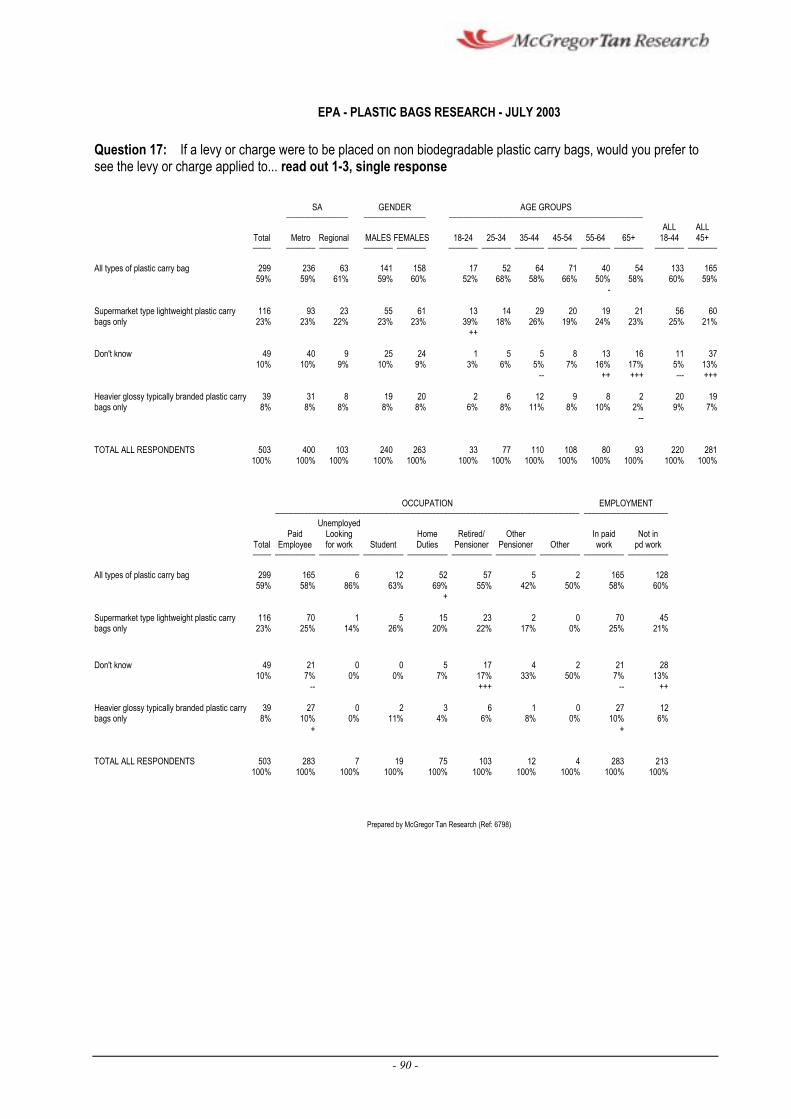
--
EPA - PLASTIC BAGS RESEARCH - JULY 2003
Question 17: If a levy or charge were to be placed on non biodegradable plastic carry bags, would you prefer to see the levy or charge applied to... read out 1-3, single response
SA GENDER AGE GROUPS œœœœœœœœœœœœœœœœœ œœœœœœœœœœœœœœœœœ œœœœœœœœœœœœœœœœœœœœœœœœœœœœœœœœœœœœœœœœœœœœœœœœœœœœœ
ALL ALL Total Metro Regional MALES FEMALES 18-24 25-34 35-44 45-54 55-64 65+ 18-44 45+ œœœœœ œœœœœœœœ œœœœœœœœ œœœœœœœœ œœœœœœœœ œœœœœœœœ œœœœœœœœ œœœœœœœœ œœœœœœœœ œœœœœœœœ œœœœœœœœ œœœœœœœœ œœœœœœœœ
All types of plastic carry bag 299 59%
236 59%
63 61%
141 59%
158 60%
17 52%
52 68%
64 58%
71 66%
40 50%
54 58%
133 60%
165 59%
-
Supermarket type lightweight plastic carry 116 93 23 55 61 13 14 29 20 19 21 56 60 bags only 23% 23% 22% 23% 23% 39% 18% 26% 19% 24% 23% 25% 21%
++
Don't know 49 40 9 25 24 1 5 5 8 13 16 11 3710% 10% 9% 10% 9% 3% 6% 5% 7% 16% 17% 5% 13%
-- ++ +++ --- +++
Heavier glossy typically branded plastic carry 39 31 8 19 20 2 6 12 9 8 2 20 19 bags only 8% 8% 8% 8% 8% 6% 8% 11% 8% 10% 2% 9% 7%
TOTAL ALL RESPONDENTS 503 400 103 240 263 33 77 110 108 80 93 220 281 100% 100% 100% 100% 100% 100% 100% 100% 100% 100% 100% 100% 100%
OCCUPATION EMPLOYMENT œœœœœœœœœœœœœœœœœœœœœœœœœœœœœœœœœœœœœœœœœœœœœœœœœœœœœœœœœœœœœœœœœœœœœœœœœœœœœœœœœœœ œœœœœœœœœœœœœœœœœœœœœœœ
Unemployed Paid Looking Home Retired/ Other In paid Not in
Total Employee for work Student Duties Pensioner Pensioner Other work pd work œœœœœ œœœœœœœœœœœ œœœœœœœœœœœ œœœœœœœœœœœ œœœœœœœœœœœ œœœœœœœœœœœ œœœœœœœœœœœ œœœœœœœœœœœ œœœœœœœœœœœ œœœœœœœœœœœ
All types of plastic carry bag 299 165 6 12 52 57 5 2 165 128 59% 58% 86% 63% 69% 55% 42% 50% 58% 60%
+
Supermarket type lightweight plastic carry 116 70 1 5 15 23 2 0 70 45 bags only 23% 25% 14% 26% 20% 22% 17% 0% 25% 21%
Don't know 49 21 10% 7%
--
0 0 5 17 4 2 21 28 0% 0% 7% 17% 33% 50% 7% 13%
+++ -- ++
Heavier glossy typically branded plastic carry 39 27 bags only 8% 10%
+
0 2 3 6 1 0 27 12 0% 11% 4% 6% 8% 0% 10% 6%
+
TOTAL ALL RESPONDENTS 503 283 7 19 75 103 12 4 283 213 100% 100% 100% 100% 100% 100% 100% 100% 100% 100%
Prepared by McGregor Tan Research (Ref: 6798)
- 90 -
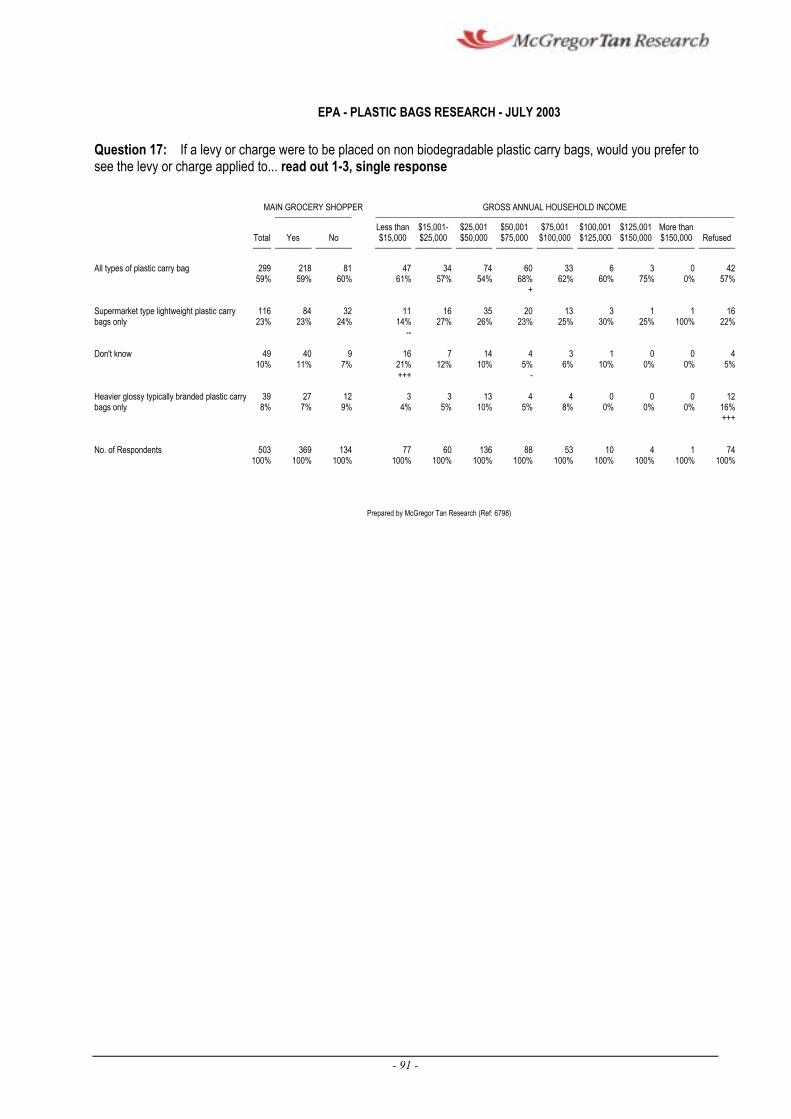
--
EPA - PLASTIC BAGS RESEARCH - JULY 2003
Question 17: If a levy or charge were to be placed on non biodegradable plastic carry bags, would you prefer to see the levy or charge applied to... read out 1-3, single response
MAIN GROCERY SHOPPER GROSS ANNUAL HOUSEHOLD INCOME œœœœœœœœœœœœœœœœœœœœœ œœœœœœœœœœœœœœœœœœœœœœœœœœœœœœœœœœœœœœœœœœœœœœœœœœœœœœœœœœœœœœœœœœœœœœœœœœœœœœœœœœœœœœœœœœœœœœœœœœ
Less than $15,001- $25,001 $50,001 $75,001 $100,001 $125,001 More than Total Yes No $15,000 $25,000 $50,000 $75,000 $100,000 $125,000 $150,000 $150,000 Refused œœœœœ œœœœœœœœœœ œœœœœœœœœœ œœœœœœœœœœ œœœœœœœœœœ œœœœœœœœœœ œœœœœœœœœœ œœœœœœœœœœ œœœœœœœœœœ œœœœœœœœœœ œœœœœœœœœœ œœœœœœœœœœ
All types of plastic carry bag 299 59%
218 59%
81 60%
47 61%
34 57%
74 54%
60 68%
33 62%
6 60%
3 75%
0 0%
42 57%
+
Supermarket type lightweight plastic carry bags only
116 23%
84 23%
32 24%
11 14%
16 27%
35 26%
20 23%
13 25%
3 30%
1 25%
1 100%
16 22%
Don't know 49 40 9 16 10% 11% 7% 21%
+++
7 14 4 3 1 0 0 4 12% 10% 5% 6% 10% 0% 0% 5%
-
Heavier glossy typically branded plastic carry 39 27 12 3 3 13 4 4 0 0 0 12 bags only 8% 7% 9% 4% 5% 10% 5% 8% 0% 0% 0% 16%
+++
No. of Respondents 503 369 134 77 60 136 88 53 10 4 1 74 100% 100% 100% 100% 100% 100% 100% 100% 100% 100% 100% 100%
Prepared by McGregor Tan Research (Ref: 6798)
- 91 -
Maximum Price Prepared to Pay Per Plastic Carry Bag
3.12.5 All survey participants were asked what would be the maximum price
they would be prepared to pay per plastic carry bag if a charge or levy
were to be placed on non-biodegradable plastic carry bags.
3.12.6 The research revealed that respondents would be prepared to pay an
average 8.6 cents per plastic carry bag, with younger respondents,
aged 18 to 24 years (10.4 cents per bag) and those in the higher income
sub-groups (10.6 cents by those whose annual household income was
$75,001 to $100,000) nominating the highest figures.
3.12.7 Interestingly, younger respondents stated that they were willing to pay
more than older respondents (25 to 34 years: 11.1 cents, compared to
65 years or above: 5.5 cents).
- 92 -
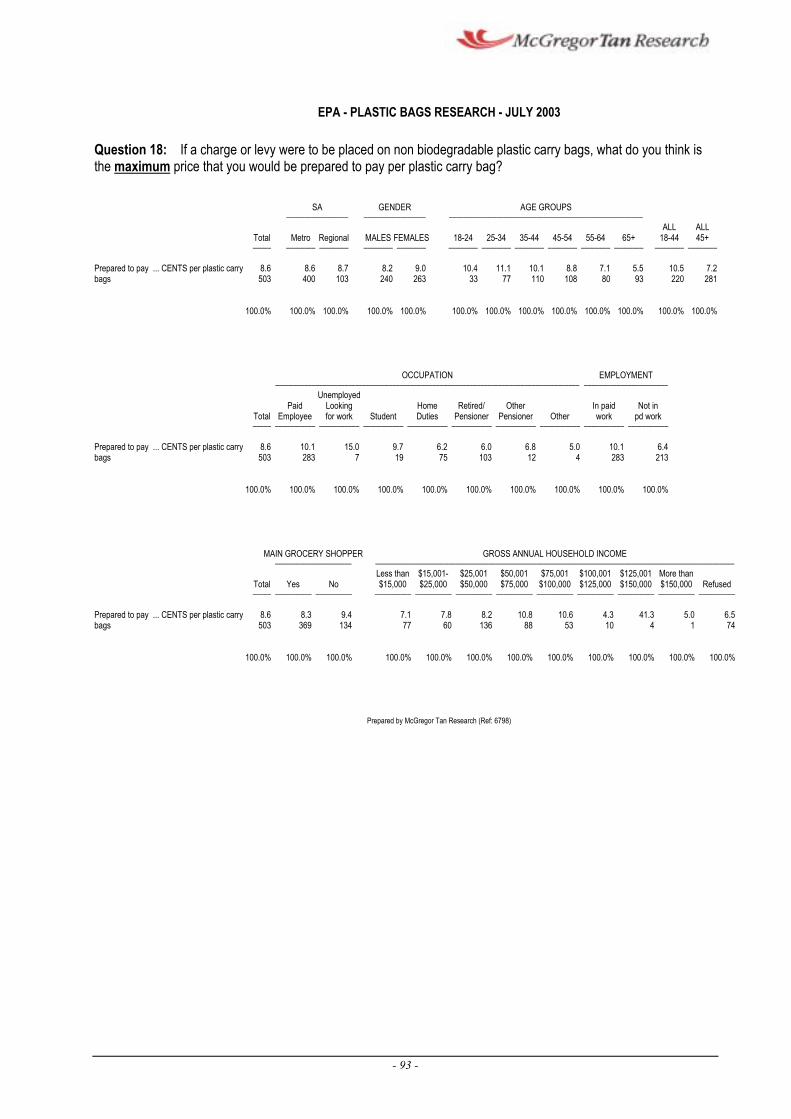
EPA - PLASTIC BAGS RESEARCH - JULY 2003
Question 18: If a charge or levy were to be placed on non biodegradable plastic carry bags, what do you think is the maximum price that you would be prepared to pay per plastic carry bag?
SA GENDER AGE GROUPS œœœœœœœœœœœœœœœœœ œœœœœœœœœœœœœœœœœ œœœœœœœœœœœœœœœœœœœœœœœœœœœœœœœœœœœœœœœœœœœœœœœœœœœœœ
ALL ALL Total Metro Regional MALES FEMALES 18-24 25-34 35-44 45-54 55-64 65+ 18-44 45+ œœœœœ œœœœœœœœ œœœœœœœœ œœœœœœœœ œœœœœœœœ œœœœœœœœ œœœœœœœœ œœœœœœœœ œœœœœœœœ œœœœœœœœ œœœœœœœœ œœœœœœœœ œœœœœœœœ
Prepared to pay ... CENTS per plastic carry 8.6 8.6 8.7 8.2 9.0 10.4 11.1 10.1 8.8 7.1 5.5 10.5 7.2 bags 503 400 103 240 263 33 77 110 108 80 93 220 281
100.0% 100.0% 100.0% 100.0% 100.0% 100.0% 100.0% 100.0% 100.0% 100.0% 100.0% 100.0% 100.0%
OCCUPATION EMPLOYMENT œœœœœœœœœœœœœœœœœœœœœœœœœœœœœœœœœœœœœœœœœœœœœœœœœœœœœœœœœœœœœœœœœœœœœœœœœœœœœœœœœœœ œœœœœœœœœœœœœœœœœœœœœœœ
Unemployed Paid Looking Home Retired/ Other In paid Not in
Total Employee for work Student Duties Pensioner Pensioner Other work pd work œœœœœ œœœœœœœœœœœ œœœœœœœœœœœ œœœœœœœœœœœ œœœœœœœœœœœ œœœœœœœœœœœ œœœœœœœœœœœ œœœœœœœœœœœ œœœœœœœœœœœ œœœœœœœœœœœ
Prepared to pay ... CENTS per plastic carry 8.6 10.1 15.0 9.7 6.2 6.0 6.8 5.0 10.1 6.4 bags 503 283 7 19 75 103 12 4 283 213
100.0% 100.0% 100.0% 100.0% 100.0% 100.0% 100.0% 100.0% 100.0% 100.0%
MAIN GROCERY SHOPPER GROSS ANNUAL HOUSEHOLD INCOME œœœœœœœœœœœœœœœœœœœœœ œœœœœœœœœœœœœœœœœœœœœœœœœœœœœœœœœœœœœœœœœœœœœœœœœœœœœœœœœœœœœœœœœœœœœœœœœœœœœœœœœœœœœœœœœœœœœœœœœœ
Less than $15,001- $25,001 $50,001 $75,001 $100,001 $125,001 More than Total Yes No $15,000 $25,000 $50,000 $75,000 $100,000 $125,000 $150,000 $150,000 Refused œœœœœ œœœœœœœœœœ œœœœœœœœœœ œœœœœœœœœœ œœœœœœœœœœ œœœœœœœœœœ œœœœœœœœœœ œœœœœœœœœœ œœœœœœœœœœ œœœœœœœœœœ œœœœœœœœœœ œœœœœœœœœœ
Prepared to pay ... CENTS per plastic carry 8.6 8.3 9.4 7.1 7.8 8.2 10.8 10.6 4.3 41.3 5.0 6.5 bags 503 369 134 77 60 136 88 53 10 4 1 74
100.0% 100.0% 100.0% 100.0% 100.0% 100.0% 100.0% 100.0% 100.0% 100.0% 100.0% 100.0%
Prepared by McGregor Tan Research (Ref: 6798)
- 93 -
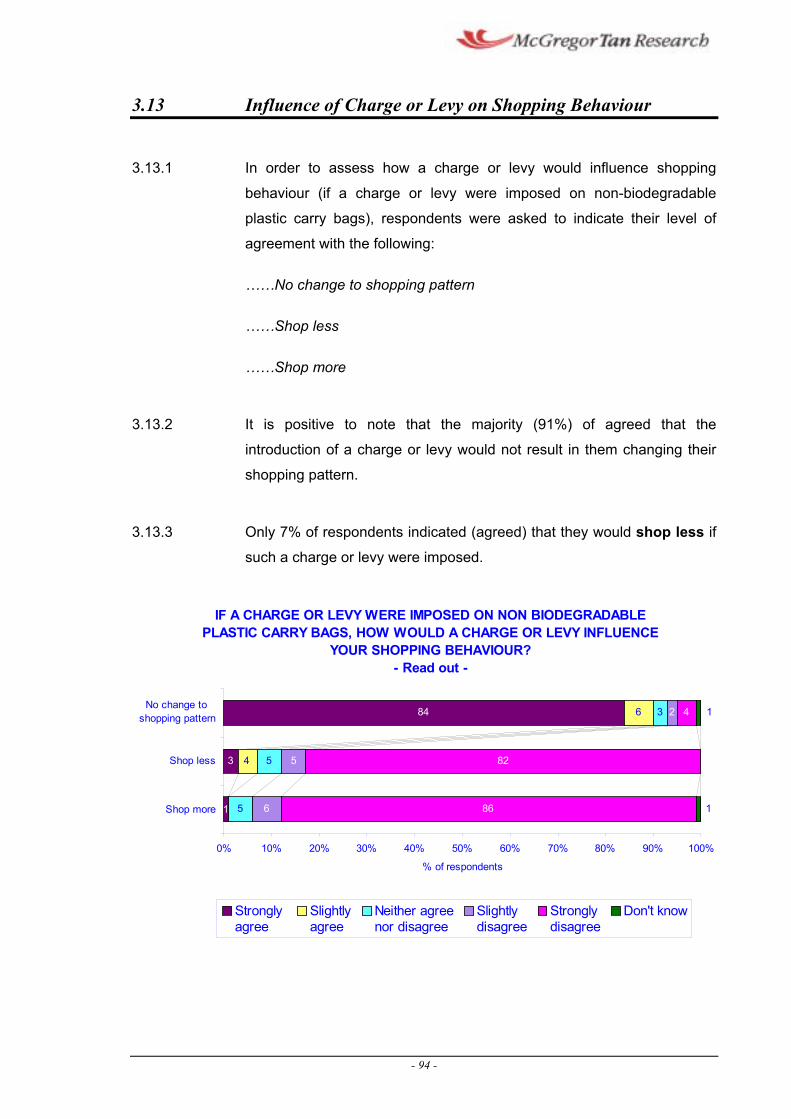
3.13 Influence of Charge or Levy on Shopping Behaviour
3.13.1 In order to assess how a charge or levy would influence shopping
behaviour (if a charge or levy were imposed on non-biodegradable
plastic carry bags), respondents were asked to indicate their level of
agreement with the following:
……No change to shopping pattern
……Shop less
……Shop more
3.13.2 It is positive to note that the majority (91%) of agreed that the
introduction of a charge or levy would not result in them changing their
shopping pattern.
3.13.3 Only 7% of respondents indicated (agreed) that they would shop less if
such a charge or levy were imposed.
IF A CHARGE OR LEVY WERE IMPOSED ON NON BIODEGRADABLE PLASTIC CARRY BAGS, HOW WOULD A CHARGE OR LEVY INFLUENCE
YOUR SHOPPING BEHAVIOUR? - Read out -
No change to 84 6
5
5
6
5
86
82
4
1
3 4
3 2 1shopping pattern
Shop less
1Shop more
0% 10% 20% 30% 40% 50% 60% 70% 80% 90% 100%
% of respondents
Slightly i SlightlyStrongly agree agree
Ne ther agree nor disagree disagree
Strongly disagree
Don't know
- 94 -
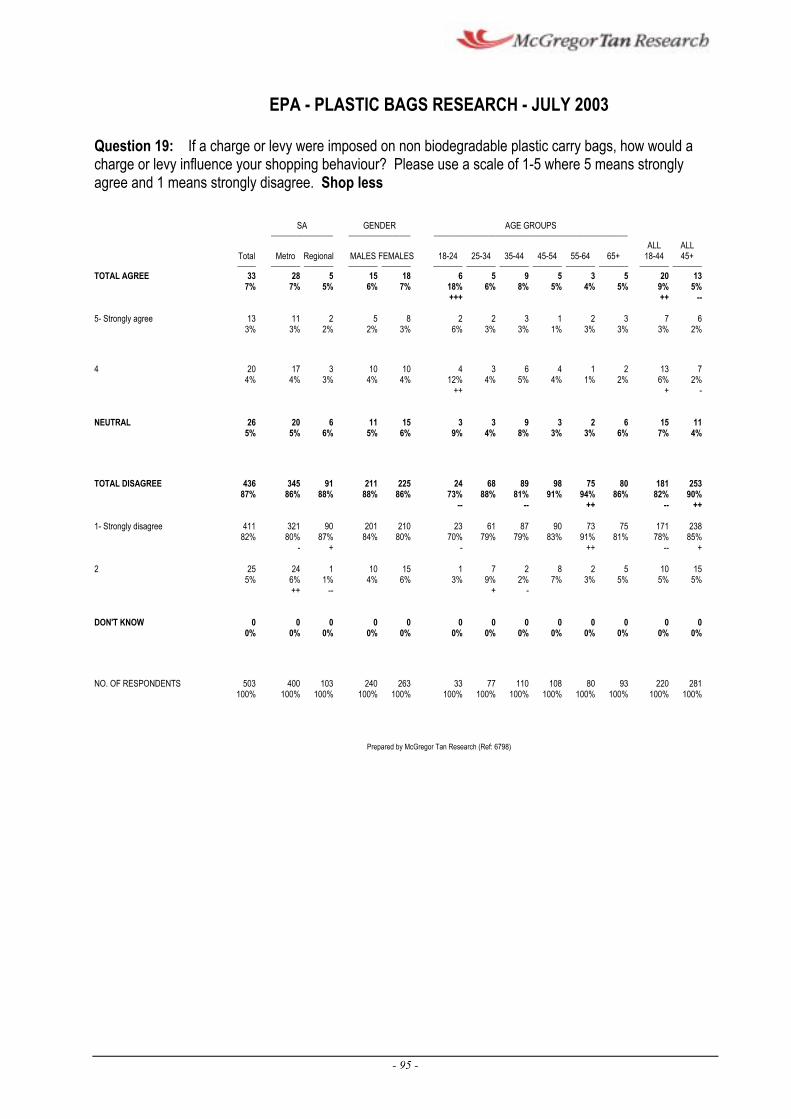
--
EPA - PLASTIC BAGS RESEARCH - JULY 2003
Question 19: If a charge or levy were imposed on non biodegradable plastic carry bags, how would a charge or levy influence your shopping behaviour? Please use a scale of 1-5 where 5 means strongly agree and 1 means strongly disagree. Shop less
SA GENDER AGE GROUPS œœœœœœœœœœœœœœœœœ œœœœœœœœœœœœœœœœœ œœœœœœœœœœœœœœœœœœœœœœœœœœœœœœœœœœœœœœœœœœœœœœœœœœœœœ
ALL ALL Total Metro Regional MALES FEMALES 18-24 25-34 35-44 45-54 55-64 65+ 18-44 45+ œœœœœ œœœœœœœœ œœœœœœœœ œœœœœœœœ œœœœœœœœ œœœœœœœœ œœœœœœœœ œœœœœœœœ œœœœœœœœ œœœœœœœœ œœœœœœœœ œœœœœœœœ œœœœœœœœ
TOTAL AGREE 33 28 5 15 18 6 5 9 5 3 5 20 13 7% 7% 5% 6% 7% 18% 6% 8% 5% 4% 5% 9% 5%
+++ ++
5- Strongly agree 13 3%
11 3%
2 2%
5 2%
8 3%
2 6%
2 3%
3 3%
1 1%
2 3%
3 3%
7 3%
6 2%
4 20 17 3 10 10 4 3 6 4 1 2 13 7 4% 4% 3% 4% 4% 12% 4% 5% 4% 1% 2% 6% 2%
++ + -
NEUTRAL 26 20 6 11 15 3 3 9 3 2 6 15 11 5% 5% 6% 5% 6% 9% 4% 8% 3% 3% 6% 7% 4%
TOTAL DISAGREE 436 345 91 211 225 24 68 89 98 75 80 181 25387% 86% 88% 88% 86% 73% 88% 81% 91% 94% 86% 82% 90%
-- -- ++ -- ++
1- Strongly disagree 411 321 90 201 210 82% 80% 87% 84% 80%
- +
23 61 87 90 73 75 171 238 70% 79% 79% 83% 91% 81% 78% 85%
- ++ -- +
2 25 24 1 5% 6% 1%
++ --
10 15 1 7 2 8 2 5 10 15 4% 6% 3% 9% 2% 7% 3% 5% 5% 5%
+ -
DON'T KNOW 0 0 0 0 0 0 0 0 0 0 0 0 0 0% 0% 0% 0% 0% 0% 0% 0% 0% 0% 0% 0% 0%
NO. OF RESPONDENTS 503 400 103 240 263 33 77 110 108 80 93 220 281 100% 100% 100% 100% 100% 100% 100% 100% 100% 100% 100% 100% 100%
Prepared by McGregor Tan Research (Ref: 6798)
- 95 -

EPA - PLASTIC BAGS RESEARCH - JULY 2003
Question 19: If a charge or levy were imposed on non biodegradable plastic carry bags, how would a charge or levy influence your shopping behaviour? Please use a scale of 1-5 where 5 means strongly agree and 1 means strongly disagree. Shop less
OCCUPATION EMPLOYMENT œœœœœœœœœœœœœœœœœœœœœœœœœœœœœœœœœœœœœœœœœœœœœœœœœœœœœœœœœœœœœœœœœœœœœœœœœœœœœœœœœœœ œœœœœœœœœœœœœœœœœœœœœœœ
Unemployed Paid Looking Home Retired/ Other In paid Not in
Total Employee for work Student Duties Pensioner Pensioner Other work pd work œœœœœ œœœœœœœœœœœ œœœœœœœœœœœ œœœœœœœœœœœ œœœœœœœœœœœ œœœœœœœœœœœ œœœœœœœœœœœ œœœœœœœœœœœ œœœœœœœœœœœ œœœœœœœœœœœ
TOTAL AGREE 33 20 1 3 3 6 0 0 20 12 7% 7% 14% 16% 4% 6% 0% 0% 7% 6%
5- Strongly agree 13 6 1 1 1 4 0 0 6 6 3% 2% 14% 5% 1% 4% 0% 0% 2% 3%
4 20 14 0 2 2 2 0 0 14 6 4% 5% 0% 11% 3% 2% 0% 0% 5% 3%
NEUTRAL 26 13 0 1 5 6 1 0 13 13 5% 5% 0% 5% 7% 6% 8% 0% 5% 6%
TOTAL DISAGREE 436 247 6 15 63 90 11 4 247 183 87% 87% 86% 79% 84% 87% 92% 100% 87% 86%
1- Strongly disagree 411 229 6 15 62 85 10 4 229 176 82% 81% 86% 79% 83% 83% 83% 100% 81% 83%
2 25 18 0 0 1 5 1 0 18 7 5% 6% 0% 0% 1% 5% 8% 0% 6% 3%
DON'T KNOW 0 0 0 0 0 0 0 0 0 0 0% 0% 0% 0% 0% 0% 0% 0% 0% 0%
NO. OF RESPONDENTS 503 283 7 19 75 103 12 4 283 213 100% 100% 100% 100% 100% 100% 100% 100% 100% 100%
Prepared by McGregor Tan Research (Ref: 6798)
- 96 -
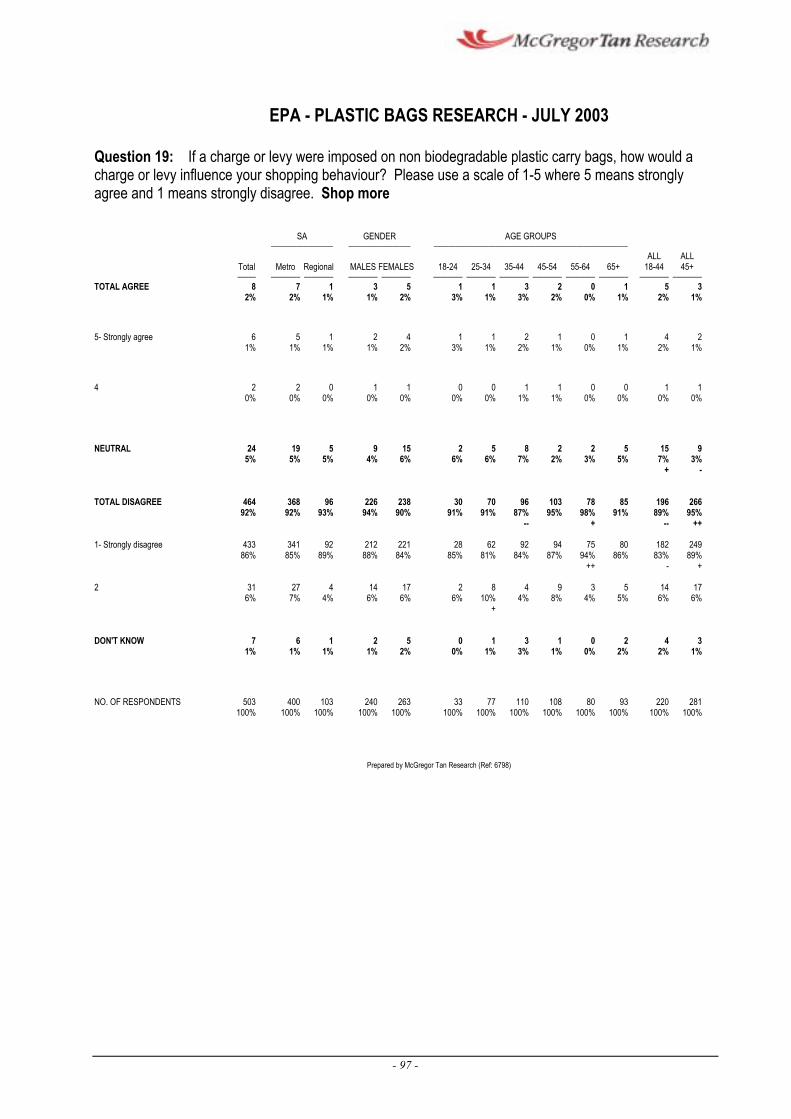
EPA - PLASTIC BAGS RESEARCH - JULY 2003
Question 19: If a charge or levy were imposed on non biodegradable plastic carry bags, how would a charge or levy influence your shopping behaviour? Please use a scale of 1-5 where 5 means strongly agree and 1 means strongly disagree. Shop more
SA GENDER AGE GROUPS œœœœœœœœœœœœœœœœœ œœœœœœœœœœœœœœœœœ œœœœœœœœœœœœœœœœœœœœœœœœœœœœœœœœœœœœœœœœœœœœœœœœœœœœœ
ALL ALL Total Metro Regional MALES FEMALES 18-24 25-34 35-44 45-54 55-64 65+ 18-44 45+ œœœœœ œœœœœœœœ œœœœœœœœ œœœœœœœœ œœœœœœœœ œœœœœœœœ œœœœœœœœ œœœœœœœœ œœœœœœœœ œœœœœœœœ œœœœœœœœ œœœœœœœœ œœœœœœœœ
TOTAL AGREE 8 7 1 3 5 1 1 3 2 0 1 5 3 2% 2% 1% 1% 2% 3% 1% 3% 2% 0% 1% 2% 1%
5- Strongly agree 6 5 1 2 4 1 1 2 1 0 1 4 2 1% 1% 1% 1% 2% 3% 1% 2% 1% 0% 1% 2% 1%
4 2 2 0 1 1 0 0 1 1 0 0 1 1 0% 0% 0% 0% 0% 0% 0% 1% 1% 0% 0% 0% 0%
NEUTRAL 24 19 5 9 15 2 5 8 2 2 5 15 95% 5% 5% 4% 6% 6% 6% 7% 2% 3% 5% 7% 3%
+ -
TOTAL DISAGREE 464 368 96 226 238 30 70 96 103 78 85 196 26692% 92% 93% 94% 90% 91% 91% 87% 95% 98% 91% 89% 95%
-- + -- ++
1- Strongly disagree 433 341 92 212 221 28 62 92 94 75 80 182 24986% 85% 89% 88% 84% 85% 81% 84% 87% 94% 86% 83% 89%
++ - +
2 31 27 4 14 17 2 8 4 9 3 5 14 17 6% 7% 4% 6% 6% 6% 10% 4% 8% 4% 5% 6% 6%
+
DON'T KNOW 7 6 1 2 5 0 1 3 1 0 2 4 3 1% 1% 1% 1% 2% 0% 1% 3% 1% 0% 2% 2% 1%
NO. OF RESPONDENTS 503 400 103 240 263 33 77 110 108 80 93 220 281 100% 100% 100% 100% 100% 100% 100% 100% 100% 100% 100% 100% 100%
Prepared by McGregor Tan Research (Ref: 6798)
- 97 -

EPA - PLASTIC BAGS RESEARCH - JULY 2003
Question 19: If a charge or levy were imposed on non biodegradable plastic carry bags, how would a charge or levy influence your shopping behaviour? Please use a scale of 1-5 where 5 means strongly agree and 1 means strongly disagree. Shop more
OCCUPATION EMPLOYMENT œœœœœœœœœœœœœœœœœœœœœœœœœœœœœœœœœœœœœœœœœœœœœœœœœœœœœœœœœœœœœœœœœœœœœœœœœœœœœœœœœœœ œœœœœœœœœœœœœœœœœœœœœœœ
Unemployed Paid Looking Home Retired/ Other In paid Not in
Total Employee for work Student Duties Pensioner Pensioner Other work pd work œœœœœ œœœœœœœœœœœ œœœœœœœœœœœ œœœœœœœœœœœ œœœœœœœœœœœ œœœœœœœœœœœ œœœœœœœœœœœ œœœœœœœœœœœ œœœœœœœœœœœ œœœœœœœœœœœ
TOTAL AGREE 8 4 0 1 2 1 0 0 4 4 2% 1% 0% 5% 3% 1% 0% 0% 1% 2%
5- Strongly agree 6 3 0 0 2 1 0 0 3 3 1% 1% 0% 0% 3% 1% 0% 0% 1% 1%
4 2 1 0 1 0 0 0 0 1 1 0% 0% 0% 5% 0% 0% 0% 0% 0% 0%
NEUTRAL 24 11 0 2 4 6 1 0 11 13 5% 4% 0% 11% 5% 6% 8% 0% 4% 6%
TOTAL DISAGREE 464 266 92% 94%
+
7 16 65 95 11 4 266 191 100% 84% 87% 92% 92% 100% 94% 90%
- + -
1- Strongly disagree 433 245 6 15 64 88 11 4 245 182 86% 87% 86% 79% 85% 85% 92% 100% 87% 85%
2 31 21 1 1 1 7 0 0 21 9 6% 7% 14% 5% 1% 7% 0% 0% 7% 4%
-
DON'T KNOW 7 2 0 0 4 1 0 0 2 5 1% 1% 0% 0% 5% 1% 0% 0% 1% 2%
+++
NO. OF RESPONDENTS 503 283 7 19 75 103 12 4 283 213 100% 100% 100% 100% 100% 100% 100% 100% 100% 100%
Prepared by McGregor Tan Research (Ref: 6798)
- 98 -
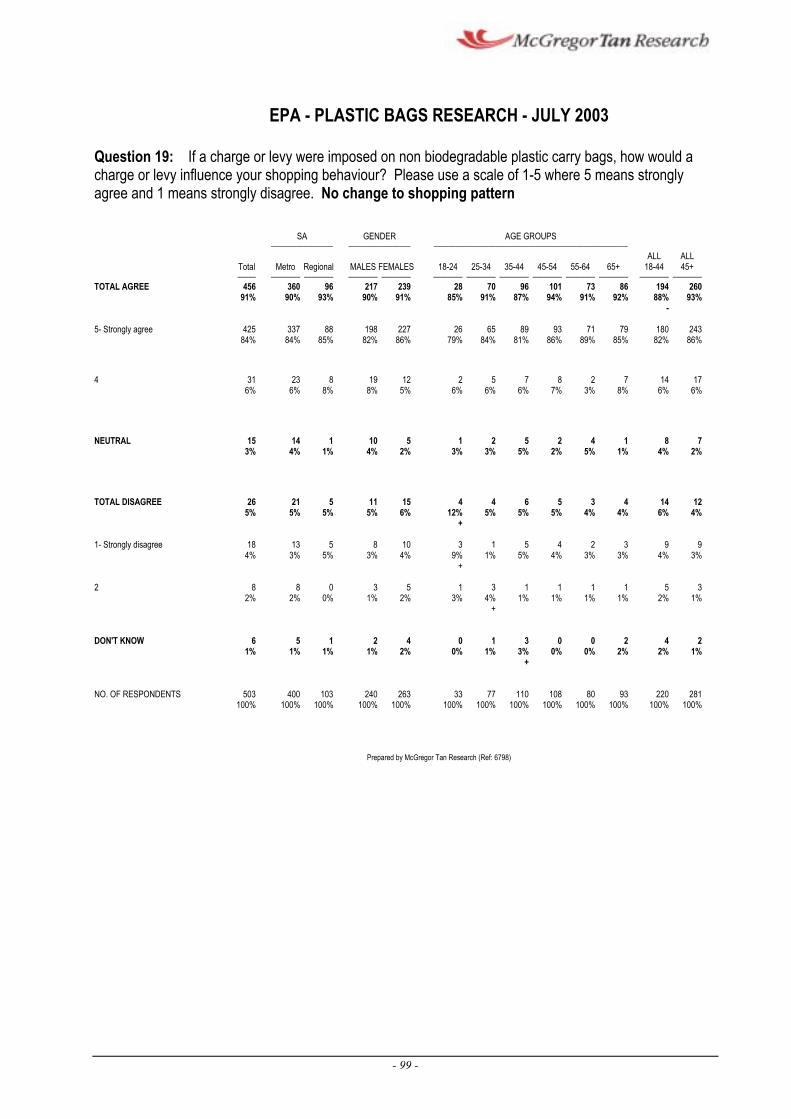
EPA - PLASTIC BAGS RESEARCH - JULY 2003
Question 19: If a charge or levy were imposed on non biodegradable plastic carry bags, how would a charge or levy influence your shopping behaviour? Please use a scale of 1-5 where 5 means strongly agree and 1 means strongly disagree. No change to shopping pattern
SA GENDER AGE GROUPS œœœœœœœœœœœœœœœœœ œœœœœœœœœœœœœœœœœ œœœœœœœœœœœœœœœœœœœœœœœœœœœœœœœœœœœœœœœœœœœœœœœœœœœœœ
ALL ALL Total Metro Regional MALES FEMALES 18-24 25-34 35-44 45-54 55-64 65+ 18-44 45+ œœœœœ œœœœœœœœ œœœœœœœœ œœœœœœœœ œœœœœœœœ œœœœœœœœ œœœœœœœœ œœœœœœœœ œœœœœœœœ œœœœœœœœ œœœœœœœœ œœœœœœœœ œœœœœœœœ
TOTAL AGREE 456 360 96 217 239 28 70 96 101 73 86 194 260 91% 90% 93% 90% 91% 85% 91% 87% 94% 91% 92% 88% 93%
-
5- Strongly agree 425 84%
337 84%
88 85%
198 82%
227 86%
26 79%
65 84%
89 81%
93 86%
71 89%
79 85%
180 82%
243 86%
4 31 23 8 19 12 2 5 7 8 2 7 14 17 6% 6% 8% 8% 5% 6% 6% 6% 7% 3% 8% 6% 6%
NEUTRAL 15 14 1 10 5 1 2 5 2 4 1 8 7 3% 4% 1% 4% 2% 3% 3% 5% 2% 5% 1% 4% 2%
TOTAL DISAGREE 26 21 5 11 15 4 4 6 5 3 4 14 12 5% 5% 5% 5% 6% 12% 5% 5% 5% 4% 4% 6% 4%
+
1- Strongly disagree 18 13 5 8 10 3 1 5 4 2 3 9 9 4% 3% 5% 3% 4% 9% 1% 5% 4% 3% 3% 4% 3%
+
2 8 8 0 3 5 1 3 1 1 1 1 5 3 2% 2% 0% 1% 2% 3% 4% 1% 1% 1% 1% 2% 1%
+
DON'T KNOW 6 5 1 2 4 0 1 3 0 0 2 4 2 1% 1% 1% 1% 2% 0% 1% 3% 0% 0% 2% 2% 1%
+
NO. OF RESPONDENTS 503 400 103 240 263 33 77 110 108 80 93 220 281 100% 100% 100% 100% 100% 100% 100% 100% 100% 100% 100% 100% 100%
Prepared by McGregor Tan Research (Ref: 6798)
- 99 -
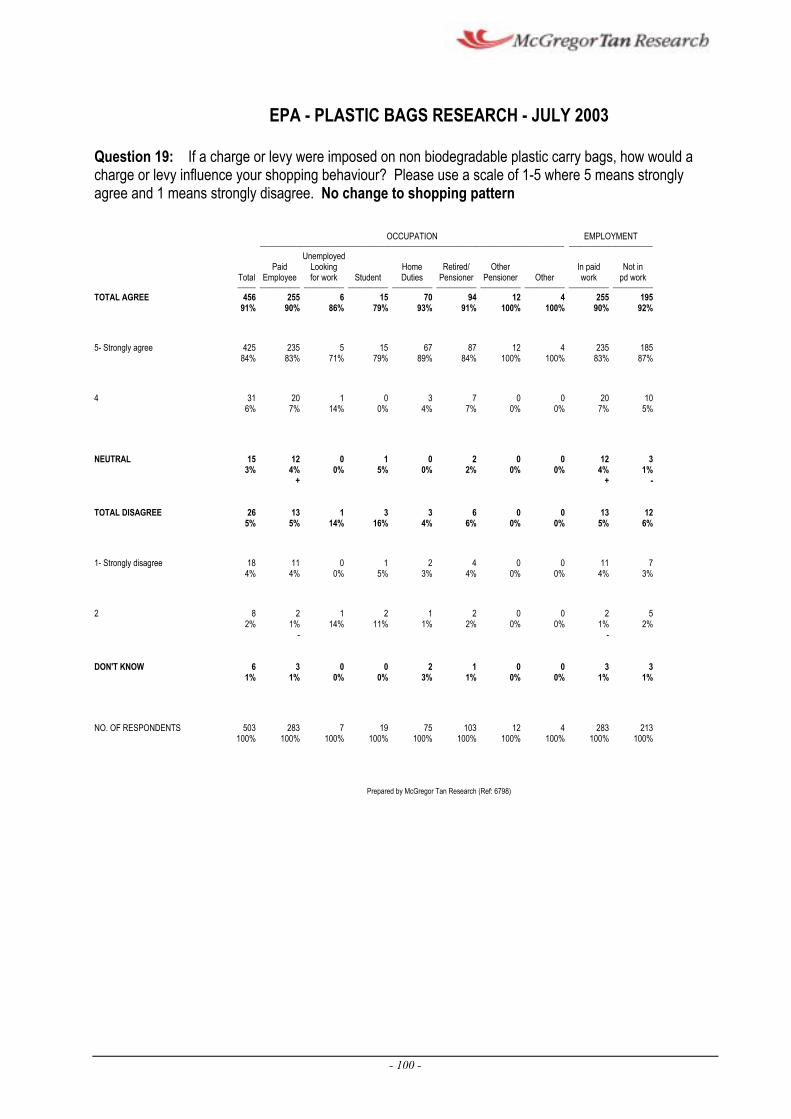
- -
EPA - PLASTIC BAGS RESEARCH - JULY 2003
Question 19: If a charge or levy were imposed on non biodegradable plastic carry bags, how would a charge or levy influence your shopping behaviour? Please use a scale of 1-5 where 5 means strongly agree and 1 means strongly disagree. No change to shopping pattern
OCCUPATION EMPLOYMENT œœœœœœœœœœœœœœœœœœœœœœœœœœœœœœœœœœœœœœœœœœœœœœœœœœœœœœœœœœœœœœœœœœœœœœœœœœœœœœœœœœœ œœœœœœœœœœœœœœœœœœœœœœœ
Unemployed Paid Looking Home Retired/ Other In paid Not in
Total Employee for work Student Duties Pensioner Pensioner Other work pd work œœœœœ œœœœœœœœœœœ œœœœœœœœœœœ œœœœœœœœœœœ œœœœœœœœœœœ œœœœœœœœœœœ œœœœœœœœœœœ œœœœœœœœœœœ œœœœœœœœœœœ œœœœœœœœœœœ
TOTAL AGREE 456 255 6 15 70 94 12 4 255 195 91% 90% 86% 79% 93% 91% 100% 100% 90% 92%
5- Strongly agree 425 235 5 15 67 87 12 4 235 185 84% 83% 71% 79% 89% 84% 100% 100% 83% 87%
4 31 20 1 0 3 7 0 0 20 10 6% 7% 14% 0% 4% 7% 0% 0% 7% 5%
NEUTRAL 15 12 3% 4%
+
0 1 0 2 0 0 12 3 0% 5% 0% 2% 0% 0% 4% 1%
+ -
TOTAL DISAGREE 26 13 1 3 3 6 0 0 13 12 5% 5% 14% 16% 4% 6% 0% 0% 5% 6%
1- Strongly disagree 18 11 0 1 2 4 0 0 11 7 4% 4% 0% 5% 3% 4% 0% 0% 4% 3%
2 8 2 1 2 1 2 0 0 2 5 2% 1% 14% 11% 1% 2% 0% 0% 1% 2%
DON'T KNOW 6 3 0 0 2 1 0 0 3 3 1% 1% 0% 0% 3% 1% 0% 0% 1% 1%
NO. OF RESPONDENTS 503 283 7 19 75 103 12 4 283 213 100% 100% 100% 100% 100% 100% 100% 100% 100% 100%
Prepared by McGregor Tan Research (Ref: 6798)
- 100 -
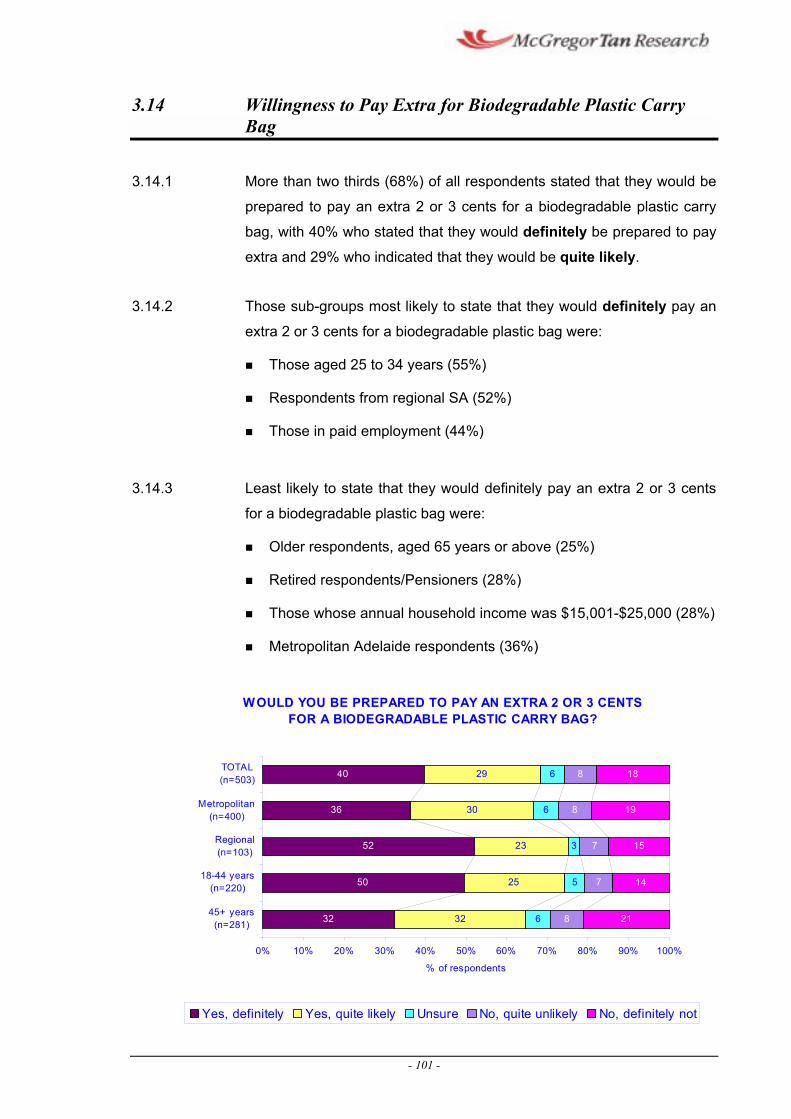
3.14 Willingness to Pay Extra for Biodegradable Plastic Carry Bag
3.14.1 More than two thirds (68%) of all respondents stated that they would be
prepared to pay an extra 2 or 3 cents for a biodegradable plastic carry
bag, with 40% who stated that they would definitely be prepared to pay
extra and 29% who indicated that they would be quite likely.
3.14.2 Those sub-groups most likely to state that they would definitely pay an
extra 2 or 3 cents for a biodegradable plastic bag were:
¢ Those aged 25 to 34 years (55%)
¢ Respondents from regional SA (52%)
¢ Those in paid employment (44%)
3.14.3 Least likely to state that they would definitely pay an extra 2 or 3 cents
for a biodegradable plastic bag were:
¢ Older respondents, aged 65 years or above (25%)
¢ Retired respondents/Pensioners (28%)
¢ Those whose annual household income was $15,001-$25,000 (28%)
¢ Metropolitan Adelaide respondents (36%)
W OULD YOU BE PREPARED TO PAY AN EXTRA 2 OR 3 CENTS FOR A BIODEGRADABLE PLASTIC CARRY BAG?
TOTA L(n=503)
Metropolitan(n=400)
Regional(n=103)
18-44 years(n=220)
45+ years(n=281) 32
50
52
36
40
32
25
23
30
29
6
5
6
6
8
7
7
8
8
21
14
15
19
18
3
0% 10% 20% 30% 40% 50% 60% 70% 80% 90% 100%
% of respondents
ini i likely i i iniYes, def tely Yes, qu te Unsure No, qu te unl kely No, def tely not
- 101 -
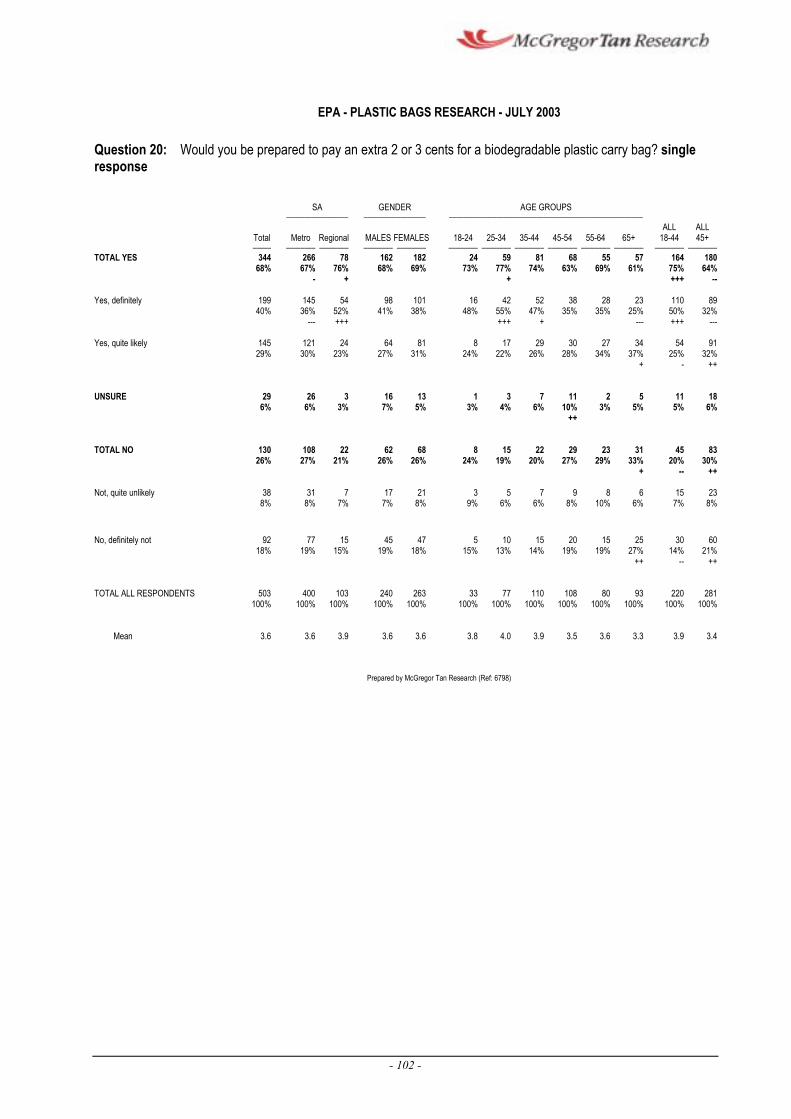
EPA - PLASTIC BAGS RESEARCH - JULY 2003
Question 20: Would you be prepared to pay an extra 2 or 3 cents for a biodegradable plastic carry bag? single response
SA GENDER AGE GROUPS œœœœœœœœœœœœœœœœœ œœœœœœœœœœœœœœœœœ œœœœœœœœœœœœœœœœœœœœœœœœœœœœœœœœœœœœœœœœœœœœœœœœœœœœœ
ALL ALL Total Metro Regional MALES FEMALES 18-24 25-34 35-44 45-54 55-64 65+ 18-44 45+ œœœœœ œœœœœœœœ œœœœœœœœ œœœœœœœœ œœœœœœœœ œœœœœœœœ œœœœœœœœ œœœœœœœœ œœœœœœœœ œœœœœœœœ œœœœœœœœ œœœœœœœœ œœœœœœœœ
TOTAL YES 344 266 78 68% 67% 76%
- +
162 182 24 59 81 68 55 57 164 180 68% 69% 73% 77% 74% 63% 69% 61% 75% 64%
+ +++ --
Yes, definitely 199 145 54 98 101 40% 36% 52% 41% 38%
--- +++
16 42 52 38 28 23 110 8948% 55% 47% 35% 35% 25% 50% 32%
+++ + --- +++ ---
Yes, quite likely 145 121 24 64 81 8 17 29 30 27 34 54 9129% 30% 23% 27% 31% 24% 22% 26% 28% 34% 37% 25% 32%
+ - ++
UNSURE 29 26 3 16 13 1 3 7 11 2 5 11 18 6% 6% 3% 7% 5% 3% 4% 6% 10% 3% 5% 5% 6%
++
TOTAL NO 130 108 22 62 68 8 15 22 29 23 31 45 8326% 27% 21% 26% 26% 24% 19% 20% 27% 29% 33% 20% 30%
+ -- ++
Not, quite unlikely 38 31 7 17 21 3 5 7 9 8 6 15 23 8% 8% 7% 7% 8% 9% 6% 6% 8% 10% 6% 7% 8%
No, definitely not 92 77 15 45 47 5 10 15 20 15 25 30 6018% 19% 15% 19% 18% 15% 13% 14% 19% 19% 27% 14% 21%
++ -- ++
TOTAL ALL RESPONDENTS 503 400 103 240 263 33 77 110 108 80 93 220 281 100% 100% 100% 100% 100% 100% 100% 100% 100% 100% 100% 100% 100%
Mean 3.6 3.6 3.9 3.6 3.6 3.8 4.0 3.9 3.5 3.6 3.3 3.9 3.4
Prepared by McGregor Tan Research (Ref: 6798)
- 102 -
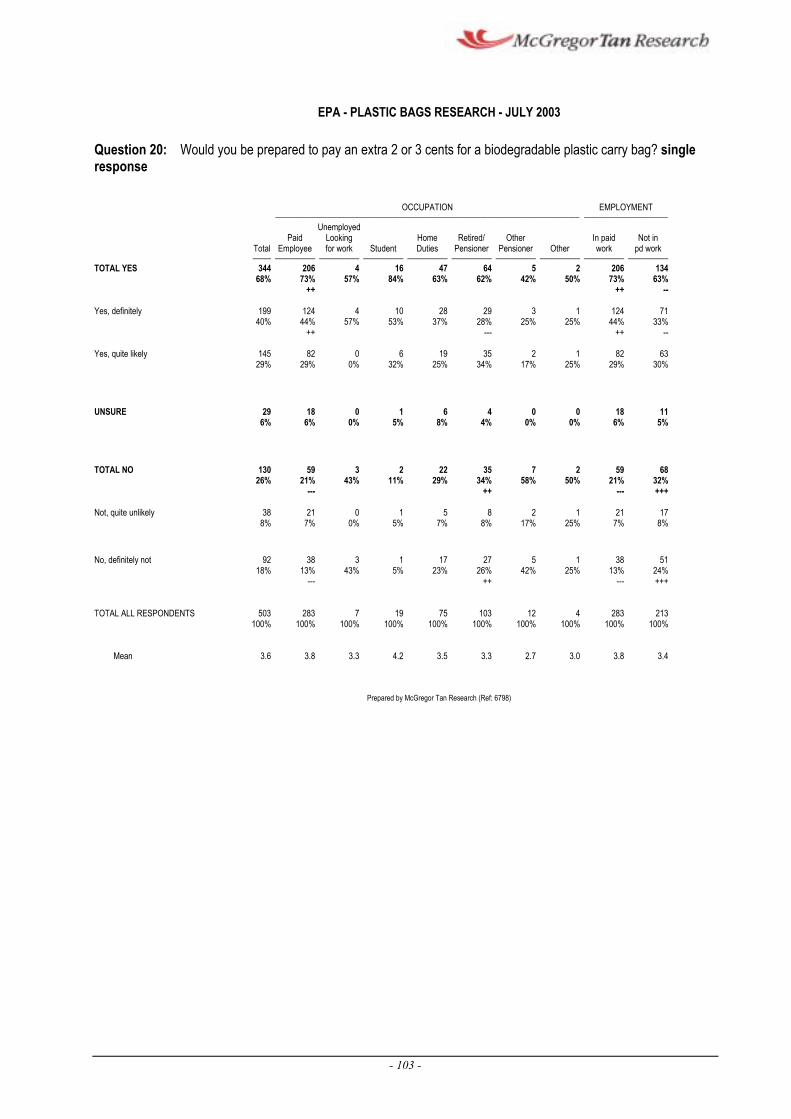
--
--- --
EPA - PLASTIC BAGS RESEARCH - JULY 2003
Question 20: Would you be prepared to pay an extra 2 or 3 cents for a biodegradable plastic carry bag? single response
OCCUPATION EMPLOYMENT œœœœœœœœœœœœœœœœœœœœœœœœœœœœœœœœœœœœœœœœœœœœœœœœœœœœœœœœœœœœœœœœœœœœœœœœœœœœœœœœœœœ œœœœœœœœœœœœœœœœœœœœœœœ
Unemployed Paid Looking Home Retired/ Other In paid Not in
Total Employee for work Student Duties Pensioner Pensioner Other work pd work œœœœœ œœœœœœœœœœœ œœœœœœœœœœœ œœœœœœœœœœœ œœœœœœœœœœœ œœœœœœœœœœœ œœœœœœœœœœœ œœœœœœœœœœœ œœœœœœœœœœœ œœœœœœœœœœœ
TOTAL YES 344 206 4 16 47 64 5 2 206 134 68% 73% 57% 84% 63% 62% 42% 50% 73% 63%
++ ++
Yes, definitely 199 40%
124 44%
4 57%
10 53%
28 37%
29 28%
3 25%
1 25%
124 44%
71 33%
++ ++
Yes, quite likely 145 29%
82 29%
0 0%
6 32%
19 25%
35 34%
2 17%
1 25%
82 29%
63 30%
UNSURE 29 18 0 1 6 4 0 0 18 11 6% 6% 0% 5% 8% 4% 0% 0% 6% 5%
TOTAL NO 130 59 26% 21%
---
3 2 22 35 7 2 59 68 43% 11% 29% 34% 58% 50% 21% 32%
++ --- +++
Not, quite unlikely 38 21 0 1 5 8 2 1 21 17 8% 7% 0% 5% 7% 8% 17% 25% 7% 8%
No, definitely not 92 38 3 18% 13% 43%
---
1 17 27 5 1 38 51 5% 23% 26% 42% 25% 13% 24%
++ --- +++
TOTAL ALL RESPONDENTS 503 283 7 19 75 103 12 4 283 213 100% 100% 100% 100% 100% 100% 100% 100% 100% 100%
Mean 3.6 3.8 3.3 4.2 3.5 3.3 2.7 3.0 3.8 3.4
Prepared by McGregor Tan Research (Ref: 6798)
- 103 -
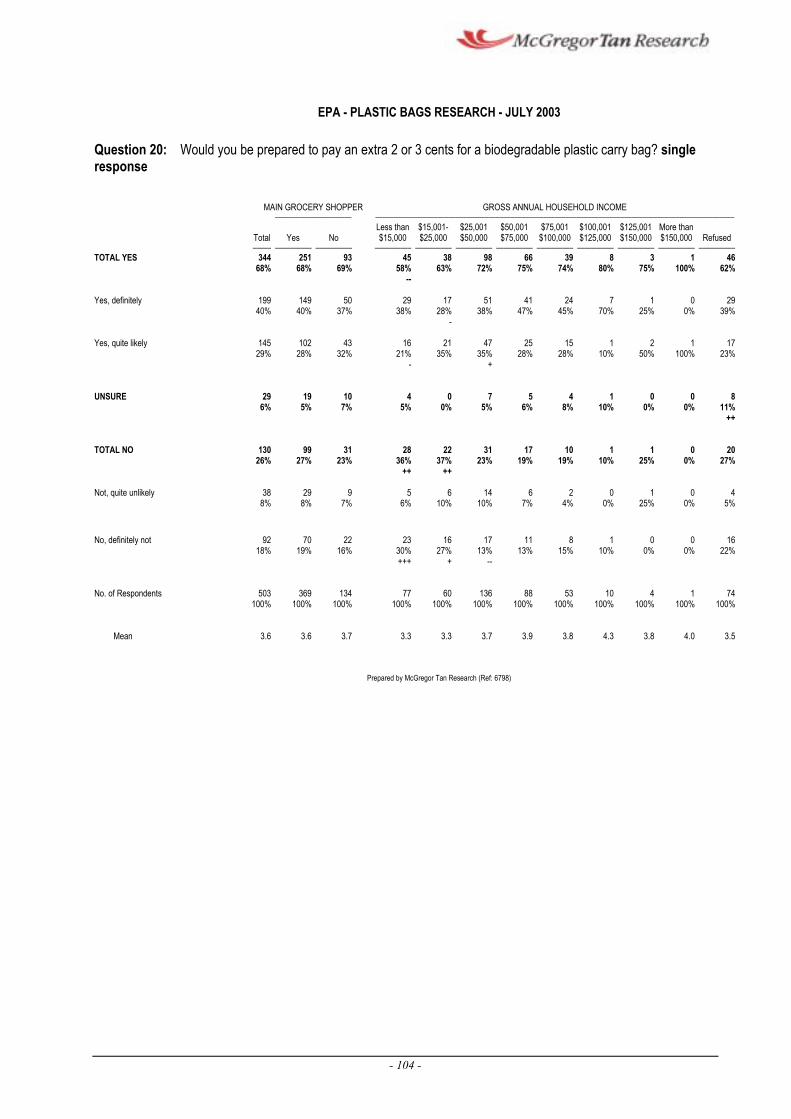
--
EPA - PLASTIC BAGS RESEARCH - JULY 2003
Question 20: Would you be prepared to pay an extra 2 or 3 cents for a biodegradable plastic carry bag? single response
MAIN GROCERY SHOPPER GROSS ANNUAL HOUSEHOLD INCOME œœœœœœœœœœœœœœœœœœœœœ œœœœœœœœœœœœœœœœœœœœœœœœœœœœœœœœœœœœœœœœœœœœœœœœœœœœœœœœœœœœœœœœœœœœœœœœœœœœœœœœœœœœœœœœœœœœœœœœœœ
Less than $15,001- $25,001 $50,001 $75,001 $100,001 $125,001 More than Total Yes No $15,000 $25,000 $50,000 $75,000 $100,000 $125,000 $150,000 $150,000 Refused œœœœœ œœœœœœœœœœ œœœœœœœœœœ œœœœœœœœœœ œœœœœœœœœœ œœœœœœœœœœ œœœœœœœœœœ œœœœœœœœœœ œœœœœœœœœœ œœœœœœœœœœ œœœœœœœœœœ œœœœœœœœœœ
TOTAL YES 344 251 93 45 38 98 66 39 8 3 1 46 68% 68% 69% 58% 63% 72% 75% 74% 80% 75% 100% 62%
Yes, definitely 199 149 50 29 17 51 41 24 7 1 0 29 40% 40% 37% 38% 28% 38% 47% 45% 70% 25% 0% 39%
-
Yes, quite likely 145 102 43 16 21 47 25 15 1 2 1 17 29% 28% 32% 21% 35% 35% 28% 28% 10% 50% 100% 23%
- +
UNSURE 29 19 10 4 0 7 5 4 1 0 0 86% 5% 7% 5% 0% 5% 6% 8% 10% 0% 0% 11%
++
TOTAL NO 130 99 31 28 26% 27% 23% 36%
++
22 31 17 10 1 1 0 20 37% 23% 19% 19% 10% 25% 0% 27%
++
Not, quite unlikely 38 29 9 5 6 14 6 2 0 1 0 4 8% 8% 7% 6% 10% 10% 7% 4% 0% 25% 0% 5%
No, definitely not 92 70 22 23 16 17 11 8 1 0 0 16 18% 19% 16% 30% 27% 13% 13% 15% 10% 0% 0% 22%
+++ + --
No. of Respondents 503 369 134 77 60 136 88 53 10 4 1 74 100% 100% 100% 100% 100% 100% 100% 100% 100% 100% 100% 100%
Mean 3.6 3.6 3.7 3.3 3.3 3.7 3.9 3.8 4.3 3.8 4.0 3.5
Prepared by McGregor Tan Research (Ref: 6798)
- 104 -
3.15 Informed Preference for Ban or Levy
3.15.1 All respondents were told:
The major difference between a ban on plastic carry bags as
opposed to a charge or levy is that a ban is a once-off solution that
seeks to take the offending plastic carry bags out of circulation,
while a charge or levy is an on-going tax to minimise the number of
plastic carry bags in use. Both have their advantages and
disadvantages.
Respondents were then asked to think about the issue in more depth
and were asked if they would prefer to see:
……A ban on non-biodegradable plastic carry bags with environment
friendly alternative bags made available to the public.
…….A charge or levy on plastic carry bags at the point of sale.
3.15.2 Almost three quarters (73%) of all respondents preferred the ban over
the charge or levy (21%) option with another 6% of respondents who
were not sure.
- 105 -
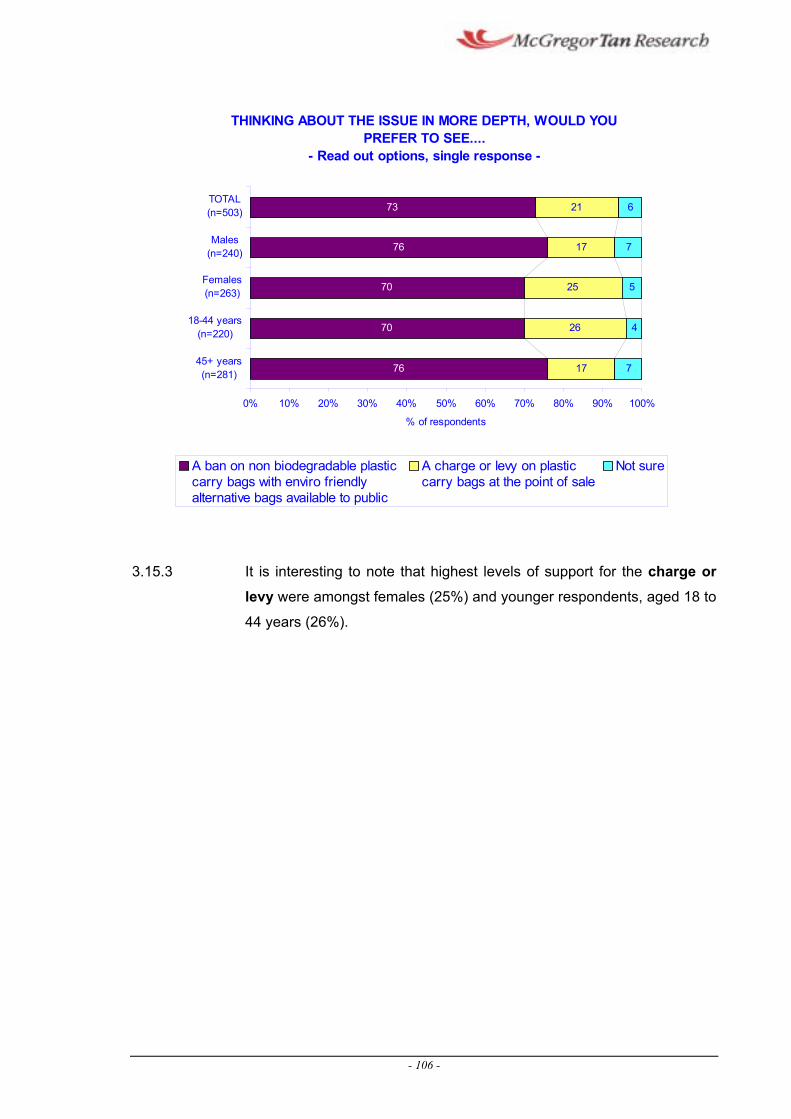
THINKING ABOUT THE ISSUE IN MORE DEPTH, WOULD YOU PREFER TO SEE....
- Read out options, single response -
76
70
70
76
73
17
26
25
17
21
7
4
5
7
6
(
(
(
(
(
45+ years n=281)
18-44 years n=220)
Females n=263)
Males n=240)
TOTAL n=503)
0% 10% 20% 30% 40% 50% 60% 70% 80% 90% 100%
% of respondents
ic i i i
i l ic
l icA ban on non biodegradable plastcarry bags w th env ro fr endly alternat ve bags avai able to publ
A charge or evy on plastcarry bags at the point of sale
Not sure
3.15.3 It is interesting to note that highest levels of support for the charge or levy were amongst females (25%) and younger respondents, aged 18 to
44 years (26%).
- 106 -
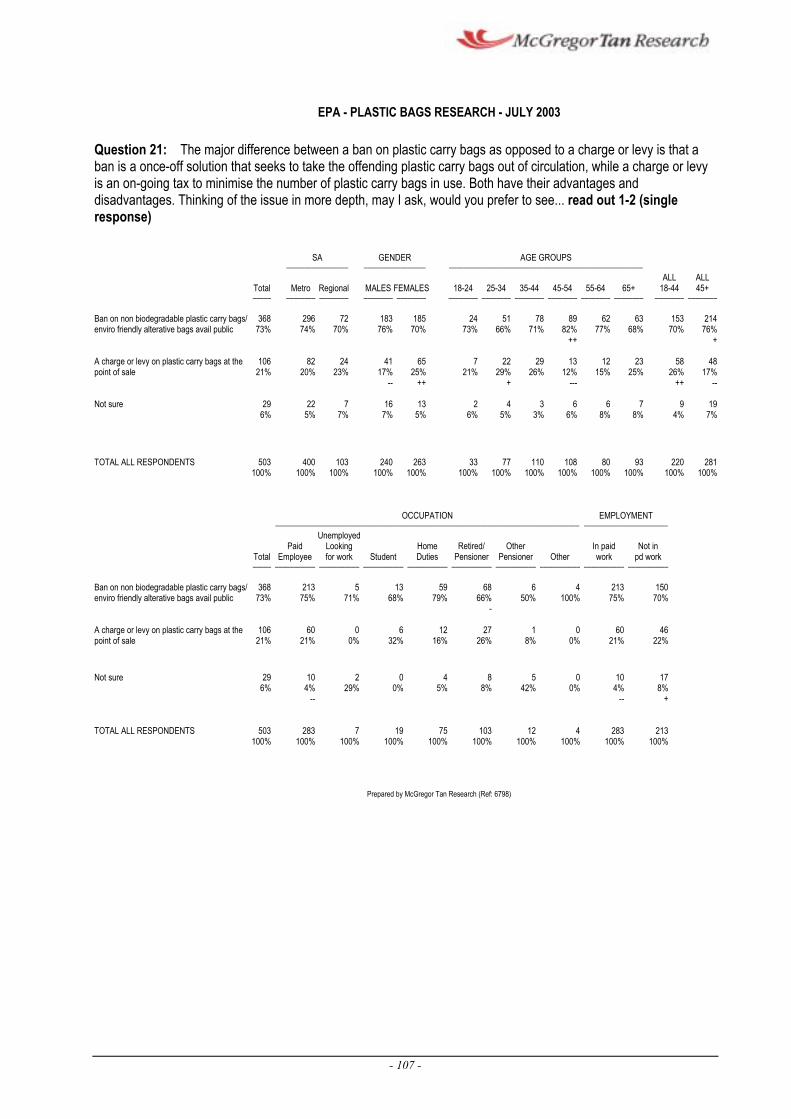
-- --- --
EPA - PLASTIC BAGS RESEARCH - JULY 2003
Question 21: The major difference between a ban on plastic carry bags as opposed to a charge or levy is that a ban is a once-off solution that seeks to take the offending plastic carry bags out of circulation, while a charge or levy is an on-going tax to minimise the number of plastic carry bags in use. Both have their advantages and disadvantages. Thinking of the issue in more depth, may I ask, would you prefer to see... read out 1-2 (single response)
SA GENDER AGE GROUPS œœœœœœœœœœœœœœœœœ œœœœœœœœœœœœœœœœœ œœœœœœœœœœœœœœœœœœœœœœœœœœœœœœœœœœœœœœœœœœœœœœœœœœœœœ
ALL ALL Total Metro Regional MALES FEMALES 18-24 25-34 35-44 45-54 55-64 65+ 18-44 45+ œœœœœ œœœœœœœœ œœœœœœœœ œœœœœœœœ œœœœœœœœ œœœœœœœœ œœœœœœœœ œœœœœœœœ œœœœœœœœ œœœœœœœœ œœœœœœœœ œœœœœœœœ œœœœœœœœ
Ban on non biodegradable plastic carry bags/ enviro friendly alterative bags avail public
368 73%
296 74%
72 70%
183 76%
185 70%
24 73%
51 66%
78 71%
89 82%
62 77%
63 68%
153 70%
214 76%
++ +
A charge or levy on plastic carry bags at the point of sale
106 21%
82 20%
24 23%
41 17%
65 25%
7 21%
22 29%
29 26%
13 12%
12 15%
23 25%
58 26%
48 17%
++ + ++
Not sure 29 22 7 16 13 2 4 3 6 6 7 9 19 6% 5% 7% 7% 5% 6% 5% 3% 6% 8% 8% 4% 7%
TOTAL ALL RESPONDENTS 503 400 103 240 263 33 77 110 108 80 93 220 281 100% 100% 100% 100% 100% 100% 100% 100% 100% 100% 100% 100% 100%
OCCUPATION EMPLOYMENT œœœœœœœœœœœœœœœœœœœœœœœœœœœœœœœœœœœœœœœœœœœœœœœœœœœœœœœœœœœœœœœœœœœœœœœœœœœœœœœœœœœ œœœœœœœœœœœœœœœœœœœœœœœ
Unemployed Paid Looking Home Retired/ Other In paid Not in
Total Employee for work Student Duties Pensioner Pensioner Other work pd work œœœœœ œœœœœœœœœœœ œœœœœœœœœœœ œœœœœœœœœœœ œœœœœœœœœœœ œœœœœœœœœœœ œœœœœœœœœœœ œœœœœœœœœœœ œœœœœœœœœœœ œœœœœœœœœœœ
Ban on non biodegradable plastic carry bags/ 368 213 5 13 59 68 6 4 213 150 enviro friendly alterative bags avail public 73% 75% 71% 68% 79% 66% 50% 100% 75% 70%
-
A charge or levy on plastic carry bags at the 106 60 0 6 12 27 1 0 60 46 point of sale 21% 21% 0% 32% 16% 26% 8% 0% 21% 22%
Not sure 29 10 6% 4%
--
2 0 4 8 5 0 10 17 29% 0% 5% 8% 42% 0% 4% 8%
-- +
TOTAL ALL RESPONDENTS 503 283 7 19 75 103 12 4 283 213 100% 100% 100% 100% 100% 100% 100% 100% 100% 100%
Prepared by McGregor Tan Research (Ref: 6798)
- 107 -
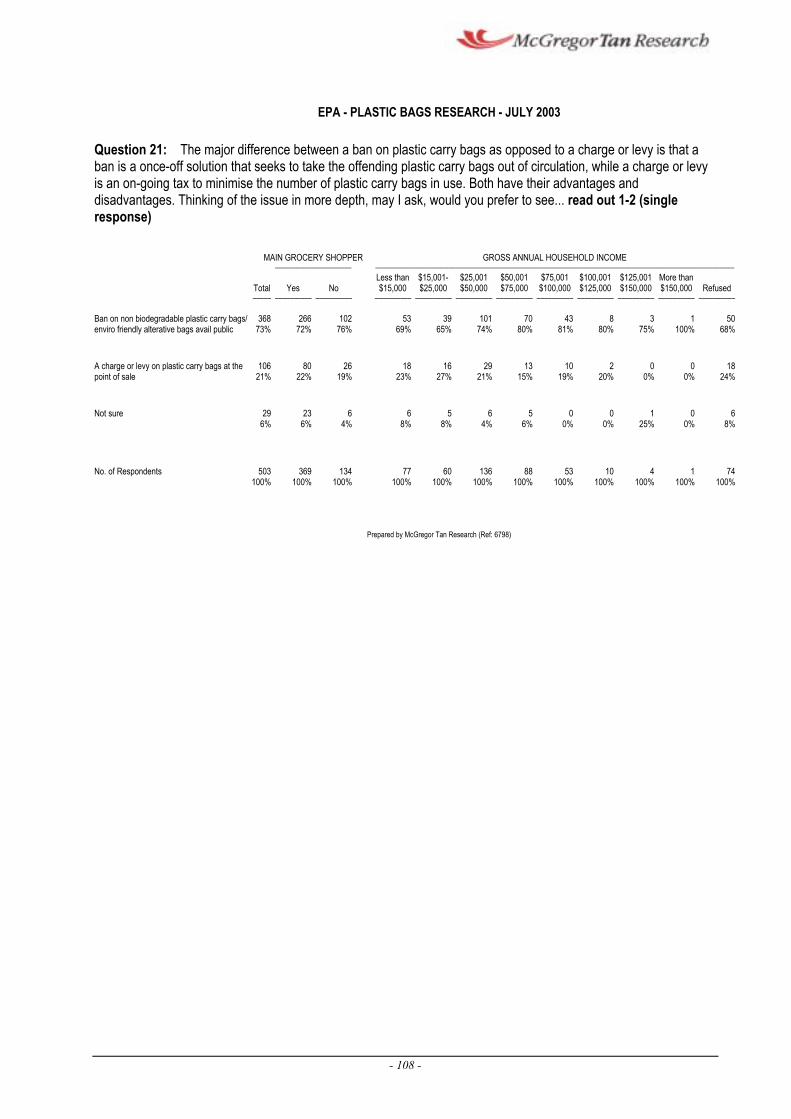
EPA - PLASTIC BAGS RESEARCH - JULY 2003
Question 21: The major difference between a ban on plastic carry bags as opposed to a charge or levy is that a ban is a once-off solution that seeks to take the offending plastic carry bags out of circulation, while a charge or levy is an on-going tax to minimise the number of plastic carry bags in use. Both have their advantages and disadvantages. Thinking of the issue in more depth, may I ask, would you prefer to see... read out 1-2 (single response)
MAIN GROCERY SHOPPER GROSS ANNUAL HOUSEHOLD INCOME œœœœœœœœœœœœœœœœœœœœœ œœœœœœœœœœœœœœœœœœœœœœœœœœœœœœœœœœœœœœœœœœœœœœœœœœœœœœœœœœœœœœœœœœœœœœœœœœœœœœœœœœœœœœœœœœœœœœœœœœ
Less than $15,001- $25,001 $50,001 $75,001 $100,001 $125,001 More than Total Yes No $15,000 $25,000 $50,000 $75,000 $100,000 $125,000 $150,000 $150,000 Refused œœœœœ œœœœœœœœœœ œœœœœœœœœœ œœœœœœœœœœ œœœœœœœœœœ œœœœœœœœœœ œœœœœœœœœœ œœœœœœœœœœ œœœœœœœœœœ œœœœœœœœœœ œœœœœœœœœœ œœœœœœœœœœ
Ban on non biodegradable plastic carry bags/ 368 266 102 53 39 101 70 43 8 3 1 50 enviro friendly alterative bags avail public 73% 72% 76% 69% 65% 74% 80% 81% 80% 75% 100% 68%
A charge or levy on plastic carry bags at the 106 80 26 18 16 29 13 10 2 0 0 18 point of sale 21% 22% 19% 23% 27% 21% 15% 19% 20% 0% 0% 24%
Not sure 29 23 6 6 5 6 5 0 0 1 0 6 6% 6% 4% 8% 8% 4% 6% 0% 0% 25% 0% 8%
No. of Respondents 503 369 134 77 60 136 88 53 10 4 1 74 100% 100% 100% 100% 100% 100% 100% 100% 100% 100% 100% 100%
Prepared by McGregor Tan Research (Ref: 6798)
- 108 -
Appendix 1:About The Research
- 109 -
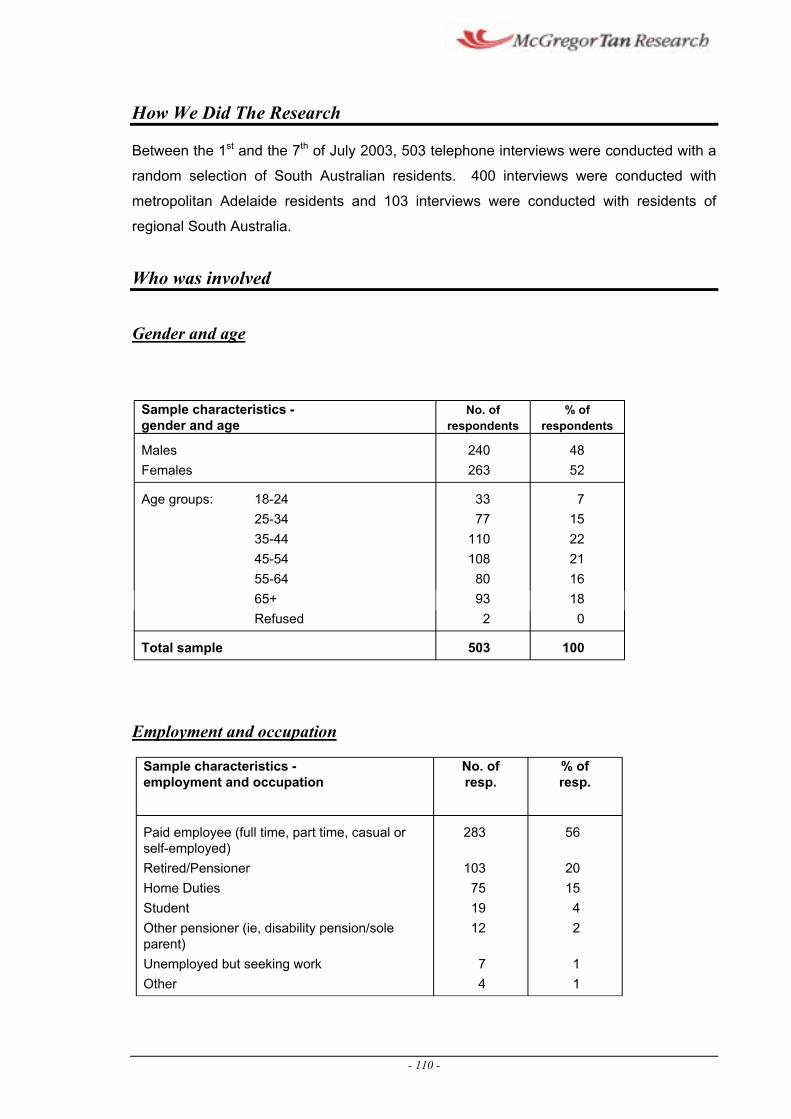
How We Did The Research
Between the 1st and the 7th of July 2003, 503 telephone interviews were conducted with a
random selection of South Australian residents. 400 interviews were conducted with
metropolitan Adelaide residents and 103 interviews were conducted with residents of
regional South Australia.
Who was involved
Gender and age
Sample characteristics - No. of % of gender and age respondents respondents
Males 240 48 Females 263 52
Age groups: 18-24 25-34
33 77
7 15
35-44 110 22 45-54 108 21 55-64 80 16 65+ 93 18 Refused 2 0
Total sample 503 100
Employment and occupation
Sample characteristics -employment and occupation
No. of resp.
% of resp.
Paid employee (full time, part time, casual or 283 56 self-employed) Retired/Pensioner 103 20 Home Duties 75 15 Student 19 4 Other pensioner (ie, disability pension/sole 12 2 parent) Unemployed but seeking work 7 1 Other 4 1
- 110 -
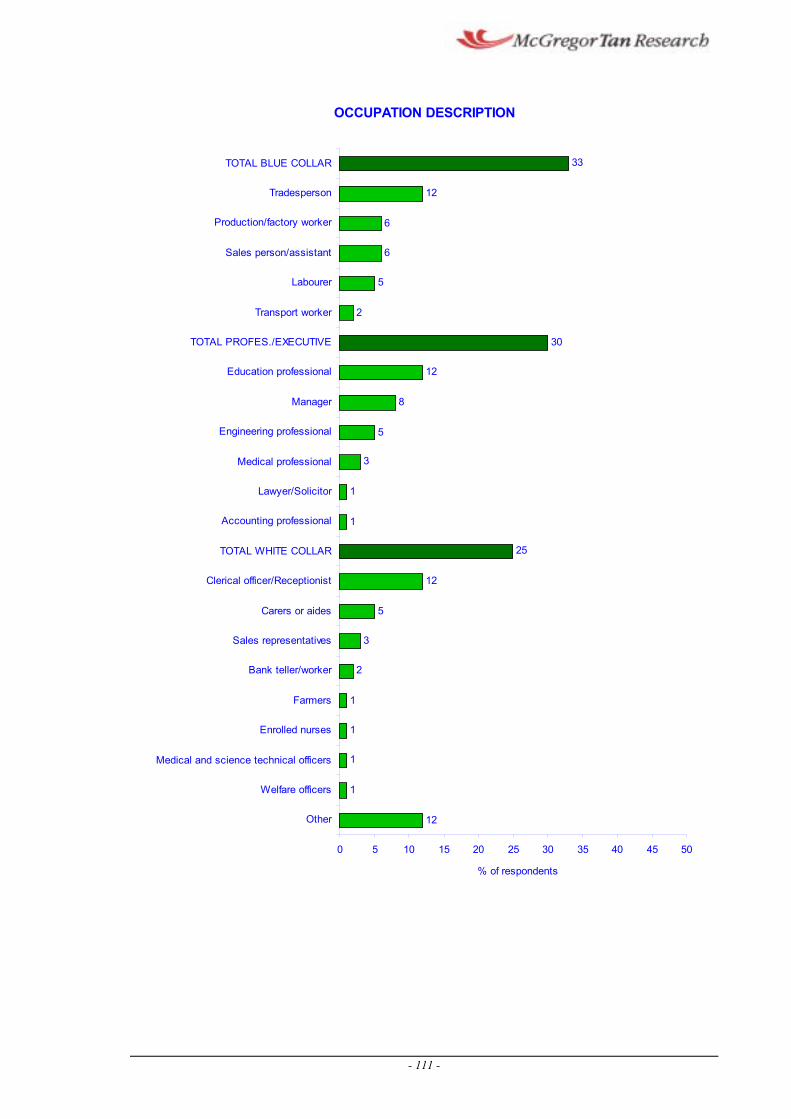
OCCUPATION DESCRIPTION
TOTAL BLUE COLLAR
Tradesperson
Production/factory worker
Sales person/assistant
Labourer
Transport worker
TOTAL PROFES./EXECUTIVE
Education professional
Manager
Engineering professional
Medical professional
Lawyer/Solicitor
Accounting professional
TOTAL WHITE COLLAR
Clerical officer/Receptionist
Carers or aides
Sales representatives
Bank teller/worker
Farmers
Enrolled nurses
Medical and science technical officers
Welfare officers
Other 12
1
1
1
1
2
3
5
12
25
1
1
3
5
8
12
30
2
5
6
6
12
33
0 5 10 15 20 25 30 35 40 45 50
% of respondents
- 111 -
Appendix 2:Additional Comments
- 112 -
This section lists the responses, made by individual interviewees, which did not fit within
the coded responses. Each is a single response, except where specified by a number of
respondents shown in brackets.
These comments are included for completeness, but always remember they are minor
responses, negligible in relation to the main, coded data. In other words, remember that
these are generally isolated comments, providing flavour but not constituting the main
ingredients.
Metropolitan Adelaide Respondents
Question 12: What do you think that retailers or businesses should do to fix the
environmental problem caused by plastic carry bags? Other
BASE: It should be left to retailers/businesses to fix the issue
DESIGN A BETTER PRODUCT CARRY BAGS INSTEAD OF US PURCHASING GIVE US A REBATE FOR USING OUR OWNCALICO BAGS (0298)EMPLOY SOMEONE TO PACK THE GROCERIES IN A BOX AND TAKE TO YOUR CAR. (0286)EVERYONE IS CONTRIBUTING (0313)GREEN CARRY BAGS THAT COLES HAVE NOW TO PURCHASE FOR TWO DOLLARS FIFTY (0232)LESS PREPACKED MEATS (0088)LOOKING AT OTHER WAYS OF MAKING PLASTIC BAGS BIO DEGRTADABLE (0188)MORE RECYCLEING BINS MORE INCENTIVES (0491)MORE USERFRIENDLY SYSTEM FOR USE OF ENVIRO FRIENDLY BAGS (0151)NOT USE SO MANY ; FAR TOO MANY ARE WASTED AND NOT ENOUGH ITEMS ARE PUT INTO EACH BAG (0157)NOTHING - AS I RE-USE ALL OF MY BAGS AND DONT THINK THERE IS AN ENVIRONMENTAL PROBLEM (0108)PURBLICISE MORE THE IN STORE FACILITY OF RECYCLING (0060)PUT MORE OF THE GREEN BAGS ON THE MARKET. TO INTRODUCE ENVIRO BAG. (0364)
Question 25: How would you describe your occupation? Other
BASE: It should be left to retailers/businesses to fix the issue
AIRLINE SERVICE OPERATOR (0364)ASSISTANS ADMINSTRATOR (0558)CASUAL WORK (0313)CHILD CARE (0459)FOOD INDUSTRY (0043)HORTICULTURALIST (0251)IT CONSULTENT (0523)NIGHTFILLER SUPERMARKET (0268)STOREMAN (0549)STOREMAN (0569)
- 113 -
Regional South Australia Respondents
Question 24: Which of the following best describes you? Other - specify
BASE: It should be left to retailers/businesses to fix the issue
SELF EMPLOYED FARMER MIXED FARM (6532)
Question 25: How would you describe your occupation? Other
BASE: It should be left to retailers/businesses to fix the issue
COOK AT A RESTAURANT (6571) GOVERNMENT (6592) HOSPITALITY (6335)
- 114 -
Appendix 3:Sampling Tolerance
- 115 -
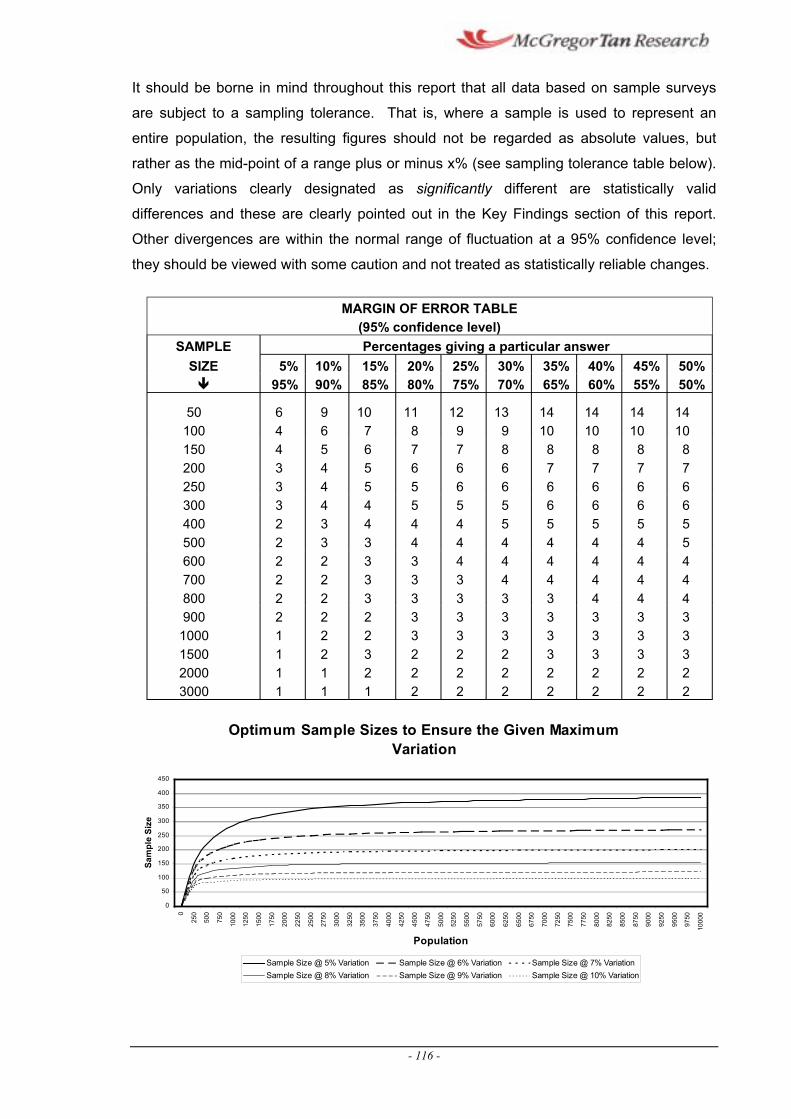
It should be borne in mind throughout this report that all data based on sample surveys
are subject to a sampling tolerance. That is, where a sample is used to represent an
entire population, the resulting figures should not be regarded as absolute values, but
rather as the mid-point of a range plus or minus x% (see sampling tolerance table below).
Only variations clearly designated as significantly different are statistically valid
differences and these are clearly pointed out in the Key Findings section of this report.
Other divergences are within the normal range of fluctuation at a 95% confidence level;
they should be viewed with some caution and not treated as statistically reliable changes.
MARGIN OF ERROR TABLE (95% confidence level)
SAMPLE Percentages giving a particular answer SIZE 5% 10% 15% 20% 25% 30% 35% 40% 45% 50% Ï 95% 90% 85% 80% 75% 70% 65% 60% 55% 50%
50 6 9 10 11 12 13 14 14 14 14 100 4 6 7 8 9 9 10 10 10 10 150 4 5 6 7 7 8 8 8 8 8 200 3 4 5 6 6 6 7 7 7 7 250 3 4 5 5 6 6 6 6 6 6 300 3 4 4 5 5 5 6 6 6 6 400 2 3 4 4 4 5 5 5 5 5 500 2 3 3 4 4 4 4 4 4 5 600 2 2 3 3 4 4 4 4 4 4 700 2 2 3 3 3 4 4 4 4 4 800 2 2 3 3 3 3 3 4 4 4 900 2 2 2 3 3 3 3 3 3 3
1000 1 2 2 3 3 3 3 3 3 3 1500 1 2 3 2 2 2 3 3 3 3 2000 1 1 2 2 2 2 2 2 2 2 3000 1 1 1 2 2 2 2 2 2 2
Optimum Sample Sizes to Ensure the Given MaximumVariation
0
50
100
150
200
250
300
350
400
450
Sam
ple
Size
0
250
500
750
1000
1250
1500
1750
2000
2250
2500
2750
3000
3250
3500
3750
4000
4250
4500
4750
5000
5250
5500
5750
6000
6250
6500
6750
7000
7250
7500
7750
8000
8250
8500
8750
9000
9250
9500
9750
1000
0
Population
l i i l i i l il i i l i i i i
Samp e S ze @ 5% Var ation Samp e Size @ 6% Var at on Samp e Size @ 7% Variat on Samp e S ze @ 8% Var ation Samp e Size @ 9% Var at on Sample S ze @ 10% Var ation
- 116 -
Appendix 4:Questionnaire
- 117 -
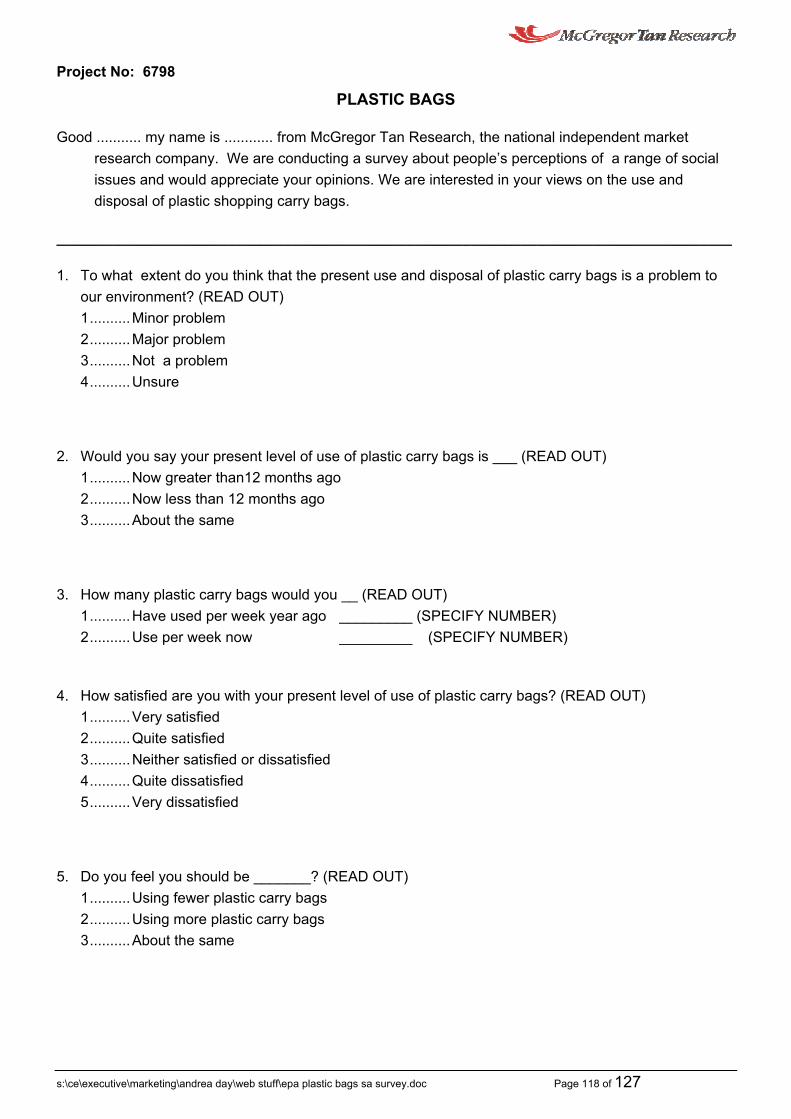
___________________________________________________________________________________
Project No: 6798
PLASTIC BAGS
Good ........... my name is ............ from McGregor Tan Research, the national independent market research company. We are conducting a survey about people‘s perceptions of a range of social issues and would appreciate your opinions. We are interested in your views on the use and disposal of plastic shopping carry bags.
1. To what extent do you think that the present use and disposal of plastic carry bags is a problem to our environment? (READ OUT) 1.......... Minor problem 2.......... Major problem 3.......... Not a problem 4.......... Unsure
2. Would you say your present level of use of plastic carry bags is ___ (READ OUT) 1.......... Now greater than12 months ago 2.......... Now less than 12 months ago 3.......... About the same
3. How many plastic carry bags would you __ (READ OUT) 1.......... Have used per week year ago _________ (SPECIFY NUMBER) 2.......... Use per week now _________ (SPECIFY NUMBER)
4. How satisfied are you with your present level of use of plastic carry bags? (READ OUT)1.......... Very satisfied
2.......... Quite satisfied
3.......... Neither satisfied or dissatisfied
4.......... Quite dissatisfied
5.......... Very dissatisfied
5. Do you feel you should be _______? (READ OUT) 1.......... Using fewer plastic carry bags 2.......... Using more plastic carry bags 3.......... About the same
s:\ce\executive\marketing\andrea day\web stuff\epa plastic bags sa survey.doc Page 118 of 127
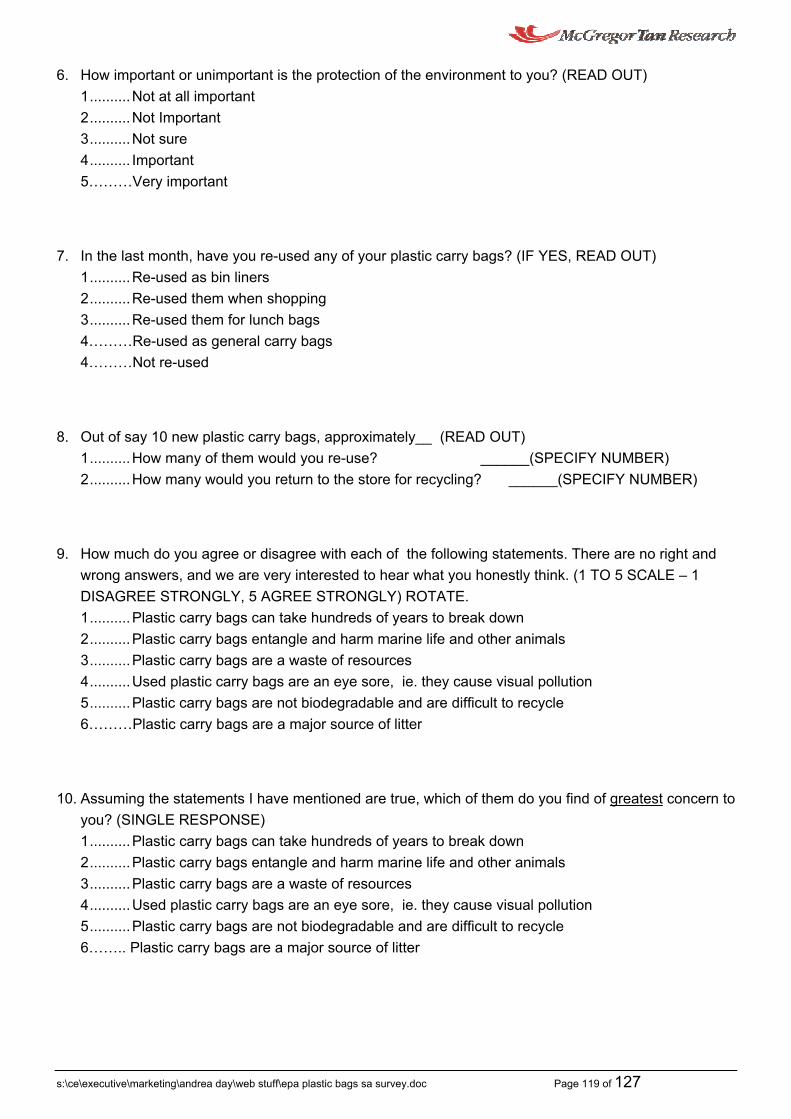
12345
6. How important or unimportant is the protection of the environment to you? (READ OUT) 1.......... Not at all important 2.......... Not Important 3.......... Not sure 4.......... Important 5………Very important
7. In the last month, have you re-used any of your plastic carry bags? (IF YES, READ OUT) 1.......... Re-used as bin liners 2.......... Re-used them when shopping 3.......... Re-used them for lunch bags 4………Re-used as general carry bags 4………Not re-used
8. Out of say 10 new plastic carry bags, approximately__ (READ OUT) 1.......... How many of them would you re-use? ______(SPECIFY NUMBER) 2.......... How many would you return to the store for recycling? ______(SPECIFY NUMBER)
9. How much do you agree or disagree with each of the following statements. There are no right and wrong answers, and we are very interested to hear what you honestly think. (1 TO 5 SCALE œ 1 DISAGREE STRONGLY, 5 AGREE STRONGLY) ROTATE. 1.......... Plastic carry bags can take hundreds of years to break down 2.......... Plastic carry bags entangle and harm marine life and other animals 3.......... Plastic carry bags are a waste of resources 4.......... Used plastic carry bags are an eye sore, ie. they cause visual pollution 5.......... Plastic carry bags are not biodegradable and are difficult to recycle 6………Plastic carry bags are a major source of litter
10. Assuming the statements I have mentioned are true, which of them do you find of greatest concern to you? (SINGLE RESPONSE)
.......... Plastic carry bags can take hundreds of years to break down
.......... Plastic carry bags entangle and harm marine life and other animals
.......... Plastic carry bags are a waste of resources
.......... Used plastic carry bags are an eye sore, ie. they cause visual pollution
.......... Plastic carry bags are not biodegradable and are difficult to recycle
6…….. Plastic carry bags are a major source of litter
s:\ce\executive\marketing\andrea day\web stuff\epa plastic bags sa survey.doc Page 119 of 127
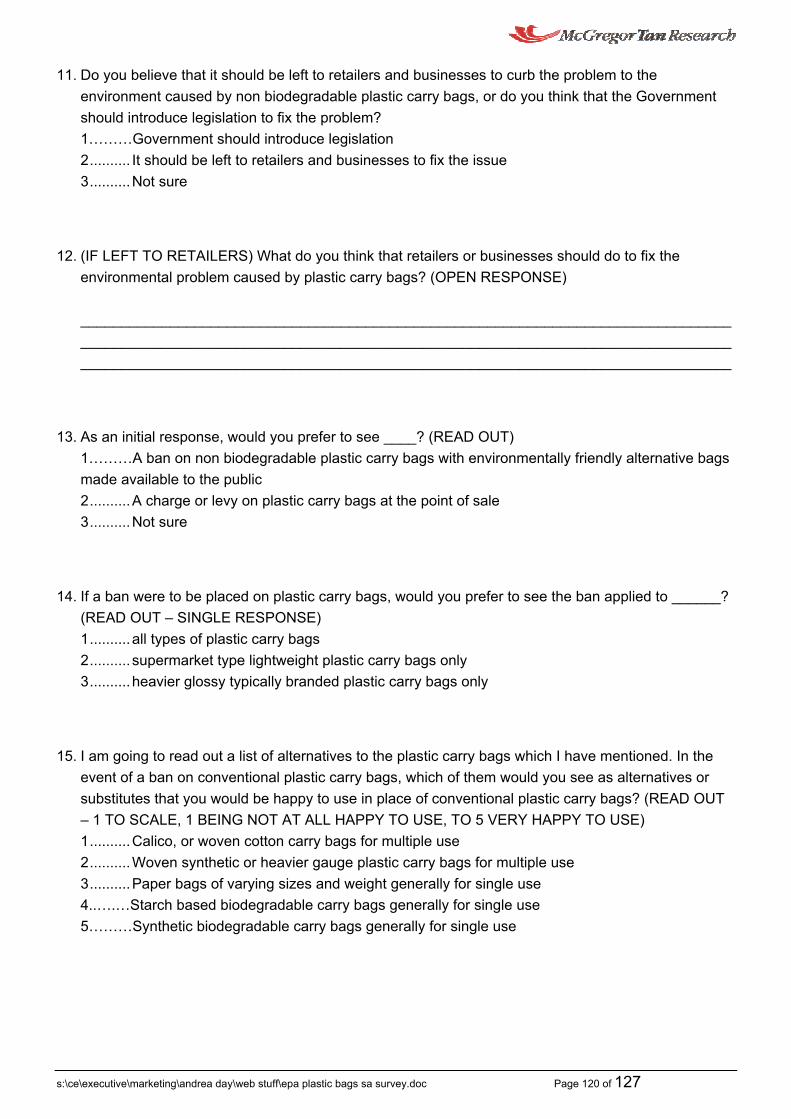
________________________________________________________________________________ ________________________________________________________________________________ ________________________________________________________________________________
11. Do you believe that it should be left to retailers and businesses to curb the problem to the environment caused by non biodegradable plastic carry bags, or do you think that the Government should introduce legislation to fix the problem? 1………Government should introduce legislation 2.......... It should be left to retailers and businesses to fix the issue 3.......... Not sure
12. (IF LEFT TO RETAILERS) What do you think that retailers or businesses should do to fix the environmental problem caused by plastic carry bags? (OPEN RESPONSE)
13. As an initial response, would you prefer to see ____? (READ OUT) 1………A ban on non biodegradable plastic carry bags with environmentally friendly alternative bags made available to the public 2.......... A charge or levy on plastic carry bags at the point of sale 3.......... Not sure
14. If a ban were to be placed on plastic carry bags, would you prefer to see the ban applied to ______? (READ OUT œ SINGLE RESPONSE) 1.......... all types of plastic carry bags 2.......... supermarket type lightweight plastic carry bags only 3.......... heavier glossy typically branded plastic carry bags only
15. I am going to read out a list of alternatives to the plastic carry bags which I have mentioned. In the event of a ban on conventional plastic carry bags, which of them would you see as alternatives or substitutes that you would be happy to use in place of conventional plastic carry bags? (READ OUT œ 1 TO SCALE, 1 BEING NOT AT ALL HAPPY TO USE, TO 5 VERY HAPPY TO USE) 1.......... Calico, or woven cotton carry bags for multiple use 2.......... Woven synthetic or heavier gauge plastic carry bags for multiple use 3.......... Paper bags of varying sizes and weight generally for single use 4..….…Starch based biodegradable carry bags generally for single use 5………Synthetic biodegradable carry bags generally for single use
s:\ce\executive\marketing\andrea day\web stuff\epa plastic bags sa survey.doc Page 120 of 127
16. If a ban were imposed on conventional non biodegradable plastic carry bags, and assuming that alternatives such as the ones I have mentioned were available, how would a ban influence your shopping behaviour? (READ OUT œ 1 TO 5 SCALE, 1 BEING DISAGREE STRONGLY TO 5 BEING AGREE STRONGLY). 1 ......... Shop less 2.......... Shop more 3.......... No change to shopping pattern
17. If a levy or charge were to be placed on non biodegradable plastic carry bags, would you prefer to see the levy or charge applied to ______? (READ OUT œ SINGLE RESPONSE) 1.......... all types of plastic carry bags 2.......... supermarket type lightweight plastic carry bags only 3.......... heavier glossy typically branded plastic carry bags only
18. If a charge or levy were to be placed on non biodegradable plastic carry bags, what do you think is the maximum price that the you would be prepared to pay per plastic carry bag?
__________________cents (SPECIFY)
19. If a charge or levy were imposed on non biodegradable plastic carry bags, how would a charge or levy influence your shopping behaviour? (READ OUT œ 1 TO 5 SCALE, 1 BEING DISAGREE STRONGLY TO 5 BEING AGREE STRONGLY). 1 ......... Shop less 2.......... Shop more 3.......... No change to shopping pattern
20. Would you be prepared an extra 2 or 3 cents for a biodegradable plastic carry bag? 1 ......... Yes, definitely 2.......... Yes, quite likely 3.......... Unsure 4...…….No, quite unlikely 5………No, definitely not
s:\ce\executive\marketing\andrea day\web stuff\epa plastic bags sa survey.doc Page 121 of 127
21. The major difference between a ban on plastic carry bags as opposed to a charge or levy is that a ban is a once-off solution that seeks to take the offending plastic carry bags out of circulation, while a charge or levy is an on going tax to minimise the number of plastic carry bags in use. Both have their advantages and disadvantages. Thinking of the issue in more depth, may I ask, would you prefer to see ____? (READ OUT)
1………A ban on non biodegradable plastic carry bags with environment friendly alternative bags made available to the public 2.......... A charge or levy on plastic carry bags at the point of sale 3.......... Not sure
CLASSIFICATIONS:
22. GENDER1……Male 2……Female
23. Can you please tell me which age group you are in?
1.......... 18 -24
2.......... 25 - 34
3.......... 35 - 44
4.......... 45 - 54
5.......... 55 - 64
6.......... 65 or over7.......... Not stated
24. Which of the following best describes you? read out01........ Paid employee (full or part time or self-employed)02........ Unemployed but seeking work
03........ Student04........ Home duties
05........ Retired/pensioner06........ Other pensioner07........ Other œ specify
25. If employed, please describe your occupation.
s:\ce\executive\marketing\andrea day\web stuff\epa plastic bags sa survey.doc Page 122 of 127
26. Are you a main shopper for groceries in your household? 02........ Yes 03........ No
27. Which of the following ranges best describes the gross annual household income for this household? (READ OUT SINGLE RESPONSE) 1.......... Less than $15,0000 2.......... $15,000 to less than $25,000 2.......... $25,000 to less than $50,000 3.......... $50,000 to less than $75,000 4.......... $75,000 to less than $100,000 5.......... $100,000 to less than $125,000 6.......... $125,000 to less than $150,000 7.......... More than $150,000 8………Refused
Thank you participating in this survey.
s:\ce\executive\marketing\andrea day\web stuff\epa plastic bags sa survey.doc Page 123 of 127
Appendix 5:How To Read The
Computer Tabulations
s:\ce\executive\marketing\andrea day\web stuff\epa plastic bags sa survey.doc Page 124 of 127
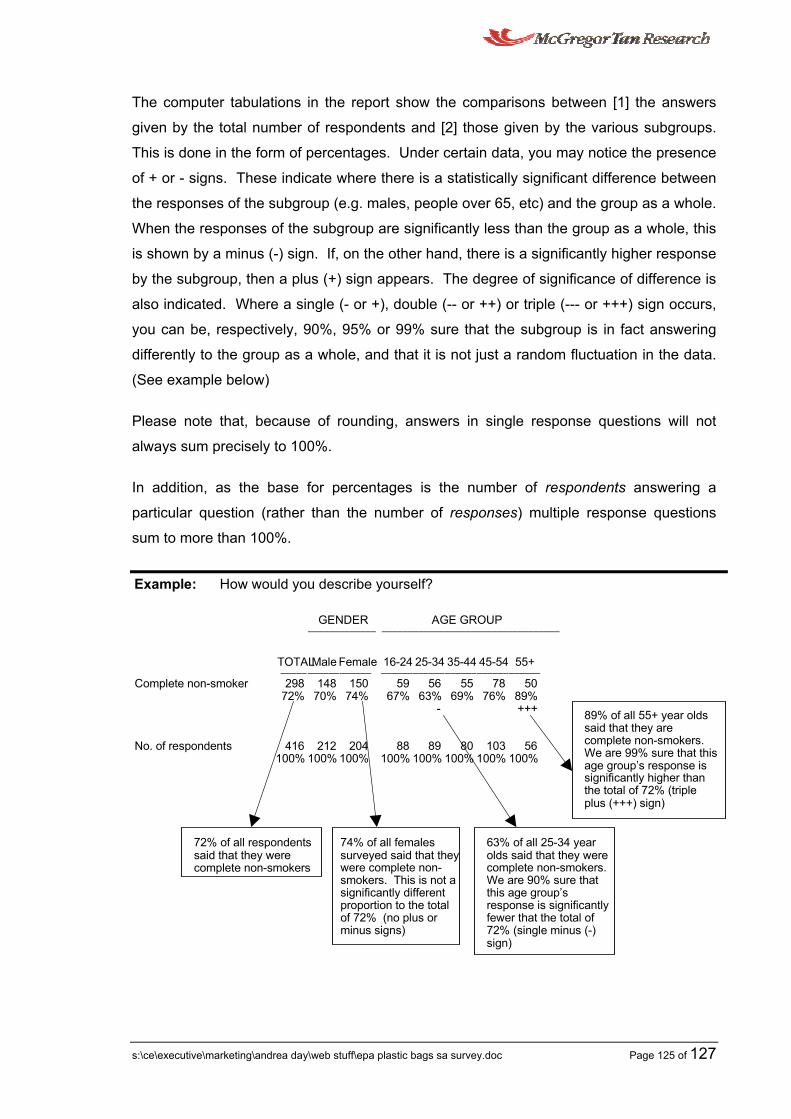
The computer tabulations in the report show the comparisons between [1] the answers
given by the total number of respondents and [2] those given by the various subgroups.
This is done in the form of percentages. Under certain data, you may notice the presence
of + or - signs. These indicate where there is a statistically significant difference between
the responses of the subgroup (e.g. males, people over 65, etc) and the group as a whole.
When the responses of the subgroup are significantly less than the group as a whole, this
is shown by a minus (-) sign. If, on the other hand, there is a significantly higher response
by the subgroup, then a plus (+) sign appears. The degree of significance of difference is
also indicated. Where a single (- or +), double (-- or ++) or triple (--- or +++) sign occurs,
you can be, respectively, 90%, 95% or 99% sure that the subgroup is in fact answering
differently to the group as a whole, and that it is not just a random fluctuation in the data.
(See example below)
Please note that, because of rounding, answers in single response questions will not
always sum precisely to 100%.
In addition, as the base for percentages is the number of respondents answering a
particular question (rather than the number of responses) multiple response questions
sum to more than 100%.
Example: How would you describe yourself?
GENDER AGE GROUP œœœœœœœœœœœœœ œœœœœœœœœœœœœœœœœœœœœœœœœœœœœœœœœœ
TOTALMale Female 16-24 25-34 35-44 45-54 55+ œœœœœ œœœœœœœœœœœœ œœœœœœœœœœœœœœœœœœœœœœœœœœœœœœ
Complete non-smoker 298 72%
148 70%
150 74%
59 67%
56 63%
55 69%
78 76%
50 89%
No. of respondents 416 212 204 100% 100% 100%
80
- +++
88 89 103 56 100% 100% 100% 100% 100%
89% of all 55+ year olds said that they are complete non-smokers. We are 99% sure that this age group‘s response is significantly higher than the total of 72% (triple plus (+++) sign)
72% of all respondents 74% of all females 63% of all 25-34 year said that they were surveyed said that they olds said that they were complete non-smokers were complete non- complete non-smokers.
smokers. This is not a We are 90% sure that significantly different this age group‘s proportion to the total response is significantlyof 72% (no plus or fewer that the total of minus signs) 72% (single minus (-)
sign)
s:\ce\executive\marketing\andrea day\web stuff\epa plastic bags sa survey.doc Page 125 of 127