Embed Size (px)
Citation preview
The Future of Fracture Critical latest Research on FC Members
William Collins, University of Kansas
KSU Bridge Design WorkshopOctober 13, 2017
The Future of Fracture Critical latest Research on FC Members
William Collins, University of Kansas
Robert Connor, Purdue University
Francisco Bonachera Martin, Purdue UniversityMatthew Hebdon, Virginia Tech
Ryan Sherman, University of Nevada Las Vegas
KSU Bridge Design WorkshopOctober 13, 2017
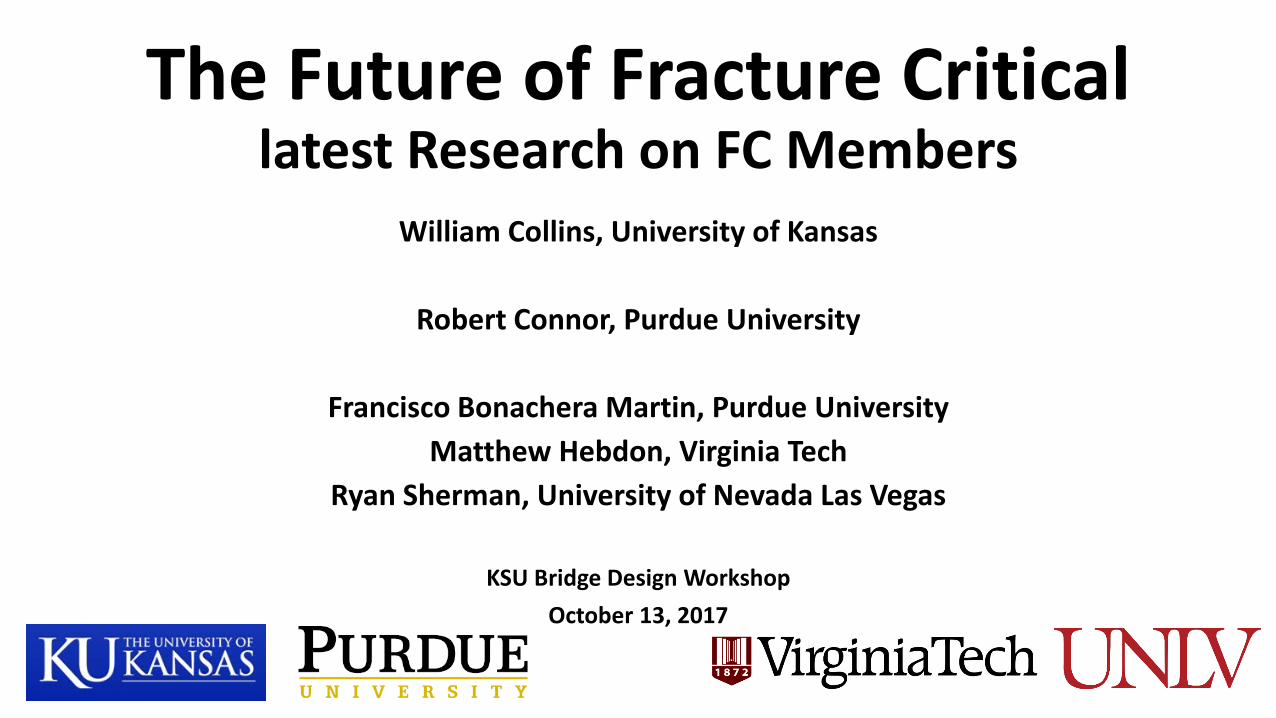
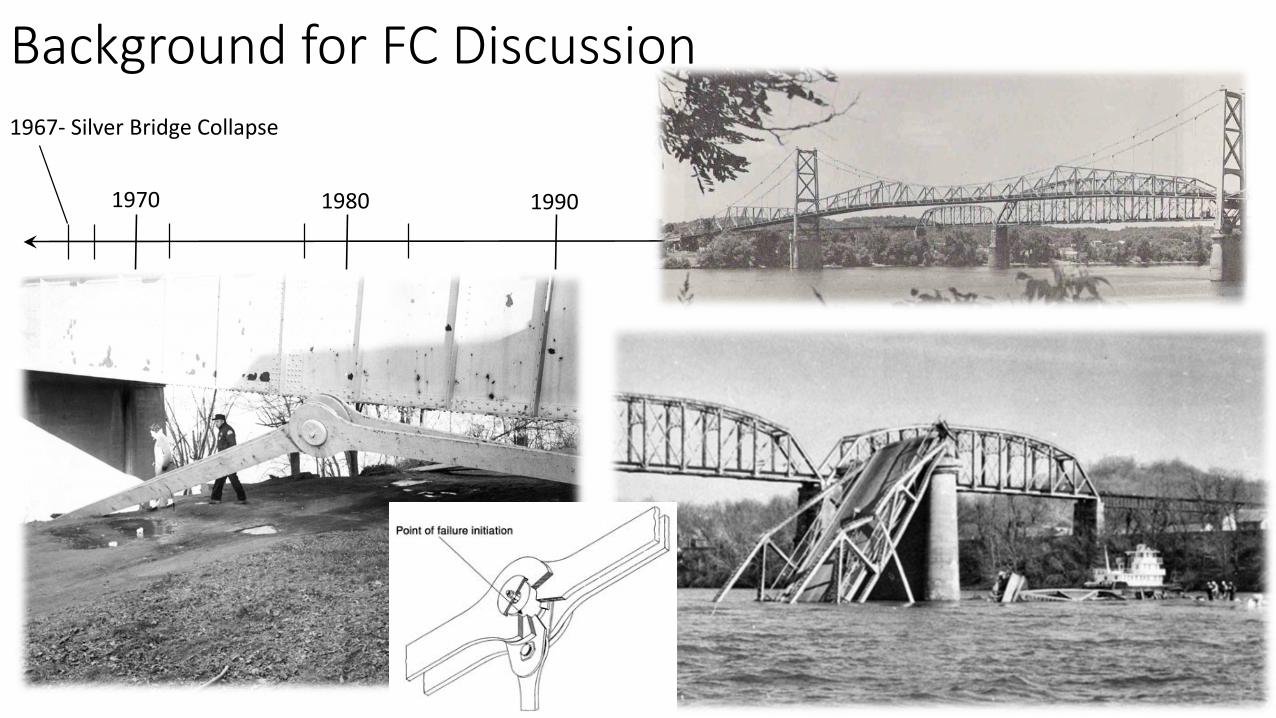
Background for FC Discussion
1970 1980 1990 2000 2010 2020
Background for FC Discussion
1970 1980 1990 2000 2010 2020
1967- Silver Bridge Collapse
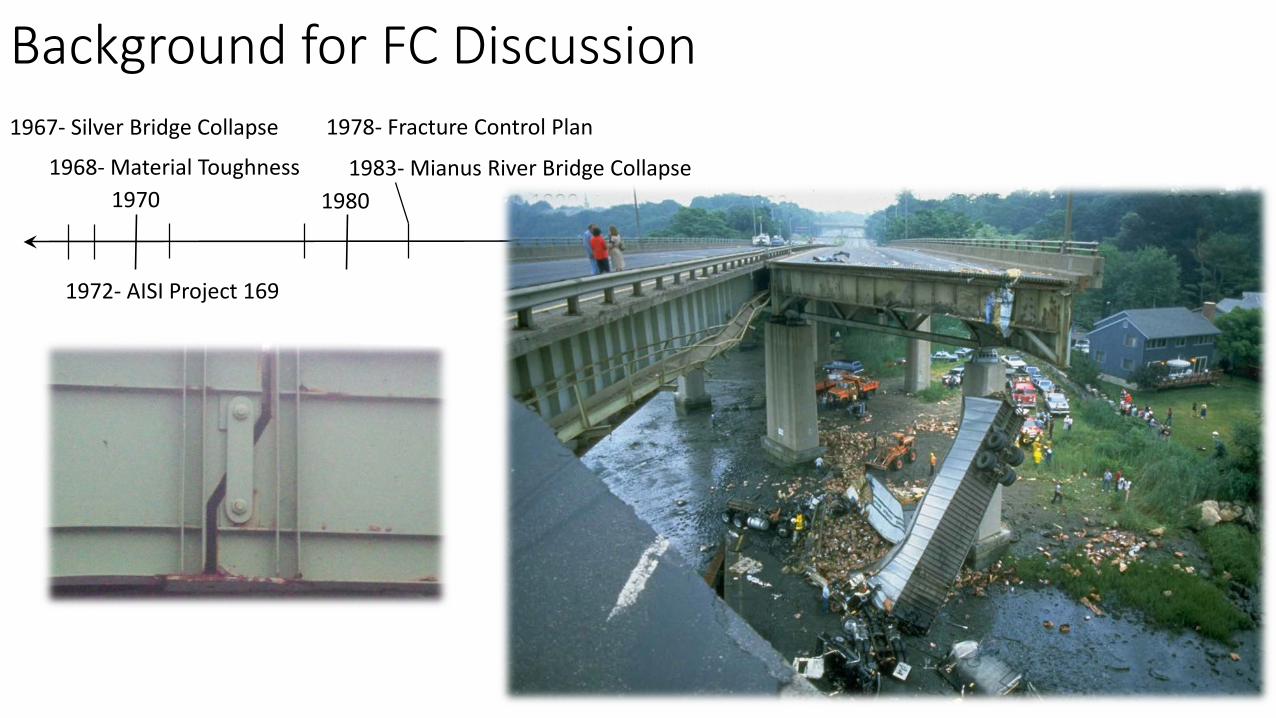
Background for FC Discussion
1970 1980 1990 2000 2010 2020
1967- Silver Bridge Collapse
1968- Material Toughness
1972- AISI Project 169
1978- Fracture Control Plan
1983- Mianus River Bridge Collapse
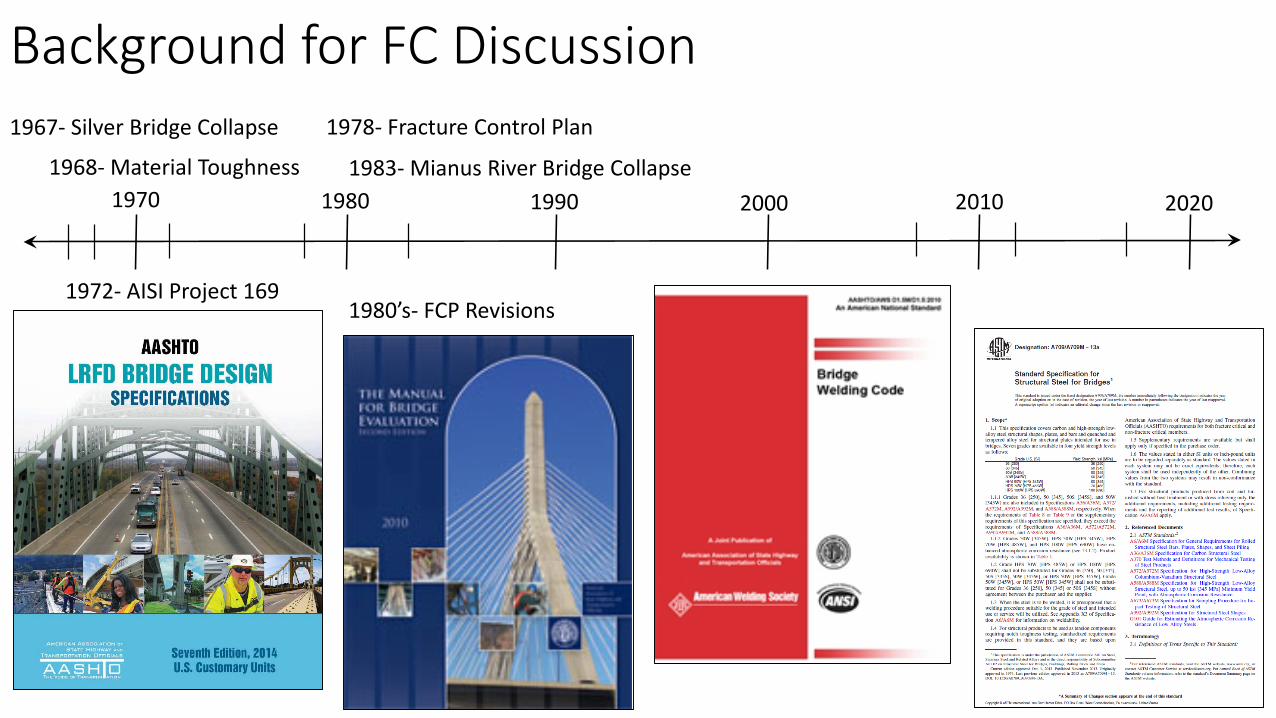
Background for FC Discussion
1970 1980 1990 2000 2010 2020
1967- Silver Bridge Collapse
1968- Material Toughness
1972- AISI Project 169
1978- Fracture Control Plan
1983- Mianus River Bridge Collapse
1980’s- FCP Revisions
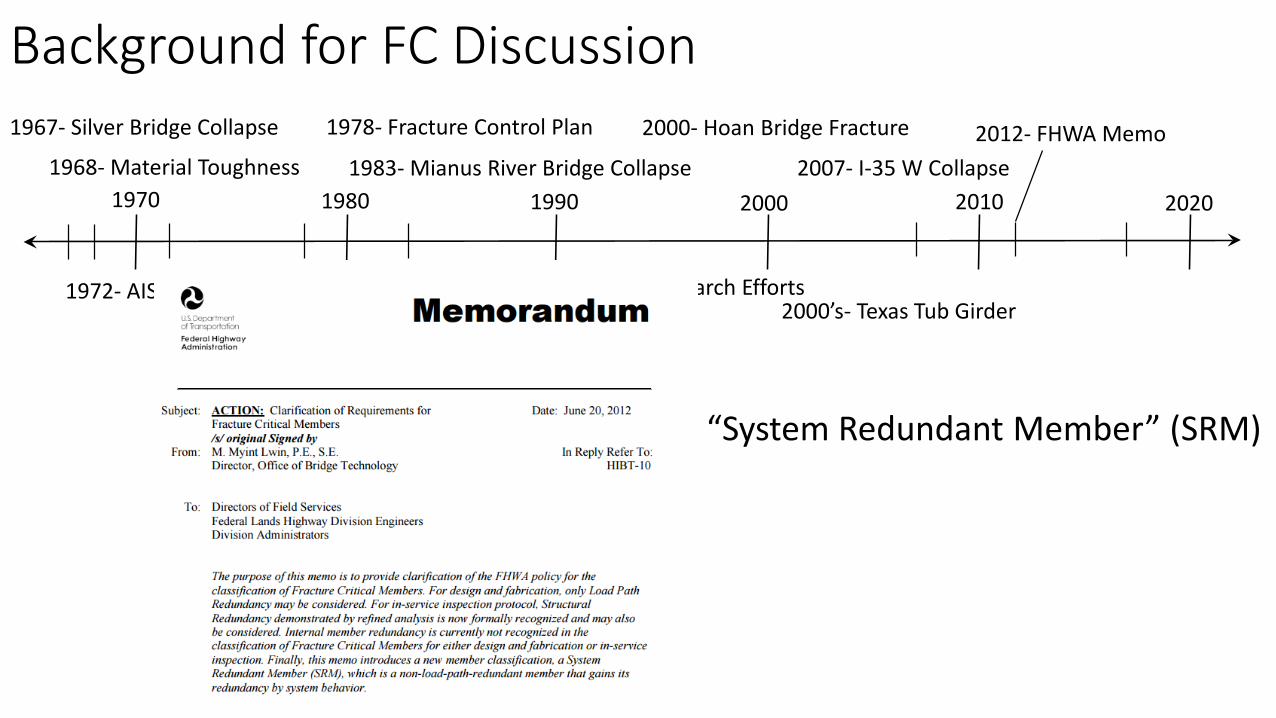
Background for FC Discussion
1970 1980 1990 2000 2010 2020
1967- Silver Bridge Collapse
1968- Material Toughness
1972- AISI Project 169
1978- Fracture Control Plan
1983- Mianus River Bridge Collapse
1990’s- HPS Research Efforts
2000- Hoan Bridge Fracture
1980’s- FCP Revisions
2007- I-35 W Collapse
2000’s- Texas Tub Girder
2012- FHWA Memo
“System Redundant Member” (SRM)
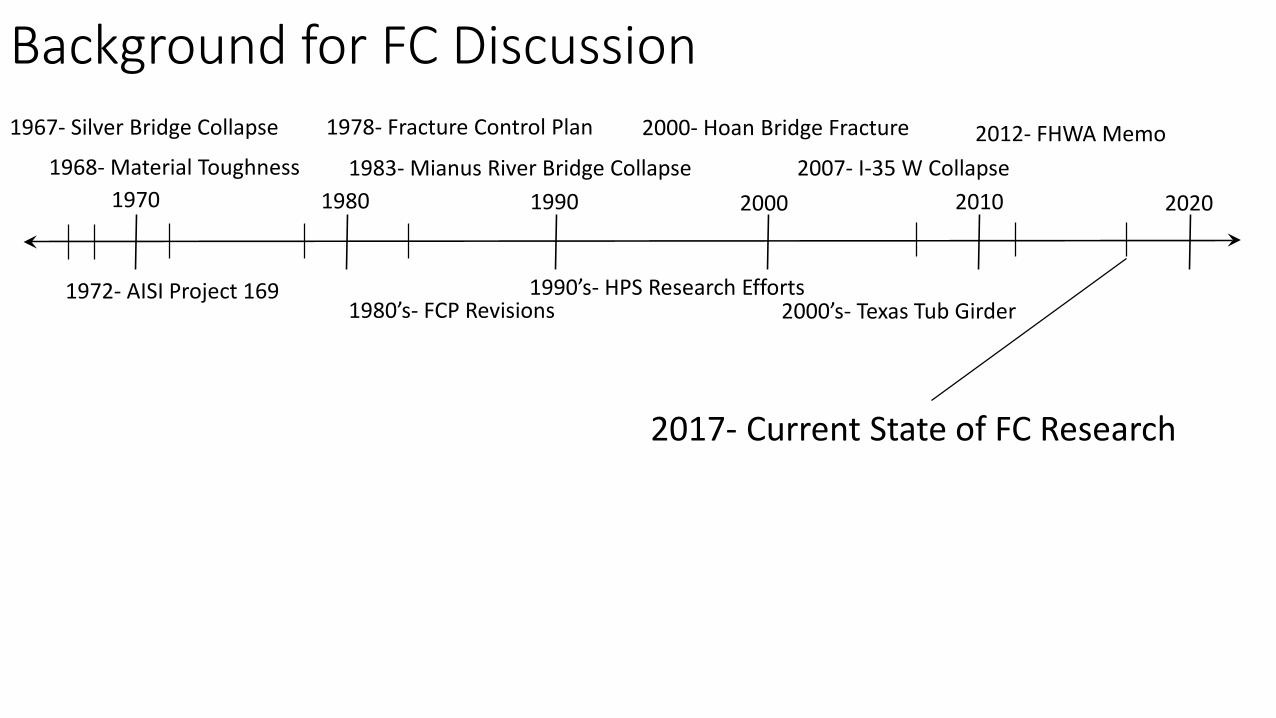
Background for FC Discussion
1970 1980 1990 2000 2010 2020
1967- Silver Bridge Collapse
1968- Material Toughness
1972- AISI Project 169
1978- Fracture Control Plan
1983- Mianus River Bridge Collapse
1990’s- HPS Research Efforts
2000- Hoan Bridge Fracture
1980’s- FCP Revisions
2007- I-35 W Collapse
2000’s- Texas Tub Girder
2012- FHWA Memo
2017- Current State of FC Research
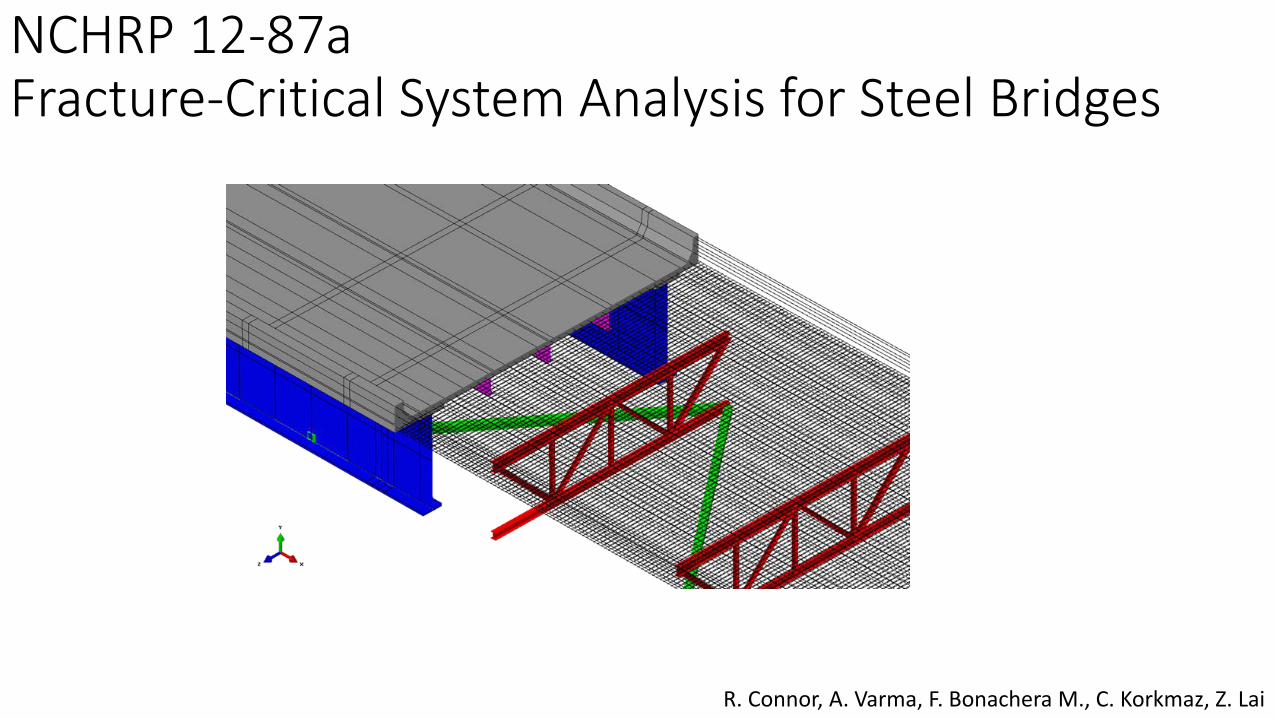
NCHRP 12-87aFracture-Critical System Analysis for Steel Bridges
R. Connor, A. Varma, F. Bonachera M., C. Korkmaz, Z. Lai
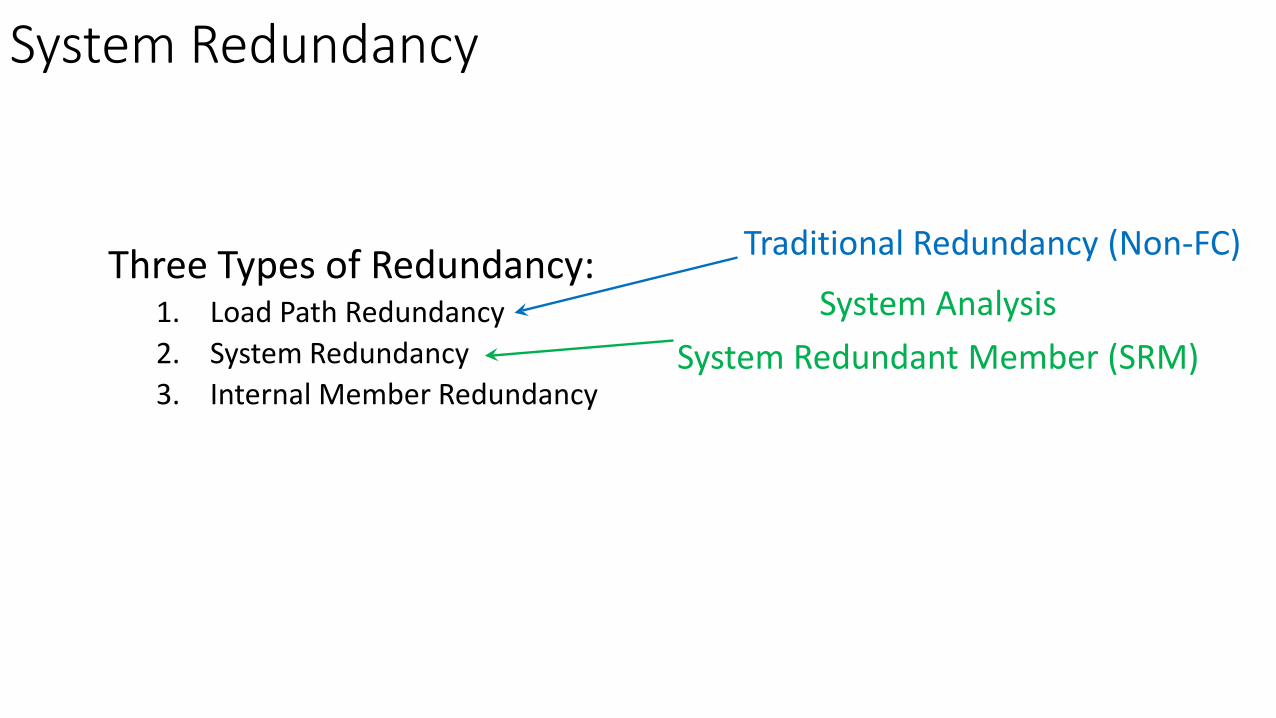
System Redundancy
Three Types of Redundancy:1. Load Path Redundancy2. System Redundancy3. Internal Member Redundancy
Traditional Redundancy (Non-FC)
System AnalysisSystem Redundant Member (SRM)
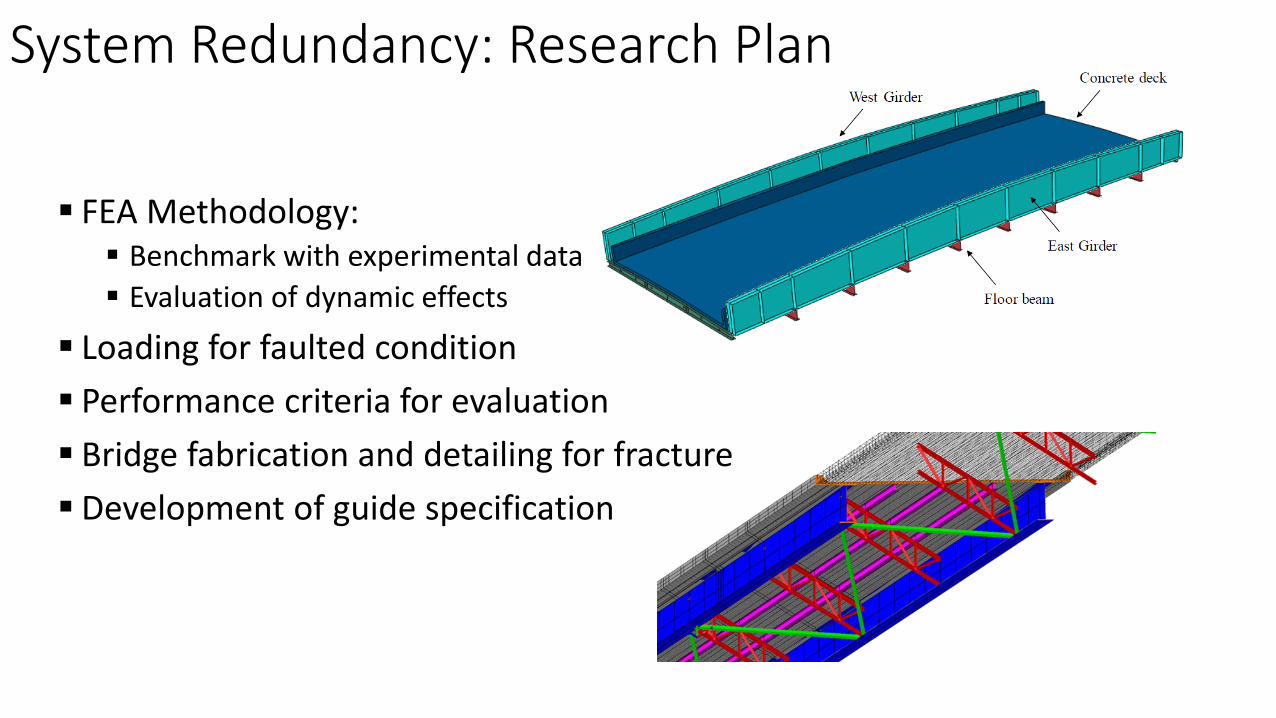
FEA Methodology: Benchmark with experimental data Evaluation of dynamic effects
Loading for faulted condition Performance criteria for evaluation Bridge fabrication and detailing for fracture Development of guide specification
System Redundancy: Research Plan
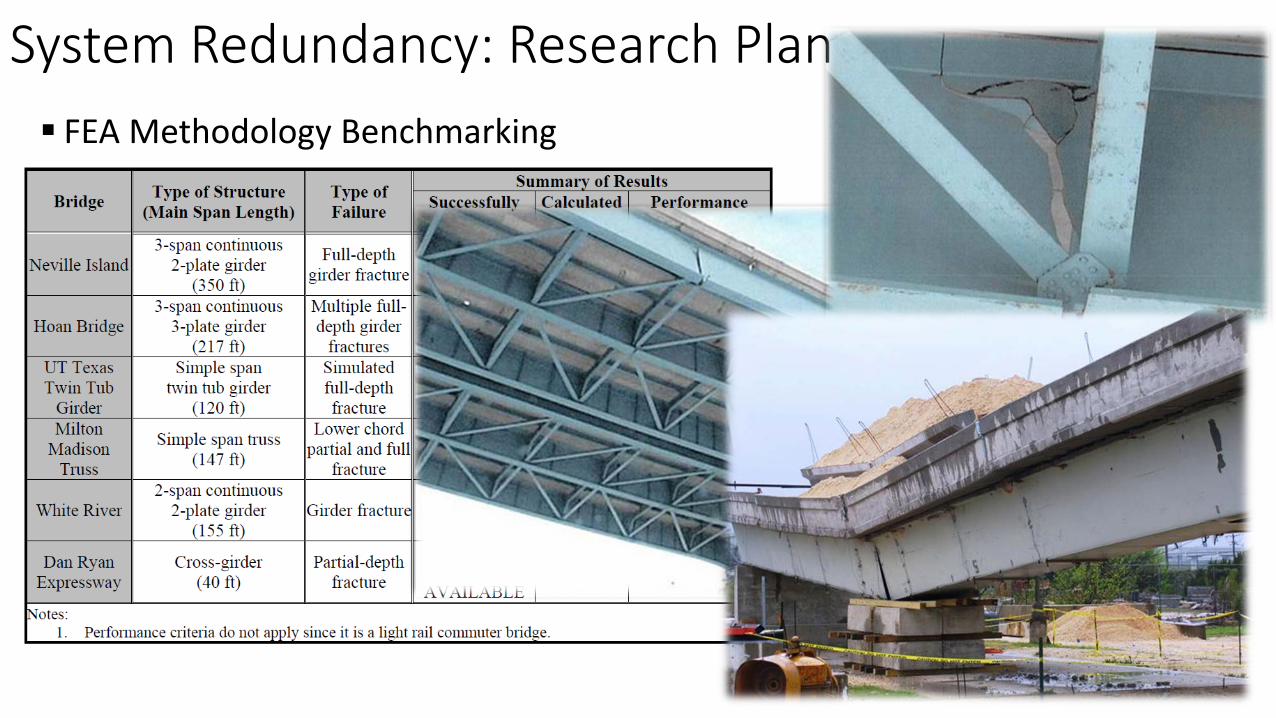
FEA Methodology Benchmarking
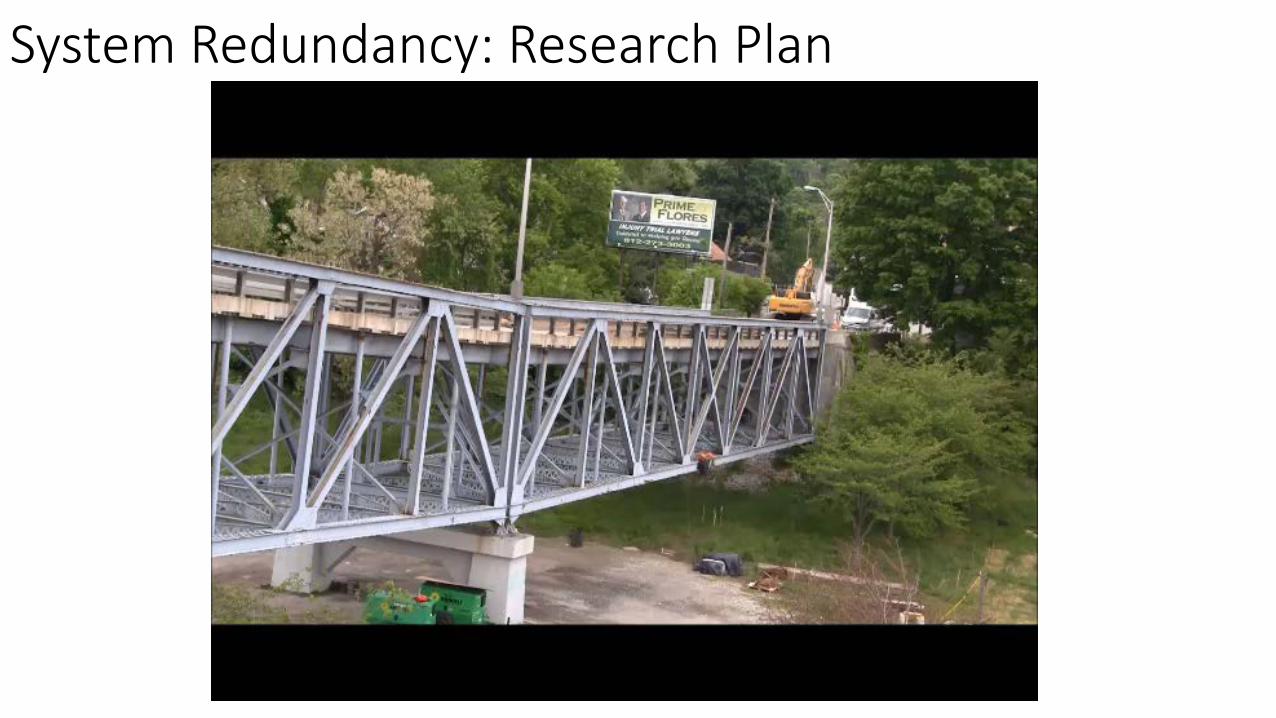
System Redundancy: Research Plan
System Redundancy: Research Plan
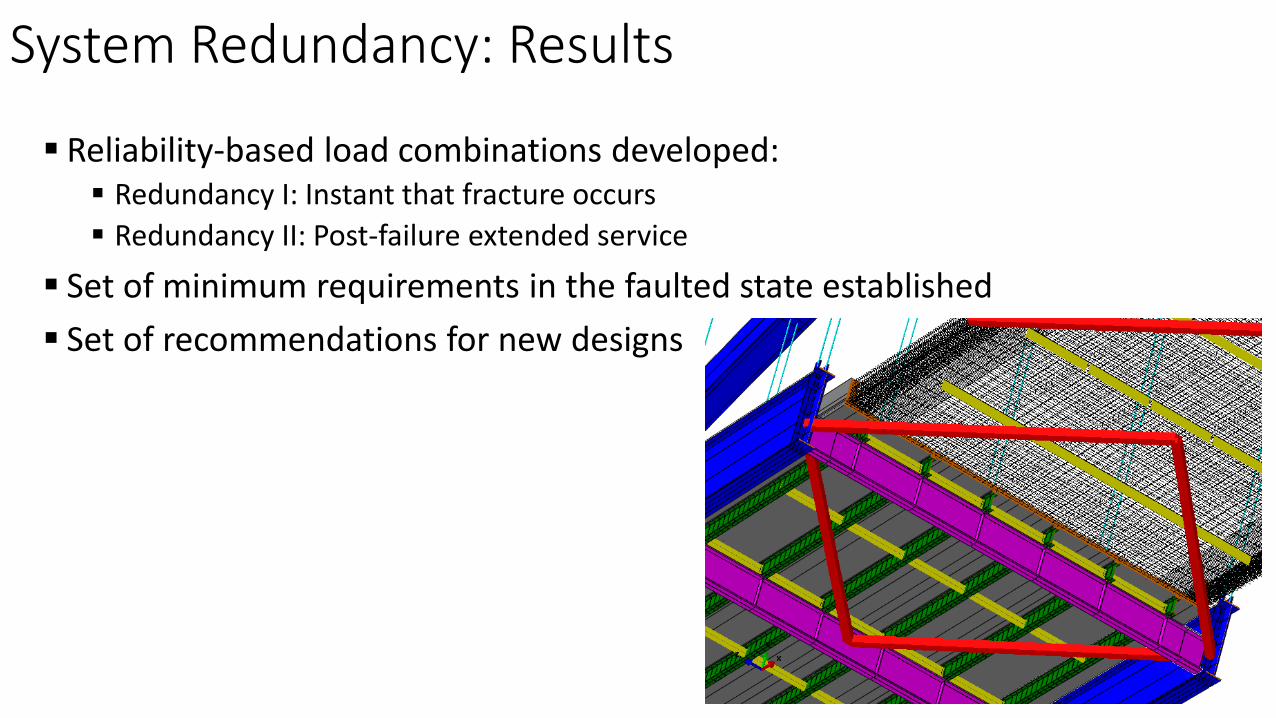
Reliability-based load combinations developed: Redundancy I: Instant that fracture occurs Redundancy II: Post-failure extended service
Set of minimum requirements in the faulted state established Set of recommendations for new designs
System Redundancy: Results
Application of methodology will lead to classification of bridges based on analysis, not opinion Further use of methodology results in simplifications Establishment of inspection practices based on analyzed bridge
performance
System Redundancy: Results
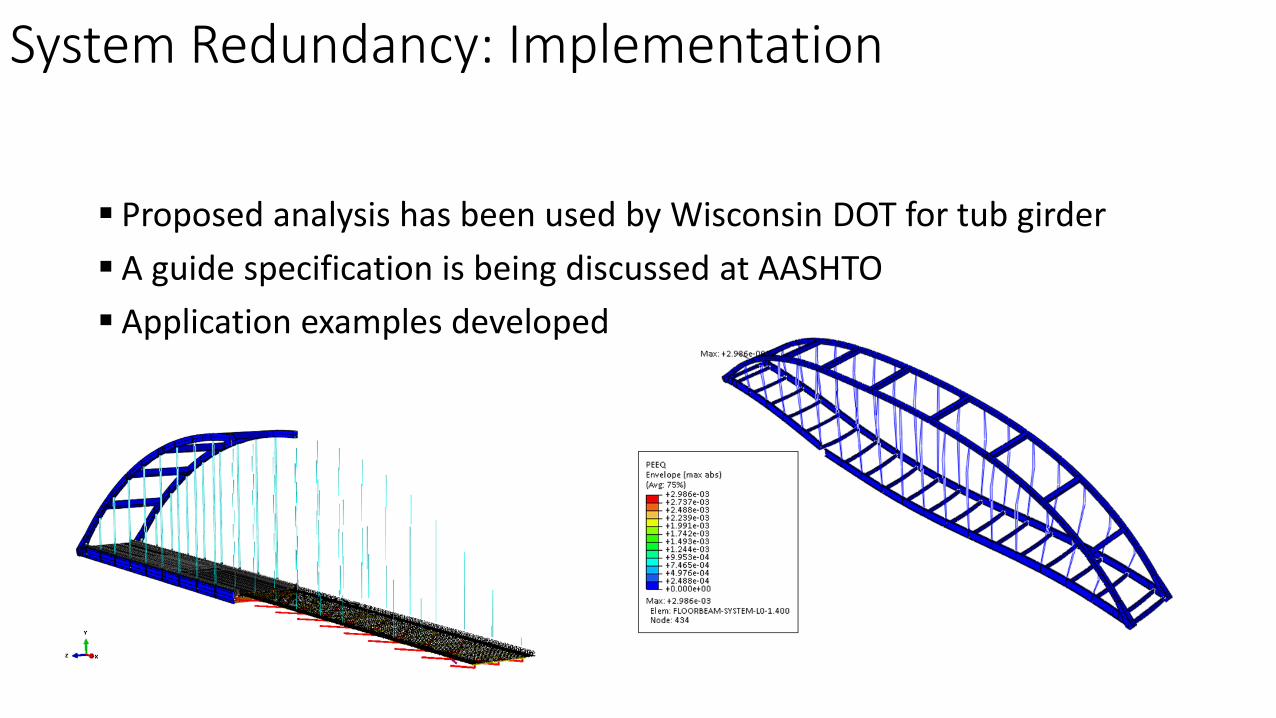
Proposed analysis has been used by Wisconsin DOT for tub girder A guide specification is being discussed at AASHTO Application examples developed
System Redundancy: Implementation

TPF-5(253): Member-level Redundancy inBuilt-up Steel Members
R. Connor, M. Hebdon
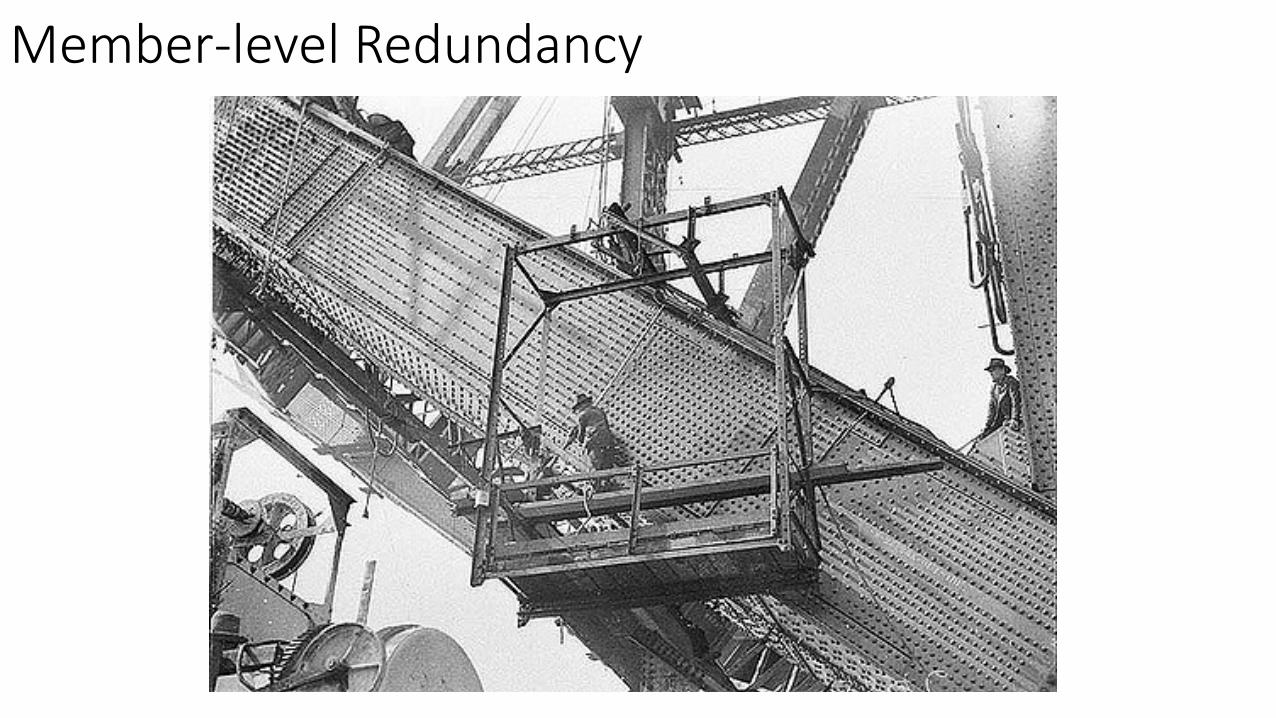
Member-level Redundancy
Member-level Redundancy
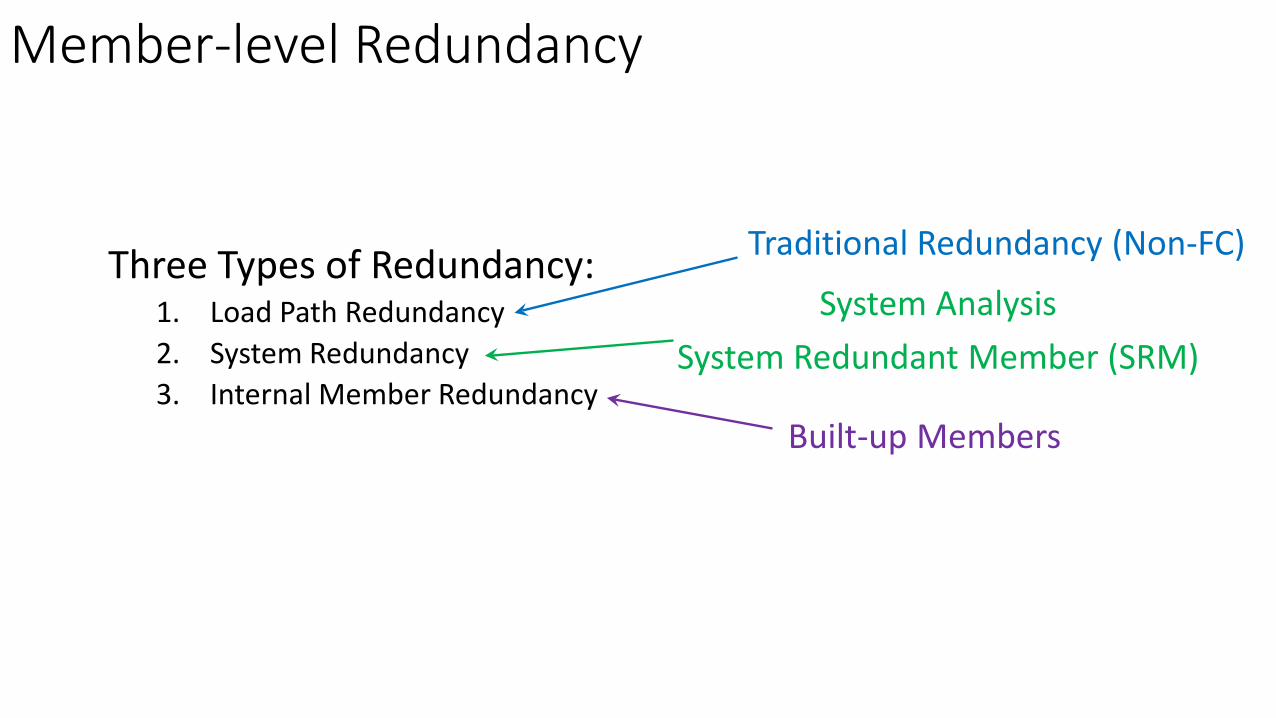
Three Types of Redundancy:1. Load Path Redundancy2. System Redundancy3. Internal Member Redundancy
System AnalysisSystem Redundant Member (SRM)
Built-up Members
Traditional Redundancy (Non-FC)
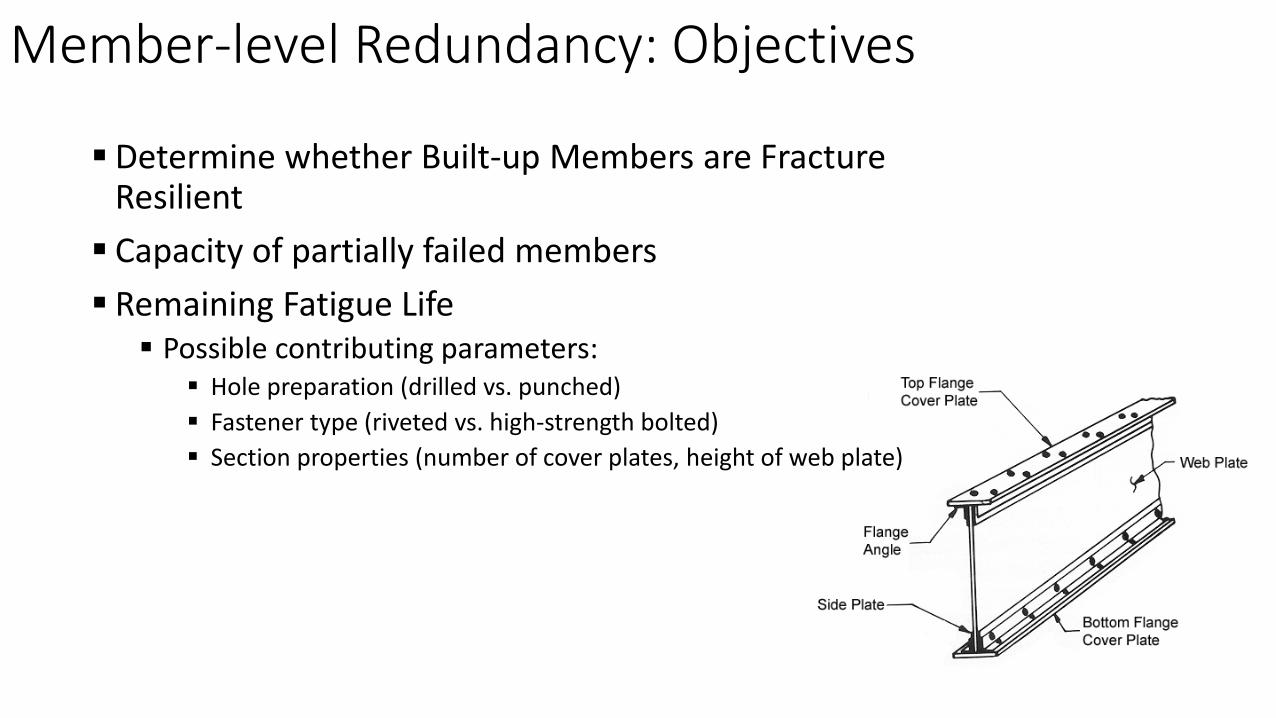
Determine whether Built-up Members are Fracture Resilient Capacity of partially failed members Remaining Fatigue Life Possible contributing parameters:
Hole preparation (drilled vs. punched) Fastener type (riveted vs. high-strength bolted) Section properties (number of cover plates, height of web plate)
Member-level Redundancy: Objectives
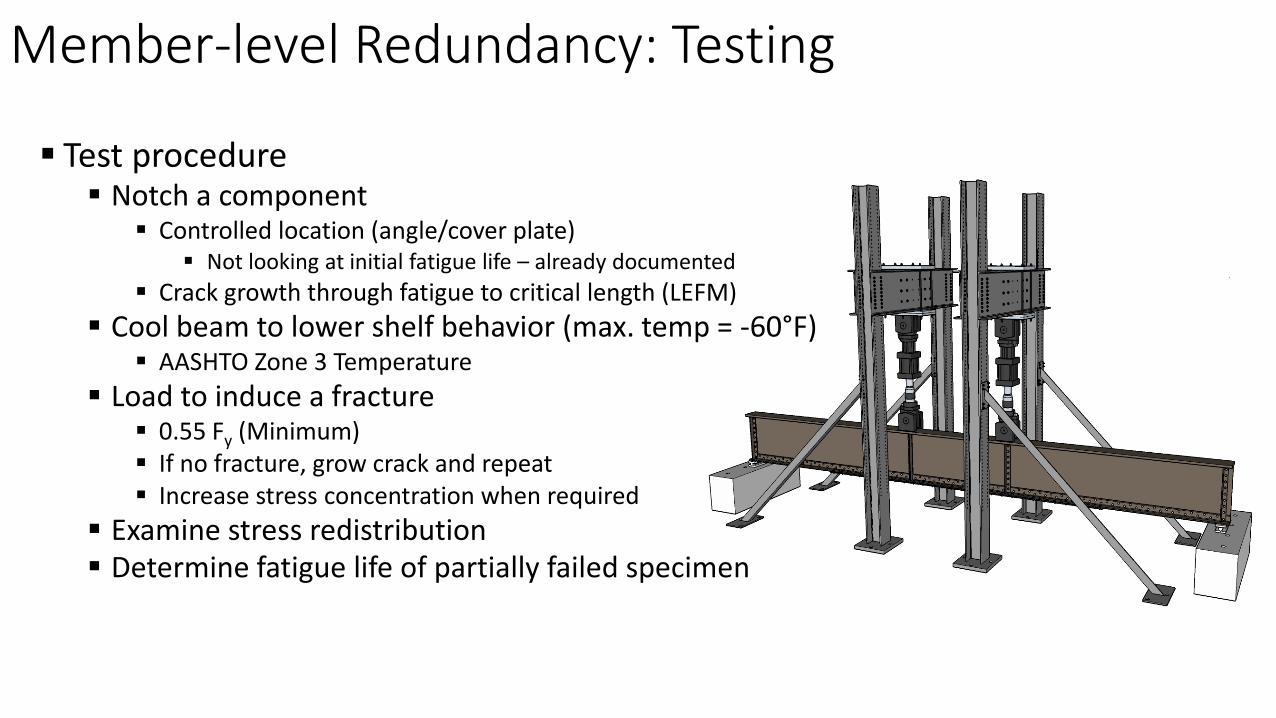
Test procedure Notch a component
Controlled location (angle/cover plate) Not looking at initial fatigue life – already documented
Crack growth through fatigue to critical length (LEFM) Cool beam to lower shelf behavior (max. temp = -60°F)
AASHTO Zone 3 Temperature Load to induce a fracture
0.55 Fy (Minimum) If no fracture, grow crack and repeat Increase stress concentration when required
Examine stress redistribution Determine fatigue life of partially failed specimen
Member-level Redundancy: Testing
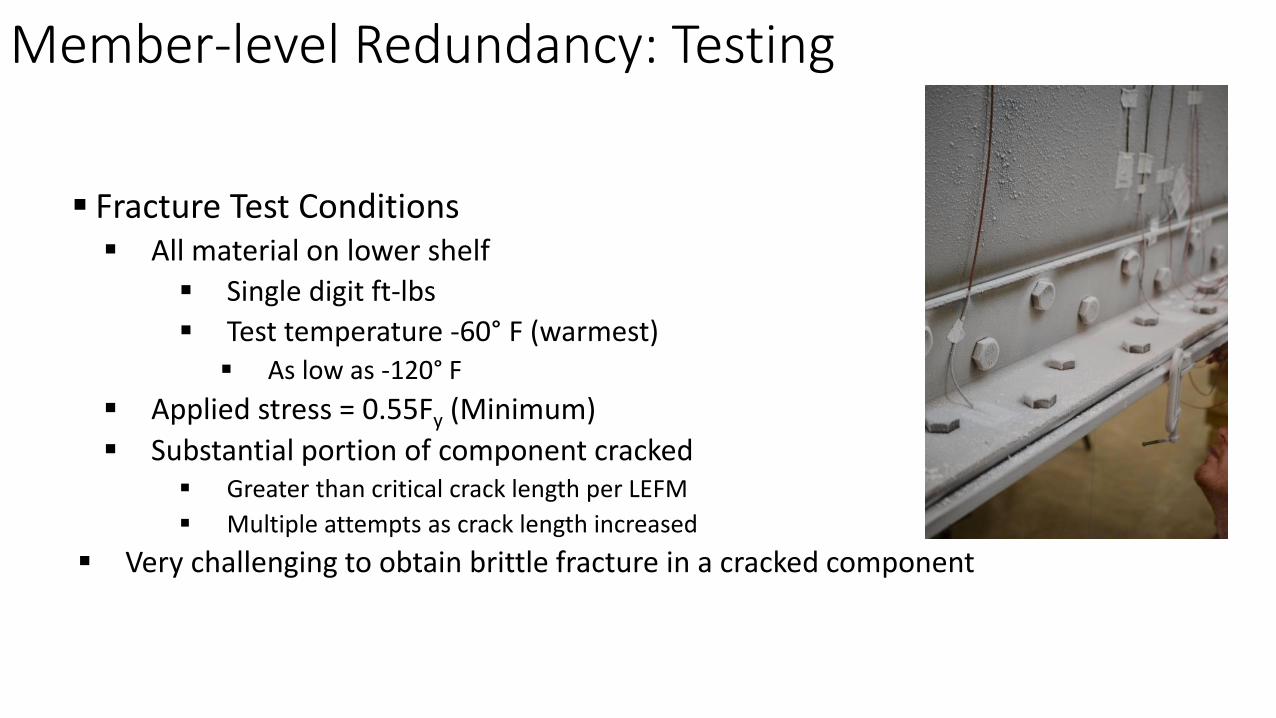
Fracture Test Conditions All material on lower shelf
Single digit ft-lbs Test temperature -60° F (warmest) As low as -120° F
Applied stress = 0.55Fy (Minimum) Substantial portion of component cracked
Greater than critical crack length per LEFM Multiple attempts as crack length increased
Very challenging to obtain brittle fracture in a cracked component
Member-level Redundancy: Testing
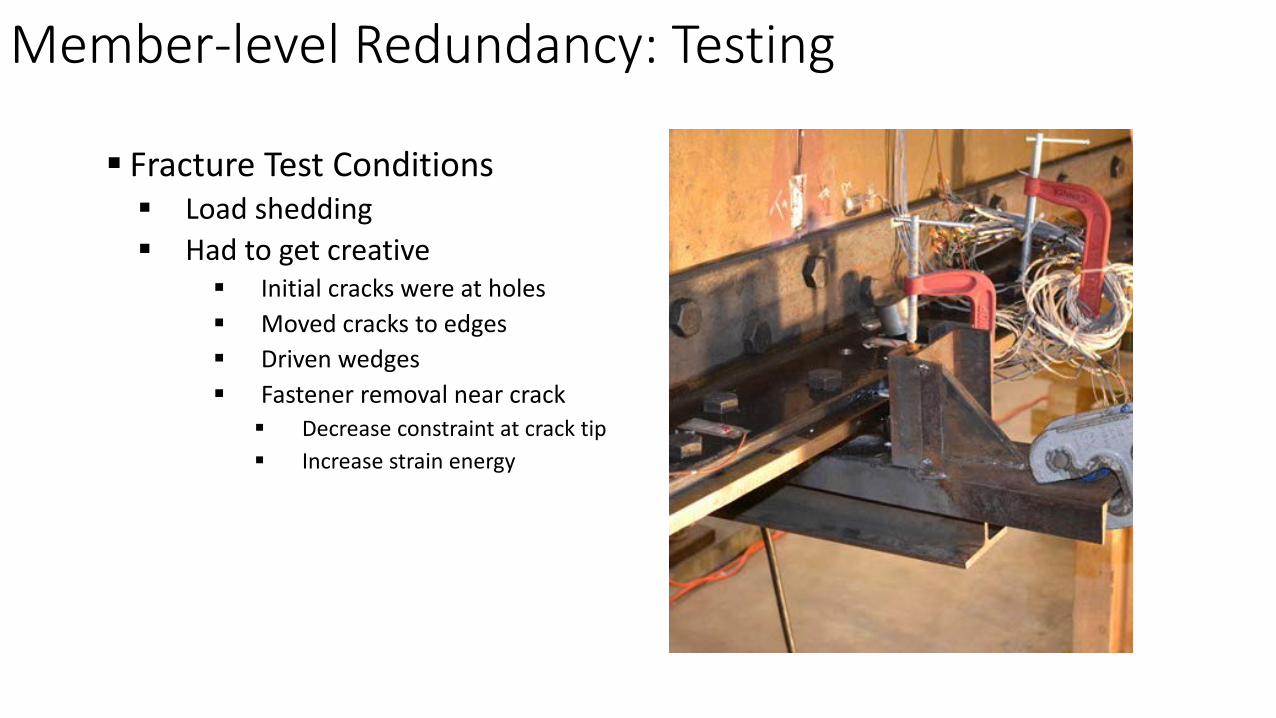
Fracture Test Conditions Load shedding Had to get creative
Initial cracks were at holes Moved cracks to edges Driven wedges Fastener removal near crack Decrease constraint at crack tip Increase strain energy
Member-level Redundancy: Testing
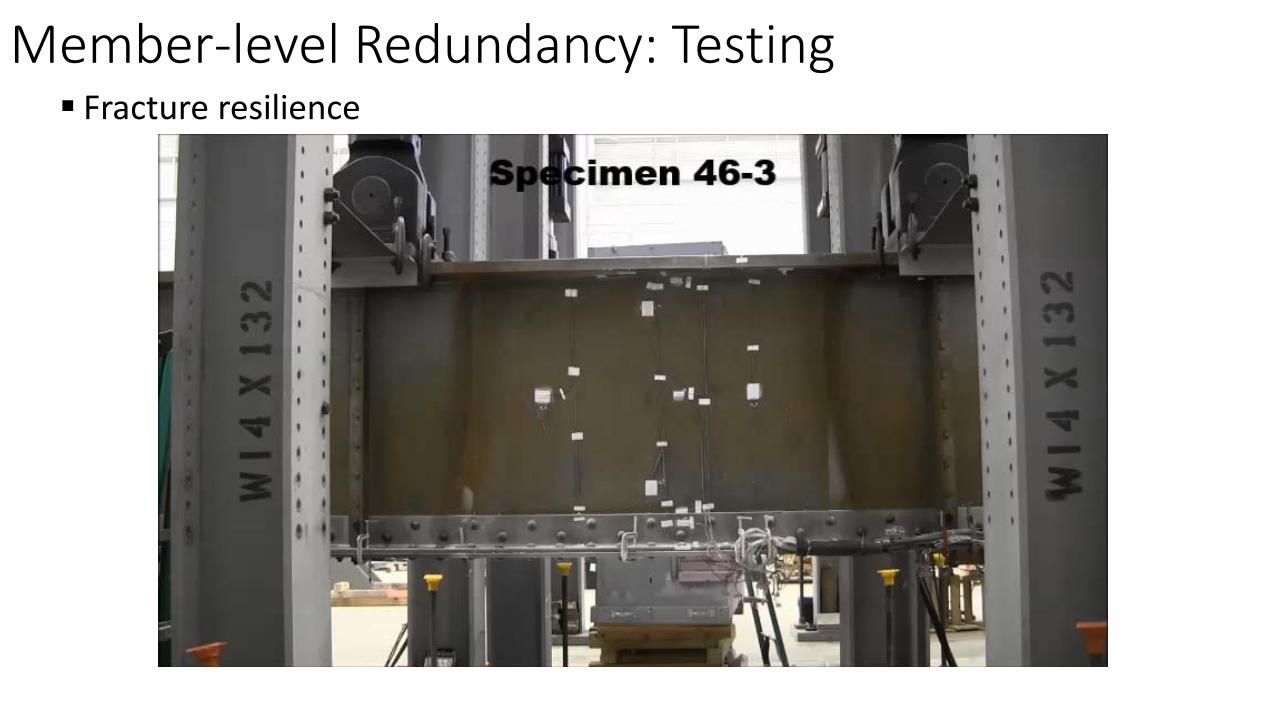
Fracture resilienceMember-level Redundancy: Testing
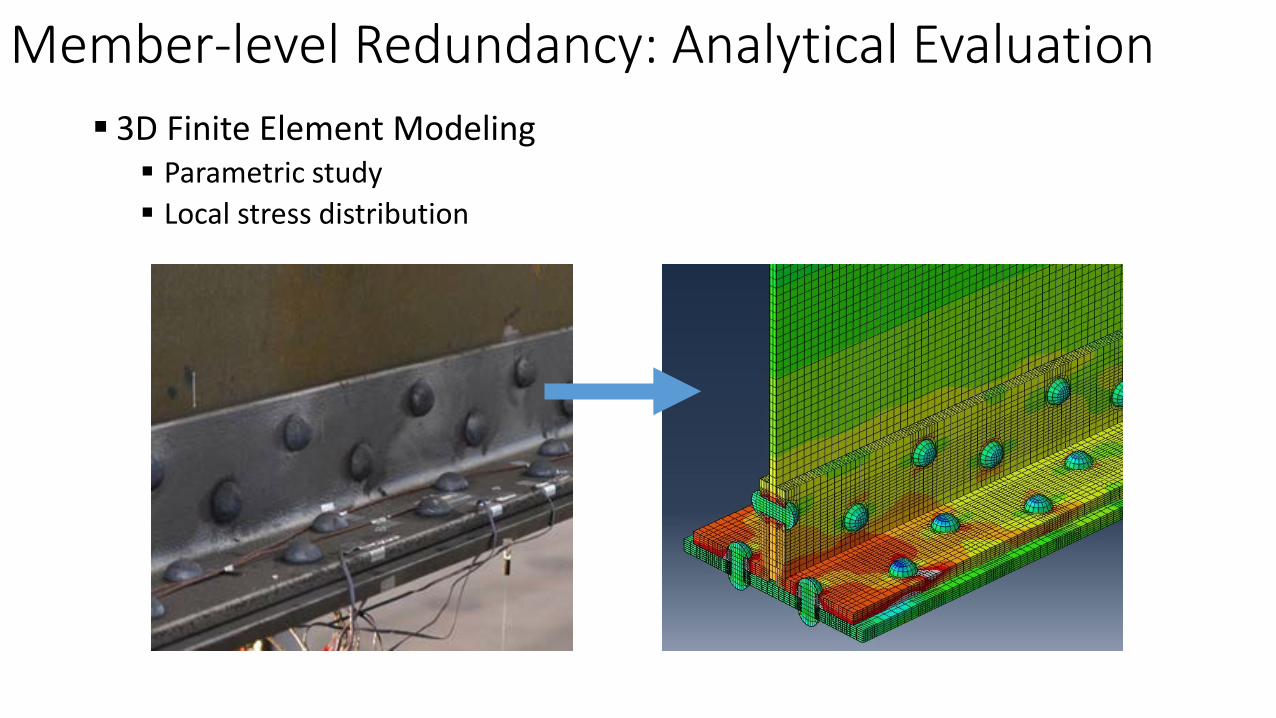
3D Finite Element Modeling Parametric study Local stress distribution
Member-level Redundancy: Analytical Evaluation
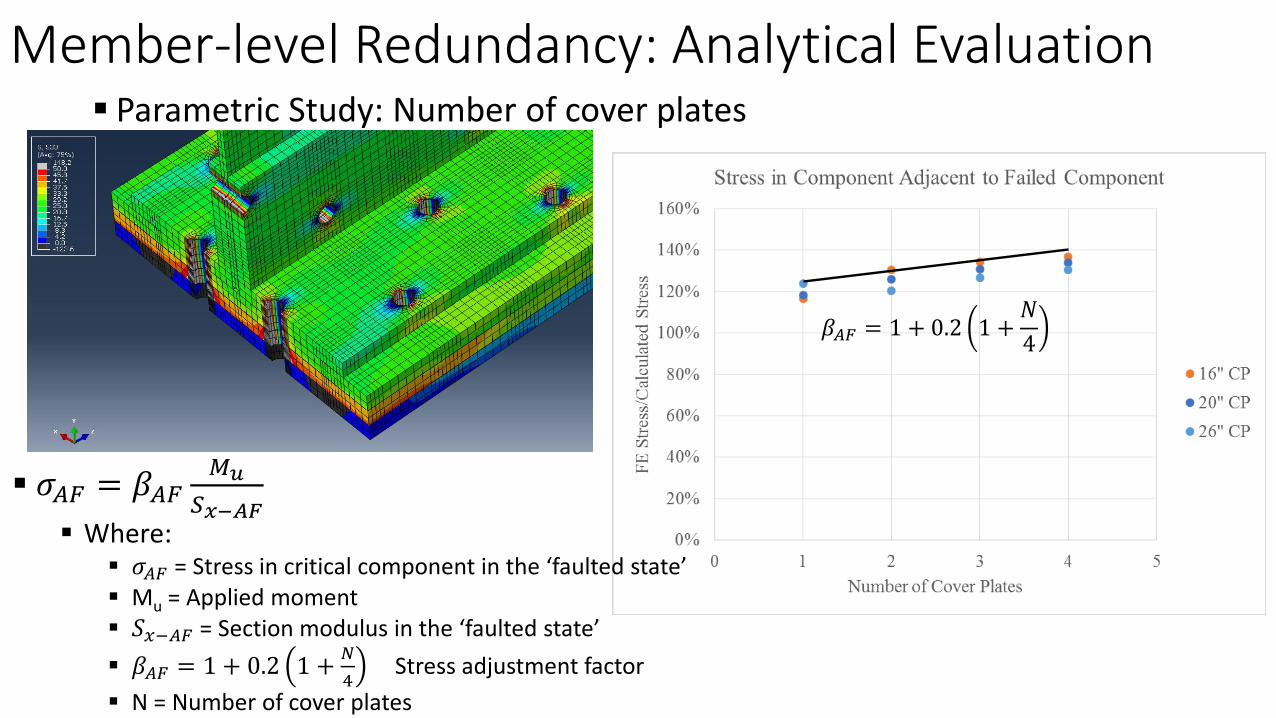
Parametric Study: Number of cover platesMember-level Redundancy: Analytical Evaluation
𝛽𝛽𝐴𝐴𝐴𝐴 = 1 + 0.2 1 +𝑁𝑁4
𝜎𝜎𝐴𝐴𝐴𝐴 = 𝛽𝛽𝐴𝐴𝐴𝐴𝑀𝑀𝑢𝑢
𝑆𝑆𝑥𝑥−𝐴𝐴𝐴𝐴 Where:
𝜎𝜎𝐴𝐴𝐴𝐴 = Stress in critical component in the ‘faulted state’ Mu = Applied moment 𝑆𝑆𝑥𝑥−𝐴𝐴𝐴𝐴 = Section modulus in the ‘faulted state’ 𝛽𝛽𝐴𝐴𝐴𝐴 = 1 + 0.2 1 + 𝑁𝑁
4Stress adjustment factor
N = Number of cover plates
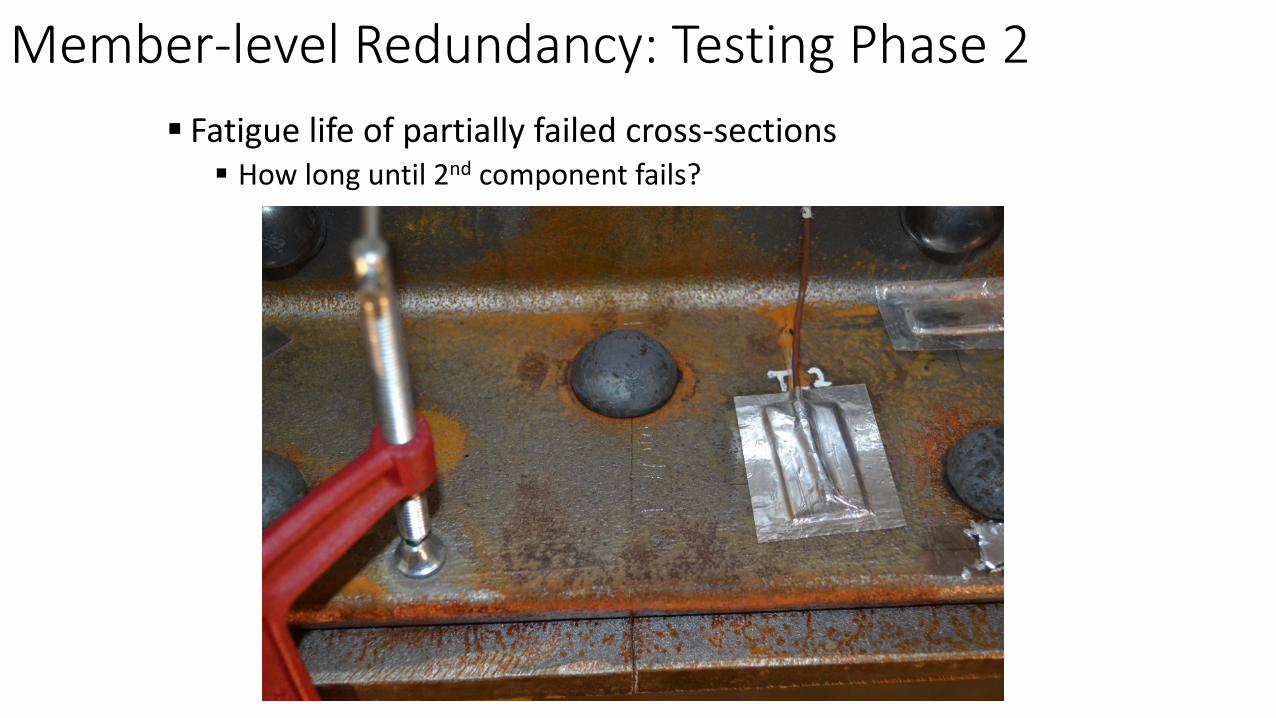
Fatigue life of partially failed cross-sections How long until 2nd component fails?
Member-level Redundancy: Testing Phase 2

Fatigue life of partially failed cross-sections
Member-level Redundancy: Testing Phase 2
Fracture Resilience of Built-up Girders Fracture of an individual component is unlikely Fracture does not propagate into adjacent components
Localized stress redistribution Concentrated in component adjacent to failed
Substantial remaining fatigue life in faulted state Category C for drilled or subpunched & reamed holes Category E’ for punched holes
Member-level Redundancy: Results
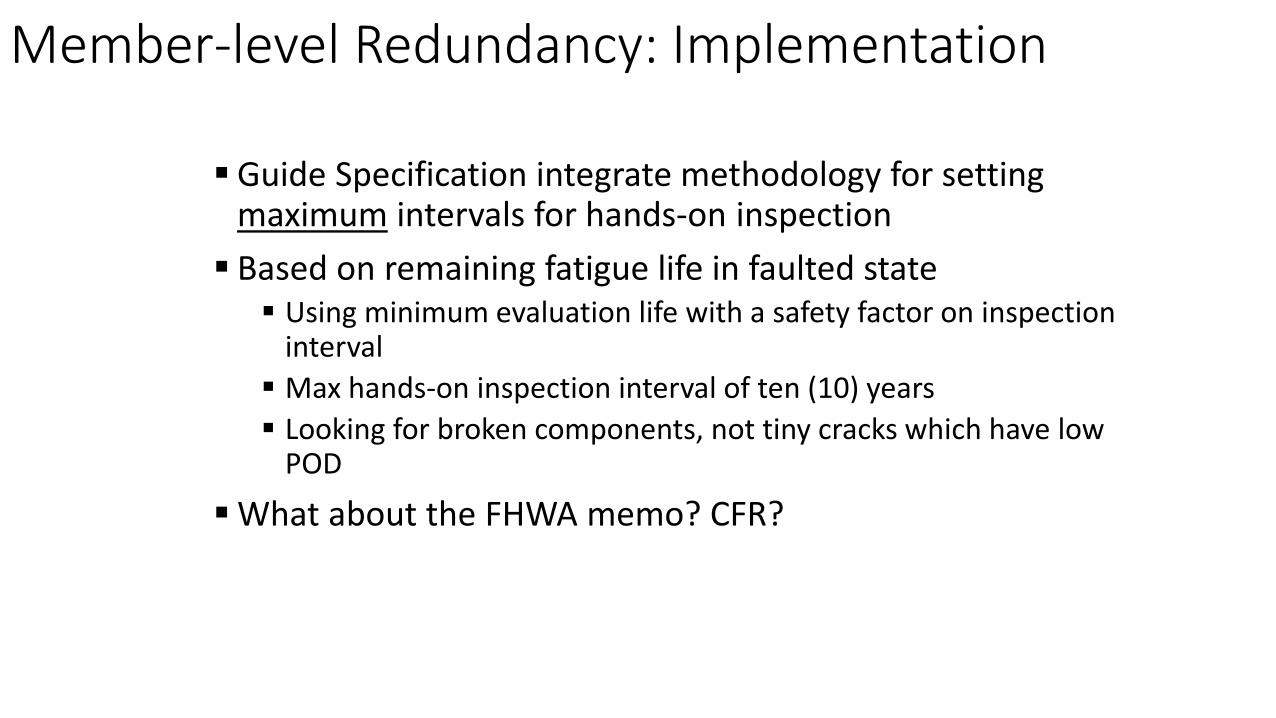
Guide Specification integrate methodology for setting maximum intervals for hands-on inspection Based on remaining fatigue life in faulted state Using minimum evaluation life with a safety factor on inspection
interval Max hands-on inspection interval of ten (10) years Looking for broken components, not tiny cracks which have low
POD
What about the FHWA memo? CFR?
Member-level Redundancy: Implementation
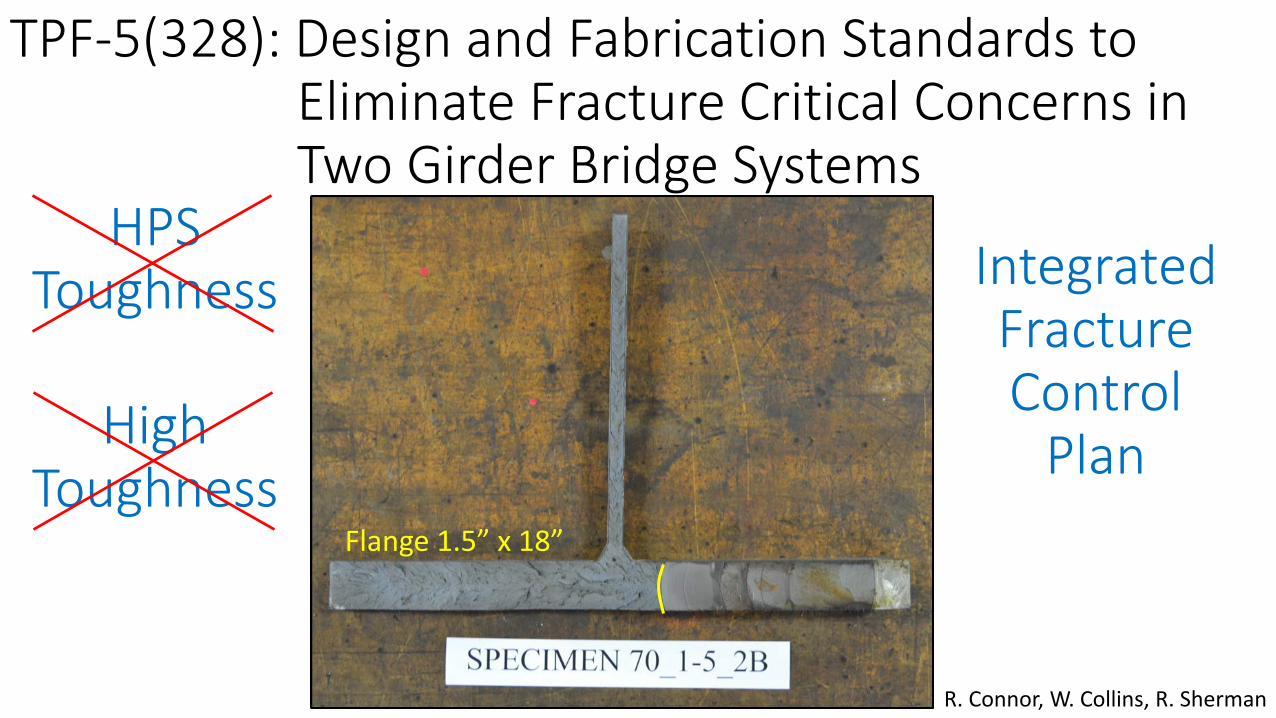
TPF-5(328): Design and Fabrication Standards toEliminate Fracture Critical Concerns inTwo Girder Bridge Systems
R. Connor, W. Collins, R. Sherman
Flange 1.5” x 18”
HPS Toughness
High Toughness
Integrated Fracture Control
Plan
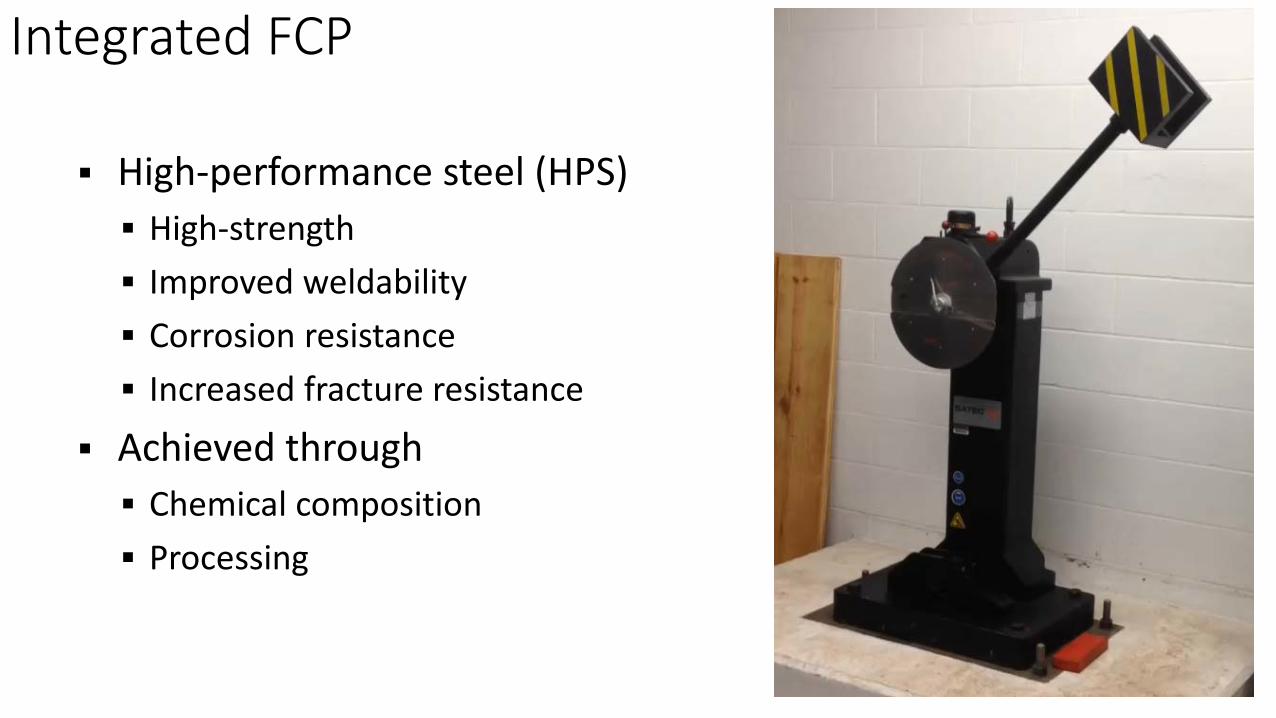
High-performance steel (HPS) High-strength Improved weldability Corrosion resistance Increased fracture resistance
Achieved through Chemical composition Processing
Integrated FCP
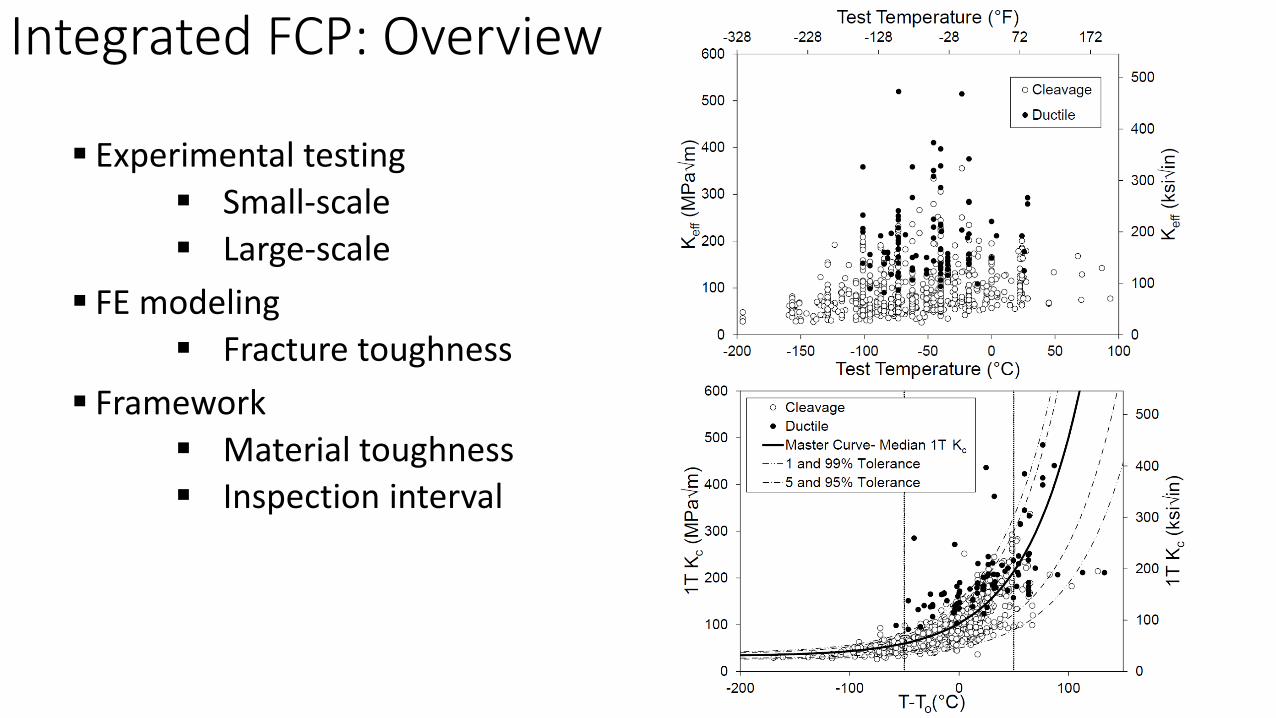
Experimental testing Small-scale Large-scale
FE modeling Fracture toughness
Framework Material toughness Inspection interval
Integrated FCP: Overview
0
50
100
150
200
250
300
350
-180 -150 -120 -90 -60 -30 0 30 60 90
ENER
GY (F
T-LB
)
TEMPERATURE (°F)
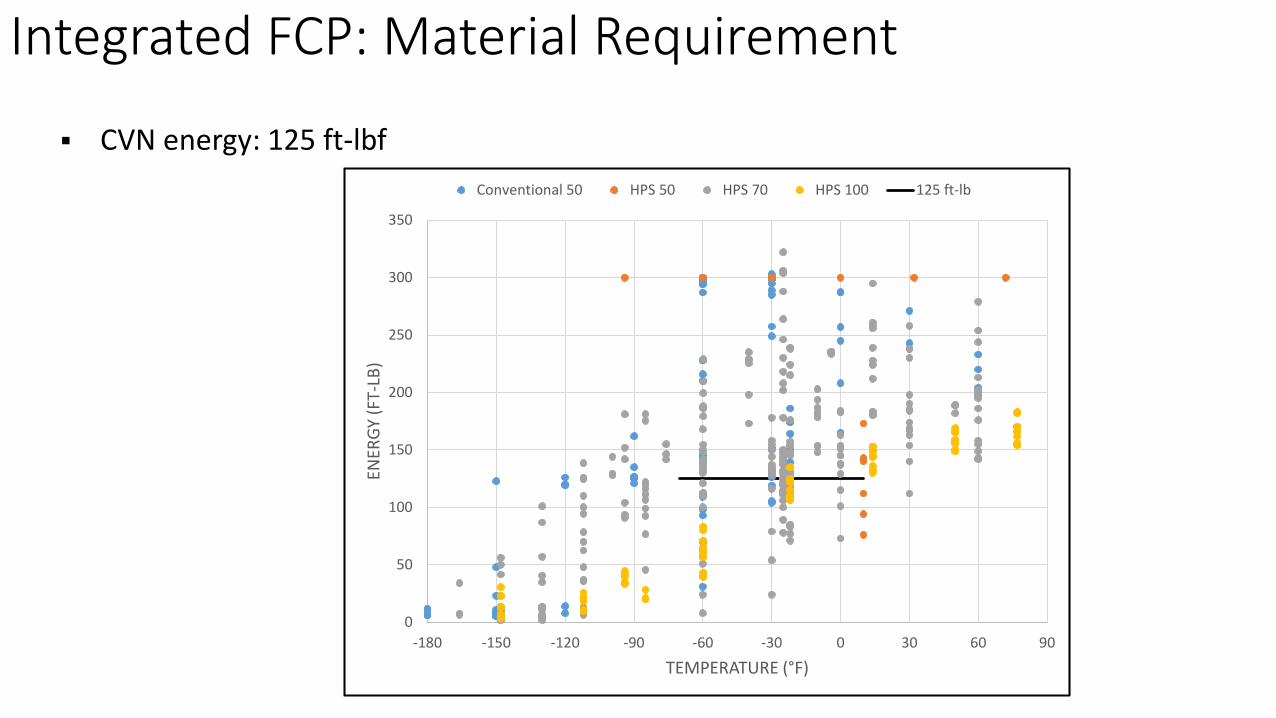
Conventional 50 HPS 50 HPS 70 HPS 100 125 ft-lb
CVN energy: 125 ft-lbf
Integrated FCP: Material Requirement
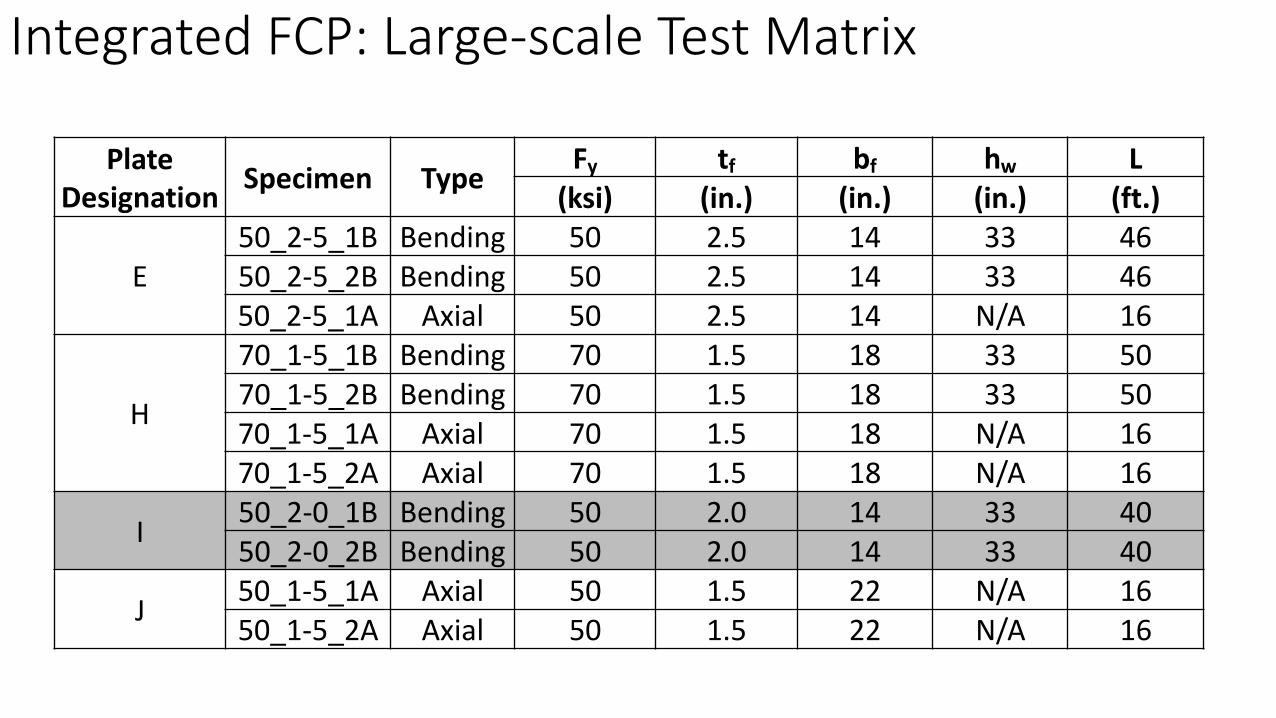
Plate Designation Specimen Type Fy tf bf hw L
(ksi) (in.) (in.) (in.) (ft.)
E50_2-5_1B Bending 50 2.5 14 33 4650_2-5_2B Bending 50 2.5 14 33 4650_2-5_1A Axial 50 2.5 14 N/A 16
H
70_1-5_1B Bending 70 1.5 18 33 5070_1-5_2B Bending 70 1.5 18 33 5070_1-5_1A Axial 70 1.5 18 N/A 1670_1-5_2A Axial 70 1.5 18 N/A 16
I 50_2-0_1B Bending 50 2.0 14 33 4050_2-0_2B Bending 50 2.0 14 33 40
J 50_1-5_1A Axial 50 1.5 22 N/A 1650_1-5_2A Axial 50 1.5 22 N/A 16
Integrated FCP: Large-scale Test Matrix
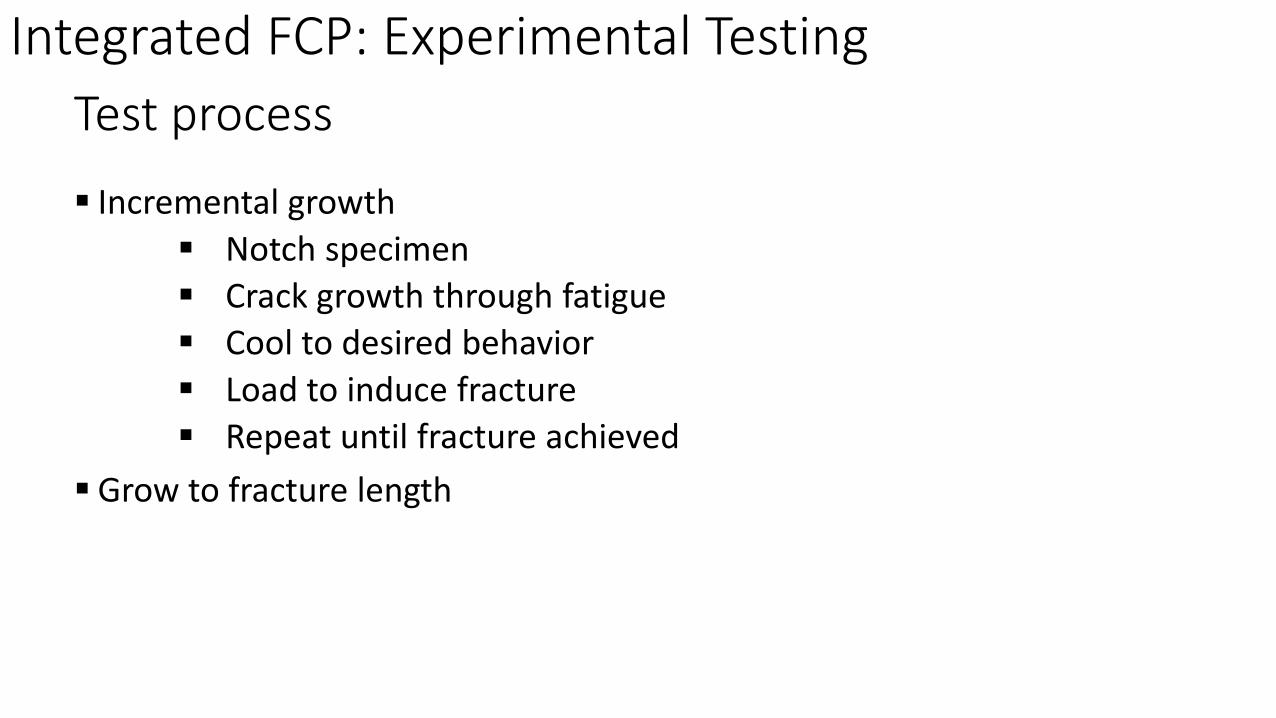
Test process
Incremental growth Notch specimen Crack growth through fatigue Cool to desired behavior Load to induce fracture Repeat until fracture achieved
Grow to fracture length
Integrated FCP: Experimental Testing
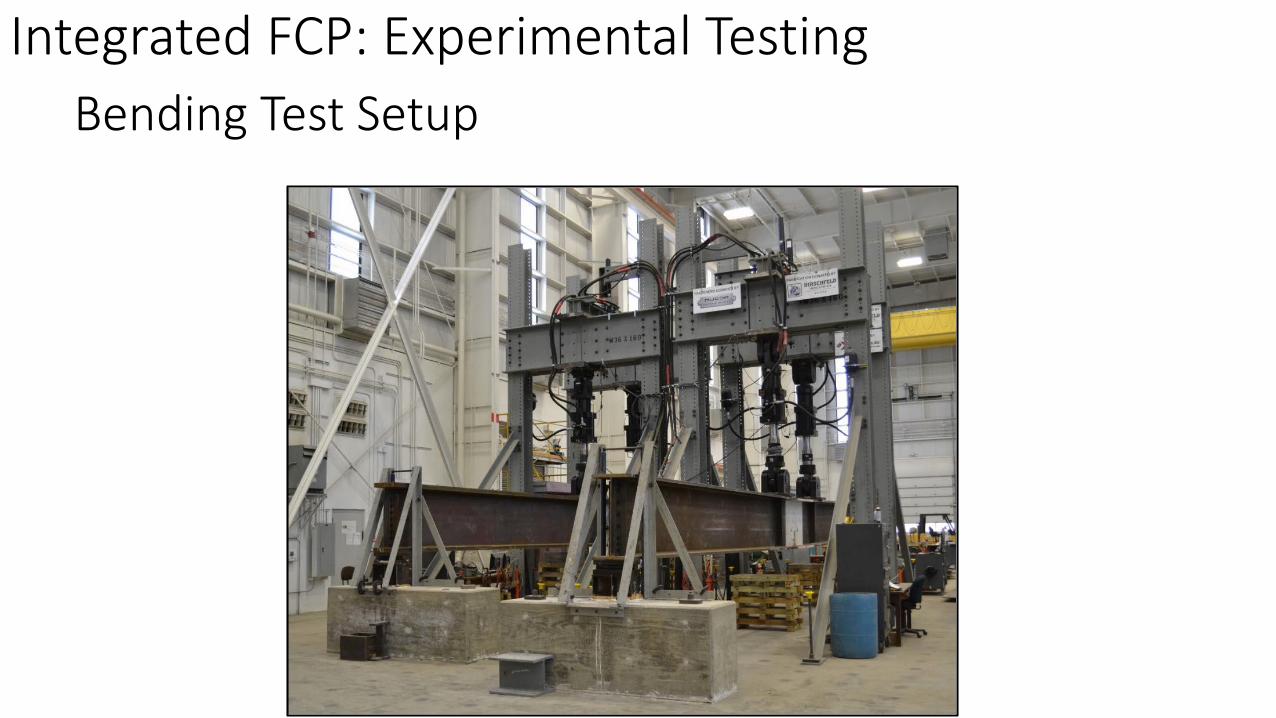
Bending Test SetupIntegrated FCP: Experimental Testing
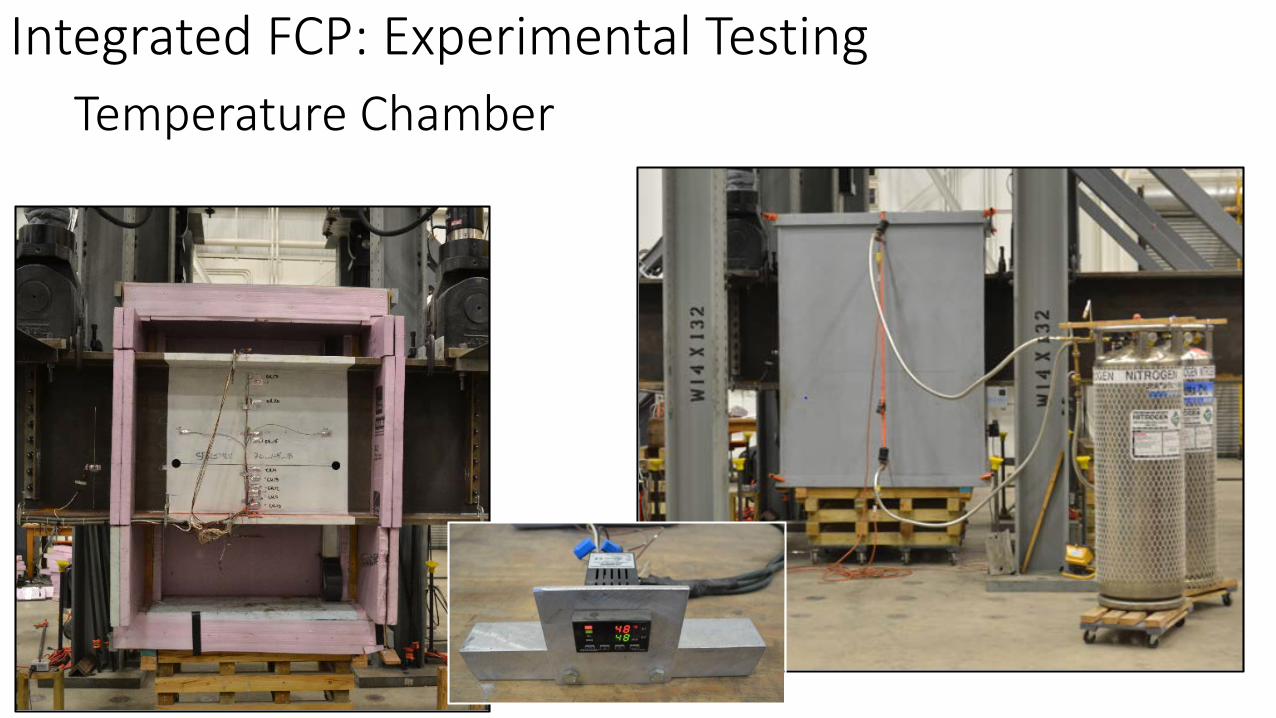
Temperature ChamberIntegrated FCP: Experimental Testing
Bending Fracture TestIntegrated FCP: Experimental Testing
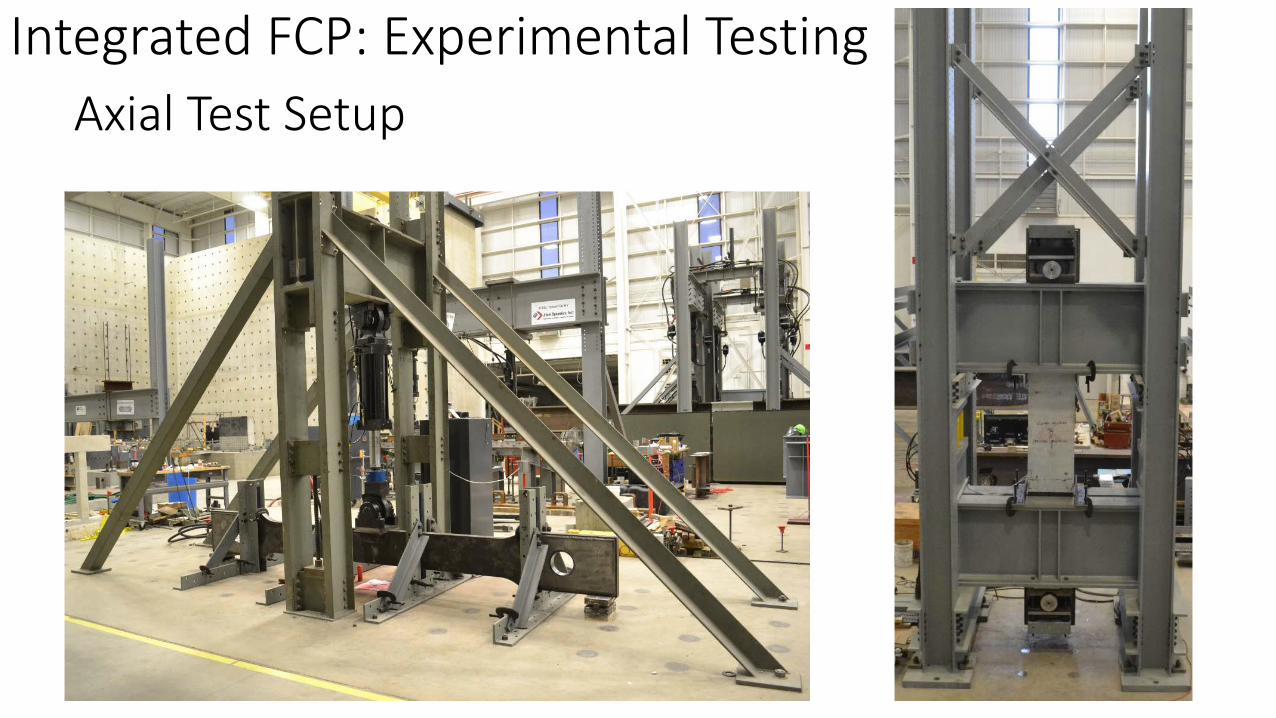
Axial Test SetupIntegrated FCP: Experimental Testing
Axial Fracture TestIntegrated FCP: Experimental Testing
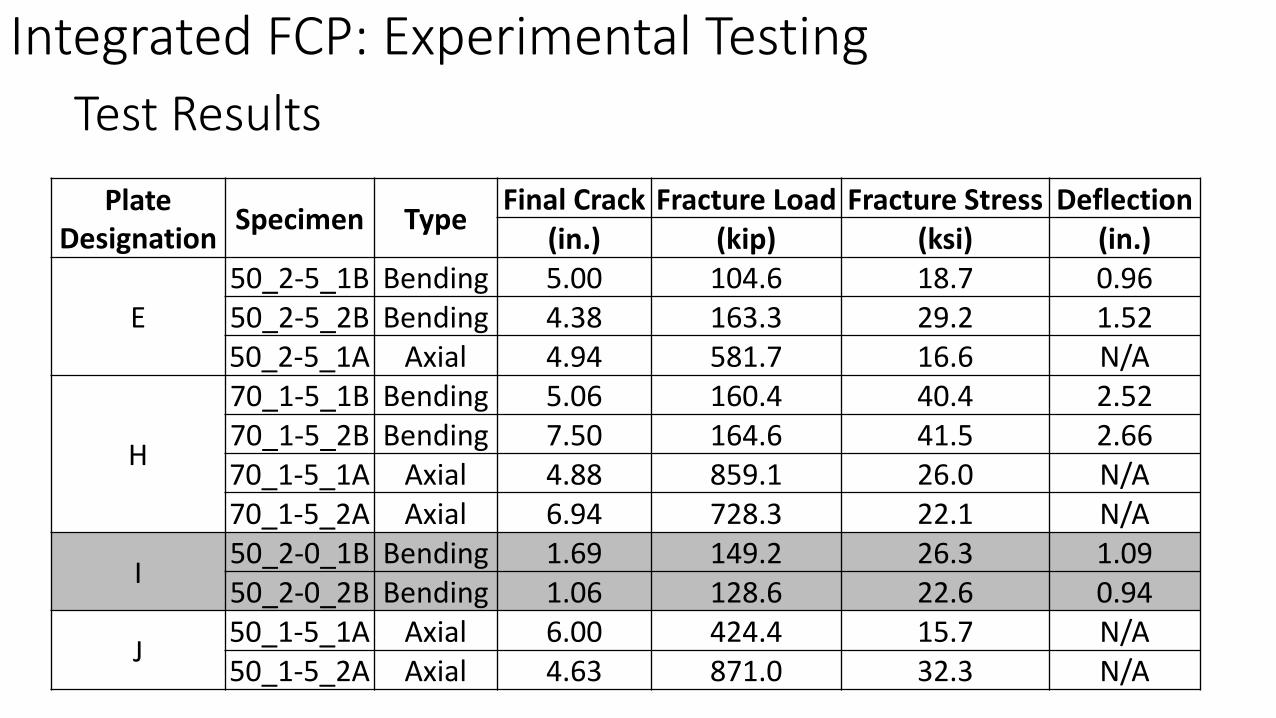
Test ResultsPlate
Designation Specimen Type Final Crack Fracture Load Fracture Stress Deflection(in.) (kip) (ksi) (in.)
E50_2-5_1B Bending 5.00 104.6 18.7 0.9650_2-5_2B Bending 4.38 163.3 29.2 1.5250_2-5_1A Axial 4.94 581.7 16.6 N/A
H
70_1-5_1B Bending 5.06 160.4 40.4 2.5270_1-5_2B Bending 7.50 164.6 41.5 2.6670_1-5_1A Axial 4.88 859.1 26.0 N/A70_1-5_2A Axial 6.94 728.3 22.1 N/A
I 50_2-0_1B Bending 1.69 149.2 26.3 1.0950_2-0_2B Bending 1.06 128.6 22.6 0.94
J 50_1-5_1A Axial 6.00 424.4 15.7 N/A50_1-5_2A Axial 4.63 871.0 32.3 N/A
Integrated FCP: Experimental Testing

General Parameters
Load at failure Crack length at failureMaterial modelGrade 50 and 70 Elastic properties Plastic properties
Solid (continuum) elements
Integrated FCP: Analytical Evaluation
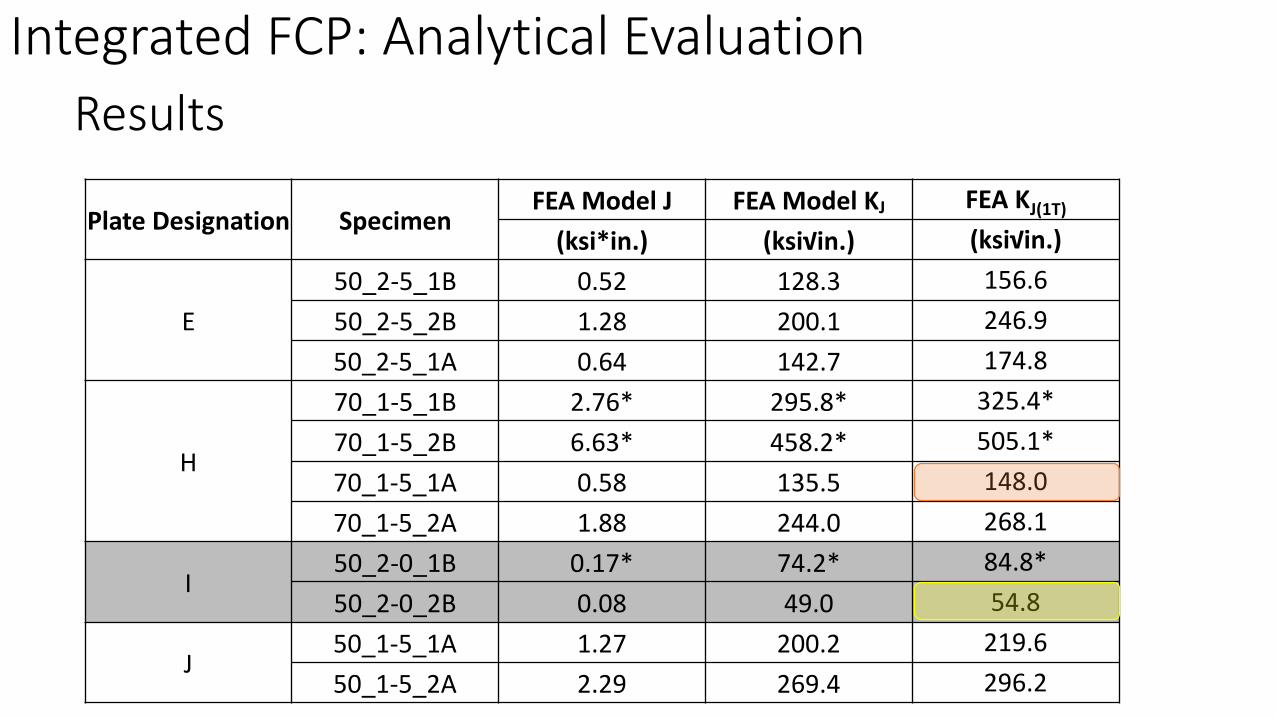
Results
Plate Designation SpecimenFEA Model J FEA Model KJ FEA KJ(1T)
(ksi*in.) (ksi√in.) (ksi√in.)
E50_2-5_1B 0.52 128.3 156.650_2-5_2B 1.28 200.1 246.950_2-5_1A 0.64 142.7 174.8
H
70_1-5_1B 2.76* 295.8* 325.4*70_1-5_2B 6.63* 458.2* 505.1*70_1-5_1A 0.58 135.5 148.070_1-5_2A 1.88 244.0 268.1
I50_2-0_1B 0.17* 74.2* 84.8*50_2-0_2B 0.08 49.0 54.8
J50_1-5_1A 1.27 200.2 219.650_1-5_2A 2.29 269.4 296.2
Integrated FCP: Analytical Evaluation
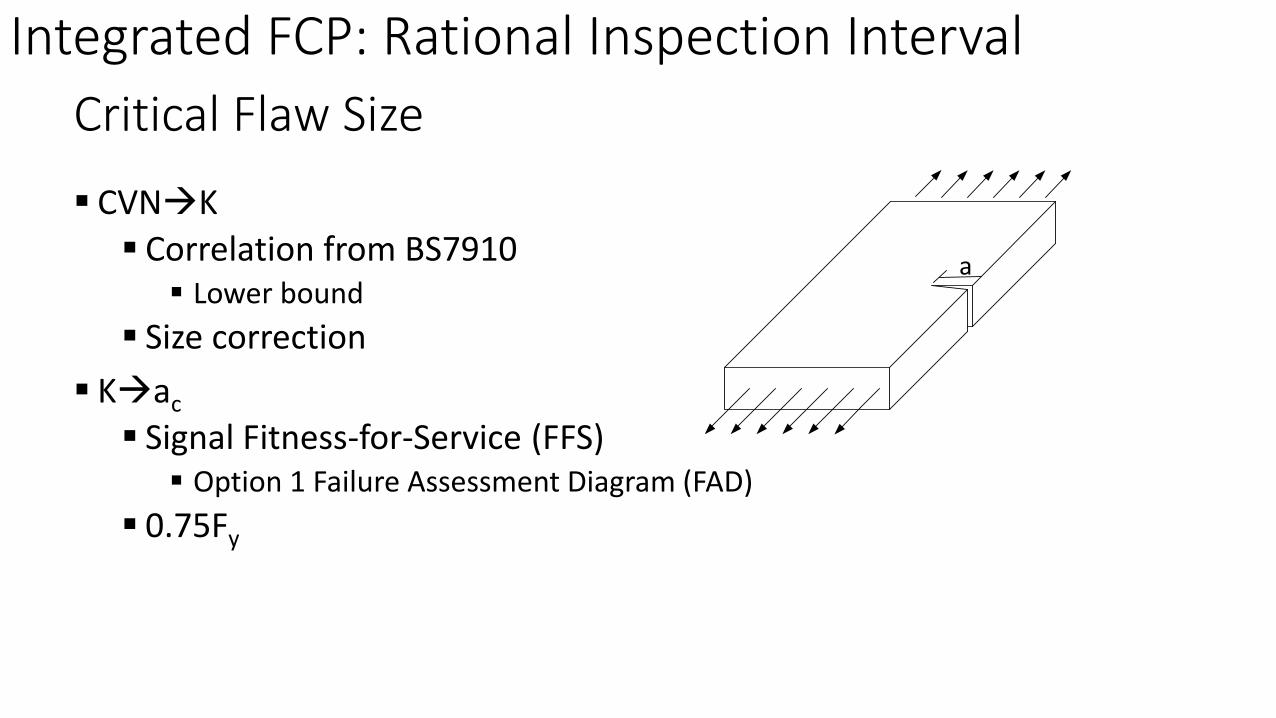
Critical Flaw Size
CVNK Correlation from BS7910 Lower bound
Size correction Kac Signal Fitness-for-Service (FFS) Option 1 Failure Assessment Diagram (FAD)
0.75Fy
a
Integrated FCP: Rational Inspection Interval
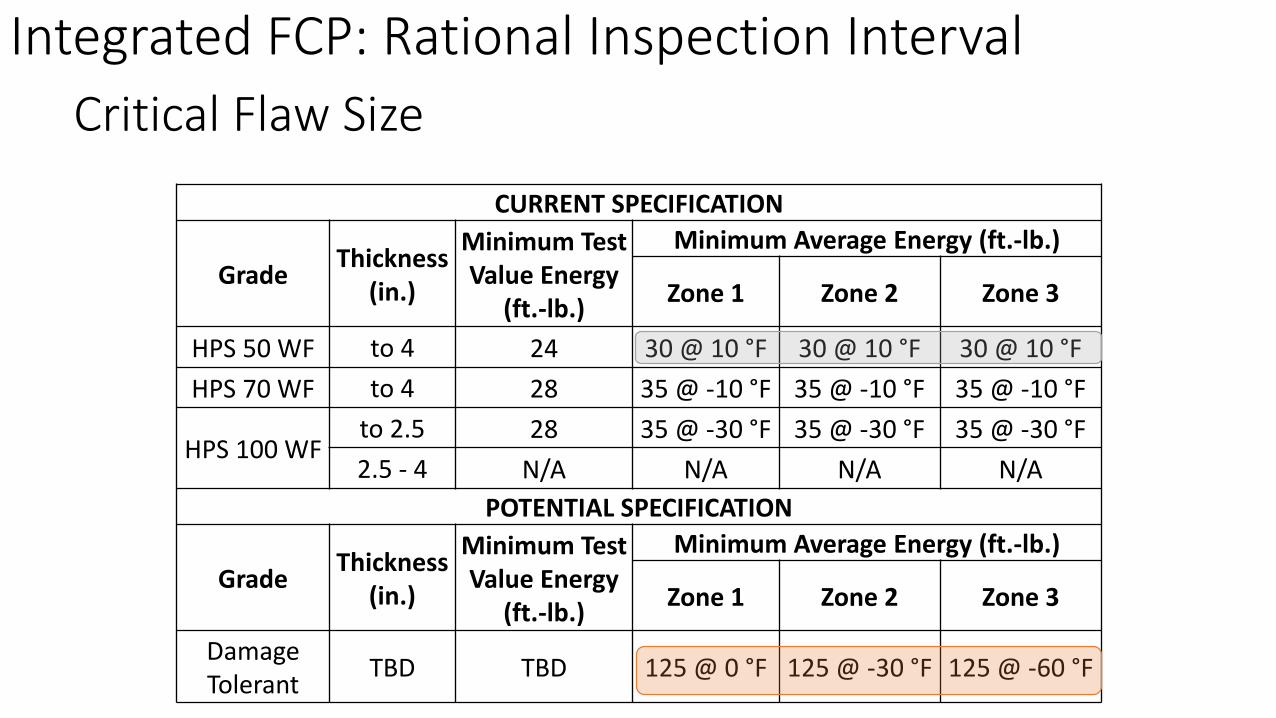
CURRENT SPECIFICATION
Grade Thickness(in.)
Minimum Test Value Energy
(ft.-lb.)
Minimum Average Energy (ft.-lb.)
Zone 1 Zone 2 Zone 3
HPS 50 WF to 4 24 30 @ 10 °F 30 @ 10 °F 30 @ 10 °FHPS 70 WF to 4 28 35 @ -10 °F 35 @ -10 °F 35 @ -10 °F
HPS 100 WFto 2.5 28 35 @ -30 °F 35 @ -30 °F 35 @ -30 °F2.5 - 4 N/A N/A N/A N/A
POTENTIAL SPECIFICATION
Grade Thickness(in.)
Minimum Test Value Energy
(ft.-lb.)
Minimum Average Energy (ft.-lb.)
Zone 1 Zone 2 Zone 3
DamageTolerant TBD TBD 125 @ 0 °F 125 @ -30 °F 125 @ -60 °F
Critical Flaw SizeIntegrated FCP: Rational Inspection Interval
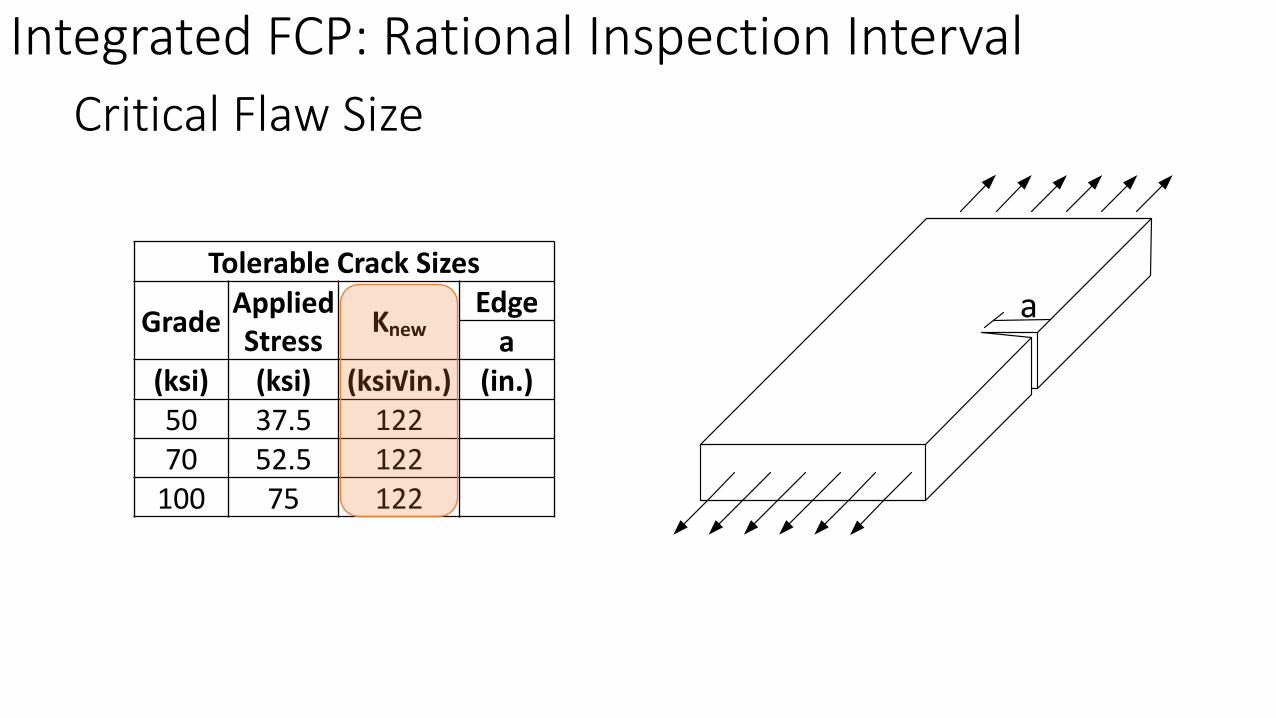
Tolerable Crack Sizes
Grade Applied Stress Knew
Edgea
(ksi) (ksi) (ksi√in.) (in.)50 37.5 12270 52.5 122
100 75 122
Critical Flaw Size
a
Integrated FCP: Rational Inspection Interval
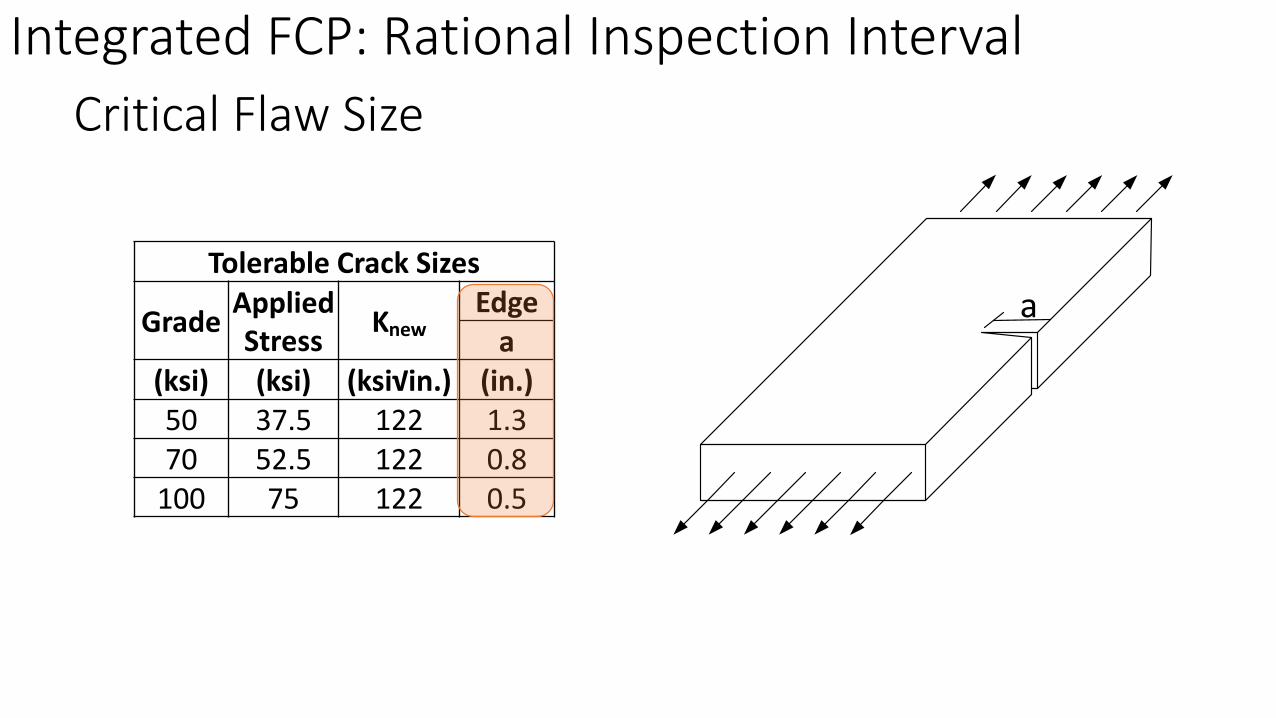
Tolerable Crack Sizes
Grade Applied Stress Knew
Edgea
(ksi) (ksi) (ksi√in.) (in.)50 37.5 122 1.370 52.5 122 0.8
100 75 122 0.5
Critical Flaw Size
a
Integrated FCP: Rational Inspection Interval
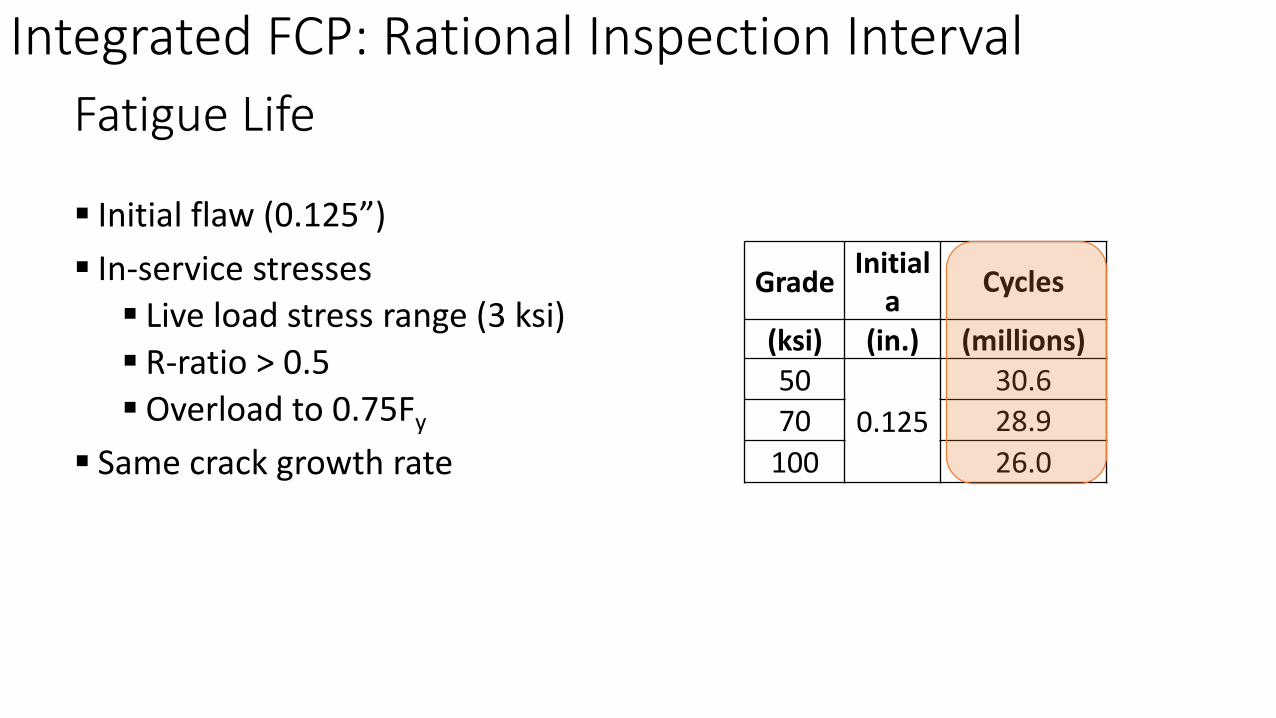
Initial flaw (0.125”) In-service stresses Live load stress range (3 ksi) R-ratio > 0.5 Overload to 0.75Fy
Same crack growth rate
Grade Initiala Cycles
(ksi) (in.) (millions)50
0.12530.6
70 28.9100 26.0
Fatigue LifeIntegrated FCP: Rational Inspection Interval
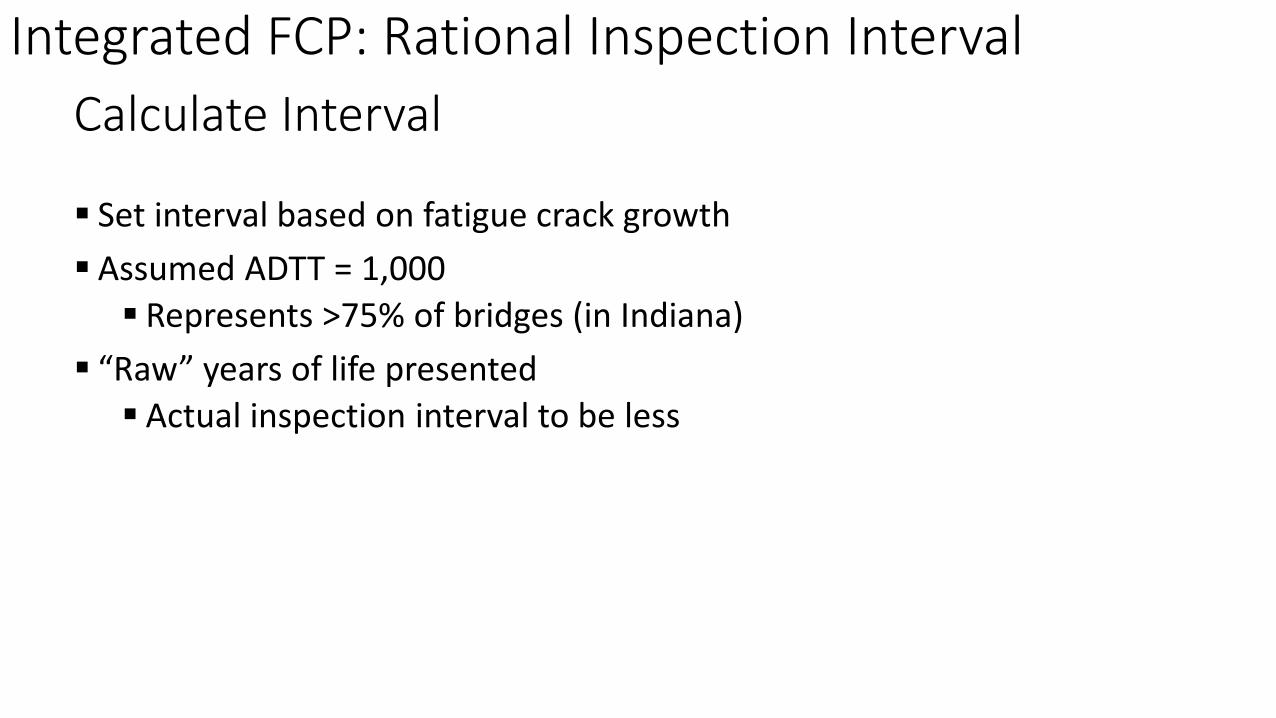
Set interval based on fatigue crack growth Assumed ADTT = 1,000 Represents >75% of bridges (in Indiana)
“Raw” years of life presented Actual inspection interval to be less
Calculate IntervalIntegrated FCP: Rational Inspection Interval
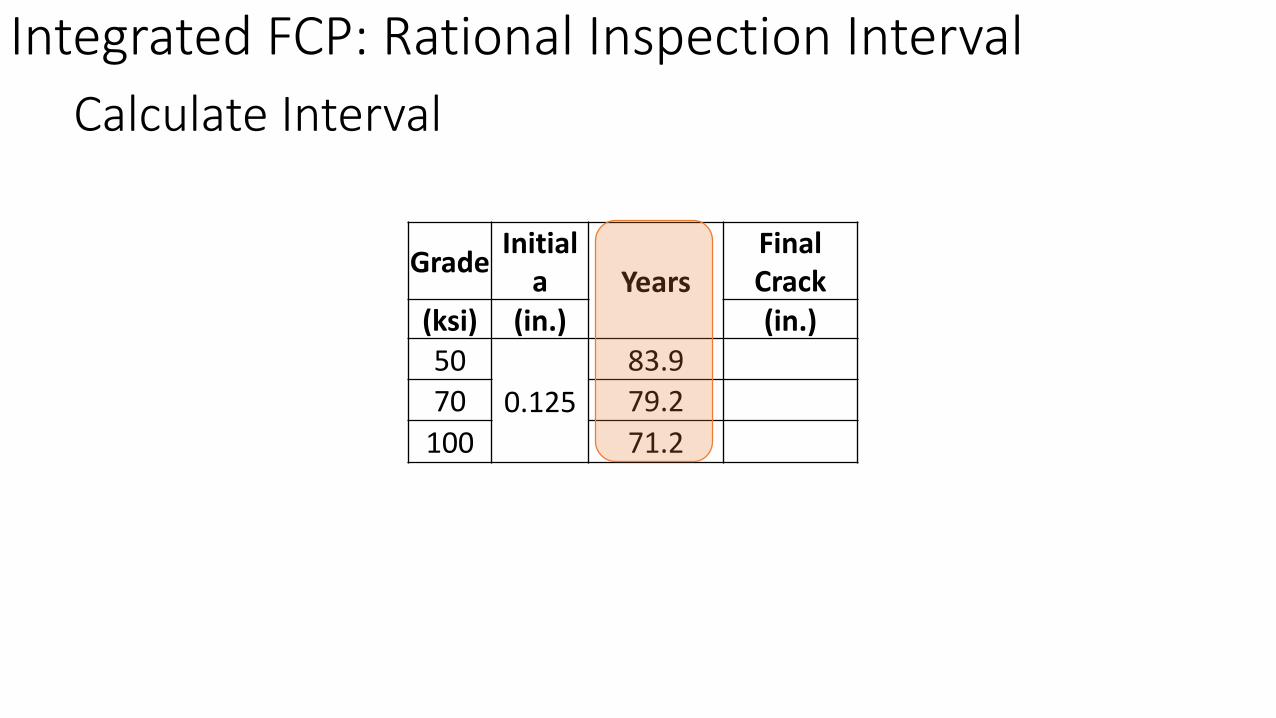
Grade Initial a Years
Final Crack
(ksi) (in.) (in.)50
0.12583.9
70 79.2100 71.2
Calculate IntervalIntegrated FCP: Rational Inspection Interval
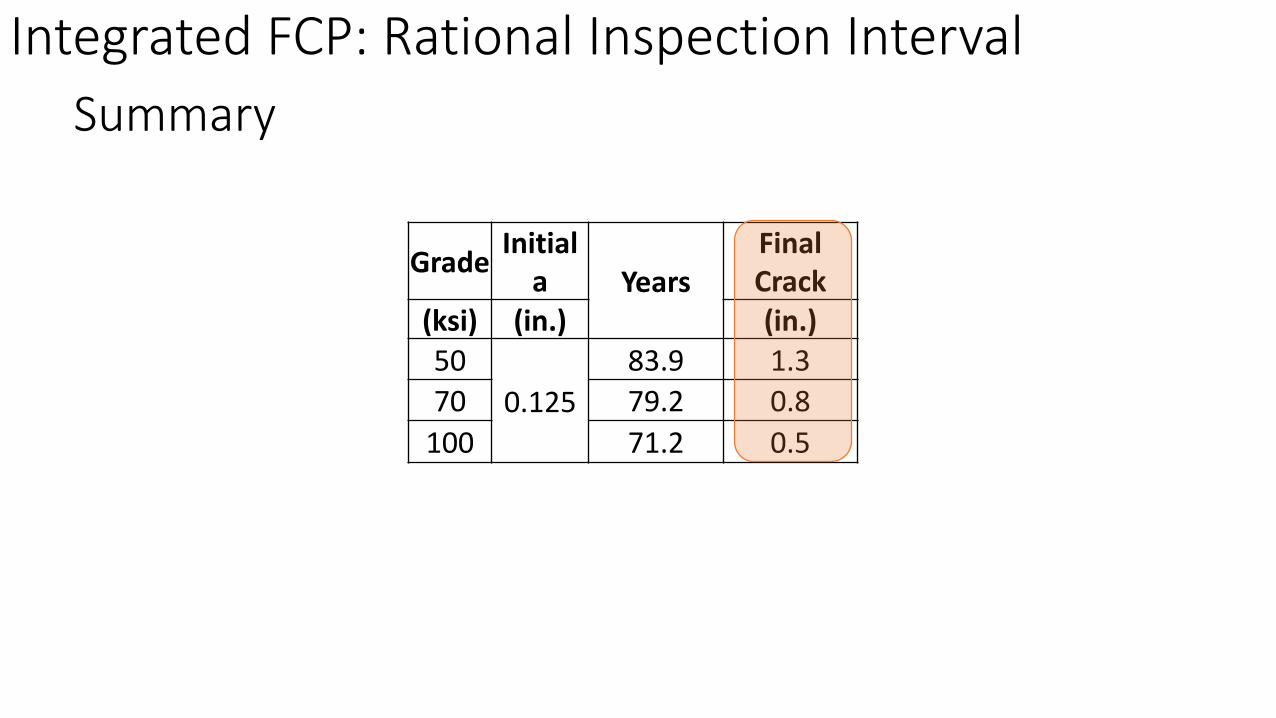
Grade Initial a Years
Final Crack
(ksi) (in.) (in.)50
0.12583.9 1.3
70 79.2 0.8100 71.2 0.5
SummaryIntegrated FCP: Rational Inspection Interval
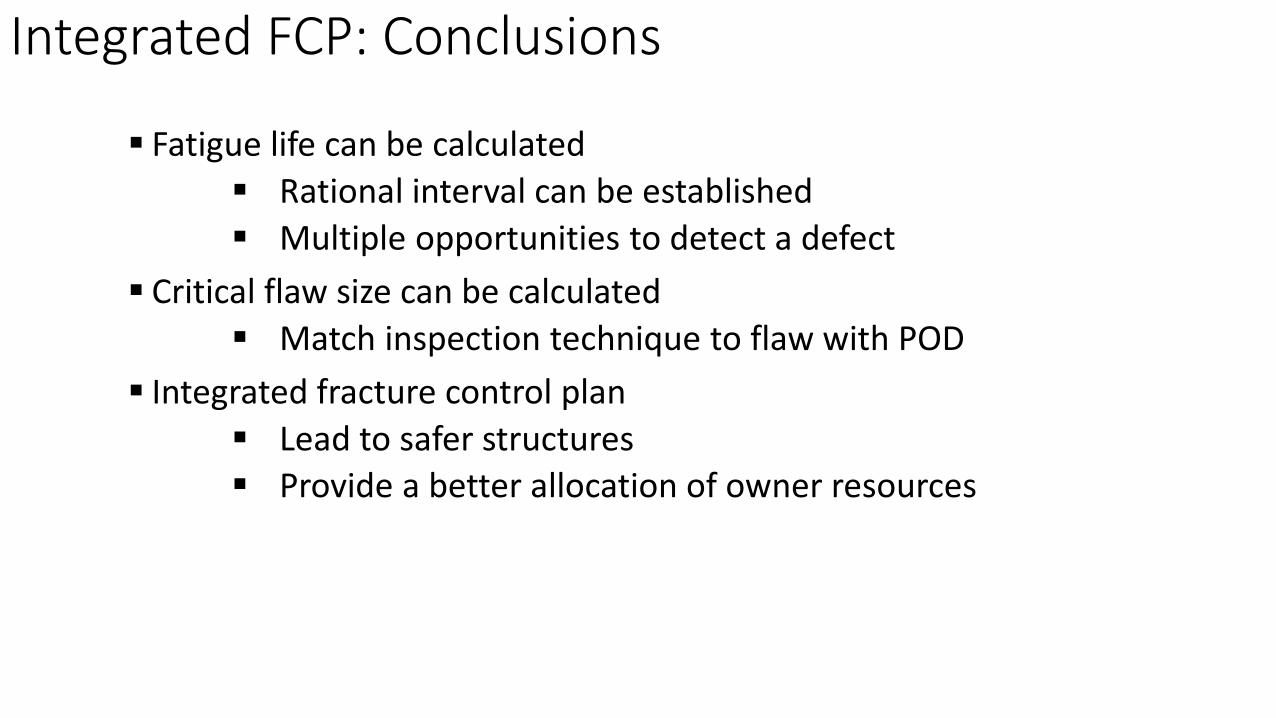
Fatigue life can be calculated Rational interval can be established Multiple opportunities to detect a defect
Critical flaw size can be calculated Match inspection technique to flaw with POD
Integrated fracture control plan Lead to safer structures Provide a better allocation of owner resources
Integrated FCP: Conclusions

Acknowledgements
Robert Connor, Purdue UniversityFrancisco Bonachera Martin, Purdue University
Matthew Hebdon, Virginia Tech
Ryan Sherman, University of Nevada Las Vegas

Thank You!
William Collins, Ph.D., P.E.Assistant Professor
University of Kansas
Office: 785.864.0672E-mail: [email protected]
Additional Material
Fracture Mechanics Introduction
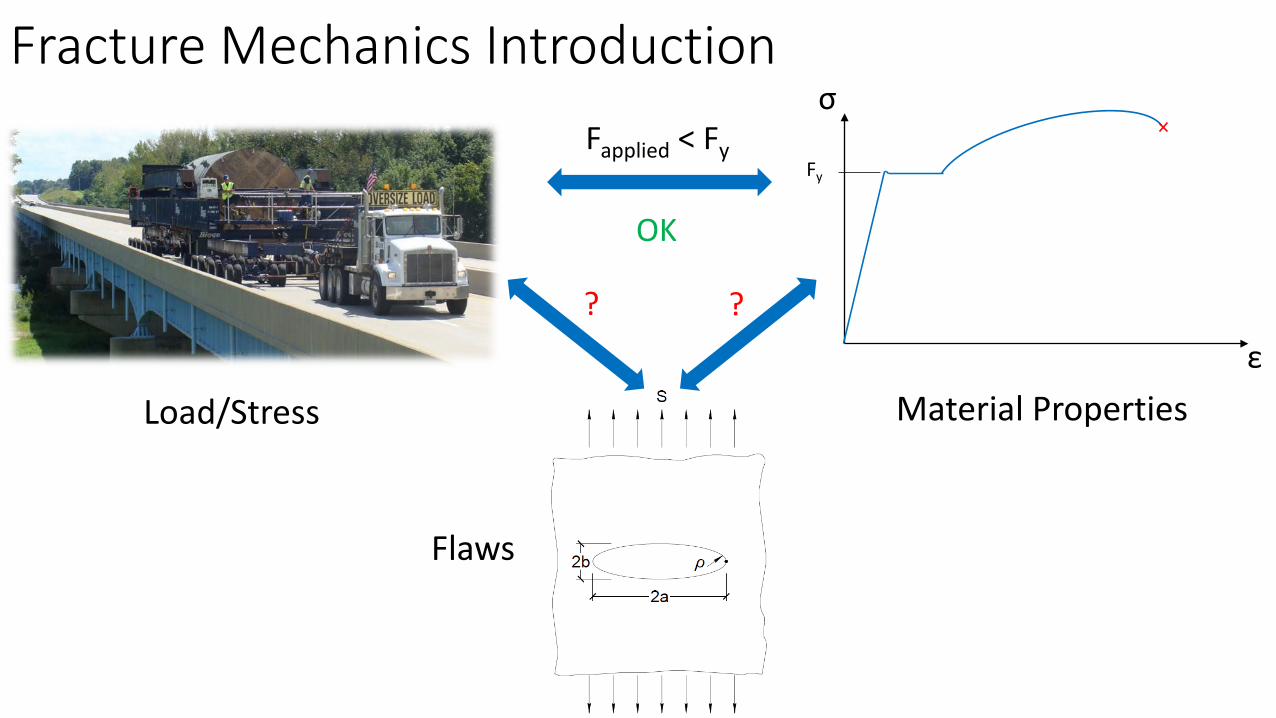
Fracture Mechanics Introductionσ
εMaterial PropertiesLoad/Stress
Fy
Fapplied < Fy
OK
Flaws
? ?
Fracture Mechanics Introduction
P
P
P
P
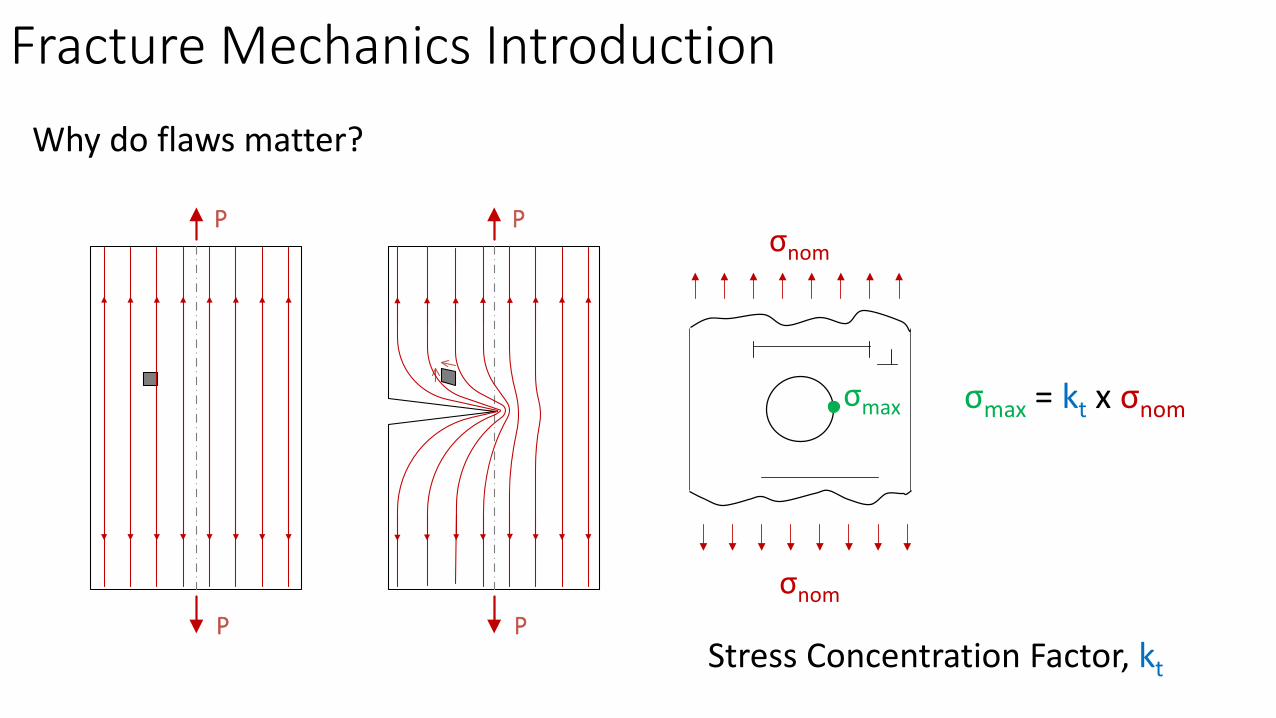
Why do flaws matter?
Stress Concentration Factor, kt
σnom
σnom
σmax σmax = kt x σnom
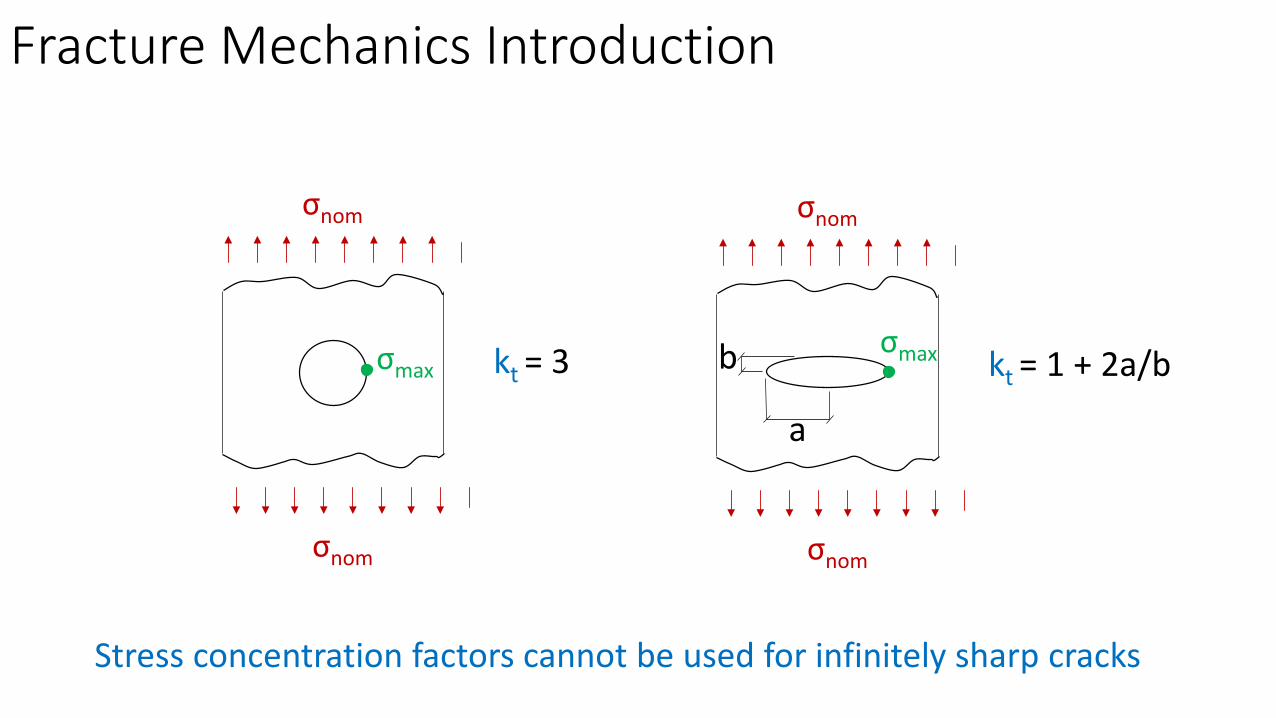
Fracture Mechanics Introduction
σnom
σnom
σmax kt = 3
σnom
σnom
σmax kt = 1 + 2a/b
a
b
Stress concentration factors cannot be used for infinitely sharp cracks
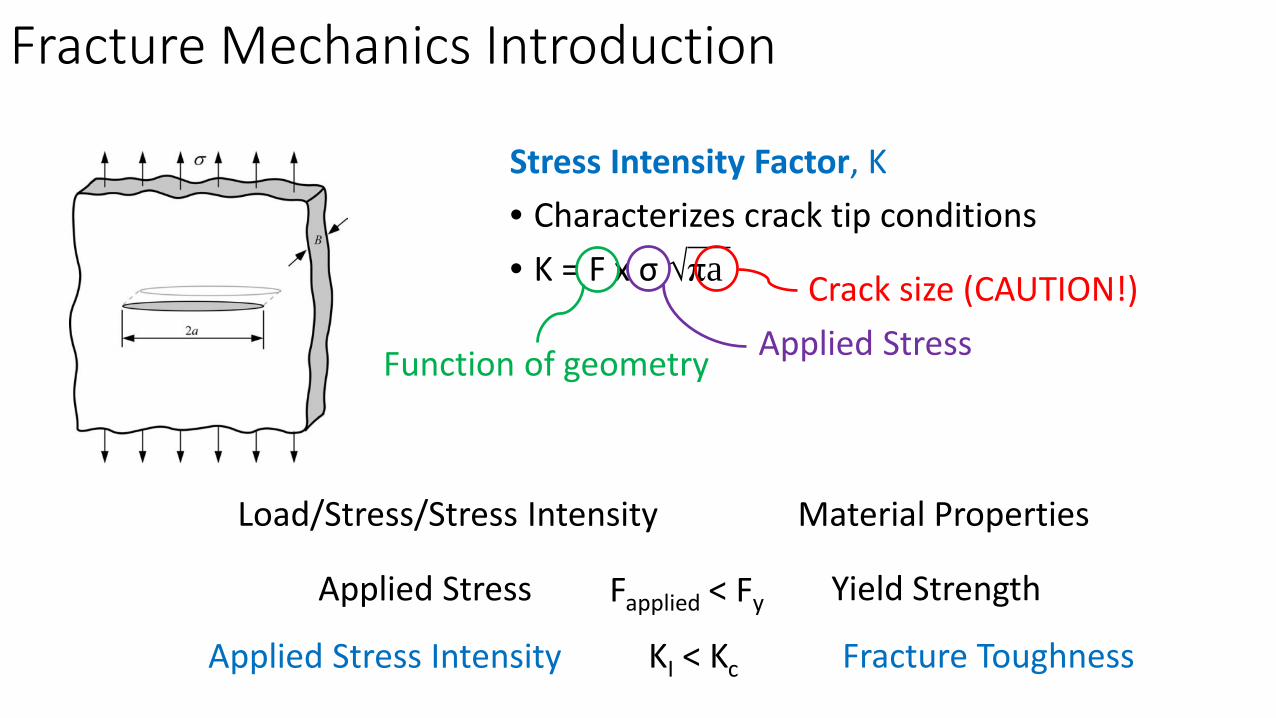
Fracture Mechanics Introduction
Stress Intensity Factor, K• Characterizes crack tip conditions• K = F x σ √πa
Function of geometry Applied StressCrack size (CAUTION!)
Fapplied < Fy
Material PropertiesLoad/Stress/Stress Intensity
KI < Kc
Yield StrengthApplied Stress
Fracture ToughnessApplied Stress Intensity
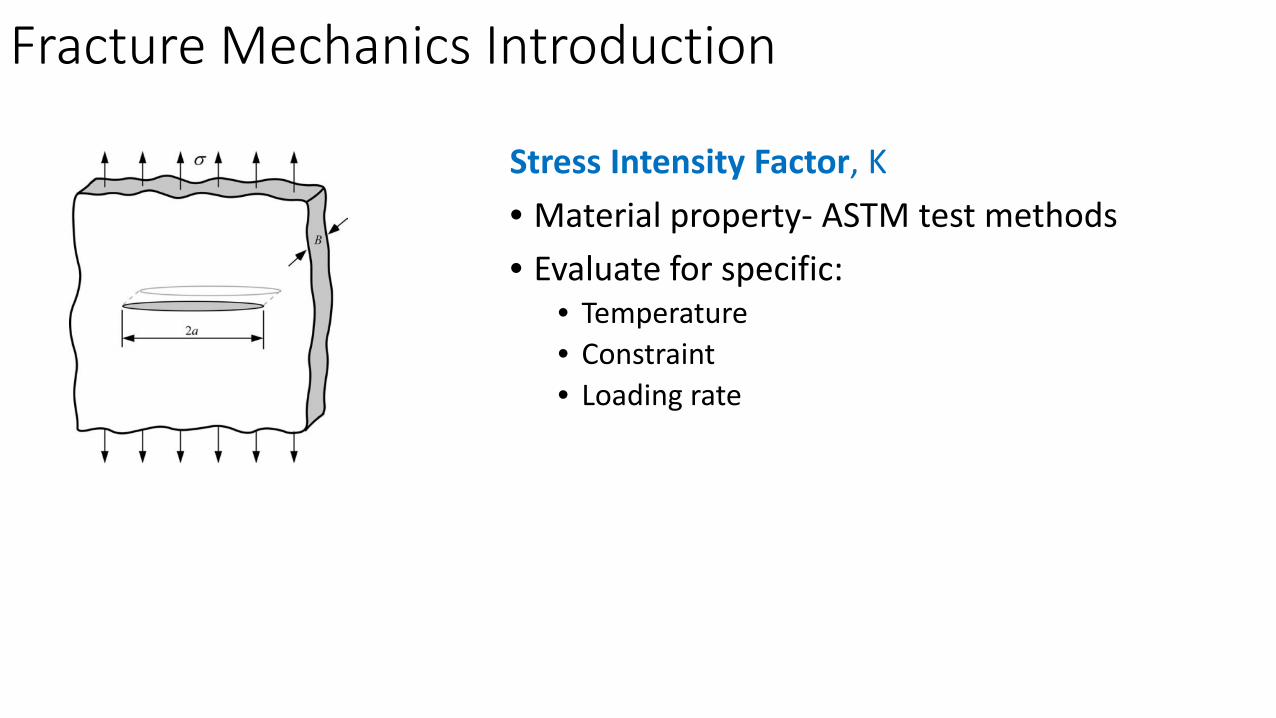
Fracture Mechanics Introduction
Stress Intensity Factor, K• Material property- ASTM test methods• Evaluate for specific:
• Temperature• Constraint• Loading rate
Additional Material
Weakest Link Behaviorand
Master Curve
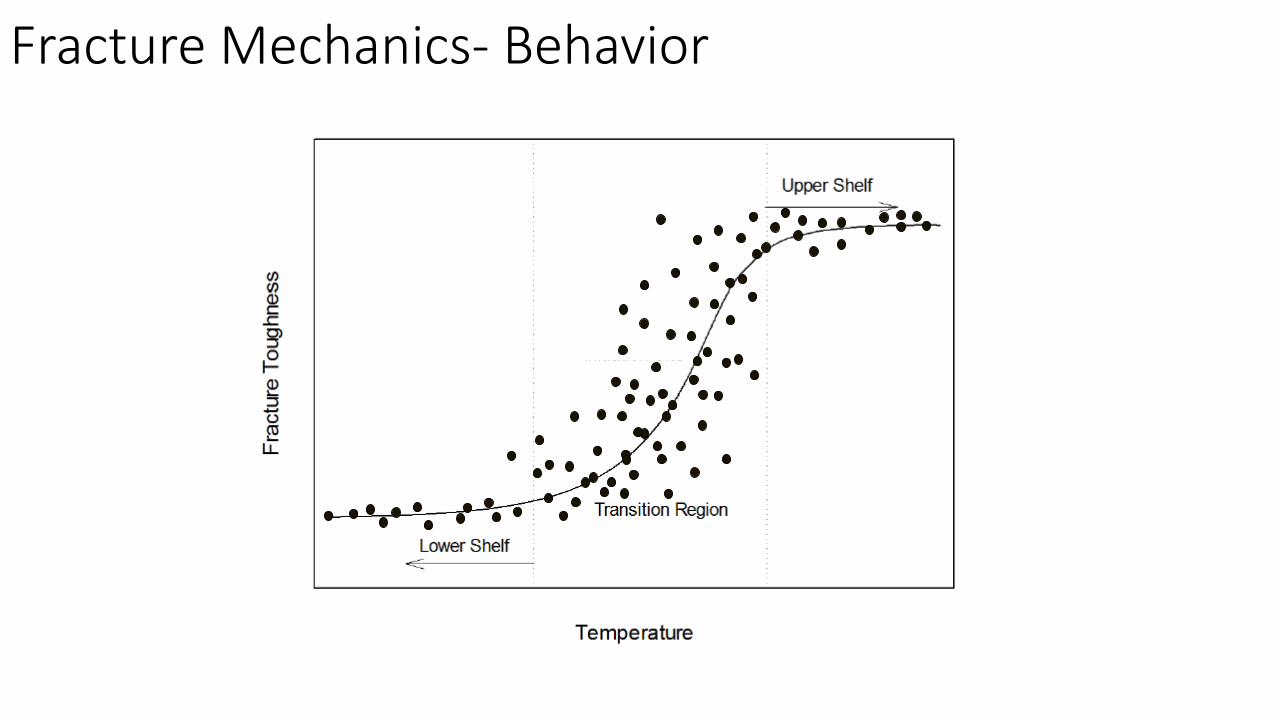
Fracture Mechanics- Behavior
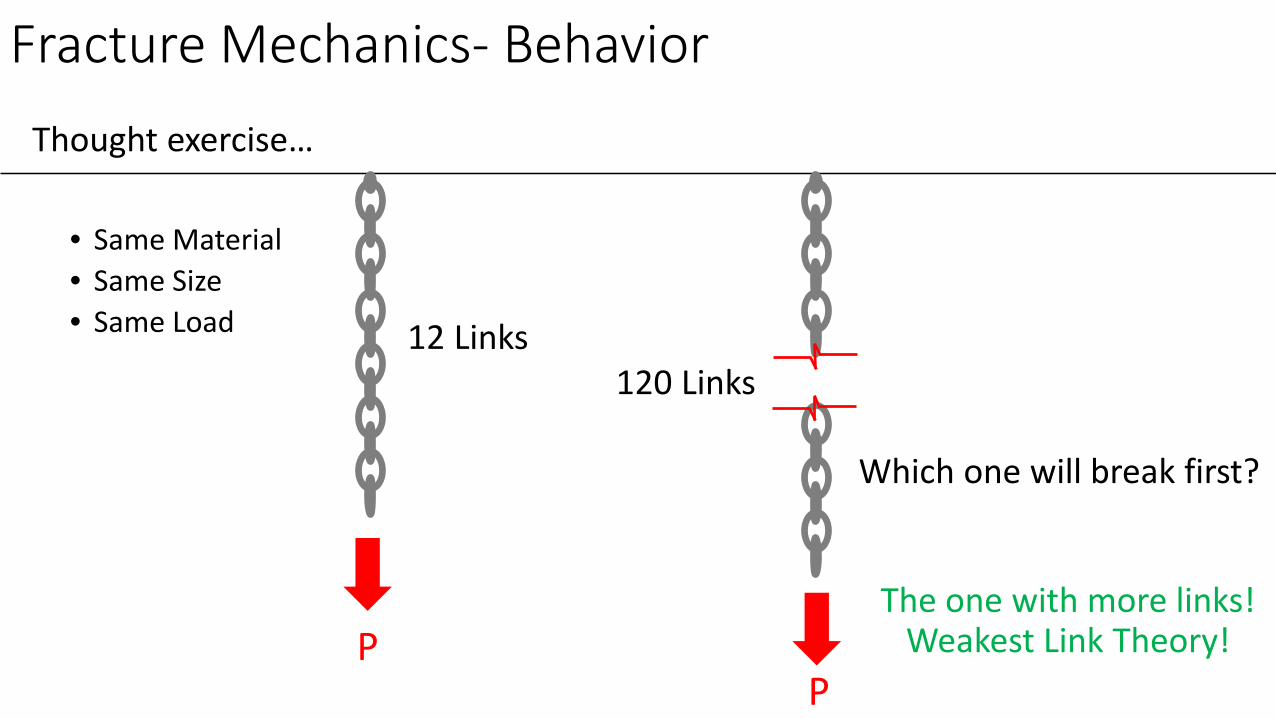
Fracture Mechanics- BehaviorThought exercise…
PP
• Same Material• Same Size• Same Load 12 Links
120 Links
Which one will break first?
The one with more links! Weakest Link Theory!

Future of Fracture Critical- AdvancesFracture Behavior CharacterizationHow do we deal with scatter in the transition region?• Scatter in data• Specimen size effects• Constraint at crack tip
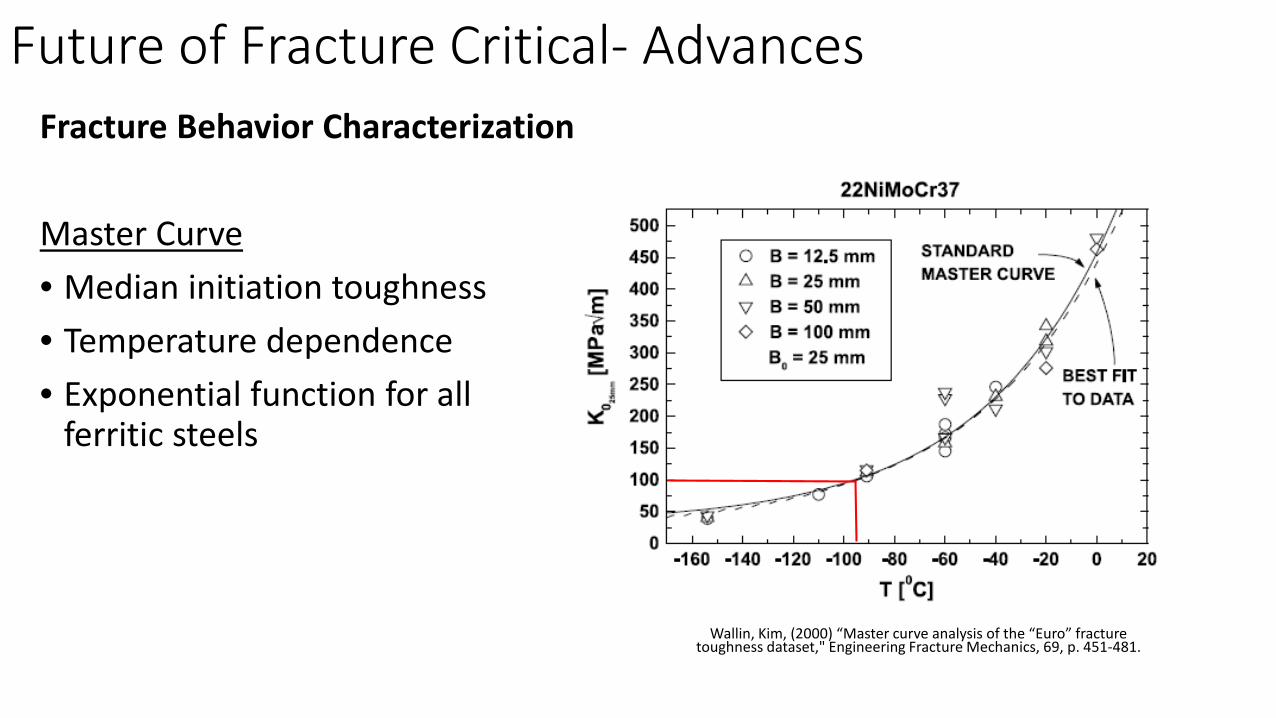
Future of Fracture Critical- AdvancesFracture Behavior Characterization
Master Curve• Median initiation toughness• Temperature dependence• Exponential function for all
ferritic steels
Wallin, Kim, (2000) “Master curve analysis of the “Euro” fracture toughness dataset," Engineering Fracture Mechanics, 69, p. 451-481.
Future of Fracture Critical- AdvancesFracture Behavior Characterization
Master Curve• Landes and Shaffer applied statistical rationale (1980)
• Recognition of initiation points and statistical flaw distribution
• Wallin’s work adapted this to be more “engineering friendly” (1984-present)
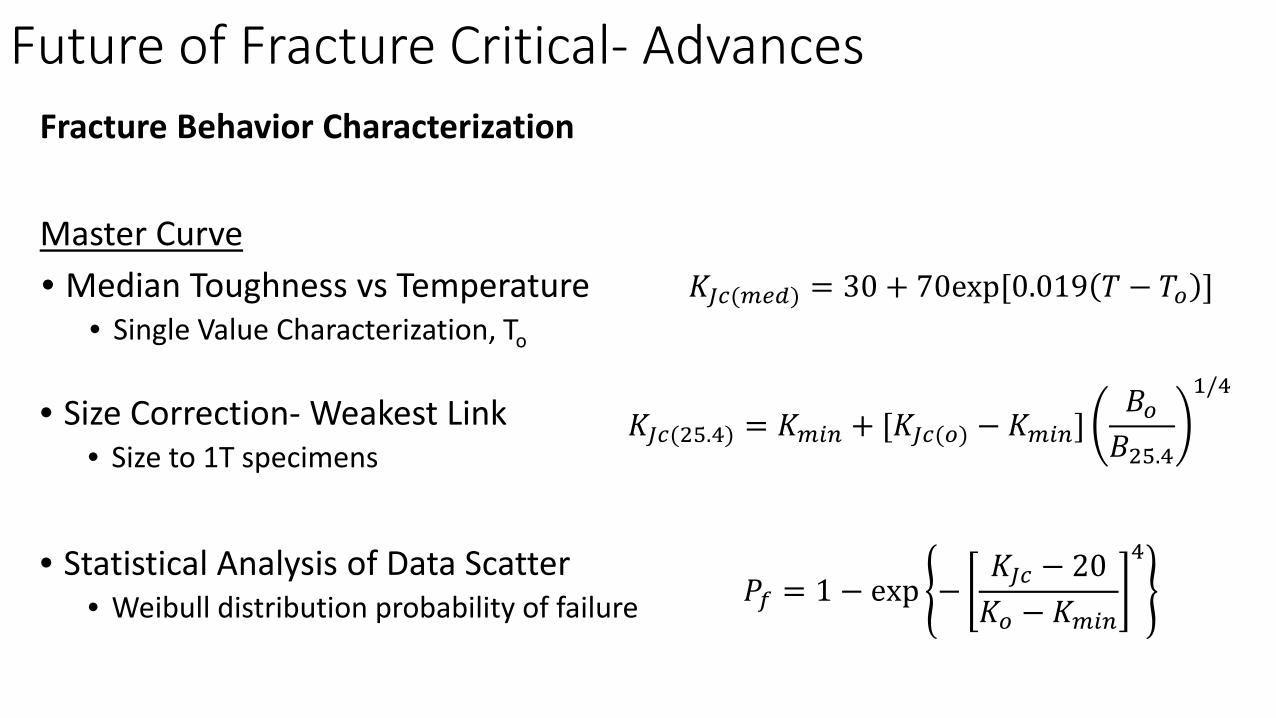
Future of Fracture Critical- AdvancesFracture Behavior Characterization
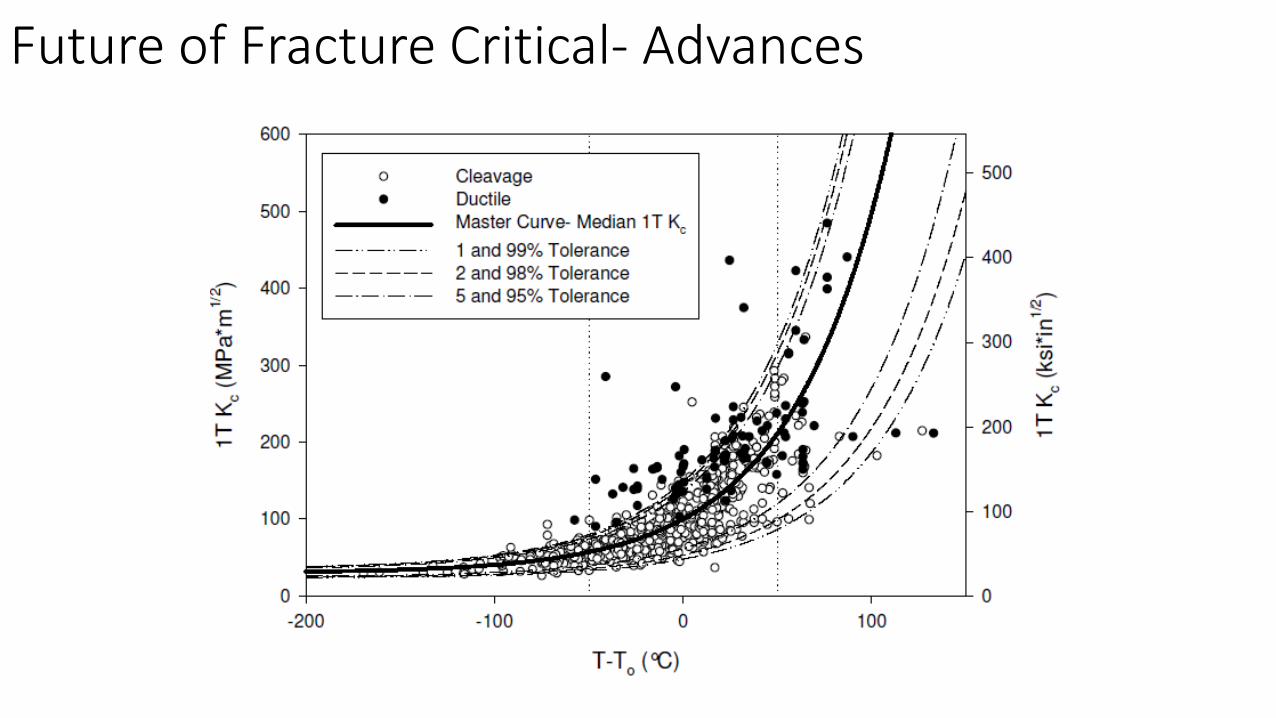
Master Curve
𝐾𝐾𝐽𝐽𝐽𝐽(25.4) = 𝐾𝐾𝑚𝑚𝑚𝑚𝑚𝑚 + [𝐾𝐾𝐽𝐽𝐽𝐽(𝑜𝑜) − 𝐾𝐾𝑚𝑚𝑚𝑚𝑚𝑚]𝐵𝐵𝑜𝑜𝐵𝐵25.4
1/4
𝐾𝐾𝐽𝐽𝐽𝐽(𝑚𝑚𝑚𝑚𝑚𝑚) = 30 + 70exp[0.019 𝑇𝑇 − 𝑇𝑇𝑜𝑜 ]
𝑃𝑃𝑓𝑓 = 1 − exp −𝐾𝐾𝐽𝐽𝐽𝐽 − 20𝐾𝐾𝑜𝑜 − 𝐾𝐾𝑚𝑚𝑚𝑚𝑚𝑚
4
• Size Correction- Weakest Link• Size to 1T specimens
• Statistical Analysis of Data Scatter• Weibull distribution probability of failure
• Median Toughness vs Temperature• Single Value Characterization, To
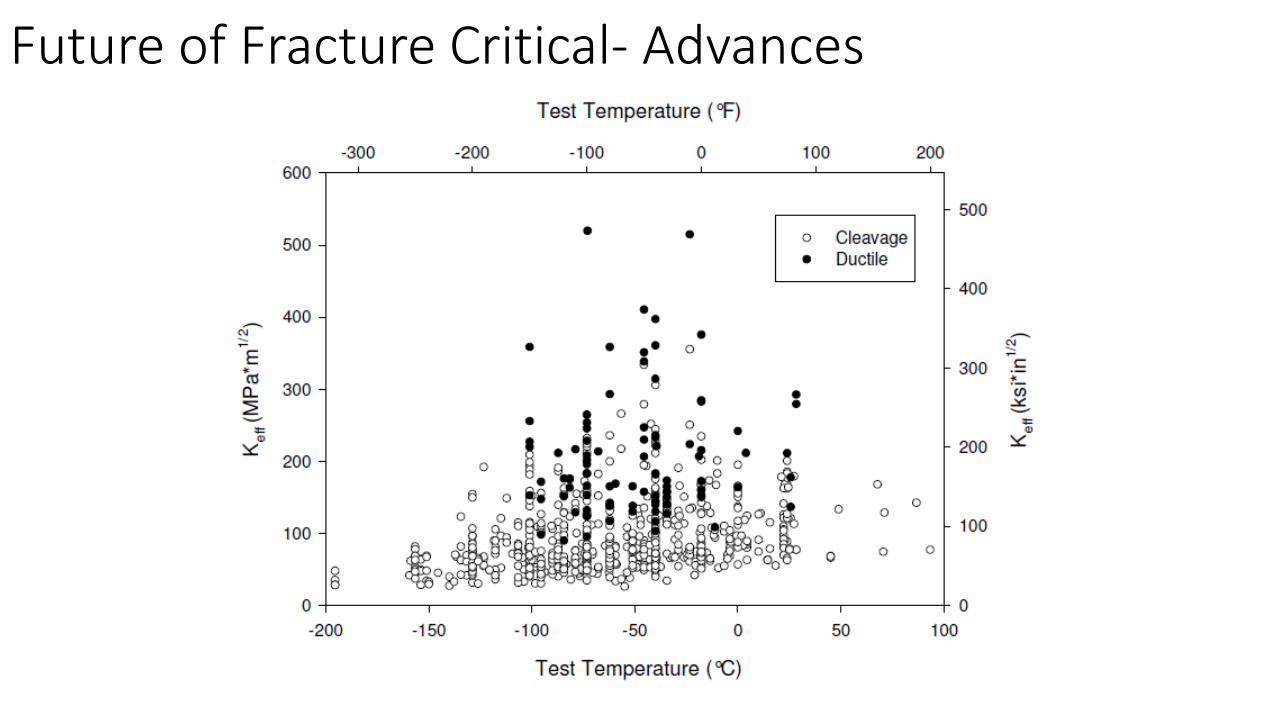
Future of Fracture Critical- Advances
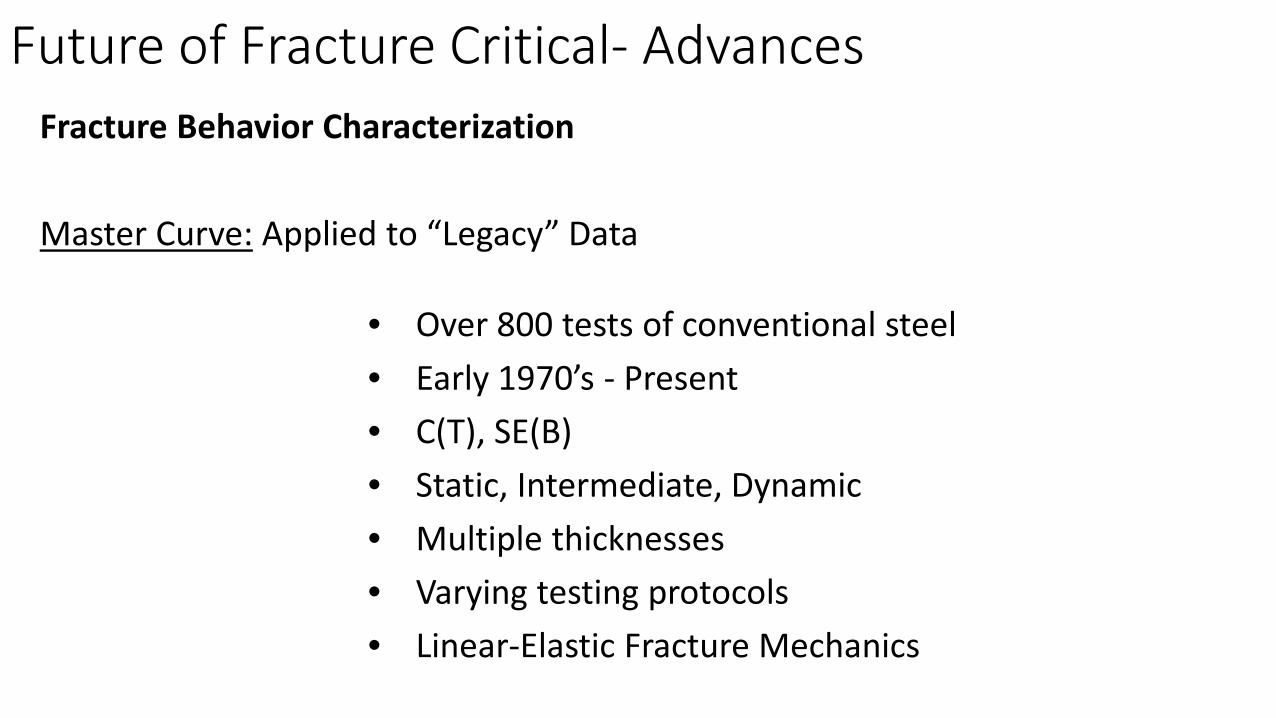
• Over 800 tests of conventional steel• Early 1970’s - Present• C(T), SE(B)• Static, Intermediate, Dynamic• Multiple thicknesses• Varying testing protocols• Linear-Elastic Fracture Mechanics
Fracture Behavior Characterization
Master Curve: Applied to “Legacy” Data
Future of Fracture Critical- Advances
Future of Fracture Critical- Advances
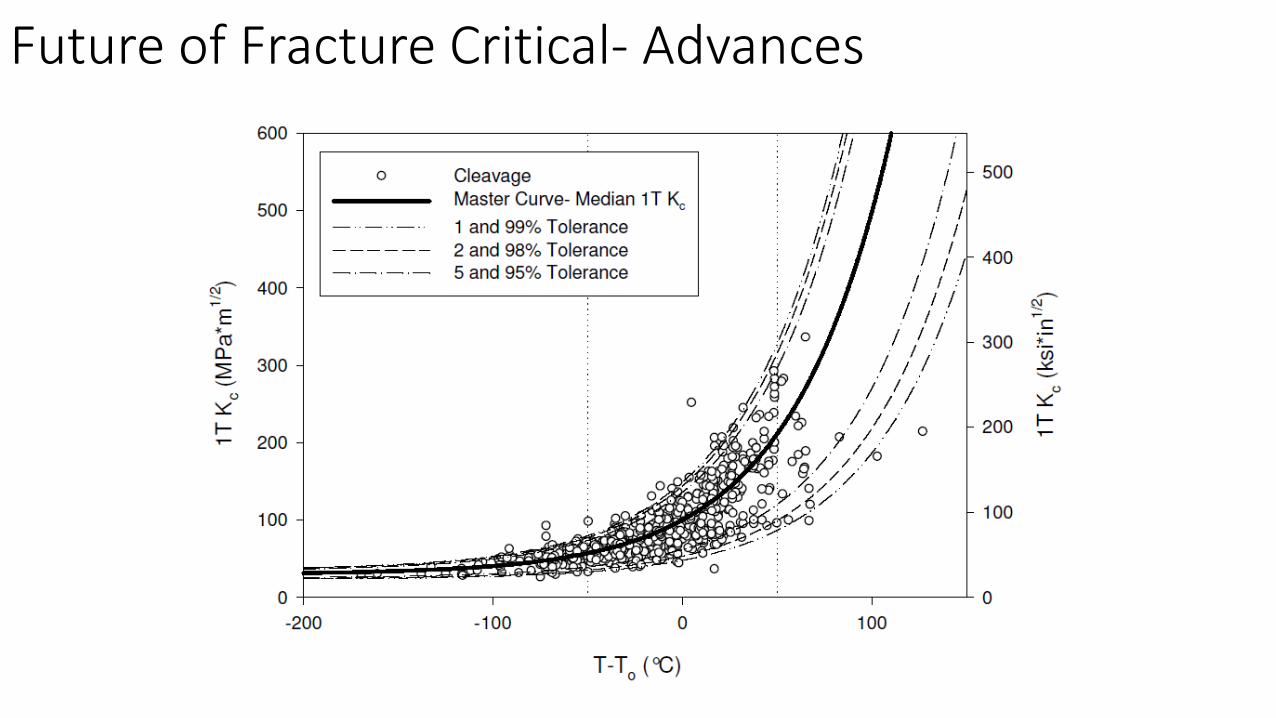
Future of Fracture Critical- Advances
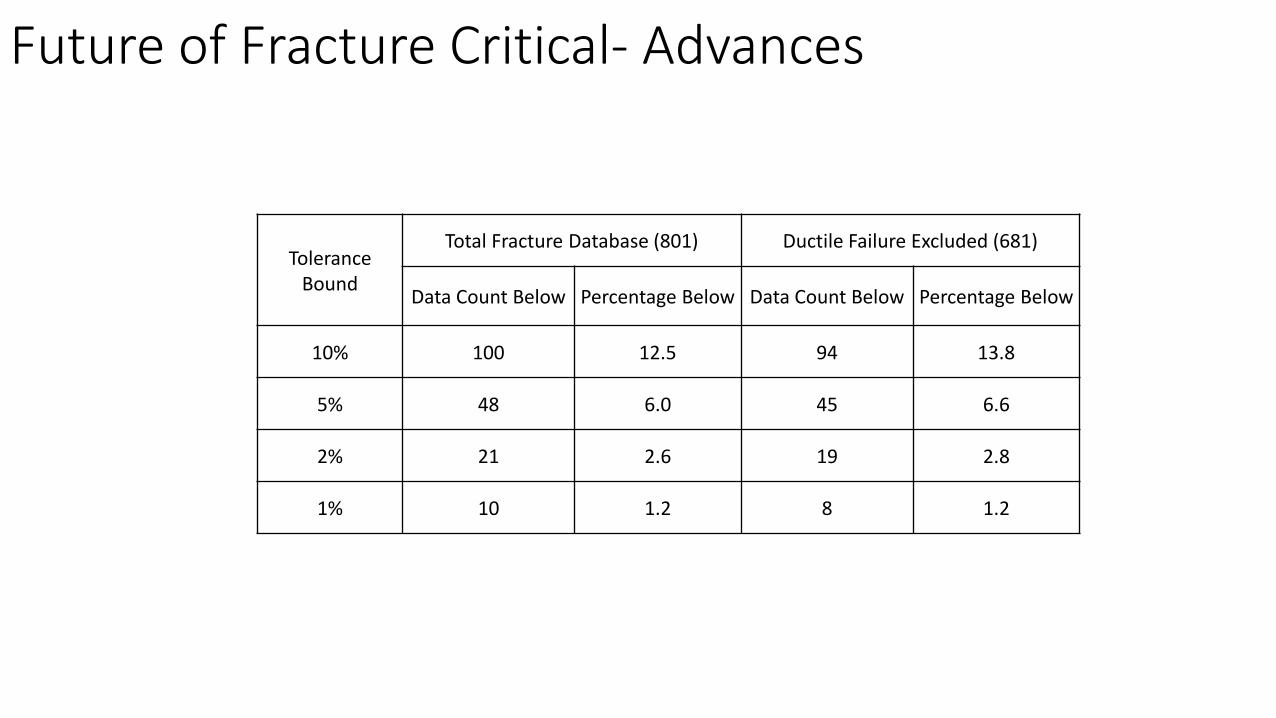
Future of Fracture Critical- Advances
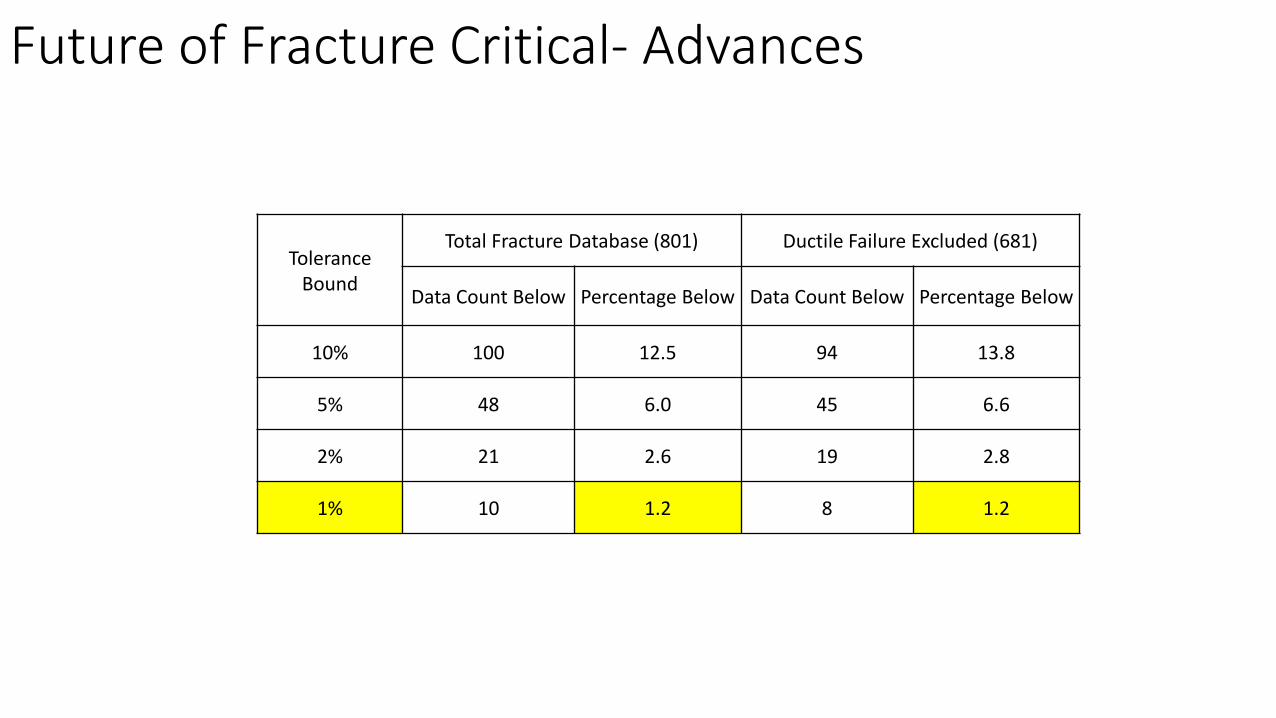
Tolerance Bound
Total Fracture Database (801) Ductile Failure Excluded (681)
Data Count Below Percentage Below Data Count Below Percentage Below
10% 100 12.5 94 13.8
5% 48 6.0 45 6.6
2% 21 2.6 19 2.8
1% 10 1.2 8 1.2
Future of Fracture Critical- Advances
Tolerance Bound
Total Fracture Database (801) Ductile Failure Excluded (681)
Data Count Below Percentage Below Data Count Below Percentage Below
10% 100 12.5 94 13.8
5% 48 6.0 45 6.6
2% 21 2.6 19 2.8
1% 10 1.2 8 1.2
Additional Material
FFS and FADs
Future of Fracture Critical- Existing StructuresFitness for Service (FFS) Evaluation• Evaluate structural components with existing flaws• Ability of component to serve its intended function• Commonly used in other industries
• Oil and Gas, Offshore, Nuclear
• Codified Procedures• BS 7910 “Guide to methods for assessing the
acceptability of flaws in metallic structures”• API 579 “Fitness-for-Service”
• Multiple Levels of Rigor
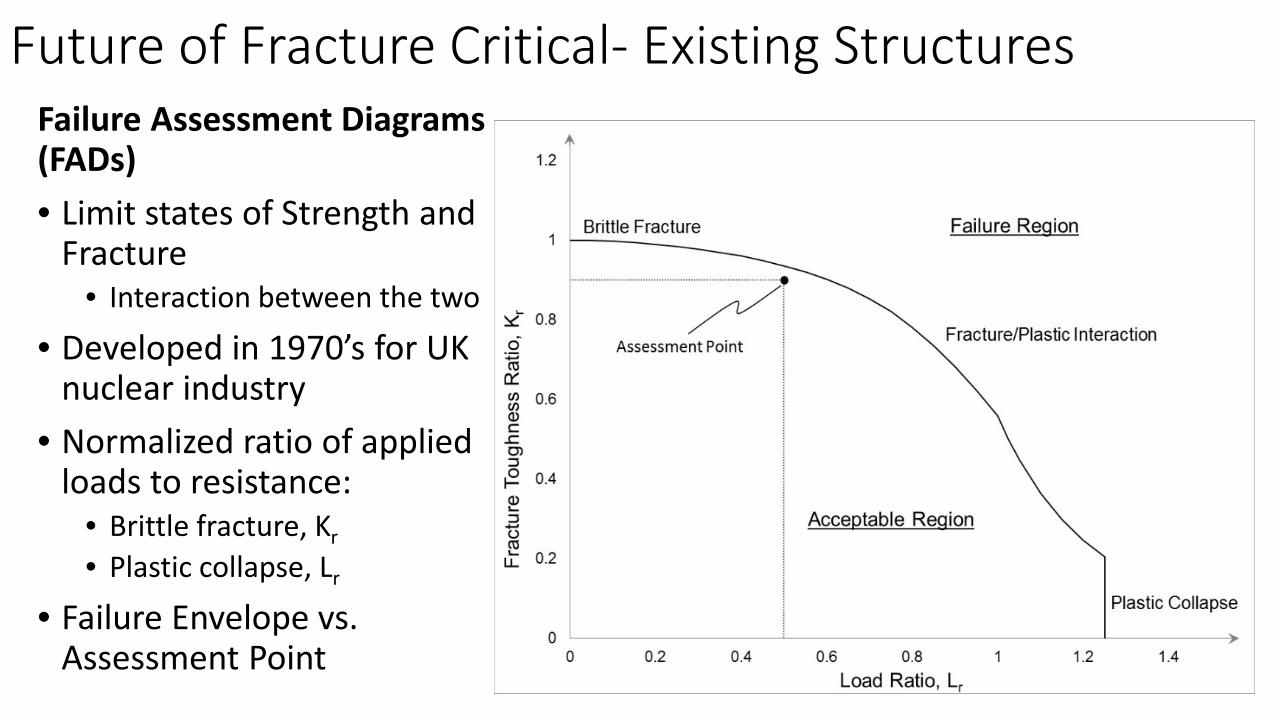
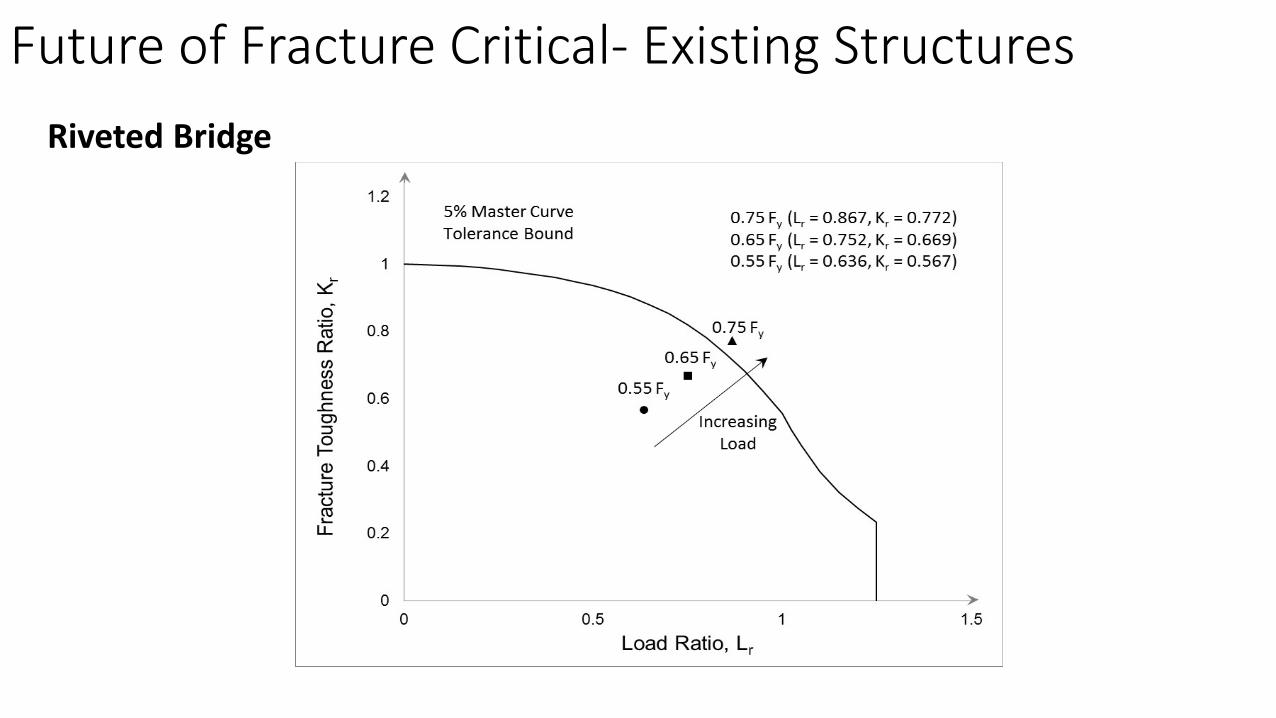
Future of Fracture Critical- Existing StructuresFailure Assessment Diagrams (FADs)• Limit states of Strength and
Fracture• Interaction between the two
• Developed in 1970’s for UK nuclear industry
• Normalized ratio of applied loads to resistance:
• Brittle fracture, Kr• Plastic collapse, Lr
• Failure Envelope vs. Assessment Point
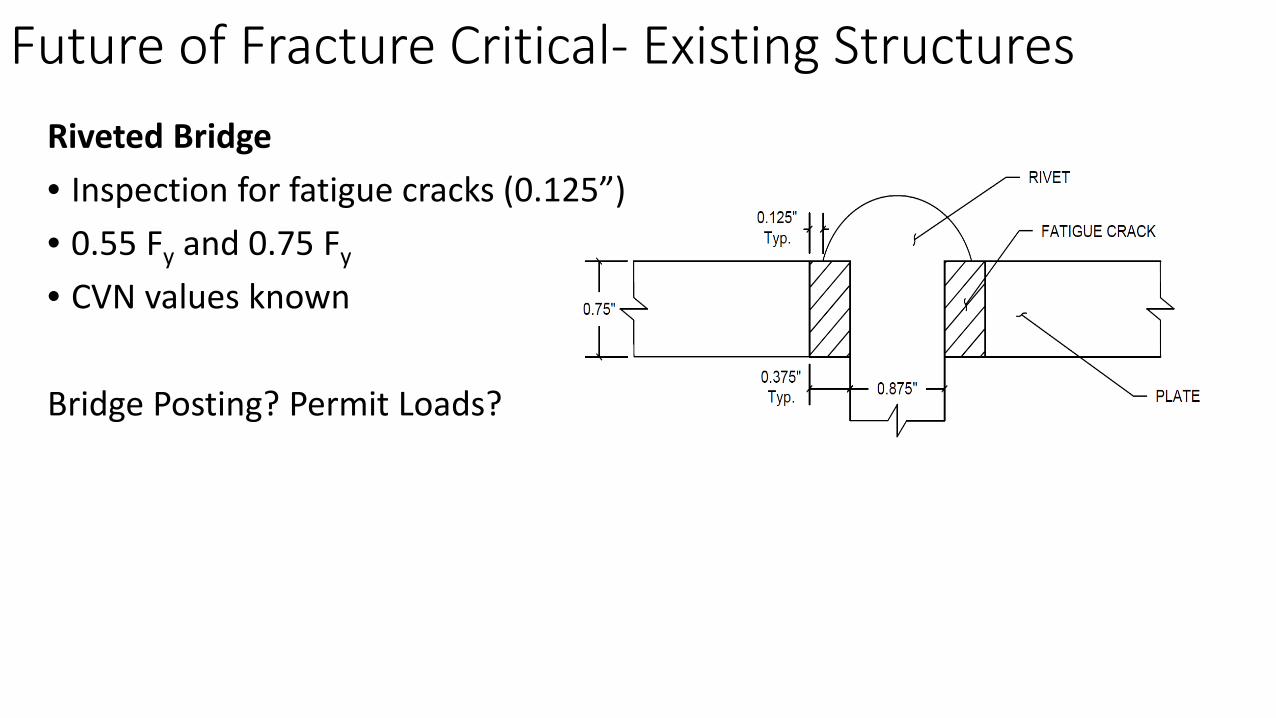
Future of Fracture Critical- Existing StructuresRiveted Bridge• Inspection for fatigue cracks (0.125”)• 0.55 Fy and 0.75 Fy
• CVN values known
Bridge Posting? Permit Loads?
Future of Fracture Critical- Existing StructuresRiveted Bridge

Future of Fracture Critical- Existing StructuresRiveted Bridge
Future of Fracture Critical- Existing StructuresFitness for Service (FFS) Evaluation
Failure Assessment Diagrams• Provide more information to owners• Fracture behavior not “binary”
Additional Material
Current FCP Approach
Fracture Control Plan- Current Approach
Fracture Control Plan1) Material Toughness2) Fabrication Requirements3) In-service Inspections
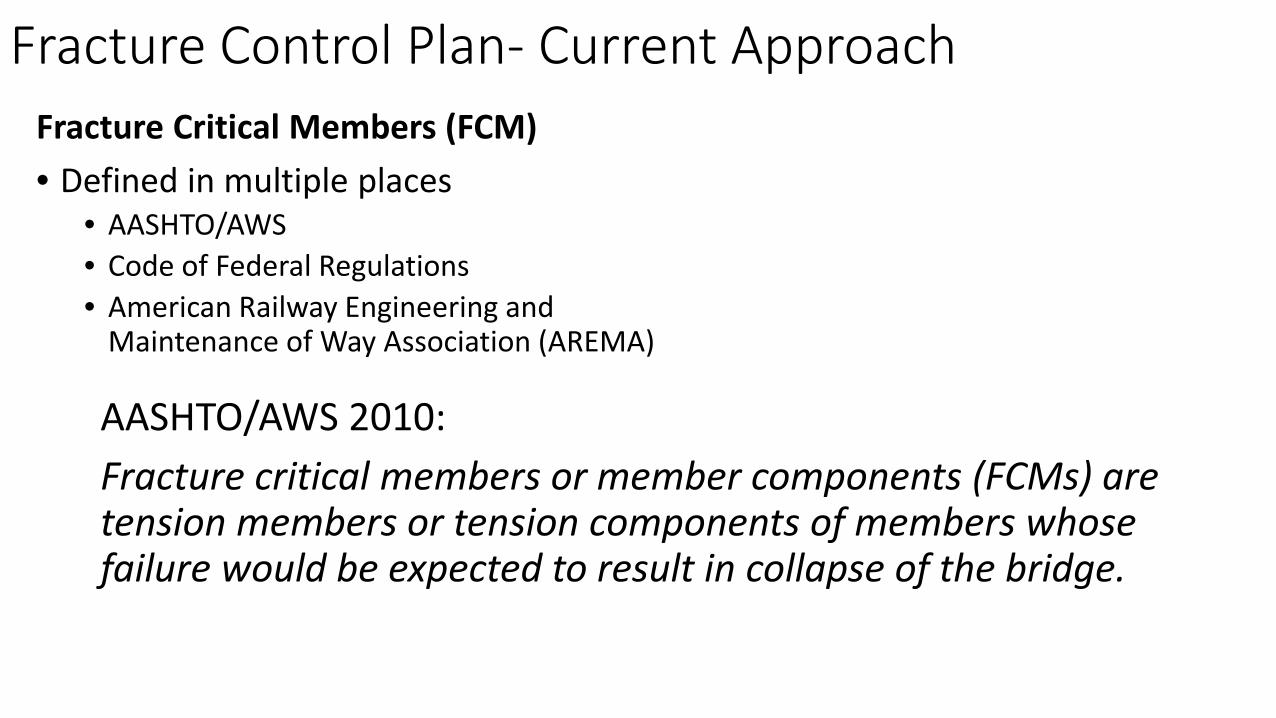
Fracture Control Plan- Current ApproachFracture Critical Members (FCM)• Defined in multiple places
• AASHTO/AWS• Code of Federal Regulations• American Railway Engineering and
Maintenance of Way Association (AREMA)
AASHTO/AWS 2010:Fracture critical members or member components (FCMs) are tension members or tension components of members whose failure would be expected to result in collapse of the bridge.
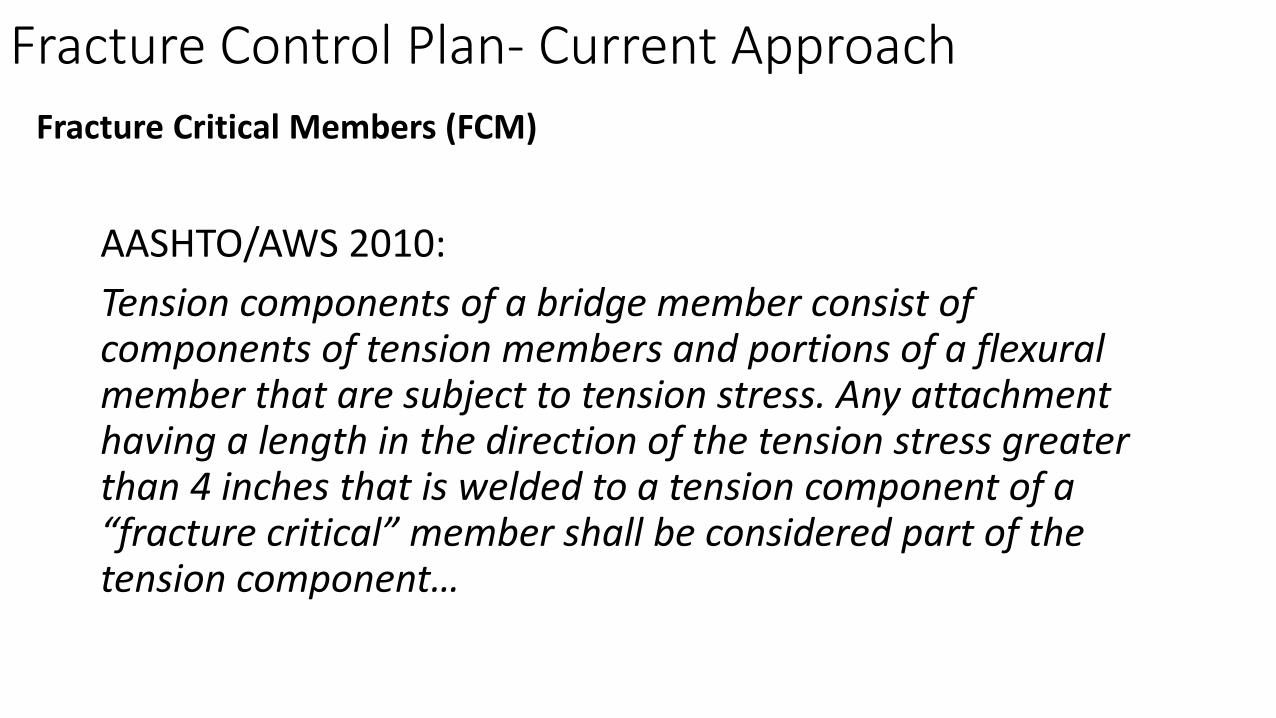
Fracture Control Plan- Current ApproachFracture Critical Members (FCM)
AASHTO/AWS 2010:Tension components of a bridge member consist of components of tension members and portions of a flexural member that are subject to tension stress. Any attachment having a length in the direction of the tension stress greater than 4 inches that is welded to a tension component of a “fracture critical” member shall be considered part of the tension component…
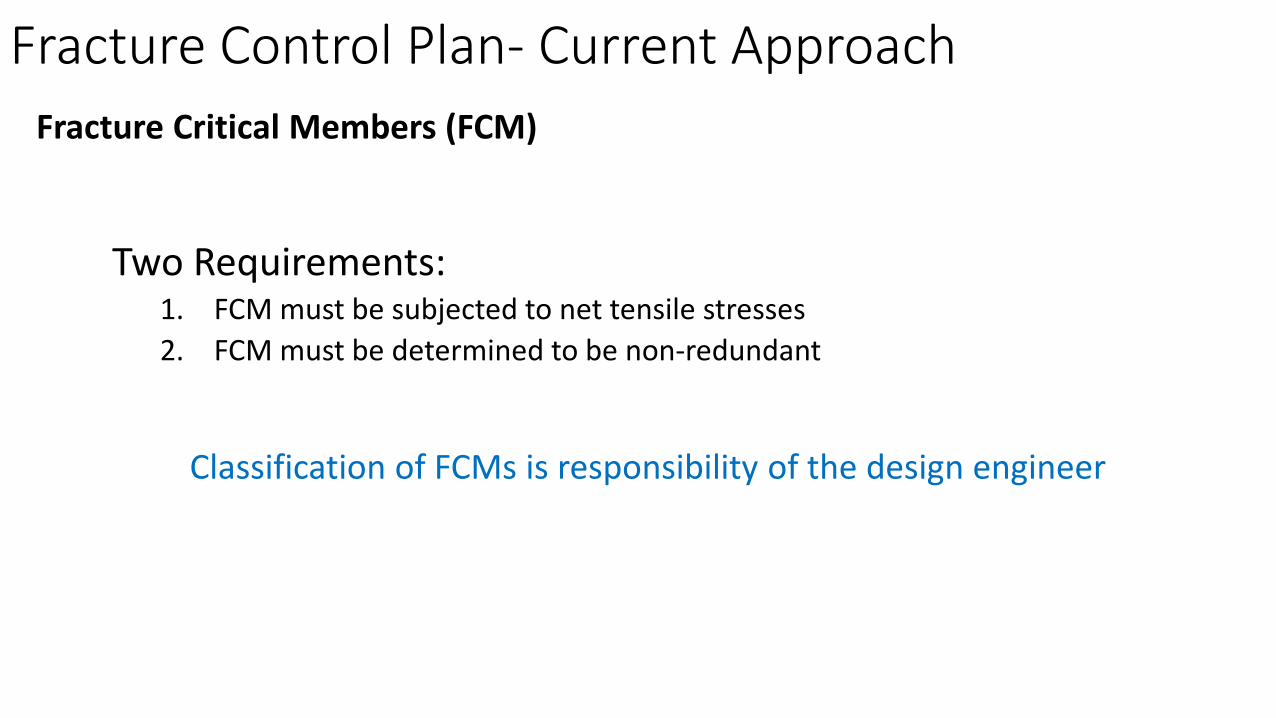
Fracture Control Plan- Current ApproachFracture Critical Members (FCM)
Two Requirements:1. FCM must be subjected to net tensile stresses2. FCM must be determined to be non-redundant
Classification of FCMs is responsibility of the design engineer
Fracture Control Plan- Current ApproachFracture Critical Members (FCM)
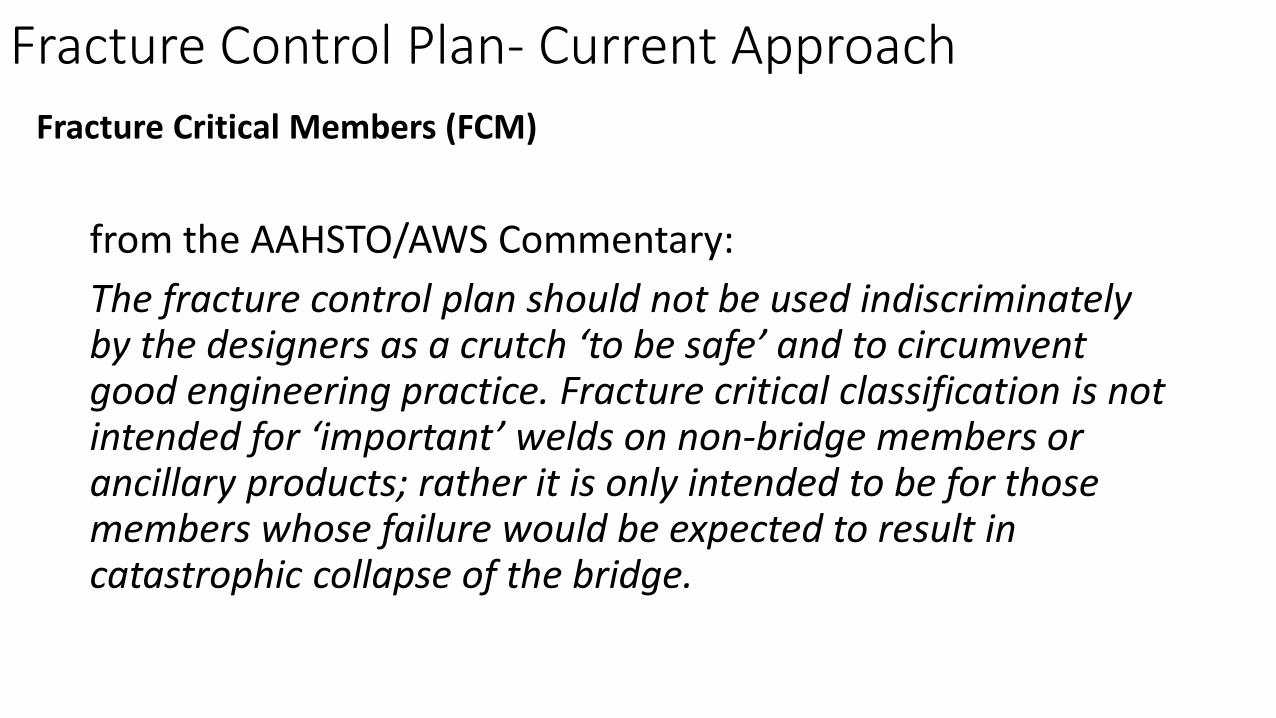
from the AAHSTO/AWS Commentary:The fracture control plan should not be used indiscriminately by the designers as a crutch ‘to be safe’ and to circumvent good engineering practice. Fracture critical classification is not intended for ‘important’ welds on non-bridge members or ancillary products; rather it is only intended to be for those members whose failure would be expected to result in catastrophic collapse of the bridge.
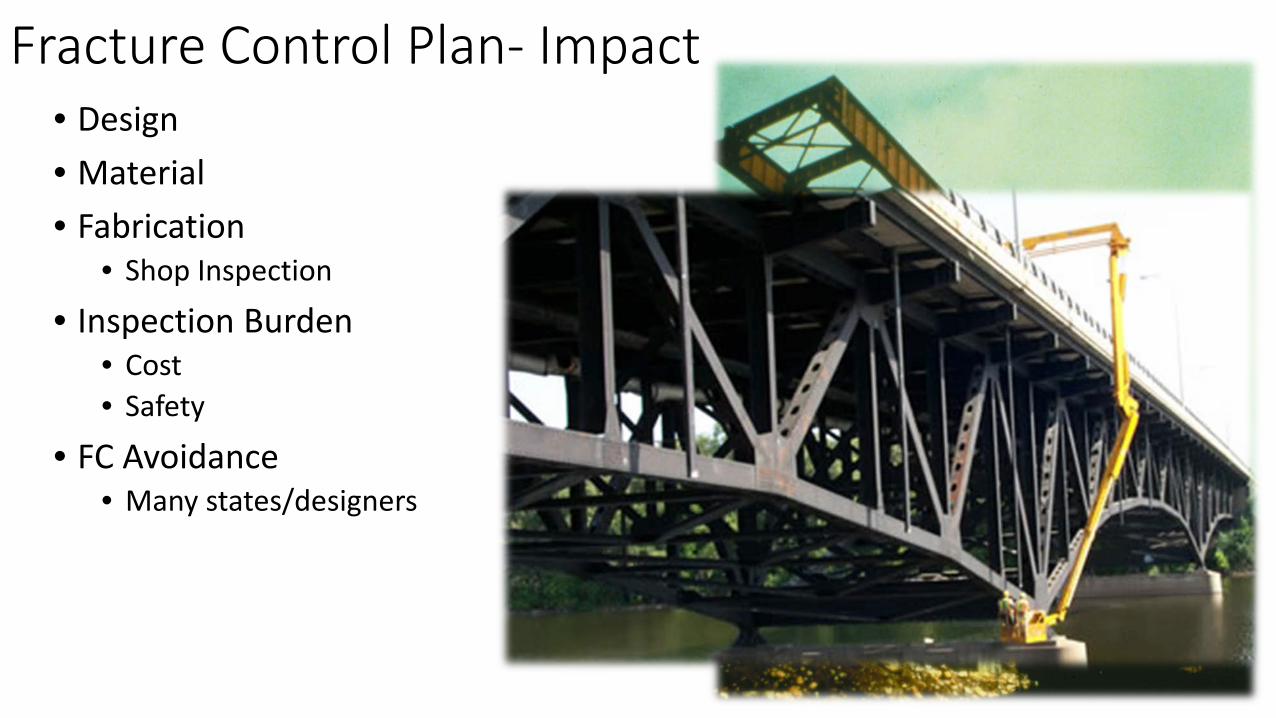
Fracture Control Plan- Impact• Design• Material• Fabrication
• Shop Inspection
• Inspection Burden• Cost• Safety
• FC Avoidance• Many states/designers
Future of Fracture Critical- Advances
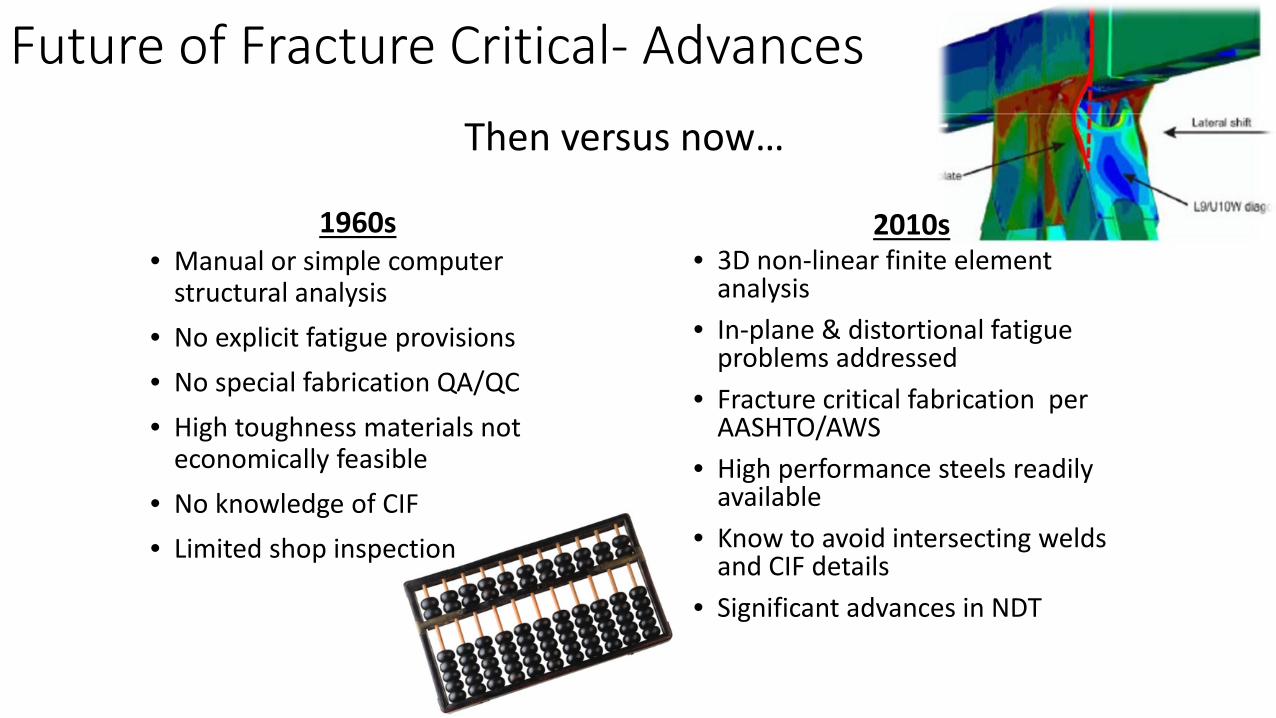
1960s 2010s• Manual or simple computer
structural analysis• No explicit fatigue provisions• No special fabrication QA/QC• High toughness materials not
economically feasible• No knowledge of CIF• Limited shop inspection
• 3D non-linear finite element analysis
• In-plane & distortional fatigue problems addressed
• Fracture critical fabrication per AASHTO/AWS
• High performance steels readily available
• Know to avoid intersecting welds and CIF details
• Significant advances in NDT
Then versus now…
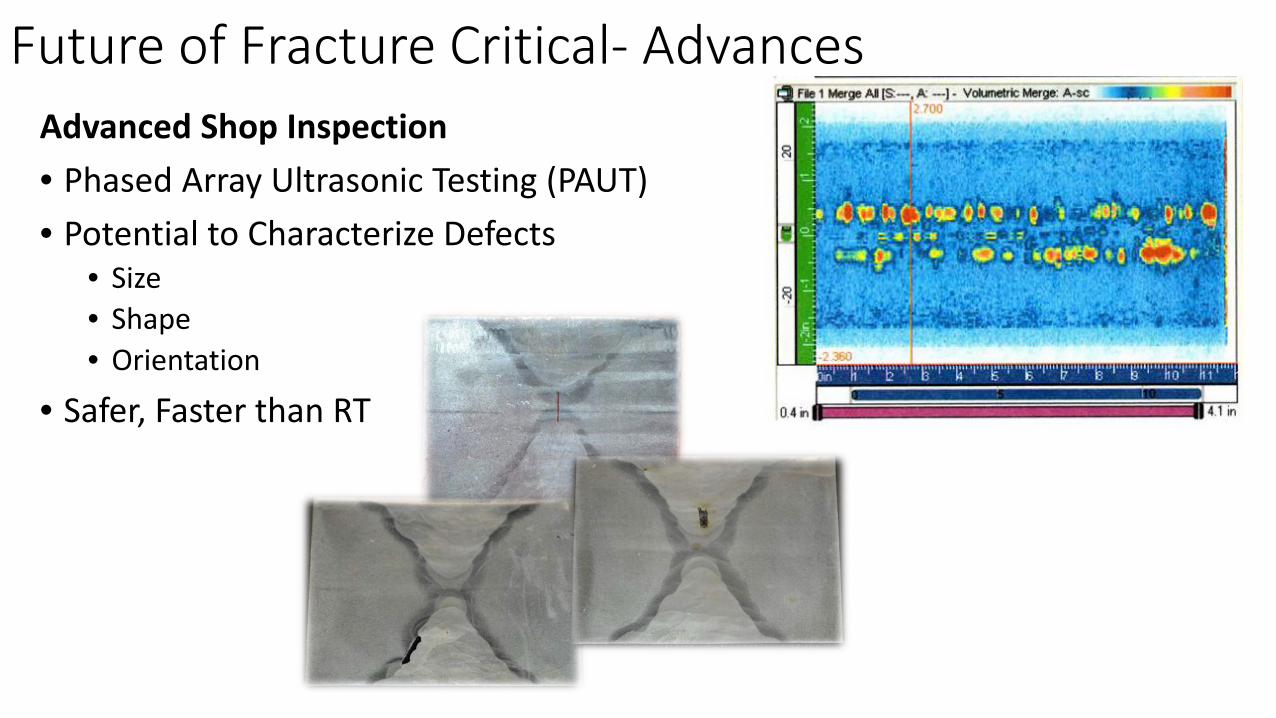
Future of Fracture Critical- AdvancesAdvanced Shop Inspection• Phased Array Ultrasonic Testing (PAUT)• Potential to Characterize Defects
• Size• Shape• Orientation
• Safer, Faster than RT