Embed Size (px)
Citation preview
working paper
The Future of EmploymentCarl Benedikt Frey & Michael Osborne
Published by the Oxford Martin Programmeon Technology and Employment
THE FUTURE OF EMPLOYMENT: HOW
SUSCEPTIBLE ARE JOBS TO
COMPUTERISATION?∗
Carl Benedikt Frey† and Michael A. Osborne‡
September 17, 2013
.
Abstract
We examine how susceptible jobs are to computerisation. To as-
sess this, we begin by implementing a novel methodology to estimate
the probability of computerisation for 702 detailed occupations, us-
ing a Gaussian process classifier. Based on these estimates, we ex-
amine expected impacts of future computerisation on us labour mar-
ket outcomes, with the primary objective of analysing the number ofjobs at risk and the relationship between an occupation’s probability
of computerisation, wages and educational attainment. According
to our estimates, about 47 percent of total us employment is at risk.
We further provide evidence that wages and educational attainment
exhibit a strong negative relationship with an occupation’s proba-
bility of computerisation.
∗We thank the Oxford University Engineering Sciences Department and the OxfordMartin Programme on the Impacts of Future Technology for hosting the “Machines andEmployment” Workshop. We are indebted to Stuart Armstrong, Nick Bostrom, ErisChinellato, Mark Cummins, Daniel Dewey, David Dorn, Alex Flint, Claudia Goldin,John Muellbauer, Vincent Mueller, Paul Newman, Seán Ó hÉigeartaigh, Anders Sand-berg, Murray Shanahan, and Keith Woolcock for their excellent suggestions.
†Oxford Martin School, University of Oxford, Oxford, OX1 1PT, United Kingdom,[email protected].
‡Department of Engineering Science, University of Oxford, Oxford, OX1 3PJ, UnitedKingdom, [email protected].
1

Keywords: Occupational Choice, Technological Change, Wage In-
equality, Employment, Skill Demand
jel Classification: E24, J24, J31, J62, O33.
2
1 Introduction
In this paper, we address the question: how susceptible are jobs to com-
puterisation? Doing so, we build on the existing literature in two ways. First, drawing upon recent advances in Machine Learning (ml) and Mobile Robotics (mr), we develop a novel methodology to categorise occupations according to their susceptibility to computerisation.1 Second, we imple-
ment this methodology to estimate the probability of computerisation for 702 detailed occupations, and examine expected impacts of future com-
puterisation on us labour market outcomes.
Our paper is motivated by John Maynard Keynes’s frequently cited pre-
diction of widespread technological unemployment “due to our discovery of means of economising the use of labour outrunning the pace at which we can find new uses for labour” (Keynes, 1933, p. 3). Indeed, over the past decades, computers have substituted for a number of jobs, including the functions of bookkeepers, cashiers and telephone operators (Bresnahan, 1999; MGI, 2013). More recently, the poor performance of labour markets across advanced economies has intensified the debate about technological unemployment among economists. While there is ongoing disagreement about the driving forces behind the persistently high unemployment rates, a number of scholars have pointed at computer-controlled equipment as a possible explanation for recent jobless growth (see, for example, Brynjolf-
sson and McAfee, 2011).2
The impact of computerisation on labour market outcomes is well-
established in the literature, documenting the decline of employment in routine intensive occupations – i.e. occupations mainly consisting of tasks following well-defined procedures that can easily be performed by sophis-
ticated algorithms. For example, studies by Charles, et al. (2013) and Jaimovich and Siu (2012) emphasise that the ongoing decline in manufac-
turing employment and the disappearance of other routine jobs is causing
1We refer to computerisation as job automation by means of computer-controlledequipment.
2This view finds support in a recent survey by the McKinsey Global Institute (mgi),showing that 44 percent of firms which reduced their headcount since the financial crisisof 2008 had done so by means of automation (MGI, 2011).
3
the current low rates of employment.3 In addition to the computerisation
of routine manufacturing tasks, Autor and Dorn (2013) document a struc-
tural shift in the labour market, with workers reallocating their labour
supply from middle-income manufacturing to low-income service occupa-
tions. Arguably, this is because the manual tasks of service occupations are
less susceptible to computerisation, as they require a higher degree of flex-
ibility and physical adaptability (Autor, et al., 2003; Goos and Manning,
2007; Autor and Dorn, 2013).
At the same time, with falling prices of computing, problem-solving
skills are becoming relatively productive, explaining the substantial em-
ployment growth in occupations involving cognitive tasks where skilled
labour has a comparative advantage, as well as the persistent increase
in returns to education (Katz and Murphy, 1992; Acemoglu, 2002; Autor
and Dorn, 2013). The title “Lousy and Lovely Jobs”, of recent work by
Goos and Manning (2007), thus captures the essence of the current trend
towards labour market polarization, with growing employment in high-
income cognitive jobs and low-income manual occupations, accompanied
by a hollowing-out of middle-income routine jobs.
According to Brynjolfsson and McAfee (2011), the pace of technological
innovation is still increasing, with more sophisticated software technologies
disrupting labour markets by making workers redundant. What is strik-
ing about the examples in their book is that computerisation is no longer
confined to routine manufacturing tasks. The autonomous driverless cars,
developed by Google, provide one example of how manual tasks in trans-
port and logistics may soon be automated. In the section “In Domain
After Domain, Computers Race Ahead”, they emphasise how fast moving
these developments have been. Less than ten years ago, in the chapter
“Why People Still Matter”, Levy and Murnane (2004) pointed at the diffi-
culties of replicating human perception, asserting that driving in traffic is
insusceptible to automation: “But executing a left turn against oncoming
traffic involves so many factors that it is hard to imagine discovering the
set of rules that can replicate a driver’s behaviour [. . . ]”. Six years later,
3Because the core job tasks of manufacturing occupations follow well-defined repet-itive procedures, they can easily be codified in computer software and thus performedby computers (Acemoglu and Autor, 2011).
4

in October 2010, Google announced that it had modified several Toyota
Priuses to be fully autonomous (Brynjolfsson and McAfee, 2011).
To our knowledge, no study has yet quantified what recent technolog-
ical progress is likely to mean for the future of employment. The present
study intends to bridge this gap in the literature. Although there are in-
deed existing useful frameworks for examining the impact of computers
on the occupational employment composition, they seem inadequate in
explaining the impact of technological trends going beyond the computeri-
sation of routine tasks. Seminal work by Autor, et al. (2003), for example,
distinguishes between cognitive and manual tasks on the one hand, and
routine and non-routine tasks on the other. While the computer substi-
tution for both cognitive and manual routine tasks is evident, non-routine
tasks involve everything from legal writing, truck driving and medical di-
agnoses, to persuading and selling. In the present study, we will argue that
legal writing and truck driving will soon be automated, while persuading,
for instance, will not. Drawing upon recent developments in Engineering
Sciences, and in particular advances in the fields of ml, including Data
Mining, Machine Vision, Computational Statistics and other sub-fields of
Artificial Intelligence, as well as mr, we derive additional dimensions re-
quired to understand the susceptibility of jobs to computerisation. Need-
less to say, a number of factors are driving decisions to automate and we
cannot capture these in full. Rather we aim, from a technological capabil-
ities point of view, to determine which problems engineers need to solve
for specific occupations to be automated. By highlighting these problems,
their difficulty and to which occupations they relate, we categorise jobs
according to their susceptibility to computerisation. The characteristics
of these problems were matched to different occupational characteristics,
using o∗net data, allowing us to examine the future direction of tech-
nological change in terms of its impact on the occupational composition
of the labour market, but also the number of jobs at risk should these
technologies materialise.
The present study relates to two literatures. First, our analysis builds
on the labour economics literature on the task content of employment (Au-
tor, et al., 2003; Goos and Manning, 2007; Autor and Dorn, 2013). Based
on defined premises about what computers do, this literature examines the
5
historical impact of computerisation on the occupational composition of
the labour market. However, the scope of what computers do has recently
expanded, and will inevitably continue to do so (Brynjolfsson and McAfee,
2011; MGI, 2013). Drawing upon recent progress in ml, we expand the
premises about the tasks computers are and will be suited to accomplish.
Doing so, we build on the task content literature in a forward-looking
manner. Furthermore, whereas this literature has largely focused on task
measures from the Dictionary of Occupational Titles (dot), last revised in
1991, we rely on the 2010 version of the dot successor o∗net – an online
service developed for the us Department of Labor.4 Accordingly, o∗net
has the advantage of providing more recent information on occupational
work activities.
Second, our study relates to the literature examining the offshoring
of information-based tasks to foreign worksites (Jensen and Kletzer, 2005;
Blinder, 2009; Jensen and Kletzer, 2010; Oldenski, 2012; Blinder and Krueger,
2013). This literature consists of different methodologies to rank and cat-
egorise occupations according to their susceptibility to offshoring. For
example, using o∗net data on the nature of work done in different occu-
pations, Blinder (2009) estimates that 22 to 29 percent of us jobs are or
will be offshorable in the next decade or two. These estimates are based
on two defining characteristics of jobs that cannot be offshored: (a) the
job must be performed at a specific work location; and (b) the job requires
face-to-face personal communication. Naturally, the characteristics of oc-
cupations that can be offshored are different from the characteristics of
occupations that can be automated. For example, the work of cashiers,
which has largely been substituted by self- service technology, must be
performed at specific work location and requires face-to-face contact. The
extent of computerisation is therefore likely to go beyond that of offshoring.
Hence, while the implementation of our methodology is similar to that of
Blinder (2009), we rely on different occupational characteristics.
The remainder of this paper is structured as follows. In Section 2, we
review the literature on the historical relationship between technological
progress and employment. Section 3 describes recent and expected future
4An exception is Goos, et al. (2009).
6
technological developments. In Section 4, we describe our methodology, and in Section 5, we examine the expected impact of these technological developments on labour market outcomes. Finally, in Section 6, we derive some conclusions.
2 A history of technological revolutions and
employment
The concern over technological unemployment is hardly a recent phe-
nomenon. Throughout history, the process of creative destruction, fol-
lowing technological inventions, has created enormous wealth, but also
undesired disruptions. As stressed by Schumpeter (1962), it was not the
lack of inventive ideas that set the boundaries for economic development,
but rather powerful social and economic interests promoting the techno-
logical status quo. This is nicely illustrated by the example of William
Lee, inventing the stocking frame knitting machine in 1589, hoping that it
would relieve workers of hand-knitting. Seeking patent protection for his
invention, he travelled to London where he had rented a building for his
machine to be viewed by Queen Elizabeth I. To his disappointment, the
Queen was more concerned with the employment impact of his invention
and refused to grant him a patent, claiming that: “Thou aimest high, Mas-
ter Lee. Consider thou what the invention could do to my poor subjects.
It would assuredly bring to them ruin by depriving them of employment,
thus making them beggars” (cited in Acemoglu and Robinson, 2012, p.
182f). Most likely the Queen’s concern was a manifestation of the hosiers’
guilds fear that the invention would make the skills of its artisan members
obsolete.5 The guilds’ opposition was indeed so intense that William Lee
had to leave Britain.
That guilds systematically tried to weaken market forces as aggregators
to maintain the technological status quo is persuasively argued by Kellen-
benz (1974, p. 243), stating that “guilds defended the interests of their
5The term artisan refers to a craftsman who engages in the entire production processof a good, containing almost no division of labour. By guild we mean an association ofartisans that control the practice of their craft in a particular town.
7
members against outsiders, and these included the inventors who, with
their new equipment and techniques, threatened to disturb their mem-
bers’ economic status.”6 As pointed out by Mokyr (1998, p. 11): “Unless
all individuals accept the “verdict” of the market outcome, the decision
whether to adopt an innovation is likely to be resisted by losers through
non-market mechanism and political activism.” Workers can thus be ex-
pected to resist new technologies, insofar that they make their skills obso-
lete and irreversibly reduce their expected earnings. The balance between
job conservation and technological progress therefore, to a large extent,
reflects the balance of power in society, and how gains from technological
progress are being distributed.
The British Industrial Revolution illustrates this point vividly. While
still widely present on the Continent, the craft guild in Britain had, by
the time of the Glorious Revolution of 1688, declined and lost most of its
political clout (Nef, 1957, pp. 26 and 32). With Parliamentary supremacy
established over the Crown, legislation was passed in 1769 making the de-
struction of machinery punishable by death (Mokyr, 1990, p. 257). To
be sure, there was still resistance to mechanisation. The “Luddite” riots
between 1811 and 1816 were partly a manifestation of the fear of technolog-
ical change among workers as Parliament revoked a 1551 law prohibiting
the use of gig mills in the wool-finishing trade. The British government
however took an increasingly stern view on groups attempting to halt tech-
nological progress and deployed 12,000 men against the rioters (Mantoux,
2006, p. 403-8). The sentiment of the government towards the destruction
of machinery was explained by a resolution passed after the Lancashire
riots of 1779, stating that: “The sole cause of great riots was the new ma-
chines employed in cotton manufacture; the country notwithstanding has
greatly benefited from their erection [and] destroying them in this coun-
try would only be the means of transferring them to another [. . . ] to the
detriment of the trade of Britain” (cited in Mantoux, 2006, p. 403).
There are at least two possible explanations for the shift in attitudes
6There is an ongoing debate about the technological role of the guilds. Epstein(1998), for example, has argued that they fulfilled an important role in the intergenera-tional transmission of knowledge. Yet there is no immediate contradiction between sucha role and their conservative stand on technological progress: there are clear examplesof guilds restraining the diffusion of inventions (see, for example, Ogilvie, 2004).
8
towards technological progress. First, after Parliamentary supremacy was
established over the Crown, the property owning classes became politically
dominant in Britain (North and Weingast, 1989). Because the diffusion
of various manufacturing technologies did not impose a risk to the value
of their assets, and some property owners stood to benefit from the ex-
port of manufactured goods, the artisans simply did not have the political
power to repress them. Second, inventors, consumers and unskilled factory
workers largely benefited from mechanisation (Mokyr, 1990, p. 256 and
258). It has even been argued that, despite the employment concerns over
mechanisation, unskilled workers have been the greatest beneficiaries of
the Industrial Revolution (Clark, 2008).7 While there is contradictory evi-
dence suggesting that capital owners initially accumulated a growing share
of national income (Allen, 2009a), there is equally evidence of growing real
wages (Lindert and Williamson, 1983; Feinstein, 1998). This implies that
although manufacturing technologies made the skills of artisans obsolete,
gains from technological progress were distributed in a manner that grad-
ually benefited a growing share of the labour force.8
An important feature of nineteenth century manufacturing technolo-
gies is that they were largely “deskilling” – i.e. they substituted for skills
through the simplification of tasks (Braverman, 1974; Hounshell, 1985;
James and Skinner, 1985; Goldin and Katz, 1998). The deskilling process
occurred as the factory system began to displace the artisan shop, and it
picked up pace as production increasingly mechanized with the adoption
7Various estimations of the living standards of workers in Britain during the indus-trialisation exist in the literature. For example, Clark (2008) finds that real wages overthe period 1760 to 1860 rose faster than gdp per capita. Further evidence provided byLindert and Williamson (1983) even suggests that real wages nearly doubled between1820 and 1850. Feinstein (1998), on the other hand, finds a much more moderate in-crease, with average working-class living standards improving by less than 15 percentbetween 1770 and 1870. Finally, Allen (2009a) finds that over the first half of the nine-teenth century, the real wage stagnated while output per worker expanded. After themid nineteenth century, however, real wages began to grow in line with productivity.While this implies that capital owners were the greatest beneficiaries of the IndustrialRevolution, there is at the same time consensus that average living standards largelyimproved.
8The term skill is associated with higher levels of education, ability, or job training.Following Goldin and Katz (1998), we refer to technology-skill or capital-skill com-plementarity when a new technology or physical capital complements skilled labourrelative to unskilled workers.
9
of steam power (Goldin and Sokoloff, 1982; Atack, et al., 2008a). Work
that had previously been performed by artisans was now decomposed into
smaller, highly specialised, sequences, requiring less skill, but more work-
ers, to perform.9 Some innovations were even designed to be deskilling.
For example, Eli Whitney, a pioneer of interchangeable parts, described
the objective of this technology as “to substitute correct and effective op-
erations of machinery for the skill of the artist which is acquired only by
long practice and experience; a species of skill which is not possessed in
this country to any considerable extent” (Habakkuk, 1962, p. 22).
Together with developments in continuous-flow production, enabling
workers to be stationary while different tasks were moved to them, it was
identical interchangeable parts that allowed complex products to be as-
sembled from mass produced individual components by using highly spe-
cialised machine tools to a sequence of operations.10 Yet while the first
assembly-line was documented in 1804, it was not until the late nineteenth
century that continuous-flow processes started to be adopted on a larger
scale, which enabled corporations such as the Ford Motor Company to
manufacture the T-Ford at a sufficiently low price for it to become the
people’s vehicle (Mokyr, 1990, p. 137). Crucially, the new assembly line
introduced by Ford in 1913 was specifically designed for machinery to be
operated by unskilled workers (Hounshell, 1985, p. 239). Furthermore,
what had previously been a one-man job was turned into a 29-man worker
operation, reducing the overall work time by 34 percent (Bright, 1958).
The example of the Ford Motor Company thus underlines the general pat-
9The production of plows nicely illustrates the differences between the artisan shopand the factory. In one artisan shop, two men spent 118 man-hours using hammers,anvils, chisels, hatchets, axes, mallets, shaves and augers in 11 distinct operations toproduce a plow. By contrast, a mechanized plow factory employed 52 workers perform-ing 97 distinct tasks, of which 72 were assisted by steam power, to produce a plow injust 3.75 man-hours. The degree of specialization was even greater in the production ofmen’s white muslin shirts. In the artisan shop, one worker spent 1439 hours performing25 different tasks to produce 144 shirts. In the factory, it took 188 man-hours to pro-duce the same quantity, engaging 230 different workers performing 39 different tasks,of which more than half required steam power. The workers involved included cutters,turners and trimmers, as well as foremen and forewomen, inspectors, errand boys, anengineer, a fireman, and a watchman (us Department of Labor, 1899).
10These machines were sequentially implemented until the production process wascompleted. Over time, such machines became much cheaper relative to skilled labor.As a result, production became much more capital intensive (Hounshell, 1985).
10
tern observed in the nineteenth century, with physical capital providing a
relative complement to unskilled labour, while substituting for relatively
skilled artisans (James and Skinner, 1985; Louis and Paterson, 1986; Brown
and Philips, 1986; Atack, et al., 2004).11 Hence, as pointed out by Ace-
moglu (2002, p. 7): “the idea that technological advances favor more
skilled workers is a twentieth century phenomenon.” The conventional
wisdom among economic historians, in other words, suggests a discontinu-
ity between the nineteenth and twentieth century in the impact of capital
deepening on the relative demand for skilled labour.
The modern pattern of capital-skill complementarity gradually emerged
in the late nineteenth century, as manufacturing production shifted to in-
creasingly mechanised assembly lines. This shift can be traced to the
switch to electricity from steam and water-power which, in combination
with continuous-process and batch production methods, reduced the de-
mand for unskilled manual workers in many hauling, conveying, and assem-
bly tasks, but increased the demand for skills (Goldin and Katz, 1998). In
short, while factory assembly lines, with their extreme division of labour,
had required vast quantities of human operatives, electrification allowed
many stages of the production process to be automated, which in turn in-
creased the demand for relatively skilled blue-collar production workers to
operate the machinery. In addition, electrification contributed to a grow-
ing share of white-collar nonproduction workers (Goldin and Katz, 1998).
Over the course of the nineteenth century, establishments became larger
in size as steam and water power technologies improved, allowing them to
11Williamson and Lindert (1980), on the other hand, find a relative rise in wagepremium of skilled labour over the period 1820 to 1860, which they partly attribute tocapital deepening. Their claim of growing wage inequality over this period has, however,been challenged (Margo, 2000). Yet seen over the long-run, a more refined explanation isthat the manufacturing share of the labour force in the nineteenth century hollowed out.This is suggested by recent findings, revealing a decline of middle-skill artisan jobs infavour of both high-skill white collar workers and low-skill operatives (Gray, 2013; Katzand Margo, 2013). Furthermore, even if the share of operatives was increasing due toorganizational change within manufacturing and overall manufacturing growth, it doesnot follow that the share of unskilled labor was rising in the aggregate economy, becausesome of the growth in the share of operatives may have come at the expense of a decreasein the share of workers employed as low-skilled farm workers in agriculture (Katz andMargo, 2013). Nevertheless, this evidence is consistent with the literature showing thatrelatively skilled artisans were replaced by unskilled factory workers, suggesting thattechnological change in manufacturing was deskilling.
11
adopt powered machinery to realize productivity gains through the combi-
nation of enhanced division of labour and higher capital intensity (Atack,
et al., 2008a). Furthermore, the transport revolution lowered costs of ship-
ping goods domestically and internationally as infrastructure spread and
improved (Atack, et al., 2008b). The market for artisan goods early on had
largely been confined to the immediate surrounding area because trans-
port costs were high relative to the value of the goods produced. With the
transport revolution, however, market size expanded, thereby eroding local
monopoly power, which in turn increased competition and compelled firms
to raise productivity through mechanisation. As establishments became
larger and served geographically expended markets, managerial tasks in-
creased in number and complexity, requiring more managerial and clerking
employees (Chandler, 1977). This pattern was, by the turn of the twen-
tieth century, reinforced by electrification, which not only contributed to
a growing share of relatively skilled blue-collar labour, but also increased
the demand for white-collar workers (Goldin and Katz, 1998), who tended
to have higher educational attainment (Allen, 2001).12
Since electrification, the story of the twentieth century has been the
race between education and technology (Goldin and Katz, 2009). The us
high school movement coincided with the first industrial revolution of the
office (Goldin and Katz, 1995). While the typewriter was invented in the
1860s, it was not introduced in the office until the early twentieth century,
when it entered a wave of mechanisation, with dictaphones, calculators,
mimeo machines, address machines, and the predecessor of the computer
– the keypunch (Beniger, 1986; Cortada, 2000). Importantly, these office
machines reduced the cost of information processing tasks and increased
the demand for the complementary factor – i.e. educated office workers.
Yet the increased supply of educated office workers, following the high
school movement, was associated with a sharp decline in the wage premium
of clerking occupations relative to production workers (Goldin and Katz,
1995). This was, however, not the result of deskilling technological change.
12Most likely, the growing share of white-collar workers increased the element ofhuman interaction in employment. Notably, Michaels, et al. (2013) find that the increasein the employment share of interactive occupations, going hand in hand with an increasein their relative wage bill share, was particularly strong between 1880 and 1930, whichis a period of rapid change in communication and transport technology.
12
Clerking workers were indeed relatively educated. Rather, it was the result
of the supply of educated workers outpacing the demand for their skills,
leading educational wage differentials to compress.
While educational wage differentials in the us narrowed from 1915 to
1980 (Goldin and Katz, 2009), both educational wage differentials and
overall wage inequality have increased sharply since the 1980s in a number
of countries (Krueger, 1993; Murphy, et al., 1998; Atkinson, 2008; Goldin
and Katz, 2009). Although there are clearly several variables at work, con-
sensus is broad that this can be ascribed to an acceleration in capital-skill
complementarity, driven by the adoption of computers and information
technology (Krueger, 1993; Autor, et al., 1998; Bresnahan, et al., 2002).
What is commonly referred to as the Computer Revolution began with the
first commercial uses of computers around 1960 and continued through the
development of the Internet and e-commerce in the 1990s. As the cost per
computation declined at an annual average of 37 percent between 1945
and 1980 (Nordhaus, 2007), telephone operators were made redundant,
the first industrial robot was introduced by General Motors in the 1960s,
and in the 1970s airline reservations systems led the way in self-service
technology (Gordon, 2012). During the 1980s and 1990s, computing costs
declined even more rapidly, on average by 64 percent per year, accompa-
nied by a surge in computational power (Nordhaus, 2007).13 At the same
time, bar-code scanners and cash machines were spreading across the retail
and financial industries, and the first personal computers were introduced
in the early 1980s, with their word processing and spreadsheet functions
eliminating copy typist occupations and allowing repetitive calculations
to be automated (Gordon, 2012). This substitution for labour marks a
further important reversal. The early twentieth century office machines
increased the demand for clerking workers (Chandler, 1977; Goldin and
Katz, 1995). In a similar manner, computerisation augments demand for
such tasks, but it also permits them to be automated (Autor, et al., 2003).
The Computer Revolution can go some way in explaining the growing
wage inequality of the past decades. For example, Krueger (1993) finds
that workers using a computer earn roughly earn 10 to 15 percent more
13Computer power even increased 18 percent faster on annual basis than predictedby Moore’s Law, implying a doubling every two years (Nordhaus, 2007).
13
than others, but also that computer use accounts for a substantial share
of the increase in the rate of return to education. In addition, more re-
cent studies find that computers have caused a shift in the occupational
structure of the labour market. Autor and Dorn (2013), for example, show
that as computerisation erodes wages for labour performing routine tasks,
workers will reallocate their labour supply to relatively low-skill service
occupations. More specifically, between 1980 and 2005, the share of us
labour hours in service occupations grew by 30 percent after having been
flat or declining in the three prior decades. Furthermore, net changes
in us employment were U-shaped in skill level, meaning that the lowest
and highest job-skill quartile expanded sharply with relative employment
declines in the middle of the distribution.
The expansion in high-skill employment can be explained by the falling
price of carrying out routine tasks by means of computers, which comple-
ments more abstract and creative services. Seen from a production func-
tion perspective, an outward shift in the supply of routine informational
inputs increases the marginal productivity of workers they are demanded
by. For example, text and data mining has improved the quality of le-
gal research as constant access to market information has improved the
efficiency of managerial decision-making – i.e. tasks performed by skilled
workers at the higher end of the income distribution. The result has been
an increasingly polarised labour market, with growing employment in high-
income cognitive jobs and low-income manual occupations, accompanied
by a hollowing-out of middle-income routine jobs. This is a pattern that
is not unique to the us and equally applies to a number of developed
economies (Goos, et al., 2009).14
How technological progress in the twenty-first century will impact on
14While there is broad consensus that computers substituting for workers in routine-intensive tasks has driven labour market polarisation over the past decades, there are,indeed, alternative explanations. For example, technological advances in computinghave dramatically lowered the cost of leaving information-based tasks to foreign work-sites (Jensen and Kletzer, 2005; Blinder, 2009; Jensen and Kletzer, 2010; Oldenski, 2012;Blinder and Krueger, 2013). The decline in the routine-intensity of employment is thuslikely to result from a combination of offshoring and automation. Furthermore, thereis evidence suggesting that improvements in transport and communication technologyhave augmented occupations involving human interaction, spanning across both cog-nitive and manual tasks (Michaels, et al., 2013). These explanations are neverthelessequally related to advance in computing and communications technology.
14
labour market outcomes remains to be seen. Throughout history, techno-
logical progress has vastly shifted the composition of employment, from
agriculture and the artisan shop, to manufacturing and clerking, to service
and management occupations. Yet the concern over technological unem-
ployment has proven to be exaggerated. The obvious reason why this
concern has not materialised relates to Ricardo’s famous chapter on ma-
chinery, which suggests that labour-saving technology reduces the demand
for undifferentiated labour, thus leading to technological unemployment
(Ricardo, 1819). As economists have long understood, however, an inven-
tion that replaces workers by machines will have effects on all product and
factor markets. An increase in the efficiency of production which reduces
the price of one good, will increase real income and thus increase demand
for other goods. Hence, in short, technological progress has two compet-
ing effects on employment (Aghion and Howitt, 1994). First, as technology
substitutes for labour, there is a destruction effect, requiring workers to
reallocate their labour supply; and second, there is the capitalisation ef-
fect, as more companies enter industries where productivity is relatively
high, leading employment in those industries to expand.
Although the capitalisation effect has been predominant historically,
our discovery of means of economising the use of labour can outrun the
pace at which we can find new uses for labour, as Keynes (1933) pointed
out. The reason why human labour has prevailed relates to its ability to
adopt and acquire new skills by means of education (Goldin and Katz,
2009). Yet as computerisation enters more cognitive domains this will
become increasingly challenging (Brynjolfsson and McAfee, 2011). Re-
cent empirical findings are therefore particularly concerning. For example,
Beaudry, et al. (2013) document a decline in the demand for skill over the
past decade, even as the supply of workers with higher education has con-
tinued to grow. They show that high-skilled workers have moved down the
occupational ladder, taking on jobs traditionally performed by low-skilled
workers, pushing low-skilled workers even further down the occupational
ladder and, to some extent, even out of the labour force. This raises
questions about: (a) the ability of human labour to win the race against
technology by means of education; and (b) the potential extent of techno-
logical unemployment, as an increasing pace of technological progress will
15
cause higher job turnover, resulting in a higher natural rate of unemploy-
ment (Lucas and Prescott, 1974; Davis and Haltiwanger, 1992; Pissarides, 2000). While the present study is limited to examining the destruction effect of technology, it nevertheless provides a useful indication of the job growth required to counterbalance the jobs at risk over the next decades.
3 The technological revolutions of the twenty-first century
The secular price decline in the real cost of computing has created vast eco-
nomic incentives for employers to substitute labour for computer capital.15
Yet the tasks computers are able to perform ultimately depend upon the
ability of a programmer to write a set of procedures or rules that appropri-
ately direct the technology in each possible contingency. Computers will
therefore be relatively productive to human labour when a problem can be
specified – in the sense that the criteria for success are quantifiable and can
readily be evaluated (Acemoglu and Autor, 2011). The extent of job com-
puterisation will thus be determined by technological advances that allow
engineering problems to be sufficiently specified, which sets the boundaries
for the scope of computerisation. In this section, we examine the extent of
tasks computer-controlled equipment can be expected to perform over the
next decades. Doing so, we focus on advances in fields related to Machine
Learning (ml), including Data Mining, Machine Vision, Computational
Statistics and other sub-fields of Artificial Intelligence (ai), in which ef-
forts are explicitly dedicated to the development of algorithms that allow
cognitive tasks to be automated. In addition, we examine the applica-
tion of ml technologies in Mobile Robotics (mr), and thus the extent of
computerisation in manual tasks.
Our analysis builds on the task categorisation of Autor, et al. (2003),
which distinguishes between workplace tasks using a two-by-two matrix,
with routine versus non-routine tasks on one axis, and manual versus cogni-
tive tasks on the other. In short, routine tasks are defined as tasks that fol-
15We refer to computer capital as accumulated computers and computer-controlledequipment by means of capital deepening.
16
low explicit rules that can be accomplished by machines, while non-routine
tasks are not sufficiently well understood to be specified in computer code.
Each of these task categories can, in turn, be of either manual or cognitive
nature – i.e. they relate to physical labour or knowledge work. Historically,
computerisation has largely been confined to manual and cognitive routine
tasks involving explicit rule-based activities (Autor and Dorn, 2013; Goos,
et al., 2009). Following recent technological advances, however, computeri-
sation is now spreading to domains commonly defined as non-routine. The
rapid pace at which tasks that were defined as non-routine only a decade
ago have now become computerisable is illustrated by Autor, et al. (2003),
asserting that: “Navigating a car through city traffic or deciphering the
scrawled handwriting on a personal check – minor undertakings for most
adults – are not routine tasks by our definition.” Today, the problems
of navigating a car and deciphering handwriting are sufficiently well un-
derstood that many related tasks can be specified in computer code and
automated (Veres, et al., 2011; Plötz and Fink, 2009).
Recent technological breakthroughs are, in large part, due to efforts to
turn non-routine tasks into well-defined problems. Defining such problems
is helped by the provision of relevant data: this is highlighted in the case
of handwriting recognition by Plötz and Fink (2009). The success of an
algorithm for handwriting recognition is difficult to quantify without data
to test on – in particular, determining whether an algorithm performs
well for different styles of writing requires data containing a variety of
such styles. That is, data is required to specify the many contingencies a
technology must manage in order to form an adequate substitute for human
labour. With data, objective and quantifiable measures of the success of
an algorithm can be produced, which aid the continual improvement of its
performance relative to humans.
As such, technological progress has been aided by the recent produc-
tion of increasingly large and complex datasets, known as big data.16 For
instance, with a growing corpus of human-translated digitalised text, the
16Predictions by Cisco Systems suggest that the Internet traffic in 2016 will be around1 zettabyte (1× 10
21 bytes) (Cisco, 2012). In comparison, the information contained inall books worldwide is about 480 terabytes (5× 10
14 bytes), and a text transcript of allthe words ever spoken by humans would represent about 5 exabytes (5 × 10
18 bytes)(uc Berkeley School of Information, 2003).
17
success of a machine translator can now be judged by its accuracy in re-producing observed translations. Data from United Nations documents, which are translated by human experts into six languages, allow Google Translate to monitor and improve the performance of different machine translation algorithms (Tanner, 2007).
Further, ml algorithms can discover unexpected similarities between old and new data, aiding the computerisation of tasks for which big data has newly become available. As a result, computerisation is no longer confined to routine tasks that can be written as rule-based software queries, but is spreading to every non-routine task where big data becomes available (Brynjolfsson and McAfee, 2011). In this section, we examine the extent of future computerisation beyond routine tasks.
3.1 Computerisation in non-routine cognitive tasks
With the availability of big data, a wide range of non-routine cognitive tasks are becoming computerisable. That is, further to the general im-
provement in technological progress due to big data, algorithms for big data are rapidly entering domains reliant upon storing or accessing inf-
ormation. The use of big data is afforded by one of the chief compara-
tive advantages of computers relative to human labor: scalability. Little evidence is required to demonstrate that, in performing the task of labo-
rious computation, networks of machines scale better than human labour (Campbell-Kelly, 2009). As such, computers can better manage the large calculations required in using large datasets. ml algorithms running on computers are now, in many cases, better able to detect patterns in big data than humans.
Computerisation of cognitive tasks is also aided by another core com-
parative advantage of algorithms: their absence of some human biases. An algorithm can be designed to ruthlessly satisfy the small range of tasks it is given. Humans, in contrast, must fulfill a range of tasks unrelated to their occupation, such as sleeping, necessitating occasional sacrifices in their occupational performance (Kahneman, et al., 1982). The additional con-
straints under which humans must operate manifest themselves as biases. Consider an example of human bias: Danziger, et al. (2011) demonstrate
18
that experienced Israeli judges are substantially more generous in their
rulings following a lunch break. It can thus be argued that many roles in-
volving decision-making will benefit from impartial algorithmic solutions.
Fraud detection is a task that requires both impartial decision making
and the ability to detect trends in big data. As such, this task is now
almost completely automated (Phua, et al., 2010). In a similar manner,
the comparative advantages of computers are likely to change the nature
of work across a wide range of industries and occupations.
In health care, diagnostics tasks are already being computerised. On-
cologists at Memorial Sloan-Kettering Cancer Center are, for example,
using ibm’s Watson computer to provide chronic care and cancer treat-
ment diagnostics. Knowledge from 600,000 medical evidence reports, 1.5
million patient records and clinical trials, and two million pages of text
from medical journals, are used for benchmarking and pattern recognition
purposes. This allows the computer to compare each patient’s individual
symptoms, genetics, family and medication history, etc., to diagnose and
develop a treatment plan with the highest probability of success (Cohn,
2013).
In addition, computerisation is entering the domains of legal and finan-
cial services. Sophisticated algorithms are gradually taking on a number
of tasks performed by paralegals, contract and patent lawyers (Markoff,
2011). More specifically, law firms now rely on computers that can scan
thousands of legal briefs and precedents to assist in pre-trial research. A
frequently cited example is Symantec’s Clearwell system, which uses lan-
guage analysis to identify general concepts in documents, can present the
results graphically, and proved capable of analysing and sorting more than
570,000 documents in two days (Markoff, 2011).
Furthermore, the improvement of sensing technology has made sen-
sor data one of the most prominent sources of big data (Ackerman and
Guizzo, 2011). Sensor data is often coupled with new ml fault- and
anomaly-detection algorithms to render many tasks computerisable. A
broad class of examples can be found in condition monitoring and novelty
detection, with technology substituting for closed-circuit tv (cctv) oper-
ators, workers examining equipment defects, and clinical staff responsible
for monitoring the state of patients in intensive care. Here, the fact that
19
computers lack human biases is of great value: algorithms are free of ir-
rational bias, and their vigilance need not be interrupted by rest breaks
or lapses of concentration. Following the declining costs of digital sensing
and actuation, ml approaches have successfully addressed condition mon-
itoring applications ranging from batteries (Saha, et al., 2007), to aircraft
engines (King, et al., 2009), water quality (Osborne, et al., 2012) and in-
tensive care units (icus) (Clifford and Clifton, 2012; Clifton, et al., 2012).
Sensors can equally be placed on trucks and pallets to improve companies’
supply chain management, and used to measure the moisture in a field of
crops to track the flow of water through utility pipes. This allows for au-
tomatic meter reading, eliminating the need for personnel to gather such
information. For example, the cities of Doha, São Paulo, and Beijing use
sensors on pipes, pumps, and other water infrastructure to monitor con-
ditions and manage water loss, reducing leaks by 40 to 50 percent. In the
near future, it will be possible to place inexpensive sensors on light poles,
sidewalks, and other public property to capture sound and images, likely
reducing the number of workers in law enforcement (MGI, 2013).
Advances in user interfaces also enable computers to respond directly
to a wider range of human requests, thus augmenting the work of highly
skilled labour, while allowing some types of jobs to become fully auto-
mated. For example, Apple’s Siri and Google Now rely on natural user
interfaces to recognise spoken words, interpret their meanings, and act
on them accordingly. Moreover, a company called SmartAction now pro-
vides call computerisation solutions that use ml technology and advanced
speech recognition to improve upon conventional interactive voice response
systems, realising cost savings of 60 to 80 percent over an outsourced call
center consisting of human labour (CAA, 2012). Even education, one of
the most labour intensive sectors, will most likely be significantly impacted
by improved user interfaces and algorithms building upon big data. The
recent growth in moocs (Massive Open Online Courses) has begun to gen-
erate large datasets detailing how students interact on forums, their dili-
gence in completing assignments and viewing lectures, and their ultimate
grades (Simonite, 2013; Breslow, et al., 2013). Such information, together
with improved user interfaces, will allow for ml algorithms that serve as
interactive tutors, with teaching and assessment strategies statistically cal-
20
ibrated to match individual student needs (Woolf, 2010). Big data analysis
will also allow for more effective predictions of student performance, and
for their suitability for post-graduation occupations. These technologies
can equally be implemented in recruitment, most likely resulting in the
streamlining of human resource (hr) departments.
Occupations that require subtle judgement are also increasingly sus-
ceptible to computerisation. To many such tasks, the unbiased decision
making of an algorithm represents a comparative advantage over human
operators. In the most challenging or critical applications, as in icus, algo-
rithmic recommendations may serve as inputs to human operators; in other
circumstances, algorithms will themselves be responsible for appropriate
decision-making. In the financial sector, such automated decision-making
has played a role for quite some time. ai algorithms are able to process a
greater number of financial announcements, press releases, and other inf-
ormation than any human trader, and then act faster upon them (Mims,
2010). Services like Future Advisor similarly use ai to offer personalised
financial advice at larger scale and lower cost. Even the work of software
engineers may soon largely be computerisable. For example, advances in
ml allow a programmer to leave complex parameter and design choices
to be appropriately optimised by an algorithm (Hoos, 2012). Algorithms
can further automatically detect bugs in software (Hangal and Lam, 2002;
Livshits and Zimmermann, 2005; Kim, et al., 2008), with a reliability that
humans are unlikely to match. Big databases of code also offer the eventual
prospect of algorithms that learn how to write programs to satisfy spec-
ifications provided by a human. Such an approach is likely to eventually
improve upon human programmers, in the same way that human-written
compilers eventually proved inferior to automatically optimised compilers.
An algorithm can better keep the whole of a program in working memory,
and is not constrained to human-intelligible code, allowing for holistic solu-
tions that might never occur to a human. Such algorithmic improvements
over human judgement are likely to become increasingly common.
Although the extent of these developments remains to be seen, esti-
mates by MGI (2013) suggests that sophisticated algorithms could sub-
stitute for approximately 140 million full-time knowledge workers world-
wide. Hence, while technological progress throughout economic history
21
has largely been confined to the mechanisation of manual tasks, requir-
ing physical labour, technological progress in the twenty-first century can be expected to contribute to a wide range of cognitive tasks, which, until now, have largely remained a human domain. Of course, many occupations being affected by these developments are still far from fully computeris-
able, meaning that the computerisation of some tasks will simply free-up time for human labour to perform other tasks. Nonetheless, the trend is clear: computers increasingly challenge human labour in a wide range of cognitive tasks (Brynjolfsson and McAfee, 2011).
3.2 Computerisation in non-routine manual tasks
Mobile robotics provides a means of directly leveraging ml technologies to aid the computerisation of a growing scope of manual tasks. The con-
tinued technological development of robotic hardware is having notable impact upon employment: over the past decades, industrial robots have taken on the routine tasks of most operatives in manufacturing. Now, however, more advanced robots are gaining enhanced sensors and manipu-
lators, allowing them to perform non-routine manual tasks. For example, General Electric has recently developed robots to climb and maintain wind turbines, and more flexible surgical robots with a greater range of motion will soon perform more types of operations (Robotics-VO, 2013). In a similar manner, the computerisation of logistics is being aided by the in-
creasing cost-effectiveness of highly instrumented and computerised cars. Mass-production vehicles, such as the Nissan leaf, contain on-board com-
puters and advanced telecommunication equipment that render the car a potentially fly-by-wire robot.17 Advances in sensor technology mean that vehicles are likely to soon be augmented with even more advanced suites of sensors. These will permit an algorithmic vehicle controller to monitor its environment to a degree that exceeds the capabilities of any human driver: they have the ability to simultaneously look both forwards and backwards, can natively integrate camera, gps and lidar data, and are not subject to distraction. Algorithms are thus potentially safer and more effective drivers than humans.
17A fly-by-wire robot is a robot that is controllable by a remote computer.
22
The big data provided by these improved sensors are offering solutions
to many of the engineering problems that had hindered robotic develop-
ment in the past. In particular, the creation of detailed three dimensional
maps of road networks has enabled autonomous vehicle navigation; most
notably illustrated by Google’s use of large, specialised datasets collected
by its driverless cars (Guizzo, 2011). It is now completely feasible to store
representations of the entire road network on-board a car, dramatically
simplifying the navigation problem. Algorithms that could perform navi-
gation throughout the changing seasons, particularly after snowfall, have
been viewed as a substantial challenge. However, the big data approach
can answer this by storing records from the last time snow fell, against
which the vehicle’s current environment can be compared (Churchill and
Newman, 2012). ml approaches have also been developed to identify un-
precedented changes to a particular piece of the road network, such as
roadworks (Mathibela, et al., 2012). This emerging technology will affect a
variety of logistics jobs. Agricultural vehicles, forklifts and cargo-handling
vehicles are imminently automatable, and hospitals are already employing
autonomous robots to transport food, prescriptions and samples (Bloss,
2011). The computerisation of mining vehicles is further being pursued
by companies such as Rio Tinto, seeking to replace labour in Australian
mine-sites.18
With improved sensors, robots are capable of producing goods with
higher quality and reliability than human labour. For example, El Dulze, a
Spanish food processor, now uses robotics to pick up heads of lettuce from a
conveyor belt, rejecting heads that do not comply with company standards.
This is achieved by measuring their density and replacing them on the
belt (IFR, 2012a). Advanced sensors further allow robots to recognise
patterns. Baxter, a 22,000 usd general-purpose robot, provides a well-
known example. The robot features an lcd display screen displaying a pair
of eyes that take on different expressions depending on the situation. When
the robot is first installed or needs to learn a new pattern, no programming
is required. A human worker simply guides the robot arms through the
motions that will be needed for the task. Baxter then memorises these
18Rio Tinto’s computerisation efforts are advertised at http://www.mineofthefuture.com.au.
23
patterns and can communicate that it has understood its new instructions.
While the physical flexibility of Baxter is limited to performing simple
operations such as picking up objects and moving them, different standard
attachments can be installed on its arms, allowing Baxter to perform a
relatively broad scope of manual tasks at low cost (MGI, 2013).
Technological advances are contributing to declining costs in robotics.
Over the past decades, robot prices have fallen about 10 percent annually
and are expected to decline at an even faster pace in the near future (MGI,
2013). Industrial robots, with features enabled by machine vision and high-
precision dexterity, which typically cost 100,000 to 150,000 usd, will be
available for 50,000 to 75,000 usd in the next decade, with higher levels
of intelligence and additional capabilities (IFR, 2012b). Declining robot
prices will inevitably place them within reach of more users. For example,
in China, employers are increasingly incentivised to substitute robots for
labour, as wages and living standards are rising – Foxconn, a Chinese
contract manufacturer that employs 1.2 million workers, is now investing
in robots to assemble products such as the Apple iPhone (Markoff, 2012).
According to the International Federation of Robotics, robot sales in China
grew by more than 50 percent in 2011 and are expected to increase further.
Globally, industrial robot sales reached a record 166,000 units in 2011, a
40 percent year-on-year increase (IFR, 2012b). Most likely, there will be
even faster growth ahead as low-priced general-purpose models, such as
Baxter, are adopted in simple manufacturing and service work.
Expanding technological capabilities and declining costs will make en-
tirely new uses for robots possible. Robots will likely continue to take on
an increasing set of manual tasks in manufacturing, packing, construction,
maintenance, and agriculture. In addition, robots are already performing
many simple service tasks such as vacuuming, mopping, lawn mowing, and
gutter cleaning – the market for personal and household service robots is
growing by about 20 percent annually (MGI, 2013). Meanwhile, commer-
cial service robots are now able to perform more complex tasks in food
preparation, health care, commercial cleaning, and elderly care (Robotics-
VO, 2013). As robot costs decline and technological capabilities expand,
robots can thus be expected to gradually substitute for labour in a wide
range of low-wage service occupations, where most us job growth has oc-
24
curred over the past decades (Autor and Dorn, 2013). This means that many low-wage manual jobs that have been previously protected from computerisation could diminish over time.
3.3 The task model revisited
The task model of Autor, et al. (2003) has delivered intuitive and accu-
rate predictions in that: (a) computers are more substitutable for human labour in routine relative to non-routine tasks; and (b) a greater inten-
sity of routine inputs increases the marginal productivity of non-routine inputs. Accordingly, computers have served as a substitute for labour for many routine tasks, while exhibiting strong complementarities with labour performing cognitive non-routine tasks.19 Yet the premises about what computers do have recently expanded. Computer capital can now equally substitute for a wide range of tasks commonly defined as non-
routine (Brynjolfsson and McAfee, 2011), meaning that the task model will not hold in predicting the impact of computerisation on the task con-
tent of employment in the twenty-first century. While focusing on the substitution effects of recent technological progress, we build on the task model by deriving several factors that we expect will determine the extent of computerisation in non-routine tasks.
The task model assumes for tractability an aggregate, constant-returns-
to-scale, Cobb-Douglas production function of the form
(1) Q = (LS + C)1−βLβNS, β ∈ [0, 1],
where LS and LNS are susceptible and non-susceptible labor inputs and C
is computer capital. Computer capital is supplied perfectly elastically at
market price per efficiency unit, where the market price is falling exoge-
nously with time due to technological progress. It further assumes income-
maximizing workers, with heterogeneous productivity endowments in both
susceptible and non-susceptible tasks. Their task supply will respond elas-
tically to relative wage levels, meaning that workers will reallocate their
19The model does not predict any substantial substitution or complementarity withnon-routine manual tasks.
25
labour supply according to their comparative advantage as in Roy (1951).
With expanding computational capabilities, resulting from technological
advances, and a falling market price of computing, workers in susceptible
tasks will thus reallocate to non-susceptible tasks.
The above described simple model differs from the task model of Autor,
et al. (2003), in that LNS is not confined to routine labour inputs. This
is because recent developments in ml and mr, building upon big data,
allow for pattern recognition, and thus enable computer capital to rapidly
substitute for labour across a wide range of non-routine tasks. Yet some in-
hibiting engineering bottlenecks to computerisation persist. Beyond these
bottlenecks, however, we argue that it is largely already technologically
possible to automate almost any task, provided that sufficient amounts of
data are gathered for pattern recognition. Our model thus predicts that
the pace at which these bottlenecks can be overcome will determine the
extent of computerisation in the twenty-first century.
Hence, in short, while the task model predicts that computers for labour
substitution will be confined to routine tasks, our model predicts that com-
puterisation can be extended to any non-routine task that is not subject
to any engineering bottlenecks to computerisation. These bottlenecks thus
set the boundaries for the computerisation of non-routine tasks. Drawing
upon the ml and mr literature, and a workshop held at the Oxford Uni-
versity Engineering Sciences Department, we identify several engineering
bottlenecks, corresponding to three task categories. According to these
findings, non-susceptible labor inputs can be described as,
(2) LNS =n
∑
i=1
(
LPM,i + LC,i + LSI,i
)
where LPM, LC and LSI are labour inputs into perception and manipulation
tasks, creative intelligence tasks, and and social intelligence tasks.
We note that some related engineering bottlenecks can be partially al-
leviated by the simplification of tasks. One generic way of achieving this
is to reduce the variation between task iterations. As a prototypical ex-
ample, consider the factory assembly line, turning the non-routine tasks
26
of the artisan shop into repetitive routine tasks performed by unskilled factory workers. A more recent example is the computerisation of non-
routine manual tasks in construction. On-site construction tasks typically demand a high degree of adaptability, so as to accommodate work environ-
ments that are typically irregularly laid out, and vary according to weather. Prefabrication, in which the construction object is partially assembled in a factory before being transported to the construction site, provides a way of largely removing the requirement for adaptability. It allows many construction tasks to be performed by robots under controlled conditions that eliminate task variability – a method that is becoming increasingly widespread, particularly in Japan (Barlow and Ozaki, 2005; Linner and Bock, 2012). The extent of computerisation in the twenty-first century will thus partly depend on innovative approaches to task restructuring. In the remainder of this section we examine the engineering bottlenecks related to the above mentioned task categories, each in turn.
Perception and manipulation tasks. Robots are still unable to match the depth and breadth of human perception. While basic geometric identi-
fication is reasonably mature, enabled by the rapid development of sophis-
ticated sensors and lasers, significant challenges remain for more complex perception tasks, such as identifying objects and their properties in a clut-
tered field of view. As such, tasks that relate to an unstructured work environment can make jobs less susceptible to computerisation. For exam-
ple, most homes are unstructured, requiring the identification of a plural-
ity of irregular objects and containing many cluttered spaces which inhibit the mobility of wheeled objects. Conversely, supermarkets, factories, ware-
houses, airports and hospitals have been designed for large wheeled objects, making it easier for robots to navigate in performing non-routine manual tasks. Perception problems can, however, sometimes be sidestepped by clever task design. For example, Kiva Systems, acquired by Amazon.com in 2012, solved the problem of warehouse navigation by simply placing bar-code stickers on the floor, informing robots of their precise location (Guizzo, 2008).
The difficulty of perception has ramifications for manipulation tasks, and, in particular, the handling of irregular objects, for which robots are
27
yet to reach human levels of aptitude. This has been evidenced in the de-
velopment of robots that interact with human objects and environments. While advances have been made, solutions tend to be unreliable over the myriad small variations on a single task, repeated thousands of times a day, that many applications require. A related challenge is failure recov-
ery – i.e. identifying and rectifying the mistakes of the robot when it has, for example, dropped an object. Manipulation is also limited by the diffi-
culties of planning out the sequence of actions required to move an object from one place to another. There are yet further problems in designing manipulators that, like human limbs, are soft, have compliant dynamics and provide useful tactile feedback. Most industrial manipulation makes uses of workarounds to these challenges (Brown, et al., 2010), but these approaches are nonetheless limited to a narrow range of tasks. The main challenges to robotic computerisation, perception and manipulation, thus largely remain and are unlikely to be fully resolved in the next decade or two (Robotics-VO, 2013).
Creative intelligence tasks. The psychological processes underlying human creativity are difficult to specify. According to Boden (2003), cre-ativity is the ability to come up with ideas or artifacts that are novel and valuable. Ideas, in a broader sense, include concepts, poems, musical com-
positions, scientific theories, cooking recipes and jokes, whereas artifacts are objects such as paintings, sculptures, machinery, and pottery. One process of creating ideas (and similarly for artifacts) involves making un-
familiar combinations of familiar ideas, requiring a rich store of knowledge. The challenge here is to find some reliable means of arriving at combina-
tions that “make sense.” For a computer to make a subtle joke, for example, would require a database with a richness of knowledge comparable to that of humans, and methods of benchmarking the algorithm’s subtlety.
In principle, such creativity is possible and some approaches to cre-ativity already exist in the literature. Duvenaud, et al. (2013) provide an example of automating the core creative task required in order to per-
form statistics, that of designing models for data. As to artistic creativ-
ity, aaron, a drawing-program, has generated thousands of stylistically-
similar line-drawings, which have been exhibited in galleries worldwide.
28
Furthermore, David Cope’s emi software composes music in many differ-
ent styles, reminiscent of specific human composers.
In these and many other applications, generating novelty is not partic-
ularly difficult. Instead, the principal obstacle to computerising creativity is stating our creative values sufficiently clearly that they can be encoded in an program (Boden, 2003). Moreover, human values change over time and vary across cultures. Because creativity, by definition, involves not only novelty but value, and because values are highly variable, it follows that many arguments about creativity are rooted in disagreements about value. Thus, even if we could identify and encode our creative values, to enable the computer to inform and monitor its own activities accordingly, there would still be disagreement about whether the computer appeared to be creative. In the absence of engineering solutions to overcome this prob-
lem, it seems unlikely that occupations requiring a high degree of creative intelligence will be automated in the next decades.
Social intelligence tasks. Human social intelligence is important in a wide range of work tasks, such as those involving negotiation, persuasion and care. To aid the computerisation of such tasks, active research is be-
ing undertaken within the fields of Affective Computing (Scherer, et al., 2010; Picard, 2010), and Social Robotics (Ge, 2007; Broekens, et al., 2009). While algorithms and robots can now reproduce some aspects of human social interaction, the real-time recognition of natural human emotion re-mains a challenging problem, and the ability to respond intelligently to such inputs is even more difficult. Even simplified versions of typical so-
cial tasks prove difficult for computers, as is the case in which social in-
teraction is reduced to pure text. The social intelligence of algorithms is partly captured by the Turing test, examining the ability of a machine to communicate indistinguishably from an actual human. Since 1990, the Loebner Prize, an annual Turing test competition, awards prizes to textual chat programmes that are considered to be the most human-like. In each competition, a human judge simultaneously holds computer-based textual interactions with both an algorithm and a human. Based on the responses, the judge is to distinguish between the two. Sophisticated algorithms have so far failed to convince judges about their human resemblance. This is
29
replacemen
Pro
babi
lity
ofC
ompu
teri
sation
Social Intelligence
Dishwasher
EventPlanner
PublicRelations
0 100
0
1
Pro
babi
lity
ofC
ompu
teri
sation
Creativity
Court Clerk
Biologist
FashionDesigner
0 100
0
1
Pro
babi
lity
ofC
ompu
teri
sation
Perception and manipulation
Telemarketer
Boilermaker
Surgeon
0 100
0
1
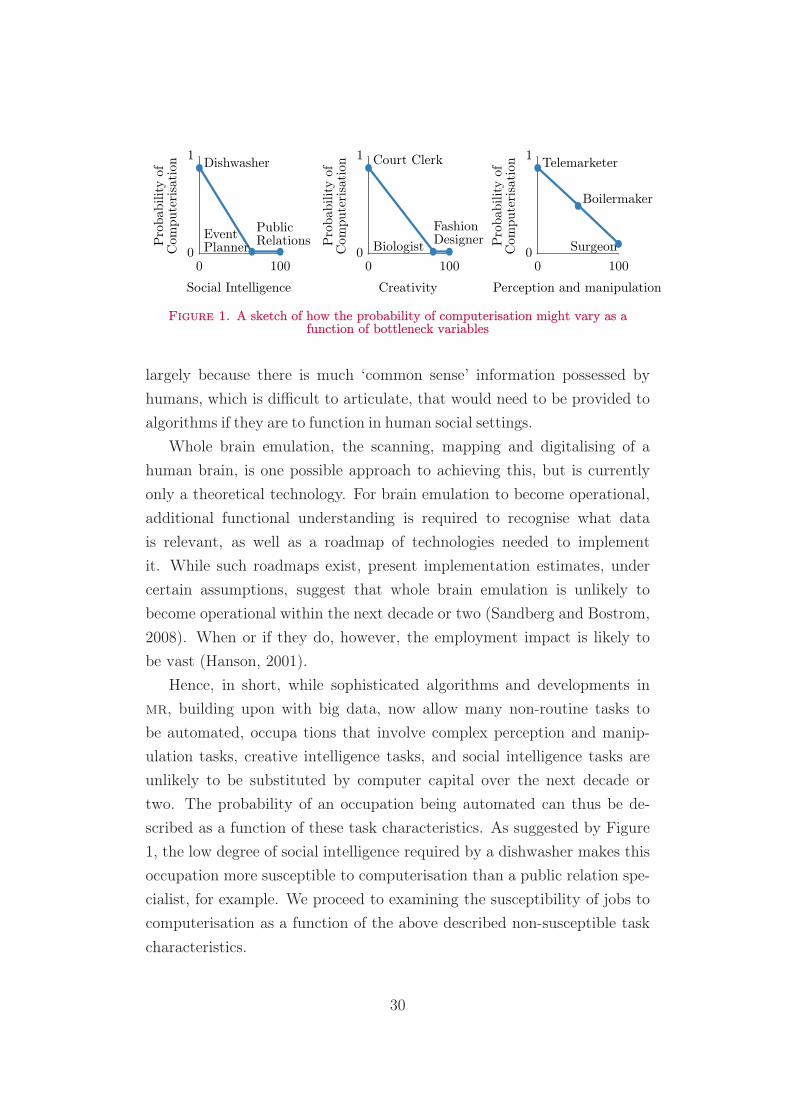
Figure 1. A sketch of how the probability of computerisation might vary as a function of bottleneck variables
largely because there is much ‘common sense’ information possessed by humans, which is difficult to articulate, that would need to be provided to algorithms if they are to function in human social settings.
Whole brain emulation, the scanning, mapping and digitalising of a human brain, is one possible approach to achieving this, but is currently only a theoretical technology. For brain emulation to become operational, additional functional understanding is required to recognise what data is relevant, as well as a roadmap of technologies needed to implement it. While such roadmaps exist, present implementation estimates, under certain assumptions, suggest that whole brain emulation is unlikely to become operational within the next decade or two (Sandberg and Bostrom, 2008). When or if they do, however, the employment impact is likely to be vast (Hanson, 2001).
Hence, in short, while sophisticated algorithms and developments in mr, building upon with big data, now allow many non-routine tasks to be automated, occupa tions that involve complex perception and manip-
ulation tasks, creative intelligence tasks, and social intelligence tasks are unlikely to be substituted by computer capital over the next decade or two. The probability of an occupation being automated can thus be de-
scribed as a function of these task characteristics. As suggested by Figure 1, the low degree of social intelligence required by a dishwasher makes this occupation more susceptible to computerisation than a public relation spe-
cialist, for example. We proceed to examining the susceptibility of jobs to computerisation as a function of the above described non-susceptible task characteristics.
30
4 Measuring the employment impact of com-
puterisation
4.1 Data sources and implementation strategy
To implement the above described methodology, we rely on o∗net, an online service developed for the us Department of Labor. The 2010 ver-sion of o∗net contains information on 903 detailed occupations, most of which correspond closely to the Labor Department’s Standard Occupa-
tional Classification (soc). The o∗net data was initially collected from labour market analysts, and has since been regularly updated by surveys
of each occupation’s worker population and related experts, to provide
up-to-date information on occupations as they evolve over time. For our
purposes, an important feature of o∗net is that it defines the key features of an occupation as a standardised and measurable set of variables, but
also provides open-ended descriptions of specific tasks to each occupation. This allows us to: (a) objectively rank occupations according to the mix of
knowledge, skills, and abilities they require; and (b) subjectively categorise them based on the variety of tasks they involve.
The close soc correspondence of o∗net allows us to link occupational characteristics to 2010 Bureau of Labor Statistics (bls) employment and
wage data. While the o∗net occupational classification is somewhat more detailed, distinguishing between Auditors and Accountants, for example,
we aggregate these occupations to correspond to the six-digit 2010 soc system, for which employment and wage figures are reported. To obtain
unique o∗net variables corresponding to the six-digit soc classification, we used the mean of the o∗net aggregate. In addition, we exclude any
six-digit soc occupations for which o∗net data was missing.20 Doing so, we end up with a final dataset consisting of 702 occupations.
To assess the employment impact of the described technological devel-
20The missing occupations consist of “All Other” titles, representing occupations witha wide range of characteristics which do not fit into one of the detailed o∗net-soc
occupations. o∗net data is not available for this type of title. We note that us
employment for the 702 occupations we considered is 138.44 million. Hence our analysisexcluded 4.628 million jobs, equivalent to 3 percent of total employment.
31
opments in ml, the ideal experiment would provide two identical autarkic
economies, one facing the expanding technological capabilities we observe,
and a secular decline in the price of computerisation, and the other not.
By comparison, it would be straightforward to examine how computerisa-
tion reshapes the occupational composition of the labour market. In the
absence of this experiment, the second preferred option would be to build
on the implementation strategy of Autor, et al. (2003), and test a simple
economic model to predict how demand for workplace tasks responds to
developments in ml and mr technology. However, because our paper is
forward-looking, in the sense that most of the described technological de-
velopments are yet to be implemented across industries on a broader scale,
this option was not available for our purposes.
Instead, our implementation strategy builds on the literature examining
the offshoring of information-based tasks to foreign worksites, consisting
of different methodologies to rank and categorise occupations according to
their susceptibility to offshoring (Blinder, 2009; Jensen and Kletzer, 2005,
2010). The common denominator for these studies is that they rely on
o∗net data in different ways. While Blinder (2009) eyeballed the o∗net
data on each occupation, paying particular attention to the job description,
tasks, and work activities, to assign an admittedly subjective two-digit in-
dex number of offshorability to each occupation, Jensen and Kletzer (2005)
created a purely objective ranking based on standardised and measurable
o∗net variables. Both approaches have obvious drawbacks. Subjective
judgments are often not replicable and may result in the researcher sub-
consciously rigging the data to conform to a certain set of beliefs. Objective
rankings, on the other hand, are not subject to such drawbacks, but are
constrained by the reliability of the variables that are being used. At this
stage, it shall be noted that o∗net data was not gathered to specifically
measure the offshorability or automatability of jobs. Accordingly, Blinder
(2009) finds that past attempts to create objective offshorability rankings
using o∗net data have yielded some questionable results, ranking lawyers
and judges among the most tradable occupations, while classifying occu-
pations such as data entry keyers, telephone operators, and billing clerks
as virtually impossible to move offshore.
To work around some of these drawbacks, we combine and build upon
32
the two described approaches. First, together with a group of ml re-
searchers, we subjectively hand-labelled 70 occupations, assigning 1 if au-
tomatable, and 0 if not. For our subjective assessments, we draw upon
a workshop held at the Oxford University Engineering Sciences Depart-
ment, examining the automatability of a wide range of tasks. Our label
assignments were based on eyeballing the o∗net tasks and job description
of each occupation. This information is particular to each occupation, as
opposed to standardised across different jobs. The hand-labelling of the
occupations was made by answering the question “Can the tasks of this job
be sufficiently specified, conditional on the availability of big data, to be
performed by state of the art computer-controlled equipment”. Thus, we
only assigned a 1 to fully automatable occupations, where we considered
all tasks to be automatable. To the best of our knowledge, we consid-
ered the possibility of task simplification, possibly allowing some currently
non-automatable tasks to be automated. Labels were assigned only to the
occupations about which we were most confident.
Second, we use objective o∗net variables corresponding to the defined
bottlenecks to computerisation. More specifically, we are interested in
variables describing the level of perception and manipulation, creativity,
and social intelligence required to perform it. As reported in Table 1,
we identified nine variables that describe these attributes. These variables
were derived from the o∗net survey, where the respondents are given mul-
tiple scales, with “importance” and “level” as the predominant pair. We
rely on the “level” rating which corresponds to specific examples about
the capabilities required of computer-controlled equipment to perform the
tasks of an occupation. For instance, in relation to the attribute “Man-
ual Dexterity”, low (level) corresponds to “Screw a light bulb into a light
socket”; medium (level) is exemplified by “Pack oranges in crates as quickly
as possible”; high (level) is described as “Perform open-heart surgery with
surgical instruments”. This gives us an indication of the level of “Man-
ual Dexterity” computer-controlled equipment would require to perform a
specific occupation. An exception is the “Cramped work space” variable,
which measures the frequency of unstructured work.
Hence, in short, by hand-labelling occupations, we work around the
issue that o∗net data was not gathered to specifically measure the au-
33
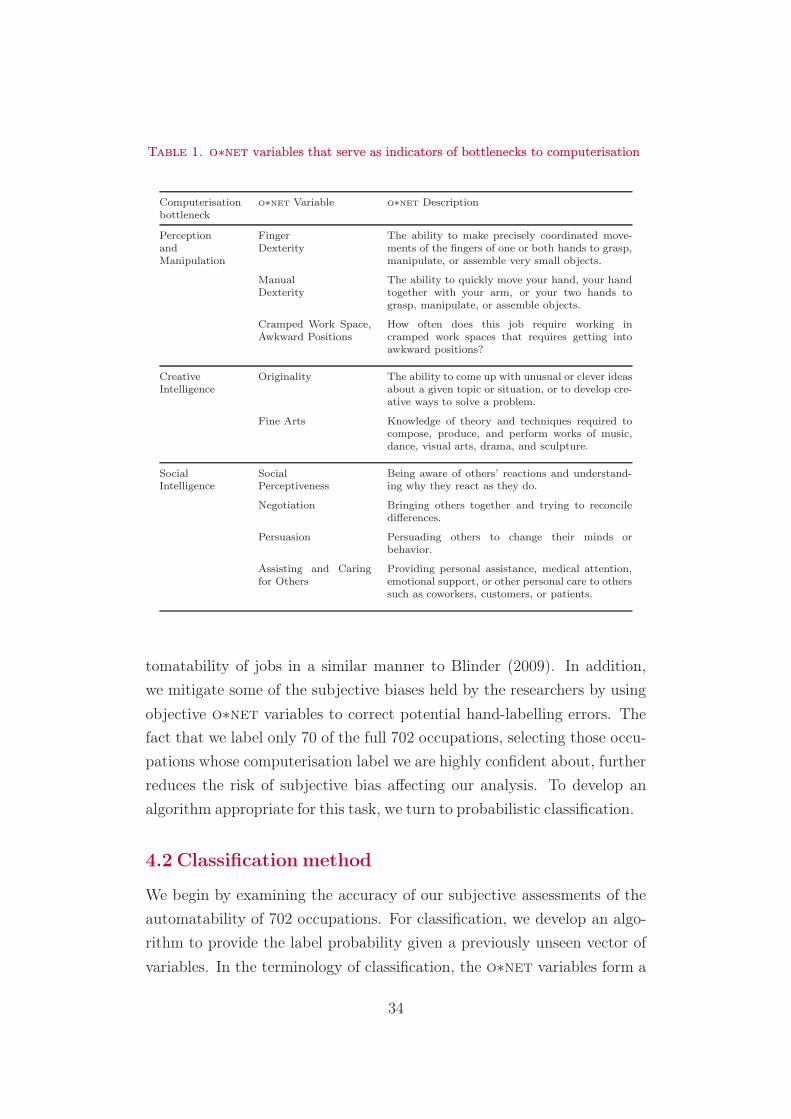
Table 1. o∗net variables that serve as indicators of bottlenecks to computerisation
Computerisationbottleneck
o∗net Variable o∗net Description
PerceptionandManipulation
FingerDexterity
The ability to make precisely coordinated move-ments of the fingers of one or both hands to grasp,manipulate, or assemble very small objects.
ManualDexterity
The ability to quickly move your hand, your handtogether with your arm, or your two hands tograsp, manipulate, or assemble objects.
Cramped Work Space,Awkward Positions
How often does this job require working incramped work spaces that requires getting intoawkward positions?
CreativeIntelligence
Originality The ability to come up with unusual or clever ideasabout a given topic or situation, or to develop cre-ative ways to solve a problem.
Fine Arts Knowledge of theory and techniques required tocompose, produce, and perform works of music,dance, visual arts, drama, and sculpture.
SocialIntelligence
SocialPerceptiveness
Being aware of others’ reactions and understand-ing why they react as they do.
Negotiation Bringing others together and trying to reconciledifferences.
Persuasion Persuading others to change their minds orbehavior.
Assisting and Caringfor Others
Providing personal assistance, medical attention,emotional support, or other personal care to otherssuch as coworkers, customers, or patients.
tomatability of jobs in a similar manner to Blinder (2009). In addition, we mitigate some of the subjective biases held by the researchers by using
objective o∗net variables to correct potential hand-labelling errors. The
fact that we label only 70 of the full 702 occupations, selecting those occu-
pations whose computerisation label we are highly confident about, further reduces the risk of subjective bias affecting our analysis. To develop an algorithm appropriate for this task, we turn to probabilistic classification.
4.2 Classification method
We begin by examining the accuracy of our subjective assessments of the automatability of 702 occupations. For classification, we develop an algo-
rithm to provide the label probability given a previously unseen vector of
variables. In the terminology of classification, the o∗net variables form a
34
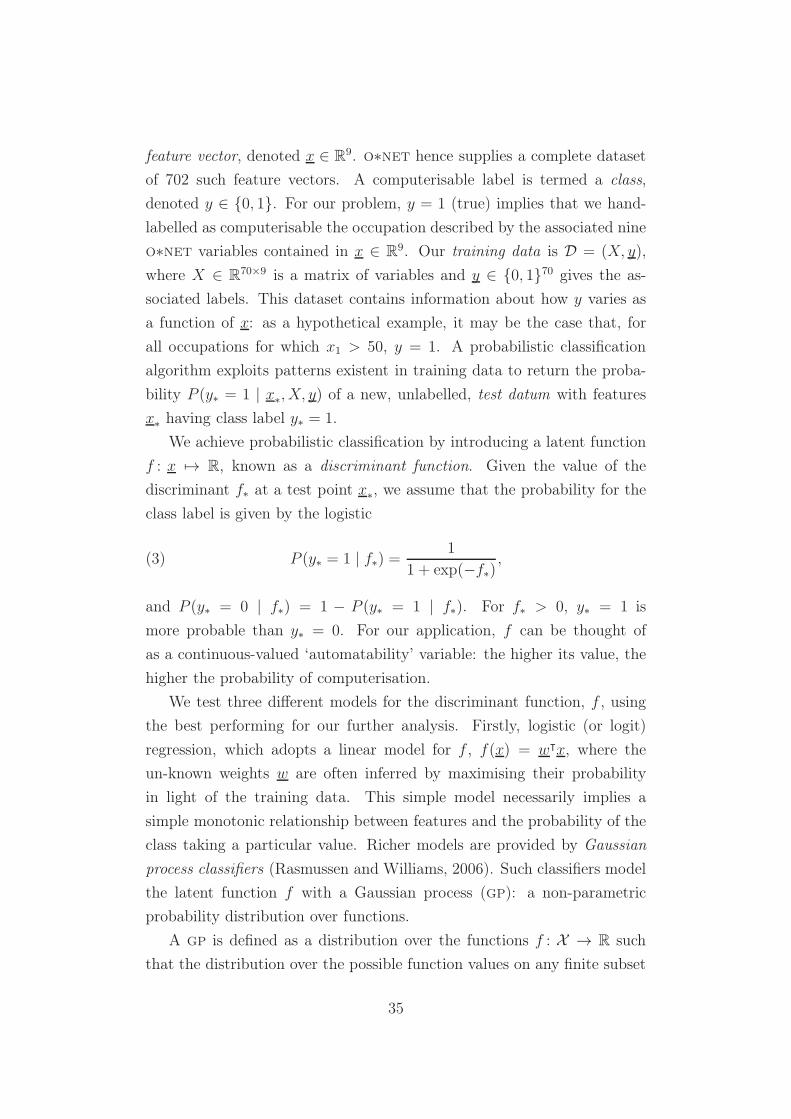
feature vector, denoted x ∈ R9. o∗net hence supplies a complete dataset
of 702 such feature vectors. A computerisable label is termed a class,
denoted y ∈ {0, 1}. For our problem, y = 1 (true) implies that we hand-
labelled as computerisable the occupation described by the associated nine
o∗net variables contained in x ∈ R9. Our training data is D = (X, y),
where X ∈ R70×9 is a matrix of variables and y ∈ {0, 1}70 gives the as-
sociated labels. This dataset contains information about how y varies as
a function of x: as a hypothetical example, it may be the case that, for
all occupations for which x1 > 50, y = 1. A probabilistic classification
algorithm exploits patterns existent in training data to return the proba-
bility P (y∗ = 1 | x∗, X, y) of a new, unlabelled, test datum with features
x∗
having class label y∗ = 1.
We achieve probabilistic classification by introducing a latent function
f : x 7→ R, known as a discriminant function. Given the value of the
discriminant f∗ at a test point x∗, we assume that the probability for the
class label is given by the logistic
(3) P (y∗ = 1 | f∗) =1
1 + exp(−f∗),
and P (y∗ = 0 | f∗) = 1 − P (y∗ = 1 | f∗). For f∗ > 0, y∗ = 1 is
more probable than y∗ = 0. For our application, f can be thought of
as a continuous-valued ‘automatability’ variable: the higher its value, the
higher the probability of computerisation.
We test three different models for the discriminant function, f , using
the best performing for our further analysis. Firstly, logistic (or logit)
regression, which adopts a linear model for f , f(x) = w⊺x, where the
un-known weights w are often inferred by maximising their probability
in light of the training data. This simple model necessarily implies a
simple monotonic relationship between features and the probability of the
class taking a particular value. Richer models are provided by Gaussian
process classifiers (Rasmussen and Williams, 2006). Such classifiers model
the latent function f with a Gaussian process (gp): a non-parametric
probability distribution over functions.
A gp is defined as a distribution over the functions f : X → R such
that the distribution over the possible function values on any finite subset
35
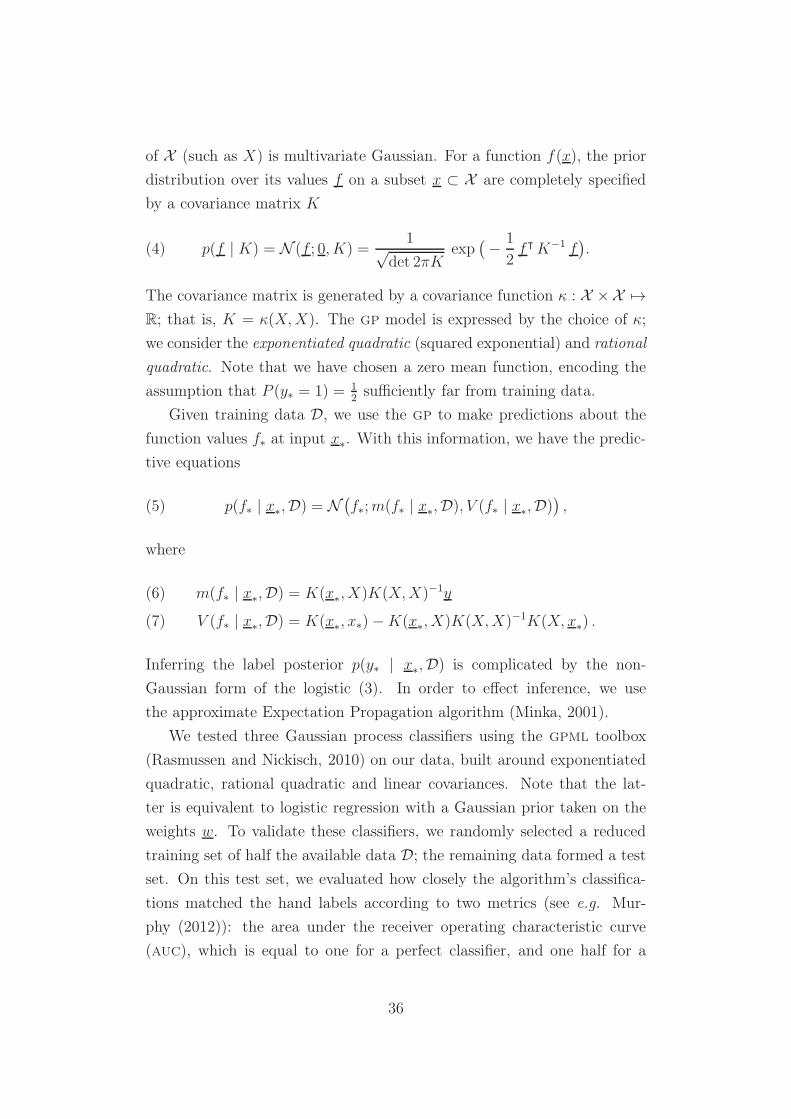
of X (such as X) is multivariate Gaussian. For a function f(x), the prior
distribution over its values f on a subset x ⊂ X are completely specified
by a covariance matrix K
p(f | K) = N (f ; 0, K) =1√
det 2πKexp
(
− 1
2f⊺ K−1 f
)
.(4)
The covariance matrix is generated by a covariance function κ : X ×X 7→R; that is, K = κ(X,X). The gp model is expressed by the choice of κ;
we consider the exponentiated quadratic (squared exponential) and rational
quadratic. Note that we have chosen a zero mean function, encoding the
assumption that P (y∗ = 1) = 1
2sufficiently far from training data.
Given training data D, we use the gp to make predictions about the
function values f∗ at input x∗. With this information, we have the predic-
tive equations
p(f∗ | x∗,D) = N
(
f∗;m(f∗ | x∗,D), V (f∗ | x∗
,D))
,(5)
where
m(f∗ | x∗,D) = K(x
∗, X)K(X,X)−1y(6)
V (f∗ | x∗,D) = K(x
∗, x∗)−K(x
∗, X)K(X,X)−1K(X, x
∗) .(7)
Inferring the label posterior p(y∗ | x∗,D) is complicated by the non-
Gaussian form of the logistic (3). In order to effect inference, we use
the approximate Expectation Propagation algorithm (Minka, 2001).
We tested three Gaussian process classifiers using the gpml toolbox
(Rasmussen and Nickisch, 2010) on our data, built around exponentiated
quadratic, rational quadratic and linear covariances. Note that the lat-
ter is equivalent to logistic regression with a Gaussian prior taken on the
weights w. To validate these classifiers, we randomly selected a reduced
training set of half the available data D; the remaining data formed a test
set. On this test set, we evaluated how closely the algorithm’s classifica-
tions matched the hand labels according to two metrics (see e.g. Mur-
phy (2012)): the area under the receiver operating characteristic curve
(auc), which is equal to one for a perfect classifier, and one half for a
36
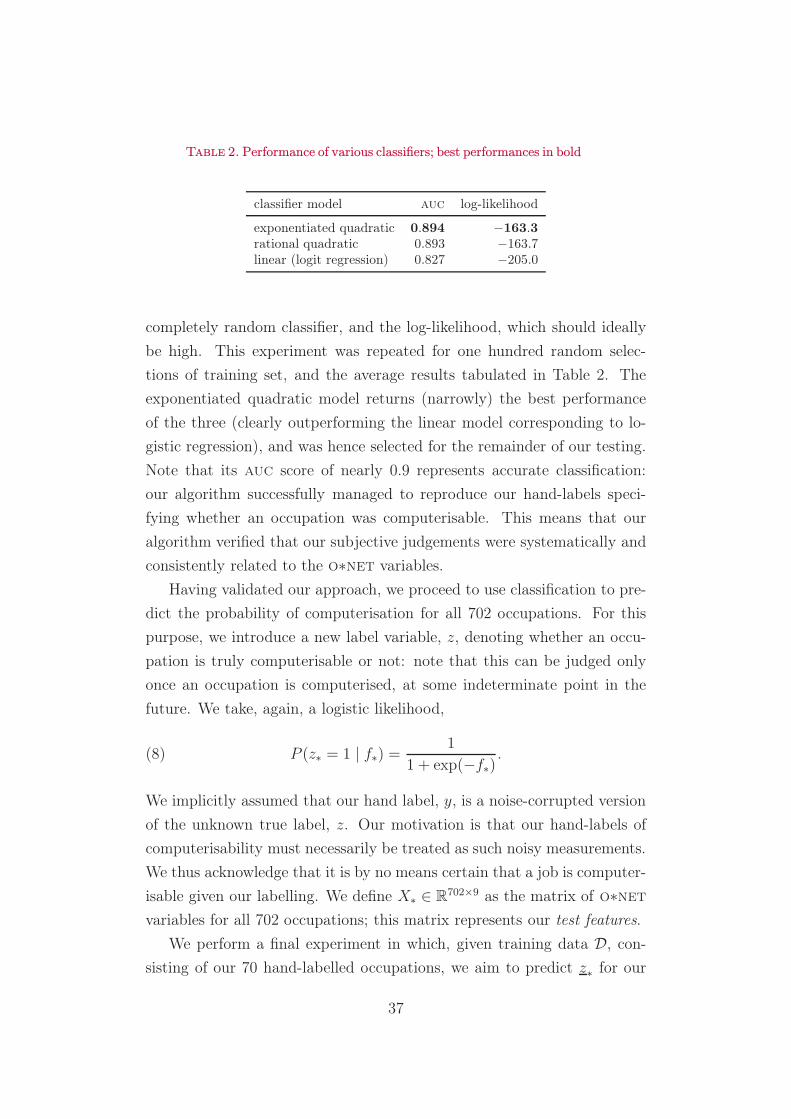
Table 2. Performance of various classifiers; best performances in bold
classifier model auc log-likelihood
exponentiated quadratic 0.894 −163.3rational quadratic 0.893 −163.7linear (logit regression) 0.827 −205.0
completely random classifier, and the log-likelihood, which should ideally
be high. This experiment was repeated for one hundred random selec-
tions of training set, and the average results tabulated in Table 2. The
exponentiated quadratic model returns (narrowly) the best performance
of the three (clearly outperforming the linear model corresponding to lo-
gistic regression), and was hence selected for the remainder of our testing.
Note that its auc score of nearly 0.9 represents accurate classification:
our algorithm successfully managed to reproduce our hand-labels speci-
fying whether an occupation was computerisable. This means that our
algorithm verified that our subjective judgements were systematically and
consistently related to the o∗net variables.
Having validated our approach, we proceed to use classification to pre-
dict the probability of computerisation for all 702 occupations. For this
purpose, we introduce a new label variable, z, denoting whether an occu-
pation is truly computerisable or not: note that this can be judged only
once an occupation is computerised, at some indeterminate point in the
future. We take, again, a logistic likelihood,
(8) P (z∗ = 1 | f∗) =1
1 + exp(−f∗).
We implicitly assumed that our hand label, y, is a noise-corrupted version
of the unknown true label, z. Our motivation is that our hand-labels of
computerisability must necessarily be treated as such noisy measurements.
We thus acknowledge that it is by no means certain that a job is computer-
isable given our labelling. We define X∗ ∈ R702×9 as the matrix of o∗net
variables for all 702 occupations; this matrix represents our test features.
We perform a final experiment in which, given training data D, con-
sisting of our 70 hand-labelled occupations, we aim to predict z∗
for our
37
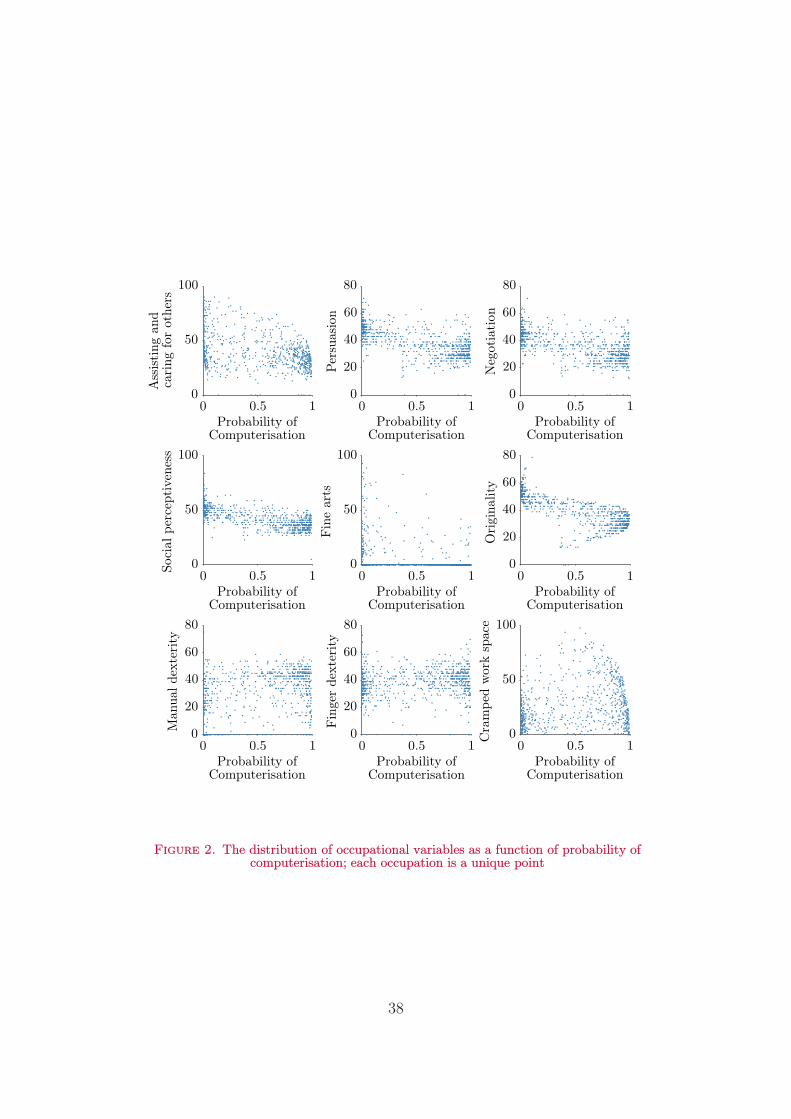
Probability ofComputerisation
Cra
mped
wor
ksp
ace
Probability ofComputerisation
Fin
ger
dext
erity
Probability ofComputerisation
Man
ualde
xter
ity
Probability ofComputerisation
Ori
gina
lity
Probability ofComputerisation
Fin
ear
ts
Probability ofComputerisation
Soci
alper
cept
iven
ess
Probability ofComputerisation
Neg
otia
tion
Probability ofComputerisation
Per
suas
ion
Probability ofComputerisation
Ass
isting
and
cari
ngfo
rot
hers
0 0.5 10 0.5 10 0.5 1
0 0.5 10 0.5 10 0.5 1
0 0.5 10 0.5 10 0.5 1
0
50
100
0
20
40
60
80
0
20
40
60
80
0
20
40
60
80
0
50
100
0
50
100
0
20
40
60
80
0
20
40
60
80
0
50
100
Figure 2. The distribution of occupational variables as a function of probability of computerisation; each occupation is a unique point
38
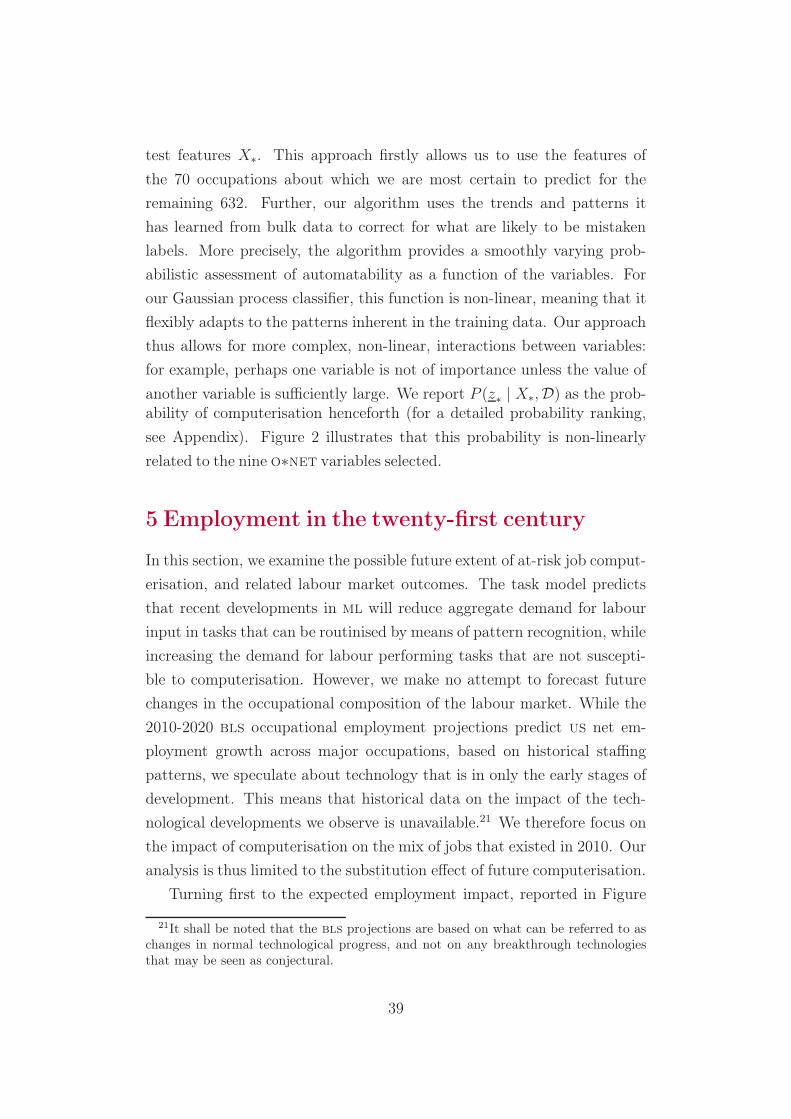
test features X∗. This approach firstly allows us to use the features of the 70 occupations about which we are most certain to predict for the remaining 632. Further, our algorithm uses the trends and patterns it has learned from bulk data to correct for what are likely to be mistaken labels. More precisely, the algorithm provides a smoothly varying prob-
abilistic assessment of automatability as a function of the variables. For our Gaussian process classifier, this function is non-linear, meaning that it flexibly adapts to the patterns inherent in the training data. Our approach thus allows for more complex, non-linear, interactions between variables: for example, perhaps one variable is not of importance unless the value of
another variable is sufficiently large. We report P (z∗ | X∗, D) as the prob-
ability of computerisation henceforth (for a detailed probability ranking,
see Appendix). Figure 2 illustrates that this probability is non-linearly
related to the nine o∗net variables selected.
5 Employment in the twenty-first century
In this section, we examine the possible future extent of at-risk job comput-
erisation, and related labour market outcomes. The task model predicts that recent developments in ml will reduce aggregate demand for labour input in tasks that can be routinised by means of pattern recognition, while increasing the demand for labour performing tasks that are not suscepti-
ble to computerisation. However, we make no attempt to forecast future changes in the occupational composition of the labour market. While the 2010-2020 bls occupational employment projections predict us net em-
ployment growth across major occupations, based on historical staffing patterns, we speculate about technology that is in only the early stages of development. This means that historical data on the impact of the tech-
nological developments we observe is unavailable.21 We therefore focus on the impact of computerisation on the mix of jobs that existed in 2010. Our analysis is thus limited to the substitution effect of future computerisation.
Turning first to the expected employment impact, reported in Figure
21It shall be noted that the bls projections are based on what can be referred to aschanges in normal technological progress, and not on any breakthrough technologiesthat may be seen as conjectural.
39
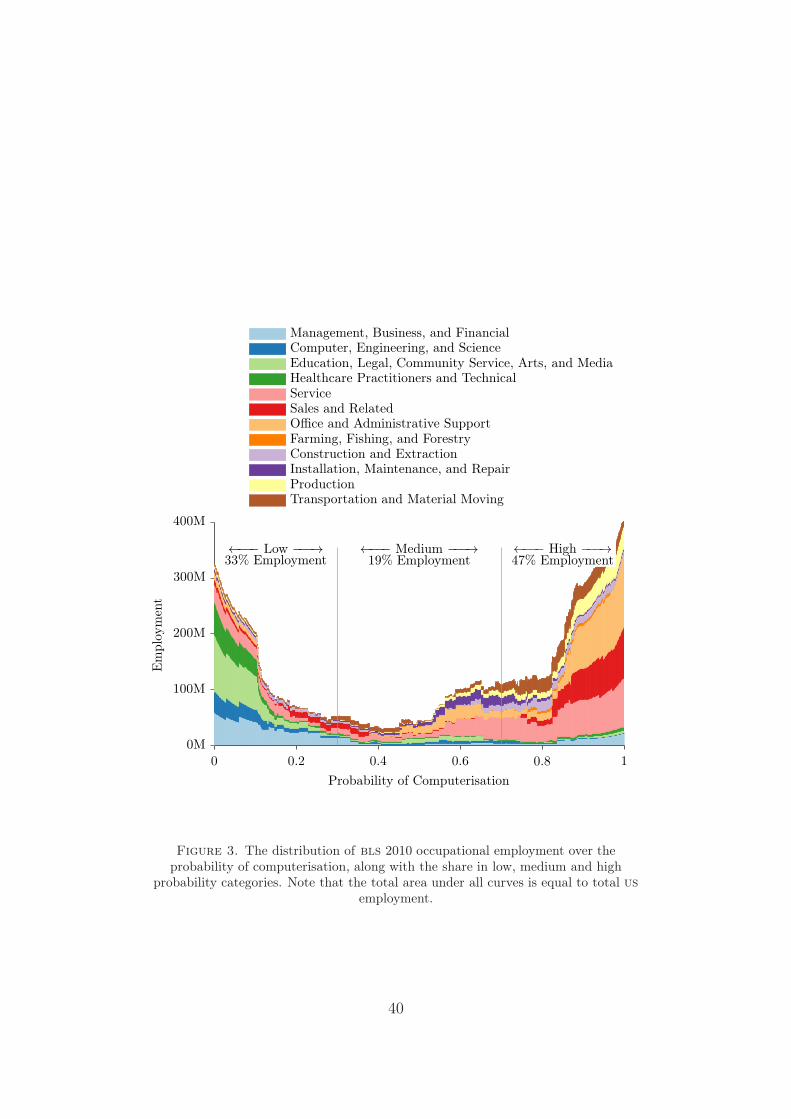
Transportation and Material MovingProductionInstallation, Maintenance, and RepairConstruction and ExtractionFarming, Fishing, and ForestryOffice and Administrative SupportSales and RelatedServiceHealthcare Practitioners and TechnicalEducation, Legal, Community Service, Arts, and MediaComputer, Engineering, and ScienceManagement, Business, and Financial
Em
ploy
men
t
Probability of Computerisation
47% Employment←−−− High −−−→
19% Employment←−−− Medium −−−→
33% Employment←−−− Low −−−→
0 0.2 0.4 0.6 0.8 1
0M
100M
200M
300M
400M
Figure 3. The distribution of bls 2010 occupational employment over theprobability of computerisation, along with the share in low, medium and high
probability categories. Note that the total area under all curves is equal to total us
employment.
40
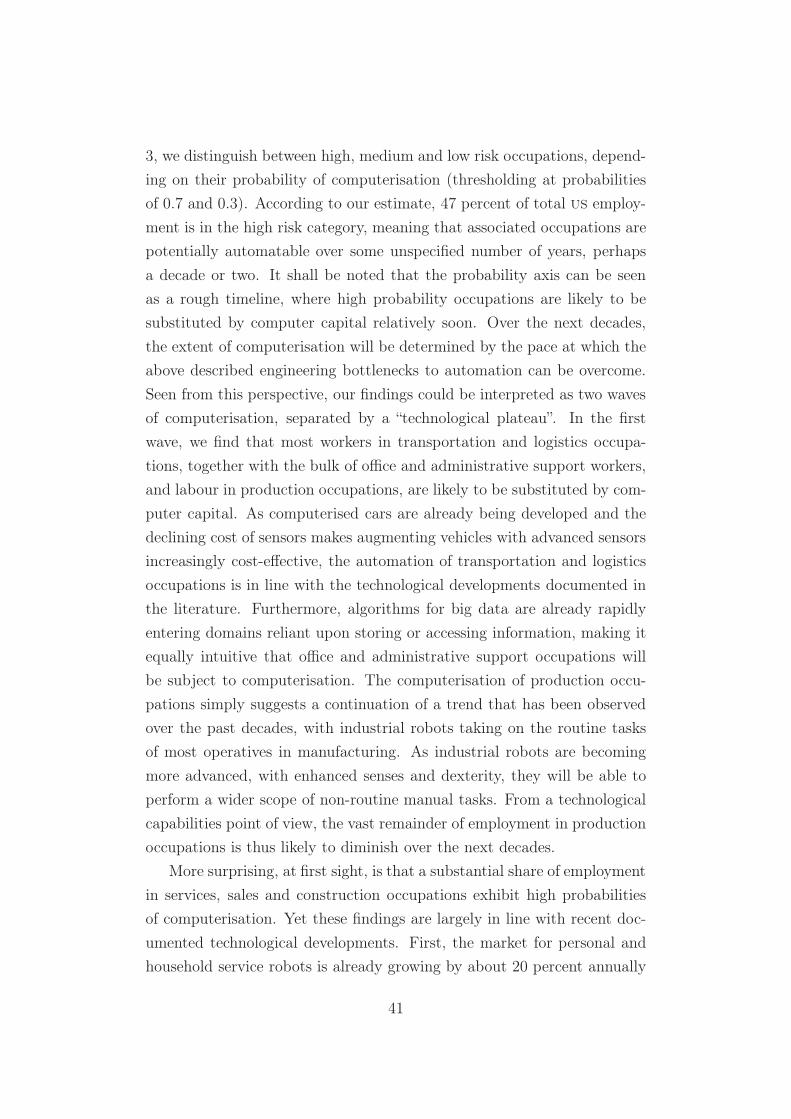
3, we distinguish between high, medium and low risk occupations, depend-
ing on their probability of computerisation (thresholding at probabilities
of 0.7 and 0.3). According to our estimate, 47 percent of total us employ-
ment is in the high risk category, meaning that associated occupations are
potentially automatable over some unspecified number of years, perhaps
a decade or two. It shall be noted that the probability axis can be seen
as a rough timeline, where high probability occupations are likely to be
substituted by computer capital relatively soon. Over the next decades,
the extent of computerisation will be determined by the pace at which the
above described engineering bottlenecks to automation can be overcome.
Seen from this perspective, our findings could be interpreted as two waves
of computerisation, separated by a “technological plateau”. In the first
wave, we find that most workers in transportation and logistics occupa-
tions, together with the bulk of office and administrative support workers,
and labour in production occupations, are likely to be substituted by com-
puter capital. As computerised cars are already being developed and the
declining cost of sensors makes augmenting vehicles with advanced sensors
increasingly cost-effective, the automation of transportation and logistics
occupations is in line with the technological developments documented in
the literature. Furthermore, algorithms for big data are already rapidly
entering domains reliant upon storing or accessing information, making it
equally intuitive that office and administrative support occupations will
be subject to computerisation. The computerisation of production occu-
pations simply suggests a continuation of a trend that has been observed
over the past decades, with industrial robots taking on the routine tasks
of most operatives in manufacturing. As industrial robots are becoming
more advanced, with enhanced senses and dexterity, they will be able to
perform a wider scope of non-routine manual tasks. From a technological
capabilities point of view, the vast remainder of employment in production
occupations is thus likely to diminish over the next decades.
More surprising, at first sight, is that a substantial share of employment
in services, sales and construction occupations exhibit high probabilities
of computerisation. Yet these findings are largely in line with recent doc-
umented technological developments. First, the market for personal and
household service robots is already growing by about 20 percent annually
41
(MGI, 2013). As the comparative advantage of human labour in tasks in-
volving mobility and dexterity will diminish over time, the pace of labour
substitution in service occupations is likely to increase even further. Sec-
ond, while it seems counterintuitive that sales occupations, which are likely
to require a high degree of social intelligence, will be subject to a wave of
computerisation in the near future, high risk sales occupations include, for
example, cashiers, counter and rental clerks, and telemarketers. Although
these occupations involve interactive tasks, they do not necessarily require
a high degree of social intelligence. Our model thus seems to do well in dis-
tinguishing between individual occupations within occupational categories.
Third, prefabrication will allow a growing share of construction work to
be performed under controlled conditions in factories, which partly elimi-
nates task variability. This trend is likely to drive the computerisation of
construction work.
In short, our findings suggest that recent developments in ml will put
a substantial share of employment, across a wide range of occupations, at
risk in the near future. According to our estimates, however, this wave of
automation will be followed by a subsequent slowdown in computers for
labour substitution, due to persisting inhibiting engineering bottlenecks to
computerisation. The relatively slow pace of computerisation across the
medium risk category of employment can thus partly be interpreted as a
technological plateau, with incremental technological improvements suc-
cessively enabling further labour substitution. More specifically, the com-
puterisation of occupations in the medium risk category will mainly depend
on perception and manipulation challenges. This is evident from Table
III, showing that the “manual dexterity”, “finger dexterity” and “cramped
work space” variables exhibit relatively high values in the medium risk
category. Indeed, even with recent technological developments, allowing
for more sophisticated pattern recognition, human labour will still have
a comparative advantage in tasks requiring more complex perception and
manipulation. Yet with incremental technological improvements, the com-
parative advantage of human labour in perception and manipulation tasks
could eventually diminish. This will require innovative task restructuring,
improvements in ml approaches to perception challenges, and progress in
robotic dexterity to overcome manipulation problems related to variation
42
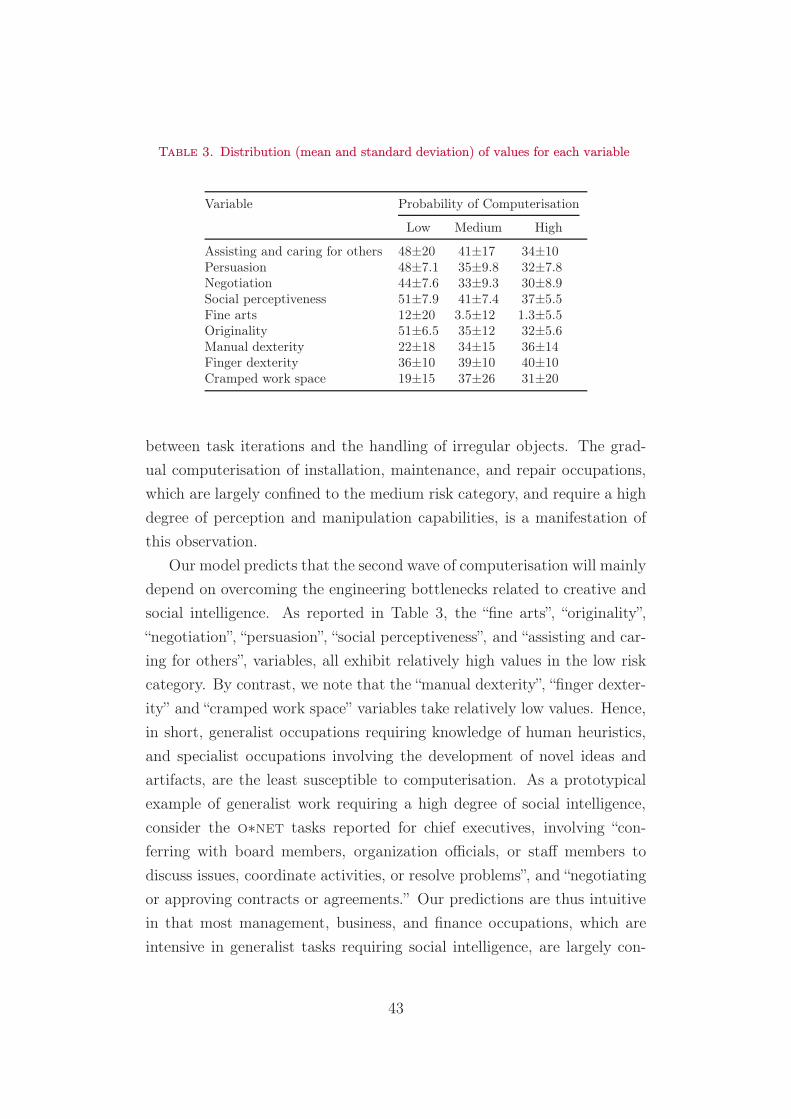
Table 3. Distribution (mean and standard deviation) of values for each variable
Variable Probability of Computerisation
Low Medium High
Assisting and caring for others 48±20 41±17 34±10Persuasion 48±7.1 35±9.8 32±7.8Negotiation 44±7.6 33±9.3 30±8.9Social perceptiveness 51±7.9 41±7.4 37±5.5Fine arts 12±20 3.5±12 1.3±5.5Originality 51±6.5 35±12 32±5.6Manual dexterity 22±18 34±15 36±14Finger dexterity 36±10 39±10 40±10Cramped work space 19±15 37±26 31±20
between task iterations and the handling of irregular objects. The grad-
ual computerisation of installation, maintenance, and repair occupations,
which are largely confined to the medium risk category, and require a high
degree of perception and manipulation capabilities, is a manifestation of
this observation.
Our model predicts that the second wave of computerisation will mainly
depend on overcoming the engineering bottlenecks related to creative and
social intelligence. As reported in Table 3, the “fine arts”, “originality”,
“negotiation”, “persuasion”, “social perceptiveness”, and “assisting and car-
ing for others”, variables, all exhibit relatively high values in the low risk
category. By contrast, we note that the “manual dexterity”, “finger dexter-
ity” and “cramped work space” variables take relatively low values. Hence,
in short, generalist occupations requiring knowledge of human heuristics,
and specialist occupations involving the development of novel ideas and
artifacts, are the least susceptible to computerisation. As a prototypical
example of generalist work requiring a high degree of social intelligence,
consider the o∗net tasks reported for chief executives, involving “con-
ferring with board members, organization officials, or staff members to
discuss issues, coordinate activities, or resolve problems”, and “negotiating
or approving contracts or agreements.” Our predictions are thus intuitive
in that most management, business, and finance occupations, which are
intensive in generalist tasks requiring social intelligence, are largely con-
43
fined to the low risk category. The same is true of most occupations in
education, healthcare, as well as arts and media jobs. The o∗net tasks
of actors, for example, involve “performing humorous and serious interpre-
tations of emotions, actions, and situations, using body movements, facial
expressions, and gestures”, and “learning about characters in scripts and
their relationships to each other in order to develop role interpretations.”
While these tasks are very different from those of a chief executive, they
equally require profound knowledge of human heuristics, implying that a
wide range of tasks, involving social intelligence, are unlikely to become
subject to computerisation in the near future.
The low susceptibility of engineering and science occupations to com-
puterisation, on the other hand, is largely due to the high degree of creative
intelligence they require. The o∗net tasks of mathematicians, for ex-
ample, involve “developing new principles and new relationships between
existing mathematical principles to advance mathematical science” and
“conducting research to extend mathematical knowledge in traditional ar-
eas, such as algebra, geometry, probability, and logic.” Hence, while it is
evident that computers are entering the domains of science and engineer-
ing, our predictions implicitly suggest strong complementarities between
computers and labour in creative science and engineering occupations; al-
though it is possible that computers will fully substitute for workers in
these occupations over the long-run. We note that the predictions of our
model are strikingly in line with the technological trends we observe in the
automation of knowledge work, even within occupational categories. For
example, we find that paralegals and legal assistants – for which computers
already substitute – in the high risk category. At the same time, lawyers,
which rely on labour input from legal assistants, are in the low risk cat-
egory. Thus, for the work of lawyers to be fully automated, engineering
bottlenecks to creative and social intelligence will need to be overcome,
implying that the computerisation of legal research will complement the
work of lawyers in the medium term.
To complete the picture of what recent technological progress is likely
to mean for the future of employment, we plot the average median wage of
occupations by their probability of computerisation. We do the same for
skill level, measured by the fraction of workers having obtained a bachelor’s
44
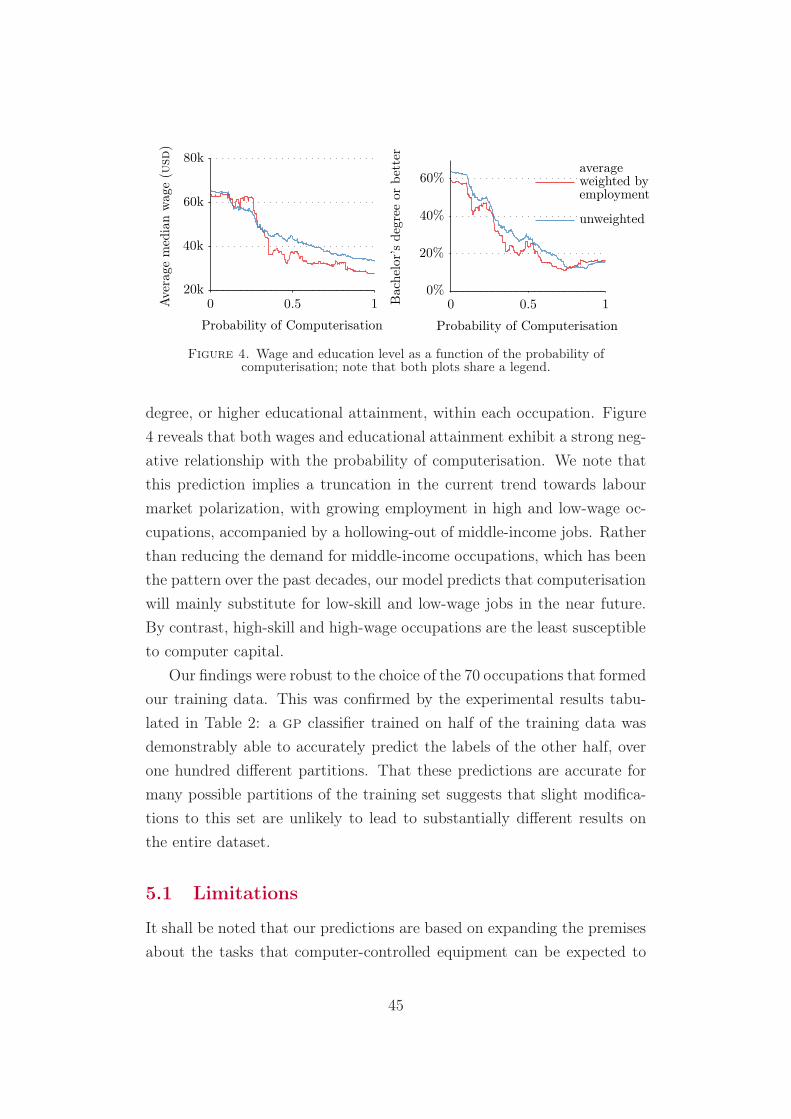
Ave
rage
med
ian
wag
e(u
sd)
Probability of Computerisation
0 0.5 1
20k
40k
60k
80k
unweighted
averageweighted byemployment
Bac
helo
r’s
degr
eeor
bet
ter
Probability of Computerisation
0 0.5 1
0%
20%
40%
60%
Figure 4. Wage and education level as a function of the probability of computerisation; note that both plots share a legend.
degree, or higher educational attainment, within each occupation. Figure 4 reveals that both wages and educational attainment exhibit a strong neg-
ative relationship with the probability of computerisation. We note that this prediction implies a truncation in the current trend towards labour market polarization, with growing employment in high and low-wage oc-
cupations, accompanied by a hollowing-out of middle-income jobs. Rather than reducing the demand for middle-income occupations, which has been the pattern over the past decades, our model predicts that computerisation will mainly substitute for low-skill and low-wage jobs in the near future. By contrast, high-skill and high-wage occupations are the least susceptible to computer capital.
Our findings were robust to the choice of the 70 occupations that formed our training data. This was confirmed by the experimental results tabu-
lated in Table 2: a gp classifier trained on half of the training data was demonstrably able to accurately predict the labels of the other half, over one hundred different partitions. That these predictions are accurate for many possible partitions of the training set suggests that slight modifica-
tions to this set are unlikely to lead to substantially different results on the entire dataset.
5.1 Limitations
It shall be noted that our predictions are based on expanding the premises about the tasks that computer-controlled equipment can be expected to
45
perform. Hence, we focus on estimating the share of employment that
can potentially be substituted by computer capital, from a technological
capabilities point of view, over some unspecified number of years. We make
no attempt to estimate how many jobs will actually be automated. The
actual extent and pace of computerisation will depend on several additional
factors which were left unaccounted for.
First, labour saving inventions may only be adopted if the access to
cheap labour is scarce or prices of capital are relatively high (Habakkuk,
1962).22 We do not account for future wage levels, capital prices or labour
shortages. While these factors will impact on the timeline of our predic-
tions, labour is the scarce factor, implying that in the long-run wage levels
will increase relative to capital prices, making computerisation increasingly
profitable (see, for example, Acemoglu, 2003).
Second, regulatory concerns and political activism may slow down the
process of computerisation. The states of California and Nevada are, for
example, currently in the process of making legislatory changes to allow
for driverless cars. Similar steps will be needed in other states, and in
relation to various technologies. The extent and pace of legislatory im-
plementation can furthermore be related to the public acceptance of tech-
nological progress.23 Although resistance to technological progress has
become seemingly less common since the Industrial Revolution, there are
recent examples of resistance to technological change.24 We avoid mak-
ing predictions about the legislatory process and the public acceptance of
22For example, case study evidence suggests that mechanisation in eighteenth centurycotton production initially only occurred in Britain because wage levels were muchhigher relative to prices of capital than in other countries (Allen, 2009b). In addition,recent empirical research reveals a causal relationship between the access to cheaplabour and mechanisation in agricultural production, in terms of sustained economictransition towards increased mechanisation in areas characterised by low-wage workerout-migration (Hornbeck and Naidu, 2013).
23For instance, William Huskisson, former cabinet minister and Member of Parlia-ment for Liverpool, was killed by a steam locomotive during the opening of the Liverpooland Manchester Railway. Nonetheless, this well-publicised incident did anything butdissuade the public from railway transportation technology. By contrast, airship tech-nology is widely recognised as having been popularly abandoned as a consequence ofthe reporting of the Hindenburg disaster.
24Uber, a start-up company connecting passengers with drivers of luxury vehicles, hasrecently faced pressure from from local regulators, arising from tensions with taxicabservices. Furthermore, in 2011 the uk Government scrapped a 12.7 billion gbp projectto introduce electronic patient records after resistance from doctors.
46
technological progress, and thus the pace of computerisation.
Third, making predictions about technological progress is notoriously difficult (Armstrong and Sotala, 2012).25 For this reason, we focus on near-
term technological breakthroughs in ml and mr, and avoid making any predictions about the number of years it may take to overcome various engineering bottlenecks to computerisation. Finally, we emphasise that since our probability estimates describe the likelihood of an occupation being fully automated, we do not capture any within-occupation variation resulting from the computerisation of tasks that simply free-up time for human labour to perform other tasks. Although it is clear that the im-
pact of productivity gains on employment will vary across occupations and industries, we make no attempt to examine such effects.
6 Conclusions
While computerisation has been historically confined to routine tasks in-
volving explicit rule-based activities (Autor, et al., 2003; Goos, et al., 2009; Autor and Dorn, 2013), algorithms for big data are now rapidly entering domains reliant upon pattern recognition and can readily substitute for labour in a wide range of non-routine cognitive tasks (Brynjolfsson and McAfee, 2011; MGI, 2013). In addition, advanced robots are gaining en-
hanced senses and dexterity, allowing them to perform a broader scope of manual tasks (IFR, 2012b; Robotics-VO, 2013; MGI, 2013). This is likely to change the nature of work across industries and occupations.
In this paper, we ask the question: how susceptible are current jobs to these technological developments? To assess this, we implement a novel methodology to estimate the probability of computerisation for 702 de-
tailed occupations. Based on these estimates, we examine expected im-
pacts of future computerisation on labour market outcomes, with the pri-
mary objective of analysing the number of jobs at risk and the relationship between an occupation’s probability of computerisation, wages and educa-
tional attainment.
25Marvin Minsky famously claimed in 1970 that “in from three to eight years wewill have a machine with the general intelligence of an average human being”. Thisprediction is yet to materialise.
47
We distinguish between high, medium and low risk occupations, de-
pending on their probability of computerisation. We make no attempt to
estimate the number of jobs that will actually be automated, and focus
on potential job automatability over some unspecified number of years.
According to our estimates around 47 percent of total us employment is
in the high risk category. We refer to these as jobs at risk – i.e. jobs we
expect could be automated relatively soon, perhaps over the next decade
or two.
Our model predicts that most workers in transportation and logistics
occupations, together with the bulk of office and administrative support
workers, and labour in production occupations, are at risk. These find-
ings are consistent with recent technological developments documented in
the literature. More surprisingly, we find that a substantial share of em-
ployment in service occupations, where most us job growth has occurred
over the past decades (Autor and Dorn, 2013), are highly susceptible to
computerisation. Additional support for this finding is provided by the
recent growth in the market for service robots (MGI, 2013) and the gradu-
ally diminishment of the comparative advantage of human labour in tasks
involving mobility and dexterity (Robotics-VO, 2013).
Finally, we provide evidence that wages and educational attainment
exhibit a strong negative relationship with the probability of computer-
isation. We note that this finding implies a discontinuity between the
nineteenth, twentieth and the twenty-first century, in the impact of capi-
tal deepening on the relative demand for skilled labour. While nineteenth
century manufacturing technologies largely substituted for skilled labour
through the simplification of tasks (Braverman, 1974; Hounshell, 1985;
James and Skinner, 1985; Goldin and Katz, 1998), the Computer Revo-
lution of the twentieth century caused a hollowing-out of middle-income
jobs (Goos, et al., 2009; Autor and Dorn, 2013). Our model predicts a
truncation in the current trend towards labour market polarisation, with
computerisation being principally confined to low-skill and low-wage occu-
pations. Our findings thus imply that as technology races ahead, low-skill
workers will reallocate to tasks that are non-susceptible to computerisation
– i.e., tasks requiring creative and social intelligence. For workers to win
the race, however, they will have to acquire creative and social skills.
48

References
Acemoglu, D. (2002). Technical change, inequality, and the labor market.
Journal of Economic Literature, vol. 40, no. 1, pp. 7–72.
Acemoglu, D. (2003). Labor- and capital-augmenting technical change.
Journal of the European Economic Association, vol. 1, no. 1, pp. 1–37.
Acemoglu, D. and Autor, D. (2011). Skills, tasks and technologies: Im-
plications for employment and earnings. Handbook of labor economics,
vol. 4, pp. 1043–1171.
Acemoglu, D. and Robinson, J. (2012). Why nations fail: the origins of
power, prosperity, and poverty. Random House Digital, Inc.
Ackerman, E. and Guizzo, E. (2011). 5 technologies that will shape the
web. Spectrum, ieee, vol. 48, no. 6, pp. 40–45.
Aghion, P. and Howitt, P. (1994). Growth and unemployment. The Review
of Economic Studies, vol. 61, no. 3, pp. 477–494.
Allen, R.C. (2009a). Engels’ pause: Technical change, capital accumula-
tion, and inequality in the british industrial revolution. Explorations in
Economic History, vol. 46, no. 4, pp. 418–435.
Allen, R.C. (2009b). The industrial revolution in miniature: The spinning
jenny in Britain, France, and India. The Journal of Economic History,
vol. 69, no. 04, pp. 901–927.
Allen, S.G. (2001). Technology and the wage structure. Journal of Labor
Economics, vol. 19, no. 2, pp. 440–483.
Armstrong, S. and Sotala, K. (2012). How we’re predicting ai – or failing
to. Tech. Rep., Oxford: Future of Humanity Institute, Oxford Univer-
sity.
Atack, J., Bateman, F. and Margo, R.A. (2004). Skill intensity and rising
wage dispersion in nineteenth-century American manufacturing. The
Journal of Economic History, vol. 64, no. 01, pp. 172–192.
49
Atack, J., Bateman, F. and Margo, R.A. (2008a). Steam power, establish-
ment size, and labor productivity growth in nineteenth century Amer-
ican manufacturing. Explorations in Economic History, vol. 45, no. 2,
pp. 185–198.
Atack, J., Haines, M.R. and Margo, R.A. (2008b). Railroads and the rise of
the factory: Evidence for the united states, 1850-70. Tech. Rep., nber
Working Paper No. 14410, National Bureau of Economic Research.
Atkinson, A.B. (2008). The changing distribution of earnings in OECD
countries. Oxford University Press.
Autor, D. and Dorn, D. (2013). The growth of low skill service jobs and
the polarization of the us labor market. American Economic Review,
vol. forthcoming.
Autor, D., Katz, L.F. and Krueger, A.B. (1998). Computing inequality:
have computers changed the labor market? The Quarterly Journal of
Economics, vol. 113, no. 4, pp. 1169–1213.
Autor, D., Levy, F. and Murnane, R.J. (2003). The skill content of recent
technological change: An empirical exploration. The Quarterly Journal
of Economics, vol. 118, no. 4, pp. 1279–1333.
Barlow, J. and Ozaki, R. (2005). Building mass customised housing
through innovation in the production system: lessons from Japan. En-
vironment and Planning A, vol. 37, no. 1, pp. 9–20.
Beaudry, P., Green, D.A. and Sand, B.M. (2013). The great reversal in the
demand for skill and cognitive tasks. Tech. Rep., nber Working Paper
No. 18901, National Bureau of Economic Research.
Beniger, J.R. (1986). The control revolution: Technological and economic
origins of the information society. Harvard University Press.
Blinder, A.S. (2009). How many us jobs might be offshorable? World
Economics, vol. 10, no. 2, p. 41.
50
Blinder, A.S. and Krueger, A.B. (2013). Alternative measures of offshora-
bility: a survey approach. Journal of Labor Economics, vol. 31, no. 2,
pp. S97–S128.
Bloss, R. (2011). Mobile hospital robots cure numerous logistic needs.
Industrial Robot: An International Journal, vol. 38, no. 6, pp. 567–571.
Boden, M.A. (2003). The creative mind: Myths and mechanisms. Rout-
ledge.
Braverman, H. (1974). Labor and monopoly capital: The degradation of
work in the twentieth century. NYU Press.
Breslow, L., Pritchard, D.E., DeBoer, J., Stump, G.S., Ho, A.D. and
Seaton, D. (2013). Studying learning in the worldwide classroom: Re-
search into edx’s first mooc. Research & Practice in Assessment, vol. 8,
pp. 13–25.
Bresnahan, T.F. (1999). Computerisation and wage dispersion: an ana-
lytical reinterpretation. The Economic Journal, vol. 109, no. 456, pp.
390–415.
Bresnahan, T.F., Brynjolfsson, E. and Hitt, L.M. (2002). Information
technology, workplace organization, and the demand for skilled labor:
Firm-level evidence. The Quarterly Journal of Economics, vol. 117,
no. 1, pp. 339–376.
Bright, J.R. (1958). Automation and management. Division of Re-
search, Graduate School of Business Administration, Harvard University
Boston.
Broekens, J., Heerink, M. and Rosendal, H. (2009). Assistive social robots
in elderly care: a review. Gerontechnology, vol. 8, no. 2, pp. 94–103.
Brown, E., Rodenberg, N., Amend, J., Mozeika, A., Steltz, E., Zakin,
M.R., Lipson, H. and Jaeger, H.M. (2010). Universal robotic gripper
based on the jamming of granular material. Proceedings of the National
Academy of Sciences, vol. 107, no. 44, pp. 18809–18814.
51
Brown, M. and Philips, P. (1986). Craft labor and mechanization in
nineteenth-century American canning. The Journal of Economic His-
tory, vol. 46, no. 3, pp. 743–56.
Brynjolfsson, E. and McAfee, A. (2011). Race against the machine: How
the digital revolution is accelerating innovation, driving productivity, and
irreversibly transforming employment and the economy. Digital Frontier
Press Lexington, ma.
Campbell-Kelly, M. (2009). Origin of computing. Scientific American
Magazine, vol. 301, no. 3, pp. 62–69.
Chandler, A.D. (1977). The visible hand: The managerial revolution in
American business. Harvard University Press.
Charles, K.K., Hurst, E. and Notowidigdo, M.J. (2013). Manufacturing de-
cline, housing booms, and non-employment. Tech. Rep., nber Working
Paper No. 18949, National Bureau of Economic Research.
Churchill, W. and Newman, P. (2012). Practice makes perfect? managing
and leveraging visual experiences for lifelong navigation. In: Robotics
and Automation ( icra), 2012 ieee International Conference on, pp.
4525–4532. ieee.
Cisco (2012). Cisco visual networking index. http://www.cisco.com/en/
\us/netsol/ns827/networking_solutions_sub_solution.html.
Clark, G. (2008). A farewell to alms: a brief economic history of the world.
Princeton University Press.
Clifford, G.D. and Clifton, D. (2012). Wireless technology in disease man-
agement and medicine. Annual Review of Medicine, vol. 63, pp. 479–492.
Clifton, L., Clifton, D., Pimentel, M., Watkinson, P. and Tarassenko, L.
(2012). Gaussian processes for personalised e-health monitoring with
wearable sensors. ieee Transactions on Biomedical Engineering, vol. 60,
pp. 193–197.
Cohn, J. (2013 February 20). The robot will see you now. The Atlantic.
52
Cortada, J.W. (2000). Before the Computer: ibm, ncr, Burroughs, and
Remington Rand and the Industry They Created, 1865-1956. Princeton
University Press.
Danziger, S., Levav, J. and Avnaim-Pesso, L. (2011). Extraneous factors
in judicial decisions. Proceedings of the National Academy of Sciences,
vol. 108, no. 17, pp. 6889–6892.
Davis, S.J. and Haltiwanger, J. (1992). Gross job creation, gross job de-
struction, and employment reallocation. The Quarterly Journal of Eco-
nomics, vol. 107, no. 3, pp. 819–863.
Duvenaud, D., Lloyd, J.R., Grosse, R., Tenenbaum, J.B. and Ghahramani,
Z. (2013). Structure discovery in nonparametric regression through com-
positional kernel search. In: Proceedings of the 30th International Con-
ference on Machine Learning, arXiv:1206.1846 [stat.ML]. Cambridge,
UK.
Epstein, S.R. (1998). Craft guilds, apprenticeship, and technological
change in preindustrial europe. Journal of Economic History, vol. 58,
pp. 684–713.
Feinstein, C.H. (1998). Pessimism perpetuated: real wages and the stan-
dard of living in Britain during and after the industrial revolution. The
Journal of Economic History, vol. 58, pp. 625–658.
Ge, S.S. (2007). Social robotics: Integrating advances in engineering and
computer science. In: The 4th annual international conference orga-
nized by Electrical Engineering/Electronics, Computer, Telecommunica-
tion and Information Technology (ecti) Association, Chiang Rai, Thai-
land, May 9â, vol. 12, p. 2007.
Goldin, C. and Katz, L.F. (1995). The decline of non-competing groups:
Changes in the premium to education, 1890 to 1940. Tech. Rep., nber
Working Paper No. 5202, National Bureau of Economic Research.
Goldin, C. and Katz, L.F. (1998). The origins of technology-skill com-
plementarity. The Quarterly Journal of Economics, vol. 113, no. 3, pp.
693–732.
53
Goldin, C. and Katz, L.F. (2009). The race between education and tech-
nology. Harvard University Press.
Goldin, C. and Sokoloff, K. (1982). Women, children, and industrialization
in the early republic: Evidence from the manufacturing censuses. The
Journal of Economic History, vol. 42, no. 4, pp. 741–774.
Goos, M. and Manning, A. (2007). Lousy and lovely jobs: The rising
polarization of work in Britain. The Review of Economics and Statistics,
vol. 89, no. 1, pp. 118–133.
Goos, M., Manning, A. and Salomons, A. (2009). Job polarization in
europe. The American Economic Review, vol. 99, no. 2, pp. 58–63.
Gordon, R.J. (2012). Is us economic growth over? faltering innovation
confronts the six headwinds. Tech. Rep., nber Working Paper No.
18315, National Bureau of Economic Research.
Gray, R. (2013). Taking technology to task: The skill content of techno-
logical change in early twentieth century united states. Explorations in
Economic History.
Guizzo, E. (2008 July 2). Three engineers, hundreds of robots,
one warehouse. ieee Spectrum. http://spectrum.ieee.org/robotics/
robotics-software/three-engineers-hundreds-of-robots-one-warehouse.
Guizzo, E. (2011 October 18). How google’s self-driving car works. ieee
Spectrum Online.
Habakkuk, H.J. (1962). American and British technology in the nineteenth
century: The search for labour-saving inventions. University Press.
Hangal, S. and Lam, M.S. (2002). Tracking down software bugs using
automatic anomaly detection. In: Proceedings of the 24th international
conference on Software engineering, pp. 291–301. acm.
Hanson, R. (2001). Economic growth given machine intelligence. Technical
Report, University of California, Berkeley.
54
Hoos, H.H. (2012). Programming by optimization. Communications of the
acm, vol. 55, no. 2, pp. 70–80.
Hornbeck, R. and Naidu, S. (2013). When the levee breaks: Labor mo-
bility and economic development in the American south. The American
Economic Review, vol. forthcoming.
Hounshell, D. (1985). From the American system to mass production,
1800-1932: The development of manufacturing technology in the United
States, vol. 4. jhu Press.
Jaimovich, N. and Siu, H.E. (2012). The trend is the cycle: Job polariza-
tion and jobless recoveries. Tech. Rep., nber Working Paper No. 18334,
National Bureau of Economic Research.
James, J.A. and Skinner, J.S. (1985). The resolution of the labor-scarcity
paradox. The Journal of Economic History, vol. 45, no. 3, pp. 513–540.
Jensen, J.B. and Kletzer, L.G. (2005). Tradable services: Understanding
the scope and impact of services offshoring [with comments and discus-
sion]. In: Brookings trade forum, pp. 75–133. jstor.
Jensen, J.B. and Kletzer, L.G. (2010). Measuring tradable services and the
task content of offshorable services jobs. In: Labor in the new economy,
pp. 309–335. University of Chicago Press.
Kahneman, D., Slovic, P. and Tversky, A. (1982). Judgment under uncer-
tainty. Cambridge University Press.
Katz, L.F. and Margo, R.A. (2013). Technical change and the relative
demand for skilled labor: The united states in historical perspective.
Tech. Rep., nber Working Paper No. 18752, National Bureau of Eco-
nomic Research.
Katz, L.F. and Murphy, K.M. (1992). Changes in relative wages, 1963–
1987: supply and demand factors. The Quarterly Journal of Economics,
vol. 107, no. 1, pp. 35–78.
55
Kellenbenz, H. (1974). Technology in the age of the scientific revolution,
1500-1700. The Fontana Economic History of Europe, vol. 2, pp. 177–
272.
Keynes, J.M. (1933). Economic possibilities for our grandchildren (1930).
Essays in persuasion, pp. 358–73.
Kim, S., Whitehead, E.J. and Zhang, Y. (2008). Classifying software
changes: Clean or buggy? Software Engineering, ieee Transactions on,
vol. 34, no. 2, pp. 181–196.
King, S., Bannister, P., Clifton, D. and Tarassenko, L. (2009). Probabilistic
approach to the condition monitoring of aerospace engines. Proceedings
of the Institution of Mechanical Engineers, Part G: Journal of Aerospace
Engineering, vol. 223, no. 5, pp. 533–541.
Krueger, A.B. (1993). How computers have changed the wage structure:
evidence from microdata, 1984–1989. The Quarterly Journal of Eco-
nomics, vol. 108, no. 1, pp. 33–60.
Levy, F. and Murnane, R.J. (2004). The new division of labor: How com-
puters are creating the next job market. Princeton University Press.
Lindert, P.H. and Williamson, J.G. (1983). Reinterpreting Britain’s social
tables, 1688–1913. Explorations in Economic History, vol. 20, no. 1, pp.
94–109.
Linner, T. and Bock, T. (2012). Evolution of large-scale industrialisation
and service innovation in Japanese prefabrication industry. Construction
Innovation: Information, Process, Management, vol. 12, no. 2, pp. 156–
178.
Livshits, B. and Zimmermann, T. (2005). Dynamine: finding common
error patterns by mining software revision histories. In: acm sigsoft
Software Engineering Notes, vol. 30, pp. 296–305. acm.
Louis, P. and Paterson, G. (1986). Biased technical change, scale, and
factor substitution in American industry, 1850-1919. The Journal of
Economic History, vol. 46, no. 1.
56
Lucas, R.E. and Prescott, E.C. (1974). Equilibrium search and unemploy-
ment. Journal of Economic Theory, vol. 7, no. 2, pp. 188–209.
CAA (2012). Roadside assistance customers benefit from smart support
during peak and after hours. Tech. Rep., SmartAction case study of
Canadian Automobile Association Saskatchewan.
IFR (2012a). 68 robots perform farmer’s work. Tech. Rep., Case study
of Fanuc Robotics Europe S.A., International Federation of Robotics,
September 2012.
IFR (2012b August 30). World robotics 2012. Tech. Rep., International
Federation of Robotics.
MGI (2011). An economy that works: Job creation and America’s future.
Tech. Rep., McKinsey Global Institute.
MGI (2013). Disruptive technologies: Advances that will transform life,
business, and the global economy. Tech. Rep., McKinsey Global Insti-
tute.
Mantoux, P. (2006). The industrial revolution in the eighteenth century:
An outline of the beginnings of the modern factory system in England.
Taylor & Francis us.
Margo, R.A. (2000). Introduction to wages and labor markets in the United
States, 1820-1860. In: Wages and Labor Markets in the United States,
1820-1860, pp. 1–5. University of Chicago Press.
Markoff, J. (2011 March 4). Armies of expensive lawyers replaced by
cheaper software. The New York Times.
Markoff, J. (2012 August 18). Skilled work, without the worker. The New
York Times.
Mathibela, B., Osborne, M.A., Posner, I. and Newman, P. (2012). Can
priors be trusted? learning to anticipate roadworks. In: Intelligent
Transportation Systems (ITSC), 2012 15th International ieee Confer-
ence on, pp. 927–932. ieee.
57
Michaels, G., Rauch, F. and Redding, S.J. (2013). Task specialization in
us cities from 1880-2000. Tech. Rep., nber Working Paper No. 18715,
National Bureau of Economic Research.
Mims, C. (2010 June 10). ai that picks stocks better than the pros. mit
Technology Review.
Minka, T.P. (2001). Expectation propagation for approximate Bayesian
inference. In: Proceedings of the Seventeenth conference on Uncertainty
in artificial intelligence, pp. 362–369. Morgan Kaufmann Publishers Inc.
Mokyr, J. (1990). The lever of riches: Technological creativity and eco-
nomic progress. Oxford University Press.
Mokyr, J. (1998). The political economy of technological change. Techno-
logical revolutions in Europe, pp. 39–64.
Murphy, K.M., Riddell, W.C. and Romer, P.M. (1998). Wages, skills, and
technology in the united states and canada. Tech. Rep., nber Working
Paper No. 6638, National Bureau of Economic Research.
Murphy, K.P. (2012). Machine learning: a probabilistic perspective. The
mit Press.
Nef, J.U. (1957). Coal mining and utilization. A history of technology,
vol. 3, pp. 72–88.
Nordhaus, W.D. (2007). Two centuries of productivity growth in comput-
ing. The Journal of Economic History, vol. 67, no. 1, p. 128.
North, D.C. and Weingast, B.R. (1989). Constitutions and commitment:
the evolution of institutions governing public choice in seventeenth-
century england. The Journal of Economic History, vol. 49, no. 04,
pp. 803–832.
Ogilvie, S. (2004). Guilds, efficiency, and social capital: evidence from
German proto-industry. The Economic History Review, vol. 57, no. 2,
pp. 286–333.
58
Oldenski, L. (2012). Offshoring and the polarization of the us labor mar-
ket. Tech. Rep., Technical report, Mimeo, Georgetown University.
Osborne, M.A., Garnett, R., Swersky, K. and de Freitas, N. (2012). Predic-
tion and fault detection of environmental signals with uncharacterised
faults. In: Twenty-Sixth aaai Conference on Artificial Intelligence
(aaai-12).
Phua, C., Lee, V., Smith, K. and Gayler, R. (2010). A comprehensive
survey of data mining-based fraud detection research. arXiv preprint
arXiv:1009.6119.
Picard, R.W. (2010). Affective computing: from laughter to ieee. Affective
Computing, ieee Transactions on, vol. 1, no. 1, pp. 11–17.
Pissarides, C.A. (2000). Equilibrium unemployment theory. mit press.
Plötz, T. and Fink, G.A. (2009). Markov models for offline handwriting
recognition: a survey. International Journal on Document Analysis and
Recognition (IJDAR), vol. 12, no. 4, pp. 269–298.
Rasmussen, C.E. and Nickisch, H. (2010). Gaussian processes for machine
learning (gpml) toolbox. The Journal of Machine Learning Research,
vol. 11, pp. 3011–3015.
Rasmussen, C.E. and Williams, C.K.I. (2006). Gaussian Processes for
Machine Learning. mit Press.
Ricardo, D. (1819). The principles of political economy and taxation. World
Scientific.
Robotics-VO (2013). A Roadmap for us Robotics. From Internet to
Robotics. 2013 Edition. Robotics in the United States of America.
Roy, A.D. (1951). Some thoughts on the distribution of earnings. Oxford
Economic Papers, vol. 3, no. 2, pp. 135–146.
Saha, B., Goebel, K., Poll, S. and Christophersen, J. (2007). An integrated
approach to battery health monitoring using Bayesian regression and
state estimation. In: Autotestcon, 2007 ieee, pp. 646–653. ieee.
59
Sandberg, A. and Bostrom, N. (2008). Whole brain emulation: A roadmap,
technical report 2008-3. Tech. Rep., Future of Humanity Institute, Ox-
ford University.
Scherer, K.R., Bänziger, T. and Roesch, E.B. (2010). Blueprint for Affec-
tive Computing: A Sourcebook and Manual. Oxford University Press.
Schumpeter, J.A. (1962). Capitalism, socialism and democracy. Harper &
Row New York.
Simonite, T. (2013 June 5). As data floods in, massive open online courses
evolve. mit Technology Review. http://www.technologyreview.com/
news/515396/as-data-floods-in-massive-open-online-courses-evolve.
Tanner, A. (2007 March 27). Google seeks world of instant
translations. Reuters. http://www.reuters.com/article/2007/03/28/
us-google-translate-id\usN1921881520070328.
uc Berkeley School of Information (2003). How much inform-
ation? 2003. http://www2.sims.berkeley.edu/research/projects/
how-much-info-2003.
us Department of Labor (1899). Thirteenth Annual Report of the Commis-
sioner of Labor. Two Volumes, Government Printing Office, Washington,
dc.
Veres, S.M., Molnar, L., Lincoln, N.K. and Morice, C.P. (2011). Au-
tonomous vehicle control systems – a review of decision making. Pro-
ceedings of the Institution of Mechanical Engineers, Part I: Journal of
Systems and Control Engineering, vol. 225, no. 2, pp. 155–195.
Williamson, J.G. and Lindert, P.H. (1980). American inequality: A
macroeconomic history, vol. 53. Academic Press New York.
Woolf, B.P. (2010). Building intelligent interactive tutors: Student-
centered strategies for revolutionizing e-learning. Morgan Kaufmann.
60
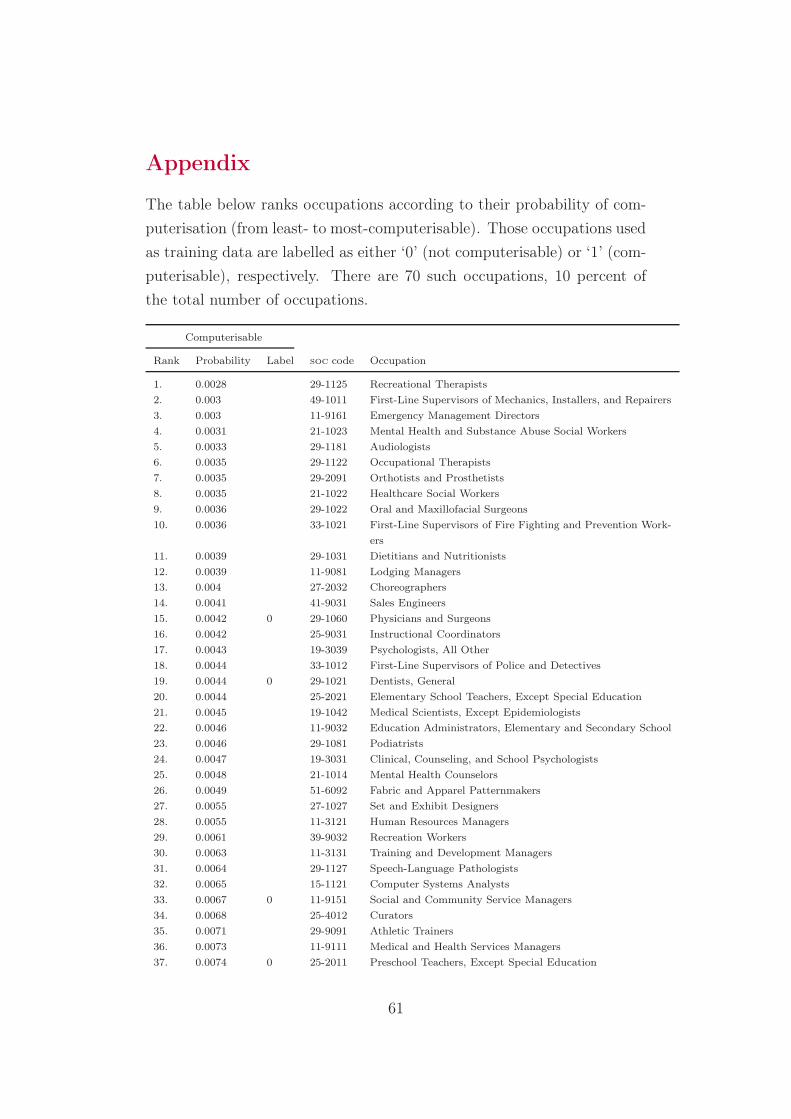
Appendix
The table below ranks occupations according to their probability of com-
puterisation (from least- to most-computerisable). Those occupations used as training data are labelled as either ‘0’ (not computerisable) or ‘1’ (com-
puterisable), respectively. There are 70 such occupations, 10 percent of the total number of occupations.
Computerisable
Rank Probability Label soc code Occupation
1. 0.0028 29-1125 Recreational Therapists
2. 0.003 49-1011 First-Line Supervisors of Mechanics, Installers, and Repairers
3. 0.003 11-9161 Emergency Management Directors
4. 0.0031 21-1023 Mental Health and Substance Abuse Social Workers
5. 0.0033 29-1181 Audiologists
6. 0.0035 29-1122 Occupational Therapists
7. 0.0035 29-2091 Orthotists and Prosthetists
8. 0.0035 21-1022 Healthcare Social Workers
9. 0.0036 29-1022 Oral and Maxillofacial Surgeons
10. 0.0036 33-1021 First-Line Supervisors of Fire Fighting and Prevention Work-
ers
11. 0.0039 29-1031 Dietitians and Nutritionists
12. 0.0039 11-9081 Lodging Managers
13. 0.004 27-2032 Choreographers
14. 0.0041 41-9031 Sales Engineers
15. 0.0042 0 29-1060 Physicians and Surgeons
16. 0.0042 25-9031 Instructional Coordinators
17. 0.0043 19-3039 Psychologists, All Other
18. 0.0044 33-1012 First-Line Supervisors of Police and Detectives
19. 0.0044 0 29-1021 Dentists, General
20. 0.0044 25-2021 Elementary School Teachers, Except Special Education
21. 0.0045 19-1042 Medical Scientists, Except Epidemiologists
22. 0.0046 11-9032 Education Administrators, Elementary and Secondary School
23. 0.0046 29-1081 Podiatrists
24. 0.0047 19-3031 Clinical, Counseling, and School Psychologists
25. 0.0048 21-1014 Mental Health Counselors
26. 0.0049 51-6092 Fabric and Apparel Patternmakers
27. 0.0055 27-1027 Set and Exhibit Designers
28. 0.0055 11-3121 Human Resources Managers
29. 0.0061 39-9032 Recreation Workers
30. 0.0063 11-3131 Training and Development Managers
31. 0.0064 29-1127 Speech-Language Pathologists
32. 0.0065 15-1121 Computer Systems Analysts
33. 0.0067 0 11-9151 Social and Community Service Managers
34. 0.0068 25-4012 Curators
35. 0.0071 29-9091 Athletic Trainers
36. 0.0073 11-9111 Medical and Health Services Managers
37. 0.0074 0 25-2011 Preschool Teachers, Except Special Education
61
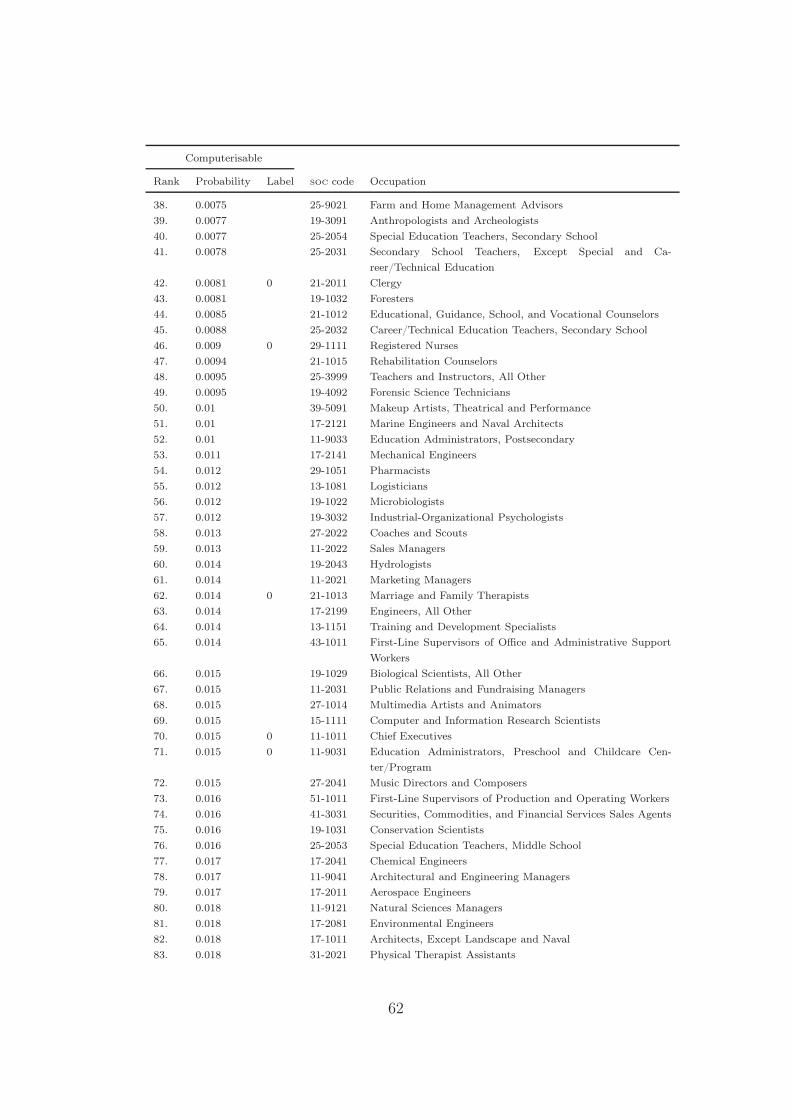
Computerisable
Rank Probability Label soc code Occupation
38. 0.0075 25-9021 Farm and Home Management Advisors
39. 0.0077 19-3091 Anthropologists and Archeologists
40. 0.0077 25-2054 Special Education Teachers, Secondary School
41. 0.0078 25-2031 Secondary School Teachers, Except Special and Ca-
reer/Technical Education
42. 0.0081 0 21-2011 Clergy
43. 0.0081 19-1032 Foresters
44. 0.0085 21-1012 Educational, Guidance, School, and Vocational Counselors
45. 0.0088 25-2032 Career/Technical Education Teachers, Secondary School
46. 0.009 0 29-1111 Registered Nurses
47. 0.0094 21-1015 Rehabilitation Counselors
48. 0.0095 25-3999 Teachers and Instructors, All Other
49. 0.0095 19-4092 Forensic Science Technicians
50. 0.01 39-5091 Makeup Artists, Theatrical and Performance
51. 0.01 17-2121 Marine Engineers and Naval Architects
52. 0.01 11-9033 Education Administrators, Postsecondary
53. 0.011 17-2141 Mechanical Engineers
54. 0.012 29-1051 Pharmacists
55. 0.012 13-1081 Logisticians
56. 0.012 19-1022 Microbiologists
57. 0.012 19-3032 Industrial-Organizational Psychologists
58. 0.013 27-2022 Coaches and Scouts
59. 0.013 11-2022 Sales Managers
60. 0.014 19-2043 Hydrologists
61. 0.014 11-2021 Marketing Managers
62. 0.014 0 21-1013 Marriage and Family Therapists
63. 0.014 17-2199 Engineers, All Other
64. 0.014 13-1151 Training and Development Specialists
65. 0.014 43-1011 First-Line Supervisors of Office and Administrative Support
Workers
66. 0.015 19-1029 Biological Scientists, All Other
67. 0.015 11-2031 Public Relations and Fundraising Managers
68. 0.015 27-1014 Multimedia Artists and Animators
69. 0.015 15-1111 Computer and Information Research Scientists
70. 0.015 0 11-1011 Chief Executives
71. 0.015 0 11-9031 Education Administrators, Preschool and Childcare Cen-
ter/Program
72. 0.015 27-2041 Music Directors and Composers
73. 0.016 51-1011 First-Line Supervisors of Production and Operating Workers
74. 0.016 41-3031 Securities, Commodities, and Financial Services Sales Agents
75. 0.016 19-1031 Conservation Scientists
76. 0.016 25-2053 Special Education Teachers, Middle School
77. 0.017 17-2041 Chemical Engineers
78. 0.017 11-9041 Architectural and Engineering Managers
79. 0.017 17-2011 Aerospace Engineers
80. 0.018 11-9121 Natural Sciences Managers
81. 0.018 17-2081 Environmental Engineers
82. 0.018 17-1011 Architects, Except Landscape and Naval
83. 0.018 31-2021 Physical Therapist Assistants
62
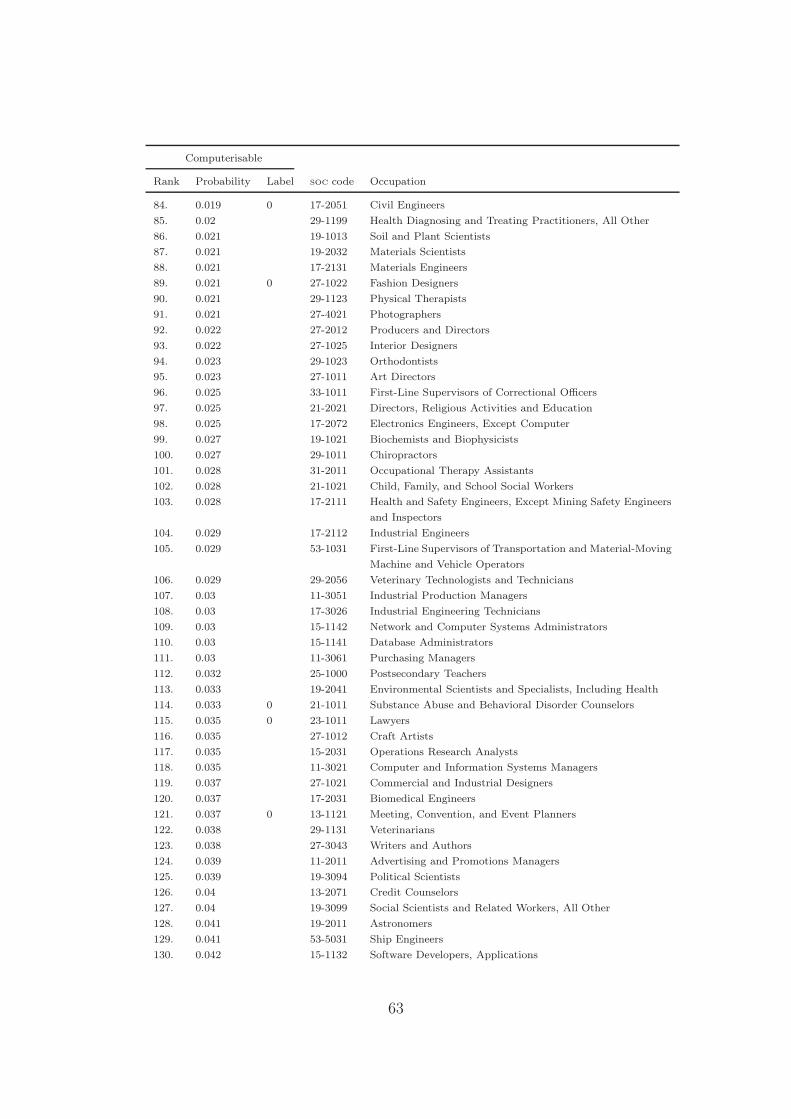
Computerisable
Rank Probability Label soc code Occupation
84. 0.019 0 17-2051 Civil Engineers
85. 0.02 29-1199 Health Diagnosing and Treating Practitioners, All Other
86. 0.021 19-1013 Soil and Plant Scientists
87. 0.021 19-2032 Materials Scientists
88. 0.021 17-2131 Materials Engineers
89. 0.021 0 27-1022 Fashion Designers
90. 0.021 29-1123 Physical Therapists
91. 0.021 27-4021 Photographers
92. 0.022 27-2012 Producers and Directors
93. 0.022 27-1025 Interior Designers
94. 0.023 29-1023 Orthodontists
95. 0.023 27-1011 Art Directors
96. 0.025 33-1011 First-Line Supervisors of Correctional Officers
97. 0.025 21-2021 Directors, Religious Activities and Education
98. 0.025 17-2072 Electronics Engineers, Except Computer
99. 0.027 19-1021 Biochemists and Biophysicists
100. 0.027 29-1011 Chiropractors
101. 0.028 31-2011 Occupational Therapy Assistants
102. 0.028 21-1021 Child, Family, and School Social Workers
103. 0.028 17-2111 Health and Safety Engineers, Except Mining Safety Engineers
and Inspectors
104. 0.029 17-2112 Industrial Engineers
105. 0.029 53-1031 First-Line Supervisors of Transportation and Material-Moving
Machine and Vehicle Operators
106. 0.029 29-2056 Veterinary Technologists and Technicians
107. 0.03 11-3051 Industrial Production Managers
108. 0.03 17-3026 Industrial Engineering Technicians
109. 0.03 15-1142 Network and Computer Systems Administrators
110. 0.03 15-1141 Database Administrators
111. 0.03 11-3061 Purchasing Managers
112. 0.032 25-1000 Postsecondary Teachers
113. 0.033 19-2041 Environmental Scientists and Specialists, Including Health
114. 0.033 0 21-1011 Substance Abuse and Behavioral Disorder Counselors
115. 0.035 0 23-1011 Lawyers
116. 0.035 27-1012 Craft Artists
117. 0.035 15-2031 Operations Research Analysts
118. 0.035 11-3021 Computer and Information Systems Managers
119. 0.037 27-1021 Commercial and Industrial Designers
120. 0.037 17-2031 Biomedical Engineers
121. 0.037 0 13-1121 Meeting, Convention, and Event Planners
122. 0.038 29-1131 Veterinarians
123. 0.038 27-3043 Writers and Authors
124. 0.039 11-2011 Advertising and Promotions Managers
125. 0.039 19-3094 Political Scientists
126. 0.04 13-2071 Credit Counselors
127. 0.04 19-3099 Social Scientists and Related Workers, All Other
128. 0.041 19-2011 Astronomers
129. 0.041 53-5031 Ship Engineers
130. 0.042 15-1132 Software Developers, Applications
63
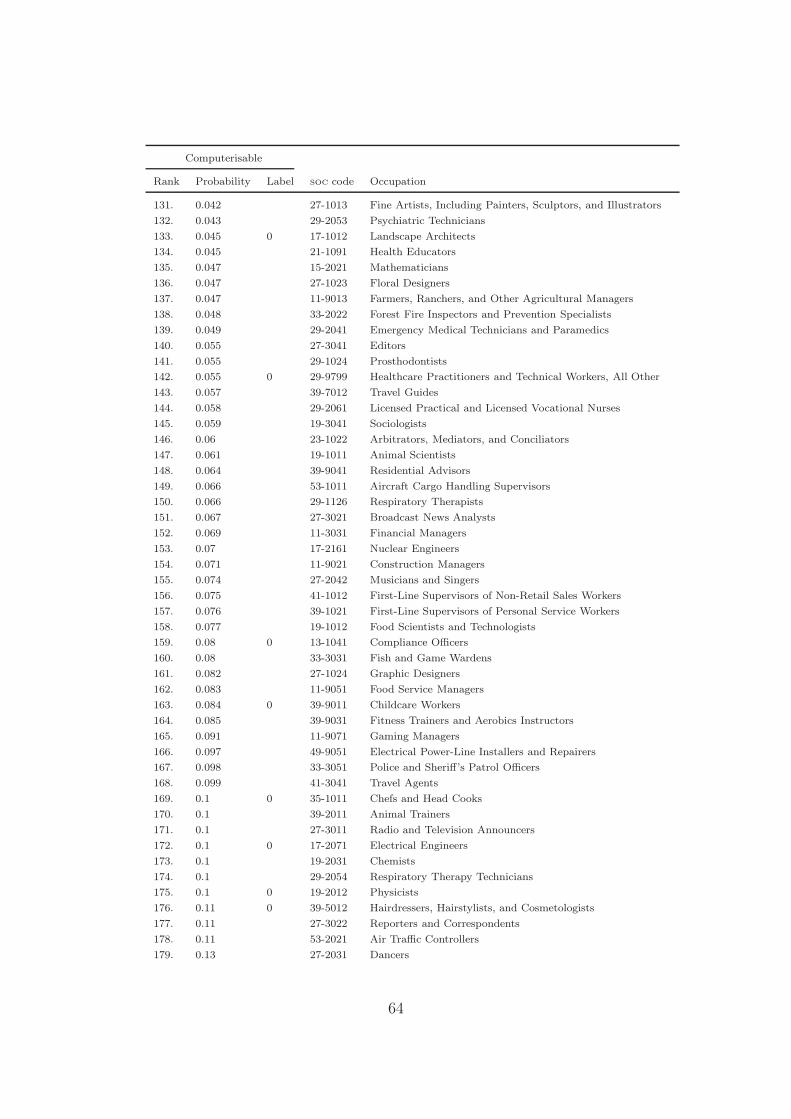
Computerisable
Rank Probability Label soc code Occupation
131. 0.042 27-1013 Fine Artists, Including Painters, Sculptors, and Illustrators
132. 0.043 29-2053 Psychiatric Technicians
133. 0.045 0 17-1012 Landscape Architects
134. 0.045 21-1091 Health Educators
135. 0.047 15-2021 Mathematicians
136. 0.047 27-1023 Floral Designers
137. 0.047 11-9013 Farmers, Ranchers, and Other Agricultural Managers
138. 0.048 33-2022 Forest Fire Inspectors and Prevention Specialists
139. 0.049 29-2041 Emergency Medical Technicians and Paramedics
140. 0.055 27-3041 Editors
141. 0.055 29-1024 Prosthodontists
142. 0.055 0 29-9799 Healthcare Practitioners and Technical Workers, All Other
143. 0.057 39-7012 Travel Guides
144. 0.058 29-2061 Licensed Practical and Licensed Vocational Nurses
145. 0.059 19-3041 Sociologists
146. 0.06 23-1022 Arbitrators, Mediators, and Conciliators
147. 0.061 19-1011 Animal Scientists
148. 0.064 39-9041 Residential Advisors
149. 0.066 53-1011 Aircraft Cargo Handling Supervisors
150. 0.066 29-1126 Respiratory Therapists
151. 0.067 27-3021 Broadcast News Analysts
152. 0.069 11-3031 Financial Managers
153. 0.07 17-2161 Nuclear Engineers
154. 0.071 11-9021 Construction Managers
155. 0.074 27-2042 Musicians and Singers
156. 0.075 41-1012 First-Line Supervisors of Non-Retail Sales Workers
157. 0.076 39-1021 First-Line Supervisors of Personal Service Workers
158. 0.077 19-1012 Food Scientists and Technologists
159. 0.08 0 13-1041 Compliance Officers
160. 0.08 33-3031 Fish and Game Wardens
161. 0.082 27-1024 Graphic Designers
162. 0.083 11-9051 Food Service Managers
163. 0.084 0 39-9011 Childcare Workers
164. 0.085 39-9031 Fitness Trainers and Aerobics Instructors
165. 0.091 11-9071 Gaming Managers
166. 0.097 49-9051 Electrical Power-Line Installers and Repairers
167. 0.098 33-3051 Police and Sheriff’s Patrol Officers
168. 0.099 41-3041 Travel Agents
169. 0.1 0 35-1011 Chefs and Head Cooks
170. 0.1 39-2011 Animal Trainers
171. 0.1 27-3011 Radio and Television Announcers
172. 0.1 0 17-2071 Electrical Engineers
173. 0.1 19-2031 Chemists
174. 0.1 29-2054 Respiratory Therapy Technicians
175. 0.1 0 19-2012 Physicists
176. 0.11 0 39-5012 Hairdressers, Hairstylists, and Cosmetologists
177. 0.11 27-3022 Reporters and Correspondents
178. 0.11 53-2021 Air Traffic Controllers
179. 0.13 27-2031 Dancers
64
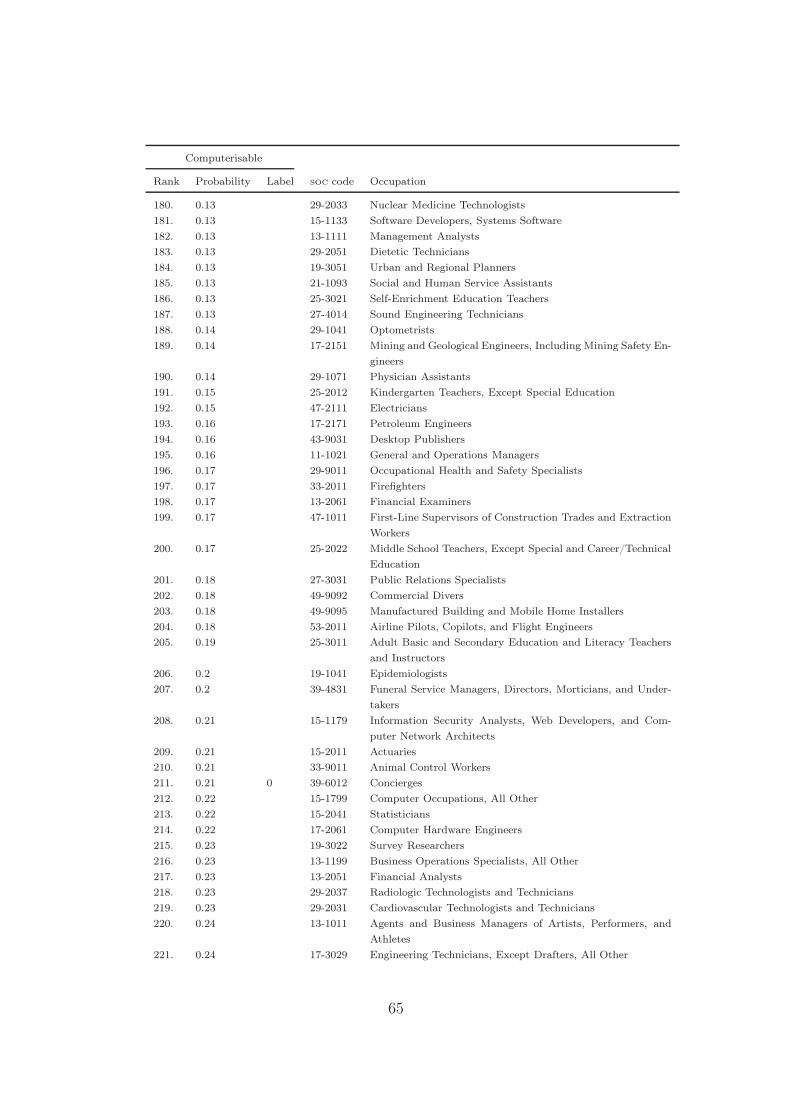
Computerisable
Rank Probability Label soc code Occupation
180. 0.13 29-2033 Nuclear Medicine Technologists
181. 0.13 15-1133 Software Developers, Systems Software
182. 0.13 13-1111 Management Analysts
183. 0.13 29-2051 Dietetic Technicians
184. 0.13 19-3051 Urban and Regional Planners
185. 0.13 21-1093 Social and Human Service Assistants
186. 0.13 25-3021 Self-Enrichment Education Teachers
187. 0.13 27-4014 Sound Engineering Technicians
188. 0.14 29-1041 Optometrists
189. 0.14 17-2151 Mining and Geological Engineers, Including Mining Safety En-
gineers
190. 0.14 29-1071 Physician Assistants
191. 0.15 25-2012 Kindergarten Teachers, Except Special Education
192. 0.15 47-2111 Electricians
193. 0.16 17-2171 Petroleum Engineers
194. 0.16 43-9031 Desktop Publishers
195. 0.16 11-1021 General and Operations Managers
196. 0.17 29-9011 Occupational Health and Safety Specialists
197. 0.17 33-2011 Firefighters
198. 0.17 13-2061 Financial Examiners
199. 0.17 47-1011 First-Line Supervisors of Construction Trades and Extraction
Workers
200. 0.17 25-2022 Middle School Teachers, Except Special and Career/Technical
Education
201. 0.18 27-3031 Public Relations Specialists
202. 0.18 49-9092 Commercial Divers
203. 0.18 49-9095 Manufactured Building and Mobile Home Installers
204. 0.18 53-2011 Airline Pilots, Copilots, and Flight Engineers
205. 0.19 25-3011 Adult Basic and Secondary Education and Literacy Teachers
and Instructors
206. 0.2 19-1041 Epidemiologists
207. 0.2 39-4831 Funeral Service Managers, Directors, Morticians, and Under-
takers
208. 0.21 15-1179 Information Security Analysts, Web Developers, and Com-
puter Network Architects
209. 0.21 15-2011 Actuaries
210. 0.21 33-9011 Animal Control Workers
211. 0.21 0 39-6012 Concierges
212. 0.22 15-1799 Computer Occupations, All Other
213. 0.22 15-2041 Statisticians
214. 0.22 17-2061 Computer Hardware Engineers
215. 0.23 19-3022 Survey Researchers
216. 0.23 13-1199 Business Operations Specialists, All Other
217. 0.23 13-2051 Financial Analysts
218. 0.23 29-2037 Radiologic Technologists and Technicians
219. 0.23 29-2031 Cardiovascular Technologists and Technicians
220. 0.24 13-1011 Agents and Business Managers of Artists, Performers, and
Athletes
221. 0.24 17-3029 Engineering Technicians, Except Drafters, All Other
65
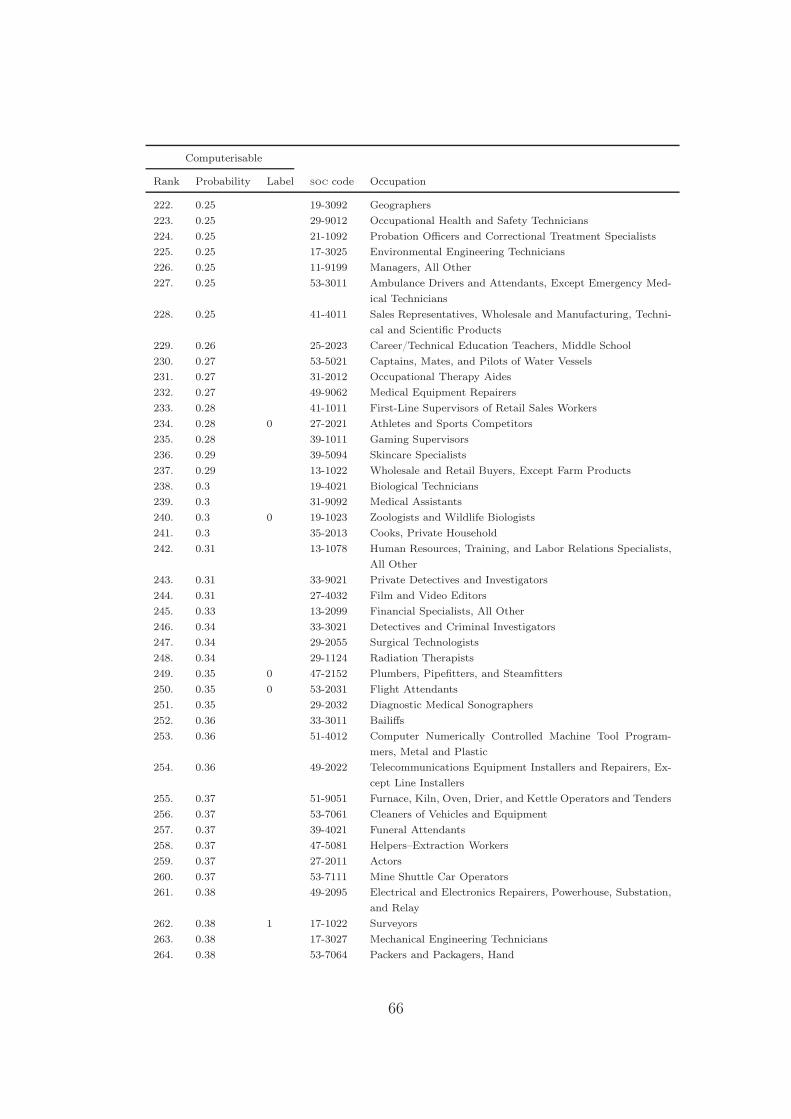
Computerisable
Rank Probability Label soc code Occupation
222. 0.25 19-3092 Geographers
223. 0.25 29-9012 Occupational Health and Safety Technicians
224. 0.25 21-1092 Probation Officers and Correctional Treatment Specialists
225. 0.25 17-3025 Environmental Engineering Technicians
226. 0.25 11-9199 Managers, All Other
227. 0.25 53-3011 Ambulance Drivers and Attendants, Except Emergency Med-
ical Technicians
228. 0.25 41-4011 Sales Representatives, Wholesale and Manufacturing, Techni-
cal and Scientific Products
229. 0.26 25-2023 Career/Technical Education Teachers, Middle School
230. 0.27 53-5021 Captains, Mates, and Pilots of Water Vessels
231. 0.27 31-2012 Occupational Therapy Aides
232. 0.27 49-9062 Medical Equipment Repairers
233. 0.28 41-1011 First-Line Supervisors of Retail Sales Workers
234. 0.28 0 27-2021 Athletes and Sports Competitors
235. 0.28 39-1011 Gaming Supervisors
236. 0.29 39-5094 Skincare Specialists
237. 0.29 13-1022 Wholesale and Retail Buyers, Except Farm Products
238. 0.3 19-4021 Biological Technicians
239. 0.3 31-9092 Medical Assistants
240. 0.3 0 19-1023 Zoologists and Wildlife Biologists
241. 0.3 35-2013 Cooks, Private Household
242. 0.31 13-1078 Human Resources, Training, and Labor Relations Specialists,
All Other
243. 0.31 33-9021 Private Detectives and Investigators
244. 0.31 27-4032 Film and Video Editors
245. 0.33 13-2099 Financial Specialists, All Other
246. 0.34 33-3021 Detectives and Criminal Investigators
247. 0.34 29-2055 Surgical Technologists
248. 0.34 29-1124 Radiation Therapists
249. 0.35 0 47-2152 Plumbers, Pipefitters, and Steamfitters
250. 0.35 0 53-2031 Flight Attendants
251. 0.35 29-2032 Diagnostic Medical Sonographers
252. 0.36 33-3011 Bailiffs
253. 0.36 51-4012 Computer Numerically Controlled Machine Tool Program-
mers, Metal and Plastic
254. 0.36 49-2022 Telecommunications Equipment Installers and Repairers, Ex-
cept Line Installers
255. 0.37 51-9051 Furnace, Kiln, Oven, Drier, and Kettle Operators and Tenders
256. 0.37 53-7061 Cleaners of Vehicles and Equipment
257. 0.37 39-4021 Funeral Attendants
258. 0.37 47-5081 Helpers–Extraction Workers
259. 0.37 27-2011 Actors
260. 0.37 53-7111 Mine Shuttle Car Operators
261. 0.38 49-2095 Electrical and Electronics Repairers, Powerhouse, Substation,
and Relay
262. 0.38 1 17-1022 Surveyors
263. 0.38 17-3027 Mechanical Engineering Technicians
264. 0.38 53-7064 Packers and Packagers, Hand
66
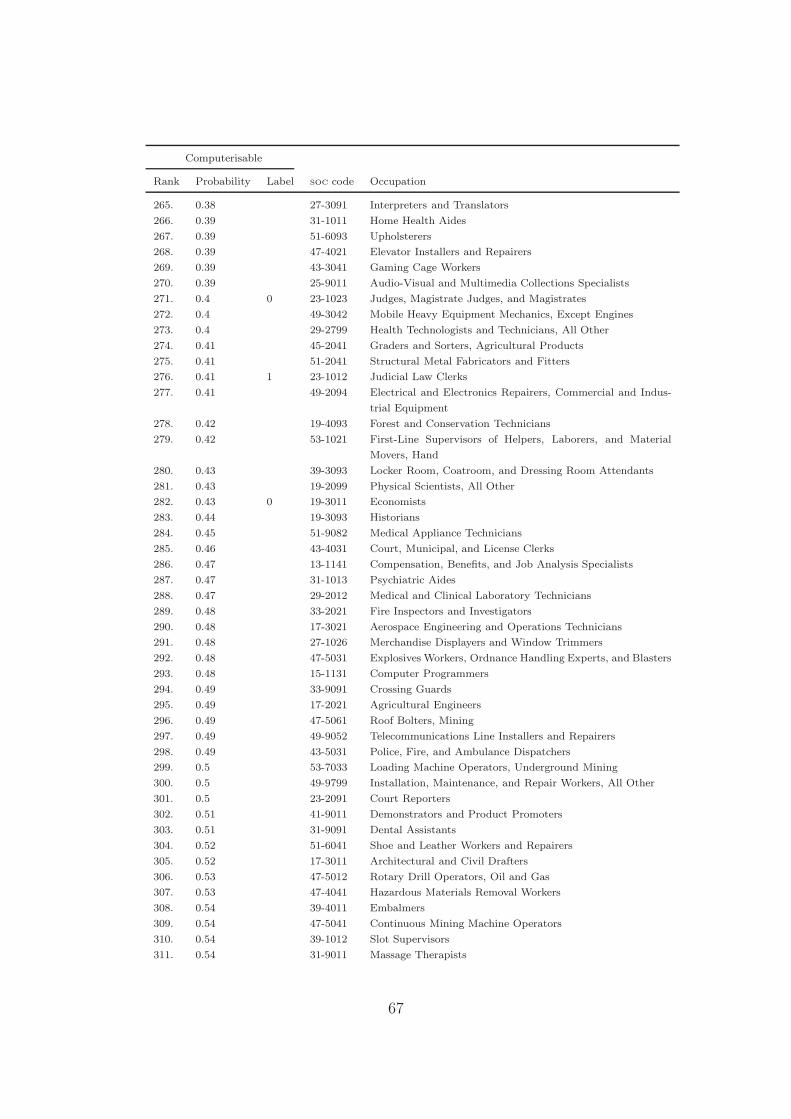
Computerisable
Rank Probability Label soc code Occupation
265. 0.38 27-3091 Interpreters and Translators
266. 0.39 31-1011 Home Health Aides
267. 0.39 51-6093 Upholsterers
268. 0.39 47-4021 Elevator Installers and Repairers
269. 0.39 43-3041 Gaming Cage Workers
270. 0.39 25-9011 Audio-Visual and Multimedia Collections Specialists
271. 0.4 0 23-1023 Judges, Magistrate Judges, and Magistrates
272. 0.4 49-3042 Mobile Heavy Equipment Mechanics, Except Engines
273. 0.4 29-2799 Health Technologists and Technicians, All Other
274. 0.41 45-2041 Graders and Sorters, Agricultural Products
275. 0.41 51-2041 Structural Metal Fabricators and Fitters
276. 0.41 1 23-1012 Judicial Law Clerks
277. 0.41 49-2094 Electrical and Electronics Repairers, Commercial and Indus-
trial Equipment
278. 0.42 19-4093 Forest and Conservation Technicians
279. 0.42 53-1021 First-Line Supervisors of Helpers, Laborers, and Material
Movers, Hand
280. 0.43 39-3093 Locker Room, Coatroom, and Dressing Room Attendants
281. 0.43 19-2099 Physical Scientists, All Other
282. 0.43 0 19-3011 Economists
283. 0.44 19-3093 Historians
284. 0.45 51-9082 Medical Appliance Technicians
285. 0.46 43-4031 Court, Municipal, and License Clerks
286. 0.47 13-1141 Compensation, Benefits, and Job Analysis Specialists
287. 0.47 31-1013 Psychiatric Aides
288. 0.47 29-2012 Medical and Clinical Laboratory Technicians
289. 0.48 33-2021 Fire Inspectors and Investigators
290. 0.48 17-3021 Aerospace Engineering and Operations Technicians
291. 0.48 27-1026 Merchandise Displayers and Window Trimmers
292. 0.48 47-5031 Explosives Workers, Ordnance Handling Experts, and Blasters
293. 0.48 15-1131 Computer Programmers
294. 0.49 33-9091 Crossing Guards
295. 0.49 17-2021 Agricultural Engineers
296. 0.49 47-5061 Roof Bolters, Mining
297. 0.49 49-9052 Telecommunications Line Installers and Repairers
298. 0.49 43-5031 Police, Fire, and Ambulance Dispatchers
299. 0.5 53-7033 Loading Machine Operators, Underground Mining
300. 0.5 49-9799 Installation, Maintenance, and Repair Workers, All Other
301. 0.5 23-2091 Court Reporters
302. 0.51 41-9011 Demonstrators and Product Promoters
303. 0.51 31-9091 Dental Assistants
304. 0.52 51-6041 Shoe and Leather Workers and Repairers
305. 0.52 17-3011 Architectural and Civil Drafters
306. 0.53 47-5012 Rotary Drill Operators, Oil and Gas
307. 0.53 47-4041 Hazardous Materials Removal Workers
308. 0.54 39-4011 Embalmers
309. 0.54 47-5041 Continuous Mining Machine Operators
310. 0.54 39-1012 Slot Supervisors
311. 0.54 31-9011 Massage Therapists
67
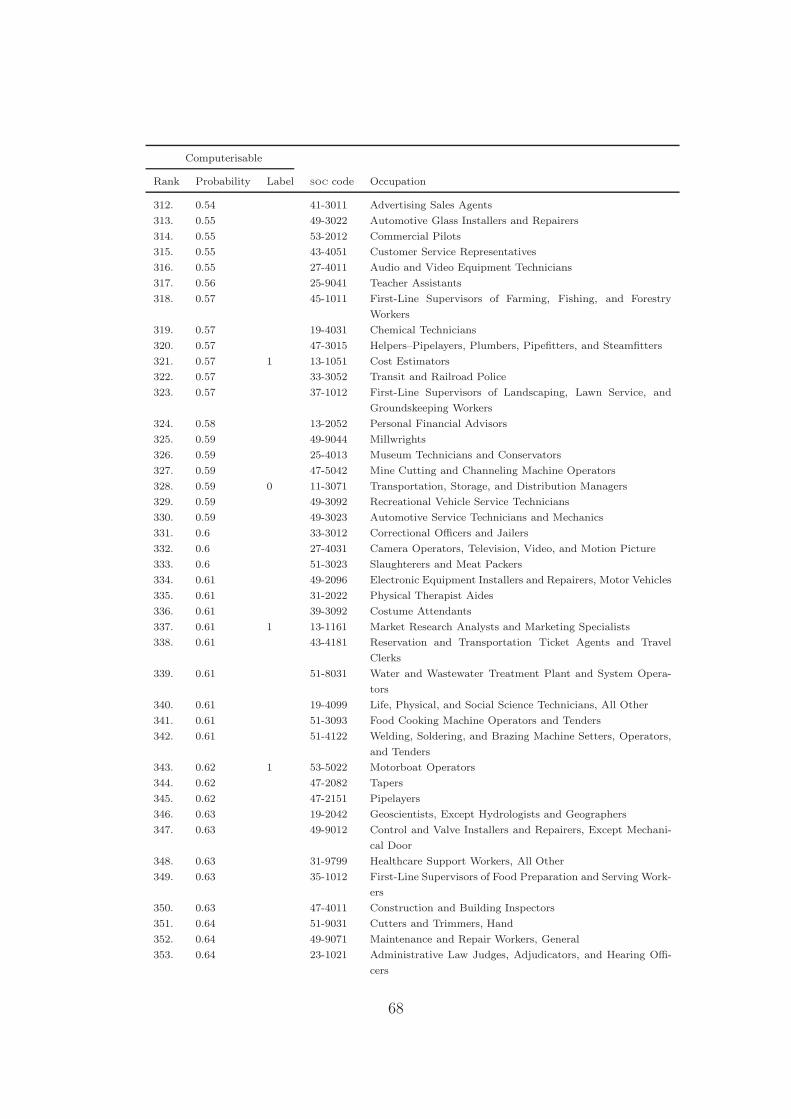
Computerisable
Rank Probability Label soc code Occupation
312. 0.54 41-3011 Advertising Sales Agents
313. 0.55 49-3022 Automotive Glass Installers and Repairers
314. 0.55 53-2012 Commercial Pilots
315. 0.55 43-4051 Customer Service Representatives
316. 0.55 27-4011 Audio and Video Equipment Technicians
317. 0.56 25-9041 Teacher Assistants
318. 0.57 45-1011 First-Line Supervisors of Farming, Fishing, and Forestry
Workers
319. 0.57 19-4031 Chemical Technicians
320. 0.57 47-3015 Helpers–Pipelayers, Plumbers, Pipefitters, and Steamfitters
321. 0.57 1 13-1051 Cost Estimators
322. 0.57 33-3052 Transit and Railroad Police
323. 0.57 37-1012 First-Line Supervisors of Landscaping, Lawn Service, and
Groundskeeping Workers
324. 0.58 13-2052 Personal Financial Advisors
325. 0.59 49-9044 Millwrights
326. 0.59 25-4013 Museum Technicians and Conservators
327. 0.59 47-5042 Mine Cutting and Channeling Machine Operators
328. 0.59 0 11-3071 Transportation, Storage, and Distribution Managers
329. 0.59 49-3092 Recreational Vehicle Service Technicians
330. 0.59 49-3023 Automotive Service Technicians and Mechanics
331. 0.6 33-3012 Correctional Officers and Jailers
332. 0.6 27-4031 Camera Operators, Television, Video, and Motion Picture
333. 0.6 51-3023 Slaughterers and Meat Packers
334. 0.61 49-2096 Electronic Equipment Installers and Repairers, Motor Vehicles
335. 0.61 31-2022 Physical Therapist Aides
336. 0.61 39-3092 Costume Attendants
337. 0.61 1 13-1161 Market Research Analysts and Marketing Specialists
338. 0.61 43-4181 Reservation and Transportation Ticket Agents and Travel
Clerks
339. 0.61 51-8031 Water and Wastewater Treatment Plant and System Opera-
tors
340. 0.61 19-4099 Life, Physical, and Social Science Technicians, All Other
341. 0.61 51-3093 Food Cooking Machine Operators and Tenders
342. 0.61 51-4122 Welding, Soldering, and Brazing Machine Setters, Operators,
and Tenders
343. 0.62 1 53-5022 Motorboat Operators
344. 0.62 47-2082 Tapers
345. 0.62 47-2151 Pipelayers
346. 0.63 19-2042 Geoscientists, Except Hydrologists and Geographers
347. 0.63 49-9012 Control and Valve Installers and Repairers, Except Mechani-
cal Door
348. 0.63 31-9799 Healthcare Support Workers, All Other
349. 0.63 35-1012 First-Line Supervisors of Food Preparation and Serving Work-
ers
350. 0.63 47-4011 Construction and Building Inspectors
351. 0.64 51-9031 Cutters and Trimmers, Hand
352. 0.64 49-9071 Maintenance and Repair Workers, General
353. 0.64 23-1021 Administrative Law Judges, Adjudicators, and Hearing Offi-
cers
68
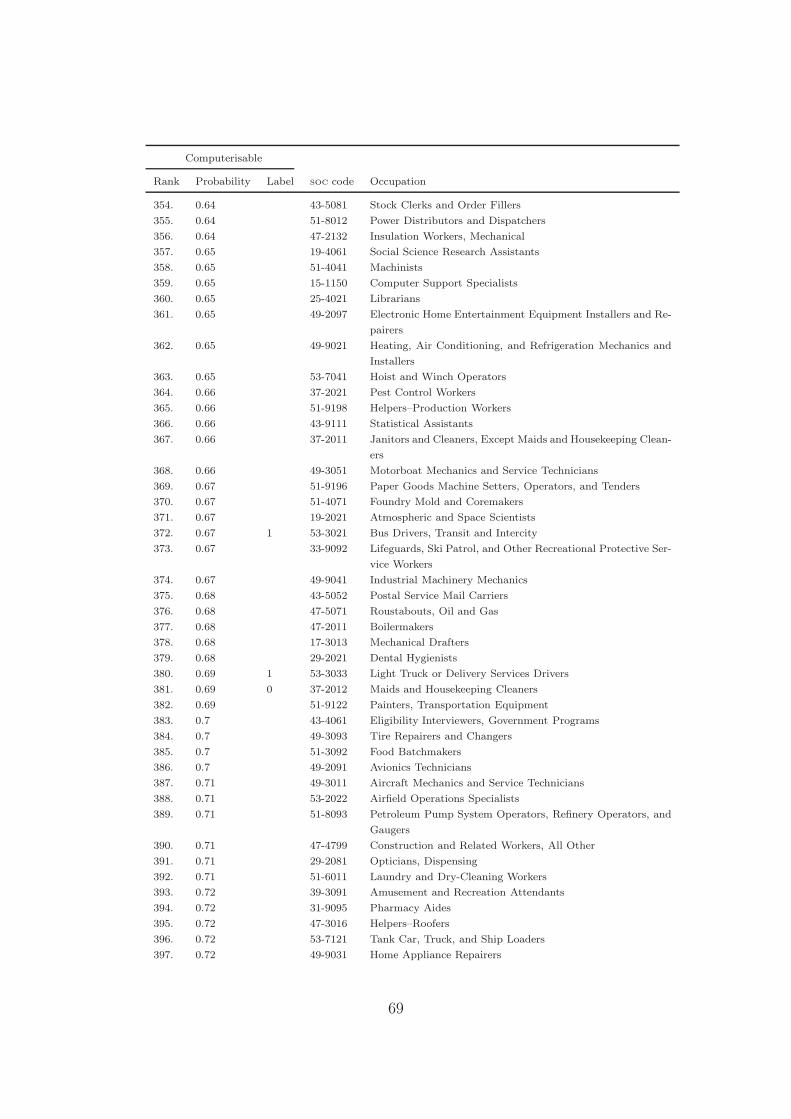
Computerisable
Rank Probability Label soc code Occupation
354. 0.64 43-5081 Stock Clerks and Order Fillers
355. 0.64 51-8012 Power Distributors and Dispatchers
356. 0.64 47-2132 Insulation Workers, Mechanical
357. 0.65 19-4061 Social Science Research Assistants
358. 0.65 51-4041 Machinists
359. 0.65 15-1150 Computer Support Specialists
360. 0.65 25-4021 Librarians
361. 0.65 49-2097 Electronic Home Entertainment Equipment Installers and Re-
pairers
362. 0.65 49-9021 Heating, Air Conditioning, and Refrigeration Mechanics and
Installers
363. 0.65 53-7041 Hoist and Winch Operators
364. 0.66 37-2021 Pest Control Workers
365. 0.66 51-9198 Helpers–Production Workers
366. 0.66 43-9111 Statistical Assistants
367. 0.66 37-2011 Janitors and Cleaners, Except Maids and Housekeeping Clean-
ers
368. 0.66 49-3051 Motorboat Mechanics and Service Technicians
369. 0.67 51-9196 Paper Goods Machine Setters, Operators, and Tenders
370. 0.67 51-4071 Foundry Mold and Coremakers
371. 0.67 19-2021 Atmospheric and Space Scientists
372. 0.67 1 53-3021 Bus Drivers, Transit and Intercity
373. 0.67 33-9092 Lifeguards, Ski Patrol, and Other Recreational Protective Ser-
vice Workers
374. 0.67 49-9041 Industrial Machinery Mechanics
375. 0.68 43-5052 Postal Service Mail Carriers
376. 0.68 47-5071 Roustabouts, Oil and Gas
377. 0.68 47-2011 Boilermakers
378. 0.68 17-3013 Mechanical Drafters
379. 0.68 29-2021 Dental Hygienists
380. 0.69 1 53-3033 Light Truck or Delivery Services Drivers
381. 0.69 0 37-2012 Maids and Housekeeping Cleaners
382. 0.69 51-9122 Painters, Transportation Equipment
383. 0.7 43-4061 Eligibility Interviewers, Government Programs
384. 0.7 49-3093 Tire Repairers and Changers
385. 0.7 51-3092 Food Batchmakers
386. 0.7 49-2091 Avionics Technicians
387. 0.71 49-3011 Aircraft Mechanics and Service Technicians
388. 0.71 53-2022 Airfield Operations Specialists
389. 0.71 51-8093 Petroleum Pump System Operators, Refinery Operators, and
Gaugers
390. 0.71 47-4799 Construction and Related Workers, All Other
391. 0.71 29-2081 Opticians, Dispensing
392. 0.71 51-6011 Laundry and Dry-Cleaning Workers
393. 0.72 39-3091 Amusement and Recreation Attendants
394. 0.72 31-9095 Pharmacy Aides
395. 0.72 47-3016 Helpers–Roofers
396. 0.72 53-7121 Tank Car, Truck, and Ship Loaders
397. 0.72 49-9031 Home Appliance Repairers
69
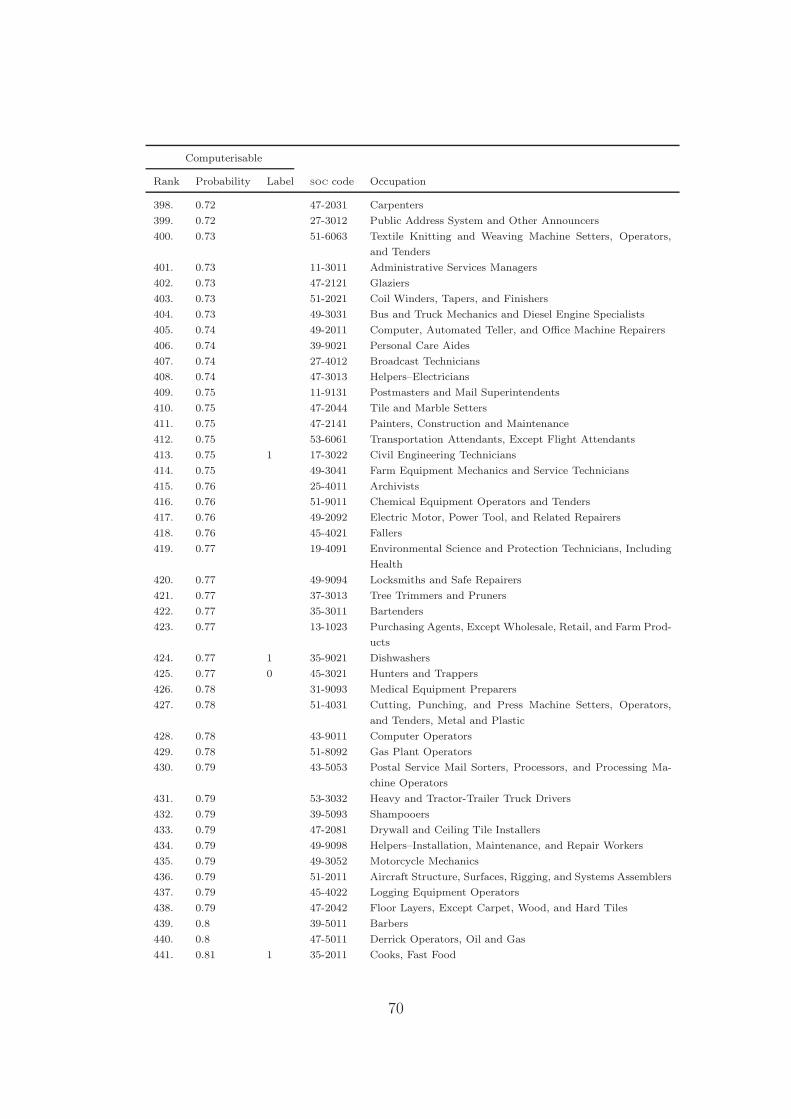
Computerisable
Rank Probability Label soc code Occupation
398. 0.72 47-2031 Carpenters
399. 0.72 27-3012 Public Address System and Other Announcers
400. 0.73 51-6063 Textile Knitting and Weaving Machine Setters, Operators,
and Tenders
401. 0.73 11-3011 Administrative Services Managers
402. 0.73 47-2121 Glaziers
403. 0.73 51-2021 Coil Winders, Tapers, and Finishers
404. 0.73 49-3031 Bus and Truck Mechanics and Diesel Engine Specialists
405. 0.74 49-2011 Computer, Automated Teller, and Office Machine Repairers
406. 0.74 39-9021 Personal Care Aides
407. 0.74 27-4012 Broadcast Technicians
408. 0.74 47-3013 Helpers–Electricians
409. 0.75 11-9131 Postmasters and Mail Superintendents
410. 0.75 47-2044 Tile and Marble Setters
411. 0.75 47-2141 Painters, Construction and Maintenance
412. 0.75 53-6061 Transportation Attendants, Except Flight Attendants
413. 0.75 1 17-3022 Civil Engineering Technicians
414. 0.75 49-3041 Farm Equipment Mechanics and Service Technicians
415. 0.76 25-4011 Archivists
416. 0.76 51-9011 Chemical Equipment Operators and Tenders
417. 0.76 49-2092 Electric Motor, Power Tool, and Related Repairers
418. 0.76 45-4021 Fallers
419. 0.77 19-4091 Environmental Science and Protection Technicians, Including
Health
420. 0.77 49-9094 Locksmiths and Safe Repairers
421. 0.77 37-3013 Tree Trimmers and Pruners
422. 0.77 35-3011 Bartenders
423. 0.77 13-1023 Purchasing Agents, Except Wholesale, Retail, and Farm Prod-
ucts
424. 0.77 1 35-9021 Dishwashers
425. 0.77 0 45-3021 Hunters and Trappers
426. 0.78 31-9093 Medical Equipment Preparers
427. 0.78 51-4031 Cutting, Punching, and Press Machine Setters, Operators,
and Tenders, Metal and Plastic
428. 0.78 43-9011 Computer Operators
429. 0.78 51-8092 Gas Plant Operators
430. 0.79 43-5053 Postal Service Mail Sorters, Processors, and Processing Ma-
chine Operators
431. 0.79 53-3032 Heavy and Tractor-Trailer Truck Drivers
432. 0.79 39-5093 Shampooers
433. 0.79 47-2081 Drywall and Ceiling Tile Installers
434. 0.79 49-9098 Helpers–Installation, Maintenance, and Repair Workers
435. 0.79 49-3052 Motorcycle Mechanics
436. 0.79 51-2011 Aircraft Structure, Surfaces, Rigging, and Systems Assemblers
437. 0.79 45-4022 Logging Equipment Operators
438. 0.79 47-2042 Floor Layers, Except Carpet, Wood, and Hard Tiles
439. 0.8 39-5011 Barbers
440. 0.8 47-5011 Derrick Operators, Oil and Gas
441. 0.81 1 35-2011 Cooks, Fast Food
70
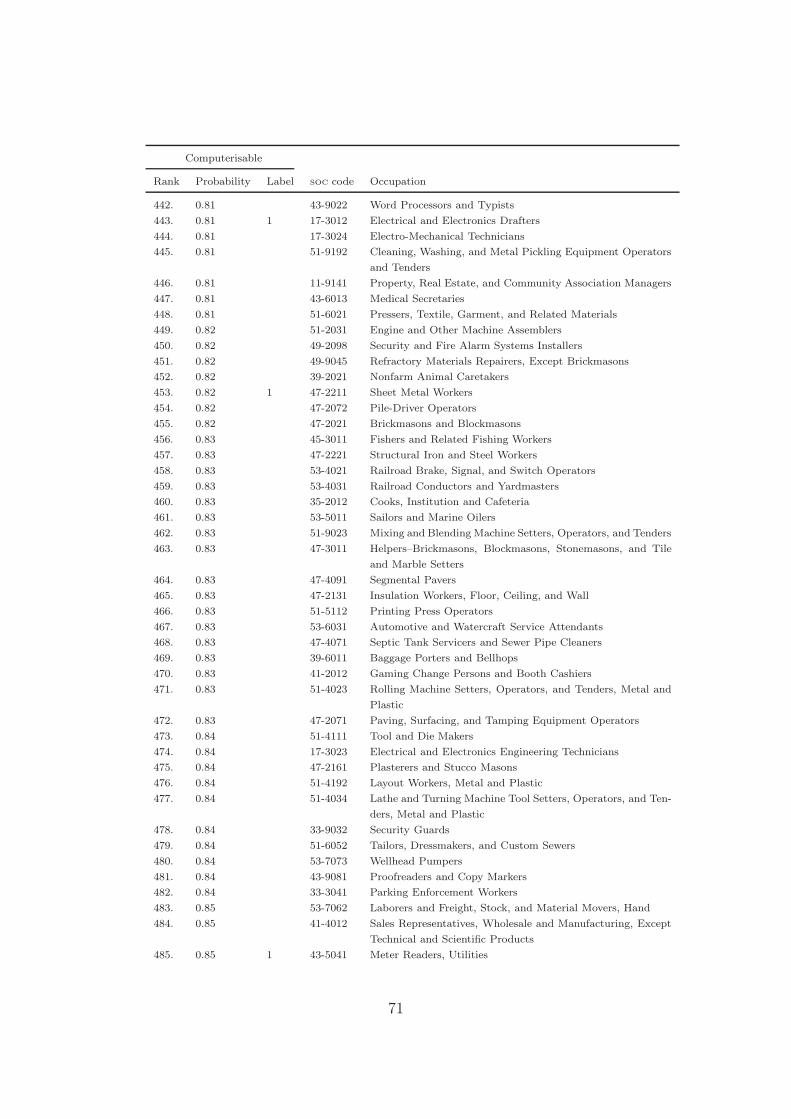
Computerisable
Rank Probability Label soc code Occupation
442. 0.81 43-9022 Word Processors and Typists
443. 0.81 1 17-3012 Electrical and Electronics Drafters
444. 0.81 17-3024 Electro-Mechanical Technicians
445. 0.81 51-9192 Cleaning, Washing, and Metal Pickling Equipment Operators
and Tenders
446. 0.81 11-9141 Property, Real Estate, and Community Association Managers
447. 0.81 43-6013 Medical Secretaries
448. 0.81 51-6021 Pressers, Textile, Garment, and Related Materials
449. 0.82 51-2031 Engine and Other Machine Assemblers
450. 0.82 49-2098 Security and Fire Alarm Systems Installers
451. 0.82 49-9045 Refractory Materials Repairers, Except Brickmasons
452. 0.82 39-2021 Nonfarm Animal Caretakers
453. 0.82 1 47-2211 Sheet Metal Workers
454. 0.82 47-2072 Pile-Driver Operators
455. 0.82 47-2021 Brickmasons and Blockmasons
456. 0.83 45-3011 Fishers and Related Fishing Workers
457. 0.83 47-2221 Structural Iron and Steel Workers
458. 0.83 53-4021 Railroad Brake, Signal, and Switch Operators
459. 0.83 53-4031 Railroad Conductors and Yardmasters
460. 0.83 35-2012 Cooks, Institution and Cafeteria
461. 0.83 53-5011 Sailors and Marine Oilers
462. 0.83 51-9023 Mixing and Blending Machine Setters, Operators, and Tenders
463. 0.83 47-3011 Helpers–Brickmasons, Blockmasons, Stonemasons, and Tile
and Marble Setters
464. 0.83 47-4091 Segmental Pavers
465. 0.83 47-2131 Insulation Workers, Floor, Ceiling, and Wall
466. 0.83 51-5112 Printing Press Operators
467. 0.83 53-6031 Automotive and Watercraft Service Attendants
468. 0.83 47-4071 Septic Tank Servicers and Sewer Pipe Cleaners
469. 0.83 39-6011 Baggage Porters and Bellhops
470. 0.83 41-2012 Gaming Change Persons and Booth Cashiers
471. 0.83 51-4023 Rolling Machine Setters, Operators, and Tenders, Metal and
Plastic
472. 0.83 47-2071 Paving, Surfacing, and Tamping Equipment Operators
473. 0.84 51-4111 Tool and Die Makers
474. 0.84 17-3023 Electrical and Electronics Engineering Technicians
475. 0.84 47-2161 Plasterers and Stucco Masons
476. 0.84 51-4192 Layout Workers, Metal and Plastic
477. 0.84 51-4034 Lathe and Turning Machine Tool Setters, Operators, and Ten-
ders, Metal and Plastic
478. 0.84 33-9032 Security Guards
479. 0.84 51-6052 Tailors, Dressmakers, and Custom Sewers
480. 0.84 53-7073 Wellhead Pumpers
481. 0.84 43-9081 Proofreaders and Copy Markers
482. 0.84 33-3041 Parking Enforcement Workers
483. 0.85 53-7062 Laborers and Freight, Stock, and Material Movers, Hand
484. 0.85 41-4012 Sales Representatives, Wholesale and Manufacturing, Except
Technical and Scientific Products
485. 0.85 1 43-5041 Meter Readers, Utilities
71
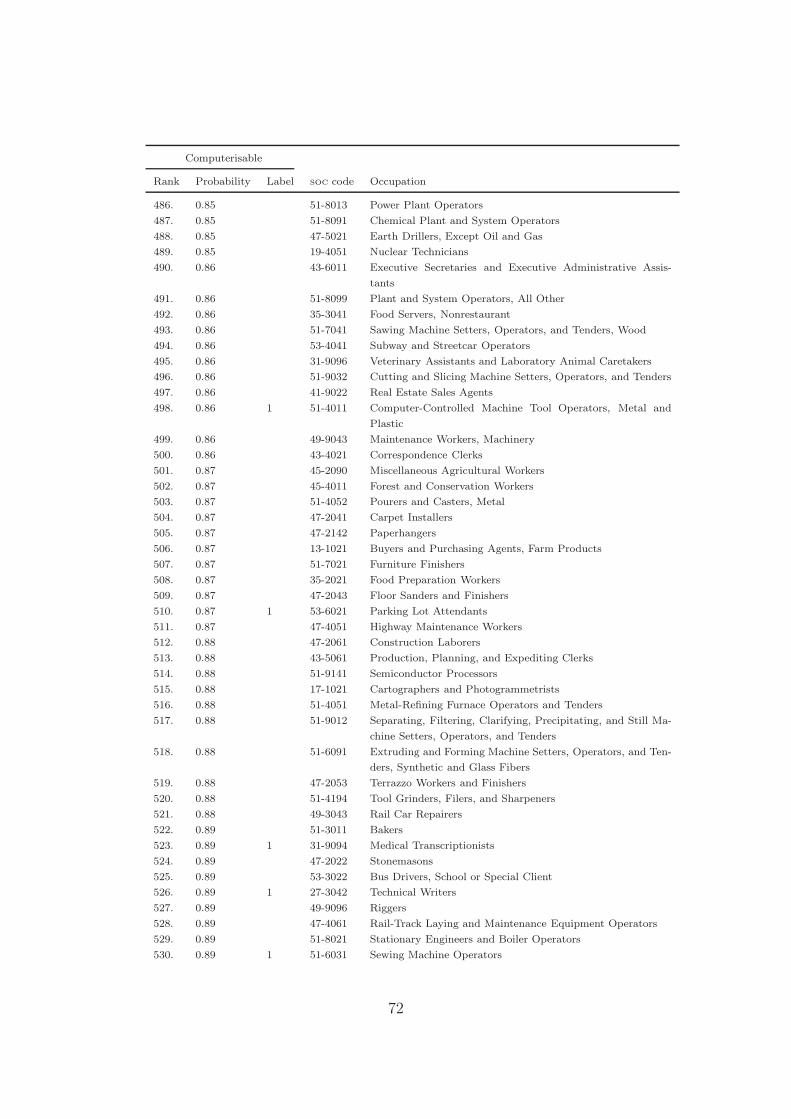
Computerisable
Rank Probability Label soc code Occupation
486. 0.85 51-8013 Power Plant Operators
487. 0.85 51-8091 Chemical Plant and System Operators
488. 0.85 47-5021 Earth Drillers, Except Oil and Gas
489. 0.85 19-4051 Nuclear Technicians
490. 0.86 43-6011 Executive Secretaries and Executive Administrative Assis-
tants
491. 0.86 51-8099 Plant and System Operators, All Other
492. 0.86 35-3041 Food Servers, Nonrestaurant
493. 0.86 51-7041 Sawing Machine Setters, Operators, and Tenders, Wood
494. 0.86 53-4041 Subway and Streetcar Operators
495. 0.86 31-9096 Veterinary Assistants and Laboratory Animal Caretakers
496. 0.86 51-9032 Cutting and Slicing Machine Setters, Operators, and Tenders
497. 0.86 41-9022 Real Estate Sales Agents
498. 0.86 1 51-4011 Computer-Controlled Machine Tool Operators, Metal and
Plastic
499. 0.86 49-9043 Maintenance Workers, Machinery
500. 0.86 43-4021 Correspondence Clerks
501. 0.87 45-2090 Miscellaneous Agricultural Workers
502. 0.87 45-4011 Forest and Conservation Workers
503. 0.87 51-4052 Pourers and Casters, Metal
504. 0.87 47-2041 Carpet Installers
505. 0.87 47-2142 Paperhangers
506. 0.87 13-1021 Buyers and Purchasing Agents, Farm Products
507. 0.87 51-7021 Furniture Finishers
508. 0.87 35-2021 Food Preparation Workers
509. 0.87 47-2043 Floor Sanders and Finishers
510. 0.87 1 53-6021 Parking Lot Attendants
511. 0.87 47-4051 Highway Maintenance Workers
512. 0.88 47-2061 Construction Laborers
513. 0.88 43-5061 Production, Planning, and Expediting Clerks
514. 0.88 51-9141 Semiconductor Processors
515. 0.88 17-1021 Cartographers and Photogrammetrists
516. 0.88 51-4051 Metal-Refining Furnace Operators and Tenders
517. 0.88 51-9012 Separating, Filtering, Clarifying, Precipitating, and Still Ma-
chine Setters, Operators, and Tenders
518. 0.88 51-6091 Extruding and Forming Machine Setters, Operators, and Ten-
ders, Synthetic and Glass Fibers
519. 0.88 47-2053 Terrazzo Workers and Finishers
520. 0.88 51-4194 Tool Grinders, Filers, and Sharpeners
521. 0.88 49-3043 Rail Car Repairers
522. 0.89 51-3011 Bakers
523. 0.89 1 31-9094 Medical Transcriptionists
524. 0.89 47-2022 Stonemasons
525. 0.89 53-3022 Bus Drivers, School or Special Client
526. 0.89 1 27-3042 Technical Writers
527. 0.89 49-9096 Riggers
528. 0.89 47-4061 Rail-Track Laying and Maintenance Equipment Operators
529. 0.89 51-8021 Stationary Engineers and Boiler Operators
530. 0.89 1 51-6031 Sewing Machine Operators
72
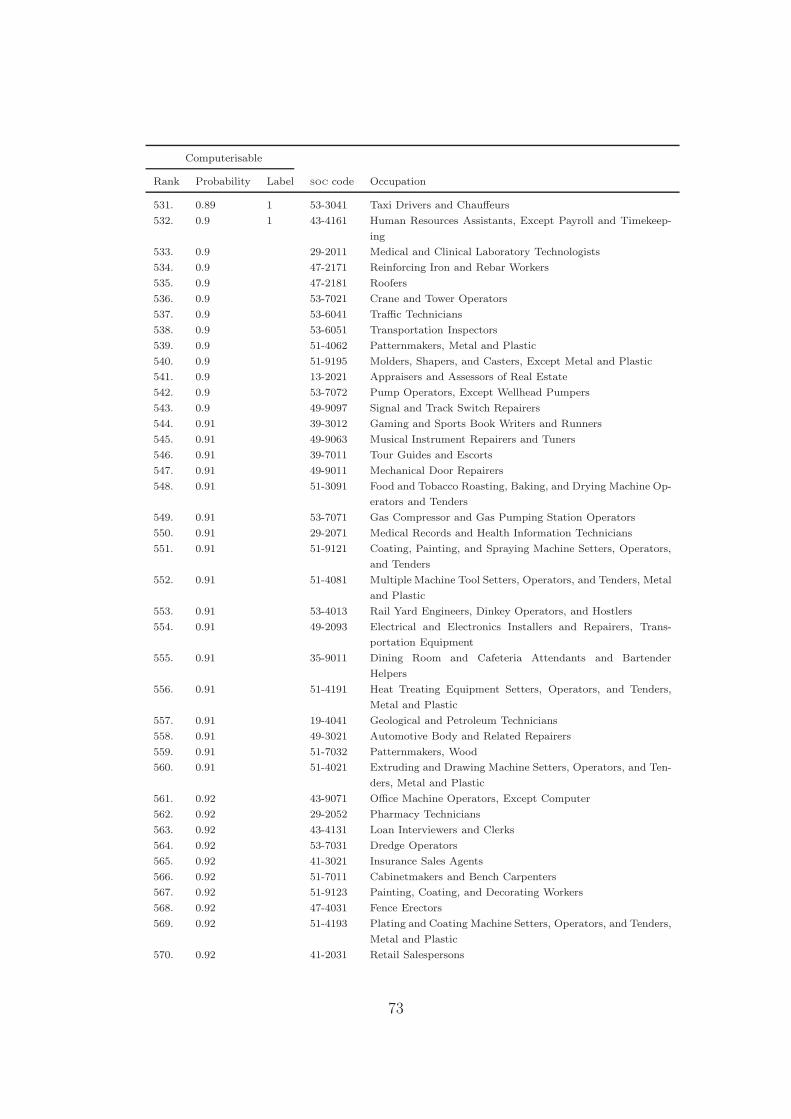
Computerisable
Rank Probability Label soc code Occupation
531. 0.89 1 53-3041 Taxi Drivers and Chauffeurs
532. 0.9 1 43-4161 Human Resources Assistants, Except Payroll and Timekeep-
ing
533. 0.9 29-2011 Medical and Clinical Laboratory Technologists
534. 0.9 47-2171 Reinforcing Iron and Rebar Workers
535. 0.9 47-2181 Roofers
536. 0.9 53-7021 Crane and Tower Operators
537. 0.9 53-6041 Traffic Technicians
538. 0.9 53-6051 Transportation Inspectors
539. 0.9 51-4062 Patternmakers, Metal and Plastic
540. 0.9 51-9195 Molders, Shapers, and Casters, Except Metal and Plastic
541. 0.9 13-2021 Appraisers and Assessors of Real Estate
542. 0.9 53-7072 Pump Operators, Except Wellhead Pumpers
543. 0.9 49-9097 Signal and Track Switch Repairers
544. 0.91 39-3012 Gaming and Sports Book Writers and Runners
545. 0.91 49-9063 Musical Instrument Repairers and Tuners
546. 0.91 39-7011 Tour Guides and Escorts
547. 0.91 49-9011 Mechanical Door Repairers
548. 0.91 51-3091 Food and Tobacco Roasting, Baking, and Drying Machine Op-
erators and Tenders
549. 0.91 53-7071 Gas Compressor and Gas Pumping Station Operators
550. 0.91 29-2071 Medical Records and Health Information Technicians
551. 0.91 51-9121 Coating, Painting, and Spraying Machine Setters, Operators,
and Tenders
552. 0.91 51-4081 Multiple Machine Tool Setters, Operators, and Tenders, Metal
and Plastic
553. 0.91 53-4013 Rail Yard Engineers, Dinkey Operators, and Hostlers
554. 0.91 49-2093 Electrical and Electronics Installers and Repairers, Trans-
portation Equipment
555. 0.91 35-9011 Dining Room and Cafeteria Attendants and Bartender
Helpers
556. 0.91 51-4191 Heat Treating Equipment Setters, Operators, and Tenders,
Metal and Plastic
557. 0.91 19-4041 Geological and Petroleum Technicians
558. 0.91 49-3021 Automotive Body and Related Repairers
559. 0.91 51-7032 Patternmakers, Wood
560. 0.91 51-4021 Extruding and Drawing Machine Setters, Operators, and Ten-
ders, Metal and Plastic
561. 0.92 43-9071 Office Machine Operators, Except Computer
562. 0.92 29-2052 Pharmacy Technicians
563. 0.92 43-4131 Loan Interviewers and Clerks
564. 0.92 53-7031 Dredge Operators
565. 0.92 41-3021 Insurance Sales Agents
566. 0.92 51-7011 Cabinetmakers and Bench Carpenters
567. 0.92 51-9123 Painting, Coating, and Decorating Workers
568. 0.92 47-4031 Fence Erectors
569. 0.92 51-4193 Plating and Coating Machine Setters, Operators, and Tenders,
Metal and Plastic
570. 0.92 41-2031 Retail Salespersons
73
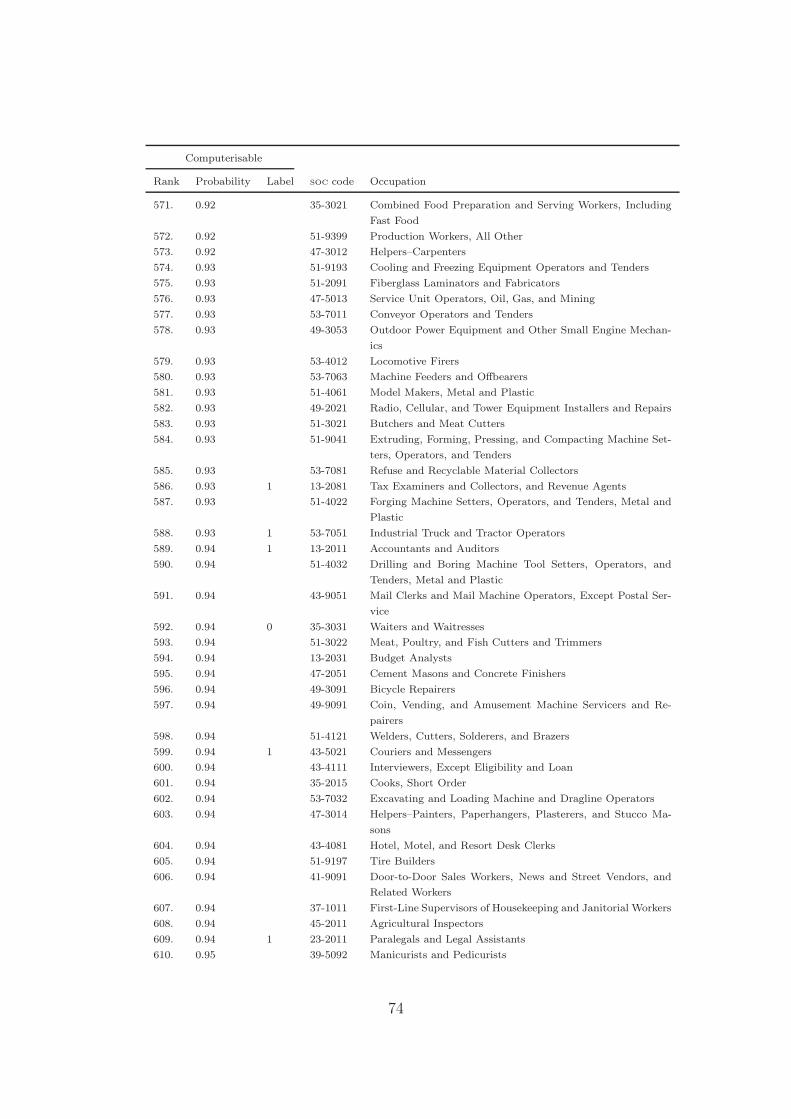
Computerisable
Rank Probability Label soc code Occupation
571. 0.92 35-3021 Combined Food Preparation and Serving Workers, Including
Fast Food
572. 0.92 51-9399 Production Workers, All Other
573. 0.92 47-3012 Helpers–Carpenters
574. 0.93 51-9193 Cooling and Freezing Equipment Operators and Tenders
575. 0.93 51-2091 Fiberglass Laminators and Fabricators
576. 0.93 47-5013 Service Unit Operators, Oil, Gas, and Mining
577. 0.93 53-7011 Conveyor Operators and Tenders
578. 0.93 49-3053 Outdoor Power Equipment and Other Small Engine Mechan-
ics
579. 0.93 53-4012 Locomotive Firers
580. 0.93 53-7063 Machine Feeders and Offbearers
581. 0.93 51-4061 Model Makers, Metal and Plastic
582. 0.93 49-2021 Radio, Cellular, and Tower Equipment Installers and Repairs
583. 0.93 51-3021 Butchers and Meat Cutters
584. 0.93 51-9041 Extruding, Forming, Pressing, and Compacting Machine Set-
ters, Operators, and Tenders
585. 0.93 53-7081 Refuse and Recyclable Material Collectors
586. 0.93 1 13-2081 Tax Examiners and Collectors, and Revenue Agents
587. 0.93 51-4022 Forging Machine Setters, Operators, and Tenders, Metal and
Plastic
588. 0.93 1 53-7051 Industrial Truck and Tractor Operators
589. 0.94 1 13-2011 Accountants and Auditors
590. 0.94 51-4032 Drilling and Boring Machine Tool Setters, Operators, and
Tenders, Metal and Plastic
591. 0.94 43-9051 Mail Clerks and Mail Machine Operators, Except Postal Ser-
vice
592. 0.94 0 35-3031 Waiters and Waitresses
593. 0.94 51-3022 Meat, Poultry, and Fish Cutters and Trimmers
594. 0.94 13-2031 Budget Analysts
595. 0.94 47-2051 Cement Masons and Concrete Finishers
596. 0.94 49-3091 Bicycle Repairers
597. 0.94 49-9091 Coin, Vending, and Amusement Machine Servicers and Re-
pairers
598. 0.94 51-4121 Welders, Cutters, Solderers, and Brazers
599. 0.94 1 43-5021 Couriers and Messengers
600. 0.94 43-4111 Interviewers, Except Eligibility and Loan
601. 0.94 35-2015 Cooks, Short Order
602. 0.94 53-7032 Excavating and Loading Machine and Dragline Operators
603. 0.94 47-3014 Helpers–Painters, Paperhangers, Plasterers, and Stucco Ma-
sons
604. 0.94 43-4081 Hotel, Motel, and Resort Desk Clerks
605. 0.94 51-9197 Tire Builders
606. 0.94 41-9091 Door-to-Door Sales Workers, News and Street Vendors, and
Related Workers
607. 0.94 37-1011 First-Line Supervisors of Housekeeping and Janitorial Workers
608. 0.94 45-2011 Agricultural Inspectors
609. 0.94 1 23-2011 Paralegals and Legal Assistants
610. 0.95 39-5092 Manicurists and Pedicurists
74
Computerisable
Rank Probability Label soc code Occupation
611. 0.95 43-5111 Weighers, Measurers, Checkers, and Samplers, Recordkeeping
612. 0.95 51-6062 Textile Cutting Machine Setters, Operators, and Tenders
613. 0.95 43-3011 Bill and Account Collectors
614. 0.95 51-8011 Nuclear Power Reactor Operators
615. 0.95 33-9031 Gaming Surveillance Officers and Gaming Investigators
616. 0.95 43-4121 Library Assistants, Clerical
617. 0.95 47-2073 Operating Engineers and Other Construction Equipment Op-
erators
618. 0.95 51-5113 Print Binding and Finishing Workers
619. 0.95 45-2021 Animal Breeders
620. 0.95 51-4072 Molding, Coremaking, and Casting Machine Setters, Opera-
tors, and Tenders, Metal and Plastic
621. 0.95 1 51-2022 Electrical and Electronic Equipment Assemblers
622. 0.95 51-9191 Adhesive Bonding Machine Operators and Tenders
623. 0.95 37-3011 Landscaping and Groundskeeping Workers
624. 0.95 51-4033 Grinding, Lapping, Polishing, and Buffing Machine Tool Set-
ters, Operators, and Tenders, Metal and Plastic
625. 0.95 43-5051 Postal Service Clerks
626. 0.95 51-9071 Jewelers and Precious Stone and Metal Workers
627. 0.96 43-5032 Dispatchers, Except Police, Fire, and Ambulance
628. 0.96 43-4171 Receptionists and Information Clerks
629. 0.96 43-9061 Office Clerks, General
630. 0.96 11-3111 Compensation and Benefits Managers
631. 0.96 1 43-2011 Switchboard Operators, Including Answering Service
632. 0.96 35-3022 Counter Attendants, Cafeteria, Food Concession, and Coffee
Shop
633. 0.96 47-5051 Rock Splitters, Quarry
634. 0.96 43-6014 Secretaries and Administrative Assistants, Except Legal, Med-
ical, and Executive
635. 0.96 17-3031 Surveying and Mapping Technicians
636. 0.96 51-7031 Model Makers, Wood
637. 0.96 51-6064 Textile Winding, Twisting, and Drawing Out Machine Setters,
Operators, and Tenders
638. 0.96 53-4011 Locomotive Engineers
639. 0.96 1 39-3011 Gaming Dealers
640. 0.96 49-9093 Fabric Menders, Except Garment
641. 0.96 35-2014 Cooks, Restaurant
642. 0.96 39-3031 Ushers, Lobby Attendants, and Ticket Takers
643. 0.96 43-3021 Billing and Posting Clerks
644. 0.97 53-6011 Bridge and Lock Tenders
645. 0.97 51-7042 Woodworking Machine Setters, Operators, and Tenders, Ex-
cept Sawing
646. 0.97 51-2092 Team Assemblers
647. 0.97 51-6042 Shoe Machine Operators and Tenders
648. 0.97 51-2023 Electromechanical Equipment Assemblers
649. 0.97 1 13-1074 Farm Labor Contractors
650. 0.97 51-6061 Textile Bleaching and Dyeing Machine Operators and Tenders
651. 0.97 51-9081 Dental Laboratory Technicians
652. 0.97 51-9021 Crushing, Grinding, and Polishing Machine Setters, Opera-
tors, and Tenders
75
Computerisable
Rank Probability Label soc code Occupation
653. 0.97 51-9022 Grinding and Polishing Workers, Hand
654. 0.97 37-3012 Pesticide Handlers, Sprayers, and Applicators, Vegetation
655. 0.97 45-4023 Log Graders and Scalers
656. 0.97 51-9083 Ophthalmic Laboratory Technicians
657. 0.97 1 41-2011 Cashiers
658. 0.97 49-9061 Camera and Photographic Equipment Repairers
659. 0.97 39-3021 Motion Picture Projectionists
660. 0.97 51-5111 Prepress Technicians and Workers
661. 0.97 41-2021 Counter and Rental Clerks
662. 0.97 1 43-4071 File Clerks
663. 0.97 41-9021 Real Estate Brokers
664. 0.97 43-2021 Telephone Operators
665. 0.97 19-4011 Agricultural and Food Science Technicians
666. 0.97 43-3051 Payroll and Timekeeping Clerks
667. 0.97 1 43-4041 Credit Authorizers, Checkers, and Clerks
668. 0.97 35-9031 Hosts and Hostesses, Restaurant, Lounge, and Coffee Shop
669. 0.98 41-9012 Models
670. 0.98 51-9061 Inspectors, Testers, Sorters, Samplers, and Weighers
671. 0.98 43-3031 Bookkeeping, Accounting, and Auditing Clerks
672. 0.98 43-6012 Legal Secretaries
673. 0.98 27-4013 Radio Operators
674. 0.98 53-3031 Driver/Sales Workers
675. 0.98 1 13-1031 Claims Adjusters, Examiners, and Investigators
676. 0.98 41-2022 Parts Salespersons
677. 0.98 1 13-2041 Credit Analysts
678. 0.98 51-4035 Milling and Planing Machine Setters, Operators, and Tenders,
Metal and Plastic
679. 0.98 43-5071 Shipping, Receiving, and Traffic Clerks
680. 0.98 43-3061 Procurement Clerks
681. 0.98 51-9111 Packaging and Filling Machine Operators and Tenders
682. 0.98 51-9194 Etchers and Engravers
683. 0.98 43-3071 Tellers
684. 0.98 27-2023 Umpires, Referees, and Other Sports Officials
685. 0.98 13-1032 Insurance Appraisers, Auto Damage
686. 0.98 1 13-2072 Loan Officers
687. 0.98 43-4151 Order Clerks
688. 0.98 43-4011 Brokerage Clerks
689. 0.98 43-9041 Insurance Claims and Policy Processing Clerks
690. 0.98 51-2093 Timing Device Assemblers and Adjusters
691. 0.99 1 43-9021 Data Entry Keyers
692. 0.99 25-4031 Library Technicians
693. 0.99 43-4141 New Accounts Clerks
694. 0.99 51-9151 Photographic Process Workers and Processing Machine Oper-
ators
695. 0.99 13-2082 Tax Preparers
696. 0.99 43-5011 Cargo and Freight Agents
697. 0.99 49-9064 Watch Repairers
698. 0.99 1 13-2053 Insurance Underwriters
699. 0.99 15-2091 Mathematical Technicians
76

Computerisable
Rank Probability Label soc code Occupation
700. 0.99 51-6051 Sewers, Hand
701. 0.99 23-2093 Title Examiners, Abstractors, and Searchers
702. 0.99 41-9041 Telemarketers
77

Oxford Martin Programme on Technology & Employment
DirectorsDr Carl Benedikt Frey, Oxford Martin Citi FellowProfessor Michael Osborne, Associate Professor in Machine Learning
Oxford Martin FellowDr Chinchih Chen
The Oxford Martin Programme on Technology and Employment is part of the Oxford Martin School’s research partnership with Citi. It investigates the implications of a rapidly changing technological landscape for economies and societies. The programme will provide an in-depth understanding of how technology is transforming the economy, to help leaders create a successful transition into new ways of working in the 21st Century.
The programme is providing novel and relevant evidence on: how technology is transforming companies and industries; why some places are better at adapting to this transformation; and related implications for living standards, inequality and social mobility.
This working paper was originally published in September 2013 under the auspices ofthe Oxford Martin Programme on the Impacts of Future Technology.
Oxford Martin Programme on Technology and EmploymentOxford Martin SchoolUniversity of Oxford34 Broad StreetOxford OX1 3BDUnited Kingdom
Tel: +44 (0)1865 272898Email: [email protected]: www.oxfordmartin.ox.ac.uk/research/programmes/tech-employment