Embed Size (px)
Citation preview
Federal Reserve Bank of St. Louis REVIEW March/April 2013 115
The Future of Community Banks: Lessons from Banks That Thrived During the
Recent Financial CrisisR. Alton Gilbert, Andrew P. Meyer, and James W. Fuchs
C ommunity banks play a vital role in the U.S. economy by allocating credit and providingfinancial services in their communities—particularly to the small businesses in thosecommunities. Over the past 30 years, however, the number of charters for all types of
banks has declined. For example, the number of commercial bank charters has shrunk by morethan 50 percent since 1985. (The number of commercial bank branches has also declined, butby a lower percentage.) The recent financial crisis contributed to this decrease in the numberof community bank charters—in part through mergers and in part through bank failures. Infact, 417 banks and thrifts failed from the beginning of 2006 through the end of 2011. Althoughthe pace of bank failures in 2012 was slower than in recent years, an additional 51 banks failedin that year. These events raise questions about the future role of banks in the economy.
The authors study the distinguishing features of community banks that maintained the highest super -visory ratings during the recent financial crisis (2006 to 2011). They identify balance sheet and incomestatement ratios that separate these thriving banks from other community banks and supplement thatanalysis with detailed interview evidence from a sample of thriving banks. They conclude that there is astrong future for well-run community banks and that the banks that prosper will be the ones with strongcommitments to maintaining risk control standards in all economic environments. There is no one-size-fits-all strategy, however, and each bank must develop a business plan that works in its market. (JEL G21, G28)
Federal Reserve Bank of St. Louis Review, March/April 2013, 95(2), pp. 115-43.
R. Alton Gilbert is a visiting scholar and economist emeritus, Andrew P. Meyer is a senior economist, and James W. Fuchs is an assistant vicepresident at the Federal Reserve Bank of St. Louis.
The authors thank William Bassett, Kevin Bertsch, Federal Reserve Board Governors Sarah Bloom Raskin and Elizabeth Duke, James Bullard,Gary Corner, Cletus Coughlin, Ron Feldman, Daigo Gubo, Jeff Gunther, Julia Maués, Gary Palmer, Robin Prager, Ken Spong, Julie Stackhouse,Todd Vermilyea, and members of the Federal Reserve’s Community Bank Research Group and Community Bank Supervision Committee; thestate bank commissioners in the Federal Reserve Eighth District; the Conference of State Bank Supervisors; and the St. Louis Fed’s SupervisoryRisk Committee and the Supervisory Policy and Risk Analysis unit for helpful comments and guidance. The authors extend special thanks tothe bankers who generously participated in the confidential “thriving bank” interviews. Stephen McMorries, Matthew Morris, and Alysha Grayprovided excellent research support.
© 2013, The Federal Reserve Bank of St. Louis. The views expressed in this article are those of the author(s) and do not necessarily reflect theviews of the Federal Reserve System, the Board of Governors, or the regional Federal Reserve Banks. Articles may be reprinted, reproduced,published, distributed, displayed, and transmitted in their entirety if copyright notice, author name(s), and full citation are included. Abstracts,synopses, and other derivative works may be made only with prior written permission of the Federal Reserve Bank of St. Louis.

Given these changes in the banking landscape, one could focus on the decline in the numberof charters, the reasons for recent bank failures, and in general the many reasons certain com-munity banks may not survive over different time horizons. This study takes a different approach:We investigate what can be learned from the operation of banks that maintained strong per-formance in recent years, even in the wake of the financial crisis. The thesis of our article is thatthe community banks that will succeed in the future will likely have characteristics similar tothose of the community banks that performed well during the recent financial crisis and its after-math. The events of recent years can be considered a real-world stress test of the community bankbusiness model. We report on work in progress on interpreting the results of that stress test.
The next section describes our criteria for identifying the banks that performed well duringthe financial crisis and its aftermath, which we define as “thriving banks.” First, we examinevarious characteristics of the thriving banks: the number that met the criteria for classificationas thriving, their asset size, and their location by state. We investigate whether community banksin states with the greatest declines in economic activity in recent years could operate as thrivingbanks. We then compare the characteristics of the thriving banks with other community banks,which we define as “surviving banks.” The surviving banks did not fail in recent years but alsodid not meet the criteria for thriving banks.
We use insights gained from the comparisons of the thriving and surviving banks to guidethe second phase of our analysis. We selected a sample of thriving community banks and askedtheir leaders how their banks were able to maintain strong performance through the financialcrisis and subsequent weak economic recovery. The interviews with leaders of these thrivingbanks indicate that they had maintained a strong commitment to conservative lending principleswhile competitors had relaxed their lending standards. Beyond this common commitment toconservative lending principles, the striking feature of the thriving banks we investigated is theirdiversity: Each appears to have found a business plan that works in its market area, but its busi-ness plan is very different from those of some of the other thriving banks we interviewed.
The diversity among the thriving banks is the basis for the third phase of our analysis, inwhich we examine various facets of that diversity. We then present our conclusions.
THRIVING VERSUS SURVIVING COMMUNITY BANKSWe restrict the asset size of the community banks in our study to those with total assets less
than $10 billion. This restriction is based on a definition of community banking organizationsin the Dodd-Frank Wall Street Reform and Consumer Protection Act of 2010. We also excludefrom our sample banks that were subsidiaries of foreign institutions at any time from 2006through 2011. In addition, we eliminate thrifts, bankers’ banks, industrial loan corporations,and cooperative banks. We eliminate banks chartered after 2001 because performance measuresof de novo banks are often substantially different during their first 5 years from those of banksin operation for longer than 5 years.
Our criterion for strong performance is maintaining the highest supervisory rating, a com-posite CAMELS rating of 1, during the years 2006 through the end of 2011; we refer to this con-dition as “thriving.” (See the boxed insert for a description of the CAMELS rating system.) Wechoose supervisory ratings rather than specific financial ratios as indicators of a bank’s health
Gilbert, Meyer, Fuchs
116 March/April 2013 Federal Reserve Bank of St. Louis REVIEW

because the composite CAMELS rating captures a bank’s overall financial condition plus anassessment of its management. We find that if we had looked at only performance measuressuch as return on assets or return on equity, we would have excluded many banks that did, infact, thrive: Many banks with the highest supervisory rating endured the turbulence of recentyears by implementing business plans that were successful but that did not yield relatively highmeasures of profitability.
As noted earlier, all other institutions that did not fail that fall outside these parameters areclassified as “surviving banks” for the purposes of our analysis. We acknowledge, however, thatmany banks that did not meet our criterion for thriving banks are in sound financial condition.
We limit the banks identified as thriving banks to those with CAMELS ratings of 1 for tworeasons. First, because our goal is to identify all community banks in the nation that meet ourstandard for thriving banks, we want to limit the number of banks in our sample. Second, somebanks with a CAMELS rating of 2 (generally considered to be safe and sound) could be approach-ing a downgrade to a CAMELS rating of 3. We want to exclude from the category of thrivingany banks that may have been on this margin of being downgraded to a CAMELS rating of 3. Inthe appendix, we show that the main results of this article are not particularly sensitive to alter-native definitions of “thriving.”
The period for our analysis, 2006 through 2011, requires explanation. The prices of residen-tial real estate in the United States were highest in 2006 and, as such, provide a proxy for thepeak of bank performance. We then follow bank performance from this peak to a time we believerepresents “end of cycle conditions”—that is, 2011.
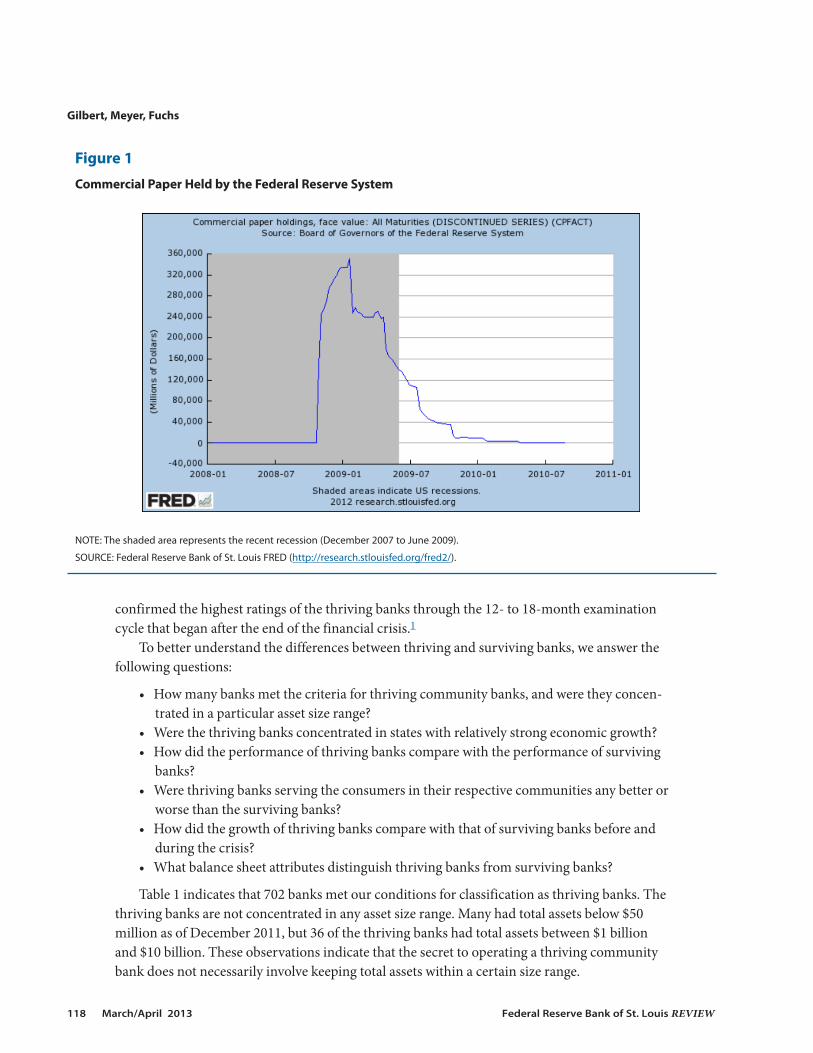
One way to identify the end of the cycle is to examine the timing of the extraordinary actionstaken by the Federal Reserve to deal with disruptions in the operations of financial markets. Wefocus on the timing of Federal Reserve lending operations to support the commercial papermarket. The terms under which the Federal Reserve purchased commercial paper provided anincentive for firms to seek other sources of funds when the commercial paper market began tofunction again as a source of credit (Anderson and Gascon, 2009). Figure 1 indicates that theamount of commercial paper held by the Federal Reserve peaked in early 2009 and was close tozero by early 2010. In addition, the number of banks on the Federal Deposit Insurance Corpora -tion’s “problem bank” list peaked at 888 in 2011:Q1, up from a total of 50 banks in 2006. Observ -ing CAMELS ratings through the end of 2011 allows us to determine whether supervisors
Gilbert, Meyer, Fuchs
Federal Reserve Bank of St. Louis REVIEW March/April 2013 117
CAMELS Ratings
Bank safety and soundness examinations focus on six areas: capital protection (C), asset quality (A), manage-ment competence (M), earnings strength (E), liquidity risk exposure (L), and market risk sensitivity (S).Examiners assign a grade of 1 (best) through 5 (worst) to each component. In addition, they assign a com-posite CAMELS rating, which is also expressed on a scale of 1 through 5. Banks with composite ratings of1 and 2 are considered to exhibit “strong” and “satisfactory” performances, respectively. Banks that fall belowa rating of 2 may prompt supervisory action, which could include a board resolution, a memorandum ofunderstanding, a written agreement, or a cease and desist order. Hence, regulators consider a drop from arating of 2 to a rating of 3 to be a significant change. A more detailed description can be found at http://www.fedpartnership.gov/bank-life-cycle/topic-index/bank-rating-system.cfm.
confirmed the highest ratings of the thriving banks through the 12- to 18-month examinationcycle that began after the end of the financial crisis.1
To better understand the differences between thriving and surviving banks, we answer thefollowing questions:
• How many banks met the criteria for thriving community banks, and were they concen-trated in a particular asset size range?
• Were the thriving banks concentrated in states with relatively strong economic growth?• How did the performance of thriving banks compare with the performance of surviving
banks?• Were thriving banks serving the consumers in their respective communities any better or
worse than the surviving banks?• How did the growth of thriving banks compare with that of surviving banks before and
during the crisis?• What balance sheet attributes distinguish thriving banks from surviving banks?
Table 1 indicates that 702 banks met our conditions for classification as thriving banks. Thethriving banks are not concentrated in any asset size range. Many had total assets below $50million as of December 2011, but 36 of the thriving banks had total assets between $1 billionand $10 billion. These observations indicate that the secret to operating a thriving communitybank does not necessarily involve keeping total assets within a certain size range.
Gilbert, Meyer, Fuchs
118 March/April 2013 Federal Reserve Bank of St. Louis REVIEW
Figure 1
Commercial Paper Held by the Federal Reserve System
NOTE: The shaded area represents the recent recession (December 2007 to June 2009).
SOURCE: Federal Reserve Bank of St. Louis FRED (http://research.stlouisfed.org/fred2/).
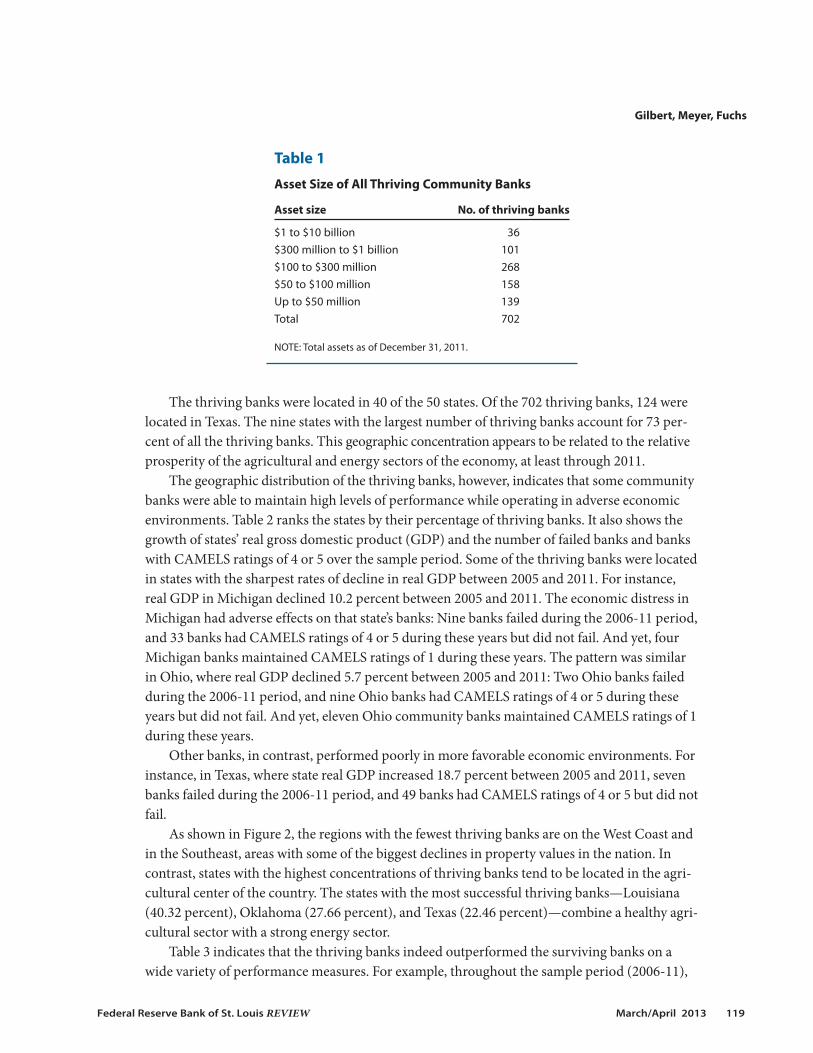
The thriving banks were located in 40 of the 50 states. Of the 702 thriving banks, 124 werelocated in Texas. The nine states with the largest number of thriving banks account for 73 per-cent of all the thriving banks. This geographic concentration appears to be related to the relativeprosperity of the agricultural and energy sectors of the economy, at least through 2011.
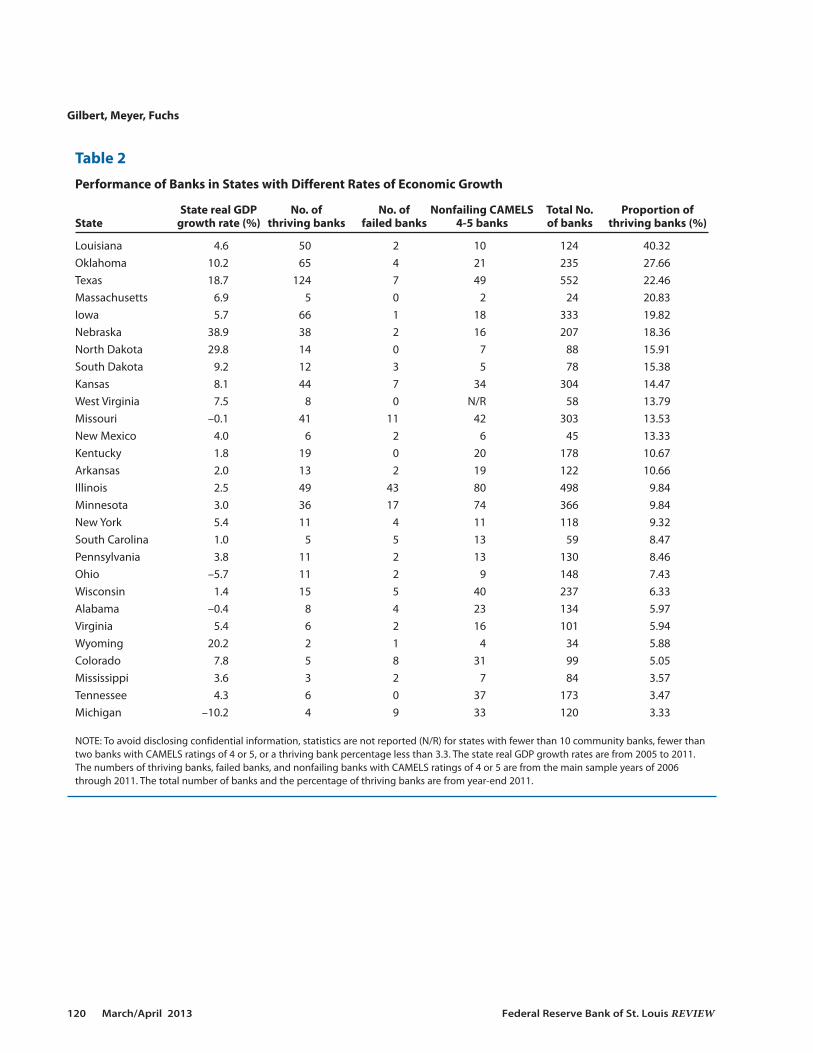
The geographic distribution of the thriving banks, however, indicates that some communitybanks were able to maintain high levels of performance while operating in adverse economicenvironments. Table 2 ranks the states by their percentage of thriving banks. It also shows thegrowth of states’ real gross domestic product (GDP) and the number of failed banks and bankswith CAMELS ratings of 4 or 5 over the sample period. Some of the thriving banks were locatedin states with the sharpest rates of decline in real GDP between 2005 and 2011. For instance,real GDP in Michigan declined 10.2 percent between 2005 and 2011. The economic distress inMichigan had adverse effects on that state’s banks: Nine banks failed during the 2006-11 period,and 33 banks had CAMELS ratings of 4 or 5 during these years but did not fail. And yet, fourMichigan banks maintained CAMELS ratings of 1 during these years. The pattern was similarin Ohio, where real GDP declined 5.7 percent between 2005 and 2011: Two Ohio banks failedduring the 2006-11 period, and nine Ohio banks had CAMELS ratings of 4 or 5 during theseyears but did not fail. And yet, eleven Ohio community banks maintained CAMELS ratings of 1during these years.
Other banks, in contrast, performed poorly in more favorable economic environments. Forinstance, in Texas, where state real GDP increased 18.7 percent between 2005 and 2011, sevenbanks failed during the 2006-11 period, and 49 banks had CAMELS ratings of 4 or 5 but did notfail.
As shown in Figure 2, the regions with the fewest thriving banks are on the West Coast andin the Southeast, areas with some of the biggest declines in property values in the nation. Incontrast, states with the highest concentrations of thriving banks tend to be located in the agri-cultural center of the country. The states with the most successful thriving banks—Louisiana(40.32 percent), Oklahoma (27.66 percent), and Texas (22.46 percent)—combine a healthy agri-cultural sector with a strong energy sector.
Table 3 indicates that the thriving banks indeed outperformed the surviving banks on awide variety of performance measures. For example, throughout the sample period (2006-11),
Gilbert, Meyer, Fuchs
Federal Reserve Bank of St. Louis REVIEW March/April 2013 119
Table 1
Asset Size of All Thriving Community Banks
Asset size No. of thriving banks
$1 to $10 billion 36$300 million to $1 billion 101$100 to $300 million 268$50 to $100 million 158Up to $50 million 139 Total 702
NOTE: Total assets as of December 31, 2011.
Gilbert, Meyer, Fuchs
120 March/April 2013 Federal Reserve Bank of St. Louis REVIEW
Table 2
Performance of Banks in States with Different Rates of Economic Growth
State real GDP No. of No. of Nonfailing CAMELS Total No. Proportion of State growth rate (%) thriving banks failed banks 4-5 banks of banks thriving banks (%)
Louisiana 4.6 50 2 10 124 40.32Oklahoma 10.2 65 4 21 235 27.66Texas 18.7 124 7 49 552 22.46Massachusetts 6.9 5 0 2 24 20.83Iowa 5.7 66 1 18 333 19.82Nebraska 38.9 38 2 16 207 18.36North Dakota 29.8 14 0 7 88 15.91South Dakota 9.2 12 3 5 78 15.38Kansas 8.1 44 7 34 304 14.47West Virginia 7.5 8 0 N/R 58 13.79Missouri –0.1 41 11 42 303 13.53New Mexico 4.0 6 2 6 45 13.33Kentucky 1.8 19 0 20 178 10.67Arkansas 2.0 13 2 19 122 10.66Illinois 2.5 49 43 80 498 9.84Minnesota 3.0 36 17 74 366 9.84New York 5.4 11 4 11 118 9.32South Carolina 1.0 5 5 13 59 8.47Pennsylvania 3.8 11 2 13 130 8.46Ohio –5.7 11 2 9 148 7.43Wisconsin 1.4 15 5 40 237 6.33Alabama –0.4 8 4 23 134 5.97Virginia 5.4 6 2 16 101 5.94Wyoming 20.2 2 1 4 34 5.88Colorado 7.8 5 8 31 99 5.05Mississippi 3.6 3 2 7 84 3.57Tennessee 4.3 6 0 37 173 3.47Michigan –10.2 4 9 33 120 3.33
NOTE: To avoid disclosing confidential information, statistics are not reported (N/R) for states with fewer than 10 community banks, fewer thantwo banks with CAMELS ratings of 4 or 5, or a thriving bank percentage less than 3.3. The state real GDP growth rates are from 2005 to 2011.The numbers of thriving banks, failed banks, and nonfailing banks with CAMELS ratings of 4 or 5 are from the main sample years of 2006through 2011. The total number of banks and the percentage of thriving banks are from year-end 2011.

Gilbert, Meyer, Fuchs
Federal Reserve Bank of St. Louis REVIEW March/April 2013 121
0-3.3 10-205-103.3-5 20-30 40-50
Thriving Bank Percentage
Figure 2
Percentage of Banks in Each State That Satisfy the Thriving Bank Criteria
NOTE: See the final column of Table 2 for the exact percentages for each state with a thriving bank percentage over 3.3 percent. States withfewer than 10 community banks are excluded (Alaska, District of Columbia, Hawaii, Maine, New Hampshire, Rhode Island, and Vermont).
SOURCE: Authors’ calculations based on call reports and supervisory structure and ratings data.
Table 3
Performance Ratio Means for Thriving Versus Surviving Banks
Thriving banks Surviving banks Attribute (N = 702) (N = 4,525)
ROA 1.5% 0.8%ROE 12.7 7.3Loan losses/Total loans 0.1 0.5Provision expense/Average assets 0.1 0.4Efficiency ratio 61.1 71.8NIM 3.7 3.7NNIM 1.9 2.3
NOTE: Data are for U.S. community banks with less than $10 billion in assets. All differences are statistically significant atthe 1 percent level. NIM, net interest margin; NNIM, net non-interest margin; ROA, return on assets; ROE, return on equity.

the mean return on assets for thriving banks was 1.5 percent, compared with only 0.8 percentfor surviving banks. Thriving banks also managed a higher return on equity to their shareholders(12.7 percent versus 7.3 percent). And, as the table shows, the mean for thriving banks in thesample was better than the corresponding mean for surviving banks for every other performancemeasure in the table. We conclude from the data in this table that these banks are thriving inmore ways than maintaining high safety-and-soundness ratings.
One question that arises is whether certain banks were able to thrive by putting more empha-sis on profits than the needs of their customers. For example, a bank might limit lending inlow-income neighborhoods in its market area, choose not to offer products appropriate to itslow-income customers, engage in deceptive advertising or incomplete disclosures for its loanproducts, or discriminate against certain customers on the basis of race, gender, age, or otherprohibited factors. These practices, however, would result in adverse Community ReinvestmentAct (CRA) ratings and consumer compliance ratings. For each bank, we identified the worstrating for both types of consumer examinations during the sample period of 2006 through 2011.Table 4 shows the percentage of thriving and surviving banks that received less-than-satisfactoryratings. Only 0.73 percent of thriving banks had less-than-satisfactory CRA ratings comparedwith 1.68 percent for surviving banks. For consumer compliance examination ratings, the cor-responding numbers were 4.29 percent versus 15.87 percent. Thus, we find no evidence that thethriving banks were any worse than the surviving banks in the treatment of potential customersin their communities.
Another difference between the thriving and the surviving banks can be found in the growthrates shown in Table 5. In the period leading up to the crisis (the beginning of 2004 to the endof 2007), asset growth in the surviving banks was considerably higher than in the thriving banks(44.28 percent versus 23.58 percent). Once the crisis hit, however, surviving bank growth plum-meted to 26.91 percent while thriving bank growth actually increased to 31.16 percent. For total
Gilbert, Meyer, Fuchs
122 March/April 2013 Federal Reserve Bank of St. Louis REVIEW
Table 4
Ratings from CRA and Consumer Compliance Exams During the Crisis
Ratings Thriving banks Surviving banks
CRA 3 or worse 0.73% 1.68%Compliance 3 or worse 4.29 15.87
NOTE: Differences are statistically significant at the 1 percent level.
Table 5
Growth Rates of Thriving and Surviving Banks Before and During the Crisis
Asset growth Loan growth
Type of bank 2004-07 2008-11 2004-07 2008-11
Thriving 23.58% 31.16% 31.06% 19.68%Surviving 44.28 26.91 66.04 18.67
loans, the pre-crisis difference was even more stark (66.04 percent for surviving banks versus31.06 percent for thriving banks). Once the crisis hit, loan growth for the surviving banks felldramatically to 18.67 percent while loan growth for the thriving banks fell moderately to 19.68percent. This pattern is consistent with our interview evidence (presented later in this article)that the thriving banks exercised a comparatively conservative growth strategy during good timesand were able to capitalize on the mistakes of their competitors during bad times. The pattern isalso consistent with the findings of Kiser, Prager, and Scott (2012) that small banks with ratingsdowngrades from 2007-10 had significantly lower rates of growth in small loans to businessesthan banks that maintained healthy ratings.
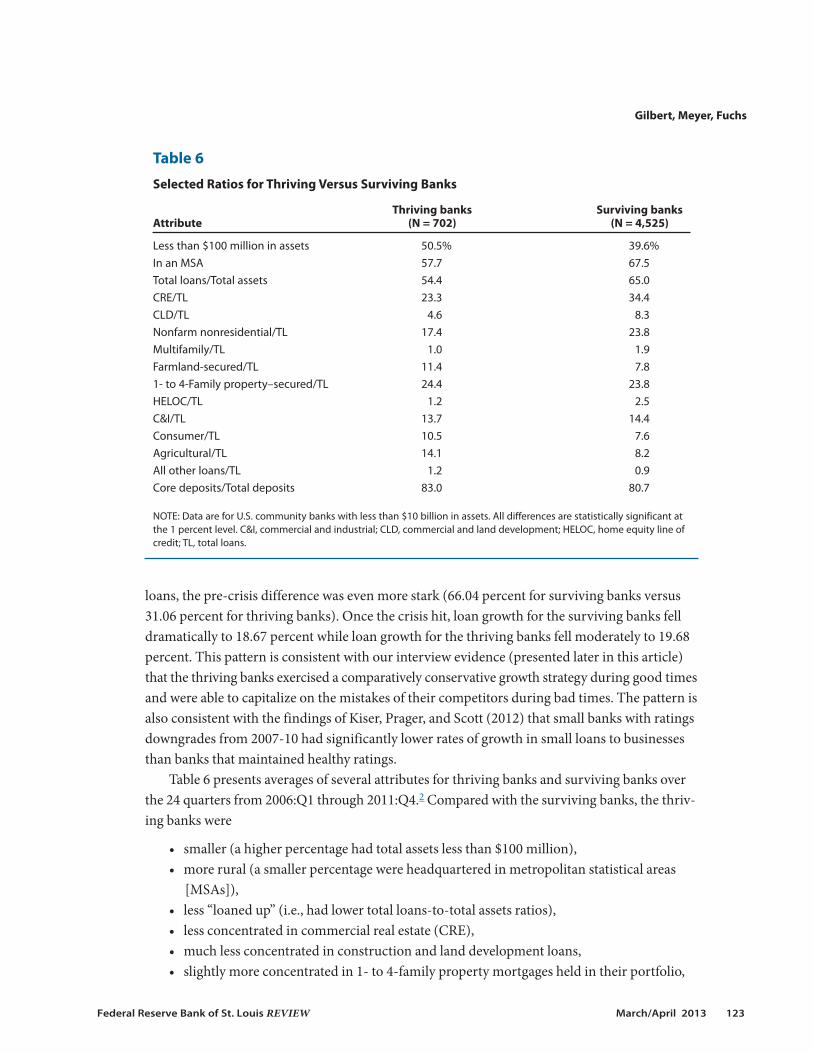
Table 6 presents averages of several attributes for thriving banks and surviving banks overthe 24 quarters from 2006:Q1 through 2011:Q4.2 Compared with the surviving banks, the thriv-ing banks were
• smaller (a higher percentage had total assets less than $100 million),• more rural (a smaller percentage were headquartered in metropolitan statistical areas
[MSAs]),• less “loaned up” (i.e., had lower total loans-to-total assets ratios),• less concentrated in commercial real estate (CRE),• much less concentrated in construction and land development loans,• slightly more concentrated in 1- to 4-family property mortgages held in their portfolio,
Gilbert, Meyer, Fuchs
Federal Reserve Bank of St. Louis REVIEW March/April 2013 123
Table 6
Selected Ratios for Thriving Versus Surviving Banks
Thriving banks Surviving banks Attribute (N = 702) (N = 4,525)
Less than $100 million in assets 50.5% 39.6%In an MSA 57.7 67.5Total loans/Total assets 54.4 65.0CRE/TL 23.3 34.4CLD/TL 4.6 8.3Nonfarm nonresidential/TL 17.4 23.8Multifamily/TL 1.0 1.9Farmland-secured/TL 11.4 7.81- to 4-Family property–secured/TL 24.4 23.8HELOC/TL 1.2 2.5C&I/TL 13.7 14.4Consumer/TL 10.5 7.6Agricultural/TL 14.1 8.2All other loans/TL 1.2 0.9Core deposits/Total deposits 83.0 80.7
NOTE: Data are for U.S. community banks with less than $10 billion in assets. All differences are statistically significant atthe 1 percent level. C&I, commercial and industrial; CLD, commercial and land development; HELOC, home equity line ofcredit; TL, total loans.

• slightly less concentrated in commercial and industrial loans, • more concentrated in consumer loans,• more concentrated in agricultural loans, and• more reliant on core deposits.
One reason the thriving banks were less likely than the surviving banks to be headquarteredin an MSA is the good performance of agricultural loans during our sample period. There is noguarantee that the good performance of agricultural loans will continue in the future. To limitthe influence of agricultural loans on the comparisons between thriving and surviving banks,Table 7 examines the differences between the attributes in Table 6 separately for urban commu-nity banks and rural community banks not classified as “agricultural” banks. The nonagriculturalrural thriving banks and rural surviving banks in Table 7 had ratios of agricultural loans to totalloans less than 25 percent. (Banks with ratios of agricultural loans to total loans of 25 percent orhigher are identified as agricultural banks.)
As shown in Table 7, the patterns within these demographic classes are remarkably similarto the results in Table 6. That is, among urban banks as a group and among nonagricultural ruralbanks as a separate group, the same factors tend to lead to better long-term health.
The results in Table 7 also indicate that, compared with the thriving urban banks, the thriv-ing rural banks were
Gilbert, Meyer, Fuchs
124 March/April 2013 Federal Reserve Bank of St. Louis REVIEW
Table 7
Selected Ratios for Thriving Versus Surviving Banks
U.S. nonagricultural U.S. urban banks rural banks
Thriving banks Surviving banks Thriving banks Surviving banks Attribute (N = 408) (N = 3,047) (N = 115) (N = 764)
Less than $100 million in assets 40.8% 31.7% 47.2% 43.9%Total loans/Total assets 55.2 66.3 52.3 62.6CRE/TL 28.8 39.8 24.3 31.4CLD/TL 6.3 10.0 3.7 7.0Nonfarm nonresidential/TL 20.9 27.0 19.3 22.8Multifamily/TL 1.3 2.4 0.7 1.2Farmland-secured/TL 8.5 5.4 7.2 5.71- to 4-Family property–secured/TL 25.9 24.0 33.9 30.9HELOC/TL 1.8 3.1 0.7 1.9C&I/TL 14.4 14.6 13.2 14.2Consumer/TL 10.0 6.8 14.1 10.8Agricultural/TL 9.1 5.1 5.0 3.7All other loans/TL 1.2 0.8 1.0 1.1Core deposits/Total deposits 83.5 80.4 81.5 79.7
NOTE: Data are for U.S. urban and nonagricultural rural banks with less than $10 billion in assets. All differences except “Allother loans/TL” are statistically significant at the 1 percent level. C&I, commercial and industrial; CLD, commercial and landdevelopment; HELOC, home equity line of credit; TL, total loans.

• smaller,• less “loaned up,”• less concentrated in CRE,• more concentrated in consumer loans, but• similarly reliant on core deposits.
The same differences hold between urban surviving banks and rural surviving banks.Of course, a large part of good performance stems from measures of management quality
and the local economic condition of the communities in which banks provide their services,both of which are difficult to quantify. To provide insight into these complex measures amongbanks, we studied examination reports for a sample of thriving banks and found several recur-ring themes. In general, thriving banks
• had a strong and localized customer service focus with high community visibility,• operated in a thriving (i.e., growing) community,• practiced forward-looking risk management with an eye toward long-term bank
performance,• demonstrated balance between growth objectives and risk level, and• had patient and conservative ownership operating with the belief that returns on invest-
ment should be attractive but not necessarily spectacular.
For the factors examined, the differences between thriving and surviving banks have provenremarkably robust to the various definitions and sample splits.3 The results in Tables 6 and 7indicate that the composition of balance sheets, including relatively low ratios of loans to assetsand relatively high reliance on core deposits, affects the performance of banks. Comments inexamination reports indicate that thriving banks benefit from strong communities and com-munity relationships, conservative underwriting, and good product structure.
INSIGHTS FROM INTERVIEWS WITH LEADERS OF THRIVING BANKS In this second phase of our study, we use our findings from the statistical analysis of thriving
and surviving banks and descriptions of thriving banks in examination reports to develop sur-vey questions. Specifically, we ask senior bank management about the reasons for their bank’ssuccess. In addition, we compare our experience with the experiences of other researchers whohave interviewed successful community bankers to investigate the reasons for their success.Researchers can gain insight into the determinants of bank success by interviewing leaders ofcommunity banks with consistently good performance.
Study by the Federal Reserve Bank of Kansas City
Myers and Spong (2003) conducted telephone interviews with the leaders (generally thepresidents) of ten high-performing community banks in communities with relatively slow eco-nomic growth located within the Kansas City Federal Reserve District. They studied a variety ofbanks, from small banks with total assets as low as $15 million to banks with established networksof branches in surrounding areas that had grown to between $100 million and $200 million in
Gilbert, Meyer, Fuchs
Federal Reserve Bank of St. Louis REVIEW March/April 2013 125

total assets. Myers and Spong’s (2003) focus is somewhat different from ours: They investigatedthe factors that helped community banks thrive in slow-growing communities, whereas we focuson the factors that helped community banks thrive during a severe financial crisis and economicrecession.
Myers and Spong (2003) identify slower-growing market areas as counties with growth inper capita personal income in the lowest quartile of all counties in Kansas City Federal ReserveDistrict states from 1990 to 2000. Most of these slower-growth counties were located in ruralareas, especially areas far from larger cities or more scenic amenities. The authors identify thehigh-performing community banks in these slower-growth counties as those with average returnson equity from 1999 to 2001 in the highest quartile of all banks in Kansas City District states.
Myers and Spong (2003) conducted telephone interviews with a senior officer at each high-performing bank to derive insights into the keys to their success beyond those they could derivefrom financial statements and examination reports. The senior officers emphasized customerservice as a key to their success. They maintained customer loyalty by keeping fees low. Officersat each of the 10 banks stressed asset quality as a key principle in their business plans and, inmany cases, the most important factor in their success. Many of the leaders also cited efficientoperations as a key to their success. Some bankers stressed the importance of using technologyto keep operating costs low.
Study by the Federal Reserve Bank of Richmond
Brastow et al. (2012) conducted interviews with the leaders of nine state member banks inthe Richmond Federal Reserve District to investigate how their banks remained in good finan-cial condition during the recent financial crisis. The focus of their study is very similar to ours.They identified “healthy banks” as those with CAMELS ratings of 1 or 2 in 2007:Q2 that main-tained ratings of 1 or 2 through 2010:Q1. They chose supervisory ratings rather than specificfinancial ratios as indicators of healthy banks because the composite CAMELS rating captures abank’s overall financial condition plus an assessment of its management. All institutions inter-viewed were community banks, but their total assets for 2010:Q3 ranged from about $150 mil-lion to almost $4 billion, with a mean of $1.5 billion.
Brastow et al. (2012) emphasize the following points in their summary of the interviews.
• Commitment to conservative lending principles. Perhaps the most widely reported charac-teristic of the healthy bank sample was that significant time and resources were devotedto monitoring credit quality. The CEOs generally attributed their low levels of delinquentloans to detailed and careful underwriting and credit administration.
• Presence of veteran senior management, coupled with a supportive and engaged board ofdirectors.
• Emphasis on relationship banking based on detailed knowledge of their markets and cus-tomers. The healthy banks appeared to have a good understanding of the behavior oftheir customers, their customers’ businesses, and their local markets. In contrast, thehealthy banks were reluctant to participate in markets or offer products they did notunderstand.
• Detailed underwriting and credit policies. Some of the healthy banks had relatively highconcentrations in CRE lending but avoided the problems of other banks with high con-
Gilbert, Meyer, Fuchs
126 March/April 2013 Federal Reserve Bank of St. Louis REVIEW
centrations of their loans in this category through detailed underwriting and creditadministration policies.
Interviews by the Federal Reserve Bank of St. Louis
This section summarizes common themes revealed in our telephone interviews with leadersof a sample of thriving banks; the interview period began in April and ran through July of 2012.Table 8 lists the questions used as a guide for our conversations with leaders of 28 thriving banks.Table 9 shows the asset size ranges of the 28 banks. Table 10 lists the 19 states in which bankshad their headquarters.
A common theme among several respondents was that their bank’s good performance wasdue more to actions taken before the recent financial crisis than to any actions taken during thecrisis. For example, the thriving banks did not vary from the policies and procedures establishedyears earlier, even as other banks were seeking higher returns based on inflated asset values.Some bankers were quite candid in attributing part of their success to being in the right place atthe right time. In some cases, banks benefited from booming farmland, commodity, or energyprices. Most bankers insisted, however, that in their underwriting they did not assume that highland and commodity prices would last forever.
The following summarizes the common themes among thriving community banks through -out the nation.Conservative Lending Principles.All bankers emphasized conservative lending principles
as a key to their success. A common theme in the interviews was that thriving banks were doingthe things they understood. Most thriving banks interviewed limited their lending or otheractivities to their own communities. All bankers emphasized avoiding opportunities for whichthey did not have expertise. Some bankers mentioned losing business to competitors before therecent financial crisis because competitors were relaxing their lending standards. Several bankersmentioned maintaining minimum down payment percentages for loans while competitors werecutting down payments required of their borrowers. This emphasis on conservative lendingprinciples is not surprising given that respondents were talking to staff members of a bank super-visory agency. The supervisory ratings of these banks and their general performance duringrecent years, however, are consistent with an emphasis on conservative lending principles.
Some bankers mentioned the work of their loan committees in maintaining high lendingstandards. One banker mentioned that the bank does its own underwriting of credit risk ratherthan relying on credit scores in making lending decisions. Another banker said that the bankidentifies loans that are past due for five days or more and acts quickly to deal with problems ofdelinquent loans. The conservative lending principles for this bank include dealing with problemsquickly. Most bankers interviewed also discussed the importance of learning from loans theyultimately had to charge off. One bank in particular required its lenders to review all charged-offloans, reassess the fundamentals of the loan at the time it was made, and communicate withmanagement whether they would still make that loan today based on those fundamentals.
Not surprisingly, these conservative principles led to low levels of nonperforming loans andloan losses relative to peer levels. Despite this good performance, many of these thriving banksmaintained a high allowance for loan and lease losses (ALLL), in some cases several times theamount of their nonperforming assets. Several bankers mentioned they maintained the bank’sALLL at the highest defensible level to provide maximum cushion for unanticipated loan losses.
Gilbert, Meyer, Fuchs
Federal Reserve Bank of St. Louis REVIEW March/April 2013 127

Gilbert, Meyer, Fuchs
128 March/April 2013 Federal Reserve Bank of St. Louis REVIEW
Table 8
Questions Asked of the Leaders of Thriving Banks During Telephone Interviews
1. How were you able to keep up your good performance during the crisis?
2. What was the greatest obstacle that you had to overcome?
3. Do you plan to do anything differently as the economy improves?
4. How competitive do you perceive your local banking market to be, and what kinds of businesses do you see as your main competitors?
5. How much weight do you put on local (or regional or national) economic conditions when making a loan decision?
6. Given the demographics and other market conditions in your community, do you place a higher value on growing your bank or on maintaining stability?
7. How has your management or ownership structure helped or hurt you during the downturn?
8. What risks do you see on the horizon?
9. What opportunities do you see on the horizon?
Table 9
Asset Size of Banks Interviewed
Asset size No. of thriving banks
$1 to $10 billion 2$300 million to $1 billion 6$100 to $300 million 10$50 to $100 million 5Up to $50 million 5Total 28
NOTE: Total assets as of December 31, 2011.
Table 10
Location of the Headquarters of the ThrivingBanks Interviewed
No. of thriving banksState interviewed
Arkansas 1Colorado 1Illinois 1Indiana 1Iowa 1Kansas 3Kentucky 2Louisiana 1Michigan 1Minnesota 1Missouri 2Nebraska 1New York 1Oklahoma 2Oregon 1South Dakota 1Tennessee 1Texas 5Wisconsin 1Total 28
Another “conservative” lending principle many bankers practiced either intentionally orserendipitously was avoiding the purchase of preferred shares of Fannie Mae and Freddie Mac.When these two government-sponsored enterprises were taken into government conservator-ship in the fall of 2008, the prices of their preferred shares fell to fractions of the prices manybanks had paid for them. Many small- and medium-sized banks bought these shares as a per-ceived safe haven investment in the face of severe stress in the financial markets. The Importance of Management and Staff. In the interviews, the leaders of the thriving
banks often emphasized their management teams. Some bankers focus on attracting staff fromthe geographic areas they serve, so their staff will know the communities they serve and will beknown by the bank’s customers. Some of the thriving banks have been managed by members ofthe same family for several generations and benefit from this depth of experience and stabilityin senior management. As well, this family-based structure may include a strong incentive tolimit risk so the bank can be passed on to the next generation.
Another common theme among leaders of thriving banks was the importance of the “softskills” of their staff. Several bankers went so far as to suggest that they would hire someone withgreat interpersonal skills over someone with a strong banking background and poor interper-sonal skills. Many bankers also mentioned an attempt to gauge the character of job candidatesand identified potential employees based on their experiences and interactions with them whilethey were working in other industry sectors in their communities.
Most leaders of thriving banks mentioned the importance of all staff members staying activein their communities. They discussed how the relationships built by their employees’ communityservice efforts outside the bank increase bank business by creating relationships based on trustand serving community needs. One banker said his bank does not offer some services becauseof concern about how those services could affect their reputation in the community. Specifically,the bank does not offer (i) home equity loans because such loans may cause financial trouble forsome customers who use this option and (ii) overdraft protection for transactions accountswith high fees for nonsufficient funds.Ownership Structure and Boards of Directors.Most thriving community banks were
C corporations, although some were S corporations.4 A common statement among managementat thriving banks was that bank shareholders should be involved in the operation of the bank asstaff or as customers and board members. Most thriving institutions were closely held, andrespondents believed that the balance between management and the board was crucial. Manybankers stated their appreciation for board member involvement in helping to increase bankbusiness and holding management accountable. They also discussed the importance of havingboard members who know that their task is not to “run the bank.” Ownership of the shares ofone bank involves an employee stock ownership plan. In addition, modest expectations bydirectors and shareholders for return on their shares in the bank are important for ensuring thatthe incentives of bank staff are skewed in the direction of limiting risk, thereby avoiding actionsto reach for yield by moving into areas outside a bank’s core expertise.Distinct Business Plans of the Thriving Banks. The telephone interviews helped us under-
stand the business plans that made it possible for individual banks to succeed in their markets.The banks interviewed are substantially different from each other, and these differences extendbeyond asset size. This following text highlights some of these differences.
Gilbert, Meyer, Fuchs
Federal Reserve Bank of St. Louis REVIEW March/April 2013 129

Operating Expense Ratios. Some of the thriving banks had relatively high ratios of operatingexpense to total assets, whereas others had relatively low operating expense ratios. The leader ofone bank explained that it had relatively high ratios of operating expense to total assets becausethe bank emphasizes customer service. In 2011 the operating expense ratio of this bank was inthe top 10 percent among its peer banks, but the ratio of pretax operating income to total assetsof this bank was in the top 30 percent among its peers.5 Other banks had relatively high operat-ing expense ratios because they incurred part of their operating expense by generating relativelyhigh non-interest income.
Other banks had relatively low operating expense ratios compared with their peers. Somebankers emphasized limited investment in their facilities, including fewer offices than somecompetitors in their market areas. Several bankers mentioned a focus on using technology toserve customers and control costs.
Non-Interest Income. The telephone interviews provided information about the sources ofnon-interest income of some of the thriving banks that we could not have learned from theirfinancial statements. The following list provides examples of sources of non-interest incomethat substantially boost the earnings of some of the thriving banks interviewed.
• One banker told us that his bank derives substantial non-interest income by offeringaccounts receivable services to businesses in its geographic area. The non-interest incomeof this bank in 2011 was about 1 percent of its average assets, placing it in the top 10 per-cent among its peer banks.
• A bank with less than $50 million in total assets as of December 2011 derives substantialnon-interest income by originating and selling loans. Non-interest income of this bankin 2011 was over 2 percent of its average assets, placing it in the top 3 percent among itspeer banks.
• A bank with less than $100 million in total assets earns substantial non-interest incomeby offering trust services and counting the currency for a local casino. The ratio of non-interest income to total assets for this bank in 2011 was over 1.3 percent of its averageassets, placing it among the top 4 percent among its peer banks.
• One community bank generates non-interest income in the form of fees earned by pro-viding temporary financing for residential mortgage loans originated by brokers locatedthroughout the nation. This bank earned non-interest income in 2011 that was about 3percent of its average assets, placing it in the top 3 percent among its peer banks.
Table 6 indicates that the thriving banks as a group have higher ratios of core deposits tototal deposits than the surviving banks. Banks tend to pay lower interest rates on core depositsthan other types of deposits. Several, but not all, of the thriving banks had relatively low ratiosof interest expense to total assets. One banker said that the interest expense of his bank reflectedthe local population of senior citizens, who carefully monitor certificate of deposit rate alterna-tives. This bank offers relatively high interest rates on certificates of deposit to retain these cus-tomers’ business. In contrast, the banks with relatively low interest expense ratios tend to havedeposit liabilities concentrated in demand deposits and money market accounts.
Some of the thriving banks had relatively high concentrations of their assets in CRE, a cate-gory of lending that created serious problems at other banks.6 These thriving banks maintained
Gilbert, Meyer, Fuchs
130 March/April 2013 Federal Reserve Bank of St. Louis REVIEW

good performance through strong risk controls and thus avoided the serious problems associatedwith CRE lending risk that plagued other banks with weaker controls. One leader of such a banksaid that they pursue “structured and disciplined credit policies” in their lending decisions. The“trick” to CRE lending at one of the thriving banks was summarized as follows: CRE lendingshould be limited to local (i.e., in-market), owner-occupied properties. Table 6 indicates, however,that the thriving banks as a group had lower exposure to CRE loans than the surviving banks.
Capital ratios varied substantially among the thriving banks. One thriving bank had a Tier1 leverage ratio of about 25 percent in 2011. In contrast, another bank had a Tier 1 capital-to-total assets ratio near the bottom of the distribution among its peer banks. This second bank,however, had a supervisory rating of 1 on the capital component of its composite CAMELS ratingbecause it had assumed little risk; about 45 percent of the bank’s assets were invested in Treasuryand agency securities.
Comparison of Interviews of the Thriving Banks with the Kansas City and RichmondFed Studies
Many comments in the section on our telephone conversations with thriving banks aresimilar to the conclusions of the two other Fed studies. One exception involves the observationby the staff of the Kansas City Fed that the banks that performed well in slow-growth countieshad relatively low operating costs. This statement is true for some, but not all, of the thrivingbanks we interviewed. The business plans of some of the thriving banks involve relatively highoperating costs, which they incur by providing enhanced service for their customers or payingthe expenses incurred in providing services that generate non-interest income.
Our telephone interviews with the leaders of thriving banks confirm a conclusion of theRichmond Fed study: Through detailed underwriting and credit administration policies, somehealthy banks were able to specialize in CRE lending and yet avoided the large losses of otherbanks that specialized in this category of lending.
Implications for Analysis of Operations of All Thriving Banks
Interviews with the leaders of the sample of thriving banks provide insight into their busi-ness plans. The interviews indicate that community banks can thrive with a wide variety of busi-ness plans. For this reason, our analysis of the performance of all of the thriving banks in thenation focuses on their diversity, rather than on a search for a unique formula for operating asuccessful community bank. The good news for the community bank model is that many com-munity banks retained the highest supervisory rating during recent years while operating ingeographic areas where other community banks became problem banks or failed.
EVIDENCE OF DIVERSITY AMONG ALL THRIVING BANKSWhile our telephone interviews provide valuable insight into the operations of a small num-
ber of the thriving banks, this section presents information based on the performance of all 702thriving banks in the nation (the third phase of our study). We examined the operating charac-teristics of these thriving banks relative to their peers in the Uniform Bank Performance Report
Gilbert, Meyer, Fuchs
Federal Reserve Bank of St. Louis REVIEW March/April 2013 131

(UBPR).7 Table 11A provides the criteria for assigning banks to the peer groups in the UBPR.The remaining sections of Table 11 present the percentages of thriving banks in each peer groupthat were in the lowest and highest quartiles among their peer banks in 2011 for various operat-ing characteristics.
Table 11B indicates that a relatively high ratio of interest income to total assets is not one ofthe characteristics that distinguish the thriving banks from their peers. About 36 percent of thethriving banks were in the lowest quarter of the distributions among peers in 2011, whereas onlyabout 16 percent were in the highest quarter of the distributions. In all 15 peer groups, the per-centage of thriving banks in the lowest 25 percent of each group is higher than the percentage inthe top 25 percent of each group. That is, differences in asset size, locations in rural or urbanareas, or number of offices do not alter the conclusion. The results in Table 11B are consistentwith the finding in Table 6 that, on average, the thriving banks had lower ratios of loans to assetsthan the surviving banks. Because the interest rates on bank loans tend to be higher than theyields on other bank assets, lower ratios of loans to assets tend to be associated with lower ratiosof interest income to total assets.
Many of the thriving banks also have relatively low ratios of interest expense to total assets:Table 11C indicates that 42 percent of the thriving banks were in the lowest quarter of the dis-
Gilbert, Meyer, Fuchs
132 March/April 2013 Federal Reserve Bank of St. Louis REVIEW
Diversity in Operating Characteristics Among the Thriving Banks
Table 11A
Criteria for Assigning Banks to Peer Groups in the UBPR
Offices in urban Peer group no. Total assets or rural areas No. of offices
1 More than $3 billion Either Any 2 $1 to $3 billion Either Any 3 $300 million to $1 billion Either Any 4 $100 to $300 million Urban 3 or more5 $100 to $300 million Rural 3 or more6 $100 to $300 million Urban 2 or fewer7 $100 to $300 million Rural 2 or fewer8 $50 to $100 million Urban 3 or more9 $50 to $100 million Rural 3 or more10 $50 to $100 million Urban 2 or fewer11 $50 to $100 million Rural 2 or fewer12 Up to $50 million Urban 2 or more13 Up to $50 million Rural 2 or more14 Up to $50 million Urban 115 Up to $50 million Rural 1
NOTE: This table presents information about the distribution of thriving banks among their peers in the UBPR in 2011:Q4,based on various operating characteristics. The following tables for each operating characteristic present the number ofthriving banks and the percentage of these banks in the top 25 percent and the lowest 25 percent of the distributionamong peer banks.

Gilbert, Meyer, Fuchs
Federal Reserve Bank of St. Louis REVIEW March/April 2013 133
Table 11B
Interest Income Divided by Total Assets
No. of Percentage of Percentage of Peer group No. thriving banks thriving banks thriving banks from UBPR in peer group in lowest 25 percent in top 25 percent
1 7 28.57 14.292 28 42.86 21.433 102 29.41 16.674 46 26.09 21.745 120 39.17 16.676 27 51.85 11.117 72 34.72 9.728 10 30.00 0.009 24 33.33 16.6710 31 41.94 12.9011 93 35.48 19.3512 7 42.86 28.5713 24 37.50 12.5014 30 40.00 26.6715 81 35.80 14.81Total 702 35.90 16.38
Table 11C
Interest Expense Divided by Total Assets
No. of Percentage of Percentage of Peer group No. thriving banks thriving banks thriving banks from UBPR in peer group in lowest 25 percent in top 25 percent
1 7 42.86 14.292 28 42.86 7.143 102 46.08 8.824 46 39.13 13.045 120 43.33 10.836 27 66.67 3.707 72 41.67 6.948 10 40.00 0.009 24 45.83 8.3310 31 45.16 19.3511 93 41.94 8.6012 7 28.57 14.2913 24 54.17 4.1714 30 36.67 13.3315 81 29.63 22.22Total 702 42.45 10.97

Gilbert, Meyer, Fuchs
134 March/April 2013 Federal Reserve Bank of St. Louis REVIEW
Table 11D
Non-Interest Income Divided by Total Assets
No. of Percentage of Percentage of Peer group No. thriving banks thriving banks thriving banks from UBPR in peer group in lowest 25 percent in top 25 percent
1 7 14.29 57.142 28 10.71 28.573 102 6.86 33.334 46 15.22 21.745 120 15.00 30.836 27 14.81 29.637 72 22.22 23.618 10 20.00 20.009 24 20.83 29.1710 31 12.90 22.5811 93 27.96 29.0312 7 28.57 0.0013 24 16.67 33.3314 30 16.67 33.3315 81 35.80 17.28Total 702 18.95 27.49
Table 11E
Non-Interest Expense Divided by Total Assets
No. of Percentage of Percentage of Peer group No. thriving banks thriving banks thriving banks from UBPR in peer group in lowest 25 percent in top 25 percent
1 7 57.14 14.292 28 39.29 14.293 102 38.24 15.694 46 52.17 6.525 120 41.67 10.836 27 55.56 7.417 72 36.11 15.288 10 70.00 0.009 24 33.33 8.3310 31 70.97 6.4511 93 41.94 10.7512 7 85.71 0.0013 24 50.00 8.3314 30 40.00 13.3315 81 55.56 6.17Total 702 45.58 10.68

Gilbert, Meyer, Fuchs
Federal Reserve Bank of St. Louis REVIEW March/April 2013 135
Table 11F
Income before Taxes and Extraordinary Items Divided by Total Assets
No. of Percentage of Percentage of Peer group No. thriving banks thriving banks thriving banks from UBPR in peer group in lowest 25 percent in top 25 percent
1 7 0.00 85.712 28 3.57 53.573 102 0.00 62.754 46 0.00 76.095 120 0.83 50.836 27 0.00 66.677 72 8.33 43.068 10 0.00 70.009 24 4.17 58.3310 31 0.00 58.0611 93 7.53 40.8612 7 0.00 57.1413 24 0.00 54.1714 30 6.67 46.6715 81 9.88 43.21Total 702 3.70 53.13
Table 11G
Tier 1 Leverage Ratio
No. of Percentage of Percentage of Peer group No. thriving banks thriving banks thriving banks from UBPR in peer group in lowest 25 percent in top 25 percent
1 7 57.14 14.292 28 28.57 17.863 102 17.65 38.244 46 8.70 30.435 120 17.50 40.836 27 7.41 40.747 72 26.39 34.728 10 20.00 50.009 24 16.67 45.8310 31 12.90 58.0611 93 21.51 38.7112 7 28.57 57.1413 24 20.83 41.6714 30 13.33 36.6715 81 13.58 44.44Total 702 18.23 39.17

tributions. In contrast, 11 percent of the thriving banks were in the highest quarter of the distri-butions for this ratio.
Our telephone interviews indicated the importance of non-interest income for some thriv-ing banks. Table 11D, however, indicates that overall, the ratios of non-interest income to totalassets for thriving banks are similar to those of their peers: 27 percent in the highest quarter and19 percent in the lowest quarter.
Table 11E illustrates the importance of relatively low operating expense for a majority of thethriving banks: Overall, the ratio of non-interest expense to total assets was in the lowest quarterof the distribution for 46 percent of thriving banks. And yet, this ratio was in the highest quarterof the distribution for 11 percent of thriving banks, illustrating the diversity among the thrivingbanks. In each of the 15 peer groups, however, the percentage of thriving banks with non-interestexpense ratios in the lowest 25 percent among peer banks is higher than the percentage in thetop 25 percent. Overall, relatively low operating expense is a general characteristic of most ofthe thriving banks across asset size and urban or rural location.
Thriving banks tended to have higher ratios of income before taxes and extraordinary itemsdivided by total assets than their peers. We use pretax income as the measure of profitabilitybecause some of the thriving banks are organized as subchapter S corporations (income tax paidby owners, not the banks), whereas others are not.8 Table 11F indicates that 53 percent of thethriving banks had ratios of pretax income to total assets in the highest quarter of the distribu-tions; this measure of profitability was in the lowest quarter for only 4 percent of the thrivingbanks. This pattern of high ratios of pretax income to total assets holds for thriving banks ineach of the 15 peer groups.
The thriving banks tended to have higher capital ratios than their peers, but there is sub-stantial diversity among the thriving banks with regard to capital ratios. Table 11G indicatesthat 39 percent of thriving banks had Tier 1 leverage ratios in the highest quarter of the distri-butions, but 18 percent of the thriving banks had ratios in the lowest quarter of the distributions.The information from the telephone interviews indicates that the thriving banks with relativelylow Tier 1 leverage ratios tended to assume relatively low credit risk.
Many of the thriving banks had relatively high concentrations in CRE. Because of concernthat the loans of many banks were becoming too concentrated in CRE, the federal bank super-visory agencies issued guidelines in December 2006 for concentrations in this area of lending.9Under these guidelines, banks were flagged for special attention if commercial real estate loansexceeded 300 percent of risk-based capital or construction and land development loans exceeded100 percent of risk-based capital.
Of the 702 thriving banks, 16 percent had concentrations in CRE that exceeded the federalsupervisory guidelines at some point during the 2006:Q1–2011:Q4 period. Nevertheless, thesebanks maintained composite CAMELS ratings of 1 throughout this period. These observationsindicate that the thriving banks as a group did not avoid the problems of other banks throughrelatively low exposures to CRE. Instead, these thriving banks were able to successfully managethe risks inherent in CRE lending.
We focus more closely on 39 of the thriving banks that exceeded one or both of these guide-lines by 50 percent or more in at least one quarter during the 2006:Q1–2011:Q4 period. That is,for these banks CRE loans exceeded 450 percent of risk-based capital or construction and landdevelopment loans exceeded 150 percent of risk-based capital.
Gilbert, Meyer, Fuchs
136 March/April 2013 Federal Reserve Bank of St. Louis REVIEW
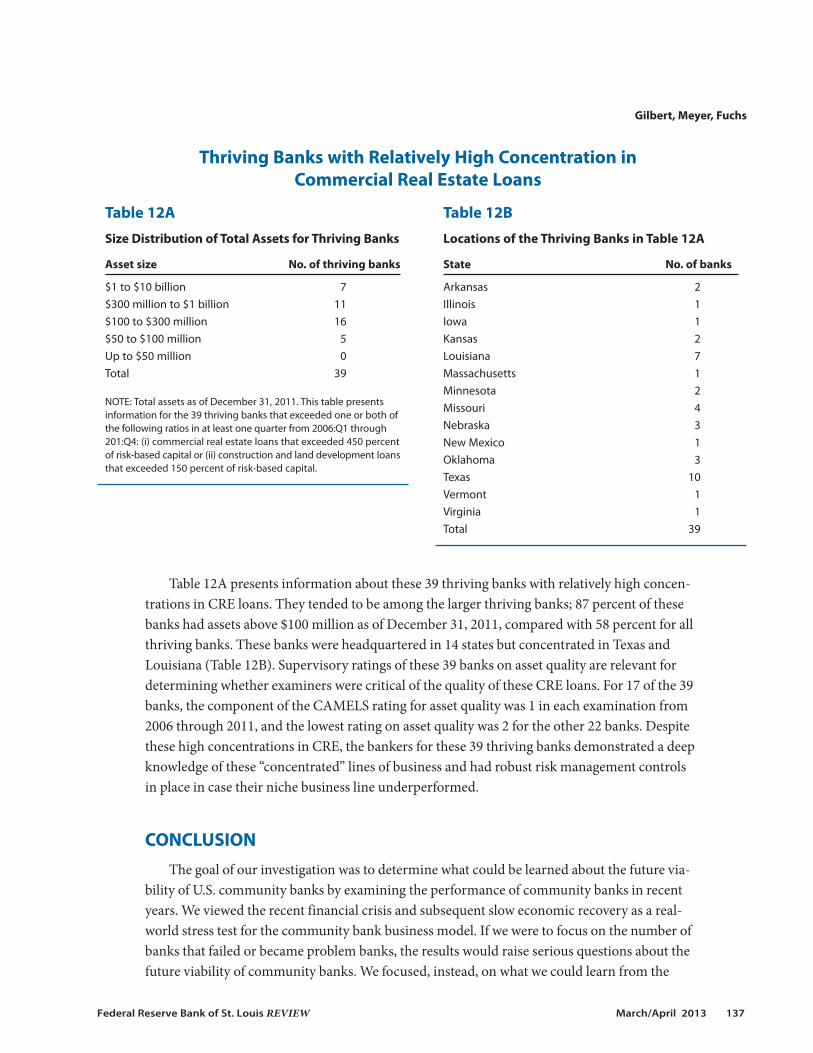
Table 12A presents information about these 39 thriving banks with relatively high concen-trations in CRE loans. They tended to be among the larger thriving banks; 87 percent of thesebanks had assets above $100 million as of December 31, 2011, compared with 58 percent for allthriving banks. These banks were headquartered in 14 states but concentrated in Texas andLouisiana (Table 12B). Supervisory ratings of these 39 banks on asset quality are relevant fordetermining whether examiners were critical of the quality of these CRE loans. For 17 of the 39banks, the component of the CAMELS rating for asset quality was 1 in each examination from2006 through 2011, and the lowest rating on asset quality was 2 for the other 22 banks. Despitethese high concentrations in CRE, the bankers for these 39 thriving banks demonstrated a deepknowledge of these “concentrated” lines of business and had robust risk management controlsin place in case their niche business line underperformed.
CONCLUSIONThe goal of our investigation was to determine what could be learned about the future via-
bility of U.S. community banks by examining the performance of community banks in recentyears. We viewed the recent financial crisis and subsequent slow economic recovery as a real-world stress test for the community bank business model. If we were to focus on the number ofbanks that failed or became problem banks, the results would raise serious questions about thefuture viability of community banks. We focused, instead, on what we could learn from the
Gilbert, Meyer, Fuchs
Federal Reserve Bank of St. Louis REVIEW March/April 2013 137
Thriving Banks with Relatively High Concentration in Commercial Real Estate Loans
Table 12A
Size Distribution of Total Assets for Thriving Banks
Asset size No. of thriving banks
$1 to $10 billion 7$300 million to $1 billion 11$100 to $300 million 16$50 to $100 million 5Up to $50 million 0Total 39
NOTE: Total assets as of December 31, 2011. This table presentsinformation for the 39 thriving banks that exceeded one or both ofthe following ratios in at least one quarter from 2006:Q1 through201:Q4: (i) commercial real estate loans that exceeded 450 percentof risk-based capital or (ii) construction and land development loansthat exceeded 150 percent of risk-based capital.
Table 12B
Locations of the Thriving Banks in Table 12A
State No. of banks
Arkansas 2Illinois 1Iowa 1Kansas 2Louisiana 7Massachusetts 1Minnesota 2Missouri 4Nebraska 3New Mexico 1Oklahoma 3Texas 10Vermont 1Virginia 1Total 39

experience of community banks that performed well during recent years. The results of thisinvestigation offer insights into the nature of the business plans that allowed many communitybanks to remain successful during a financial crisis and major recession.
We identified thriving community banks as those in organizations with total assets lessthan $10 billion that maintained the highest supervisory rating (a composite CAMELS rating of1) for the years 2006 through 2011. In the first phase of our analysis, we examined the size andgeographic distribution of the 702 banks that met these criteria and investigated the character-istics that distinguished the thriving banks from surviving banks (the community banks thatdid not fail or merge out of existence during these years but did not qualify as thriving banks).In the second phase of our project, we used our findings from the comparisons of thriving andsurviving banks to design a plan for interviewing leaders of a sample of the thriving banks. Weconducted telephone interviews with leaders of 28 of the thriving banks to ask about the keys totheir success. In the third phase, we used insights into the business plans of the thriving banksinterviewed to examine various thriving bank characteristics, including interest income, inter-est expense, operating income, capital ratios, and CRE concentrations.
Our analysis implies there is a role for community banks in our nation’s financial system inthe future. The community banks that prosper in the future will have characteristics similar tothose of the thriving banks interviewed: strong commitments to maintaining standards for riskcontrol in all economic environments and business plans that work for their individual markets.
We recognize, however, that the results of our analysis are shaped by the economic environ-ment of our sample period: 2006 through 2011. The characteristics of banks that meet the criteriafor thriving banks would tend to be somewhat different if the analysis covered other years. Forexample, during our sample period, a concentration in agricultural lending had a statisticallysignificant impact on whether a bank was a thriving bank. Given the increases in land prices andagricultural product prices in recent years, a positive association between agricultural lendingand community bank performance is not surprising. If we were to conduct this study with datafrom the 1980s, however, we would tend to observe the opposite case: Concentrations in agri-cultural lending were sources of weakness. Also, given the poor performance of banks with highconcentrations of CRE during the recent financial crisis (a source of strength for communitybanks before 2006), it is important to view our results in the context of the period used for thisstudy. In addition, a more forward-looking analysis of the future of community banking in theUnited States would take into account many additional factors, particularly the cost of regulatorycompliance under the Basel III international capital accords and under the Dodd-Frank Actwhen fully implemented.
Gilbert, Meyer, Fuchs
138 March/April 2013 Federal Reserve Bank of St. Louis REVIEW
NOTES1 The date for the end of the financial crisis would be slightly different if we focused on the Term Asset-BackedSecurities Loan Facility (TALF) rather than the Commercial Paper Funding Facility. Through the TALF, the FederalReserve extended credit to investors in highly rated asset-backed securities and commercial mortgage-backed secu-rities. The TALF opened in March 2009 and closed on June 30, 2010. If we dated the end of the financial crisis as June30, 2010, the period from that date until the end of 2011 would cover the 18-month cycle for bank examinations.
2 For the attribute “Less than $100 million in assets” in Tables 6 and 7, we first calculate the percentage of the 24 quar-ters that each individual bank had total assets less than $100 million and then calculate the mean of these percent-ages separately for both the thriving banks and the surviving banks. This method of creating the observations allowsfor patterns in which the total assets of a bank rise above or fall below the threshold of $100 million during the 24-quarter period. We use the same method to calculate the percentages of thriving and surviving banks located in anMSA. This method allows for situations in which the headquarters of a bank moved into or out of an MSA during the24-quarter period. The other attributes in Tables 6 and 7 are ratios derived from balance sheets. We use the samemethod to average the financial ratios for each bank over the 24-quarter period.
3 See the appendix for a detailed discussion of several alternative definitions for thriving and surviving banks.
4 Laws vary by state, but in general, an S corporation passes its taxable income or loss directly through to shareholders,whereas a C corporation pays taxes on the corporate income directly. There are upper limits to the asset size andnumber of shareholders for banks wishing to organize as an S corporation.
5 Peer banks in these comparisons are those in the peer groups of the Uniform Bank Performance Report (UBPR)described in Table 11A.
6 One of the banks interviewed that had a relatively high concentration of loans in CRE is not included in the analysisof all thriving banks in the nation because it was chartered in 2003. We decided to exclude from the analysis all com-munity banks chartered after 2001 because the operating characteristics of de novo banks tend to be different fromthose of banks that have operated for longer periods of time. If we had included the bank chartered in 2003 in theanalysis of all thriving banks, it would have been included in Tables 12A and 12B as one of the thriving banks withrelatively high concentrations of their assets in CRE loans.
7 For more information on the UBPR, see http://www.ffiec.gov/ubpr.htm.
8 See Gilbert and Wheelock (2007) for information on how organization as subchapter S corporations affects banks’after-tax profits.
9 These guidelines can be found at http://www.federalreserve.gov/boarddocs/srletters/2007/SR0701a2.pdf.
REFERENCESAnderson, Richard G. and Gascon, Charles C. “The Commercial Paper Market, the Fed, and the 2007-2009 FinancialCrisis.” Federal Reserve Bank of St. Louis Review, November/December 2009, 91(6), pp. 589-612;http://research.stlouisfed.org/publications/review/09/11/Anderson.pdf.
Brastow, Ray; Carpenter, Bob; Maxey, Susan and Riddle, Mike. “Weathering the Storm: A Case Study of Healthy FifthDistrict State Member Banks Over the Recent Downturn.” Federal Reserve Bank of Richmond S&R PerspectivesNewsletter, Summer 2012; http://www.richmondfed.org/banking/supervision_and_regulation/newsletter/2012/summer/article3.cfm.
Gilbert, R. Alton and Wheelock, David C. “Measuring Commercial Bank Profitability: Proceed with Caution.” FederalReserve Bank of St. Louis Review, November/December 2007, 89(6), pp. 515-32; http://research.stlouisfed.org/publications/review/07/11/Gilbert.pdf.
Kiser, Elizabeth K.; Prager, Robin A. and Scott, Jason R. “Supervisor Ratings and the Contraction of Bank Lending toSmall Businesses.” Finance and Economics Discussion Series No. 2012-59, Division of Research & Statistics andMonetary Affairs, Board of Governors of the Federal Reserve System, August 23, 2012;http://www.federalreserve.gov/pubs/feds/2012/201259/201259pap.pdf.
Myers, Forest and Spong, Kenneth. “Community Bank Performance in Slower Growing Markets: Finding SoundStrategies for Success.” Federal Reserve Bank of Kansas City Financial Industry Perspectives, October 2003, pp. 15-30;http://www.kc.frb.org/publicat/fip/prs03-2.pdf.
Gilbert, Meyer, Fuchs
Federal Reserve Bank of St. Louis REVIEW March/April 2013 139

APPENDIX
Alternative Definitions of “Thriving” and “Surviving”
In this appendix, we explore whether our results are robust to alternative definitions of “thriving” and “surviving.”In particular, one could argue that banks with CAMELS ratings of 2 (2-rated) should not be included with thesurviving banks but considered separately. One could also argue that these classifications should be based onthe probability of failure or the probability of being downgraded to problem status, rather than the CAMELSrating from the previous exam. The tables in this appendix show that the basic results in the article are robustto these alternative specifications.
2-Rated Banks
We define 2-rated banks as banks that fell below a CAMELS rating of 1 (1-rated) at some point between 2006and 2011 but never fell below a rating of 2. As shown in Tables A1 and A2, the 2-rated banks fit nicely betweenthe 1-rated banks and the banks with ratings of 3 or worse. The differences are statistically significant in bothdirections. In effect, by including them in the surviving banks category, we are diluting the sample, making itlook more like the thriving bank sample. If we were to combine the 2-rated banks with the thriving banks, wewould dilute that sample, making it look more like the surviving bank sample. The fact that the results are con-sistent with our specification of thriving banks in the text provides confidence that use of another arbitrarycutoff between thriving and surviving banks would not alter our conclusions.
Probability of Downgrade or Failure
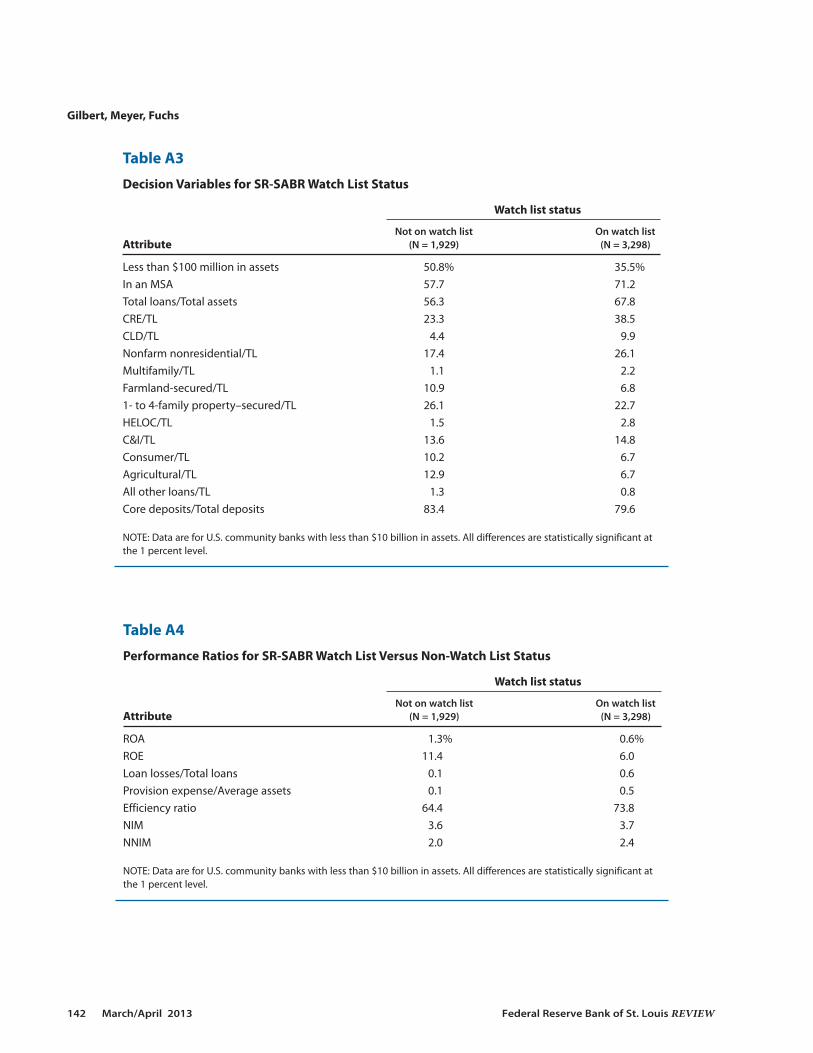
The Federal Reserve System maintains a confidential model called the Supervision and Regulation StatisticalAssessment of Bank Risk (SR-SABR). One part of the model estimates the probability that a given bank will bedowngraded from a CAMELS rating of 1 or 2 to a CAMELS rating of 3, 4, or 5 (i.e., from non-problem status toproblem status). Another part of the model estimates the probability that a given bank will fail within the nexttwo years. A bank with a CAMELS rating of 1 or 2 will be placed on an official “watch list” if its probability ofdowngrade or failure is above a preset threshold for each measure. (Banks with current CAMELS ratings of 3 orworse are automatically on the watch list.) Thus, another natural alternative definition of thriving banks is the group of banks that remained off the watchlist throughout the sample period (i.e., they maintained CAMELS ratings of 1 or 2, with downgrade or failureprobabilities less than the preset thresholds). Tables A3 and A4 show the comparisons for the 1,929 banks thatpassed the watch list criterion. Again, the differences are all in the expected direction and all are statisticallysignificant.
Thriving Banks Versus 2-Rated Banks Not on the Watch List
A final test involves whether 2-rated banks designated as safe by the SR-SABR model should be included amongthe thriving banks. (Recall that our main specification considers a bank thriving if it maintained a CAMELS ratingof 1 throughout the period regardless of its downgrade or failure probabilities.) Tables A5 and A6 comparethese banks with those that slipped to a CAMELS rating of 2 but nevertheless remained off the watch list becauseof their favorable SR-SABR ratings. The tables show that the differences are large enough to justify excludingthe 2-rated banks from the thriving bank definition. As discussed previously, one could justify including themwithout fundamentally altering the conclusions, so the decision is ultimately a judgment call.
Gilbert, Meyer, Fuchs
140 March/April 2013 Federal Reserve Bank of St. Louis REVIEW

Gilbert, Meyer, Fuchs
Federal Reserve Bank of St. Louis REVIEW March/April 2013 141
Table A1
Decision Variables for Three-Way Split of CAMELS Ratings
CAMELS rating
Worse than 1 but No worse than 1 no worse than 2 3 or worse
Attribute (N = 702) (N = 2,560) (N = 1,965)
Less than $100 million in assets 50.5% 43.9% 34.1%In an MSA 57.7 62.5 74.1Total loans/Total assets 54.4 62.6 68.1CRE/TL 23.3 28.3 42.3CLD/TL 4.6 5.9 11.5Nonfarm nonresidential/TL 17.4 20.5 28.0Multifamily/TL 1.0 1.6 2.4Farmland-secured/TL 11.4 9.5 5.71- to 4-family property–secured/TL 24.4 25.4 21.8HELOC/TL 1.2 2.1 3.0C&I/TL 13.7 14.3 14.6Consumer/TL 10.5 8.7 6.0Agricultural/TL 14.1 10.3 5.5All other loans/TL 1.2 1.1 0.7Core deposits/Total deposits 83.0 81.8 79.2
NOTE: Data are for U.S. community banks with less than $10 billion in assets. All differences except “All other loans/TL” arestatistically significant at the 1 percent level. C&I, commercial and industrial; CLD, construction and land development;HELOC, home equity lines of credit; TL, total loans.
Table A2
Performance Ratios for Three-Way Split of CAMELS Ratings
CAMELS rating
Worse than 1 but No worse than 1 no worse than 2 3 or worse
Attribute (N = 702) (N = 2,560) (N = 1,965)
ROA 1.5% 1.1% 0.4%ROE 12.7 10.4 3.2Loan losses/TL 0.1 0.3 0.7Provisions/TL 0.1 0.2 0.6Efficiency ratio 61.1 67.3 77.6NIM 3.7 3.7 3.7NNIM 1.9 2.2 2.5
NOTE: Data are for U.S. community banks with less than $10 billion in assets. All differences are statistically significant atthe 1 percent level. NIM, net interest margin; NNIM, net non-interest margin; ROA, return on assets; ROE, return on equity.
Gilbert, Meyer, Fuchs
142 March/April 2013 Federal Reserve Bank of St. Louis REVIEW
Table A3
Decision Variables for SR-SABR Watch List Status
Watch list status
Not on watch list On watch list Attribute (N = 1,929) (N = 3,298)
Less than $100 million in assets 50.8% 35.5%In an MSA 57.7 71.2Total loans/Total assets 56.3 67.8CRE/TL 23.3 38.5CLD/TL 4.4 9.9Nonfarm nonresidential/TL 17.4 26.1Multifamily/TL 1.1 2.2Farmland-secured/TL 10.9 6.81- to 4-family property–secured/TL 26.1 22.7HELOC/TL 1.5 2.8C&I/TL 13.6 14.8Consumer/TL 10.2 6.7Agricultural/TL 12.9 6.7All other loans/TL 1.3 0.8Core deposits/Total deposits 83.4 79.6
NOTE: Data are for U.S. community banks with less than $10 billion in assets. All differences are statistically significant atthe 1 percent level.
Table A4
Performance Ratios for SR-SABR Watch List Versus Non-Watch List Status
Watch list status
Not on watch list On watch list Attribute (N = 1,929) (N = 3,298)
ROA 1.3% 0.6%ROE 11.4 6.0Loan losses/Total loans 0.1 0.6Provision expense/Average assets 0.1 0.5Efficiency ratio 64.4 73.8NIM 3.6 3.7NNIM 2.0 2.4
NOTE: Data are for U.S. community banks with less than $10 billion in assets. All differences are statistically significant atthe 1 percent level.

Gilbert, Meyer, Fuchs
Federal Reserve Bank of St. Louis REVIEW March/April 2013 143
Table A5
Decision Variables for 1-Rated Banks Versus 2-Rated Banks Not on Watch List
CAMELS rating/watch list status
1 2/Not on watch list Attribute (N = 702) (N = 1,280) Significance
Less than $100 million in assets 50.5% 50.7%In an MSA 57.7 58.2Total loans/Total assets 54.4 57.7 ***CRE/TL 23.3 23.4CLD/TL 4.6 4.4 ***Nonfarm nonresidential/TL 17.4 17.5Multifamily/TL 1.0 1.2 ***Farmland-secured/TL 11.4 10.7 ***1- to 4-family property–secured/TL 24.4 26.8 ***HELOC/TL 1.2 1.6 ***C&I/TL 13.7 13.6Consumer/TL 10.5 10.0 ***Agricultural/TL 14.1 12.3 ***All other loans/TL 1.2 1.3 **Core deposits/Total deposits 83.0 83.5 ***
NOTE: Data are for U.S. community banks with less than $10 billion in assets. ** and *** indicate statistical significance atthe 5 percent and 1 percent levels, respectively.
Table A6
Performance Ratios for 1-Rated Banks Versus 2-Rated Banks Not on Watch List
CAMELS rating/watch list status
1 2/Not on watch list Attribute (N = 702) (N = 1,280)
ROA 1.5% 1.2%ROE 12.7 10.8Loan losses/Total loans 0.1 0.2Provision expense/Average assets 0.1 0.1Efficiency ratio 61.1 66.2NIM 3.7 3.6NNIM 1.9 2.0
NOTE: Data are for U.S. community banks with less than $10 billion in assets. All differences are statistically significant atthe 1 percent level.

144 March/April 2013 Federal Reserve Bank of St. Louis REVIEW