Embed Size (px)
Citation preview

The Future of Carbon Pricing in the UK
1
The Future of Carbon Pricing in the UK
The Future of Carbon Pricing in the UK
Report prepared for the Committee on Climate Change
Final Report
August 2019

The Future of Carbon Pricing in the UK
2
Executive summary
In May 2019, the UK Government and the Devolved Administrations requested the advice of the Committee on Climate Change (CCC) on the future of carbon pricing. The letter requested advice on a UK ETS applying to the power, industry and aviation sectors in two scenarios: a standalone UK ETS and a UK ETS linked to the EU ETS, noting that a linking agreement would be subject to negotiation. In particular, the government requested advice on setting the level of the cap and trajectory for the 2021 to 2030 period. In addition, the letter requested advice in relation to the proposals outlined in the Government’s public consultation document on future carbon pricing options relating to the design and operation of the UK ETS.
In developing this advice, the Government’s letter set out key principles guiding the design of a future carbon pricing policy, including that the UK ETS must:
● facilitate cost effective decarbonisation, maintain competitiveness and provide a smooth transition
● be at least as ambitious as the current system and support delivery of the UK’s and Devolved Administrations’ domestic and international climate targets
● be capable of being linked to the EU ETS and consistent with the UK’s commitments on CORSIA
● be deliverable for operation from 1 January 2021
While this report supports and informs the CCC in responding to the government’s request, its recommendations are not CCC advice. The work provides a broader, more comprehensive assessment of the options available to the UK that informs the CCC’s advice, which is on a narrower set of issues. We describe and evaluate three policy scenarios for the development of carbon pricing in the UK, provide policy recommendations and identify the advantages, disadvantages and trade-offs. These three policy scenarios cover the spectrum of potential carbon pricing policy options set out in the request:
1. A UK ETS linked to the EU ETS; this is the UK government’s preferred scenario. Given the lengthy process for negotiating and ratifying a linking agreement, we consider that this would only be possible by 2021 if there is not substantive policy deviation between the UK ETS and EU ETS. Given this, we focus on a mirrored ETS-link, with the UK adopting almost all aspects of the EU ETS.
2. A standalone UK ETS; this provides the potential for divergence in policy design to ensure that the UK ETS operates effectively as an independent policy and is aligned with achieving the UK’s domestic net zero mitigation targets. In this scenario we consider that linking would only be feasible on a longer time frame, potentially sometime in the period 2025-30.
3. A UK carbon tax as a fallback option; this would not provide any opportunity to fully link with the EU ETS or other carbon markets in the short- or long-term. As such we suggest policy design options aligned with achieving the net zero objective, that assume that a carbon tax remains a purely domestic fall-back mechanism.
While political developments regarding Brexit may constrain choices, a UK ETS linked to the EU ETS remains the best solution if the UK leaves the EU with a negotiated deal. That option will maintain predictable climate policy during the Brexit transition in addition to access to an established and efficient EU carbon market. In a ‘no-deal’ scenario, the UK’s choice will be restricted to either a standalone UK ETS, with low potential for linking to the EU ETS in the short to medium term, or a carbon tax which would remain a purely domestic measure. The approach to carbon pricing in the interim period over 2019-20 is similarly constrained, with the UK expected to continue in Phase III of the EU ETS under a negotiated deal, and a carbon tax to apply in a no-deal scenario as reconfirmed by BEIS in July 2019. However, this report sets out the scenarios without a view of the most likely political developments regarding Brexit.

The Future of Carbon Pricing in the UK
3
If the UK does not develop a linked UK ETS, international experience suggests that it may face significant challenges in developing a well-functioning carbon market. Across scenarios, maintaining competitiveness, ensuring market stability and promoting secondary market development are key objectives. Further, carbon markets are exposed to shocks, with good design needed to ensure that these shocks do not have a long-term impact on ETS effectiveness. Similarly, ensuring a liquid secondary market which provides access to risk management products is important for ensuring efficiency and supporting investment in emissions reductions. If the UK ETS is linked with the EU ETS, these challenges will be limited and remain largely unchanged from the challenges to date. However, a standalone UK ETS requires careful design to address these challenges and avoid the need for disruption and further policy changes in the future.
Introducing a standalone UK ETS or carbon tax introduces additional uncertainty, and appropriate governance mechanisms are needed to manage these risks. Central to this will be establishing independent reviews of the operation of UK carbon pricing to ensure that it is driving change consistent with achieving the UK’s net zero obligations.
Findings on the future of carbon pricing in the UK
Market based mechanisms such as carbon pricing should continue to play a central role in an effective climate policy mix in the UK. The experience in the UK and international jurisdictions demonstrates that carbon pricing is a cost-effective way of reducing emissions. A central barrier to reducing greenhouse gas emissions arises from the fact that private actors do not face the full costs of their emissions. Carbon pricing addresses this by internalising the costs of emissions, which in turn influences firms’ production decisions to induce cost-effective mitigation and consumers to reduce demand for carbon-intensive products and services. Firms treat these costs like other operating costs and aim to reduce them to increase profit margins and/or gain market share. Over time, low-emissions producers will gain market share over high-emissions producers. Equivalently, consumers will substitute towards low-emissions products.
Under each scenario, UK carbon pricing can be designed to meet climate objectives and provide price incentives to spur emissions reductions given the choice of instrument is less important than how it is designed. ETSs limit the volume of emissions allowances in a jurisdiction and allow firms to trade them, resulting in a market price for these allowances. Carbon taxes place a set price per unit of emissions to help firms internalise the costs of emissions and face incentives for emissions reductions. The key difference between these instruments is therefore that ETSs provides greater certainty in the level of emissions, while carbon taxes provide certainty of price. Clarity about emissions reductions, and the carbon price are both important elements of effective climate policy. As such most ETSs operating globally also include some form of supply adjustment mechanism (SAM) or price mechanism to manage prices. Meanwhile, carbon taxes can be designed to offer advantages of ETSs. Thus, the choice of instrument is less important than how it is designed to achieve a certain climate policy objective.
As a result, achieving net zero emissions while supporting broader competitiveness and domestic policy objectives is possible under all carbon pricing policy scenarios. During the development of this advice, the UK became the first major economy to legislate a net zero target. This new commitment provides an additional basis for policy development that requires an ‘all-of-the-above’ strategy with carbon pricing playing an essential role within a broader policy mix. The CCC’s Net Zero report demonstrates that reaching a net zero target is possible but challenging. Our work further supports this advice by finding that any of the 3 carbon pricing mechanisms analysed in this report can be designed to achieve the target at low cost while also supporting competitiveness and other domestic policy objectives.
The net zero objective, however, places a greater emphasis on the role of carbon pricing to achieve a deeper decarbonisation of the economy and further supplementary policies to overcome non-price barriers. There is a need for strengthened caps or higher carbon taxes over the period to 2050, and to see carbon pricing incentives spread further throughout the economy. Our recommendations address the role that the carbon pricing mechanism can play in driving this change. They also point to the supplementary policies necessary to complement the carbon price; these address the array of non-price barriers for the adoption of mitigation measures and greenhouse gas removal technologies (GGRs) to meet the net zero emissions target.

The Future of Carbon Pricing in the UK
4
Recommendations and policy design
The benefits of a UK ETS linked to the EU ETS, especially with respect to low transition costs and access to an established, large and liquid carbon market, make it the best choice on balance. Linking to the EU ETS by 2021 is only possible if design changes are kept to a minimum to avoid the need for lengthy and difficult negotiations. As such in this scenario we recommend minimal changes to the fundamental design of the system, with largely unchanged provisions regarding scope, cap setting, free allocations mechanisms and other market design features. To ensure the effective functioning of SAMs the UK should closely coordinate any SAM with the operation of the EU ETS’s MSR. In addition to the need for supplementary policies to address non-price barriers across the economy and mobilise greenhouse gas removals (GGRs), in this scenario the Climate Change Levy (CCL) and Carbon Price Support (CPS) should be retained to ensure appropriate price incentives in covered sectors. These policies are important with the EU ETS not yet aligned with a net zero objective; however, this may soon change with incoming European Commission President Ursula von der Leyen supporting a net zero target. Achieving the net zero objective remains feasible in this scenario, however the balance of effort between the ETS and supplementary policies shifts towards the latter.
By contrast, a standalone UK ETS faces potentially significant challenges in achieving market stability and liquidity, although it would allow the ETS to be more closely aligned with the UK’s net zero emissions objective. To increase liquidity and reduce demand volatility, a standalone UK ETS could expand coverage to transport and uncovered combustion fuels (most importantly use of gas). Greater coverage would allow the UK’s cap to be more closely calibrated to the net zero objective and UK carbon budgets. This would increase carbon costs for households and businesses; however, compensation mechanisms could be provided to offset these impacts. Allocation methods would be unchanged at the beginning of the system, but in the longer-term the introduction of border carbon adjustments (BCAs) or adoption of output-based allocations could be considered. The design of a UK SAM will play a crucial role in providing market stability and predictability particularly in early years when demand is more uncertain as electricity generators build hedging positions. This would be implemented through an auction reserve price and cost containment reserve. We recommend that in 2021, the reserve price and cost containment reserve be triggered at £30/tCO2e and £50/tCO2e respectively and over time be calibrated to track the range of prices necessary to hit the net zero target.
Moving to a carbon tax results in greater administrative simplicity but loses the cost efficiency benefits of an ETS and would also require institutional safeguards to ensure prices remain consistent with the UK’s net zero target. In this scenario the CPS and CCL could, over time, be integrated into a new carbon tax. While coverage of the tax should be expanded to cover uncovered energy and transport emissions as under a standalone ETS, policymakers should again be cognisant of the need to reduce cost impacts on lower income consumers to reduce political risks. The carbon tax trajectory would begin at £16 in 2019 in line with government announcements for a ‘no-deal’ scenario, but to retain mitigation incentives it should quickly converge to the expected EU allowance price by 2021, and the long run efficient trajectory for achieving the UK’s net zero emissions objectives no later than 2025. This trajectory should be assessed through regular independent reviews to account for the latest information regarding mitigation costs and emissions levels. A system of exemptions or rebates should be established to replicate the approach of the EU ETS in addressing competitiveness issues, with these potentially being replaced by BCAs in the future.
Across scenarios some policy design elements are common:
● Market-based mechanisms are central to any successful decarbonisation strategy but there remains an important role for supplementary policies to address non-price barriers to mitigation or sequestration across the economy, and particularly with relation to GGRs.
● There is a need to mobilise land sector abatement through the establishment of an offset mechanism, with demand sourced either through carbon price compliance entities or in the case of a linked UK ETS, through an obligation on transport emissions. This could mobilise demand for mitigation in uncovered sectors and support greenhouse removals from land use change and the expansion of forestry.

The Future of Carbon Pricing in the UK
5
● The Government’s proposed continuation of the small emitter and hospitals opt-out and introduction of an ultra-small emitter exemption appears appropriate to reduce administration costs and complexity.
● The use of carbon pricing revenues should be prioritised for addressing competitiveness issues and supporting GGRs as necessary, with remaining funds available for a range of other uses including potentially revenue recycling to households.
● There is a need for increased oversight and review to ensure policies are appropriately designed. This includes continuing to assess progress to the UK and Devolved Administrations emissions reduction objectives, in assessing the design and function of competitiveness arrangements including offsets and consideration of the operation of the secondary market.
● The Devolved Administrations should continue to play a central role in administering the carbon pricing system, particularly with regards to emissions monitoring reporting and verification.
Across these policy scenarios trade-offs are inevitable, with the benefits of co-operation and economic integration being weighed against the benefits of designing policy for the UK’s specific circumstances. Each scenario brings advantages and disadvantages, summarised in Table 1 below.
Table 1 Summary of advantages and disadvantages by policy scenario
Key advantages Key disadvantages
Linked UK ETS
● Access to a large, liquid market which could provide enhanced resilience to domestic shocks
● Reduces inter-EEA competitiveness concerns
● Certainty of current policy and lower transition costs for business
● Lower capacity to design in line with economic context
● Additional need for supplementary policies and costs for uncovered sectors to reach net zero
Standalone UK ETS
● Can tie policy more closely to net zero target and provide more certain emissions outcomes
● Counter-cyclical price development ●
● Risks of low liquidity and volatility, with additional design features needed to mitigate these risks
● Competitiveness and leakage risks increase
● Administrative costs of implementation
UK Carbon Tax
● Greater price certainty ● Administrative simplicity for
governments and covered facilities ● Greater capacity for policy simplification
● Less cost effective ● Uncertain quantity of abatement risks
not achieving carbon budgets ● Potential government intervention risks
undermining price predictability ● No automatic price response to
economic downturns
Source: Vivid Economics

The Future of Carbon Pricing in the UK
6
Contents
Executive summary ........................................................................................................................... 2 1 Introduction ..................................................................................................................................... 10 2 Principles of carbon pricing ............................................................................................................. 12 3 Experience of carbon pricing ........................................................................................................... 22 4 Approach to assessment and recommendations ............................................................................ 58 5 Assessment and recommendations ................................................................................................. 66 6 Conclusion ..................................................................................................................................... 106
List of tables
Table 1 Summary of advantages and disadvantages by policy scenario ........................................................ 5 Table 2 Summary of advantages and disadvantages of a carbon tax relative to an ETS .............................. 14 Table 3 Benefits and costs of a linked ETS relative to a standalone ETS ...................................................... 20 Table 4 International experience of carbon pricing considered in this review............................................. 22 Table 5 List of sectors and GHG coverage under key carbon pricing instruments worldwide ..................... 31 Table 6 Issuance of domestic offsets in Australia, British Columbia and California, by sector ..................... 37 Table 7 Advantages and disadvantages of different free allocation methodologies .................................... 44 Table 8 SAMs introduced in ETS globally ..................................................................................................... 47 Table 9 Common treatments of banking and borrowing in ETS globally ..................................................... 51 Table 10 Recommendations: Linking ............................................................................................................. 67 Table 11 Options considered: Scope .............................................................................................................. 68 Table 12 Recommendations: Scope ............................................................................................................... 71 Table 13 Options considered: Cap or tax-level ............................................................................................... 72 Table 14 Recommendations: Cap or tax-level ................................................................................................ 77 Table 15 Options considered: Crediting and offsets ...................................................................................... 78 Table 16 Recommendations: Crediting and offsets ....................................................................................... 80 Table 17 Options considered: Supplementary policies .................................................................................. 81 Table 18 Recommendations: Supplementary policies ................................................................................... 83 Table 19 Options considered: Allocation and rebates.................................................................................... 84 Table 20 Recommendation: Allocations and rebates ..................................................................................... 89 Table 21 Options considered: SAMs .............................................................................................................. 90 Table 22 Recommendations: SAMs ................................................................................................................ 93 Table 23 Recommendations: Temporal flexibility .......................................................................................... 94 Table 24 Options considered: Secondary market development and auctions ............................................... 94 Table 25 Recommendations: Secondary market development and auctions ................................................ 96 Table 26 Options considered: Use of revenues .............................................................................................. 97 Table 27 Recommendations: Use of revenue ................................................................................................ 98 Table 28 Options considered: Evaluation and review .................................................................................... 99 Table 29 Recommendations: Evaluation and review ................................................................................... 100 Table 30 Recommendations: Devolved administrations .............................................................................. 101 Table 31 Advantages and disadvantages of scenarios ................................................................................. 104

The Future of Carbon Pricing in the UK
7
List of figures
Figure 1 Carbon pricing instruments are suitable for incentivising cost-efficient emission reductions ........ 13 Figure 2 The basic setup of a carbon tax relative to an ETS .......................................................................... 15 Figure 3 Carbon leakage occurs through three main channels ..................................................................... 17 Figure 4 Allowance prices have increased across most jurisdictions in recent years .................................... 23 Figure 5 The carbon tax had a substantial impact on transport emissions in Sweden .................................. 26 Figure 6 Quebec’s auction allowance price effectively rose after linking with the Californian ETS ............... 28 Figure 7 Unrestricted use of international offsets overwhelmed the NZ ETS ............................................... 38 Figure 8 Two key aspects distinguish four methodologies to allocate free allowances ................................ 45 Figure 9 The auction reserve price effectively supported California allowance prices ................................. 49 Figure 10 Both the reserve price and the CCR have affected the auction price in the past ............................ 50 Figure 11 Banking helped support prices despite oversupply in the EU ETS ................................................... 52 Figure 12 BAU emissions are highly uncertain ................................................................................................ 61 Figure 13 Allowance surpluses can quickly build if demand is at the low end of expectations ....................... 62 Figure 14 Differences in foresight of economic actors can lead to very different price outcomes ................. 63 Figure 15 Supply could be squeezed by early banking to build up hedging positions ..................................... 63 Figure 16 Sectors covered by the EU ETS have volatile emissions .................................................................. 70 Figure 17 Indicative scenarios of cap-setting, free allocations and auction supply ......................................... 73 Figure 18 The potential UK ETS soft price corridor could align with carbon price trajectories ....................... 92
List of boxes
Box 1 Carbon pricing and broader policy objectives ................................................................................. 13 Box 2 Key findings: Price development and emissions reduction ............................................................. 23 Box 3 Currently, the UK has multiple carbon pricing instruments in place ............................................... 25 Box 4 Key findings: Integrating markets through linked ETS ..................................................................... 27 Box 5 Key findings: Carbon pricing in the climate policy mix .................................................................... 30 Box 6 Offsetting emissions from international aviation ............................................................................ 39 Box 7 Net zero and the role of greenhouse gas removal technologies ..................................................... 40 Box 8 Key findings: A well-functioning market .......................................................................................... 41 Box 9 Cost pass-through of freely allocated emissions allowances in the power sector .......................... 42 Box 10 Key findings: Effective governance ................................................................................................. 53 Box 11 Policymakers face crucial choices on the use of carbon revenues .................................................. 54 Box 12 The design of the BCPM model ....................................................................................................... 60 Box 13 The impact of cap setting choices under a linked UK ETS on EU wide emissions is unclear ............ 74 Box 14 Inability to set a UK ETS cap that guarantees meeting devolved administrations targets ............... 75 Box 15 UK firms might face additional carbon leakage risk to the EU ......................................................... 86 Box 16 Accounting for the SEM for power generation in Ireland ................................................................ 87

The Future of Carbon Pricing in the UK
8
Acknowledgements
Vivid Economics prepared this report with extensive input from Prof. Sam Fankhauser12, Dr. Luca Taschini1, Dr. Robert Ritz23 and Dr. Misato Sato1. We are grateful to CCC staff, particularly Mike Hemsley, Owen Bellamy and Bianca Letti, to CCC board members and to workshop participants who provided valuable input and comments for this report. Vivid Economics is also grateful for the modelling work undertaken by the BEIS EU ETS team that informs this report.
Authors
The Vivid Economics team was comprised of Thomas Kansy, Stuart Evans, Paul Sammon, Alex Child, Fabian Knoedler-Thoma and Aaron Tam
1Grantham Research Institute on Climate Change and the Environment 2 Vivid Economics 3 University of Cambridge

The Future of Carbon Pricing in the UK
9
Glossary
Acronym Description
AFOLU Agriculture, Forestry and Other Land Use
BAU Business as Usual
BCA Border Carbon Adjustment
BCPM BEIS Carbon Pricing Model
BECCS Bioenergy with Carbon Capture and Storage
BEIS Department for Business, Energy and Industrial Strategy
CCA Climate Change Agreement
CCC Committee on Climate Change
CCL Climate Change Levy
CCR Cost Containment Reserve
CfD Contracts for Differences
CDM Clean Development Mechanism
CER Certified Emissions Reduction
CPS Carbon Price Support
CORSIA Carbon Offsetting and Reduction Scheme for International Aviation
CSCF Cross-Sectional Correction Factor
DACCS Direct Air Carbon Capture and Storage
ECR Emissions Containment Reserve
EEA European Economic Area
EITE Emissions-Intense and Trade-Exposed
EUA European Union Allowance
EU27 All current members of the EU minus the UK
ETS Emissions Trading Scheme
GGR Greenhouse Gas Removal
GHG Greenhouse Gas
MACC Marginal Abatement Cost Curve
MRV Monitoring, Reporting, Verification
MSR Market Stability Reserve
LULUCF Land Use, Land Use Change, Forestry
RGGI Regional Greenhouse Gas Initiative
SAM Supply Adjustment Mechanism
SEM Single Electricity Market
WCI Western Climate Initiative
The Future of Carbon Pricing in the UK
10
1 Introduction
In May 2019, the UK Government and the Devolved Administrations requested the advice of the Committee on Climate Change (CCC) on the future of carbon pricing. The letter requested advice on a UK ETS applying to the power, industry and aviation sectors in two scenarios: a standalone UK ETS and a UK ETS linked to the EU ETS, noting that a linking agreement would be subject to negotiation. In particular, the government requested advice on setting the level of the cap and trajectory for the 2021 to 2030 period. In addition, the letter requested advice in relation to the proposals outlined in the Government’s public consultation document on future carbon pricing options relating to the design and operation of the UK ETS.
In developing this advice, the Government’s letter set out key principles guiding the design of a future carbon pricing, including that the UK ETS must:
● facilitate cost effective decarbonisation, maintain competitiveness and provide a smooth transition
● be at least as ambitious as the current system and support delivery of the UK’s and Devolved Administrations domestic and international climate targets
● be capable of being linked to the EU ETS and consistent with the UK’s commitments on CORSIA
● be deliverable for operation from 1 January 2021
The Government consultation on the future of carbon pricing, has expressed a preference for establishing a UK ETS linked with the EU ETS (UK Government and Devolved Administrations, 2019). The EU ETS has been the flagship carbon policy in the UK for the power and industry sectors, however the UK’s departure from the EU means that replacement policies will be required to meet the country’s national and international commitments.
This work supports the CCC’s response to the Government’s request for advice. It leverages the knowledge and experience of a wide range of stakeholders and academic literature to identify the economic rationale for carbon pricing and practical lessons from the implementation of carbon pricing globally. Our findings are supplemented by quantitative evidence provided by the BEIS Carbon Price Model (BCPM) which provides carbon price outputs based on varying design choices on market scope and cap and assumptions of market behaviour. We define three scenarios for a UK carbon pricing policy from 2021 and identify the design options available to optimise the fit of carbon pricing in the broader policy mix, ensure a well-functioning market, and support effective governance. We then provide recommendations for each design aspect of a UK carbon pricing instrument under each policy scenario. Throughout, the analysis focuses on developing policies required to ensure the UK’s achievement of net zero emissions target by 2050. The three policy scenarios we define match the scenarios identified in the UK government’s request for advice:
● a UK ETS linked to the EU ETS;
● a standalone UK ETS; and
● a carbon tax.
The remainder of this report is structured as follows:
● Section 2 details the economic principals of carbon pricing. This section sets out the fundamental role of carbon pricing, the relative merits of emissions trading and carbon taxes, and the benefits and costs of a linked and standalone ETSs;
● Section 3 discusses international experiences of carbon pricing. In this section, we consider carbon market price developments, evidence of emission reductions, and experiences of linking ETSs; and

The Future of Carbon Pricing in the UK
11
synthesise the international experiences of carbon pricing instruments across the key design aspects that impact market outcomes;
● Section 4 sets out our definition of the policy scenarios, our approach to presenting quantitative modelling results provided by the BCPM, and introduces key issues and challenges to the UK’s implementation of carbon pricing that require consideration in each scenario;
● Section 5 presents our assessment of the available design options across policy scenarios and provides policy recommendations to support effective carbon pricing in each scenario. We consider all major central design features of carbon pricing instruments, that determine carbon pricing’s role in the climate policy mix, the functioning of markets, and effectiveness of governance. This section then concludes with a high-level summary of the trade-offs implied across the three policy scenarios.

The Future of Carbon Pricing in the UK
12
2 Principles of carbon pricing
This section synthesises the theoretical underpinning of carbon pricing design and operation. The principles, together with the practical experiences of carbon pricing, form the basis for scenario analysis and the application to net zero. The section synthesises the most recent and relevant thinking on design and operation of carbon pricing instruments and will contribute to the final recommendations.
The remainder of this section is structured as follows:
● Section 2.1 explains the role of carbon pricing
● Section 2.2 compares the advantages and disadvantages of emissions trading and carbon taxes
● Section 2.3 discusses linking considerations
2.1 The role of carbon pricing
Deep decarbonisation of the global economy is required to keep global warming well below 2 degrees and pursue efforts to limit warming to 1.5 degrees Celsius, and avoid the severe social, economic and environmental impacts of climate change. In 2016, 86% of global primary energy supply was generated from carbon-intensive and non-renewable fossil fuels.4 Additionally, process emissions from activities such as manufacturing, agriculture and waste management contribute significantly to the world’s atmospheric GHG concentration. Growing emissions are driving dangerous climate change and action is required on a global scale in order to slow and reverse these trends.
However, a central barrier to reducing emissions arises from the fact that private actors do not face the full costs of their emissions. Climate change is a collective action dilemma, wherein emissions today lead to widespread and delayed social, economic, and environmental harm. However, private market incentives mean that this social cost of emissions is borne by neither businesses nor consumers. Therefore, governments must implement a range of policies to ensure private agents face the right incentives for emissions abatement, to avert associated damages.
Central to these policy options is carbon pricing, which aims to internalise the true costs of emissions into firms’ production decisions to induce cost-effective and flexible abatement. Carbon pricing incentivises upstream firms, intermediaries and end-users to supply and demand low-emissions goods and services. By pricing emissions, the external costs of the production and consumption of emissions-intensive goods are internalised into private costs. Firms will treat these costs like other business costs and aim to reduce them to increase profit margins and/or gain market share. Over time, low-emissions producers will gain market share over high-emissions producers. Equivalently, consumers will substitute towards low-emissions products due to their cost advantage. Therefore, carbon pricing is a critical part of a policy suite for the decarbonisation of the economy.
Carbon pricing works alongside other climate policies to reduce emissions by encouraging short run substitution and efficiency measures and changing longer run investment and consumption decisions. Figure 1 highlights the three main areas of abatement opportunities for firms. In an approximate cost hierarchy, fuel-switching and energy efficiency measures tend to be the least expensive mitigation measures, while changes in technologies and processes are often far costlier. Carbon pricing targets the cost-effective abatement shown in the blue section in Figure 1 and can also induce innovation and support technology spillovers in the absence of other non-price barriers.
4Vivid Economics based on BP Statistical Review of World Energy 2017

The Future of Carbon Pricing in the UK
13
Figure 1 Carbon pricing instruments are suitable for incentivising cost-efficient emission reductions
Source: Hood (2011)
However, carbon pricing is less suitable for overcoming non-price barriers to mitigation and supporting particularly expensive mitigation technologies and should therefore be part of a broader policy suite. The fact that energy efficiency measures (the red section of Figure 1) carry negative net costs (i.e. savings from lower energy bills) but are yet to be implemented suggests that there are non-price barriers such as imperfect information. As a result, incentives from carbon pricing alone would not induce significant uptake of these abatement opportunities. A variety of enabling policies are required to establish standards, mitigate risks, and create the right market conditions. Furthermore, some abatement opportunities (green section of Figure 1) may be too costly for an early-phase carbon price to unlock without raising concerns over distributional impacts. More targeted policies may be needed in these cases, such as dedicated technology funds, low-carbon technology mandates, or R&D support to reduce technology costs. For these areas of mitigation, supplementary policies may be necessary. Thus, carbon pricing needs to fit efficiently into the broader policy objectives, as discussed in Box 1.
Box 1 Carbon pricing and broader policy objectives
The design of carbon pricing should seek to achieve other standards for good policy implementation. This includes the objectives of increasing efficiency, promoting growth and addressing distributional issues.
● Policy should aim to maximise efficiency, by allocating resources to their most efficient social use. This includes by internalizing external benefits or costs, removing distortions introduced by tax and transfer policies, and reducing administrative costs on business and governments.
● Policy should promote long-run economic growth, which increases economic possibilities and wellbeing. Some ways that policies may achieve this are by smoothing the economic cycle, increasing innovation and productivity growth or ensuring that debt levels are sustainable.
● Policy should be aligned with achieving social objectives to reduce inequality and expand access to economic opportunity. This can be achieved through policies that redistribute income from high-income groups to low-income groups (e.g. by replacing regressive taxes), or by reducing the costs of economic transition and addressing regional economic disadvantage.

The Future of Carbon Pricing in the UK
14
BEIS has emphasised the need for the following policy principles to be reflected in any carbon pricing instrument(UK Department for Business Energy & Industrial Strategy, 2019):
● facilitate cost-effective decarbonisation;
● ensure ambition is at least as stringent as it has been under the current EU Emissions Trading System (ETS) and provides a smooth transition for all sectors;
● maintain industrial competitiveness while supporting the delivery of climate change commitments and targets for the UK and devolved administrations;
● meet the UK’s commitment to implement the Carbon Offsetting and Reduction Scheme for International Aviation (CORSIA); and
● be capable of being linked to the EU ETS with fully fungible allowances between the two systems.
Achieving net zero in the UK will require additional policies to supplement carbon pricing. Many sectors require very high carbon prices to achieve net zero without further policy support. For example, unlocking negative emissions technology could require carbon prices of up to 300 £/tCO2e in the UK in 2050(J. Burke, Byrnes, & Fankhauser, 2019). However, such levels of carbon prices across an entire economy might be limited by political feasibility. For example, public procurement arrangements and/or private negative emissions markets can facilitate negative emission technologies and reduce the carbon prices required for net zero. Supplementary policies are necessary across all sectors but the net zero target created a special case for focusing on negative emissions technology.
2.2 Emissions trading vs. carbon tax
The two main carbon pricing policy instruments are carbon taxes or ETSs. Carbon taxes place a set price per unit of emissions to help firms internalise the costs of emissions and face incentives for emissions reductions. ETSs limit the volume of emissions allowances in a jurisdiction and allow firms to trade them, resulting in a market price for these allowances. In basic economic theory, both instruments deliver the same results under certainty in a given time period. However, economic shocks, uncertainty and multiple time periods lead to different results for the two instruments. Table 2 below summarises the overarching advantages and disadvantages of a carbon tax versus an ETS and the remainder of this section discusses each element in turn.
Table 2 Summary of advantages and disadvantages of a carbon tax relative to an ETS
Element Carbon Tax ETS
Price predictability
The carbon price is given by pre-defined tax rates. This provides a stable price signal to inform investment decisions, if there is confidence that tax rates will not be altered.
The carbon price is determined by the market. Its volatility and uncertainty can withhold low-carbon investment decisions. Supply adjustment mechanisms (SAMs) can increase the price predictability.
Carbon leakage and competitiveness
Tax rebates or reductions of other taxes can reduce competitiveness impacts but may be less proficient at maintaining abatement incentives. Carbon tax exemptions can address leakage but reduce incentives to mitigation incentives.
Well-targeted free allowances based on benchmarks can mitigate carbon leakage risk while maintaining abatement incentives. However, these can be relatively administratively costly.

The Future of Carbon Pricing in the UK
15
Environmental integrity
Emissions reductions are determined by market dynamics and it can be difficult to align the tax to a certain emissions target. Conversely, the simplicity of carbon tax implementation makes it easier to apply it to a large range of sectors.
Provides more certainty in emissions reduction and can be aligned better to a certain policy target (e.g. carbon budgets). However, an oversupply in (free) allowances can reduce the carbon price and environmental integrity.
Cost effectiveness
The carbon tax has lower administrative costs but offers less dynamic cost-effectiveness as it responds less to demand shocks and business cycles.
Allows for economic efficiency between and within sectors and over time, but market power, lack of liquidity, and excessive price volatility can reduce cost effectiveness.
Source: Vivid Economics
2.2.1 Price predictability
Under the basic set-up, carbon taxes provide a fixed carbon price with uncertain emissions reductions, while ETSs provide fixed emissions reductions with uncertain resulting carbon prices. Figure 2 details the basic setup of a carbon tax and an ETS. The figure illustrates how the two systems respond to a demand shock (D to D’). Under a carbon tax, an increase in allowance demand increases the quantity of resulting emissions in the market while prices are held constant. Under an ETS, the same increase in demand raises allowance prices as the supply is kept constant. Furthermore, the demand for emissions at different prices is often unknown and complicates the determination of the optimal price or quantity. In practice, all major ETSs have some supply adjustment mechanisms (SAMs) that balance quantity and/or price.5
Figure 2 The basic setup of a carbon tax relative to an ETS
Source: Vivid Economics
Carbon taxes provide a stable price signal that can help incentivise long term investment into abatement. The fixed carbon price provides a good signal for both short- and long-run abatement decisions; regulated
5 In an international context, SAMs are often called market stability mechanisms (MSMs). This report follows the terminology used by BEIS in the consultation. Both terms describe all measures that adjust the supply curve of allowances.

The Future of Carbon Pricing in the UK
16
entities can project their carbon costs more precisely and undergo decarbonisation investments with greater certainty. Furthermore, transparency of the price signal and ease of understanding are beneficial for regulated entities that are not familiar with carbon pricing. In practice, the stability of the carbon price is often jeopardised by political pressure and the tax rate might be subject to resulting changes, reducing the incentives for long-term investments.
In contrast, ETSs have uncertain allowance prices determined by the market, which may sometimes inhibit longer run investment, but short-run fluctuations can also incentivise efficiency improvements. The price uncertainty can lead to lower low-carbon investments, because the investment returns depend on long-term carbon costs. However, short-run fluctuations in commodity prices can also incentivise short-run mitigation measures such as fuel-switching and energy efficiency.
The ETS cap provides certainty in emissions reduction but interacts with the effects of other climate policies. The fixed emissions reduction allows policymakers to plan for national and international commitments, such as carbon budgets or NDCs, with more certainty. However, market determined prices can be complicated by the interacting signals of the prevailing policy suite. As such, overlapping climate policies (e.g. renewable energy policies) might not lead to additional emissions reductions if the ETS is not adjusted, also known as the ‘waterbed effect’.
However, an ETS may also include SAMs to provide greater certainty in the price signal and increase the resilience of the market to unexpected shocks. SAMs can increase the certainty of the price signal by narrowing prices to a corridor or ensuring allowance surpluses to not build too high, using either price-based mechanisms or quantity-based mechanisms. SAMs come with trade-offs to varying degrees, generally reflected in the value of additional compliance flexibility relative to the value of greater certainty to induce investments into emissions reduction.
2.2.2 Carbon leakage and competitiveness
Asymmetry in global carbon pricing may lead to a domestic carbon price risking adversely impacting the competitiveness of local industries. Potential competitiveness impacts arise fundamentally from asymmetries in carbon costs, either due to trading partners having no carbon price or having a lower carbon price than the domestic jurisdiction. Without mitigating policy design, asymmetries in carbon pricing could negatively impact competitiveness and result in carbon leakage.6 There are three main channels for carbon leakage: the output or short-term competitiveness channel; the investment or long-term competitiveness channel; or the fossil-fuel price channel, detailed in Figure 3.7
Sectors most at risk of impact are emissions intensive and trade exposed (EITE) who face a significant carbon cost burden while having limited cost pass-through capacity. EITE sectors have high carbon costs and they cannot pass through costs because they are typically price takers on international markets. Thus, they are most likely to be at risk of carbon leakage. A first-best solution would be to account for differences in carbon pricing through border carbon adjustments (BCAs). These carbon tariffs would equalise the carbon cost impact across jurisdictions and maintain domestic abatement. However, BCAs have not been tested internationally and are expected to be politically and administratively difficult to implement (Mehling, Van Asselt, Das, & Droege, 2018)8. They require to estimate the carbon content of various international products to set the correct tariffs and might cause retaliatory tariffs.
ETSs and carbon taxes face the same potential impact of carbon leakage and competitiveness, but approach sectoral support differently. As both instruments impose a carbon cost on emissions, they yield the same competitiveness and carbon leakage implications. However, they use different policy options used to support sectors at risk of these impacts.
6 Carbon leakage occurs when production (and resulting emissions) relocate to locations with less stringent carbon pricing. This can mean that local carbon pricing initiatives result in less than expected (or even negative) reductions in global emissions levels. 7 Details on the theory and practical experience of carbon leakage can be found in PMR (2015). 8 The only experience on BCAs to date are the carbon-cost adjustments for power generation in California.

The Future of Carbon Pricing in the UK
17
Figure 3 Carbon leakage occurs through three main channels
Source: Vivid Economics
In an ETS, sectors at risk of significant competitiveness impacts are largely supported by providing free emissions allowances to firms to alleviate cost increases. The distribution of free allowances reduces the carbon costs for covered entities and might reduce the competitiveness impacts from carbon pricing. However, free allowance allocation creates trade-offs, as the reduction of competitiveness impacts may also reduce the carbon price signal (Vivid Economics, Motu Economic and Public Policy Research, & EDF, 2016). Therefore, free allowances should be targeted at sectors genuinely at risk and reduced over time. The impact of free allowance allocation depends on the level of support provided, which is significantly influenced by the methodology used to allocate allowances in general. More details on allowance allocation methodologies are provided in Section 3.4.1.
Carbon taxes support sectors at risk of carbon leakage either through reforming other taxes or through directly reducing the effective burden of the carbon tax. The main support mechanism is through reducing the carbon tax burden on sectors at risk of leakage, either through exemptions or tax rate reductions or absolute rebates on tax payments (PMR, 2017). It is important that the support mechanisms do not dilute the carbon price signal to ensure environmental integrity.
The use of benchmarking maintains incentives to abate; while possible under both instruments they have mainly been applied in ETSs to date. Overall, the method of providing free allocation in ETSs may provide more incentives to invest into emissions reductions than the carbon tax method of providing tax rate reductions or rebates if designed properly. Free allocations may provide additional incentives to invest into emissions reductions as firms can receive up to 100% of the benchmarked value of freely allocated permits. Free allocation with benchmarking, especially in combination with output-based allocation, maintains abatement incentives if benchmarks are sufficiently ambitious, while free allocation protects against leakage.9 With a tax, leakage can be addressed through tax relief, a rate reduction or exemption. Like free allocation, mitigation incentives can be amplified using benchmarks, for example by applying a carbon tax only for the emissions exceeding a product emissions benchmark. Additionally, the mitigation incentive
9 Benchmarking sets a certain emissions intensity standard per sector or subsector. Installations receive allowances relative to the benchmark.

The Future of Carbon Pricing in the UK
18
effects are likely to be weaker with the tax exemption approach, and stronger under the rebate approach, where firms face the full carbon cost and are compensated later.10
2.2.3 Environmental integrity
In principle, an ETS offers greater certainty about emissions reductions than carbon taxes because they set a quantity cap. For carbon taxes, emissions reductions are determined by the market. As such, a carbon tax could result in lower emissions reductions than expected if market dynamics change. For example, an unforeseen fall in global oil prices would reduce the total cost of oil use and result in lower emissions reductions. Whereas, ETSs set explicit emissions caps and thereby provide policy makers greater mitigation certainty.
However, certain policy design flaws can reduce the environmental integrity of ETS. Overly generous free allowance allocation can create an oversupply of allowances, reducing allowance prices and inhibiting investment into abatement. Similarly, a cap without sufficient stringency or a SAM that overcompensates for higher high prices can result in an effective oversupply of allowances that reduces environmental integrity. Because ETS reform usually take multiple years, once environmental integrity is compromised, it takes policymakers a longer time to correct it.
Conversely, the simplicity of carbon taxes makes them easier to apply to a wide range of sectors, improving environmental integrity. Carbon taxes have relatively simple administrative implications, which makes them easier to apply across a wide variety of sectors. This is particularly true for some sectors, such as Agriculture, Forestry and Other Land Use (AFOLU), in which it is inherently more difficult to implement ETSs. However, given the range of abatement costs across sectors, there may sometimes be trade-offs between wide, uniform carbon pricing coverage and feasible ambition levels.
Both instruments are capable of delivering co-benefits. Carbon taxes and ETSs are able to deliver environmental co-benefits associated with reducing GHG emissions such as reductions in local air pollutants and the generation of other harmful waste products. They can also reduce dependence on energy imports and create an additional source of government income.
Both instruments may require supplementary policies to maximise environmental integrity. However, both also need support for technology improvement, to remove barriers to behaviour change, to secure returns on uncertain investments, and to increase the availability of substitution fuels and products. Environmental integrity also requires removing regulatory incentives that are countervailing to carbon pricing, such as explicit and implicit fossil fuel subsidies.
2.2.4 Economic efficiency
In theory, an ETS facilitates economic efficiency, allowing mitigation to occur where and when it is cheapest. Emissions trading allows for lowest cost achievement of mitigation targets between and within sector. Entities that can abate at a cost lower than the equilibrium carbon price can sell their allowances to entities with higher abatement costs. Furthermore, temporal efficiency allows emission reduction to materialise in the time period that is most cost-effective. The counter-cyclical nature of the allowance price also allows for regulation to be in harmony with economic activity and business cycles.
However, an ETS offers these theoretical benefits only under certain conditions that are not always met in practice. Efficiency is reduced in cases where a small number of players have large market power, which has been an explicit reason that some jurisdictions have adopted a carbon tax rather than an ETS. Further, low liquidity in secondary markets can inhibit trade and counteract the efficiency benefits of an ETS, although this risk can be reduced with appropriate policy design to support development of secondary markets.
10 However, South Africa’s 2019 implemented carbon tax includes an additional tax rate discount (not exceeding 5%) for facilities that perform better than pre-defined sectoral emissions intensity benchmarks (Republic of South Africa, 2019).

The Future of Carbon Pricing in the UK
19
Finally, excessive price volatility can prevent cost-efficient mitigation as greater price uncertainty increases risks and the required hurdle rate of return for firms considering low carbon investments.
A carbon tax offers less dynamic cost-effectiveness and has limitations in responding to business cycles. As carbon prices are fixed, environmental integrity can be compromised under significant demand shifts; the price is non-responsive and additional demand is not met with increasing prices to reduce emissions. Conversely, in times of economic slow-down, carbon taxes might be inflexible in reducing the burden on regulated entities and exacerbate competitiveness impacts during downside business cycles. However, the extent of this challenge is also influenced by the ease with which the legislative environment allows for tax rate changes.
Both ETSs and carbon taxes can incorporate offsets to increase flexibility and increase cost-efficient abatement within a larger pool of emitters. Both types of carbon pricing instruments can include offsets for compliance. This allows for abatement in uncovered domestic sectors or international offset markets to be used for regulated entity compliance. It can increase efficiency if achieved at lower cost than the prevailing carbon tax and if offsets are embedded in an appropriate institutional set-up.
Administrative costs are usually higher under an ETS than a carbon tax, but their importance is usually small. An ETS has normally higher administrative costs11. Regulators must implement frequent auctions and/or decide about the allowance allocation on a firm level; they may also operate allowance exchanges. In contrast, a carbon tax has lower administrative costs. They can be integrated into the existing tax system (and can often simultaneously stimulate the reform of the wider tax environment) and do not require complex oversight. Carbon tax rates can also be adjusted more easily than ETS design. However, administrative costs are generally low in a larger economy and other considerations might have higher importance. For example, the administrative costs for UK emitters in the EU ETS were estimated at £0.07/tCO2 in 2009 (Aether, 2010)12. Carbon taxes and ETSs can also be complementary; a carbon tax can work in sectors with more diffuse emission sources (e.g. transport, residential) and complement ETSs focused on heavy industry and the energy sector (Metevier, Bultheel, & Postic, 2018; Somanathan, Sterner, & Sugiyama, 2014).
2.3 Linking ETS
Overall, both standalone and linked ETSs have specific advantages; the main trade-off is having control on design and operation versus reducing the overall costs of abatement. Under a standalone ETS, policymakers have no external restriction on ETS design and operation, including cap size, allocation mechanism, sector coverage and SAMs. Under a linked system, policymakers may need to compromise substantially depending on the linking arrangement. Importantly, significant disparity in market sizes can also result in the larger market’s design features dominating linked market outcomes, regardless of negotiated alignment. On the other hand, abatement can materialise more cost-efficiently over a larger pool of emitters and with higher trading liquidity.
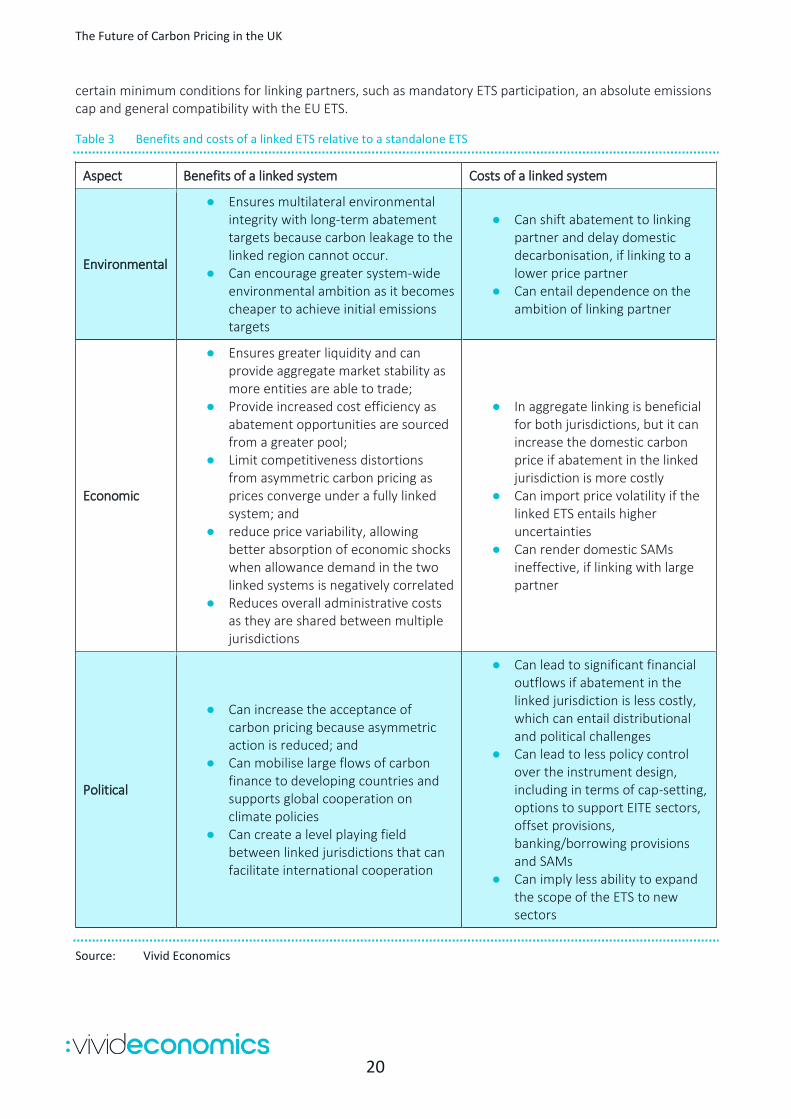
Linked ETSs have environmental, economic and political advantages and disadvantages compared to a standalone ETS. Table 3 summarises the most important benefits and costs of linking.
Successful linking requires certain minimum criteria to be aligned across ETSs. Linking requires minimum agreement on criteria for market integrity, environmental integrity (robust MRV and emissions accounting) and ambition to operate effectively. Furthermore, linking jurisdictions must share similar underlying objectives for the ETS to find a common ground on linking arrangements. The EU has already defined13
11 Administrative costs for government include maintaining the MRV system, running allowances auctions and evaluating the system, while administrative costs for business include those associated with complying with the system separate from explicit liabilities. 12 Administrative and transaction costs are generally low, but are relatively higher for small emitters (Dutch Emissions Authority, 2015) 13 Article 25 of the Directive 2003/87/EC of the European Parliament and of the Council, https://€-lex.€opa.eu/legal-content/EN/ALL/?uri=CELEX%3A32003L0087
The Future of Carbon Pricing in the UK
20
certain minimum conditions for linking partners, such as mandatory ETS participation, an absolute emissions cap and general compatibility with the EU ETS.
Table 3 Benefits and costs of a linked ETS relative to a standalone ETS
Aspect Benefits of a linked system Costs of a linked system
Environmental
● Ensures multilateral environmental integrity with long-term abatement targets because carbon leakage to the linked region cannot occur.
● Can encourage greater system-wide environmental ambition as it becomes cheaper to achieve initial emissions targets
● Can shift abatement to linking partner and delay domestic decarbonisation, if linking to a lower price partner
● Can entail dependence on the ambition of linking partner
Economic
● Ensures greater liquidity and can provide aggregate market stability as more entities are able to trade;
● Provide increased cost efficiency as abatement opportunities are sourced from a greater pool;
● Limit competitiveness distortions from asymmetric carbon pricing as prices converge under a fully linked system; and
● reduce price variability, allowing better absorption of economic shocks when allowance demand in the two linked systems is negatively correlated
● Reduces overall administrative costs as they are shared between multiple jurisdictions
● In aggregate linking is beneficial for both jurisdictions, but it can increase the domestic carbon price if abatement in the linked jurisdiction is more costly
● Can import price volatility if the linked ETS entails higher uncertainties
● Can render domestic SAMs ineffective, if linking with large partner
Political
● Can increase the acceptance of carbon pricing because asymmetric action is reduced; and
● Can mobilise large flows of carbon finance to developing countries and supports global cooperation on climate policies
● Can create a level playing field between linked jurisdictions that can facilitate international cooperation
● Can lead to significant financial outflows if abatement in the linked jurisdiction is less costly, which can entail distributional and political challenges
● Can lead to less policy control over the instrument design, including in terms of cap-setting, options to support EITE sectors, offset provisions, banking/borrowing provisions and SAMs
● Can imply less ability to expand the scope of the ETS to new sectors
Source: Vivid Economics

The Future of Carbon Pricing in the UK
21
Several factors would facilitate the UK ETS linking with the EU ETS and reinforce the gains available:
● Status quo: The UK is currently part of the EU ETS, which resembles a full-harmonised link. Linking to the EU ETS would approximate the status quo most closely and would imply the fewest disruptions for UK market participants. Similar levels of ambition and carbon prices facilitate this.
● Geographic proximity: The UK and the EU27 are, and will remain, significant trade partners and maintaining similar regulatory environments for industrial sectors will help keep a level playing field between the jurisdictions.
● Institutional similarity: The UK and EU27 have similar political institutions, decision-making processes, and experience with ETS design which could ease linking negotiations. The two regions also stand to gain from expanding international carbon market coverage along a common set of design principles, to ensure they reap first-mover advantages.
● Cultural ties: The UK and the EU27 have strong cultural ties and shared objectives regarding carbon pricing and climate policy. This would be a vital facilitator of linking as a shared ambition regarding climate policy is fundamental to cooperation. The UK’s recent proclamation of achieving net-zero by 2050 could be an important signalling device of their commitment in this regard.

The Future of Carbon Pricing in the UK
22
3 Experience of carbon pricing
Carbon pricing is becoming growing globally as jurisdictions take action to pursue the Paris Agreement’s goal of limiting climate change. There are currently 28 ETSs and 29 carbon taxes implemented or scheduled for implementation at the regional, national and subnational level, covering 11 GtCO2e (around 25% of global GHG emissions) (World Bank Group, 2019). Prices in existing carbon pricing systems vary from US$1-127/tCO2e (£1-95/tCO2e14), raising US$44bn (£33bn) in carbon revenues. Power, industry and transport emissions are most frequently covered; some instruments also include transport, buildings and waste. In contrast, most jurisdictions do not cover agriculture due to challenging emissions measurement. Carbon pricing is expanding with new policies in 2019 including carbon taxes in South Africa and Singapore, and Canada’s carbon pricing backstop, which applies an ETS and carbon levy to provinces with insufficient carbon prices. The effectiveness of carbon pricing instruments is fundamentally determined by their impact on emissions reductions, of which there has been some evidence, as discussed in Section 3.1.
The distinction between carbon taxes and ETSs is important in theory, but in practice most ETS are hybrid systems. Every major ETS implemented to date has some form of explicit price- or quantity-control measures in place. As such, ETS prices are less uncertain and emissions reductions may be less certain than as discussed under the theoretical ETSs discussed above.
This section synthesises the key practical experiences of carbon pricing to inform lessons learnt for the design of a UK carbon price. The section synthesises the experiences of the implementation of nine jurisdictions’ carbon pricing instruments across key aspects of policy design, as detailed in Table 4.
Table 4 International experience of carbon pricing considered in this review
Categories/issue EU Swiss SK NZ WCI RGGI Aus BC/Alb*
SA Sweden
Instrument ETS Carbon Tax
Linking X X
X
X
Net Zero Scope (GHG/sector) X
X
X X X
Cap X
X
X
Crediting and offsets
X X
X
Complementary policies X
X
Markets Free allocation X
X
X X
Temporal flexibility X
SAMs X
X X
Auctions and secondary market development
X
X X X
X
Gover-nance
Use of revenues X
X X X X X
Evaluation/ review X
X
X
Note: “X” indicates where a jurisdiction’s experience is considered; *BC = British Columbia and Alb = Alberta Source: Vivid Economics
14 US$ 1 = GBP 0.75, €1 = £ 0.88, CA$ 1 = £ 0.58 (2018 average), AU$ 1 = £ 0.56, https://www.ofx.com/en-gb/forex-news/historical-exchange-rates/yearly-average-rates/

The Future of Carbon Pricing in the UK
23
The remainder of this section discusses the experiences of carbon pricing across five main themes:
● Section 3.1: outcomes in price development and emissions reductions
● Section 3.2: integrating markets through linked ETS
● Section 3.3: policy design for net zero, including scope cap and offsets
● Section 3.4: market functioning, including allocation, banking and borrowing and market design
● Section 3.5: governance, including use of revenues and reviews
3.1 Price development and emissions reductions
Box 2 Key findings: Price development and emissions reduction
● Existing ETSs have experienced extended periods of very low allowance prices at some stage in the last decade. Due to these low prices, ETSs had only a minor impact on emissions.
● To address low prices, jurisdictions introduced SAMs and tightened caps. These policy changes mean that past evidence on price development and emissions reductions might not be a good indicator for the future.
Most ETSs have experienced low allowance prices in the past due to factors including economic and technology shocks, inflows of international offset units, complementary policies and loose caps. Figure 4 shows allowance prices in major emissions trading system since 2008.
Figure 4 Allowance prices have increased across most jurisdictions in recent years
Note: Currency conversions to EURs using ICAP (2018a) exchange rates. Regional Greenhouse Gas Initiative (RGGI) includes the US states Connecticut, Delaware, Maine, Maryland, Massachusetts, New Hampshire, New York, Rhode Island and Vermont;
Source: Vivid Economics based on ICAP

The Future of Carbon Pricing in the UK
24
All major ETSs have seen prices remain below €20/tCO2(£18/tCO2) for most of the period and below €10/tCO2(£9/tCO2) for extended periods. Most prominently, the EU ETS has suffered from low allowance prices for most of Phase III (2013-2020). In this case, the cap was not substantially higher than demand for emissions. Complimentary policies across the EU, such as renewable energy policies, decreased business-as-usual emissions further, and lead to a low allowance price. The economic recession and the import of international offsets under the Kyoto Protocol decreased the price further, an experience common to other jurisdictions.
Policymakers responded with lower caps and the implementation of SAMs, and prices have increased in recent years. Most ETSs have undergone major revisions since their launch. For example, the EU adopted for Phase IV (2021-2030) a faster decreasing cap and a market stability reserve (MSR) that is able to remove allowances temporarily and permanently (see Section 3.4.2). Similarly, the Regional Greenhouse Gas Initiative (RGGI) will introduce an emissions containment reserve (ECR) that is able to reduce allowances permanently. Allowance prices have increased in most jurisdictions over the last few years, but it is unclear to what extent it is linked to these policy changes. Other possible drivers are the exhaustion of cheap abatement options and expectations on future prices.
Analysing the impact of carbon pricing instruments on industrial emissions is challenging. Several factors influence industry emissions and emissions intensity including fuel prices, new technologies, and other climate and energy policies. This results in an identification problem in attributing the cause of emission reductions to carbon pricing.
Although available data is limited, there is some evidence to suggest that carbon pricing instruments have reduced industry emissions intensity. There is some evidence to suggest that carbon prices have succeeded in reducing industrial emissions intensity in recent years. EU absolute emissions fell by 327 MtCO2e or 38.1% over 1990-2012 in manufacturing industries and construction IPCC sectors (EEA, 2014), indicating a broader trend beyond the implementation of the EU ETS. Furthermore, over 2018, emissions in the EU ETS decreased close to twice as fast as the cap (Marcu et al., 2019). Dechezleprêtre et al (2018) find statistically significant emissions reductions for some industry sectors in Phase II of the EU ETS and none for Phase I. Australia's Treasury modelling (2013) project that emissions in Australia would have been 17 MtCO2e (2.8%) higher without the absence of the carbon pricing mechanism in 2012-2013 (ACCA, 2014). While much of these reductions are the result of other factors, such as the financial crisis, there is some evidence that the EU ETS reduced industry’s emissions intensity. Martin, de Preux, & Wagner (2014) find a reduction in energy intensity for UK firms who pay the full Climate Change Levy compared to firms that received generous exemptions due to so-called Climate Change Agreements (CCAs).
Evidence also suggests that carbon pricing has been influential in driving increased low-carbon innovation. Evidence from the EU ETS suggests that carbon pricing induced regulated companies to increase low-carbon patenting by up to 10% and increase patenting for other technologies by close to 1% (Calel & Dechezleprêtre, 2016). Further, evidence on patent applications under China’s regional pilot carbon pricing instruments suggests that carbon pricing effectively induced low carbon innovation (Cui, Zhang, & Zheng, 2018). Siegmeier et al. (2018) investigate the macroeconomic impacts of carbon pricing and find that induced investment shifts towards low-carbon technologies may enhance economic efficiency without constraining economic growth. A recent report (Kennedy, 2018) supports this conclusion on the innovation and economic growth impacts of carbon pricing.
In the EU, absolute emissions reductions mostly stem from electricity while industry emitters kept their emissions roughly constant, however the role of the EU ETS remains unclear. The electricity sector has reduced emission since the launch of the EU ETS. In contrast, industry emissions remained roughly constant with some degree of reduction in emissions intensity. For example, the pulp and paper sector has also shown a steady decline over 2005-17. A recent report argues that the role of the EU ETS in the decarbonisation of the electricity sector has been limited as the allowance price remained below the coal-to-gas fuel switching price(Marcu et al., 2019). However, the report also notes that this might change with the recent increase in allowance prices and the changes to the EU ETS in Phase IV.

The Future of Carbon Pricing in the UK
25
A recent review found that New Zealand’s ETS was ineffective in reducing domestic emissions, and reforms are being developed to increase its effectiveness. New Zealand’s ETS was launched in 2007 and has undergone multiple reviews since then. Generous provisions to use international offsets and further changes to weaken impacts on market participants kept the allowance price too low to incentivise low-carbon investments and did not provide investment certainty. Consequently, the ETS has not facilitated substantial domestic emissions reduction (New Zealand Productivity Commission, 2018). New Zealand has enacted various policy changes to strengthen the price signal, including an end to international offsets and the two-for-one obligation rule, auctioning of allowances and a flexible cost containment reserve to replace the fixed price ceiling. Further changes are discussed in 2019, including a potential carbon price floor (ICAP, 2019). Together these changes have resulted in prices rising rapidly in the last three years.
The Regional Greenhouse Gas Initiative (RGGI)15 has likely reduced electricity emissions in the past, mostly by fuel switching. A recent study finds that electricity emissions declined faster in RGGI states than in other US states (B. C. Murray, Maniloff, & Murray, 2015). While it is statistically difficult to separate the effects completely, there is some indication that RGGI has partly driven this effect. Fuel switching to natural gas contributed most to the reduction in electricity emissions, followed by improved energy efficiency and increased renewable energy (Ceres, 2015). RGGI policymakers reformed the ETS as a response to low allowance prices, including a reduction in the cap and an update of SAMs.
In California, it is unclear what role the ETS has played in the state’s emissions reductions. California has managed to reduce its emissions notably in the past decade through multiple decarbonisation policies, including its cap and trade system (California Climate Investments, 2018). However, given the large number of overlapping policies operating in California the role of the ETS is unclear and may have been limited. The combination of an oversupply of allowances and the availability of renewable energy and natural gas resulted in an allowance constraint that might have not trigged additional low-carbon investments (Near Zero, 2017). The auction reserve price in the system prevented a further decline in allowance prices, which tracked the minimum price closely in recent years.
Overall, most ETSs had a limited role in past emissions reduction but this might change in the future with tighter caps and further market reforms. The initial oversupply of allocations, complementary policies and cheap abatement options in the electricity sector have resulted in low allowance prices and a limited contribution of ETSs to emissions reductions in most jurisdictions. However, this might not be a good indicator for the future of emissions trading in these jurisdictions. The annual caps will decrease in all jurisdictions and will require abatement beyond fuel switching and efficiency improvements, especially if net zero targets are adopted. Furthermore, most jurisdictions have adopted SAMs that can deal with low allowance prices and/or oversupply of allowances. Therefore, the contribution of ETSs to emissions reduction is likely to increase in the upcoming years.
Carbon prices are also common in many jurisdictions, including the UK. Carbon taxes are often simpler to implement and have been used in several EU jurisdictions to supplement the ETS. The UK’s current carbon pricing instruments are summarised in Box 3.
Box 3 Currently, the UK has multiple carbon pricing instruments in place
Emitters in the UK currently face the following carbon pricing instruments:
● The EU ETS on electricity, industry and EEA flights
● The Carbon Price Support (CPS), a carbon tax levied on electricity generation
● The Climate Change Levy (CCL) on non-domestic use of electricity, gas and solid fuels
15 RGGI includes the US states Connecticut, Delaware, Maine, Maryland, Massachusetts, New Hampshire, New York, Rhode Island and Vermont.

The Future of Carbon Pricing in the UK
26
Carbon taxes have the highest impact on emissions if set at a high level and sustained over time such as in Sweden. Most carbon taxes are set far below the levels required to meet the Paris Agreement (CPLC, 2017). For these carbon taxes, measurable impacts on emissions are low. In contrast, Sweden’s carbon tax of currently around £100/tCO2 in heating and transport had substantially reduced Sweden’s emissions in those sectors. In the transport sector alone, the carbon tax is estimated to have reduced Sweden’s emissions by 6% annually each year (Andersson, 2017). Figure 5 illustrates the emissions reductions in transport since the 1990s in Sweden.
Figure 5 The carbon tax had a substantial impact on transport emissions in Sweden
Note: Altered for clarity, graph includes emissions reductions due VAT changes implemented at a similar time. Source: German Federal Ministry for the Environment, Nature Conservation and Nuclear Safety (2018)based on
Andersson (2017)
Carbon taxes in Europe and British Columbia have been associated with emissions reductions relative to business-as-usual pathways and since 2008 absolute emissions reductions. The British Columbia carbon tax was estimated to have reduced fuel consumption and GHG emissions by between 5-15% over 2007-12, even though absolute emissions kept rising (Haites, 2018; B. Murray & Rivers, 2015).The Province of British Columbia (2019) notes that between 2007-16, real GDP growth of 19% was associated with net emissions decline by 3.7%. Since 2008, emissions subject to carbon taxes in European countries have declined in absolute terms. However, the role of supplementary policies in achieving these emissions reductions may sometimes be of equivalent or greater significance as carbon taxes (Haites, 2018).
The UK’s CPS has been one of several policies that together succeeded in incentivising investment in low-carbon electricity generation. The UK used around 33 million tonnes of oil equivalent (mtoe) of coal for electricity generation in 2012, which declined to around 7 mtoe in 2016 (Hirst, 2018). As an indication of this progress, the UK achieved its highest number of hours of electricity generated without coal-fired generation in 2018 and its power sector has decarbonised at a faster rate than the rest of Europe (Newbery, Reiner, & Ritz, 2018)(REA, 2018). However, The CPS worked in tandem with other policies such as the EU-wide emissions standards implemented by the 2010 Industrial Emissions Directive (IED) that also likely played a large role in reducing coal-fired electricity generation (BEIS, 2016).

The Future of Carbon Pricing in the UK
27
3.2 Integrating markets through linked ETS
Box 4 Key findings: Integrating markets through linked ETS
● Linking negotiations can be protracted, so if near term linking is sought this is likely to require a high degree of harmonisation of policy design.
● Linking is possible between ETS with substantively different designs, however cooperation between market regulators is required to ensure that efficient market functioning, environmental integrity and sufficient ambition are maintained.
● As with all international agreements, systems and processes should be established that govern agreed behaviour in the event of delinking.
This section discusses the experiences of linking carbon markets. While there have been limited experiences of direct carbon market linking the lessons from each attempt can be instructive. For a small linking partner, the decision to link has major implications for all subsequent design decisions, and for the long-term functioning of its market. The UK’s case on linking differs from other jurisdictions because it would first de-link from an existing system before linking to the same and/or different ETS. Nevertheless, after the UK leaves the EU ETS, its situation is very similar to jurisdiction’s that have not previously linked, and valuable lessons can be drawn from this experience.
In the early 2000s the UK developed a voluntary carbon market that has since been merged into the EU ETS. The UK’s voluntary carbon market became fully operational in 2003 and rewarded the participants with government payments in exchange for emissions reductions. The scheme ended in 2006 after the launch of the EU ETS and the UK blended existing climate policies(IETA, 2015b). The challenges of linking a UK ETS to the EU ETS in the future are different, mostly because both systems would continue to operate after linking. The massive overcompliance suggests that the effect of the ETS has been limited(Smith & Swierzbinski, 2007). The example from the early 2000s did not require rules for exchange and an alignment of policy design providing limited lessons for a potential linking agreement.
The linking arrangements between Switzerland and the EU illustrate the significant time taken and the importance of ETS size dynamics on influencing linking outcomes. The linking process took several years of negotiation. First negotiations began in 2011, were then finalised in 2017, and will become operational in late 2019. The establishment of a joint committee, composed of representatives from both Swiss and EU parties, was a successful initiative which acted as a forum for operationalisation, information sharing, and dispute resolution. The small size of the Swiss ETS means that the linked system will largely take on the characteristics of the EU ETS, in terms of price and rules. This is evidenced by the fact that the Swiss ETS will also integrate aviation emissions when the linking agreement comes into force. However, as the Swiss ETS is significantly smaller than the covered UK sectors, this suggests that the UK may face substantively different experiences.
Lessons from Australia-EU linking negotiations emphasise that two ETSs can maintain substantial differences in design and still link. This experience shows that with shared objectives and underlying principles for ETSs, negotiations can proceed rapidly, with negotiations commencing in 2011 and linking arrangements agreed by mid-2012. The initial design agreements illustrated that ETS can maintain different designs but still link so long as minimum standards are met. While Australia agreed to minor design amendments, the EU was not required to make any design changes which reflects its greater size and hence greater negotiating power. Linking talks were facilitated by both the EU and Australia having robust market regulations, particularly on MRV requirements, financial market rules, and exchange regulations. The Australian ETS was repealed before negotiations for a full link could be finalised. Outstanding topics to be negotiated included

The Future of Carbon Pricing in the UK
28
approaches to competitiveness, third party cooperation, offsets, and setting of caps and targets. These topics point to the potential main barriers to linking where coordination is likely to be required.
The ETS linking of Quebec and California was facilitated by both markets being subnational and initially designed according to common principles. Both jurisdictions are subnational and therefore did not face complications introduced by the international climate regime, such as the need to make corresponding adjustments as described under Article 6 of the Paris Agreement. Furthermore, both ETSs were designed according to Western Climate Initiative’s blueprint for a carbon market and thus already had relatively harmonised features when considering linking. This experience suggests that similar initial designs make linking significantly easier. Local stakeholder engagement also helped to facilitate linking as public comment on the proposed ETS rule amendments was legally necessary for California (Vaiciulis, 2013).
Carbon prices are uncertain and modelled flows of allowances between jurisdictions can be incorrect. Before the start of Quebec’s ETS, ex-ante modelling estimated that Quebec’s unlinked carbon price would be higher than California’s due to a power sector dominated with renewables and fewer low-cost emissions reduction opportunities (WCI Economic Modelling Team, 2012). Linking was estimated to make Quebec converge to California’s lower price and result in a flow of allowances to California (CARB, 2012). However, the launch of the scheme revealed that prices in Quebec are actually lower, leading to opposite effects than predicted (see Figure 6). While economic modelling can provide information about future prices in a linked system, markets are unpredictable with actual outcomes potentially significantly different to prior expectations.
Figure 6 Quebec’s auction allowance price effectively rose after linking with the Californian ETS
Notes: Currency conversions to US$ using ICAP (2018a) exchange rates Source: Vivid Economics based on CARB (2018a) and Environment Quebec (2018)
Linking with California raised Quebec’s auctioned carbon price, as linking leads to price convergence. Because California’s carbon market is approximately six times larger than Quebec’s, linking resulted in Quebec’s allowance price tracking California’s price. Before linking, Quebec’s settlement allowance prices were consistently around US$1-2 (£0.75-1.50) lower than California’s, prior to the beginning of joint auctions (EIA,
0
2
4
6
8
10
12
14
16
Pri
ce (
US$
/tC
O2e)
California settlement price California reserve price
Quebec settlement price Quebec reserve price
First joint auctions held in November 2014 and February 2015

The Future of Carbon Pricing in the UK
29
2015).16 After linking, the WCI joint auctions utilised the higher of the two auction reserve prices, adjusted by an auction exchange rate to reflect the multiple currencies (WCI, 2014). As Figure 6 illustrates, this resulted in allowance prices tracking Californian ETS prices, which was to be expected considering the relative sizes of the carbon markets. Thus, linking leads to convergence of carbon prices with more weight on the larger market.
Linking ETS provides greater market stability, particularly when allowance demand across jurisdictions is negatively correlated. A linked ETS results in a larger aggregate market which reduces price variability and allows for better absorption of economic shocks. However, the economic advantage offered by linking can vary depending on the characteristics of linking partners, and in certain circumstances individual linking partners can experience an increase in price volatility. However, the volatility reduction effect is emphasised when economic activity across the linked jurisdictions is negatively correlated (Doda & Taschini, 2016). Recent ex-ante modelling work calibrated using power sector emissions data from five jurisdictions supports theoretical findings that efficiency gains from linking are independent of cap selection and banking/borrowing restrictions (Doda, Quemin, & Taschini, 2018).
Linking necessitates that registries are technically linked in such a way that facilitates robust market functioning. A full registry link implies that allowances from both markets are fully fungible which facilitates allowance trading between jurisdictions and increases market liquidity. This requires not only that registries are technically compatible, but also that there is sufficient cooperation between market regulators in terms of transaction authorisation and validation and knowledge-sharing to provide confidence to the market of the link’s ability to minimise the risk of market abuse (Commonwealth of Australia & European Commission, 2013). Related to this, linking registries requires explicit transaction resolution processes to maintain environmental integrity, particularly to guard against potential double-counting. Explicit consideration must also be given to national accounting processes such that jurisdictions using foreign allowances can still meet their international obligations. This will become increasingly important as Article 6 mechanisms become codified and begin implementation.
Delinking arrangements are also important as jurisdiction’s circumstances, interests and positions may change which may require delinking. Having mechanisms and approaches specified in advance provides greater predictability for businesses and supports market stability in situations where delinking may occur.
The WCI ETS’s swift action after Ontario’s announcement to de-link helped ensure market stability. The auction immediately following Ontario’s de-linking from the WCI ETS resulted in full market clearance and very little unexpected or undesired outcomes. On the day of Ontario’s announcement to de-link, the WCI temporarily suspended the allowance accounts of all Ontario’s trading entities.17 This prevented the dumping of excess allowances onto the market and resulted in secondary market prices stabilising quickly. This reflects the market’s confidence in the WCI, the robust ETS design, and the effectiveness of decisive market intervention (Sutter, 2018).
The design of the EU-Switzerland ETS link applies different delinking rules. This would allow registry transactions to continue but would stop the use of the partner ETS’s allowances for compliance. That is, EU allowances could be transferred between the EU and Swiss registries but could only be surrendered in the EU.
16 The differences between ex ante modelled impacts and actualised impacts reflect both a general finding in the literature of carbon prices being lower than expected (Burtraw et al., 2018), and assumptions in the specific model used by the WCI Economic Modelling Team, such as not taking into account the impact of free allocations on allowance prices.
17 The revoking of Ontario’s ETS resulted in CA$2.8 billion worth of allowances purchased by Ontario entities with uncertain value (MOECC, 2018). However, Ontario has developed a plan to compensate such entities which were previously required to participate under the programme (MOECC, 2019)

The Future of Carbon Pricing in the UK
30
3.3 Carbon pricing in the climate policy mix
Box 5 Key findings: Carbon pricing in the climate policy mix
● Most ETSs cover power and industry. Several also cover transport and waste. Forestry is only covered in New Zealand and agriculture has not been covered to date. Carbon taxes tend to cover fuels in transport and energy. In some cases, carbon taxes operate in parallel to an ETS.
● Cap setting requires an assessment of the relationship between the ETS cap, sectors outside the ETS sectors and countries’ emission targets. Uncertain emission impacts of carbon taxes can make it difficult to align tax levels with emissions reductions targets.
● Crediting and offsets can expand the reach of carbon pricing. Quantitative and qualitative limits providing useful tools to maintain environmental integrity and price signal of a scheme.
● Supplementary policies can support carbon pricing and address non-price barriers to mitigation.
The UK government has announced it intends to legislate a target to reach net zero emissions by 2050. Given this intent it is important to consider what experience to date can indicate about which aspects of carbon pricing design are relevant for achieving this objective.
Reaching net zero requires a concerted economy-wide effort. The need to achieve a deep carbonisation of the UK economy and to mobilise greenhouse gas removal policies will influence the design of ETS policies and points to a role for non-price complementary policies.
The key policy issues in designing a climate policy mix to reach net zero include:
● Carbon pricing scope (Section 3.3.1);
● Setting the level of the cap or tax (Section 3.3.2);
● Determining the role of crediting or offset systems (Section 3.3.3); and
● Developing appropriate supplementary policies (Section 3.3.6).
3.3.1 Scope
International experience shows carbon pricing instruments have had varying design features regarding scope. This section discusses the experience of these scoping features in terms of coverage of sectors, gases, thresholds, and point of obligation.
Sector and GHG coverage vary in existing carbon pricing instruments. Table 5 below presents a summary of the sectoral and GHG coverage of major existing ETS. Most instruments cover power and industry sectors, but newer instruments are beginning to cover additional sectors. This includes emissions from buildings (Tokyo-Saitama), transport (California-Quebec), and waste (South Korea, NZ, Australia). Currently, only New Zealand currently covers the forestry sector and no system yet covers agriculture. GHG coverage depends on jurisdictions’ emissions profile and covered sectors. For example, any jurisdiction covering waste would necessarily be required to cover methane (CH4) emissions.
A narrower sectoral coverage can mean lower resilience to sector-specific shocks. In North America, a technological breakthrough in fracking, which increased natural gas supplies, contributed to natural gas prices falling by 46% over 2005-11 (ADB, 2016; B. C. Murray et al., 2015). Low natural gas prices resulted in gas-fired generators outcompeting emissions-intensive coal-fired generators in the North Eastern American electricity market and electricity sector emissions fell rapidly. As demand dropped, allowance prices fell
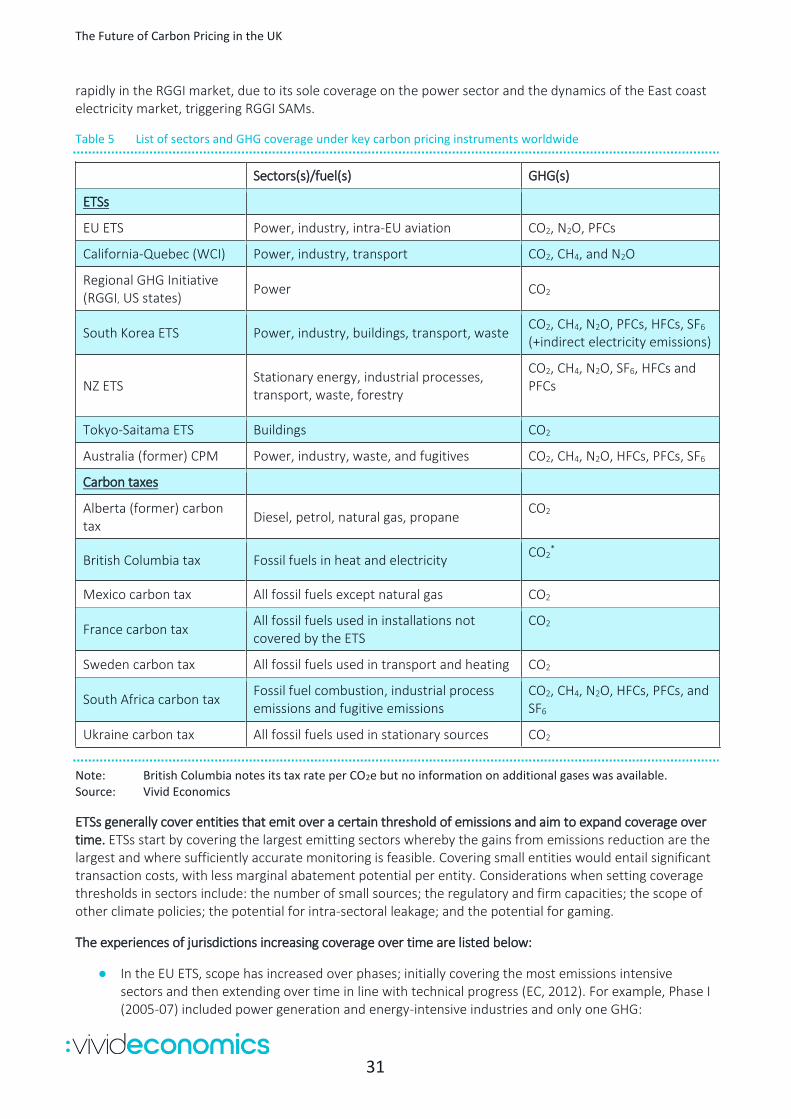
The Future of Carbon Pricing in the UK
31
rapidly in the RGGI market, due to its sole coverage on the power sector and the dynamics of the East coast electricity market, triggering RGGI SAMs.
Table 5 List of sectors and GHG coverage under key carbon pricing instruments worldwide
Sectors(s)/fuel(s) GHG(s)
ETSs
EU ETS Power, industry, intra-EU aviation CO2, N2O, PFCs
California-Quebec (WCI) Power, industry, transport CO2, CH4, and N2O
Regional GHG Initiative (RGGI, US states)
Power CO2
South Korea ETS Power, industry, buildings, transport, waste CO2, CH4, N2O, PFCs, HFCs, SF6 (+indirect electricity emissions)
NZ ETS Stationary energy, industrial processes, transport, waste, forestry
CO2, CH4, N2O, SF6, HFCs and PFCs
Tokyo-Saitama ETS Buildings CO2
Australia (former) CPM Power, industry, waste, and fugitives CO2, CH4, N2O, HFCs, PFCs, SF6
Carbon taxes
Alberta (former) carbon tax
Diesel, petrol, natural gas, propane CO2
British Columbia tax Fossil fuels in heat and electricity CO2
*
Mexico carbon tax All fossil fuels except natural gas CO2
France carbon tax All fossil fuels used in installations not covered by the ETS
CO2
Sweden carbon tax All fossil fuels used in transport and heating CO2
South Africa carbon tax Fossil fuel combustion, industrial process emissions and fugitive emissions
CO2, CH4, N2O, HFCs, PFCs, and SF6
Ukraine carbon tax All fossil fuels used in stationary sources CO2
Note: British Columbia notes its tax rate per CO2e but no information on additional gases was available. Source: Vivid Economics
ETSs generally cover entities that emit over a certain threshold of emissions and aim to expand coverage over time. ETSs start by covering the largest emitting sectors whereby the gains from emissions reduction are the largest and where sufficiently accurate monitoring is feasible. Covering small entities would entail significant transaction costs, with less marginal abatement potential per entity. Considerations when setting coverage thresholds in sectors include: the number of small sources; the regulatory and firm capacities; the scope of other climate policies; the potential for intra-sectoral leakage; and the potential for gaming.
The experiences of jurisdictions increasing coverage over time are listed below:
● In the EU ETS, scope has increased over phases; initially covering the most emissions intensive sectors and then extending over time in line with technical progress (EC, 2012). For example, Phase I (2005-07) included power generation and energy-intensive industries and only one GHG:

The Future of Carbon Pricing in the UK
32
CO2;Phase II (2008-12) added N2O, from nitric acid production; Phase III (2013-20) expanded sectoral and GHG coverage further, including the sectors petrochemicals, ammonia, nonferrous and ferrous metals and aluminium and PFC gases. EU ETS countries are also able to increase sector scope unilaterally under Article 24 of Directive 2003/87/EC, but to date no country has made use of it.
● In California, facilities in industry and power sectors were initially included if they emitted more than 25 ktCO2e per year. After 2015, it was expanded to cover retail sales of mineral transport fuels (such as gasoline, diesel, and natural gas).
● For New Zealand, ETS coverage expanded over time (ICAP, 2018b). In 2008, it included forestry and land-use emissions; in 2010 it expanded to include energy, industry and liquid fuels, and eventually included waste and synthetic emissions in 2014.
The EU allows certain small facilities to opt out of the ETS if they are subject to regulation which achieves equivalent emissions reductions as expected under the ETS. Smaller facilities include those with emissions less than 25 ktCO2e per year and/or combustion plants with thermal-rated input below 20 MW, and hospitals (European Commission, 2015c). In 2016, this applied to around 4 MtCO2 or 0.22% of total verified emissions (Glowacki, 2018).
The point of regulation is generally established at the point of emissions to ensure well targeted incentives, except where this imposes excessive administrative costs. The EU ETS and RGGI instruments impose the point of regulation at the facility level. California uses a hybrid approach, with facility level liabilities for some emissions sources such as power generation and industry, and upstream coverage for some sources like transport where applying liabilities at the point of emissions would impose excessive administrative costs. The NZ ETS generally imposes liability upstream from the point of emissions to reduce administrative costs.
The choice of scope is not isolated from other policy questions, as a larger scope can increase market liquidity and complicates linking. The inclusion of more sectors can increase liquidity, as more market participants are able to trade. The scope can also complicate linking with other ETSs if MRV is more difficult or more uncertain for some included sectors. For example, emission reductions in land use, land-use change and forestry (LULUCF) are more challenging to verify, such that potential linking partners might be concerned about the environmental integrity of a linked system.
Carbon taxes are generally applied at the point of fuel sale (upstream from emissions) and include a broader scope than ETSs. Most jurisdictions tax the carbon content of a fuel irrespective of its use. For example, Mexico’s carbon tax covers all fossil fuels except natural gas and Alberta18 covers diesel, petrol, natural and propane in all sectors. There are a few carbon taxes that cover only certain sectors; for example, Sweden’s carbon tax covers only transport and heating and France targets only sectors not covered by the ETS.
Some jurisdictions also operate carbon taxes in support of ETS to strengthen the price signal. While some jurisdictions, such as France and Sweden, implemented a carbon tax to extend carbon pricing to sectors that are not covered by the ETS, others apply a carbon tax to emitters that already must surrender allowances. For example, electricity generators in the UK must pay the Carbon Price Support on top of their ETS compliance. The Dutch government recently proposed a benchmarked carbon tax on ETS-covered industry that will be flexibly adjusted to reach a certain emissions reduction(Government of the Netherlands, 2019).
3.3.2 Cap and tax level
Setting the cap of an ETS or the level of a carbon tax is the primary means of determining the ambition of emissions reductions in covered sectors. A tighter cap or higher tax implies higher ambition and greater emissions reductions, whereas a lower cap or tax implies lower ambition but with lower costs.
18 Alberta’s new government repealed the carbon tax in May 2019.

The Future of Carbon Pricing in the UK
33
(1) Cap level
An ETS provides a degree of predictability regarding emissions for covered sectors. An ETS sets a cap for emission – the maximum level of emissions for covered sectors in a given. However, most jurisdictions also adopt flexibility mechanisms, such as banking or borrowing of allowances to manage price fluctuations over time, and SAMs to target price outcomes alongside quantity objectives. This means that in any one year the emissions in covered sectors may diverge significantly from the cap, however over time the general trajectory of emissions is more certain. This in turn means that increasing the scope of an ETS can provide greater certainty over the long-term emissions trajectory, as there is less potential for variation from the smaller uncovered sector.
In the absence of economy-wide ETS coverage, jurisdictions will need to consider the relationship between their ETS cap and achieving their target. Cap setting must consider overall abatement targets, the ambition of the instrument, and emissions from sectors not covered in the ETS. This is therefore closely related to the calculation of carbon budgets and the CCC’s role in UK climate policy. In principle, an ETS with economy-wide coverage could set a cap at the national target, but most ETSs do not include all emissions. Independent advice plays an important role in setting caps with Australia’s Climate Change Authority and the New Zealand Interim Committee on Climate Change both established with a remit to consider emissions caps and targets.
Depending on the approach taken ETS caps may need to be reviewed regularly. Given experience to date we can identify at least three approaches for approaching the relationship between covered and uncovered (uncovered) sectors in the development of caps:
● Effort sharing between covered and uncovered sectors, as adopted by the EU ETS
● Emissions trading as a safeguard to ensure targets are achieved, as in the early years of the Californian system
● Emissions trading as the primary driver of economy-wide mitigation, as in New Zealand and in Australia’s prior carbon pricing mechanism
There are different types of caps and targets that can be adopted by jurisdictions. Most ETSs use absolute caps and targets, which is the focus of this advice. However, some Chinese regional ETSs use emissions intensity caps to target GHG emissions per output. These aim to ensure that the economy improves its emissions efficiency but does not necessarily guarantee absolute emissions reductions in the event of significant economic growth. For example, Shenzhen sets an intensity cap due to its significant expected rate of growth and structural adjustment which results in a highly uncertain level of output (Qi & Cheng, 2018).
In the EU, there is a specific attribution of effort between covered and uncovered sectors and across jurisdictions. In the EU ETS, the cap is established in a manner that is set for the long term with a linear adjustment factor reducing the overall cap for covered sectors. This is complemented by effort-sharing decision to provide mechanisms for reaching overall EU target, even though coverage of the ETS is less than half of total emissions (European Commission, 2018). Cap setting is a political process with caps defined in the ETS directive and updated in preparation for phases. This inflexibility of caps provides certainty but can have negative effects if it means that the EU cannot respond quickly to shocks. The introduction of a SAM in the form of the MSR seeks to overcome this issue by providing for short to medium term supply flexibility in response to supply excesses or shortages. For uncovered sectors, EU member states are responsible for achieving the required emissions reductions under the effort sharing decision with additional policies, and face penalties if they fail to meet them.
An alternative approach to cap setting is taken in California where the ETS acts as a backstop, with the cap set in a manner that ensures California’s target is reached while mitigation is primarily driven by other policies. In this way the ETS is seen as a complement to other measures such as its Renewables Portfolio Standard, Low Emissions Vehicle Standards, Low Carbon Fuel Standard and agriculture and land sector policies. In this case the ETS acts as a safety net, to ensure economy-wide targets are met and mobilise low cost mitigation

The Future of Carbon Pricing in the UK
34
options that are not captured by other programs. Given this approach California’s relatively broad coverage of emissions and sectors acts alongside its cap setting arrangements to increase confidence that targeted emissions reductions are achieved.
The final approach is to see the ETS doing the heavy lifting as the main driver of mitigation. This for instance is the approach taken in New Zealand, where plans are in place to cover all major sources of greenhouse gas emissions within their ETS. New Zealand’s ETS was initially designed to be fully linked to the international CDM market, entailing no domestic cap. However, after de-linking occurred, it becomes important that the ETS set a domestic cap to ensure emissions reductions. Recent updates to the ETS will introduce a domestic cap and auctioning, as well as a long-term target to achieve net zero long lived greenhouse gases. These changes underpin the role of the ETS as the central policy mechanism for NZ to achieve its long-term targets.
In theory, the process for setting an ETS cap or carbon tax level is straightforward once the scope and relative stringency of the ETS is decided upon. To calculate the cap in covered sectors, the government can simply calculate the expected net emissions in the uncovered sector, and subtract these emissions from the overall target to calculate the emissions cap. The method for calculating the carbon tax level is similar, identify the level of emissions reductions required, calculate the expected emissions reductions at different price levels, and identify what tax level is needed to hit the right level of emissions.
However, large uncertainties in projected emissions introduce significant complexity to this process. In calculating projected emissions governments rely on models that estimate complex relationships drawing on a set of assumptions. Emissions depend on factors including the level of economic growth, the effectiveness of a given policy mix, and the development of mitigation technologies, all of which are unknown. As such, if assumptions regarding any of these parameters are incorrect projected emissions will also be wrong, which means emissions in uncovered sectors (and covered sectors for a carbon tax) may be miscalculated which means that the cap or tax level then needs to be adjusted over time in order to achieve the jurisdiction’s emissions reduction targets. These models also may not account for non-price barriers to action, these barriers are common across sectors and mean that for cost-effective pathways to be realised a wide range of supplementary policies may be necessary.
Given this uncertainty jurisdictions can implement a ‘set, review, amend’ philosophy towards cap-setting. This approach was adopted under Australia’s former ETS where the Climate Change Authority advised on targets and caps, with a focus on identifying both explicit caps in the medium term, alongside a longer-term range that sets the bounds of expectations regarding targets and reflects the need for policy to respond to uncertainty. In Australia the cap was set based on the abatement effort needed given expected emissions from uncovered sectors. That is, uncovered emissions were not explicitly targeted but instead emissions were projected taking account of current policies which in turn was used to back calculate ETS caps.
Appropriate cap setting arrangements will become ever more important given the government’s intention to legislate a net zero target. Tying caps to this long-term net zero target will require a balance between the expected emissions reductions from covered and uncovered sectors, and particularly the impacts of other policies such as approach to allocations (see Section 3.4.1 and mobilisation of GGRs (see Box 7). To date, there is little experience of this across jurisdictions.
Experience to date has been that ETS caps have been less stringent than first anticipated. This has multiple drivers, with low costs in part due to economic and technology shocks as well as substantial renewable energy support policies. In the EU this led to a significant oversupply developing following the European Recession in 2008 which continues to affect the EU ETS more than a decade later. If the UK ETS cap is set too loose then this creates a risk that a large oversupply could develop if effective SAMs are not in place.
In general, ETS caps are set in phases, but additional approaches such as rolling annual caps could be considered. In the EU ETS, cap setting has been focused across four phases. This is a useful method, given the relatively slow process to introduce regulatory changes in the EU and its ability to align with natural review cycles. Over Phase I (2005-08) and II (2009-12), a decentralised approach was taken, determining the EU cap based on an aggregation of national allocation plans from Member States. Over Phase III (2013-20) a single

The Future of Carbon Pricing in the UK
35
EU-wide cap was set, with a constant annual linear reduction factor of 1.74%. Over Phase IV (2021-30), the single EU-wide cap remains, but the annual linear reduction factor increases to 2.2%. In California, caps are set for three-year compliance periods in line with longer term emissions budgets. California’s method is the result of estimating annual allowance budgets from 2013-2050 that are aligned with a linear extrapolation from the State’s 2030 emissions target(CARB, 2011).
(2) Tax level
Setting an appropriate carbon tax level is a bigger challenge. Where an ETS provides at least a predictable trajectory for emissions over time, if a carbon tax results in emissions that are below or above a jurisdiction’s target it can be very difficult to know if this is a temporary aberration or a signal of a longer-term trend.
Carbon tax levels vary greatly around the world and are rarely set high enough to trigger substantial emissions reductions. Current carbon tax levels span from less than £1/tCO2 in Ukraine to about £100/tCO2 in Sweden, with most emissions priced below £25/tCO2(World Bank Group, 2019). Carbon taxes are most impactful if set at a high level and sustained over time(Haites, 2018). In contrast, most carbon taxes to date are too low to achieve the targets of the Paris Agreement (CPLC, 2017).
The primary benefit of carbon taxes is that they can provide greater certainty regarding carbon prices, which can enable low carbon investments. However, in practice carbon taxes have been changed or frozen as government priorities are reassessed with annual budget cycles and given political opposition. British Columbia’s carbon tax rate was frozen between 2012 and 2017, before its rising trajectory was reinstated. A similar freeze has also occurred in the UK where the Carbon Price Support has been frozen at its current maximum level of £18/tCO2e since 2014, despite being scheduled to increase to a maximum of £30/tCO2e by 2020. In France, the government’s plan to increase the carbon tax sparked the Yellow Vests protests and the increase has been postponed.
This propensity for carbon taxes to be frozen alongside the uncertain quantity of emissions reduction under a price-based mechanism may make it difficult to target a long-term emissions reduction objective.
3.3.3 Crediting and offsets
A carbon pricing instrument can also incentivise emissions reductions in uncovered sectors by introducing offsetting arrangements.
ETS rules can directly incentivise sequestration by crediting emissions that are sequestered in covered sectors. For instance, the coverage of forestry under the New Zealand ETS enables forestry sequestration to be credited, with mitigation from this source expected to be central to achieving their net zero long lived greenhouse gases target. However, current EU ETS rules do not cover forestry sectors or allow for the crediting of emissions sequestration from activities such as bioenergy with carbon capture and storage (BECCS). As such, either changes to ETS rules in the longer term or supplementary policies would be required to incentivise sequestration activities in covered EU sectors.
The other approach tends to be the use of offsets, where emissions reductions or sequestration from uncovered sectors receive credits and can be used for compliance for covered entities. Offsets allow entities regulated under a carbon price to use lower cost, verified emissions reductions from external sectors to cover their compliance obligations. These emissions reductions can arise from negative emissions activities such as CCUS or nature-based solutions, or mitigation measures in uncovered sectors (for example waste, or transport). Offsets are typically used in ETSs subject to certain limits:
● Qualitative limits: generally, ETSs limit offset eligibility to domestic projects or specific project types. However, several ETSs (for example, the EU, South Korea, early years in the NZ ETS, Australia) also

The Future of Carbon Pricing in the UK
36
allow international offsets (commonly from the CDM market)19 to be used for compliance. Domestic forestry emissions reductions are often eligible to be credited, such as in California’s ETS.
● Quantitative limits: ETS frequently impose quantitative limits on offset use, in order to limit the impact that the offset system can have on allowance prices. Most ETS limit offset use to 10% or less of an entity’s compliance obligation. However, notable exceptions to this include Australia’s CPM which planned to allow international offsets for up to 50% compliance, before this threshold was reduced to 12.5% to enable linking with the EU ETS; Tokyo-Saitama’s ETS which allows unlimited use of certain offsets; and New Zealand’s ETS which previously allowed unlimited use of Kyoto offsets.
Offsets can be provided from domestic or international sources, with domestic offsets provided from uncovered sectors of the same jurisdictions, and international offsets from other jurisdictions. These have different implications for costs and environmental integrity as discussed below.
3.3.4 Domestic offsets
Greenhouse gas removal measures (GGRs) are often concentrated in uncovered sectors, such as the agricultural and forest sectors, which makes finding mechanisms to mobilise investment crucial. However, these sectors are often not included under carbon prices due to a lack of readiness of firms and difficulties in measuring emissions. Domestic offsets provide a self-selection mechanism to help address these challenges.
Forestry and agricultural sectors often involve firms with low readiness to participate in carbon markets, but offsets allow self-selection of firms with sufficient readiness to participate. When the extent of emissions reductions for a given sector or source are uncertain, complex or costly to measure, there is a case for implementing an offsetting system rather than covering the sector under an ETS. This is because an offset regime does not require participation from all firms, including those that have difficulty in measuring emissions. Rather, firms with greater readiness can self-select into the offset mechanism, while those who are not, will not experience the administrative costs-associated with carbon pricing. For instance, agriculture has a mix of small-scale farms operating alongside large agribusiness that can deal with far higher administrative and regulatory complexity. Small firms may also face substantially higher costs from measuring emissions than larger firms.
Domestic offsets can build readiness for participating in carbon pricing mechanisms by building firm capacity and creating ‘business ecosystems’ that support trade. By encouraging the establishment of mechanisms for measuring emissions reductions and market trading, crediting builds capacity for the entities conducting the projects in uncovered sectors. For instance, it can also improve knowledge and capacity of financial institutions funding projects in these sectors and verifiers measuring emissions.
Offset systems may also be appropriate when the accuracy of emissions measurement is low for a certain source of emissions but relatively high for a mitigation intervention. For instance, measuring emissions from the waste sector can be challenging, as emissions are often geographically dispersed, and emissions are determined by factors including the composition of waste at the time of deposition, weather and time elapsed. However, emissions reductions from methane capture and combustion projects in the waste sector are comparatively easy to measure directly at the point of combustion, making this a potential candidate for crediting. Further, these mitigation measures can often be achieved at low marginal cost and including them under an offset regime could imply significant cost savings for regulated entities.
Offset crediting mechanisms can provide a form of cost containment when linked with carbon pricing mechanisms. If firms are struggling to meet their obligations under an ETS, offset credits may be used to fulfil these requirements. For instance, domestic offset credits can be used for a limited amount of compliance in the California ETS and under Colombia’s carbon tax.
19International offsets available through linking to international carbon markets such as the CDM market, may not help achieve a net zero domestic emissions target. However, in the future they may mobilise significant flows of climate finance to support mitigation in developing countries.

The Future of Carbon Pricing in the UK
37
To establish an offset system, first a reliable crediting mechanism is required for measuring and verifying volumes of emissions reduced, avoided or sequestered. Examples of crediting mechanisms are many, the UK’s Woodland Carbon Code is effectively a crediting system that measures the sequestration of emissions in forests. Domestic crediting mechanisms have been established in Australia, California, British Columbia and South Africa, amongst others.
Careful design and regular review of these crediting mechanisms is essential to ensure environmental integrity. A 2014 review of Australia’s crediting system noted four main risks to environmental integrity (Climate Change Authority, 2014):
1. emissions reductions that were measured or estimated did not occur, or occurred to a lesser extent (measurement risk)
2. emissions reductions occurred, but would have happened even without the scheme (additionality risk) 3. emissions reductions relate to sequestration that didn’t persist (permanence risk) 4. the project triggered an increase in emissions outside the project (leakage risk).
The Australian review concluded that at the time, its crediting system achieved a reasonably high level of environmental integrity and achieved real reductions in emissions that would not otherwise have occurred. However, crediting mechanisms often face criticisms regarding these potential risks, with for instance concerns raised regarding the provisions to account for leakage from California’s offset system (Haya, 2019), and the additionality of the Australian system (Burke, 2016).
To date, forestry and other land sector projects have generated by far the most offsets. However, significant issues have also been associated with projects to reduce emissions from waste, industrial gases, energy fugitives and agriculture.
Table 6 Issuance of domestic offsets in Australia, British Columbia and California, by sector
Issuance MtCO2e
LULUCF Agriculture Waste Energy fugitives
Industrial gases
Energy and transport
Australia 42.2 0.6 21.1 0.8 - 0.6
British Columbia
3.8 - 0.1 - - 1.0
California 123.8 5.9 - 6.1 19.7 -
Total 169.8 6.4 21.1 6.9 19.7 1.6
Note: For consistency categorisations have been aligned across sources Source: Vivid Economics drawing on data from Government sources in California, Australia and British Columbia,
as of July 2019.
Alongside a crediting mechanism, for offsets to be successful requires rules to mobilise demand for these activities. This could either be achieved through direct coverage of emissions and sequestration sources (e.g. NZs coverage of forestry), by allowance emitters to offset compliance liabilities (e.g. California’s ETS domestic forest offsets) or by identifying alternative demand sources. Alternative sources of demand could include direct government purchase, or obligations on uncovered sectors such as transport. Australia provides an example of a crediting mechanism that creates demand through two mechanisms, an emissions obligation on energy and industrial emitters, and direct purchase by government through auctions.
3.3.5 International offsets
International offsets have many of the benefits of domestic offsets and provide a channel for climate finance to developing countries with low-cost abatement opportunities. However, experience with offsets has been

The Future of Carbon Pricing in the UK
38
mixed because international offsets can be hard to monitor and verify, creating additional risks regarding environmental integrity.
Quantitative limits on international offsets have been applied in many situations and its large size means that smaller domestic markets can be overwhelmed by offset market outcomes. For example, the NZ ETS was initially introduced with unrestricted linking to the international CDM market. When the financial crisis occurred, steep reductions in the Certified Emissions Reduction (CER) price resulted and the significant size of the CDM market meant that this also led to rapidly falling NZU prices, shown in Figure 7. This dramatic fall in prices may have compromised the local emissions reduction incentive. In 2012 the NZ government announced that it would de-link from the Kyoto market which occurred in mid-2015. In 2017, the government stipulated that any future allowance of international offsets in the NZ ETS would be accompanied by quantitative limits (Leining & Kerr, 2018).
Figure 7 Unrestricted use of international offsets overwhelmed the NZ ETS
Notes: Currency conversions to EUR using ICAP (2018a) exchange rates Source: Vivid Economics
Qualitative limits have also often been placed on the use of international offsets in several ETS. These are usually imposed to address concerns regarding environmental integrity of certain projects; however, they can also be used to target preferred source countries or technologies. The EU ETS introduced restrictions such that Kyoto credits weren’t allowed if sourced from nuclear energy, LULUCF or industrial gas destruction projects. They also introduced restrictions on the use of credits from hydroelectric projects and from projects that were not sourced from least developed countries. Similar restrictions were put in place by New Zealand, and under the former Australian ETS.
International aviation and maritime emissions receive different treatment under the international climate regime as their emissions do not relate to any single country. These sectors, especially aviation, are also difficult to decarbonise, which means that they are likely to rely on offsetting in order to reduce emissions. This is the approach that will be taken for cutting emissions from international aviation via (CORSIA) expanded on in Box 6 below.

The Future of Carbon Pricing in the UK
39
Box 6 Offsetting emissions from international aviation
The International Civil Aviation Organisation (ICAO) plans to implement a market-based measure to limit emissions from international aviation. This measure, known as the Carbon Offsetting and Reduction Scheme for International Aviation (CORSIA), uses market incentives to ensure that aviation experiences carbon neutral growth from 2020 onwards. To achieve this, CORSIA will rely on the use of purchasing emissions offsets to achieve additional mitigation not possible through technological, operational, or fuel-switching methods. CORSIA will impose a baseline level of emissions in 2020 and require any growth in sectoral emissions in subsequent years to be counteracted through the purchase of emissions offsets. The offset obligations will be shared amongst aircraft operators participating in the CORSIA, based on a sectoral growth factor and individual operator’s emissions.
A key challenge for offset mechanisms such as this is the need to ensure offsets have sufficient environmental integrity. Due to the significant likely demand generated by CORSIA, there will be pressure on the system to accept offsets with potentially lower standards of environmental integrity. The UK could help strengthen CORSIA by considering requiring supplementary quantitative and qualitative limits on CORSIA eligible units for UK-origin covered flights.
3.3.6 Supplementary measures
A variety of market failures can prevent a carbon price signal of an ETS or carbon tax from delivering efficient behavioural responses and lowest cost abatement. Limited accounting for co-benefits of R&D and low-carbon technologies can result in under-investment. For example, social benefits, knowledge spillovers and network effects mean that the total private return to such investments is less than the total social return, which inevitably leads to suboptimal private investment (Stiglitz & Stern, 2017). Direct policy measures can help address this under-investment, such as R&D funding and low-carbon technology subsidies, which can unlock accompanying mitigation measures. For instance, transport electrification may require investment to reduce the emissions intensity of electricity. Another market failure is a lack of access to finance for low-carbon projects due to perceptions of high risk. Policy makers can address this by establishing green investment banks to finance low-carbon projects or by directly de-risking investments through regulatory changes or guarantees. Australia’s Clean Energy Finance Corporation fulfils this role by building the sector’s capacity to appropriately assess and invest into low-carbon projects. A lack of information and behavioural biases can be another barrier to private low-carbon investment. For example, people often do not have sufficient information on energy bills to induce increased energy efficiency behaviour. Governments are supporting smart metering systems to overcome this barrier and assisting consumers to monitor energy use.
During the nascent years of carbon pricing, prices may be too low to achieve desired abatement and the complementary policies described above can help deepen emissions reductions. The High-level Commission on Carbon Pricing estimates that the explicit carbon price consistent with achieving the Paris Agreement will be around US$40-80/tCO2 (£30-60/tCO2) by 2020 (Stiglitz & Stern, 2017). Yet, in 2019 close to 50% of global emissions were priced below US$10/tCO2 (£7.50 /tCO2) (World Bank Group, 2019). As such, complementary policies such as funding for low-carbon technologies, infrastructure investment for renewables and R&D support are vital to facilitating further emissions reductions and ultimately achieving Paris goals. Complementary policies are likely to be especially important for GGRs, as discussed in Box 7.
The UK’s carbon price support (CPS) was designed to top up EU ETS prices and improve incentives for decarbonisation of power. The CPS tops-up the EU allowance price in the UK electricity sector by charging fossil fuel electricity generators an additional fee. This was against the backdrop of the UK’s commitment to channel £200 billion investment to low-carbon energy by 2020 and a concern over low EU allowance prices (HMRC, 2010).The CPS was one of several policies that together succeeded in driving decarbonisation of the UK electricity sector at a faster rate than the rest of Europe(Newbery et al., 2018), with the UK’s use of coal for electricity generation decreasing by around 80% over the period 2012-16(Hirst, 2018).
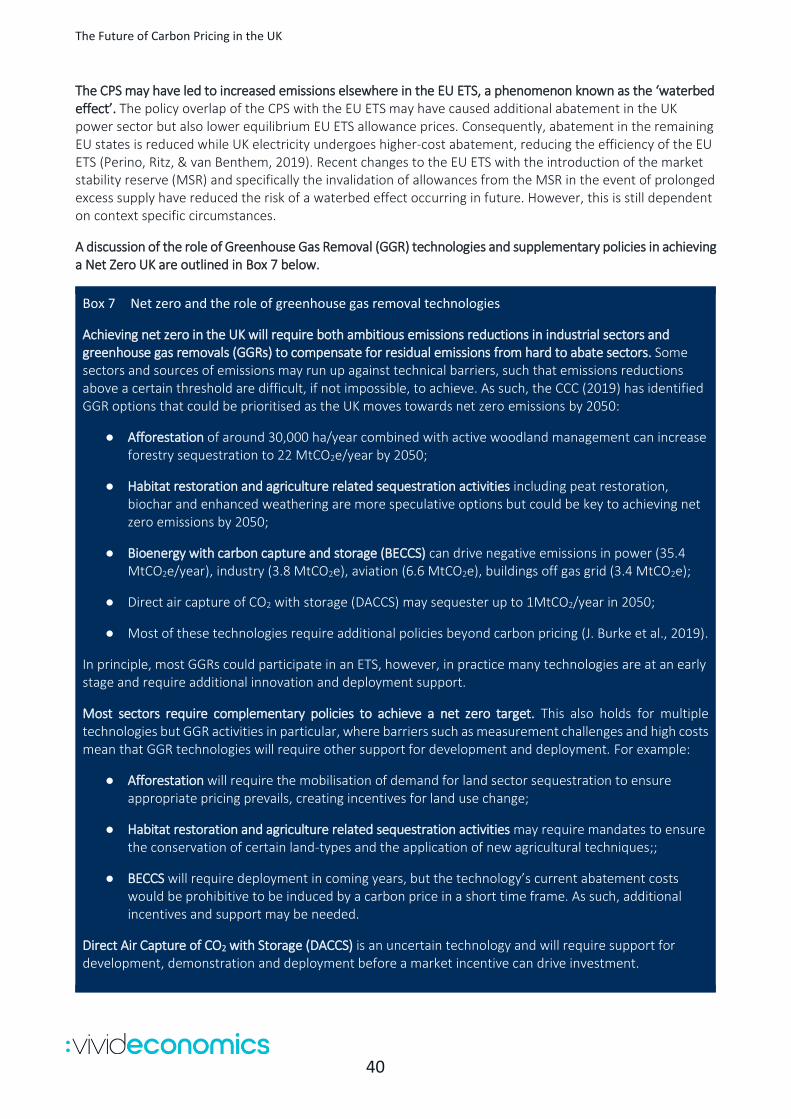
The Future of Carbon Pricing in the UK
40
The CPS may have led to increased emissions elsewhere in the EU ETS, a phenomenon known as the ‘waterbed effect’. The policy overlap of the CPS with the EU ETS may have caused additional abatement in the UK power sector but also lower equilibrium EU ETS allowance prices. Consequently, abatement in the remaining EU states is reduced while UK electricity undergoes higher-cost abatement, reducing the efficiency of the EU ETS (Perino, Ritz, & van Benthem, 2019). Recent changes to the EU ETS with the introduction of the market stability reserve (MSR) and specifically the invalidation of allowances from the MSR in the event of prolonged excess supply have reduced the risk of a waterbed effect occurring in future. However, this is still dependent on context specific circumstances.
A discussion of the role of Greenhouse Gas Removal (GGR) technologies and supplementary policies in achieving a Net Zero UK are outlined in Box 7 below.
Box 7 Net zero and the role of greenhouse gas removal technologies
Achieving net zero in the UK will require both ambitious emissions reductions in industrial sectors and greenhouse gas removals (GGRs) to compensate for residual emissions from hard to abate sectors. Some sectors and sources of emissions may run up against technical barriers, such that emissions reductions above a certain threshold are difficult, if not impossible, to achieve. As such, the CCC (2019) has identified GGR options that could be prioritised as the UK moves towards net zero emissions by 2050:
● Afforestation of around 30,000 ha/year combined with active woodland management can increase forestry sequestration to 22 MtCO2e/year by 2050;
● Habitat restoration and agriculture related sequestration activities including peat restoration, biochar and enhanced weathering are more speculative options but could be key to achieving net zero emissions by 2050;
● Bioenergy with carbon capture and storage (BECCS) can drive negative emissions in power (35.4 MtCO2e/year), industry (3.8 MtCO2e), aviation (6.6 MtCO2e), buildings off gas grid (3.4 MtCO2e);
● Direct air capture of CO2 with storage (DACCS) may sequester up to 1MtCO2/year in 2050;
● Most of these technologies require additional policies beyond carbon pricing (J. Burke et al., 2019).
In principle, most GGRs could participate in an ETS, however, in practice many technologies are at an early stage and require additional innovation and deployment support.
Most sectors require complementary policies to achieve a net zero target. This also holds for multiple technologies but GGR activities in particular, where barriers such as measurement challenges and high costs mean that GGR technologies will require other support for development and deployment. For example:
● Afforestation will require the mobilisation of demand for land sector sequestration to ensure appropriate pricing prevails, creating incentives for land use change;
● Habitat restoration and agriculture related sequestration activities may require mandates to ensure the conservation of certain land-types and the application of new agricultural techniques;;
● BECCS will require deployment in coming years, but the technology’s current abatement costs would be prohibitive to be induced by a carbon price in a short time frame. As such, additional incentives and support may be needed.
Direct Air Capture of CO2 with Storage (DACCS) is an uncertain technology and will require support for development, demonstration and deployment before a market incentive can drive investment.

The Future of Carbon Pricing in the UK
41
3.4 A well-functioning market
Box 8 Key findings: A well-functioning market
● Allocation mechanisms are a balance between preventing carbon leakage, preserving incentives to reduce emissions and generating revenue to finance other climate and policy objectives. The important of reducing carbon leakage risk will increase in importance with the expected rise in carbon prices and differences in carbon prices between markets.
● Supply adjustment mechanisms (SAMs) can stabilise prices. To date these have focused on supporting prices. As ambition increases, price containment will become increasingly important.
● Banking and, to a lesser extent, borrowing, are used in most ETSs around the world and provide temporal flexibility in abatement decisions.
● Secondary markets benefit from broader ETS scope and participation of active traders, including third parties, to create a deep and liquid market.
Carbon pricing seeks to change incentives so that businesses and consumers change their behaviours to reduce emissions, yet this can only happen in a framework that ensures well-functioning markets. The experience of jurisdictions to date suggest that market design should be assessed based on the likely impact on issues including competitiveness, market stability, market liquidity and the development of secondary markets. The performance of markets will be influenced by policy decisions including:
● the allocation of allowances and tax rebates (Section 3.4.1),
● design of SAMs (Section 3.4.2),
● rules regarding banking and borrowing (Section 3.4.3), and
● rules to determine market size and participation (Section 3.4.4).
The impact of policy choices on market functioning is considered in detail in the remainder of this section.
3.4.1 Allocation and rebates
Free allocation under an ETS and rebates under a carbon tax primarily aim to address carbon leakage. In this case free allocations are used to reduce risks of carbon leakage in ETS while rebate approaches can be used for carbon taxes. Allowances that aren’t allocated for free can be auctioned and provide potentially significant flows of revenue that can be used for alternative policy objectives. Rebates under carbon taxes serve to reduce compliance costs and can be aligned to emissions intensity benchmarks to incentivise abatement.
Allowance auctions take place in ETS across the world to facilitate allowance price discovery using exchange platforms. The UK undertakes regular allowance auctions through the Intercontinental Commodity Exchange (ICE) platform, while other EU Member States undertake auctions through the common European Energy Exchange (EEX) platform. The California-Quebec ETS implement joint, quarterly allowance auctions through the Western Climate Initiative (WCI) platform. Similarly, in RGGI, allowance auctions take place every quarter through a platform administered by Enel X. The Korea Exchange also hosts quarterly auctions for the Korean ETS.

The Future of Carbon Pricing in the UK
42
Free allocations should be targeted to firms or products that are at risk of carbon leakage. Firms are at risk of carbon leakage if their goods fulfil two factors at the same time:
● The product is emissions intensive, implying that a carbon price increases the production costs substantially
● The product is trade exposed to jurisdiction without (similar levels of) carbon pricing, implying that firms cannot pass through carbon costs onto the consumer because of international competition.
Most jurisdictions target assistance to sectors that are emissions-intensive and trade-exposed. Quantitative tests on historic emissions intensity and trade exposure are accepted as best practice in most jurisdictions. These tests are sometimes supplemented with qualitative assessments and stakeholder engagement.
Once eligible sectors or firms have been identified there are several ways of allocating free permits:
● Grandfathering (e.g. Phase 1 and 2 EU ETS);
● Fixed sector benchmarking (Phase 3 and 4 of EU ETS); and
● Output-based allocations (California).
Table 7 compares these allocation options against auctioning, as an alternative means of allocation.
The grandfathering method of free allocation has been used in the early stages of ETS implementation. Grandfathering allocates free allowances in proportion to an individual facility’s historical emissions. Prominent examples of systems using grandfathering include the first two phases of the EU ETS (from 2005-07 and 2008–12), the first phase of the South Korea ETS (for most sectors), and Chinese ETS pilots.
Providing free allocation to sectors not genuinely at risk of carbon leakage has resulted in those sectors receiving windfall profits. Free allocation of allowances in the EU ETS to the power sector resulted in windfall profits as they did not face higher carbon costs but nonetheless passed through potential carbon cost impacts to consumers (opportunity cost pricing). Cost pass-through in the power sector is possible because it is generally not exposed to international competition, with free allocation possibly leading to windfall profits, as discussed in Box 9. This redistributive effect is amplified for lower-income households, whose electricity bill takes up a larger proportion of total costs (European Commission, 2014a). Certain industries may also experience windfall profits; CE Delft (2016) estimated at least €3bn of windfall profits in the UK between 2008 and 2014. Branger & Quirion (2015) suggest that the European cement industry gained an additional €3.5bn from overallocation between 2005 and 2012.
However, the proportion of free allocations in the EU ETS was reduced significantly from Phase II (2008-12), when almost all allowances were allocated for free, to Phase III (2013-20) when less than half were. In Phase III new criteria were adopted to better target allowances to EITE firms. In Phase IV (2021-30) free allocations will be limited to less than 43% of the overall cap. Allocations to individual installations will also be made more flexible, as these will be adjusted annually to reflect relevant increases and decreases in production of more than 15% on the basis of a rolling two-year average.
Box 9 Cost pass-through of freely allocated emissions allowances in the power sector
Allocating free allowances to the electricity sector can allow electricity generators to earn windfall profits due to ‘opportunity cost pricing’. When allowances have been freely allocated, electricity generators bid to produce electricity at prices which include the opportunity cost of surrendering emissions allowance rather than selling it on the ETS market. This raises the price at which generators are willing to produce electricity, as they could earn revenue below a certain threshold from merely selling allowances

The Future of Carbon Pricing in the UK
43
(European Commission, 2015c). However, because allowances have been received for free, increased revenue from higher prices represents a windfall profit.
As wholesale electricity prices are generally determined by a marginal fossil fuel generator, the consumer electricity price will rise by the value of carbon price. All dispatched generators with marginal costs below the marginal generator, even carbon-emitting generators, receive extra revenues due to the price increase, and thus earn windfall profits. Additionally, large industrial electricity consumers receive indirect cost compensation in many EU member states, including the UK. This represents a redistribution of welfare away from consumers to electricity producers. If electricity were traded in the international market, then generators would be forced to surrender free allowances to price competitively against generators in markets without carbon pricing.

The Future of Carbon Pricing in the UK
44
Table 7 Advantages and disadvantages of different free allocation methodologies
Allocation method Description Advantages Disadvantages Example Jurisdictions
Auctioning
Selling allowances via a market mechanism (periodic auctions) ensures efficient functioning of the trading market and maintains incentives for abatement by providing a price signal. This method creates revenue.
Raises revenue and requires less political input. Auctions also facilitate price discovery; does not distort incentives; and reward early action.
No direct support for carbon leakage sectors and may bias against smaller firms.
Remaining emissions not freely allocated in most ETSs including EU ETS Phases III and IV and California.
Grandfathering
Freely allocating allowances to firms based on their historical emissions – either directly or past production or fuel use multiplied by an emissions factor. Allocation is independent of current production.
A simple methodology to support sectors with easily available data. Demand-side abatement incentives maintained.
Long-term reliance reduces abatement incentive. Theoretically weak prevention of leakage, as firms’ incentives not affected. Windfall profits may occur and early action is penalised.
EU ETS Phase I and II
Fixed sector benchmarking
Allowances allocated to firms are based on their past production multiplied by a product or sector level benchmark of emissions intensity (either average or indexed to a subset of efficient firms). The overall amount of free allowances is only infrequently updated.
Rewards early action and incentivises longer term efficiency improvements. Demand-side abatement incentives maintained.
Sector benchmark calculations are data-intense and complicated. Windfall profits and reduced production still possible.
EU ETS Phase III
Output-based allocation
Emissions-intensity benchmarks (either sector-level or a firm’s historical emissions intensity) are used to determine allocation in conjunction with the most current production data. The use of current production data entails greater sensitivity in terms of allocation decisions.
Incentivises emissions intensity improvements while maintaining output. Risk of windfall profits minimised. Strong, targeted leakage prevention.
Benchmark calculation and current production data difficulties. Less demand-side abatement incentivised as user prices less affected. Adherence to overall ETS cap not certain.
California, New Zealand, Oregon (prospective), Quebec, South Korea
Source: Vivid Economics adapted from PMR (2015b, 2016)

The Future of Carbon Pricing in the UK
45
However, free allocation in ETS around the world has gradually moved towards a more targeted, benchmarking approach over time. In Phase III the EU ETS introduced fixed sector benchmarking to provide support while maintaining abatement incentives. Fixed sector benchmarking allocates allowances to facilities based on a function of their past production and product- or sector-level emissions intensity benchmarks. The California cap-and-trade uses output-based allocation to reward efficiency and reduce the potential for thresholds to influence incentives. Output-based allocation methods provide free allowances according to a pre-determined emissions intensity benchmark and adjust allocations if facilities change their output. Facilities that are more efficient than their competitors are rewarded using benchmarking, and the system ensures that an entity cannot increase its allocation by artificially increasing or decreasing production because allocation is directly linked to current output levels (EDF, CDC Climate, & IETA, 2015). In Phase IV of the EU ETS, free allocation will be based on more regularly updated production data to more closely align with output-based allocation. Figure 7 summarises the key dimensions of different allocation mechanisms
Figure 8 Two key aspects distinguish four methodologies to allocate free allowances
Source: Vivid Economics
Ex-post evidence suggests that little to no carbon leakage has occurred in the EU ETS to date. Dechezleprêtre et al (2018) investigated the impact of the first two EU ETS Phases and found no impact on economic performance of regulated firms and even identify an increase in revenue and fixed assets. Similarly, a literature review of key empirical studies on carbon leakage between 2007 and 2013, mainly focused on the EU ETS and often within the cement and iron and steel sectors, finds no strong evidence of the occurrence of carbon leakage. While this might be evidence of the success of support mechanisms, carbon prices may also have just been too low as of yet to stimulate wider-ranging leakage, or measurement inaccuracy may be such that real leakage is not being found (Vivid Economics, 2015).20
Firms in California may be particularly vulnerable to carbon leakage risk due its ETS being sub-national and highly trade exposed, but there is little robust evidence of carbon leakage. To help address carbon leakage,
20The existence of carbon leakage may be more important for smaller states and when there are carbon price differentials between states. Næss-Schmidt (2011), for example, finds that for every 100 tCO2 abatement achieved in the sectors most at risk of carbon leakage in the Nordic countries, emissions in other EU countries increase by 102 tCO2. This is explained by Nordic countries on average having a 33% higher internal carbon price than the EUA price and Nordic industries being more energy efficient and consuming electricity with lower carbon-content than neighbouring countries.

The Future of Carbon Pricing in the UK
46
the carbon price has been extended to include electricity imports, effectively imposing a subnational border carbon adjustment (BCA) (CARB, 2011; IETA, 2015a). However, leakage may still be occurring due to the complexity of power contract chains. These chains can become so entangled that the source of power becomes unknown, at which point they become ‘unspecified’ emissions sources which are given default emission rates of natural gas power plants (Roberts, 2014). If the actual source of electricity has an emission intensity greater than gas, then this would result in carbon leakage. This emphasises the challenges faced by BCAs as discussed above although it is more likely to be a challenge given the specific circumstances of California which has an interconnected electricity grid with states without a carbon price. Cement producers in the state have also expressed carbon leakage concerns, even with free allowance support, as they already experience higher costs than neighbour state competitors, due to stricter environmental rules and higher labour and fuel costs. As such, they have advocated for border-adjustment taxes on incoming carbon-intensive products (Zuckerman, Laughlin, Abramskiehn, & Wang, 2014).
Over time, all ETSs aim to increase the share of auctioning to support the low carbon transition and to unlock a potentially significant source of revenue. Free allocation should be a transitionary measure to support competitiveness in the early stages of the low-carbon transition. Over time, the effective price signal should ratchet upwards to support investments into abatement technologies and new processes such that competitiveness support becomes less necessary. Further, as a jurisdiction’s mitigation ambition increases through greater application of auctioning, more revenue will be generated to support other policy ambitions and mitigate any regressive impacts from carbon pricing (discussed further in Section 3.5.1)
To achieve net zero the level of allocations will need to reduce over time to allow cap reductions and to reflect necessary mitigation in industrial sectors. Regular reviews of international policy context help ensure maintained competitiveness and identify if competitive distortions have lessened. Competitiveness may also be addressed by other policy options like border carbon adjustments. Mechanisms also exist to reduce allocations over time:
● EU’s cross-sectoral adjustment factor ensures that the cap share going to free allocations is limited to 43% of the cap.
● Previously Australia’s approach included an annual efficiency contribution which reduced the allocation per unit of output by 1.3% per year.
Carbon taxes can include similar measures to mitigate competitiveness but must be designed carefully to maintain the carbon price signal. As under emissions trading, reducing the burden from carbon taxes can reduce competitiveness impacts for firms. Many countries provide exemptions for specific sectors or reduce the tax rate for exposed sectors. For example, the first phase of South Africa’s carbon tax faces an effective rate reduction of between 60-95% for EITE sector. However, both exemptions and reduced carbon tax rates reduce the carbon price signal and could affect environmental integrity.
Carbon taxes with output-based benchmarks can provide stronger abatement incentives with South Africa’s carbon tax providing a practical example. Carbon taxes can provide rebates based on the level of output and sector-specific benchmarks, in a manner mirroring output-based allocation under an ETS. South Africa’s carbon tax uses emissions-intensity benchmarks by sector to provide efficiency performance allowances of up to 5% of an entity’s total compliance. The approach lies between fixed-sector benchmarks and output-based benchmarks, depending on how frequently the government updates these benchmarks and firms’ performance allowance scores (Government of the Republic of South Africa, 2019). Similar mechanisms are used in Sweden’s NOx tax and for benchmarked rebates for electro-intensive industries under the UK CPS (BEIS, 2018).

The Future of Carbon Pricing in the UK
47
3.4.2 Supply adjustment mechanisms (SAMs)
SAMs have been implemented in all long-standing global ETS and are an important feature to help ETS achieve their dual long-run objectives. Price fluctuations through time are desirable, as this transmits information on abatement costs to market participants. However, excessive price volatility or prices falling too low can reduce low-carbon investment, while excessively high prices can have negative economic and political impacts. As such, SAMs have been implemented to support the credibility of long term price signals and mitigate the risk of shocks resulting in severe impacts on market outcomes(Vivid Economics et al., 2016).
SAMs allow for ETS to have greater control on price outcomes and can help reduce the waterbed effect. SAMs aim to make quantity instruments (such as ETS) act more like price instruments (such as taxes), by providing (typically) rule-based allowance supply adjustments in the event of market imbalances. The waterbed effect is when emissions reductions in one jurisdiction in a linked system are accompanied with increased emissions in another jurisdiction, resulting in aggregate emissions remaining unaffected. SAMs allow for ETS to puncture this waterbed effect when supply adjustments are made permanent, thereby increasing the effectiveness of supplementary climate policies (Perino et al., 2019).
All long-standing ETS have implemented some form of SAM. Table 8 provides a high-level description of the mechanisms introduced in carbon markets worldwide.
Table 8 SAMs introduced in ETS globally
Jurisdiction SAM
EU ETS ● Market Stability Reserve (MSR)
New Zealand ETS ● Allowance price ceiling to be replaced with cost containment reserve
California-Quebec ETS ● Auction reserve price ● Allowance price containment reserve (APCR)
Chinese regional pilots ● Mixed: auction price floors/ceilings and allowance reserves
RGGI ● Auction reserve price ● Cost containment reserve (CCR) ● Emissions containment reserve (ECR) to take effect from 2021
Korea ETS ● Discretionary market interventions ● Intend to move to a rule-based system
Source: Vivid Economics
However, this section will discuss the (expected) impact of existing SAMs in three major international ETSs:
● The EU ETS’s market stability reserve (MSR);
● The California-Quebec ETS soft price collar; and
● The Regional Greenhouse Gas Initiative’s (RGGI) soft price collar.
Experience shows that while SAMs are often developed with a focus on limiting the potential impact of prices rising too high too quickly, in practice it is the mechanisms that support prices that have been triggered most frequently.
The EU ETS’s MSR took a relatively long time to design and agree and was preceded by a temporary solution to addressing allowance oversupply and resulting low prices. The EU ETS operated for over 10 years without a

The Future of Carbon Pricing in the UK
48
permanent SAM, which may reflect the difficulty of generating agreement on SAM design and market reform amongst partners in a multi-country ETS (Newbery, Reiner, & Ritz, 2019). In 2013-14 the EU legislators agreed to ‘backload’21 900 million allowances over the period 2014-16, to temporarily reduce oversupply by removing allowances from auction. Backloading resulted in the gradual decline of the allowance surplus over 2014-17. However, the large number of surplus allowances meant that prices remained low, which bolstered support for a longer-term solution.
The MSR, introduced in 2019, is a rule-based mechanism that seeks to more permanently address market imbalances by making allowance supply flexible to the number of unused allowances banked in the system. It includes rule-based adjustments of allowance supply in response to allowance surplus thresholds.22 If the surplus exceeds 833 million allowances, then the auction volume in the subsequent year is reduced by 12% (amended to 24% over 2019-23), whereas if the surplus is below 400 million, then the auction volume in the subsequent year is increased by 100 million allowances (European Commission, 2014b).23
From 2023, the MSR may alter the long-term allowance supply in the EU ETS by invalidating allowances held in the MSR in excess of the previous year’s auction volume. From 2023 onwards, if the volume of allowances held in the MSR exceeds the total volume of allowances auctioned in the previous year (approximately 57% of the annual cap), any excess allowances will be invalidated. This will affect the overall emissions budget available to ETS sectors, and therefore the total level of emissions within the EU. The invalidation mechanism will also mean that overlapping climate policies in covered sectors may still affect EU ETS-wide GHG emissions; ‘puncturing’ the waterbed (Beck & Kruse-Andersen, 2018; Quemin & Trotignon, 2019;Perino, 2018).
Prevailing market perspectives expect the MSR to solve supply and demand imbalances, strengthen the allowance price, and accelerate emissions reductions in the EU ETS. The expectation of the MSR’s 2019 implementation was met with increased allowance price volatility in 2018 against the backdrop of expected future increases in prices.24 While exact estimates differ, most market analysts expect the MSR to absorb significant volumes of allowance surplus over the first few years of operation, with estimates of a total MSR volume in 2022 ranging between 2.0 and 3.0 GtCO2e. Invalidating surplus allowances above threshold levels from 2023 onwards will reduce the EU’s overall emissions and reduce the long-term impact of allowance oversupply.
The California-Quebec ETS has also implemented SAMs, using a soft price floor and a soft price ceiling. Both California and Quebec use an auction reserve price as a soft price floor to mitigate the risk of carbon prices falling too low. To provide confidence to the market that prices would be contained within a certain range, and to prevent unexpected price spikes, an allowance price containment reserve (APCR) mechanism was developed. This reserve sets aside a portion of allowances under the cap for injection into the market if the allowance price exceeds any of three tiers (IETA, 2018).
21 Backloading describes to process of temporarily removing allowances from an ETS and adding them at a later time. 22 The surplus is defined as the Total number of allowances in circulation (TNAC). This is defined as ‘the cumulative number of allowances issued in the period since 1 January 2008, including the number issued pursuant to Article 13(2) of Directive 2003/87/EC in that period and entitlements to use international credits exercised by installations under the EU ETS in respect of emissions up to 31December of that given year, minus the cumulative tonnes of verified emissions from installations under the EU ETS between 1 January 2008 and 31 December of that same given year, any allowances invalidated in accordance with Article 12(4) of Directive 2003/87/EC and the number of allowances in the reserve’ (European Commission, 2015a, p. 3). 23 Auction volumes are also increased by 100 million allowances if for more than six consecutive months the carbon price is more than three times the average carbon price during the two preceding years—even when the total number of allowances in circulation is more than 400 million—the allowances will also be released from the reserve. This safeguard would be in addition to measures taken under Article 29a of the ETS Directive,23 which allows for moderately increasing the auction supply with allowances from the new entrant reserve in the event of a marked price increase over a six-month period.
24The EU ETS experienced record levels of price volatility in September 2018, moving from close to €26/tCO2e (£23/tCO2e) to around €18/tCO2e
(£16/tCO2e) over five days (Vitelli, 2018).

The Future of Carbon Pricing in the UK
49
The California-Quebec auction reserve price has supported lower-end market prices, but discussions are ongoing to determine whether enduring oversupply requires a structural solution. The auction reserve price helped maintain California-Quebec allowance prices over 2014-17 as shown in Figure 9, with declines below the reserve price self-correcting in response to withheld auction supply. When secondary market prices dropped below auction reserve price levels between April and June 2016, this was accompanied by significant volumes of allowances going unsold. In 2016, 130 MtCO2e of allowances went unsold at auction, around 42% of the total allowances offered for sale. For comparison, in 2015 no allowances went unsold and the average proportion of qualified bids relative to allowances offered for sale stood at 1.18. However, the auction reserve price is less effective at solving the current enduring oversupply of allowances as a result of cap overestimation, high banking levels, the impact of overlapping policies, and post-2020 instrument design uncertainty.
Figure 9 The auction reserve price effectively supported California allowance prices
Source: Vivid Economics
The Regional Greenhouse Gas Initiative (RGGI) has implemented a soft price collar using two price-based SAMs. To mitigate the risks of carbon prices falling too low, RGGI has a minimum auction floor price that acts as a soft floor for the market.25 In the event of prices becoming too high, RGGI has a soft price ceiling (a Cost Containment Reserve (CCR)) that injects a predefined volume of allowances into the market in the event of allowance prices breaching certain thresholds.
RGGI’s SAMs have been effective in maintaining prices and reducing volatility, as shown in Figure 10. Over 2010-13, RGGI’s auction reserve price mitigated a decline in allowance prices. Overhauls in RGGI’s design led to the emissions cap being tightened over 2014-20, which contributed to price rises from US$2.7/tCO2e (£2.0/tCO2e) to US$4.7/tCO2e (£3.5/tCO2e) over the course of 2014. In 2014 and 2015, RGGI’s CCR helped reduce the impact of price spikes by providing 5 million and 10 million, respectively, additional allowances (from outside the cap) at auction. Reports show the CCR further limited price volatility both directly (by
25The minimum price is a hard price floor for the auction but a soft price floor for the carbon price facing covered entities, as the secondary market price can fall below the minimum auction price.

The Future of Carbon Pricing in the UK
50
providing additional allowances above certain price thresholds) and indirectly (by limiting the likely price spread and reducing speculative trading).
Figure 10 Both the reserve price and the CCR have affected the auction price in the past
Source: Vivid Economics
3.4.3 Temporal flexibility
Most ETSs around the world have temporal flexibility in the form of unlimited banking of allowances for future compliance. All ETS allow some form of banking but either do not allow for borrowing or impose strong restrictions and they also all allow some level of offsets. Table 9 describes the common treatment of banking and borrowing in ETS around the world.

The Future of Carbon Pricing in the UK
51
Table 9 Common treatments of banking and borrowing in ETS globally
Banking Borrowing
Unlimited banking is permitted in all ETS, except for
California-Quebec, Hubei and Shanghai:
● California-Quebec has holding limits for
banked allowances, in 2018 this was 12.3
million allowances (3% of the 2018 cap) in
excess of participant’s compliance
obligation (CARB, 2018b);
● Hubei only allows allowances to be banked
if previously traded;26
● Shanghai allows unlimited banking within
compliance periods, but across compliance
periods allowed only one-third of
allowances banked from the 2013-15 phase
to be used per year in the 2016-18 phase.
Borrowing is heavily limited in all jurisdictions:
● In the EU, limited borrowing is allowed
within phases with firms able to use free
allocations for past liabilities;
● In Korea, limited borrowing is allowed for up
to 10-20% of an entity’s compliance
obligation, and in the future this limit will be
a function of past borrowing;
● In the (former) Australian CPM, borrowing
from a year in advance was to be limited to
5% of an entity’s future compliance
obligation.
Source: Vivid Economics
The potential pitfalls of not allowing unlimited banking in the absence of SAMs is illustrated by the example of EU ETS allowance prices over Phase I and II. In the run up to the end of Phase I, Prices of Phase I vintage EUAs dropped significantly as entities were forced to begin selling off allowances to avoid complete value loss. The introduction of unlimited banking from Phase II onwards, however, helped to support EU ETS allowance prices even when faced with an oversupply following the 2008 financial crisis. However, as a result, a significant stock of banked allowances built during Phase III which put downward pressure on allowance prices. The Market Stability Reserve was developed as a mechanism to address this significant build-up of banked allowances and reduce the risk that a large surplus develops in the future.
26 This measure of allowing allowances to be banked only if they have been traded at least once may reflect an ambition to increase market liquidity.

The Future of Carbon Pricing in the UK
52
Figure 11 Banking helped support prices despite oversupply in the EU ETS
Notes: The total number of allowances in circulation (TNAC) reflects the allowance surplus and is determined each year as the total allowances issued minus allowances surrendered for compliance, adjusting for international credits used for compliance and allowances already in the reserve (European Commission, 2015b).
Source: Vivid Economics
3.4.4 Secondary markets
The EU has a functional secondary market that has wide participation and a diversity of products offered. The EU extends secondary market participation to third party entities such as financial brokers. Further, the secondary market exchanges (ICE based in the UK and EEX in Germany) offer both futures and options financial products, which increases the range of tools available for market entities to manage their risks. This combined with EU ETS’s significant size, helps promote liquidity and improves the robustness of allowance prices to short-run shocks. The EU ETS reflects how markets can evolve into more efficient structures over time. Since its start, the proportion of Exchange trading relative to over the counter (OTC) trading has increased significantly, and this has been accompanied by strong growth in futures markets. However, longer timeframes offered for futures and options could further enhance the ability to manage risks and reduce price volatility.
Market activity in the EU ETS varies largely between participants, with many participants not trading or actively managing their liabilities. Electricity generators and third-party entities are most active in the trading period. In contrast, industry participants, especially smaller emitters, are less active and often only participate in a few transactions at the end of the compliance period. During Phase I, more than 50% of covered entities were largely inactive (Betz & Schmidt, 2016). This can result in lower efficiency of the market and reduces the effectiveness of additional policy interventions. For example, if policymakers enact temporary measures to adjust allowance supply or price formation, but market participants do not engage in trading, the intervention is less effective.

The Future of Carbon Pricing in the UK
53
In Korea, limiting third party participation and the number of financial products offered in secondary markets can be detrimental to market liquidity. In Phases 1 and 2, only compliance entities and public banks (Industrial Bank of Korea, Korea Development Bank, and Korea Export/Import Bank) can trade allowances. Furthermore, only spot products can be traded during Phases 1 and 2.27 Only three types of tradeable spot products are currently offered: Korean Allowance Units (KAU), Korean Credit Units (KCU), and Korean Offset Credits (KOC). 28Korea’s turnover ratio, an indicator of market liquidity,29 was only 0.05% over 2015-17, while the same indicators in the EU, RGGI, and California post-2014 all stood above 15% (Narassimhan et al., 2017). Trading has tended to be concentrated just before annual compliance deadlines. In a survey conducted by the Greenhouse Gas Inventory and Research Center (GIR) in 2017, 70% of 164 respondents stated that they had not yet experienced carbon trading after two years of K-ETS operation (Acworth, 2018).
The experiences of New Zealand’s secondary market reflect the challenges of generating liquidity in a small ETS. In order to mitigate this challenge, the NZ ETS initially linked with CDM market to provide greater liquidity and ensure that NZ prices reflected international prices. However, this left the jurisdiction vulnerable to challenges in the international market post 2008 and rapid falling prices in the Kyoto market. This eventually resulted in NZ de-linking from the CDM market to stave off further price reductions (as discussed in Section 3.3.3). Further, NZ’s announced repealing of the price ceiling of NZ$25/tCO2e (£17/tCO2e) may contribute to inhibiting liquidity. Recently, prices have been rising and have now reached the ceiling level. The government has announced its intention to replace the ceiling with a cost containment reserve.30 However, this expectation of future higher prices may have exacerbated liquidity issues and secondary market prices as market participants hesitate to sell allowances below the price ceiling level.
The experience of US markets illustrates the benefits of consignment auctions to improve liquidity in smaller markets. Consignment auctions are situations whereby firms receive free allowance allocations which must be consigned to auction for sale, and they receive the revenues from the sale. Theory suggests this type of auction helps generate clear price discovery and may facilitate political acceptability. The California ETS has used consignment auctions for publicly owned electricity distribution utilities and mandates that revenues be used for the benefit of ratepayers. In the 1990s US SO2market, free allocation combined with consignment auctions helped a market with low liquidity reveal stable auction prices which helped facilitate increased market activity and compliance cost reduction (Burtraw & McCormack, 2017).
3.5 Effective governance
Box 10 Key findings: Effective governance
● Governments have various choices in revenue use beyond industry compensation (via free allowances in an ETS or exemptions in a carbon tax). Currently, many jurisdictions earmark their revenue for climate-related projects.
● Frequent and independent evaluation and review of carbon pricing instruments is important to ensure long-run efficiency and their role in meeting economy-wide targets.
● A UK carbon price should be compatible with, or preferably complement, policies to achieve climate targets set by the Devolved Administrations.
27 From Phase 3 onwards, third parties (including individuals) will be eligible to trade in the market and derivative trading will be introduced.
28 KAUs are allowances that the K-ETS allocates to installations and can be used for compliance; KOCs are certified emissions reductions from offset projects external to the K-ETS; and KCUs are converted KOCs that can be used for compliance under the K-ETS (Yoo, 2018).
29 The turnover ratio is the ratio of total allowances traded in the secondary market and total allocations issued.
30 The revision of the NZ$25 price ceiling reflects an expectation that NZ$25 is not sufficient to achieve New Zealand’s nationally determined contribution (NDC) targets (Ministry for the Environment, 2018).

The Future of Carbon Pricing in the UK
54
Carbon pricing requires effective governance to guarantee the long-term success of the instrument. The future UK carbon pricing instruments require a well-designed institutional framework. Experience suggests that there are different trade-offs on carbon revenue use that comprehensive, frequent and independent evaluations and reviews are important; and that UK should work in close cooperation with the devolved administrations. The key issues of effective governance relate to policy choices on:
● the use of carbon revenues (Section 3.5.1),
● the evaluation and review process (Section 3.5.2), and
● the treatment of devolved administrations (Section 3.5.3).
3.5.1 Use of revenue
Revenue from carbon pricing instruments can be recycled to further additional policy outcomes or mitigate any potential regressive impacts of carbon pricing. Carbon pricing instruments generate revenues either through auctions or direct taxation. Box 11 summarises different ways to use carbon revenues.
Box 11 Policymakers face crucial choices on the use of carbon revenues
Revenue generated by carbon pricing can be directed to several uses, including:
● General budget; treated as part of the broader fiscal mix to fund government priorities
● Climate related projects; funding other climate policies, such as feed-in-tariffs or energy efficiency programs
● Competitiveness; to reduce risks of carbon leakage in targeted sectors, for example through free allowances or tax-exemptions
● Support for households and affected groups; Revenues are transferred to households to soften the impacts of carbon pricing on energy costs or to address transition impacts
● Fiscal reforms; Revenues are used to reduce other taxes in a revenue-neutral way to remove distortions (e.g. taxes on capital or labour) and increase overall economic efficiency
Recycling carbon revenues back into the government budget for general spending theoretically increases the economic efficiency of the system. Revenue from the carbon tax in Mexico is legally required to be deposited back into the general budget (Garcia, 2017). Similarly, in the UK all revenues from carbon pricing are channelled to the general budget as earmarking is not permitted (PMR, 2017). However, revenue recycling can still effectively make additional reforms to the tax system fungible. For example, The UK’s Climate Change Levy (CCL) was introduced in 2001 with reforms to the corporate tax regime with the intention of realising a double-dividend.31 In the EU, the CPLC(2016) estimates that 32% of countries incorporate some form of general budget revenue recycling from auctions. This method allows governments to use revenues for spending on areas unrelated to climate change, based on priorities, which increases the economic efficiency of the system. However, this may also raise public concerns on a lack of transparency and lead to perceptions of a government implementing a tax in order to raise revenues (Marron & Morris, 2016).
Carbon revenues have been used to stimulate innovation and investment in the EU and RGGI. EU legislation stipulates that EU members states should spend at least 50% of carbon revenues for climate-related projects
31 The UK’s voluntary carbon market in the early 2000s did not provide any revenues.

The Future of Carbon Pricing in the UK
55
(The European Parliament and Council, 2009), in practice most member states devote far more than the legal minimum. The EU’s Innovation Fund aims to finance innovative low-carbon technologies in energy intensive industries and promote carbon capture, renewable energy, and energy storage technologies. The EU ETS funds the Innovation Fund using revenues from auctioning 450 million allowances over 2020-30 and from any remaining funds from the NER300 programme which was established to support demonstration CCS and RES projects. Similarly, in RGGI, auction revenues are distributed to states in alignment with RGGI state budget allocations and at least 25% must be allocated for either consumer benefit or strategic energy purposes. Over 2008-13 67% of RGGI auction revenues went into energy efficiency, additional abatement, renewable energy or electricity bill assistance (Lygre & Wettestad, 2018).
Alberta’s carbon levy recycles more than 50% of revenues towards maintaining small business competitiveness and offsetting household cost increases. This is implemented through a 1% reduction in the small business tax rate and household rebates. The rebate will provide US$1.5 billion (£ 1.1bn) over three years to low and middle income households, while the business tax rate reduction will be worth US$ 565 million (£ 424m) over three years(Alberta Goverment, 2017).
The British Columbian carbon tax introduced personal and corporate tax reforms and direct transfers, funded by carbon tax revenue (PMR, 2017b). The personal tax reforms and direct transfers targeted low income households by reducing the tax rate by 5% for the two lowest income groups, providing direct transfers through the Low Income Climate Action Tax Credit, and delivering a number of homeowner, senior citizen and other social direct transfers (British Columbia Ministry of Finance, 2013). General corporate tax reforms included a gradually reduced tax rate from 12% (in 2007) to 11% (in 2008), to 10.5% (in 2010), to 10% (in 2011). Small business tax rates were also reduced gradually from 4.5% to 2.5% and the income-tax threshold for small businesses was increased by 25%. A number of direct transfers to industry were also implemented through tax credits (British Columbia Ministry of Finance, 2013). In 2013, the total carbon tax revenue was CA$1.120 billion (£ 648m) while personal and corporate tax reductions and transfers totalled CA$546 million (£ 316m) and CA$834 million (£ 482m), respectively. The carbon tax and associated reforms therefore entailed a net reduction in the fiscal budget of CA$260 million (£ 150m) in 2013 (British Columbia Ministry of Finance, 2013). This tax reform was intended to produce a double dividend by incentivising emission reductions while reducing the overall tax burden on the economy and pricing pollutants in place of productive goods (such as labour) (CPLC, 2017). Indicative research suggests that the use of revenue made an initially unpopular carbon tax more popular over time (Metcalf, 2015).
California takes a hybrid approach to revenue recycling. The majority of carbon revenues is earmarked towards objectives such that pre-defined portions of revenues generated are recycled into spending on energy efficiency and renewable energy projects in public buildings, supporting disadvantaged communities, as well as low carbon transportation, natural resource conservation programmes, and direct household transfers in the form of electricity bill rebates (LAO, 2014). However, around 4% of the revenues is recycled into the general government budget to cover employee and administrative costs (Carl & Fedor, 2016).
In Australia, distributional impacts of the CPM on lower income households led to the government introducing transitional measures to support them. The Australian Government (2011) estimated that the implementation of the carbon price would raise electricity prices over 2013-2017 by an average of 10-17%. This price increase was predicted to impact lower income households more, as they spend a larger proportion of income on electricity. In order to support the households most affected by the carbon price, the government provided transitional assistance by increasing the Family Tax Benefit,32 pensions, allowances, and tax cuts funded by the recycling of carbon revenues. This assistance for households received over 50% of the carbon price revenues expected (C2ES, 2011).
32 Cash transfers to parents or caregivers with dependent children or full-time dependent students (C2ES, 2011)

The Future of Carbon Pricing in the UK
56
Alberta and Australia provided funding to regions and people disproportionally affected by a low-carbon transition. Certain parts of the population face a stronger impact from carbon pricing than others, such as regions that rely on the extraction or combustion of fossil fuels. Carbon revenues can be used to smoothen the transition and fund initiatives for economic development, economic diversification or retraining. Alberta used part of its carbon tax revenue to fund its Coal Community Transition Fund, an initiative to support regions impacted by the coal phase-out (Government of Alberta, 2019). Similarly, Australia targeted regions that were expected to be strongly affected by carbon with the Regional Structural Adjustment Assistance Program (Government of Australia, 2012). The recently proposed German coal phase-out includes a suggestion of payments of € 20bn (£ 18bn) to coal regions in the next 20 years, even though the payments are not directly linked to carbon revenues.
Recently, a carbon fee and dividend plan has been proposed by members of the US Congress. This would function as a carbon tax on fossil fuels with all revenues returned to households in monthly dividends. These dividends would be direct transfers to households allocated in equal shares (CPLC, 2019).
3.5.2 Evaluation and review
All jurisdictions undertake frequent evaluation and review of their carbon pricing instruments and this is key to ensuring the long run efficiency of policy. Pre-determined reviews across time are important to ensure that stock is taken of how the instrument fares in a continually evolving context. New Zealand has undertaken three formal reviews of its ETS through which it measures the performance of the carbon pricing instrument and recommends policy amendments that could help improve its efficiency and effectiveness. Similarly, the EU ETS has been through several reviews of the overall market and has mandated specific reviews of the MSR to be undertaken within three years of implementation (with the first due in 2021) and at five-year intervals thereafter as directed under Article 3 of Decision (EU) 2015/1814. Topics considered in the reviews of the EU ETS have been on the efficacy of cap-setting, auctioning, free allocation and competitiveness, indirect carbon cost support, MRV in the compliance system, the registry system, the treatment of small operators, and distributional impacts on households. California also undertakes frequent ETS reviews, which recently proposed amendments for the post 2020 operation of the carbon market, ranging from the continued free allocation of 100% of the sectoral emissions benchmark for sectors identified as High, Medium, and Low carbon leakage risk, updating offset provisions, and revisions to SAMs.
Legislated and ad-hoc institutional reviews are important to enable independent evaluations that can identify potential policy improvements. Various jurisdictions have created independent institutions to review climate policies, such as the UK’s CCC, Australia’s Climate Change Authority or New Zealand’s interim Climate Change Committee (CCC). In addition, jurisdiction commission ad-hoc reviews of their policies, such as the New Zealand’s Productivity Commission’s recent review of climate policy. Independent reviews allow an assessment and recommendations that are less beholden to political drivers. The European Commission also regularly reviews the functioning of the EU ETS; however, this is performed by the Commission so does not provide the same degree of independence.
Holistic reviews can capture performance of the climate policy architecture across a range of dimensions. For instance, the EU’s assessment of the MSR considers several aspects of market functioning as does RGGI’s market analysis. Further, intermittent reviews can consider the broader climate policy aims, policy and institutions like that conducted in recent years by New Zealand’s Productivity Commission.
Key to effective reviews are robust economic analysis and in-depth stakeholder engagement. Economic analyses of carbon pricing instruments can comprise both ex-ante and ex-post evaluations. Ex-ante approaches assist policymakers in deciding which policies to adopt in advance, based on theoretical impact frameworks and simplifying assumptions. The assessment can be performed through bottom-up (partial equilibrium) models at a detailed sector level and through top-down (general equilibrium) models for an
The Future of Carbon Pricing in the UK
57
economy-wide assessment. Ex-post approaches draw on empirical data to review the effectiveness of policies as they are experienced in real-world outcomes and use econometric methods.
Stakeholder engagement is a vital component of any effective policy review and helps to generate buy-in across a broad range of perspectives.
● In the EU, reviews of the ETS utilise continuous and broad stakeholder engagement. For the preparation of Phase 3 and Phase 4, EU-wide stakeholder consultation was undertaken. A stakeholder review of the EU ETS began in 2008, which resulted in the publishing of several directives and amendments to legislation, most importantly the ‘revised EU ETS Directive’ which informed the design of Phase 3 (Fallmann et al., 2015). In preparation for Phase 4 of the EU ETS, a wide range of stakeholders have been consulted using online platforms, workshops, written consultations, and questionnaires (European Commission, 2015a).
● Extensive stakeholder engagement continues to support the functioning of the Californian ETS. The CARB held consistent public meetings, from 2009 onwards, in preparation of the ETS, with multiple stakeholders covering a range of topics regarding the ETS (CARB, 2017). Continued stakeholder engagement once the ETS began resulted in legislative amendments in 2015 (IETA, 2015a). Stakeholder consultation has generally occurred through frequent open public meetings, webinars, and workshops. The outputs from these engagements, including comments received and resolutions made, are widely documented and publicly available which increases the transparency of the process (CARB, 2017).
3.5.3 Devolved administrations
In the UK, climate change policy is devolved to Wales, Scotland and Northern Ireland, although the UK Government retains control over several policy areas that influence mitigation incentives. The devolved administrations are currently responsible for implementing MRV under the EU ETS. Recently, the UK government and devolved administrations committed to carbon pricing as a tool to achieve emissions reductions targets. This commitment was accompanied by joint statement on a preferred direction after Brexit being a linked ETS and alternative options if this is not possible. Any instrument developed must be capable of achieving the separate climate targets of the devolved administrations, such as Scotland’s 2045 net-zero ambitions. The potential introduction of a UK carbon tax would be a reserved matter for the UK government; however the UK government has stated that relevant agencies which currently undertake monitoring, reporting and verification would continue undertaking these functions, including environment agencies in devolved administrations.

The Future of Carbon Pricing in the UK
58
4 Approach to assessment and recommendations
The Committee on Climate Change was asked to consider at least two scenarios in its advice, an ETS linked to the EU ETS and a standalone ETS, both to be operational by January 2021.The commissioning letter also provided scope to advise on other policy options including a UK carbon tax.
These three options each have advantages and disadvantages regarding economic efficiency, efficacy in achieving environmental outcomes and consequences for the UK’s future political engagement with the EU. As such our analysis focuses on discussing the advantages and disadvantages associated with these options and identifies how policies can be designed to achieve the best outcomes in each of these scenarios.
The commissioning letter provides guidance on principles to assess different policy options. The carbon pricing mechanism should:
● facilitate cost effective decarbonisation (through trading of allowances), maintain competitiveness and provide a smooth transition
● be at least as ambitious as the current system and support delivery of the UK’s and devolved administration’s climate targets
● be capable of being linked to the EU ETS and consistent with the UK’s commitments on the robust implementation of CORSIA
● be operational from 1 January 2021
Given the Government’s recent commitment to legislating a net zero target, we seek to operationalise these principles by considering carbon-pricing centred policy packages that:
● are capable of reaching net zero by 2050, which requires mobilising mitigation across the economy and addressing price- and non-price barriers to emissions reductions;
● are economically efficient, which requires measures to reduce carbon leakage risk, ensure market stability, and minimise administrative and transaction costs.
Below we provide further details on the policy scenarios we consider, and the key issues that the UK’s carbon pricing policies will need to address.
4.1 Policy scenarios
There remains a degree of uncertainty regarding the parameters of future policy options, across the three scenarios. However, it is likely that in a ‘deal’ scenario the UK has a broader option set than in a ‘no-deal’ scenario where it is unlikely to be able to rely on cooperation from the rest of the EU. Given these specifications, and our assessment of potential policy outcomes in the sections below we provide advice relating to three distinct policy scenarios:
1. An immediate link with the EU ETS from January 2021, in line with the government’s preferred position. To link the EU ETS with another ETS, the EU requires agreement through a treaty level mechanism. Given the process for negotiating treaties in the EU, we consider that implementing a link in the time available is only possible if there is not substantive policy deviation between the UK ETS and EU ETS. Given this we focus on a mirrored ETS-link, with the UK adopting almost all aspects of the EU ETS. We do however identify a handful of ways in which design may differ, which broadly align with proposals made in BEIS’s consultation on the Future of Carbon Pricing.

The Future of Carbon Pricing in the UK
59
2. A standalone ETS from January 2021, provides the potential for divergence in policy design to ensure that the UK ETS operates effectively as an independent policy and is aligned with achieving the UK’s domestic net zero mitigation targets. In this scenario we consider that linking would only be feasible on a longer time frame, potentially sometime in the period 2025-30.
This longer-term timeframe on linking implies policy changes could be desirable or necessary for the UK market to run smoothly. The key issues that the UK would have to consider in its policy design are outlined in section 4.3 below.
Potential changes to policy design do not necessarily pose a barrier to linking. In the past the EU has demonstrated a willingness to cooperate with other jurisdictions operating ETS of substantively different designs. We consider that cooperation is possible so long as the UK ETS can demonstrate it maintains sufficient ambition, environmental integrity, and compatible market arrangements.
As such, in assessing potential policies under the standalone UK ETS, we propose the principle of least-regret policy divergence that limits changes to those needed to ensure that a standalone system operates effectively while minimising barriers to linking. This is given effect by applying two tests before proposing a variance from EU ETS design:
1. That policy variances must improve the functioning of the UK ETS as a standalone system.
2. That policy variances do not compromise future linking by undermining the ambition, environmental integrity or market compatibility of the UK ETS.
In some cases, a variance in policy that creates a barrier to linking may be required for the UK ETS to operate as an effective standalone system. Where this is the case, we identify this barrier to linking so that policy makers and market participants have a clear view to the policy settings that are likely to be altered under a potential future linking agreement.
3. A carbon tax from January 2021 would not provide any opportunity to fully link with the EU ETS or other carbon markets in the short- or long-term. To this end, we suggest policy design options that assume that a carbon tax remains a purely domestic fall-back mechanism.
While consistent with the UK leaving the EU, a fourth scenario – remaining in the EU ETS – is not considered in this analysis. This scenario would offer several key benefits, including all of those suggested under scenario 1 discussed below. It would also have the benefit of avoiding potentially difficult negotiations to establish the link. The option would be consistent with leaving the EU as Norway, Liechtenstein and Iceland – which are not members of the EU –are members of the EU ETS. However, it is excluded from the analysis as it is outside the scope of options identified in BEIS’ request for advice from the CCC.
Even given these restrictions, there are many policy parameters that could be varied across each scenario. For each policy area considered we present several options that could be pursued. This is not a universe of options but rather seeks to identify options that span a range of potential approaches, including the status quo. Where we consider alternative approaches, this draws on those that have been used or proposed in other jurisdictions applying carbon pricing to date.
There are two options for the UK’s carbon pricing instrument over 2019-20: if the UK leaves the EU under a negotiated deal, they will stay in the EU ETS otherwise they will introduce a transitionary carbon tax. Transitionary arrangements for the UK’s carbon pricing instrument will be needed for the interim period following the UK’s exit from the EU in 2019 and the start to the UK’s new policy scenario in 2021. Remaining operating within the EU ETS over this period would be contingent on the UK leaving the EU under a negotiated deal. Conversely, in the event of a no-deal exit, the UK government will implement a carbon tax set at £16 beginning from November 2019 (HMRC, 2019a).

The Future of Carbon Pricing in the UK
60
Brexit may also lead to changes in the design of the EU ETS. Following Brexit, the EU will likely need to make adjustments to the EU ETS, to account for the impact of the UK’s exit, for instance the EU ETS emissions cap. Other policy areas would also be affected but may be less likely to be changed in the short term, for instance, parameters of the MSR or benchmark levels could be adjusted to account for the impact of the UK’s exit. However, given these are politically contentious issues we consider that these are less likely to be changed. For the purposes of our analysis these potential changes to the EU ETS are not considered in detail, as they have a relatively small impact on the substantive policy issues being considered.
The potential to implement certain policy options that may be preferred in the longer term are also constrained by the specification that the policy should be operational from 2021. Given this, for certain design elements we consider the potential for a phased approach. This is in line with the natural evolution of carbon pricing policies, where design parameters change with changing circumstances. Where there is a case to consider a policy change in the longer term, this is identified as a policy option that should be considered at a future point in time.
4.2 Modelling
Modelling a UK ETS can inform decisions on market design and contrast different policy options and market behaviour. The use of economic models is common practice; it provides insights on potential future market dynamics. It can also contrast the differences between different policy options and market behaviour.
The use of the BEIS Carbon Pricing Model (BCPM) allows for a consistent modelling approach between the Government and CCC’s independent advice. The BCPM is BEIS’ internal model to analyse ETS design and to produce carbon values that are used across government (BEIS, 2019). BEIS has used the model to study EU ETS design and currently uses it to analyse different design options under a UK ETS. Given time constraints, all scenarios were developed within the current model set-up and BEIS is currently in the process of updating its model inputs.
The modelling does not provide exact predictions on future allowance prices and abatement, the analysis focuses on differences between parameters within a stylised world. The BCPM, like every other model, is not able to reproduce all factors that contribute to real market prices. Therefore, the model does not aim to predict future allowance prices in a UK ETS. Instead, the model depicts an abstract representation of certain elements of emissions trading. Within this stylised model world, it is possible to study the relative impacts of different ETS design and market behaviour in contrast to other scenarios.
Due to time constraints, the design of a standalone UK ETS modelled by the BCPM differs substantially from the design recommended in the following sections. Although this modelling has informed the development of recommendations, it does not represent the market dynamics that would be expected from an ETS following the policy design recommendations outlined below.
Further details of the structure of the BCPM are provided in Box 12below.
Box 12 The design of the BCPM model
The BCPM is a partial-equilibrium model based on market fundamentals that requires business-as-usual (BAU) emissions, marginal abatement cost curves (MACCs) and an ETS cap as key inputs. Essentially, the BCPM uses the demand for emissions, the costs of abatement and the supply of allowances to calculate an equilibrium carbon value. It does not account for speculations or market expectation of future supply and demand but is instead based on market fundamentals. It is a partial-equilibrium model and therefore does not model interactions between abatement in the covered sectors and the rest of the economy.

The Future of Carbon Pricing in the UK
61
The BCPM requires three key inputs:
● Business-as-usual (BAU) emissions gives demand for mitigation from the covered sectors in the ETS. This information is available for different levels of fuel prices and economic growth.
● Marginal abatement cost curves (MACCs) provide information on the costs of abatement for the covered sectors. Each abatement option available is priced per ton of CO2. For a given carbon value, all abatement cheaper than the carbon value is undertaken by the covered sectors.
● ETS caps resemble the supply of allowances available to covered sectors.
Further details on the model can be found on BEIS’ Carbon Valuation website.
4.2.1 Results and discussion
The BCPM model illuminates some key lessons for the design of UK carbon pricing policy. It shows the high level of uncertainty regarding emissions growth and the behaviour of market participants, with major implications for market demand. This in turn, shows the need for responsive carbon price design.
BAU emissions and MACCs are largely uncertain, resulting in uncertain carbon values. BEIS is currently in the process of updating its calculations of BAU emissions. This modelling exercise uses 2018 BAU emissions in line with BEIS’ current model set-up. Furthermore, the MACCs used do not include GGR technologies and may overestimate the costs of abatement. In general, both BAU emissions and MACCs are inherently uncertain as economic development, fuel prices and technology deployment are uncertain. Resulting carbon values should be interpreted carefully. Indeed, the high, central and low BAU emissions scenario vary substantially in their emissions outcomes, with a range of almost 30 Mt CO2e as early as 2021 and the range of possible outcomes growing over time as shown in Figure 12 below.
Figure 12 BAU emissions are highly uncertain
Source: Vivid Economics drawing on BCPM outputs
0
20
40
60
80
100
120
140
160
180
200
MtC
O2e
BAU emissions range Central emissions BAU

The Future of Carbon Pricing in the UK
62
This uncertainty suggests that balancing the objectives of a carbon price to both ensure a certain quantity of emissions and provide predictable price developments is likely difficult. This is illustrated by outcomes under a cap set at the UK’s notional share of the EU ETS cap, which shows significant differences in the development of allowances surpluses between scenarios. Figure 13 below, shows the development of cumulative allowance surpluses in the UK system over time. Under a low BAU emissions scenario the UK’s allowance balloons over the period to 2030 reaching almost four times the UK’s annual cap. In contrast, under a high BAU emissions scenario allowances surpluses remain modest over this period and thereafter.
Figure 13 Allowance surpluses can quickly build if demand is at the low end of expectations
Note: Assumes limited foresight, notional cap used to illustrate scenario Source: Vivid Economics drawing on BCPM outputs
The behaviour of market participants is also crucial for the development of markets. If market participants have limited foresight,33 carbon values could remain very low initially and rise steeply thereafter. For instance, Figure 14 below shows that if BAU emissions do not exceed cap levels and market participants have limited foresight then the market price will fall to zero. However, once the cap becomes binding carbon values rise steeply and much higher than under perfect foresight. With perfect foresight, prices are always expected to remain positive and increase over time, while limited foresight prices could stagnate for extended periods. Neither very short foresight nor perfect foresight is realistic, with different market participants focused on outcomes over different periods. Nonetheless, depressed prices could prevent early investment in low-carbon technologies and result in significant longer-term costs as high prices bite.
When considered alongside the uncertainty of BAU emissions discussed above this suggests that to support price stability some supply adjustment mechanism should be built into the design of an ETS. While some variability in prices is welcome, SAMs help keep the long run trajectory of prices broadly aligned with those needed for decarbonisation.
Furthermore, modelling suggests that market participants seeking to build hedging positions could accumulate a substantial number of allowances in the early 2020s. This could squeeze the market soon after
33 Foresight describes how long into the future market participants anticipate abatement requirements and costs. BEIS uses a foresight of 3 years for its modelling of the UK ETS. Under the alternative assumptions of perfect foresight, market participants take abatement requirements and costs of the whole modelling period into account.
0
100
200
300
400
500
600
mill
ion
allo
wan
ces
Low BAU surplus Central BAU surplusHigh BAU surplus Notional UK cap, million allowances

The Future of Carbon Pricing in the UK
63
implementation suggesting that the design of any SAM under a standalone UK ETS would need to account for this potential demand. Figure 15 shows how high hedging demand leads to large rates of banking in the early years of an ETS, and potentially squeezing the market.
Figure 14 Differences in foresight of economic actors can lead to very different price outcomes
Note: Notional cap scenarios used for illustrative purposes Source: Vivid Economics drawing on BCPM outputs
Figure 15 Supply could be squeezed by early banking to build up hedging positions
Note: Illustrated using banking behaviour under high BAU emissions scenario, with limited foresight. Source: Vivid Economics drawing on BCPM outputs and CCC, 2018, Progress Report to Parliament
Allo
wan
ce p
rice
Limited foresight
Range Central
Perfect foresight
Range Central
-15
-10
-5
0
5
10
15
20
25
30
2021 2022 2023 2024 2025 2026 2027 2028 2029 2030
An
nu
al c
han
ge in
su
rplu
s (m
illio
n)
Notional cap scenario CCC cost-effective path cap scenario

The Future of Carbon Pricing in the UK
64
4.3 Key issues
The UK’s future carbon price needs to be fit for purpose and respond to the specific challenges facing the UK in the current context. The nature of challenges that are faced will differ between the scenarios set out above, however these challenges generally fall into one of three main domains:
● Integrating markets through linked ETS
● The role of carbon pricing in achieving the UK’s net zero targets
● Ensuring an efficient market
Alongside issues of governance, these domains structure the remainder of our report and are the central focus of our assessment and recommendations. We introduce these challenges in more detail below.
4.3.1 Integrating markets through linked ETS
Following Brexit, the EU will remain the UK’s most important partner on carbon pricing. The EU is the UK’s largest trading partner, and the government’s preferred position is an immediate link between the new UK ETS and the EU ETS. With the recent adoption of a net zero target, the UK’s climate policy may be considered more ambitious than that of the EU, however incoming President of the European Commission Ursula von der Leyen has flagged her support for introducing a net zero target.
Linking with the EU ETS brings a range of benefits and challenges. Chief amongst the benefits is access to an established, large and liquid market and policy continuity for UK firms. However, this will come at the cost of reduced capacity to design a carbon pricing mechanism tailored to the UK’s context and to pursue independent collaboration with other carbon markets developing globally.
Practical barriers to the design and operation of a link will also need to be overcome. Under a linked ETS scenario, this includes meeting the legislative requirements for linking under the EU ETS directive, establishing a registry to enable the trade of allowances between the UK ETS and EU ETS, as setting rules and procedures governing interactions between regulators.
In non-linking scenarios, integrating energy markets and managing differences in carbon prices will become key. Issues regarding the Irish Single Energy Market and interconnections between the UK and EU grids will need to be managed. Further, as UK and EU firms compete in regional markets managing the relative cost of carbon for emissions-intensive trade-exposed firms will be key to maintaining competitiveness.
4.3.2 Carbon pricing in the policy mix
The UK government has announced its intention to adopt a target to reach net zero greenhouse gas emissions by 2050. Achieving this goal is challenging and will require the adoption and expansion of incipient and as yet undeveloped technologies. In particular, the uptake of greenhouse gas reduction technologies at scale in the agriculture, industry and energy sectors will be essential.
Achieving net zero emissions requires economy-wide mitigation effort, with carbon pricing presenting an important part of the climate policy toolkit. However, the amount of abatement effort that is done by carbon pricing can differ amongst scenarios; this will in turn have implications both for design of the carbon price, and the role of supplementary policies in driving the net zero transition.
Under a linked UK ETS scenario, the role played by carbon pricing will be largely determined by EU policy. In this scenario the UK will be a price taker, and supplementary policies in covered sectors are needed to drive deeper cuts in emissions. In a standalone ETS or carbon tax scenario however, the impact of these policies can be more directly calibrated to take on a larger role in achieving domestic targets.

The Future of Carbon Pricing in the UK
65
4.3.3 Ensuring a well-functioning market
The experience of EU ETS and other carbon markets to date suggest that the UK may face several challenges in developing a robust carbon market. Under the scenario where the UK ETS is linked with the EU ETS, some challenges might be reduced, however in other scenarios managing competitiveness, ensuring market stability and promoting secondary market development should be key objectives. The need to provide firms affected by policy change a degree of policy predictability is a guiding consideration across all recommendations.
Under all forms of carbon pricing, managing competitiveness impacts and reducing risks of carbon leakage are a central objective. EITE firms are particularly affected by carbon pricing and retaining appropriate policies to reduce the risk of carbon leakage without providing windfall gains is a perennial challenge. Managing these impacts as caps become tighter or tax level higher is a foreseeable challenge that will have impacts across all scenarios.
Experience of other carbon markets over the last decade suggests that ensuring market stability and supporting development of a liquid secondary market should be priorities, particularly in the standalone UK ETS scenario. Carbon markets are exposed to shocks, with good design needed to ensure that these shocks do not have a long-term impact on ETS effectiveness. Similarly, ensuring a liquid secondary market which provides access to sufficient risk management products is important for ensuring efficiency and supporting investment in emissions reductions. Designing a standalone ETS to explicitly address these challenges can avoid the need for disruption and further policy changes in the future.

The Future of Carbon Pricing in the UK
66
5 Assessment and recommendations
This section assesses and recommends policy options for the future of carbon pricing in the UK. This section draws on the evidence and issues discussed previously on the theoretical principles of carbon pricing (Section 2), experience of carbon pricing from implemented policies around the world (Section 3), and key areas for consideration for the UK’s future climate policy (Section 4.3). It presents key policy options in each area, assesses them and offers recommendations for each scenario.
The recommendations are built on an assessment of available evidence to identify potential for BEIS to create an operational system by 1 January 2021. The design of an ETS usually takes multiple years, while the CCC has been given less than two months to provide advice to BEIS. During this short period of time, it was not possible to undertake an in-depth quantitative analysis on various topics, including detailed modelling of economy-wide and sector-specific impacts of carbon pricing or a detailed carbon leakage risk assessment. Instead, the recommendations rely on previous theoretical and empiric studies, practitioners’ experience, and academic and expert input. A deeper analysis of specific issues can be part of future studies before and after the launch of the new carbon pricing instrument.
This report and its recommendations are entirely the work of Vivid Economics in support of the CCC’s advice. Its conclusions do not represent the CCC’s advice.
This section provides recommendation on the preferable policy design for each scenario. The recommendations weigh advantages and disadvantages of each policy option and conclude with the preferable design.
● BEIS prefers a linked UK ETS that mirrors the EU ETS to facilitate rapid linking, however, it is not certain that this policy option will be available.34 Thus, this section provides recommendations on preferable design for both a linked UK ETS and a standalone ETS.
● Similarly, a carbon tax might only be considered as a fallback option, but this section also provides recommendations in case the Government chooses to implement a tax.
Some design choices are not feasible to implement by the expected launch in January 2021, but this section also aims to outline options to improve the carbon pricing design in the medium term. The short period until the beginning of 2021 will not allow for substantial changes from the current EU ETS in many areas. Nevertheless, a divergence from the current carbon market in some areas might provide benefits for the UK as discussed below. Therefore, the recommendations include suggestions that are not feasible at the launch but should be considered in the medium term to help guide decisions about the most appropriate carbon pricing instrument from 2021 onwards.
5.1 Integrating markets through linked ETS
This section focuses on technical issues regarding linking and highlights policy choices and trade-offs that are likely to eventuate from the different scenarios. Views on the feasibility and potential of linking outcomes are provided in Section 4.1. The policy option space is relatively limited when considering a mirrored link, as the UK would likely be a policy taker in any immediate linking scenario given the short time frame and the larger
34The negotiations on linking would be affected by the general political climate between the UK and the EU and the experience on the negotiations on the UK’s departure from the EU. As the result, the EU might not be willing to negotiate an immediate link. Furthermore, both jurisdictions might be limited in their capacity to prepare and conduct linking negotiations before 2021 as they prepare for the impacts of the UK’s departure more generally.
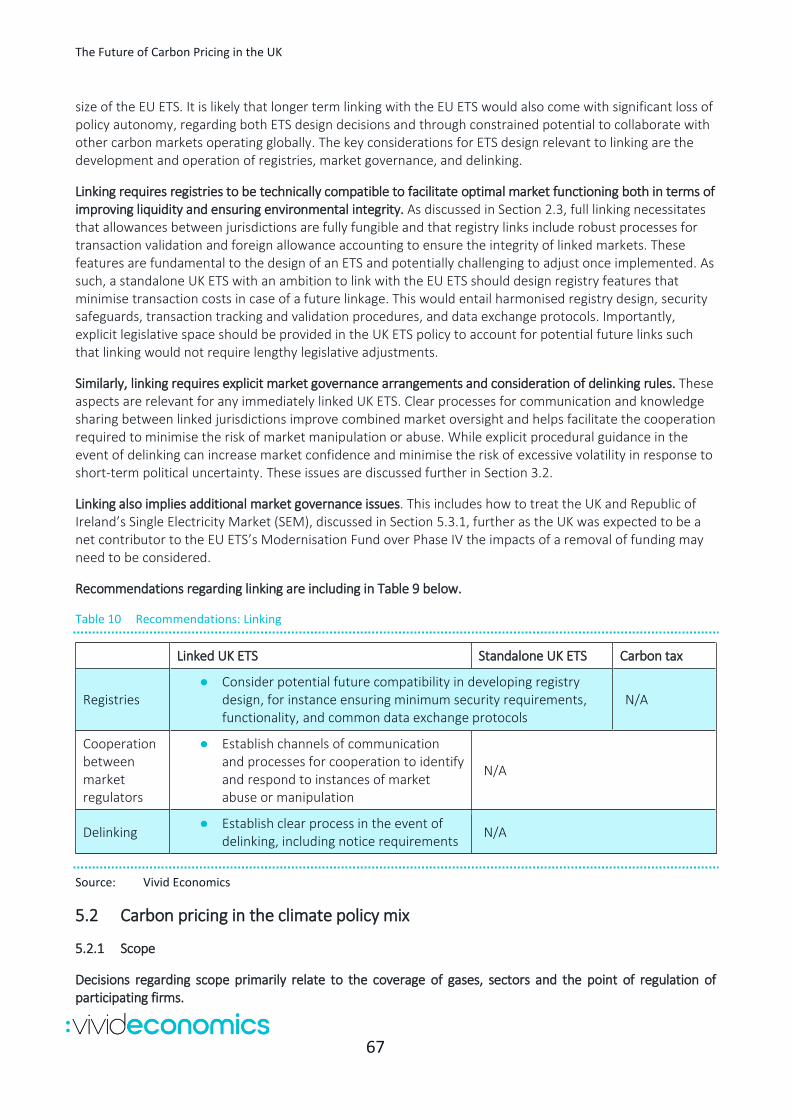
The Future of Carbon Pricing in the UK
67
size of the EU ETS. It is likely that longer term linking with the EU ETS would also come with significant loss of policy autonomy, regarding both ETS design decisions and through constrained potential to collaborate with other carbon markets operating globally. The key considerations for ETS design relevant to linking are the development and operation of registries, market governance, and delinking.
Linking requires registries to be technically compatible to facilitate optimal market functioning both in terms of improving liquidity and ensuring environmental integrity. As discussed in Section 2.3, full linking necessitates that allowances between jurisdictions are fully fungible and that registry links include robust processes for transaction validation and foreign allowance accounting to ensure the integrity of linked markets. These features are fundamental to the design of an ETS and potentially challenging to adjust once implemented. As such, a standalone UK ETS with an ambition to link with the EU ETS should design registry features that minimise transaction costs in case of a future linkage. This would entail harmonised registry design, security safeguards, transaction tracking and validation procedures, and data exchange protocols. Importantly, explicit legislative space should be provided in the UK ETS policy to account for potential future links such that linking would not require lengthy legislative adjustments.
Similarly, linking requires explicit market governance arrangements and consideration of delinking rules. These aspects are relevant for any immediately linked UK ETS. Clear processes for communication and knowledge sharing between linked jurisdictions improve combined market oversight and helps facilitate the cooperation required to minimise the risk of market manipulation or abuse. While explicit procedural guidance in the event of delinking can increase market confidence and minimise the risk of excessive volatility in response to short-term political uncertainty. These issues are discussed further in Section 3.2.
Linking also implies additional market governance issues. This includes how to treat the UK and Republic of Ireland’s Single Electricity Market (SEM), discussed in Section 5.3.1, further as the UK was expected to be a net contributor to the EU ETS’s Modernisation Fund over Phase IV the impacts of a removal of funding may need to be considered.
Recommendations regarding linking are including in Table 9 below.
Table 10 Recommendations: Linking
Linked UK ETS Standalone UK ETS Carbon tax
Registries ● Consider potential future compatibility in developing registry
design, for instance ensuring minimum security requirements, functionality, and common data exchange protocols
N/A
Cooperation between market regulators
● Establish channels of communication and processes for cooperation to identify and respond to instances of market abuse or manipulation
N/A
Delinking ● Establish clear process in the event of
delinking, including notice requirements N/A
Source: Vivid Economics
5.2 Carbon pricing in the climate policy mix
5.2.1 Scope
Decisions regarding scope primarily relate to the coverage of gases, sectors and the point of regulation of participating firms.

The Future of Carbon Pricing in the UK
68
Gases: The UK government has announced its intention to cover emissions of all major greenhouse gases under a future carbon price. The consultation document proposes that the ETS apply to and cover emissions of CO2, N2O, CH4, SF6, hydrofluorocarbons and perfluorocarbons. This represents all major greenhouse gases, and all greenhouse gas covered in the EU’s NDC, except for nitrogen trifluoride (NF3) which was responsible for less than 0.5ktCO2e of the UK’s gross emissions in 2016 (UNFCCC, 2019). The coverage of GHGs is closely tied to the coverage of sectors, for example, it would be challenging to cover the waste sector without covering CH4 emissions. This near universal coverage is appropriate and consistent with the approach of the EU ETS, therefore this is considered appropriate in all scenarios.
Sectors: The UK government’s letter to the CCC requested advice on the design of an ETS applying to the power, industry and aviation sectors. Both the proposed sector coverage and gas coverage are consistent with those covered under the EU ETS. However, there is a strong case for considering covering a wider set of emissions under a standalone ETS or carbon tax scenario. Expanded sectoral coverage increases mitigation possibilities and can stabilise carbon markets and increase liquidity. Consideration of expanded sector coverage also requires consideration of the point of regulation in sectors to which coverage may be expanded.
Point of regulation: The UK government’s consultation paper on the Future of Carbon Pricing recommends the continuation of the small emitter and hospitals opt-out and introduces ultra-small emitter exemption. These changes to threshold rules appear appropriate to reduce the administrative burden on small emitters in the UK. The small emitter and hospitals opt out would apply to installations emitting less than 25,000tCO2 and with a net rated thermal input below 35MW. As discussed in Section 3.3.1, emitters of this scale are often not covered in other jurisdictions. The BEIS proposal suggests slight operational differences between a linked UK ETS scenario and a standalone UK ETS scenario, which appear to strike a reasonable balance between maintaining a consistent approach with the EU ETS and reducing administrative burden for these smaller facilities. The ultra-small emitter exemption is proposed to apply to all installations emitting less than 2,500tCO2e per annum with these facilities having no obligations except to monitor their emissions. This appears appropriate in all scenarios given the small size of these facilities.
Options regarding the scope of carbon pricing are set out in Table 11 below.
Table 11 Options considered: Scope
Linked UK ETS Standalone UK ETS Carbon tax
Gases ● Retain current gas coverage as per Annex II of the EU ETS including
emissions of CO2, N2O, CH4, SF6, hydrofluorocarbons and perfluorocarbons
Sectors and sources
● Retain current sector coverage ● Expand coverage to additional sectors and sources of emissions include
some combination of; uncovered transport; uncovered fossil fuel combustion; uncovered industrial gases; waste; fugitives; agriculture; and/or, land-use, land-use change and forestry (LULUCF)
Point of regulation ● Appropriate point of regulation may be point of emission, upstream or
downstream and is assessed on a case by case basis
Thresholds ● Continue small emitter and hospitals opt-out and introduce an ultra-small
emitter exemption
Source: Vivid Economics
The feasibility and desirability of expanding the scope of carbon pricing varies across policy scenarios. Expanding the scope of the UK ETS will have major implications for cap setting, SAMs and measures to

The Future of Carbon Pricing in the UK
69
support secondary market development. It will also have more minor impacts on several other aspects of policy design.
In an immediately linked UK ETS, it is not feasible to expand sectoral coverage due to time constraints. Under Article 24 of the EU ETS Directive, Member States can unilaterally expand coverage to additional sectors. However, expanding the sectoral coverage under a linked UK ETS will require changes to caps and SAMs, having a spillover impact on the EU ETS. It is highly unlikely for the UK to reach a detailed agreement on this issue with the EU in advance of leaving the EU ETS. As a result, in the near term, mirroring the scope of the EU ETS is the only feasible option, covering energy, industry and inter-EEA aviation. However, in the longer term, expanding sectoral coverage may be possible.
In a standalone UK ETS, expanding the scope of the ETS to other sectors could increase the efficiency, liquidity and stability of the market. However, expanding scope to new sectors can be difficult due to challenges with measuring emissions where emissions, or facilities covered have insufficient regulatory readiness to appropriately participate in the market (see section 3.3.1). By increasing the absolute market size, liquidity will be enhanced thus increasing the likelihood that effective secondary markets developed. In other jurisdictions with low levels of covered emissions such as New Zealand, liquidity can be low and exchange-based trading may not develop. The composition of firms can also be important, as heterogeneous traders will have different drivers of buying and selling behaviour, which can support a more active market. This is discussed further in section 5.3.4 below.
Under a carbon tax, expanding sectoral coverage can support greater mitigation. While in this case market stability is less relevant, expanding sectoral coverage under a carbon tax can still mobilise additional mitigation across sectors and simplify the current set of carbon taxes (as discussed in Section 5.2.2 below). It is also relatively easy to expand coverage under a carbon tax because transactions costs to small emitters are much more limited as compared to an ETS.
Under our recommendations, domestic aviation emissions would be covered under a linked ETS and a standalone UK ETS. In the ETS scenarios, this coverage will work in coordination with the CORSIA abatement mechanism for international aviation to ensure that aircraft operators do not face double taxation and to maintain domestic aviation abatement ambition at levels at or above the EU ETS. Streamlining reporting requirements to one state could simplify compliance. We support the UK governments preferred option of a UK ETS covering emissions from domestic UK flights, and flights departing from the UK to the EEA and to Switzerland, noting this would likely require agreement of the EU27.
However, in our carbon tax scenario aviation emissions would not be covered immediately and the government will need to consider carefully how to cover aviation if it implements a Carbon Emissions Tax under a no-deal scenario. Covering aviation emissions under a carbon tax is not straightforward due to international obligations. The Chicago Convention and various bilateral air service agreements set principles for international air transport and effectively ensure that the taxation of aviation fuels is prohibited. As such, covering aviation under a carbon tax could become more complex and would not be included in the current carbon tax scenario. However, should the UK government implement a long-term carbon tax, consideration will need to be given as to how best to support aviation abatement incentives.
Of those sectors and sources considered in Table 11, expanding coverage of transport (excluding international aviation) and uncovered fossil fuels (predominantly gas) is desirable and plausible by 2021. Expanding coverage to upstream transport (road transport and domestic maritime) and gas could see around 200MtCO2e of additional emissions covered from 2021.35 This would represent a more than doubling of the coverage of the ETS, with improved liquidity supporting a more robust secondary market that is more likely to offer risk management products including forward and futures contracts. Placing a carbon price incentive in these sectors can mobilise further emissions reductions from households, businesses and other small
35 Estimated, drawing on BEIS reporting to UNFCCC (UNFCCC, 2019)

The Future of Carbon Pricing in the UK
70
emitters that may otherwise by missed. Measurement of these emissions is also relatively straightforward with the use of emissions factors. If the policy is targeted upstream, then the measure of these emissions is possible through obligations on a small number of relatively sophisticated firms.36 Upstream coverage of these sectors has been successful in other jurisdictions, including California, New Zealand and Australia (see section 3.3.1).
Expanding the coverage to the transport sector would likely improve the stability of a standalone UK ETS because emissions levels from sectors currently covered by the EU ETS are relatively volatile. Emissions covered in the EU ETS are predominantly from the industrial and energy sectors, while only a small part of transport emissions (inter-EEA aviation) is covered. Energy, industry and transport are collectively responsible for approximately 70% of the UK’s net emissions. Figure 16 shows that over the last decade emissions from transport have been far less volatile than those from the energy and industry sectors, both of which have seen year on year changes in emissions of up to 15% in some years, where transport emissions have changed no more than 5% in any given year. Under a standalone UK ETS scenario and a UK carbon tax scenario, these emissions would be covered in line with the proposal in the Future of Carbon Pricing consultation. However, this is likely to require a separate agreement with the EU, if this does not eventuate it is likely that only domestic aviation (UK to UK flights) would be covered, with international flights and flights to the EEA addressed in line with the UK’s obligations under CORSIA.
Figure 16 Sectors covered by the EU ETS have volatile emissions
Note: Energy is calculated as total GHG emissions from fuel combustion by energy industries, transport as total GHG emissions from fuel combustion in transport, Industry as the sum of total GHG emissions from fuel combustion and industrial process emissions.
Source: Vivid Economics, drawing on BEIS, 2019, CRF Tables as reported to the UNFCCC, Summary 2: Summary Report for CO2 Equivalent Emissions, available at https://unfccc.int/documents/194973
Expanding the sectoral coverage under a standalone UK ETS is also unlikely to become a barrier against linking it with the EU ETS in the future. Broader sectoral coverage makes the achievement of net zero targets more
36 The Energy System’s catapult for instance found that New Zealand’s upstream regulation helped to ensure “low transaction and compliance costs, while covering a large amount of emissions”(Energy Systems Catapult, 2018)
-20%
-15%
-10%
-5%
0%
5%
10%
2006 2007 2008 2009 2010 2011 2012 2013 2014 2015 2016
An
nu
al c
han
ge in
em
issi
on
s b
y se
cto
r
Energy Industry Transport

The Future of Carbon Pricing in the UK
71
likely as it reduces the level of uncertainty associated with uncovered sector emissions. Furthermore, environmental integrity is unlikely to be a challenge because emissions measurements in these sectors are robust. Finally, the impact on competitiveness will be limited because these sectors are not directly exposed to international competition.
Expansions in coverage beyond transport and uncovered fossil fuels may be considered in future. The most obvious candidates for future expansion include uncovered industrial gases (particularly refrigerants) and emissions from waste and fugitive emissions, which together accounted for almost 50MtCO2e of emissions in 2016. Coverage of agriculture and LULUCF emissions is unlikely in the near term. Emissions from these sources suffer from larger uncertainties in the measurement of emissions and relatively low levels of regulatory readiness from firms of varying size and sophistication.
These recommendations are summarised by scenario in Table 12 below.
Table 12 Recommendations: Scope
Linked UK ETS Standalone UK ETS Carbon tax
Gases ● Retain current gas coverage as per Annex II of the EU ETS including emissions of CO2,
N2O, CH4, SF6, hydrofluorocarbons and perfluorocarbons
Sectors and sources
● Retain current sector coverage including UK-EEA aviation
● Expand coverage to include transport (excluding international aviation and maritime) and uncovered fossil fuel combustion (predominantly natural gas).
● Consider expanding scope to include uncovered industrial gases, waste and fugitive emissions at a future date.
Point of regulation
● Unchanged for covered sectors and sources.
● Unchanged for facilities already covered by the EU ETS
● Upstream coverage of transport and uncovered fossil fuel combustion. Where this overlaps with emissions from facilities already covered under the EU ETS, this can be addressed by providing upstream suppliers with partial exemptions.
Thresholds ● Continue small emitter and hospitals opt-out and introduce an ultra-small emitter
exemption
Source: Vivid Economics

The Future of Carbon Pricing in the UK
72
5.2.2 Cap (or tax-level)
The UK government has announced that it will pursue a target to reach net zero emissions by 2050. This target guides the level of the cap that is set in the ETS and the degree of effort that must be pursued in uncovered sectors. However, it is important that the mechanism for adjusting the cap or tax level over time is sufficiently flexible and allows policy ambition to be ratcheted up, which is an intention of the Paris Agreement. The recent tightening of long-term emissions targets in the UK demonstrates how preferences for emissions reductions may change.
As discussed in Section 3.3.2, large uncertainties in projected emissions introduce significant complexity to the cap setting process. The EU ETS deal with this uncertainty by establishing explicit targets in covered and uncovered sectors under the Effort Sharing Decision. Other jurisdictions deal with this uncertainty in different ways, with several instead adopting carbon budgets and allowing effort to be spread across years, while others have regular reviews to calibrate caps. Modelling can shed light on risks and uncertainties associated with cap setting options. The analysis in this section draws on modelling performed by BEIS’s BCPM, which is explained in Section 4.2.
We have identified several potential options for setting the cap and tax level, set out in Table 13 below. These range from the status quo, with caps set at the UK’s notional level of the EU ETS cap or carbon tax rates aligned with the EU ETS price, to scenarios closely tied to achieving the UK’s net zero emissions targets. The table also considers supplementary carbon taxes – those that currently apply to uncovered sectors or on top of the EU ETS price. However, this section does not consider SAMs for ETS which are considered in detail in Section 5.3.2. These mechanisms alter supply if certain price or quantity criteria are met and may have an impact on long-term supply if adjustments are permanent. We also limit our consideration to explicit carbon prices and exclude other policies with an effective carbon price such as fuel taxes, which are often levied for other reasons. Under all policy scenarios, regular reviews of progress to the net zero target will be required – these are discussed in section 5.4.2.
Table 13 Options considered: Cap or tax-level
Linked UK ETS Standalone UK ETS Carbon tax
Cap and tax level
● UK notional share of EU ETS cap ● UK notional share of EU ETS to
2030, with a net zero efficient price trajectory from 2030
● Net zero trajectory from 2021
● Variable tax-rate tracking EU allowance price
● Carbon emissions tax start at £16 then converge to net zero efficient price trajectory by 2030
Supplementary carbon taxes
● Retain Climate Change Levy (CCL) and Carbon Price Support (CPS) ● Integrate CCL and CPS into broader pricing mechanism ● Retain CPS at budgeted rate for 2020-21 followed by net zero consistent
price level ● Retain CCL at budgeted rates to 2021-22 followed by net zero consistent
price level differentiated rates by fuel can be retained if appropriate for net zero trajectory
SAMs ● Discussed in Section 5.3.2
Review of caps and taxes
● Discussed in Section 5.4.2
Source: Vivid Economics

The Future of Carbon Pricing in the UK
73
Cap setting in a UK ETS
The approach to cap setting affects the level of effort required in uncovered sectors, industry competitiveness and overall government revenues.
A tighter ETS cap (or higher carbon tax) implies that a lower level of effort is needed for uncovered sectors to meet emissions reductions targets. By contrast, a looser cap (or lower carbon tax) implies that more effort is required in uncovered sectors. This in turn means that additional supplementary policies are necessary under a looser cap. However, the magnitude of this effect is dependent on whether the UK ETS is linked or standalone. In a linked UK ETS, a tightening of the cap will have a limited uplift on the carbon price, resulting in an insignificant increase in incentives for abatement in covered sectors.
A looser ETS cap can lead to lower carbon prices in covered sectors. This is relevant when comparing a cap based on the notional UK share of the EU ETS cap against a net zero consistent cap trajectory (assuming current coverage levels). Figure 17 provides an indicative example of the relationship between free allocations and caps. If we assume that allocations to industry were to remain constant at 2018 levels, these will take up an increasing share of the cap over time, reaching 100% of the net zero cap by 2042 or 100% of the notional cap in 2046. While this is an extreme example, it implies that under a tighter cap, the share of free allocations may need to fall more rapidly. The EU ETS currently has a mechanism to ensure industry allocations remain at or below 43%of the cap in any one year. If a similar mechanism is adopted in the UK ETS (and it binds), then a tighter cap will result in a lower level of free allocations to industry, with potential impacts on competitiveness. However, it should be noted that alternative measures exist to protect industry competitiveness, such as the use of border carbon adjustments in the longer-term. These alternatives are discussed further in Section 5.3.1 below.
Figure 17 Indicative scenarios of cap-setting, free allocations and auction supply
Note: Indicative scenarios only Source: Vivid Economics

The Future of Carbon Pricing in the UK
74
A tighter cap will reduce the volume of allowances auctioned and may therefore squeeze auction revenues. The scale of this impact differs between linking scenarios, with revenue losses from a tighter cap more pronounced under a linked scenario. This is because the UK ETS will largely be a price taker from the larger EU ETS, such that a decrease in the UK ETS cap will only create a limited increase in price, resulting in greater revenue losses. In contrast under a standalone UK ETS, reduced supply is likely to also lead to higher prices, which counteracts the impact of a lower cap on revenue and may even mean that revenue increases.
It should be noted that the ETS cap can target net domestic emissions if crediting of sequestration is allowed. The UK carbon budget, as with a net zero target, is based on net domestic emissions (that is gross emissions less sequestration) rather than gross domestic emissions. In other words, incentive policies are required not only for emissions abatement, but also for sequestration activities, such as expansion of forestry or BECCS. Amongst direct subsidies and other innovation policies, the ETS is one policy option to support sequestration. Currently, the EU ETS is not designed to support crediting of GGRs. There is an opportunity to use the ETS to incentivise sequestration if appropriate changes are made to the rules in crediting and offsets (see Section 5.2.3).
To maintain consistency with the EU ETS under a linked UK ETS, the notional cap over Phase 4 could be maintained, or any change in cap delayed until the release of the UK’s sixth carbon budget. Under a linked UK ETS, the market price for allowances will be heavily influenced by EU policy and external market conditions. A unilateral tightening of the UK cap may reduce revenues without providing corresponding additional incentives to cut emissions. A tighter cap should be considered if the UK can agree with a coordination mechanism with the EU such that cap tightening can lead to additional abatement across the EEA and the UK over Phase 4, however this may not be feasible for implementation by 2021.
After Phase 4, there is a strong case to tighten the ETS cap to align it with the UK’s net zero target. In the absence of a net zero consistent cap in the EU, the EU ETS price is likely to remain below the cost-effective path in covered sectors in the UK. Supplementary policies in covered sectors will be needed to meet the UK’s domestic targets. For example, a Carbon Price Support can be imposed on all covered sectors, which may have impacts on EU wide emissions (see Box 13).
Box 13 The impact of cap setting choices under a linked UK ETS on EU wide emissions is unclear
Before the introduction of the MSR, a reduction in the cap of a linked UK ETS would, over time, lead to an equivalent reduction in total EU emissions.
However, the introduction of the MSR changes this relationship. In the coming years it is expected that the MSR will bind, with large levels of allowance invalidation expected from 2023 onwards. In this case the impact of a lower UK cap depends on the behaviour of market participants. To the extent that a tighter UK cap drives higher prices and real emissions reductions, then the EU-wide surplus of allowances will be reduced (to the point where there may be allowances released from the MSR reserve as well). However, if a tighter cap simply results in the drawdown of the existing allowance surplus then this will see fewer allowances placed in the MSR and subsequently cancelled.
It is likely that the true impact will sit in between these extremes, with a tighter cap reducing total EU emissions by an amount less than equivalent to the change in the national cap.
By contrast under a standalone UK ETS, there is a case to tighten the cap so that the ETS can drive effort in reducing emissions in covered sectors. Compared to a linked UK ETS, cap setting in a standalone UK ETS has a more direct impact on carbon prices and therefore provides greater control over the level of emissions. This strengthens the case for using the ETS as the main driver for emissions reductions as opposed to relying on

The Future of Carbon Pricing in the UK
75
supplementary policies to spur mitigation in covered sectors. As discussed in Section 3.3, the appropriate level for the cap should mirror the carbon budget for covered sectors – a tighter cap will be required to pursue the net zero target.
Our recommendation to expand the scope of a standalone UK ETS would also necessitate adjustments in the cap to account for the expanding set of emissions covered by the policy. As discussed in Section 5.2.1 above, the coverage of a standalone UK ETS should expand over time to support mitigation across the economy in an efficient manner. If sectors such as agriculture, aviation and forestry are included in the ETS at a later stage, they would affect both the demand and supply of allowances. For example, facilities undertaking GGRs could generate offset credits or allowances to be sold to market participants who need to meet their compliance obligations. Without adjustments to the cap, this can create a supply of allowances in the market and put downward pressure on the carbon price. As such, in setting the cap the potential impact of GGRs should be considered to ensure compatibility with the carbon budget.
Even if coverage is unchanged, staying with the notional cap under a standalone UK ETS carries the risk of a significant allowance oversupply building throughout the 2020s. The BCPM modelling developed for this advice shows that if the UK’s cap is set at the level implied by the UK’s share of the EU ETS cap a large allowance surplus is likely in some scenarios as discussed in Section 4.2.1 above. The build-up of allowance surplus over the 2021-30 period continues to have a large impact in the years following. If a net zero consistent cap is adopted from 2021 however, this surplus remains moderate resulting in greater emissions reductions in the 2030s and 2040s.
While cap setting in a standalone UK ETS provides greater control over UK emissions, it does not guarantee that targets in devolved administrations will be met, see Box 14 below.
Box 14 Inability to set a UK ETS cap that guarantees meeting devolved administrations targets
Setting the ETS cap alone will not guarantee emissions reductions in line with targets within devolved administrations, such as the Scotland’s proposed net zero target by 2045.
This is because the market mechanism will encourage abatement in areas where marginal abatement costs are the lowest, irrespective of their geographic locations. For example, even if the national cap is tightened, it will be difficult to meet a net zero target in Scotland if Scottish installations find it cheaper to purchase allowances from the market rather than reducing their own emissions. As such devolved administrations may consider adopting supplementary policies if they are concerned about meeting their emissions reduction targets.
See Section 5.4.3 for discussion on the coordination required with devolved administrations.
Integration of a UK ETS with supplementary carbon taxes
Supplementary carbon prices may be needed to meet the UK’s legislated targets if carbon prices in an ETS are too low or coverage is limited. At present, the UK applies carbon taxes in addition to the price levied through the EU ETS. These supplementary carbon taxes are:
● The Carbon Price Support (CPS);37which tops up the EU ETS as an additional carbon tax applied to electricity generation
37 The CPS is given effect through the CCL, however given their different rates and objectives we consider them separately for the purposes of this paper (HMRC, 2019b). At present, facilities with a voluntary Climate Change Agreement receive a discount on the CCL. These agreements will continue to be supported; however additional discounts will no longer be needed.

The Future of Carbon Pricing in the UK
76
● The Climate Change Levy (CCL); which prices emissions from non-domestic energy use
In a linked UK ETS scenario, there are strong reasons to maintain this system but to also align it with the net zero target. This provides additional incentives for decarbonisation that are needed to more closely align the level of mitigation effort of covered sectors with efficient mitigation pathways, with the CCL providing incentives to reduce energy consumption from some uncovered emissions sources. Retaining these supplementary taxes also maintains consistency with pre-Brexit policy settings. In this scenario the UK should gradually adjust the level of the CPS and CCL to be consistent with the efficient price level needed to meet the UK’s net zero target in the medium term.
In a standalone UK ETS scenario, there is a case for integrating these supplementary carbon taxes into a single carbon pricing mechanism applying to a larger share of total emissions. Under a standalone UK ETS more ambitious emissions reductions targets can be pursued reducing the need for supplementary policies in covered sectors, particularly if an appropriate SAM is adopted to maintain price incentives (see Section 5.3.2). In this case, additional carbon taxes add administrative complexity and distort mitigation incentives across sectors, reducing the overall efficiency of the policy. By rolling these policies into a single mechanism it is possible to achieve a uniform carbon price without reducing the incentive.
Setting a carbon tax
In a ‘no deal’ scenario, the government has noted its intent to introduce a Carbon Emissions Tax to replace the EU ETS (HMRC, 2018). Under this system all current UK stationary installations participating in the EU ETS would be covered. The tax would be payable on all emissions in excess of the allocation of free EU Allowances that would have been allocated under the EU ETS and installations would continue to report their activities annually under the existing Monitoring, Reporting and Verification (MRV) scheme. The tax was intended to be levied at a rate of £16/tCO2e in 2019.
If the government decides to pursue a Carbon Emissions Tax in the longer term, we have identified two potential approaches to setting its level:
1. Setting a variable tax rate tracking the EU allowance price 2. Carbon emissions tax starting at £16/tCO2e in 2019 and converging to the EU allowance price by
2021 and the efficient net zero price trajectory no later than 2025. This initial level is lower than current EU allowance prices but is adopted consistent with the government’s announced policy.
Adopting a variable tax rate would prioritise reducing competitive distortion between the EU ETS and UK covered firms relative to achieving the UK’s net zero emissions targets. Adopting this approach would require supplementary policies to support emissions reductions in covered sectors, particularly for electricity generation. A variable tax rate pegged to the EU ETS also introduces administrative complexity in developing and implementing a methodology to track and set EU ETS equivalent tax levels. This reduces the benefit price certainty traditionally offered by carbon taxes and raises questions as to how frequently the tax rate is updated. Further, managing competitiveness impacts is more appropriately achieved through adjustments to rebates provisions (discussed in Section 5.3.1 below) than through the headline carbon tax rate.
Therefore, it is preferable to set the carbon tax rate at the level needed to efficiently decarbonise covered sectors in line with the net zero 2050 target. To provide a gradual transition to the necessary carbon tax level, this could be achieved by converging from the proposed rate of £16/tCO2e (or a similar price level) to the estimated cost-efficient pathway in the early 2020s. The current EU allowance price is significantly higher than this level, as such the tax rate should increase rapidly to reach an equivalent level no later than 2021. The latest assessment on cost-efficient pathways uses DECC’s target-consistent carbon values, which would translate into a carbon tax of £78/tCO2e in 2030 and £220/tCO2e in 2050, however this efficient may change

The Future of Carbon Pricing in the UK
77
given expanded scope and changes in context.38 This has to be reviewed and calibrated regularly to ensure the carbon tax is aligned with the net zero target and newest growth and fuel price projections.
If a Carbon Emissions Tax is implemented, there is a strong justification that this should replace the CCL and CPS. As proposed in Section 5.2.1, this carbon tax could be applied to a larger set of emissions than are covered by the EU ETS. Establishing a Carbon Emissions Tax to replace the EU ETS, the CCL and CPS reduce administrative complexity and increase the economic efficiency of the UK’s carbon pricing policies.39
Table 14 below summarises our recommendations regarding the setting of caps and tax-levels.
Table 14 Recommendations: Cap or tax-level
Linked UK ETS Standalone UK ETS Carbon tax
Cap and tax level
● Adopt notional UK share of EU ETS cap to 2030, then move to a net zero trajectory; a tightening of the cap may also be considered after the release of the UK’s sixth carbon budget
● Set cap consistent with a net zero trajectory, this will differ based on decisions on scope
● Set Carbon Emissions Tax at £16 in 2019 and converge to the expected EU allowance price by 2021, and a net zero consistent price trajectory no later than 2025.
Supplementary carbon taxes
● Retain Climate Change Levy (CCL) and Carbon Price Support (CPS) at current level but revise in line with net zero target
● Remove CCL if scope is expanded (see Section 5.2.1)
● Remove CPS from 2021 if replaced by a SAM (see Section 5.3.2)
● Remove CCL if scope is expanded (see Section 5.2.1)
● Gradually remove CPS as Carbon Emissions Tax converges to the efficient price trajectory
Source: Vivid Economics
5.2.3 Crediting and offsets
The UK government has announced its intention to adopt a target to reach net zero greenhouse gas emissions by 2050. Achieving this requires emissions reductions across the economy, with an important role being played by the potential expansion of mitigation from the forestry and agriculture sectors.
Newly planted forests can sequester carbon for decades into the future, so action today can meaningfully contribute to achieving the UK’s net zero 2050 target. Land use change will play an important role in any feasible UK net zero 2050 scenario, with the expansion of forestry and restoration of peatlands providing potentially substantial increases land-based carbon storage.
Mobilising sequestration from GGRs requires policies to address a range of market failures. In the land sector a major barrier to uptake of land use change is the lack of a price signal to appropriately value land-based
38 The pathways represent the emissions reductions by sector that are most efficient at the given carbon price level (CCC, 2015). 39 The government should continue to support the establishment of Climate Change Agreements (CCAs) that operate alongside the CCL.

The Future of Carbon Pricing in the UK
78
carbon storage. Other supplementary policies will be needed to uptake GGRs across the UK economy; these are discussed further in Section 5.2.4 below.
Domestic offset mechanisms have proved effective at mobilising land sector mitigation in several jurisdictions. As discussed in Section 3.3.3 above, crediting mechanisms to date have disproportionately led to crediting of forestry and other land sector projects.
The UK is well placed to implement a domestic offset system to begin to change behaviour and channel investment to regional communities to reduce land sector emissions. To be effective this mechanism must be robustly designed and integrated into the broader policy mix. Table 15 below outlines the options identified for the operation of a crediting and offsets system.
Table 15 Options considered: Crediting and offsets
Linked UK ETS Standalone UK ETS Carbon tax
Crediting mechanism & sectors
● No offsets ● Forestry offsets only with transition of Woodland Carbon Code ● Expanded project-based or programmatic domestic offset crediting system,
applying to emissions reductions, avoidance or sequestration from all uncovered sectors
Demand source
● Government purchase
● Compliance obligation in uncovered sectors
● Government purchase ● Use for compliance for carbon price liabilities by
covered sector firms
Restrictions on use
● No limits on use ● Quantitative limits on use against compliance obligations
International offsets
● Not considered at present given ongoing negotiations on the Paris Rulebook and the design and operation of a new market mechanism under Article 6.4
CORSIA ● Continue to cooperate through the International Civil Aviation Organisation (ICAO)
to ensure the Carbon Offsetting and Reduction Scheme for International Aviation (CORSIA) supports real and additional emissions reductions
Source: Vivid Economics
The UK has already established a crediting mechanism to provide offset credits for organisations looking to voluntarily offset their emissions with the Woodland Carbon Code. At present, the Woodland Carbon Code applies to about 17,000 hectares which are expected to sequester 6MtCO2 over the next 100 years (UK Woodland Carbon Code, 2019). While an important start, this is a long way from the scale of change required under a net zero trajectory. Indeed, CCC analysis has suggested a long-term milestone for the UK that would see forestry expanding by 30,000-50,000 hectares per year by 2050.
There are significant benefits in expanding eligibility for offsets to other uncovered sectors. The development of offset crediting methodologies is complex and takes time. It would therefore be wise to develop institutions that would oversee the development of additional methodologies in uncovered sectors. Experience from California, British Columbia, Australia, South Africa and other jurisdictions suggest that substantial abatement opportunities are likely to be present across sectors including agriculture, waste, industrial gases and fugitive emissions. These sectors are all at least partially uncovered under our

The Future of Carbon Pricing in the UK
79
recommendations made in section 5.2.1 above, therefore offsetting provides an opportunity to efficiently reduce emissions in these sectors.
SAMs play an important role to maintain decarbonisation incentives for ETS sectors. Offsets can shift some of the abatement effort to non-ETS sectors and decrease the allowance price, creating a risk that if not this may delay decarbonisation if not appropriately managed. However, by establishing an effective SAMs in a standalone UK ETS scenario, this risk can be managed to ensure carbon prices remain consistent with the net zero objective. The design of SAMs is outlined in detail in Section 5.3.2.
Demand for offsets
The appropriate mechanism to mobilise demand for offsets will differ between scenarios.
In a linked ETS scenario, offsets will not be able to be used for ETS compliance purposes. In this case, a demand source will need to be found from outside covered sectors. Here, the two main options are government purchase of mitigation outcomes, or an alternative compliance obligation in uncovered sectors. Government purchase at the scale required to align with the net zero targets could have substantial direct fiscal costs, and uncertainty regarding future commitment of government funds could nonetheless undermine investment. On the other hand, uncovered sectors and particularly transport, could provide a stable source of demand for offsets. An offset obligation on sellers of transport fuels could be investigated, starting at a low level and then growing as transport decarbonises and more offset supply becomes available. This would create a market-based mechanism to mobilise mitigation in uncovered sectors and as it is outside of the ETS this will not pose barrier to linking.
In a standalone UK ETS scenario or carbon tax scenario, simplification of climate policy architecture suggest that offsets could be used to meet some proportion of carbon price liabilities.
Qualitative and quantitative restrictions on the use of offsets can help ensure environmental integrity and manage the impact of offsets on markets as discussed in section 3.3.3. Qualitative limits should not be required for domestic offsets, so long as the government implements provision to ensure the credibility of offsets through robust processes and benchmark setting. Quantitative limits can limit the potential impact of offsets on the operation of a carbon market and have been used in all ETS accepting offsets to date. These limits may be appropriate to ensure that the expansion of offsets does not reduce the need for covered sectors to reduce emissions under a standalone UK ETS or carbon tax. Under a linked UK ETS where we propose demand for offsets is generated from a compliance obligation on transport emissions, the potential restriction on the use of domestic offset credits is less likely to be necessary, as the level of demand is defined as a quantity-limited obligation.
In a standalone UK ETS use of offsets can be restricted to manage impacts on supply and demand. This can follow international practice and allow offsets to be used for a restricted proportion of emissions, for instance starting at up to 5% of liabilities, which under expanded coverage would enable in the range of 15-20 MtCO2e offsets to be used from 2021. This potential level of demand is unlikely to be fulfilled given the current lack of offset projects but would provide a clear incentive to invest in new emissions reductions projects. In the longer term, this quantitative limit may be calibrated against the cap or tax level to increase demand for uncovered sector abatement in line with efficient mitigation pathway.
In a standalone UK ETS, the use of a SAM can ensure low-cost domestic offsets do not disrupt efficient market functioning. Early abatement in offset sectors can often be achieved at relatively low costs and allowing unlimited use of offsets for compliance can result in the offset market overly influencing market outcomes in an ETS, as seen in NZ over 2011-14 (discussed in Section 3.3.3). However, allowing only domestic offsets would not generate as significant supply effects. Similarly, efficient SAM design can ensure that the offset market does not exert significant impacts on allowance prices. This is particularly the case if a SAM targets a

The Future of Carbon Pricing in the UK
80
specific price corridor. The influence of domestic offsets on an ETS market can also be controlled through quantitative limits.
International offsets should not be considered for domestic compliance use until rules for their generation and use are clarified as part of the Paris Rulebook. The finalisation of the Paris Rulebook for market-based cooperation is expected at the Conference of the Parties to the UNFCCC to be hosted by Chile in December 2019. Once finalised it may still be several years before the new market mechanism established under Article 6.4 of the Paris Agreement is fully operational. Thus, the potential use of international offsets should be considered at a later date. International offsets provide a valuable means of channelling climate finance to developing countries, however they should only be considered once appropriate qualitative and quantitative limits have been put in place to manage their potential impacts.
As CORSIA comes into force, it will be important for the UK to ensure that emissions offset within the scheme are credible. Domestic aviation would be covered under the scope of any policy scenario (discussed in Section 5.2.1), complementing CORSIA, the main abatement instrument for international aviation. While the CORSIA rules will establish a list of carbon allowance types that it deems credible, it will be important for the UK and like-minded high-ambition jurisdictions to ensure CORSIA supports real and additional emissions reductions. A major risk is that of double claiming, with a risk that both host jurisdictions and aircraft operators claim emissions reductions from an offset project (International Air Transport Association, 2018). Hence, the UK should work closely with partners including the EU27 to ensure that CORSIA supports robust emissions reductions and take additional measures to protect environmental integrity if required. This should include making provision to introduce additional qualitative or quantitative restrictions on the use of offsets by airline operators, if these offsets fail to meet minimum environmental integrity criteria.
Recommendations regarding crediting and offsets are set out in Table 16 below.
Table 16 Recommendations: Crediting and offsets
Linked UK ETS Standalone UK ETS Carbon tax
Crediting mechanism & sectors
● Expanded project-based or programmatic domestic offset crediting system applying to emissions reductions, avoidance or sequestration from all uncovered sectors
Demand source
● Consider compliance obligation on uncovered emissions from transport
● Use for compliance with carbon price liabilities by covered sector firms
Restrictions on use
● No restrictions ● Quantitative restrictions on use
against compliance obligations
International offsets
● Not considered at present given ongoing negotiations on the Paris Rulebook
CORSIA
● Continue to cooperate through ICAO and with partners like the EU to ensure the CORSIA supports real and additional emissions reductions.
● Consider in future whether additional qualitative or quantitative restrictions on the use of offsets by airline operators, if these offsets fail to meet minimum environmental integrity criteria.
Source: Vivid Economics

The Future of Carbon Pricing in the UK
81
5.2.4 Supplementary measures
As outlined in Section 2.1, carbon pricing operates within a broader climate policy framework that is required to drive efficient reductions in emissions. Carbon pricing aims to address the price-barriers to emissions reductions by putting a price on the negative externality of climate change. By putting a price on emissions, carbon pricing seeks to ensure that an appropriate value is placed on the damages from climate change. However, carbon pricing is less suitable for overcoming non-price barriers to mitigation and supporting particularly expensive mitigation technologies.
Potential options identified for supplementary policies are outlined in Table 17 below.
Table 17 Options considered: Supplementary policies
Linked UK ETS Standalone UK ETS Carbon tax
Price barriers
● Supplementary pricing in covered sectors
● Offset mechanisms or other supplementary pricing policies in uncovered sectors
● Other policies that provide an indirect price incentive
● Supplementary pricing in covered sectors
● Align design of carbon price with long term prices needed to achieve net zero
● Offset mechanisms or other supplementary pricing policies in uncovered sectors
● Other policies that provide an indirect price incentive
Non-price barriers
● Multiple policies have been identified to target a range of non-price barriers, including information barriers, and network and coordination barriers
Source: Vivid Economics
Supplementary policies will be needed to resolve price barriers where carbon pricing is inadequate. In sectors covered by carbon pricing, breakthrough technologies needed to achieve net zero emissions are not yet available on a commercial scale and remain prohibitively expensive to develop, demonstrate and deploy. Incentives from carbon pricing alone are important to make a long-term business case for rolling out new technologies. But they will be insufficient to incentivise companies to bear the full risk of unknown breakthrough technologies, as large technology spillovers cannot be captured by companies. Additional policy incentives and support are therefore required in such covered sectors such as funding support and engagement strategies with broader public (e.g. on CCS). For sectors not covered by carbon pricing, offset mechanisms should be established to provide price incentives for abatement activities. Examples include offsets for forestry emissions reductions and GGR deployment. In doing so, policy transition should be considered as the existing Woodland Carbon Code is already a standalone crediting system for forestry sequestration.
Close cooperation between actors in international supply chains can support technological advancement through RD&D support. For the UK, many key supply chain partners are located elsewhere in Europe, and the UK should continue to collaborate with joint low-carbon technology research projects like NER300 if possible. With the departure from the EU ETS, the UK also leaves the Innovation Fund, but could continue to cooperate with the EU on developing technology collaborations and partnerships.
There are a range of other non-price barriers that can inhibit efficient mitigation that may need to be addressed. The CCC has considered in detail the policies and incentives that are needed to address these primarily non-price barriers, that are inhibiting the UK’s achievement of its emissions reduction targets (CCC, 2019b).

The Future of Carbon Pricing in the UK
82
In the energy sector, there is need to address barriers to investment in renewables and network and coordination failures within energy grids. Deployment of renewable energy technologies can be supported by expansion of access to contract for difference (CfDs) auctions or equivalent mechanisms to manage risks stemming from volatile electricity prices, and by addressing planning barriers to onshore wind. The success of CfDs has meant that these are soon expected to require no net subsidy to producers, so we consider this as a risk reduction policy rather than an explicit pricing policy. Other priorities relate to addressing information and coordination failures through improved electricity network planning to meet growth in future demand, enhanced building standards to deliver greater energy efficiency and development of a coordinated strategy for low carbon heat.
Transport requires a range of policies to support uptake of zero-emission vehicles and support active and public transport. The CCC recommend a sales ban on conventional vehicles from 2030-2035, a clearer approach to EU vehicle standards and testing, stronger incentives to purchase cleaner vehicles and support for modal shifts such as to public transport, walking and cycling. Heavy transport is a harder to decarbonise sector, which requires further planning for the roll-out of zero emission heavy vehicles and/or the use of biofuels.
To reduce industrial emissions requires support to deploy high-capital cost project, particularly CCS. Funding mechanisms should be developed to support fuel switching (particularly to biofuels) and CCS and capital support provided to address industry decarbonisation. To reduce fugitive emissions, policies to reduce methane leakage and venting are needed, as are plans to restrict industrial F-gases. Addressing coordination barriers (knowledge spillovers, coordination of investments) to deployment of CCS and hydrogen will become essential in the 2020’s to support a strategy to develop low- or zero-carbon hydrogen use, production and infrastructure.
Finally, in the land and waste sector there is a need to develop England’s Peatland Strategy and work to reduce biodegradable waste. Doing so will see more carbon stored in the UK’s natural landscapes and reduce methane, a potent short-lived greenhouse gas.
Alongside these immediate priorities, the CCC has identified longer term milestones for key sectors to achieve in line with a net zero target. This includes the near total decarbonisation of power by 2050, a shift to low-carbon heat in all new installations by 2035, expanded electric vehicle charging infrastructure and expansion of use of hydrogen and CCS in industry. On top of this, large scale expansion of GGRs will be necessary through bioenergy with CCS (BECCS) and continued large scale afforestation.
Supplementary policies will be required across the economy to support this transition. This includes support for RD&D as discussed before, coordinating actors and infrastructure and addressing behavioural or other non-price barriers to emissions reductions.
Specific support may also be required for development and deployment of other GGRs. This is discussed in the CCC’s net zero report, which highlighted that alongside the need for deployment of CCS and BECCS the UK would need to support direct air capture of CO2 with storage (DACCS) and some combination of currently more speculative mitigation options. These speculative options included further changes in demand (e.g. in aviation and diets), more radical shifts in land use, greater use of DACCS or the development of a major supply of carbon-neutral synthetic fuels (e.g. produced from algae or renewable power).
The government has commissioned a study on incentivising GGR deployment in the UK and other countries that should inform the development of supplementary policies in this area. An appropriate approach would see the development of governance rules, incentives and market mechanisms to ensure that an at-scale removals market can develop with appropriate environmental safeguards.
Given these challenges, Table 18 outlines recommendations for the role of supplementary policies.

The Future of Carbon Pricing in the UK
83
Table 18 Recommendations: Supplementary policies
Linked UK ETS Standalone UK ETS Carbon tax
Price barriers
● Retain supplementary price mechanisms as discussed in section 5.2.2 above
● Adopt offset mechanisms as identified in section 5.2.3 above
● Advocate for EU ETS policy design that provides appropriate price incentives for GGRs
● Align design of carbon price with long term prices needed to achieve net zero as discussed in sections 5.2.2 and 5.3.2
● Adopt offset mechanisms as identified in section 5.2.3 above
● Provide appropriate price incentives for future deployment of GGRs, through carbon price coverage or offset mechanisms
Non-price barriers
● Adopt policies in line with CCC recommendations to remove non-price barriers to emissions reductions through standards, coordination, infrastructure and other mechanisms.
● Adopt additional policies to address non-price barriers to GGRs as necessary
Source: Vivid Economics

The Future of Carbon Pricing in the UK
84
5.3 A well-functioning market
5.3.1 Allocation and rebates
The choice of allocation methods under an ETS or the use of rebates under a carbon tax requires finding a balance between preventing carbon leakage, preserving incentives to reduce emissions and generating revenue to finance other climate and policy objectives. The identification of carbon leakage risk and the design of appropriate policy responses is an important component of launching a carbon price instrument (see Vivid Economics, 2018a, 2018b). For industrial sectors, the importance of policies to mitigate carbon leakage risks increases after the UK’s departure from the EU ETS for multiple reasons:
● the exclusion from the EU ETS could imply a carbon price differential with its main trading partner;
● alignment with the net zero target will require a tighter cap in the medium term; and
● an expansion of scope to harder-to-abate sectors like transport may increase the domestic carbon price.
Achieving the balance between safeguarding competitiveness and environmental integrity requires consideration of 3 elements:
● identification of sectors at risk of carbon leakage;
● mechanisms to reduce carbon leakage risk in identified sectors, usually through free allocation of allowances or rebates under a tax; and
● emissions efficiency benchmarking to maintain environmental integrity.
Free allowances and rebates reduce available revenue and should only be used for sectors at risk of carbon leakage, otherwise auctioning or full tax compliance should be implemented. Free allowances under an ETS and rebates under a carbon tax reduce the revenues available for other policy objectives (see section 5.4.1). Support should therefore be well targeted at EITE sectors that are genuinely at risk of carbon leakage. For all other sectors, auctioning under an ETS and full compliance under a carbon tax should be implemented. Extensive use of auctioning is valuable not only for the revenue it provides but also for its role in contributing to price discovery and market liquidity (see section 5.3.4).
Allocation and rebates should focus on the industrial sector, while all other sectors including electricity generators should continue full auctioning under an ETS. The EU ETS has already transitioned the electricity sector to full auctioning and this procedure should be maintained under a linked or standalone UK ETS. Equally, electricity should not receive rebates under a carbon tax. The challenges of carbon leakage mean that the treatment of the industry sector should differ. Table 19 summarises the options for industrial allocation and rebates under the policy scenarios, which are the focus of this section.
Table 19 Options considered: Allocation and rebates
Linked UK ETS Standalone UK ETS Carbon tax
Eligibility for assistance (leakage list)
● Retain current leakage list ● Update current leakage list methodology with UK data ● Adopt multi-tier approach that considers past market performance
Indirect cost compensation
● Retain current indirect cost compensation

The Future of Carbon Pricing in the UK
85
Allocation levels/ rebate levels
● Retain current fixed-sector benchmarking ● Adopt output-based allocation
● Rebates based on current production levels
Rules for new entrants ● Retain new entrant reserve (NER) ● Remove NER if output-based allocation
adopted ● NA
Further policy tools ● Border carbon adjustment (BCA)
Benchmark setting ● Retain current benchmark levels
Source: Vivid Economics
Under a linked ETS, the UK would likely need to follow the EU ETS approach to allocation, while in other scenarios the UK could implement a more tailored approach. An immediate link would require the UK to adopt most or all of the EU’s policies on leakage prevention. Under a standalone ETS or a carbon tax, the UK could implement policies that better target leakage without over allocating allowances to sectors with lower carbon leakage risk.
Identification of sectors at risk of leakage
The UK should maintain the EU’s carbon leakage list under a linked ETS. A common leakage identification list facilitates linking in the short time period until the launch of the scheme. The downside of this approach is that some nuance for UK-specific dynamics might be missed.
The standalone UK ETS could determine leakage risk using the same approach as the EU ETS and, over the longer term, develop a multi-tier methodology. The development of a separate approach to carbon leakage identification is time- and data-intensive. A continuation of the current approach at the launch of the instrument reduces complexity and is familiar to market participants40. However, the current leakage list identifies almost all industrial emitters at risk of carbon leakage. A multi-tier approach allows for a more targeted identification, separating sectors with high trade exposure and emissions intensity from sectors with lower risk. It would draw on similar emissions intensity and trade exposure metrics, but would set tiered identification thresholds.
However, a key challenge with the UK creating an amended identification methodology is that for some sectors the number of installations or firms will be too low to facilitate publication of the methodology. The EU determines sectors at risk using EU trade data and EUTL emissions and GVA data by sector. Publication of this methodology is predicated on the need to ensure there are at least three independent operators within the EU and that there are no operators so large that confidential market information is not inadvertently released. Given the bloc’s scale, this requirement is not an issue for most EU industrial sectors. However, for smaller jurisdictions this requirement can be challenging: Oregon’s proposed cap and trade scheme contains a number of sectors which contain only one facility and thus the state enacted alternative methods to determine sectors at risk of leakage. Under a standalone UK ETS, moving to a new methodology for determining leakage risk is likely to result in similar issues, making identification of sectors at risk more challenging.
40However, the identification of carbon leakage risk with the same approach as the EU might lead to data confidentiality issues in the UK given the lower number of allowances. The UK could follow the approach of other smaller jurisdictions instead.

The Future of Carbon Pricing in the UK
86
Mechanisms to reduce carbon leakage risk in identified sectors
Free allowances or rebates to sectors identified as at risk of carbon leakage should be maintained under all three scenarios. The provision of free allowances under an ETS or rebates under a carbon tax to EITE sectors identified by the previously methodology can provide leakage protection while maintaining environmental integrity. The UK should maintain this approach irrespective of the scenario.
The UK should maintain the EU ETS’ fixed-sector benchmark approach at the launch of the UK system but may consider moving to an output-based approach to have stronger leakage prevention in future phases. Similar to the leakage risk determination, a new allocation mechanism is difficult to develop until the launch of the new system. The current allocation through fixed-sector benchmarks provides incentives to abate and a degree of leakage prevention. However, an output-based approach has stronger incentives to maintain output levels. This stronger leakage prevention becomes more important with the expected increase in carbon prices.
If a standalone ETS is eventually linked to the EU ETS, a relatively tighter cap could lead to fewer free allowances for UK emitters without further policy adjustments. If the UK adopts a tighter cap than the EU ETS and eventually links, then UK emitters could receive proportionally less allowances if both jurisdictions target the same share of free allowances. The EU uses the cross-sectoral correction factor to target a certain share (currently 43%) of free allowances. If the UK targets the same share, its emitters would receive fewer free allowances. To create a level playing field, the UK could either adjust the cross-sectoral correction factor or request an equal distribution of allowances across the linked carbon markets during the negotiations.
Under both a linked ETS and a standalone UK ETS scenario, benchmarked indirect cost compensation should be retained. This compensation mitigates the carbon cost impact on electro-intensive industry under the ETS. Maintaining the same methodology mitigates leakage risk from competition with EU firms. The benchmarks and the upper limit on compensation ensures that there is a residual indirect cost increase from the carbon price which incentivises energy efficiency. If policymakers decide to increase demand-side abatement in the electricity sector, a decrease in the upper limit for compensation can facilitate this.
In the long term, the UK could consider implementing a border carbon adjustment (BCA) to achieve a high level of leakage protection. BCAs can provide strong leakage prevention in theory, but their implementation faces multiple challenges. This is the subject of consideration from European policymakers and the new President of the European Commission recently announced an intention to introduce a ‘Carbon Border Tax to avoid carbon leakage’ (European Commission, 2019). The WTO has noted that BCAs can be compliant with adequate design (Monjon & Quirion, 2011). The estimation of carbon contents in foreign goods with multiple production steps and therefore the appropriate tax rate is more challenging. Nevertheless, the UK could consider BCAs on goods with few production processes and high carbon content to supplement its carbon leakage mitigation policy suite. Under a linked UK ETS, the UK could promote the implementation of a joint UK-EU BCA.
In addition to the risk of carbon leakage to non-EEA countries, a standalone UK ETS might as face additional competitiveness risks from EU ETS countries. These are discussed in Box 15.
Box 15 UK firms might face additional carbon leakage risk to the EU
A standalone ETS might face additional risk of carbon leakage to the EU27 for EITE sectors. Potential changes to the cap size, scope and allocation mechanism will alter the carbon leakage risk to jurisdictions outside the current EU ETS. However, the UK ETS might also face the following potential sources of carbon leakage to the EU:
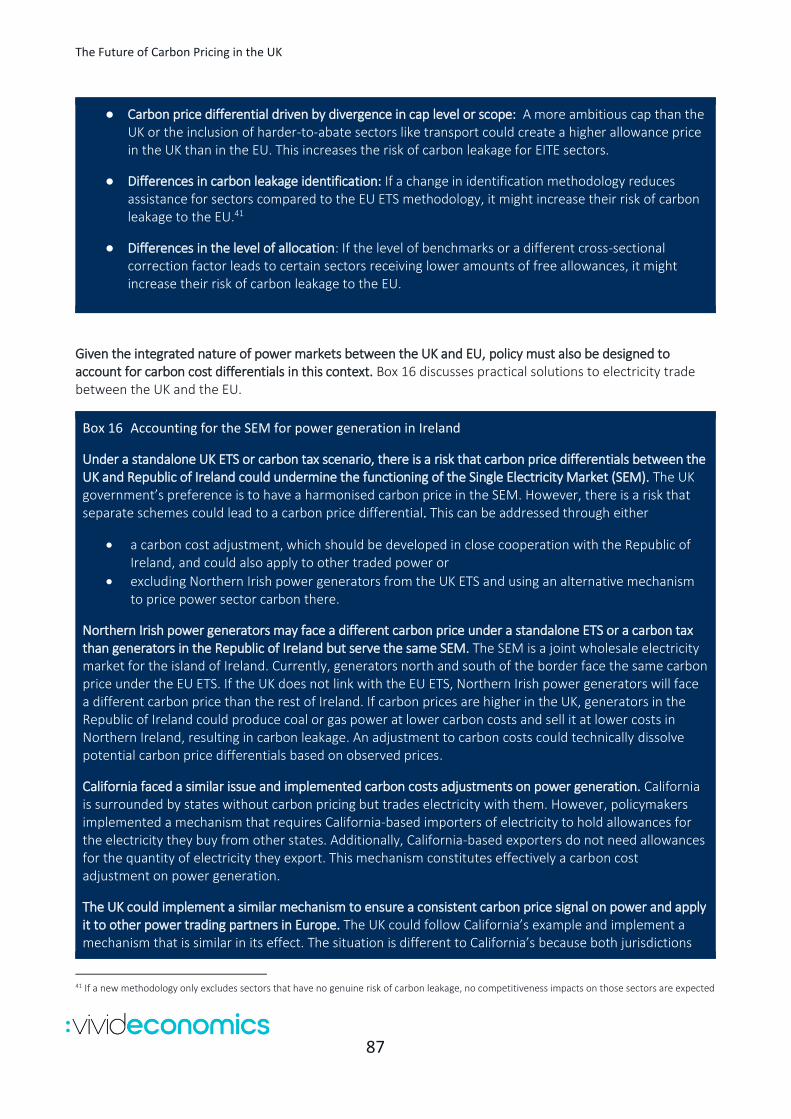
The Future of Carbon Pricing in the UK
87
● Carbon price differential driven by divergence in cap level or scope: A more ambitious cap than the UK or the inclusion of harder-to-abate sectors like transport could create a higher allowance price in the UK than in the EU. This increases the risk of carbon leakage for EITE sectors.
● Differences in carbon leakage identification: If a change in identification methodology reduces assistance for sectors compared to the EU ETS methodology, it might increase their risk of carbon leakage to the EU.41
● Differences in the level of allocation: If the level of benchmarks or a different cross-sectional correction factor leads to certain sectors receiving lower amounts of free allowances, it might increase their risk of carbon leakage to the EU.
Given the integrated nature of power markets between the UK and EU, policy must also be designed to account for carbon cost differentials in this context. Box 16 discusses practical solutions to electricity trade between the UK and the EU.
Box 16 Accounting for the SEM for power generation in Ireland
Under a standalone UK ETS or carbon tax scenario, there is a risk that carbon price differentials between the UK and Republic of Ireland could undermine the functioning of the Single Electricity Market (SEM). The UK government’s preference is to have a harmonised carbon price in the SEM. However, there is a risk that separate schemes could lead to a carbon price differential. This can be addressed through either
• a carbon cost adjustment, which should be developed in close cooperation with the Republic of Ireland, and could also apply to other traded power or
• excluding Northern Irish power generators from the UK ETS and using an alternative mechanism to price power sector carbon there.
Northern Irish power generators may face a different carbon price under a standalone ETS or a carbon tax than generators in the Republic of Ireland but serve the same SEM. The SEM is a joint wholesale electricity market for the island of Ireland. Currently, generators north and south of the border face the same carbon price under the EU ETS. If the UK does not link with the EU ETS, Northern Irish power generators will face a different carbon price than the rest of Ireland. If carbon prices are higher in the UK, generators in the Republic of Ireland could produce coal or gas power at lower carbon costs and sell it at lower costs in Northern Ireland, resulting in carbon leakage. An adjustment to carbon costs could technically dissolve potential carbon price differentials based on observed prices.
California faced a similar issue and implemented carbon costs adjustments on power generation. California is surrounded by states without carbon pricing but trades electricity with them. However, policymakers implemented a mechanism that requires California-based importers of electricity to hold allowances for the electricity they buy from other states. Additionally, California-based exporters do not need allowances for the quantity of electricity they export. This mechanism constitutes effectively a carbon cost adjustment on power generation.
The UK could implement a similar mechanism to ensure a consistent carbon price signal on power and apply it to other power trading partners in Europe. The UK could follow California’s example and implement a mechanism that is similar in its effect. The situation is different to California’s because both jurisdictions
41 If a new methodology only excludes sectors that have no genuine risk of carbon leakage, no competitiveness impacts on those sectors are expected
The Future of Carbon Pricing in the UK
88
have a carbon price. Therefore, there is no need to hold additional allowance. Instead, a carbon levy based on the price differential between UK ETS and EU ETS could be charged on imported electricity.42 This could be applied to Ireland, but also the electricity trade with France and the Netherlands.43 Carbon levies and rebates should be updated regularly to account for changing allowance prices. Any carbon cost adjustment should only be adopted after in-depth consultation with the Republic of Ireland, stakeholders on both sides of the border and the EU.
In the absence of an agreement in this area, the UK ETS could exclude Northern Irish power generators. They are already exempt from UK’s CPS to avoid a different carbon price across the border. However, in this scenario it is likely that an alternative carbon pricing mechanism linked to the EUA price will be necessary to support decarbonisation in Northern Ireland and prevent carbon leakage from the Republic of Ireland.
The UK should maintain the New Entrants Reserve (NER) after leaving the EU ETS. The NER allows for a level-playing field between incumbents and new entrants. It provides new entities with the similar level of allowances and the same abatement incentives. The UK should continue to provide allowances to new entrants based on the sector benchmarks and their current level of productions. If the UK decides to move from fixed-sector benchmarking to output-based allocation, it would no longer need the NER. A carbon tax also does not require a new entrant’s reserve, but the mechanism should mirror the incentives under a NER; emitters should receive benchmarked rebates based on their current level of production.
Emissions efficiency benchmarking of sectors
Stringent benchmarks are important to incentivise emissions intensity reductions and the UK should maintain the EU’s policy to benchmark at the level of industry’s best performers. Stringent benchmarks ensure that only the least emissions-intense firms within a subsector receive all allowances for free. It promotes reductions in emissions intensity. This effect is amplified under output-based allocation. For example, if the UK adopts a net zero-compatible cap and the EU maintains its current cap trajectory, UK might be at additional risk of carbon leakage. The UK could adjust their measure of trade exposure by discounting a sector’s EU trade completely or partly. There is no precedent for a carbon leakage metric adjusted for covered jurisdictions yet, but this will become more relevant in the future as more jurisdictions implement carbon pricing. The UK should maintain the EU’s policy to set the benchmark at the top 10% of installations in a given subsector.
However, the UK may face challenges if creating its own benchmarks given confidentiality issues with data on emissions and production. The small number of facilities or installations in many EITE sectors may result in an inability to create sector benchmarks as it would reveal market information. A possible resolution is to adopt EU benchmarks in a standalone scheme, although this would lose some of the advantages offered in this scenario.
42 Simultaneously, UK power exporters could theoretically receive a carbon rebate on the price differential for export. However, this might be considered illegal under WTO rules. 43 The electricity markets of Great Britain and mainland Europe are connected, but it is not an integrated electricity market as on the island of Ireland. Sales across the Channel have to be agreed on in advance and mainland Europe exporters have to pay the CPS for imports to the UK.

The Future of Carbon Pricing in the UK
89
Table 20 Recommendation: Allocations and rebates
Linked UK ETS Standalone UK ETS Carbon tax
Eligibility for assistance (leakage list)
● Maintain current approaches under the EU ETS
● Maintain current approaches under the EU ETS for the start of the instrument.
● In long term, consider adjusting eligibility to differentiate by leakage risk and previous cost pass through capacity.
Allocation / leakage prevention mechanism
● Maintain current fixed sector benchmarking as under the EU ETS
● Maintain current approaches under the EU ETS from 2021. In the long term, consider moving to output based allocation.
● Mirror the effect of the current cross-sectoral correction factor but revisit in case of ETS linking with the EU.
● Rebates based on relative emissions performance
Indirect cost compensation
● Maintain the current approach to provide indirect cost compensation for electro-intensive industries
Rules for new entrant
● Maintain the current approaches under the EU ETS
● Maintain current approaches under the EU ETS. If the UK adopts output-based allocation the NER is not needed.
● Provide rebates based on current production levels
Further policy tools
● Promote joint implementation of UK-EU BCAs on a small number of emissions intensive goods
● Consider BCA on a small number of emissions intensive goods
● Consider BCA on UK-EU electricity trade.
Benchmark setting
● Maintain current EU ETS benchmarks, that calibrates assistance to the top 10% most efficient EU facilities in each subsector
Source: Vivid Economics
5.3.2 Supply adjustment mechanisms (SAMs)
Recent years have demonstrated that carbon markets can be vulnerable to shocks, as the UK considers the design of its future carbon price it must ensure it is robust to unexpected events. Carbon markets deal with abstract commodities with regulatory determined supply curves, which make them vulnerable to shocks. Forecasting emissions trajectories given unexpected changes in demand and supply circumstances is a central challenge for designing carbon markets (Lina & Ackva, 2018). For instance, the economic slow-down following the global financial crisis drove down demand for allowances and carbon prices around the world. The fixed emissions caps of ETS with SAMs mean that allowance supply is perfectly inelastic, and shocks get fully transmitted into changes in prices. This can lead to significant price volatility that can reduce low-carbon investment and have other negative economic, political, and social impacts.

The Future of Carbon Pricing in the UK
90
SAMs help improve the resilience of ETSs to shocks by making allowance supply responsive to market outcomes. SAMs fall into two broad categories:
● Quantity-based instruments are allowance supply interventions triggered by allowance surplus thresholds; and
● Price-based instruments are allowance supply interventions triggered by allowance price thresholds.
We identify the range of feasible options for developing a SAM, the UK’s future carbon pricing instrument in Table 21. The option space across the five key elements of SAMs varies significantly across future UK carbon pricing scenarios. A carbon tax does not allow for any equivalent adjustment mechanisms as it explicitly sets price levels.44 While in an EU-linked system, the option space for the UK is essentially limited to adopting or closely coordinating with the EU ETS’s mechanisms. However, a standalone ETS allows for a wider option space and there could be significant benefit in developing a mechanism uniquely suited to the UK’s context and ETS objectives.
Table 21 Options considered: SAMs
Linked UK ETS Standalone UK ETS Carbon tax
Mechanism intervention
● Adopt or coordinate with measures in the EU ETS
● Adjustment at auction
NA
Mechanism trigger ● Price ● Quantity
Trigger levels ● Calibrated with net zero target ● Calibrated considering other criteria
(revenues, competitiveness, cost)
Bounds of intervention ● Bound (soft) ● Unbound (hard) ● Volume of bound interventions
Impact on cap ● Permanent ● Temporary
Source: Vivid Economics
Under linking, any independent UK supply-intervention will be ineffective, as it will be dominated by the impact of the MSR on the linked system. An independent UK SAM does not necessarily pose an insurmountable barrier to linking with an ETS with a quantity-based mechanism such as the MSR. However, given the significant disparities in market size between the EU ETS and the UK ETS, the SAM of the EU ETS would effectively propagate across the entire linked system under any full-linking arrangement. Any independent mechanism (price- or quantity-based) existing solely in the UK ETS would become ineffective.45
An immediately linked UK ETS will have to adopt or closely coordinate with the EU ETS’s MSR to account for the aggregate allowance surplus across the two linked jurisdictions, to ensure predictability and avoid potential gaming. With full linking, allowances become perfect substitutes for compliance entities, which means that the use and banking of allowances from each system is somewhat arbitrary and hence so is the evolution allowances surpluses. For instance, a surplus of 1,000 million allowances could be composed of 900 million EU allowances and 100 million UK allowances, or 800 million EU allowances and 200 million UK allowances.
44 While a carbon tax could set variable tax rates that allow for responsive adjustments, this is discussed in Section 4.2.2 45 The UK’s CPS imposes top-up prices on prevailing linked EU allowance prices. While price top-ups retain their price buffer under a linked scenario, they have little impact on providing increased price predictability or market stability, as the underlying EU allowances price is still dominated by the overarching SAM of the larger ETS.

The Future of Carbon Pricing in the UK
91
Given the thresholds of the EU MSR, this in turn would have large subsequent impacts on allowance supply across the joint system. A joint EU-UK MSR could be implemented at thresholds like the current regulation given that it already takes the UK’s participation into account. If these measures are not coordinated, gaming could occur whereby firms make a strategic choice regarding which type of allowance to bank in order to affect the operation of the MSR and supply and demand balance of the market.
A linked UK ETS would also require coordination with the EU ETS’s Cost Containment Mechanism (CCM). This price-based mechanism can be triggered if EU ETS allowance prices rise to more than three times the average price during the two preceding years for more than six consecutive months, provided this price change does not relate to changing market fundamentals. The mechanism allows for one of three interventions to be implemented upon being trigged: i) bring forward allowances from future auctions; ii) auction up to 25% of remaining New Entrant Reserve (NER) allowances; or iii) auction allowances from a dedicated CCM reserve. A mirrored link UK ETS should adopt equivalent design features to ensure the efficient operation of markets.
Under a standalone UK ETS, the UK could consider developing its own MSR with proportional thresholds and aim to merge it with the EU MSR upon linking. This aligns with the BEIS proposal to develop a version of the MSR adapted for the UK context, by proportionately reducing thresholds to account for the UK’s smaller market size. However, implementing a standalone quantity-based measure could not be immediately implemented. Quantity-based mechanisms are triggered by the total number of surplus allowances in the previous year and no surplus would exist at the start of the UK ETS. As such, this approach would likely require supplementary market stability measures on the introduction of the UK ETS.
A standalone UK ETS might be better served by developing a simple price-based SAM to guide prices and expectations into a predictable price range. The EU MSR is a product of the EU ETS’s history, and as such it addresses the issues of longstanding oversupply of allowances and takes the power sector’s hedging requirements as a reference for the MSR thresholds. In contrast, the UK ETS will start without past oversupply and with a rapidly decarbonising power sector. Price-based SAMs aim to limit market prices fluctuations and keep price expectations within a predictable range, which helps support investment decisions and generate stakeholder buy-in.46 Price-based measures also have the benefit of being significantly more transparent and easy for market participants to understand relative to a quantity-based measure, such as the MSR.
The standalone UK ETS scenario provides an opportunity to develop a new price-based SAM for the UK similar to the soft price collars implemented internationally. Both the California-Quebec ETS and the Regional Greenhouse Gas Initiative (RGGI) impose a soft price collar. This is implemented through an auction reserve price which acts as a (soft) price floor and the release of fixed volumes of allowance reserves upon prices breaching high thresholds, which acts as a (soft) price ceiling. In the case of California, this price ceiling has three tiers of upper price thresholds and corresponding allowance reserves that are intended to act as ‘speed bumps’ for unexpected price increases.
The trigger levels of a price-based SAM could be set by considering a combination of current prices, UK ambition, and CPLC estimates of carbon prices aligned with Paris goals.EU allowance prices have been rising over 2018-19 and are currently around £25/tCO2e, with 2021 EUA futures prices reaching just over £26/tCO2e. Combining the UK’s CPS support, means that electricity generators face a total carbon price of around £43-44/tCO2e between now and 2021. In 2016, the US Interagency Working Group on Social Cost of Greenhouse Gases estimated that under their central scenario, the Social Cost of Carbon was about US$42/tCO2 in 2007 US$, equivalent to about £40.5/tCO2 in 2021. To achieve the Paris climate target, the High-Level Commission on Carbon Prices has estimated that explicit carbon prices must reach around
46 However, this price limitation still retains some flexibility due to the fixed volume of allowance reserves. This entails that in extraordinary circumstances, prices can still extend beyond the soft price collar and this ensures that extreme cases do not result in unintended fiscal or environmental outcomes.

The Future of Carbon Pricing in the UK
92
£30-60/tCO2 by 2020 and £38-75/tCO2 by 2030, in addition to the required supplementary policies (CPLC, 2017). Carbon prices around the world will need to converge to this range over time, if they are to have a significant role in supporting the mitigation required. A price-based SAM in the UK could be set to reflect the current carbon price trajectory range and price range required to achieve Paris ambition.
Figure 18 shows the recommended starting points for a price-corridor for a UK ETS using a price-based SAM against several comparators.
Figure 18 The potential UK ETS soft price corridor could align with carbon price trajectories
Notes: Currency conversions to GBP using OFX annual exchange rates. Social cost of Carbon from the US Interagency Working Group on Social Cost of Greenhouse Gases, carbon price trajectory aligned with Paris from CPLC (2017)
Source: Vivid Economics and EUA futures prices extrapolated from point estimates of futures prices for December 2019, 2020, and 2021 taken from ICE market data on July 25th 2019 10:16 GMT
An initially tight price corridor can help maintain abatement incentives in the presence of uncertain BAU emissions, while fostering market confidence. Maintaining a price floor at, or above, current levels would ensure that a standalone scenario would not result in a reduction in the price signal that could potentially lead to a rebound in coal-fired electricity generation (Moore, 2018). Further, setting a relatively tight price corridor in early years of ETS operation could help generate confidence in the market and help reduce the price impact of a wide uncertainty range in modelled BAU emissions trajectories. A standalone UK ETS aiming to achieve net zero emissions by 2050 would also need to account for significant hedging demand as the power sector accumulates hedging positions in the early 2020s. To accommodate for this, it will be important to have an upper price ceiling cost containment reserve with a large volume of allowances available in the early 2020s to ensure market stability, however this number could decline from 2025 onward. Any allowances injected from the containment reserve should be sourced from the cap in later years, ensuring their use reflects only a temporary supply adjustment.

The Future of Carbon Pricing in the UK
93
A price-based SAM in a standalone UK ETS system could be designed to ensure the net zero target is achieved no later than 2050. Jurisdictions often determine price trigger levels and allowance reserve volumes through stakeholder engagement. However, a standalone ETS would provide the UK with an opportunity to implement a SAM based on detailed modelling and a flexible design. The same modelling that will help determine ETS caps could ensure that price triggers reflect the price corridor required over time to reach net zero, considering uncertainty around marginal abatement cost curves in covered UK sectors.47 Allowances removed/injected could be calibrated such that in the event of lower than expected short run prices effective caps are tightened so that net zero targets are reached earlier, but in the event of higher than expected short run prices the net zero target date does not shift beyond 2050. This would require that when the auction price floor binds, allowances are first temporarily held from the market and then if a certain number of consecutive auctions fail to clear at allowance prices above the price floor then held allowances begin to be permanently removed.48
However, compatibility with the MSR and shared underlying market motivations are key aspects requiring alignment when considering the future linking with the EU ETS. Other areas of ETS design are more flexible and a divergence from EU ETS can be maintained more easily. However, as discussed above, any future link would likely have to be accompanied with the dropping of any independent UK SAM. Policymakers should be aware of this trade-off when designing SAMs and intending a link with the EU ETS. However, other forms of linking to the EU ETS, such as quantity-restricted linking, could also be investigated to limit the influence of size disparities and retain a degree of domestic control on allowance prices.
Recommendations for SAMs are summarised by scenario in Table 22 below.
Table 22 Recommendations: SAMs
Linked UK ETS Standalone UK ETS Carbon tax
Mechanism Intervention
● Implement coordinated EU-UK MSR
● Introduce a soft price collar using an auction reserve price to maintain the overall carbon price signal and a cost containment reserve to guard against price spikes
N/A
Mechanism Trigger
● Price-based SAM to facilitate a predictable price corridor
Trigger levels
● Determined through modelling consistent with uncertainty surrounding abatement costs
Bounds of intervention
● Auction reserve price (hard floor in auctions) ● Cost containment reserve (soft ceiling)
Impact on cap
● A combination of permanent removals and temporary injections to support the achievement net zero no later than 2050
● Allowances withheld from auction are initially temporarily removed but become permanently removed if prices remain consistently at the floor level
47Alternatively, the auction price floor could be dynamically set at the level of prevailing EU ETS prices to ensure minimal potential carbon leakage to the EU under a standalone system. 48 This aligns with the BEIS consultation proposition for unsold allowances at auctions to be spread over the subsequent four scheduled auctions, but not redistributed more than four auctions out. Similarly, BEIS suggests that no single auction should have more than 125% of its originally intended volume, with excess allowances entered into a reserve.

The Future of Carbon Pricing in the UK
94
● Allowances injected in the event of high prices are sourced from later compliance years
Source: Vivid Economics
5.3.3 Temporal flexibility
At present the EU allows unlimited banking and limited borrowing of allowances. Unlimited banking is allowed between years and phases, while borrowing is limited to the use current allowance allocations for past emissions liabilities.
The UK ETS should adopt these rules regardless of choice of ETS design scenario. The option to bank unlimited allowances facilitates price stability between compliance years and ETS phases. This certainty is key to providing a stable price signal for low-carbon investments and has been proven successful in the EU ETS and other jurisdictions. Limited borrowing allows some temporal flexibility without compromising early abatement. For a linked UK ETS, alignment of banking and borrowing rules with the EU will simplify linking. A linked system propagates the less stringent banking and borrowing design features across the combined market, effectively making banking restrictions redundant in the more stringent jurisdiction, particularly if linking with a larger partner. There is also no compelling reason to change rules under a standalone UK ETS as unlimited banking provisions allow firms to respond efficiently to UK-specific shocks, while more severe shocks are addressed by the market’s SAM.
Table 23 Recommendations: Temporal flexibility
Linked UK ETS Standalone UK ETS Carbon tax
Temporal flexibility
● Continue the approach under the EU ETS of unlimited banking and limited borrowing.
NA
Source: Vivid Economics
5.3.4 Secondary market development and auctions
The efficient functioning of secondary markets is crucial to the effective operation of any UK ETS. Section 3.4.4 discussed the negative effects on market functioning that arise if secondary markets are insufficiently liquid. In cases of low secondary market liquidity, a well-designed primary market becomes essential to deliver a market with sufficient allowance supply and efficient price discovery.
Several design aspects regarding both auctions and secondary markets can influence market functioning and liquidity for a given market size. Section 5.2.1 discusses the role of coverage in enhancing liquidity, but additional considerations include the breadth of market participants, the design and frequency of auctions, and the use of consignment auctions.
Table 24 sets out these design options across UK carbon pricing scenarios for ETS.
Table 24 Options considered: Secondary market development and auctions
Recommendations Linked UK ETS Standalone UK ETS Carbon tax
Participation restrictions
● Continue with broad secondary market participation ● Restrict market participation
NA

The Future of Carbon Pricing in the UK
95
Auction design ● Continue EU ETS approach ● Update auction design and frequency
Products offered ● Continue EU ETS approach ● Future vintage auctions
Consignment auctions
● No consignment auctions ● Consignment auctions
Source: Vivid Economics
In general, broad market participation, in both auctions and secondary markets, helps promote sufficient market liquidity and access to allowances for compliance entities. The EU ETS currently allows broad market participation, allowing virtually universal access to third parties and financial institutions. Trading takes place through over-the-counter (OTC) trade, exchange-based trade, and auctions, with the volume of exchange-based-trading increasing over time and now dominating trade. The UK’s auction platform is provided through the Intercontinental Exchange (ICE), one of only two active EU allowance exchanges. The BEIS consultation on the Future of UK Carbon Pricing suggests the continued use of this auction platform and maintaining rules allowing wide secondary market access (subject to certain application checks and eligibility criteria) under a standalone ETS. This open market access is appropriate as restrictions on participation in other markets have contributed to lower liquidity on exchanges, for instance as has occurred in the Korean ETS as discussed in Section 3.4.4.
Auction design influences market functioning and the current EU ETS approach could be continued under both ETS scenarios, however changed auction rules may be appropriate if liquidity problems manifest under a standalone UK ETS. Currently, UK auctions operate as single round, uniform-price sealed bid auctions. Participants submit private bids containing their desired volume of allowances and price they are willing to pay, with allowances allocated in order of highest to lowest price bids until no more allowances remain. The clearing price is the bid price associated with the last sold allowance, and all bidders pay this price regardless of their initial bid price. This method has the benefit of incentivising efficient price discovery as private bids incentivise bidders to post their privately held highest willingness to pay for allowances. This design is also relatively simple and transparent compared to other auction design options and bid limits ensure limited potential for large participants to disproportionately influence auction outcomes. However, if liquidity or excessive volatility becomes a challenge, alternative auction designs could be investigated, such as the use of multi-round clock auctions, whereby the allowance price either ascends or descends over multiple rounds until demand levels equate with auction supply and the auction clears. These clock auctions provide additional information to market participants regarding market demand which can assist in reaching an efficient price in the absence of a clear secondary market signal.
Auction frequency also influences market outcomes; however, the current UK auction timetable is likely sufficient for both ETS scenarios. Auctions should be frequent enough to ensure that the allowance market is sufficiently liquid, but not too frequent as to compromise auction participation rates and impose large administrative burden. Currently UK auctions take place fortnightly and distribute annual allowances over the course of the year, with lower allocations for summer months when demand is low. However, the exact number of allowances auctioned is determined in advance by the auctioneer; flexibility that will likely be important under a standalone UK ETS. This is particularly the case as UK entities currently may also purchase allowances from other EU auction platforms, which would not be possible in a standalone scenario. Increased frequency of auctions could therefore be investigated under a standalone ETS if markets actualise with lower than expected liquidity or excessive volatility.
Allowing a diversity of products as under the current EU ETS, can help improve market functioning. The EU ETS currently allows spot products (immediate trade of allowances), and derivative products for risk

The Future of Carbon Pricing in the UK
96
management such as futures, forwards and options. These products allow entities to hedge their risks into the future and encourage increased market participation and depth. Allowing these products is appropriate in both a linked UK ETS and standalone UK ETS scenario. Under a standalone UK ETS scenario however, supporting provision of longer tenure derivate products could support market stability. In the absence of a liquid forward market the government could consider introducing allowance vintages and offering auctions of future vintage allowances to provide a form of forward market. As these auctions are still infrequent, this is still likely to be insufficient for frequent traders such as electricity generators that alter their hedging position many times daily.
A final option for enhancing liquidity under a standalone UK ETS could be to introduce consignment auctions if low market liquidity arises. In a smaller carbon market, high levels of free allocation could result in thin markets. In this case, consignment auctions could be introduced whereby entities receiving free allowances are required to submit them to auction and then are reimbursed based on the auction clearing price. These auctions can be a useful mechanism to stimulate trade (Burtraw & McCormack, 2017), and have been used to kick start SO2 markets in the US, as discussed in Section 3.4.4.
Recommendations for secondary market development and auctions are summarised in Table 25 below.
Table 25 Recommendations: Secondary market development and auctions
Recommendations Linked UK ETS Standalone UK ETS Carbon tax
Participation restrictions
● Continue broad secondary market participation
NA
Auction design ● Continue EU
ETS approach
● Continue with UK auction design and frequency as under EU ETS
● In event of low liquidity, evaluate new auction designs and frequency
Products offered ● Continue EU
ETS approach
● Continue EU ETS approach ● In absence of liquid forward markets,
evaluate introducing future vintage auctions
Consignment auctions
● No consignment auctions
● No consignment auctions ● In event of low liquidity, evaluate
introduction of consignment auctions
Source: Vivid Economics
5.4 Effective governance
5.4.1 Use of revenue
The use of carbon revenue is ultimately a political decision, however there is a case that in order to build public support for carbon pricing carbon revenue should be used to support emissions reductions or address social costs related to the policy.
At present, the UK’s use of revenues from carbon pricing is predominantly split between support for competitiveness, climate related projects and general government revenues. Under the EU ETS a large share of potential revenue is foregone through free allocations to industry, while the EU ETS directive stipulates that at least 50% of revenue collected by member states should be spent on climate-related projects, with most member states, including the UK devoting far more than the suggested minimum(European

The Future of Carbon Pricing in the UK
97
Commission, 2017). The EU also sets aside funds to support innovation in low-carbon technologies in energy intensive industries and to support new emissions intensive entrants to the emissions trading system. The introduction of the CCL was accompanied with a reduction in national insurance contributions, however, some of the potential revenues from the CCL is foregone through discounts to energy intensive industry and the CCL revenue is exceeded by the costs of the reduction in national insurance contributions. The revenue from the CPS is directed to general government revenue.
The use of carbon revenues should be consistent with policy intent, and clearly communicate the potential benefits of carbon pricing as part of a broader policy package. As discussed in section 3.5.1 using carbon revenues to achieve climate objectives can increase the popularity of the policy. It is likely that the use of revenues to build stakeholder support will be especially important as carbon prices rise as needed to achieve the UK’s net zero emissions target.
Potential options for the use of revenue are set out in Table 26.
Table 26 Options considered: Use of revenues
Linked UK ETS Standalone UK ETS Carbon tax
Use of revenue
● Maintain current channelling of revenue, predominantly to competitiveness, climate related projects and general budget revenues.
● Adopt an alternative split of revenue between uses including general budget, climate related projects, competitiveness, support for households and effected groups and fiscal reform.
Source: Vivid Economics
Under all policy scenarios there are opportunities to better align the UK’s use of carbon revenues with the government’s recently adopted net zero 2050 goal. Splitting revenue uses in multiple ways can broaden both the policy impact and public support for the carbon pricing instrument. Most jurisdictions will use carbon revenue to support multiple policy objectives. This allows revenue uses to be balanced across stakeholders and projects. For example, carbon revenue could be used to help address competitiveness concerns, fund projects to reduce emissions and mitigate cost impacts on households. This signals that public preferences have been considered and potential impacts across multiple groups accounted for.
While transferring revenue to the general budget is common, this can risk undermining the popularity of carbon pricing if benefits are not clearly communicated. The costs of carbon pricing under an ETS or carbon tax are very visible to the public, either in form of the tax rate or the allowance price. The use of revenue is a strategic opportunity to emphasise the benefits of a climate policy package. Channelling revenues to the general budget rather than specific uses ultimately means that the benefits derived from carbon revenue are not visible to the public.
Part of the revenue should continue to be foregone to provide free allowances to EITE industries in line with recommendations on allocations and rebates in section 5.3.1. As discussed above, the mitigation of carbon leakage risk increases in importance in the UK carbon pricing instrument and over time. However, these free allocations reduce the carbon revenue available for other policy objectives. Maintaining appropriate benchmarks and a well targeted leakage determination methodology will increase the revenue available while effectively protecting the EITE sectors at risk.
As discussed in section 5.2.4, supplementary policies and programs will be required to support efficient mitigation which should be a priority use of revenues. The UK already uses parts of the EU ETS revenue for climate-related project to facilitate the low-carbon transition. To achieve the UK’s net zero 2050 target, carbon revenues may be used to support the development and deployment of GGR technologies at scale.

The Future of Carbon Pricing in the UK
98
With remaining revenue, the UK should consider providing support to households, address transition impacts, finance public goods and/or reduce distortionary taxes.
● Households will increasingly notice the impact of carbon pricing, on their energy bills and at the purchases of goods and services. An extension in scope to other sectors like heating or transport may increase this impact. The UK could directly transfer part of the revenue to households to offset the impact of price increases. This should build on the existing tax and transfer system to minimise administrative costs. If the government uses transfers to support households, it may consider doing this in the form of an equal per capita ‘dividend’, or as targeted means-tested transfers as discussed in section 3.5.1.
● The low carbon transition brings economic opportunities but also costs for some groups. Carbon revenues can be used to reduce these impacts and provide new economic opportunities to effected communities.
● An alternative could be to hypothecate these revenues to finance key public goods. For instance, to make the benefits of carbon pricing more tangible a share of revenues could be hypothecated to the NHS, which has substantial funding requirements, and enjoys broad public support.
● Finally, the government may decide to use carbon revenues to support economic growth by removing distortionary taxes. In this case it should target these tax cuts in a manner that also compensates for some of the costs of carbon prices and take steps to ensure that the funding of these tax cuts is made clearly visible to the beneficiaries of this policy.
Table 27 Recommendations: Use of revenue
Linked UK ETS Standalone UK ETS Carbon tax
Use of revenue
● Maintain the current system of allowance allocation (as discussed in section 5.3.1)
● Continue funding climate-related projects with a focus on GGRs (as discussed in section 5.2.4)
● Prioritise spending to address competitiveness (see section 5.3.1) and supplementary policies needed to mobilise GGRs (see section 5.2.4)
● Remaining revenues can provide support for households, address transition impacts, reduce distortionary taxes or fund other public goods
● The uses of carbon revenues should be clearly communicated
Source: Vivid Economics
5.4.2 Evaluation and review
Launching its own carbon pricing instrument will require the UK to establish its processes for reviewing policy design and implementing timely changes.
Major policy changes under an ETS are often implemented between phases, with the EU ETS adopting this approach. This creates a degree of predictability for market participants regarding the review and alteration of policy rules. A longer phase may deliver more political certainty for market participants with a shorter phase allowing for more frequent reviews and policy adjustment.
To ensure that policy changes are based on solid evidence, regular evaluation and review is crucial. This can be used to assess a range of issues such as the performance of certain aspects of a policy, impacts on stakeholders, or provide a high-level assessment of the climate policy architecture.
Options for ETS phases and for evaluation and review are outlined in Table 28 below.

The Future of Carbon Pricing in the UK
99
Table 28 Options considered: Evaluation and review
Linked UK ETS Standalone UK ETS Carbon tax
Phases ● Align with current EU ETS phases with the first phase
from 2021 to 2030 ● Implement shorter phases aligned with carbon budgets
N/A
Evaluation and review
● Mirror the EU’s evaluation and review process. ● Allow for expanded or additional independent evaluations.
Source: Vivid Economics
The EU ETS has had phases of expanding length. Phase I of the ETS ran for three years, Phase II for five years, Phase III for eight years and Phase IV will operate for ten years. These phases have allowed for policy experimentation and development while providing greater levels of policy predictability over time.
The phase of a linked UK ETS would need to mirror that of the EU ETS, with the EU ETS Phase IV operating from 2021-30. Under an immediate link the UK ETS, changes to policy parameters such as rates of cap decline, changes in scope, and operation of SAMs would occur at the same time as in the EU ETS. Phase IV of the EU ETS will last for ten years, implying that policy parameters are largely set for that decade.
Under a standalone UK ETS shorter phases and more regular reviews could be adopted that align with the UK’s carbon budgets. Jurisdictions using ETS phases, generally try to avoid substantial changes to policy during a phase. For a new ETS like the UK ETS, shorter phases and frequent reviews may be appropriate. Price development, abatement and liquidity may not materialise as expected and policy changes may be required in the years following the UK ETS’s launch. Further, aligning UK ETS phases with the UK’s Carbon Budgets allows coordination between covered and uncovered sectors to facilitate economy-wide abatement.
A standalone UK ETS could operate in 5-year phases with a shorter initial phase to allow an early review:
● Phase I: 2021-2022
● Phase II: 2023-2027 (period of the 4th Carbon Budget)
● Phase III: 2028-2032 (period of the 5th Carbon Budget)
● Continuation in 5-year phases
Under a carbon tax, defined phases are less important but frequent evaluation remains critical. If the UK implements a carbon tax, it should be frequently evaluated and its impact on abatement. Under a carbon tax it can be difficult to meet quantity-based emissions targets as mitigation is a function of parameters that are difficult to predict, such as fuel prices and technological development. While a UK ETS would include SAMs to help reduce uncertainty in the price and quantity of emissions, a carbon tax cannot include equivalent mechanisms. As such, the carbon tax trajectory should be assessed through regular independent reviews to take account of the latest information regarding mitigation costs and emissions levels. Because a carbon tax does not involve intertemporal trading, defined phases are less important. However, policymakers need to find a balanced approach between frequent review and predictable policy changes.

The Future of Carbon Pricing in the UK
100
The European Commission performs regular reviews of the EU ETS, such as on market functioning, competitiveness, aviation or the MSR. A standalone ETS or a carbon tax will require the UK to fill this gap with its own reviews. Under a linked UK ETS, the UK would benefit from some of the Commission’s work but there is still the need to ensure that the UK ETS works given the UK’s emission reduction objectives and context. Frequent evaluations, especially from independent bodies, are important to ensure the carbon pricing instrument is efficient and effective. The importance of evaluations increases at the launch of instrument as uncertainties regarding performance are high.
The carbon pricing instrument should be evaluated independently as part of the broader climate policy suite. The Government (particularly BEIS and HM Treasury) will play an important role in developing future carbon pricing policy. Nevertheless, independent reviews play an important role in assessing the effectiveness of policies and identifying opportunities for improvement as discussed in Section 3.5.2. The CCC will continue to play an important role in evaluating the UK’s progress to meeting its legislated carbon budgets and long-term targets. However, under all scenarios there is a case for additional reviews regarding the design and operation of carbon pricing. Review processes should include consultation with a wide range of stakeholders, including industry representatives, NGOs and consumer representatives.
In addition to the CCC’s current review roles, future reviews by the CCC or another independent institution of market functioning under all scenarios should include consideration of:
● Impacts on competitiveness: Ex-post evidence on cost-pass through and carbon leakage
● Offset policy design: considering the design and operation of the offset system, and with a focus on environmental integrity concerns, for instance regarding additionality and permanence
● Use of revenues: including Identification and evaluation of revenue uses
In addition, under a standalone UK ETS secondary market development should be reviewed. This would include market liquidity, stability and efficiency and should be completed soon at the end of the first phase.
The Government’s suggested schedule of reviews for a standalone UK ETS is appropriate for all scenarios. BEIS’s consultation on the Future of UK Carbon Pricing proposed an initial review in 2023, another between 2024 and 2027, and a review in 2028 in line with the global stocktake within the Paris Agreement. This is an appropriate frequency and timing under a linked UK ETS preparing for movement to Phase V of the EU ETS in 2030. Similarly, under a standalone UK ETS or carbon tax these reviews allow for regular assessments of policy efficacy and consideration of progress against carbon budgets. However, further reviews under a standalone UK ETS or carbon tax may be appropriate depending on how the system develops.
Table 29 Recommendations: Evaluation and review
Linked UK ETS Standalone UK ETS Carbon tax
Phases ● Align UK ETS and
EU ETS phases
● Adopt an initial two-year phase followed by five-year phases aligned with carbon budgets.
● NA
Evaluation and review
● Complement CCC’s current reviews with independent reviews of the impact of policies on competitiveness and secondary market development (if relevant), assessment of design and operation of offsets systems, and the use of revenues.
Source: Vivid Economics

The Future of Carbon Pricing in the UK
101
5.4.3 Devolved administrations
Under all policy scenarios, the design of carbon pricing will have to consider the feasibility of implementation with devolved administrations. As discussed in Section 3.5.3, climate and environmental policy in the UK is primarily devolved. While the UK government retains tools to drive emission reductions, it often depends on obtaining the consent from devolved administrations to implement some of the UK-wide policies, such as the EU ETS. Key areas to consider include the enforcement of MRV, emissions targets set by devolved administrations, regional economic impacts and further political concerns.
Relevant agencies which currently undertake MRV should broadly continue with their existing functions. This avoids the administrative burden associated with transferring responsibilities from one agency to another. This would imply having the following agencies responsible for MRV, regardless of the policy scenario:
1) Environment Agency (for England) 2) Scottish Environment Protection Agency 3) Natural Resources Wales 4) Northern Ireland Environment Agency 5) Offshore Petroleum Regulator for Environment and Decommissioning (for offshore activity)
Supplementary policy measures beyond carbon pricing are required to deliver on separate emissions targets legislated by devolved administrations. It is a non-trivial task to reach emissions targets of devolved administrations by relying on an ETS (with national cap) or a UK-wide carbon tax, because price incentives that are suitable for the emission targets of one nation might not be adequate in another nation. Additional policy instruments available under the devolved competence should be adjusted in response to the ambition level and economic structure of each region. These measures also have the potential to target sectors not directly covered by carbon pricing. Examples include project-based incentives for afforestation and peatland restoration, and financial support for CCS storage and transport infrastructure.
Altering arrangements on scope and free allocation (or rebates, in the case of a carbon tax) will have distributional impacts affecting devolved administrations. Carbon price scope and allocations affect the distribution of carbon price impacts and may lead to redistribution between nations; further analysis would be required to identify the potential scale and directions of these impacts.
Devolved administrations have noted their opposition to a UK carbon tax. As noted by the Scottish and Welsh governments in 2018, a national carbon tax would replace a devolved mechanism collectively agreed by all four administrations.49 By contrast, the use of an ETS (be it linked to the EU ETS or standalone) can be accommodated in a similar structure to the manner in which the EU ETS was agreed and implemented by devolved administrations.
Table 30 Recommendations: Devolved administrations
Linked UK ETS Standalone UK ETS Carbon tax
Devolved administrations
● Continue EUETS arrangements on the implementation of MRV ● Use supplementary policies to reduce emissions in line with DA’s targets ● Consider distributional impacts of changes to policy design
Source: Vivid Economics
49https://www.climatechangenews.com/2018/10/15/unacceptable-scotland-wales-reject-post-brexit-carbon-tax-plan/

The Future of Carbon Pricing in the UK
102
5.5 Summary of advantages and disadvantages
The work provides an overview of most salient advantages and disadvantages for each scenario from the perspective of the UK as well as specific trade-offs across four overarching design areas related to:
● Facilitating future carbon market cooperation through linking;
● Determining carbon pricing’s role within the climate policy mix;
● Supporting well-functioning markets; and
● Ensuring effective governance
While political developments regarding Brexit may constrain choices, a UK ETS linked to the EU ETS remains the best solution if the UK leaves the EU with a negotiated deal. That option will maintain predictable climate policy during the Brexit transition in addition to access to an established and efficient EU carbon market. Given the timeline this scenario entails keeps design changes to a minimum. This scenario implies reduced design flexibility and largely unchanged provisions regarding scope, cap setting, free allocations and other market design features, such as SAMs (which should be coordinated with the EU ETS’s MSR). Supplementary policies play a significant role here to address non-price barriers and mobilise GGRs to reach domestic Net Zero targets. This scenario could also retain the CCL and CPS to maintain appropriate price incentives for covered sectors. Administrative costs are lower than under a standalone UK ETS.
There is a range of advantages and disadvantages of a linked UK ETS across the four overarching design areas:
● facilitating linking. The linked UK ETS must be designed with allowance registries compatible with the EU and additional processes in place in the short term to ensure effective cooperation between UK and EU regulators. Clear procedures must be developed to guide process in the event of de-linking.
● determining carbon pricing’s role within the climate policy mix. A linked UK ETS would need to mirror most EU ETS rules. Achieving a domestic net zero target could be achieved by aligning the UK’s cap with net zero trajectories from 2030 onwards. However, this scenario requires more heavy-lifting from supplementary policies, such as additional pricing instruments in covered and uncovered sectors. There is also an opportunity to introduce an offset mechanism with compliance obligations in the transport sector. However, achieving domestic net zero may be difficult if comparable ambition from the EU is not present, and would require supplementary measures in covered sectors.
● supporting well-functioning markets. A linked ETS would require the UK ETS to maintain the EU ETS’s approach to free allocation and assistance for industrial competitiveness. Similarly, this scenario implies the UK ETS must either adopt or closely coordinate any SAMs with the MSR and align with the EU ETS’s approach to banking and the operation of auctions and secondary markets. Unlimited banking and broad secondary market participation as under the EU ETS can be retained.
● ensuring effective governance. The linked UK ETS scenario may allow limited design changes to ensure effective governance. Revenue use options would likely remain as under the EU ETS: diverted to mitigate competitiveness concerns and support climate-related projects such as GGR technology development. This scenario would also entail that the UK retains the phase timings as the EU ETS and adopts independent reviews of the UK ETS in the context of the UK’s broader policy suite.
A standalone UK ETS provides greater policy flexibility and can more closely tie a domestic net zero trajectory but requires specific design to address potential market stability and liquidity challenges. Coverage can expand in this scenario, almost doubling UK covered emissions. This facilitates greater ETS alignment with net zero objectives and ensures counter-cyclical allowance prices dynamics to UK economic activity. Flexibility entails the ability to move towards more efficient allocation methods and potentially border carbon adjustments –

The Future of Carbon Pricing in the UK
103
but also potentially facing border carbon adjustments by the EU ETS. However, a standalone scenario entails certain risks including potential liquidity challenges, price volatility, and increased risks of competitiveness impacts on domestic industry. SAM design is therefore crucial and a soft price collar between £30/tCO2e and £50/tCO2e can be introduced from 2021 and subsequently calibrated to support the achievement of net zero. If liquidity is insufficient, changes to auction design and operation could be considered. The administrative costs associated with a standalone UK ETS are likely the highest across all scenarios.
There is a range of advantages and disadvantages of a standalone UK ETS across the four overarching design areas:
● facilitating linking. Policy adjustments in this scenario have been designed such that they would not introduce insurmountable barriers to linking, however some policy areas such as the operation of SAMs would require adjustment and close coordination. Ensuring the feasibility of future linking arrangements requires compatible allowance registries to be designed from the outset. However, specific processes for cooperation can be negotiated at a later stage.
● determining carbon pricing’s role within the climate policy mix. A standalone UK ETS can take on a larger share of the effort needed to reach net zero. It would enable expansion of scope to emissions from transport and uncovered fossil fuel combustion, with the possibility of further scope expansion to other hard to cover sectors in the future. This scenario allows for an ETS cap tightly linked to net zero trajectories from 2021 and can be accompanied by a simplification of the required supplementary policy-mix, supported by design of an effective SAM. There is also potential to introduce domestic offsets for covered entities’ compliance obligations and introduce price incentives for GGR technologies.
● supporting well-functioning markets. A standalone UK ETS provides a significant opportunity to reform design to support well-functioning markets. From 2021, we propose adopting the EU ETS approach to allocations, but in the longer term the introduction of tiered categories of leakage risk identification, output-based allocation, and potentially the use of BCAs could be considered to guard against competitiveness impacts. To provide price predictability, a soft price collar SAM could be adopted from 2021, with an auction reserve price starting at £30/tCO2e and a cost containment reserve at £50/tCO2e. In the event of low market liquidity, the government could investigate changing auction design to support secondary market development.
● ensuring effective governance. This scenario allows for more flexibility in the use of revenues. As in the linked scenario however, revenues should be prioritised to reduce competitiveness impacts on local industry and fund GGR technology. Remaining revenues could be used to offset costs to households, reduce distortionary taxes, or fund other government priorities like the NHS. Clear communication of revenue use can help generate stakeholder buy-in for the instrument. In this scenario UK ETS phases could be shortened to align with UK Carbon Budgets and more regular independent reviews.
A UK carbon tax provides administrative simplicity but requires institutional safeguards to ensure prices remain consistent with net zero objectives. Coverage can be expanded under this scenario, as under a standalone UK ETS. An expanded carbon tax could provide the opportunity to integrate the CPS, CCL and a new carbon tax into a single system. Theoretically, certainty about carbon cost can be provided for industry, facilitating investment decisions with tax trajectory that could start at £16/tCO2e in 2019 and, by 2025, converge to the efficient trajectory required for net zero objectives. The CPS could continue to top up prices in the interim but could be gradually reduced and removed once the carbon tax level converged to the efficient trajectory. However, being a price-based mechanism, the quantity of abatement achieved is less certain and regular reviews must be undertaken to account for the latest abatement cost and emissions reduction information to achieve carbon budgets and a cost-effective trajectory towards the net zero target. As with the

The Future of Carbon Pricing in the UK
104
standalone UK ETS, this scenario also entails competitiveness impacts and carbon leakage but exemptions or rebates aligned with the EU ETS approach to addressing competitiveness would reduce these risks. There would also be potential to introduce border carbon adjustments or output-based support in the longer term.
There is a range of advantages and disadvantages of a carbon tax across the four overarching design areas:
● facilitating linking. A carbon tax could not be linked with an ETS
● determining carbon pricing’s role within the climate policy mix. As in the standalone UK ETS, this scenario allows for an expansion of sectoral coverage to include transport and uncovered fossil fuel combustion, with the possibility to cover more complex sources in the future. A carbon tax may also provide relative price certainty by setting carbon taxes at £16 in 2019 and converging to an efficient price level, consistent by net zero trajectories, no later than 2025. The expanded carbon tax provides the opportunity to integrate the CPS, CCL and a new carbon tax into a single system, allowing for the simplification of the policy environment. Offsets and supplementary policies would be used in a similar manner as under a standalone UK ETS.
● supporting well-functioning markets. Carbon taxes require less complex arrangements to ensure efficient market functioning. This increases administrative simplicity and reduces implementation costs of this scenario. Rebates can reduce competitiveness impacts and can be designed based on efficiency benchmarks like those used for allocation under a standalone ETS, while new entrants can receive rebates based on current production levels.
● ensuring effective governance. The carbon tax scenario is also the simplest policy scenario in terms of governance. The flexibility afforded to revenue use is the same as the standalone UK ETS. While exact phasing becomes less important in this scenario, frequent reviews remain essential to calibrate carbon taxes with those needed to reach net zero particularly given uncertainty regarding emissions levels and costs.
Across the policy scenarios trade-offs are inevitable, with the benefits of cooperation and economic integration weighed against the benefits of designing policy for the UK’s specific circumstances. Each scenario brings advantages and disadvantages. These advantages and disadvantages are discussed in detail in Section 4 and are briefly summarised in Table 31 below.
Table 31 Advantages and disadvantages of scenarios
Key advantages Key disadvantages
Linked UK ETS
● Access to a large, liquid market which could provide enhanced resilience to domestic shocks
● Reduces inter-EEA competitiveness concerns
● Certainty of current policy and lower transition costs for business
● Lower capacity to design in line with economic context
● Additional need for supplementary policies and costs for uncovered sectors to reach net zero
Standalone UK ETS
● Can tie policy more closely to net zero target and provide more certain emissions outcomes
● Counter-cyclical price development ●
● Risks of low liquidity and volatility, with additional design features needed to mitigate these risks
● Competitiveness and leakage risks increase
● Administrative costs of implementation

The Future of Carbon Pricing in the UK
105
UK Carbon Tax
● Greater price certainty ● Administrative simplicity for
governments and covered facilities ● Greater capacity for policy simplification
● Less cost effective ● Uncertain quantity of abatement risks
not achieving carbon budgets ● Potential government intervention risks
undermining price predictability ● No automatic price response to
economic downturns
Source: Vivid Economics

The Future of Carbon Pricing in the UK
106
6 Conclusion
The report considers the theory and practice of carbon pricing globally to identify key lessons and best practice and offers advice to the UK government as it considers the next steps in its carbon pricing policy. As carbon pricing has expanded over the last decade, new challenges have developed regarding price development, emissions reductions, market functioning, competitiveness and political risk. The UK itself has a long history on carbon pricing, starting with the voluntary market, the still operating CCL and CPS, and the current participation in the EU ETS. The experience from all these jurisdictions and the theoretical work behind it provide valuable insights that can help the UK implement and run its future carbon pricing instruments efficiently and effectively.
We describe and evaluate three policy scenarios for the development of carbon pricing in the UK, provide policy recommendations and identify the advantages, disadvantages and trade-offs. These three policy scenarios cover the spectrum of potential carbon pricing policy options set out in the request:
1. A UK ETS linked to the EU ETS; this is the UK government’s preferred scenario. Given the lengthy process for negotiating and ratifying a linking agreement, we consider that this would only be possible by 2021 if there is not substantive policy deviation between the UK ETS and EU ETS. Given this, we focus on a mirrored ETS-link, with the UK adopting almost all aspects of the EU ETS.
2. A standalone UK ETS; this provides the potential for divergence in policy design from the EU ETS. In this scenario we consider that linking would only be feasible on a longer time frame, potentially sometime in the period 2025-30.
3. A UK carbon tax as a fallback option; this would not provide any opportunity to fully link with the EU ETS or other carbon markets in the short- or long-term. As such we suggest policy design options that assume that a carbon tax remains a purely domestic fall-back mechanism.
A UK ETS linked to the EU ETS remains the best solution if the UK leaves the EU with a negotiated deal. A UK ETS linked to the EU ETS maintains predictable climate policy and access to an established and efficient broader European carbon market. Linking to the EU ETS by 2021 is only possible if design changes are kept to a minimum to avoid the need for lengthy negotiations. As such in this scenario we recommend minimal changes to the fundamental design of the system, with largely unchanged provisions regarding scope, cap setting, free allocations and other market design features. To ensure the effective functioning of SAMs the UK should closely coordinate any SAM with the operation of the EU ETS’s MSR. In addition to the need for supplementary policies to address non-price barriers and mobilise GGRs, in this scenario the CCL and CPS should be retained to ensure appropriate price incentives in covered sectors.
However, developments regarding Brexit will constrain choices. As discussed in section 4, in a ‘no-deal’ scenario, the UK’s choice will be restricted to either a standalone UK ETS, with a low potential for future linking with the EU ETS in the short to medium term, or a carbon tax as a purely domestic measure.
A standalone UK ETS can more closely align policy with the UK’s net zero objective, but careful design will be needed to address potential challenges regarding market stability and liquidity. To increase efficiency, liquidity and reducing demand volatility, it would be desirable to expand coverage in a new UK ETS to transport and uncovered combustion fuels (most importantly use of gas). This will see the absolute amount of emissions covered more than double. Greater coverage will allow the UK’s cap to be more closely calibrated to the net zero objective and UK carbon budgets. Allocation methods would be unchanged at the beginning of the system, but in the longer-term the introduction of BCAs or adoption of output-based allocations could be considered. The design of a UK SAM will play a crucial role in providing market stability and predictability particularly in early years when demand is more uncertain as electricity generators build hedging positions.

The Future of Carbon Pricing in the UK
107
This would be implemented through an auction reserve price and cost containment reserve. We recommend that in 2021, the reserve price and cost containment reserve be triggered at £30/tCO2e and £50/tCO2e respectively and over time be calibrated to track the likely range of prices necessary to hit the net zero target. Finally, changes to auction design and operation may be considered to jump start the secondary market if insufficient liquidity impinges the provision of risk management products.
Moving to a carbon tax results in greater administrative simplicity but would require appropriate institutional safeguards to ensure prices remain consistent with the UK’s net zero target. In this scenario the CPS and CCL could, over time, be integrated into a new carbon tax. Coverage of this tax should be expanded to cover uncovered energy and transport emissions as under a standalone ETS. The carbon tax trajectory should begin at £16 in 2019 in line with government announcements to date but should quickly converge to the expected EU allowance price by 2021, and the long run efficient trajectory for achieving the UK’s net zero emissions objectives no later than 2025. This trajectory should be assessed through regular independent reviews to take account of the latest information regarding mitigation costs and emissions levels. A system of exemptions or rebates should be established to replicate the approach of the EU ETS in addressing potential competitiveness issues, with these potentially being replaced by border carbon adjustments or an output-based approach in the longer term.
Across scenarios some policy elements are common:
● Market-based mechanisms are central to any successful decarbonisation strategy but there remains an important role for supplementary policies to address non-price barriers to mitigation or sequestration, and particularly with relation to GGRs.
● The Government’s proposed continuation of the small emitter and hospitals opt-out and introduction of an ultra-small emitter exemption appears appropriate to reduce administration costs.
● There is a need to mobilise land sector abatement through the establishment of an offset mechanism, with demand sourced either through carbon price compliance entities or in the case of a linked UK ETS, through an obligation on transport emissions.
● The use of carbon pricing revenues should be prioritised for addressing competitiveness issues and supporting GGRs as necessary, with remaining funds available for a range of other uses.
● With the increased autonomy of the UK’s carbon pricing policy there is a need for increased oversight and review to ensure policies are fit for purpose. This includes continuing to assess progress to the UK and devolved administrations emissions reduction objectives, in assessing the design and function of competitiveness arrangements and offsets and considering the operation of the secondary market.
● The devolved administrations should continue to play a central role in administering the carbon pricing system, particularly with regards to emissions monitoring reporting and verification.
While there remains significant uncertainty regarding the future of carbon pricing in the UK, carbon pricing will play an essential role in meeting the UK’s net zero objectives under any scenario. Regardless of the outcome of Brexit, there is a need for the UK to develop credible and predictable policy arrangements and effective governing institutions to maintain current momentum toward a net zero emissions economy.

The Future of Carbon Pricing in the UK
108
References
ACCA. (2014). Reducing Australia’s Greenhouse Gas Emissions — Targets and Progress Review. Climate Change Authority.
Acworth, W. (2018). KETS Project Briefing Paper.
ADB. (2016). Emissions Trading Schemes and Their Linking: Challenges and Opportunities in Asia and the Pacific. Asian Development Bank.
Aether. (2010). Assessing the cost to UK operators of compliance with the EU Emissions Trading System.
Alberta Goverment. (2017). Fiscal Plan: Climate Leadership Plan.
Andersson, J. (2017). Cars, carbon taxes and CO2 emissions. Centre for Climate Change Economics and Policy Working Group Paper, 238.
Australian Government Treasury. (2011). Strong Growth, Low Pollution: Modelling a Carbon Price.
Beck, U. R., & Kruse-Andersen, P. K. (2018). Endogenizing the cap in a cap-and-trade system : Assessing the agreement on EU ETS phase 4 (Working paper 2018:2).
BEIS. (2016). Coal Generation in Great Britain.
BEIS. (2018). Energy Intensive Industries (EIIs): Compensation For The Indirect Costs Of The Eu Emissions Trading System And The Carbon Price Support Mechanism. Retrieved from https://assets.publishing.service.gov.uk/government/uploads/system/uploads/attachment_data/file/749406/indirect-costs-of-eu-ets-and-cps-mechanism-guidance.pdf
BEIS. (2019). Updated Short-Term Traded Carbon Values.
Betz, R., & Schmidt, T. (2016). Transfer patterns in Phase I of the EU Emissions Trading System: a first reality check based on cluster analysis. Climate Policy, 16(4), 474–495.
Branger, F., & Quirion, P. (2015). Reaping the carbon rent: Abatement and overallocation profits in the European cement industry, insights from an LMDI decomposition analysis. Energy Economics, 47, 189–205.
British Columbia Ministry of Finance. (2013). Carbon Tax Report and Plan.
Burke, J., Byrnes, R., & Fankhauser, S. (2019). How to price carbon to reach net-zero emissions in the UK. Grantham Research Institute on Climate Change and the Environment and Centre for Climate Change Economics and Policy, London School of Economics and Political Science.
Burke, P. (2016). Undermined by Adverse Selection: Australia’s Direct Action Abatement Subsidies. Economic Papers: A Journal of Applied Economics and Policy, 35(3), 216–229. https://doi.org/10.1111/1759-3441.12138
Burtraw, D., Holt, C., Palmer, K., Paul, A., & Shobe, W. (2018). Quantities with Prices.
Burtraw, D., & McCormack, K. (2017). Consignment auctions of free emissions allowances. Energy Policy, 107, 337–344. https://doi.org/10.1016/j.enpol.2017.04.041
C2ES. (2011). Australia’s Carbon Pricing Mechanism. Arlington.

The Future of Carbon Pricing in the UK
109
Calel, R., & Dechezlepretre, A. (2016). Environmental policy and directed technological change: evidence from the European carbon market. Review of Economics and Statistics, 98(1), 173–191. https://doi.org/10.1162/REST
California Climate Investments. (2018). Annual Report 2018.
CARB. (2011). Article 5: CALIFORNIA CAP ON GREENHOUSE GAS EMISSIONS AND MARKET-BASED COMPLIANCE MECHANISMS.
CARB. (2012). Proposed Amendments to the California Cap on Greenhouse Gas Emissions and Market-Based Compliance Mechanisms to Allow for the Use of Compliance Instruments Issued by Linked Jurisdictions - Staff Report: Initial Statement of Reasons -. Sacramento. Retrieved from https://www.arb.ca.gov/board/mt/2017/mt121417.pdf
CARB. (2017). Cap and Trade: Public Meetings.
CARB. (2018a). Archived Auction Information | Cap-and-Trade. Retrieved December 14, 2018, from https://www.arb.ca.gov/cc/capandtrade/auction/auction_archive.htm
CARB. (2018b). Facts About Holding Limit for Linked Cap-and-Trade Programs.
Carl, J., & Fedor, D. (2016). Tracking global carbon revenues: A survey of carbon taxes versus cap-and-trade in the real world. Energy Policy, 96, 50–77. https://doi.org/10.1016/j.enpol.2016.05.023
CCC. (2015). Sectoral scenarios for the Fifth Carbon Budget -Technical report. Retrieved from https://www.theccc.org.uk/publication/sectoral-scenarios-for-the-fifth-carbon-budget-technical-report/
CCC. (2019a). Net Zero Technical Report, (May).
CCC. (2019b). Reducing UK emissions 2019: Progress Report to Parliament.
CE Delft. (2016). Calculation of additional profits of sectors and firms from the EU ETS.
Ceres. (2015). The Regional Greenhouse Gas Initiative: A Fact Sheet.
Climate Change Authority. (2014). Carbon Farming Initiative Review.
Commonwealth of Australia, & European Commission. (2013). Registry options to facilitate linking of emissions trading systems: Consultation paper.
CPLC. (2016). What Are the Options for Using Carbon Pricing Revenues?
CPLC. (2017). Report of the High-Level Commission on Carbon Prices.
CPLC. (2019). Bipartisan carbon fee and dividend bill now before U.S. Congress.
Cui, J., Zhang, J., & Zheng, Y. (2018). Carbon Pricing Induces Innovation: Evidence from China’s Regional Carbon Market Pilots. AEA Papers and Proceedings, 108, 453–57. https://doi.org/10.1257/pandp.20181027
Dechezleprêtre et al, A. (2018). The joint impact of the European Union emissions trading systemon carbon emissions and economic performance. OECD Economics Department Working Papers.
Doda, B., Quemin, S., & Taschini, L. (2018). Linking Permit Markets Multilaterally. ESRC Centre for Climate Change Economics and Policy London, March(September 2017), 53.

The Future of Carbon Pricing in the UK
110
Doda, B., & Taschini, L. (2016). Carbon dating: When is it beneficial to link ETSs ? Baran Doda and Luca Taschini September 2015 Centre for Climate Change Economics and Policy the Environment (No. No. 234).
Dutch Emissions Authority. (2015). A Simple and Effective EU ETS.
EC. (2012). Coverage: Choice of sectors and GHG coverage under an ETS Some views from the EU.
EDF, CDC Climate, & IETA. (2015). California: The world’s carbon markets: a case study guide to emissions.
EEA. (2014). Total greenhouse gas emissions trends and projections.
EIA. (2015). California and Quebec complete second joint carbon dioxide emissions allowance auction. Today in Energy. Retrieved from https://www.eia.gov/todayinenergy/detail.php?id=20312
Energy Systems Catapult. (2018). New Zealand Emissions Trading Scheme.
Environment Quebec. (2018). Auction Notices and Results - Carbon market. Retrieved December 14, 2018, from http://www.environnement.gouv.qc.ca/changements/carbone/avis-resultats-en.htm
European Commission. (2014a). Energy prices and costs in Europe, 248. https://doi.org/10.2765/72195
European Commission. (2014b). Questions and answers on the proposed market stability reserve for the EU emissions trading system. MEMO 22 January 2014.
European Commission. (2015a). Commission Staff Working Document Impact Assessment Accompanying the document Proposal for a Directive of the European Parliament and of the Council amending Directive 2003/87/EC to enhance cost-effective emission reductions and low- carbon. Brussels.
European Commission. (2015b). DECISION (EU) 2015/1814 OF THE EUROPEAN PARLIAMENT AND OF THE COUNCIL of 6 October 2015 concerning the establishment and operation of a market stability reserve for the Union greenhouse gas emission trading scheme and amending Directive 2003/87/EC. https://doi.org/http://eur-lex.europa.eu/pri/en/oj/dat/2003/l_285/l_28520031101en00330037.pdf
European Commission. (2015c). EU ETS Handbook. Climate Action. https://doi.org/10.2834/55480
European Commission. (2017). Analysis of the use of Auction Revenues by the Member States, (March). Retrieved from https://ec.europa.eu/clima/sites/clima/files/ets/auctioning/docs/auction_revenues_report_2017_en.pdf
European Commission. (2018). Effort sharing: Member States’ emission targets.
European Commission. (2019). Opening Statement in the European Parliament Plenary Session by Ursula von der Leyen, Candidate for President of the European Commission. Retrieved from http://europa.eu/rapid/press-release_SPEECH-19-4230_en.htm
Fallmann, H., Heller, C., Seuss, K., Monique Voogt, Phylipsen, D., Iersel, S. van, … Riedel, A. (2015). Evaluation of the EU ETS Directive. Vienna.
Garcia, S. P. (2017). Mexico Carbon Tax. In Technical Workshop Carbon Tax: Design and Implementation in Practice. New Delhi: PMR. Retrieved from https://www.thepmr.org/system/files/documents/Mexico Carbon Tax_PMR_march_2017.pdf
German Federal Ministry for the Environment Nature Conservation and Nuclear Safety. (2018). The Carbon

The Future of Carbon Pricing in the UK
111
Tax in Sweden - Fact Sheet.
Glowacki, M. (2018). Exclusion of small installations and hospitals from the EU ETS.
Government of Alberta. (2019). Coal Community Transition Fund. Retrieved from https://www.alberta.ca/coal-community-transition-fund.aspx
Government of Australia. (2012). Clean Energy Future: Regional Structural Adjustment Assistance Program. Retrieved from https://webarchive.nla.gov.au/wayback/20130328233120/http:/www.regional.gov.au/regional/funding/rsaap.aspx
Government of the Netherlands. (2019). Klimaatakkoord. Retrieved from https://www.klimaatakkoord.nl/binaries/klimaatakkoord/documenten/publicaties/2019/06/28/klimaatakkoord/klimaatakkoord.pdf
Government of the Republic of South Africa. (2019). Carbon Tax Act. Government Gazette, 42483.
Haites, E. (2018). Carbon taxes and greenhouse gas emissions trading systems : what have we learned ? Climate Policy, 18(8), 955–966. https://doi.org/10.1080/14693062.2018.1492897
Haya, B. (2019). Policy Brief: The California Air Resources Board’s U.S. Forest offset protocol underestimates leakage.
Hirst, D. (2018). Carbon Price Floor (CPF) and the price support mechanism. Number 05927. House of Commons Library.
HMRC. (2010). Carbon price floor: support and certainty for low-carbon investment.
HMRC. (2018). Carbon Emissions Tax. Retrieved April 25, 2019, from https://www.gov.uk/government/publications/carbon-emmisions-tax/carbon-emmisions-tax
HMRC. (2019a). Carbon Emissions Tax technical note.
HMRC. (2019b). Climate Change Levy.
Hood, C. (2011). Summing Up The Parts: Combining Policy Instruments for Least-Cost Climate Mitigation Strategies. Information Paper. Paris. Retrieved from https://www.iea.org/publications/freepublications/publication/Summing_Up.pdf
ICAP. (2018a). Allowance Price Explorer. Retrieved from https://icapcarbonaction.com/en/introducing-allowance-price-explorer
ICAP. (2018b). New Zealand Emissions Trading Scheme (NZ ETS).
ICAP. (2019). New Zealand Emissions Trading Scheme. Retrieved from https://icapcarbonaction.com/en/?option=com_etsmap&task=export&format=pdf&layout=list&systems%5B%5D=48
IETA. (2015a). Québec: an emissions trading case study.
IETA. (2015b). United Kingdom: An Emissions Trading Study. Retrieved from https://www.ieta.org/resources/Resources/Case_Studies_Worlds_Carbon_Markets/2015/uk_case_study_may2015.pdf
IETA. (2018). Colombia: An Emissions Trading Case Study.

The Future of Carbon Pricing in the UK
112
International Air Transport Association. (2018). An Airline Handbook on CORSIA.
Kennedy, J. (2018). How Induced Innovation Lowers the Cost of a Carbon Tax.
LAO. (2014). The 2014-15 Budget: Cap-and-Trade Auction Revenue Expenditure Plan. Sacramento.
Leining, C., & Kerr, S. (2018). Economic and Public Policy Research a Guide To the New Zealand. Wellington.
Lina, L., & Ackva, J. (2018). Carbon markets must balance stability and adaptability. Retrieved December 7, 2018, from https://www.chinadialogue.net/blog/10505-Carbon-markets-must-balance-stability-and-adaptability/en
Lygre, S., & Wettestad, J. (2018). The Regional Greenhouse Gas Initiative. The Evolution of Carbon Markets, 53–66. https://doi.org/10.4324/9781315228266-4
Marcu, A., Alberola, E., Caneill, J.-Y., Mazzoni, M., Schleicher, S., Vailles, C., … Cecchetti, F. (2019). 2019 State of the EU ETS Report.
Marron, D. B., & Morris, A. C. (2016). How To Use Carbon Tax Revenues.
Martin, R., de Preux, L. B., & Wagner, U. J. (2014). The impact of a carbon tax on manufacturing: Evidence from microdata. Journal of Public Economics, 117, 1–14. https://doi.org/10.1016/j.jpubeco.2014.04.016
Mehling, M., Van Asselt, H., Das, K., & Droege, S. (2018). Beat protectionism and emissions at a stroke. Nature, 559, 321–324.
Metcalf, G. E. (2015). A conceptual framework for measuring the effectiveness of green fiscal reforms. Retrieved from http://www.greengrowthknowledge.org/sites/default/files/Metcalf_A_Conceptual_Framework_for_Measuring_the_Effectiveness_of_Green_Fiscal.pdf
Metevier, C., Bultheel, C., & Postic, S. (2018). Global Carbon Account 2018. Institute for Climate Economics.
Ministry for the Environment. (2018). In-principle decisions: further information. Retrieved December 6, 2018, from http://www.mfe.govt.nz/climate-change/new-zealand-emissions-trading-scheme/reviews-of-nz-ets/nz-ets-review-201516/principle
MOECC. (2018). Ontario Post-Joint Auction Public Proceeds Report Ontario Cap-and-Trade Program May 2018 Joint Auction #15.
MOECC. (2019). Ontario Introduces Legislation to End Cap and Trade Carbon Tax Era in Ontario.
Monjon, S., & Quirion, P. (2011). Addressing leakage in the EU ETS: border adjustment or output-based allocation? Ecological Economics, 70(11), 1957–1971.
Moore, C. (2018). “No Deal” Brexit will trigger a UK coal resurgence.
Murray, B. C., Maniloff, P. T., & Murray, E. M. (2015). Why have greenhouse emissions in RGGI states declined? An econometric attribution to economic, energy market, and policy factors. Energy Economics, 51, 581–589. https://doi.org/10.1016/j.eneco.2015.07.013
Murray, B., & Rivers, N. (2015). British Columbia’s revenue-neutral carbon tax: A review of the latest “grand experiment” in environmental policy. Energy Policy, 86(May), 674–683. https://doi.org/10.1016/j.enpol.2015.08.011
Næss-Schmidt, S. (2011). Carbon leakage from a Nordic perspective.

The Future of Carbon Pricing in the UK
113
Narassimhan, E., Gallagher, K. S., Koester, S., & Alejo, J. R. (2017). Carbon Pricing in Practice: A Review of the Evidence.
Near Zero. (2017). California’s climate emissions are falling, but cap-and-trade is not the cause.
New Zealand Productivity Commission. (2018). Low-emissions economy. Retrieved from https://www.productivity.govt.nz/sites/default/files/Low emissions economy issues paper FINAL WEB.pdf
Newbery, D. M., Reiner, D. M., & Ritz, R. A. (2018). When is a carbon price floor desirable? (Energy Policy Research Group Working Paper No. 1816).
Newbery, D. M., Reiner, D. M., & Ritz, R. A. (2019). The political economy of a carbon price floor for power generation. Energy Journal, 40(June), 1–24. https://doi.org/10.5547/01956574.40.1.dnew
Perino, G. (2018). New EU ETS Phase 4 rules temporarily puncture waterbed. Nature Climate Change, 8(4), 262–264. https://doi.org/10.1038/s41558-018-0120-2
Perino, G., Ritz, R., & van Benthem, A. (2019). Understanding Overlapping Policies: Internal Carbon Leakage and the Punctured Waterbed, 23(March 2019). https://doi.org/10.3386/w25643
PMR. (2017). Carbon Tax Guide: A Handbook for Policy Makers.
Province of British Columbia. (2019). British Columbia’s Carbon Tax.
Qi, S., & Cheng, S. (2018). China’s national emissions trading scheme: integrating cap, coverage and allocation. Climate Policy, 18(sup1), 45–59. https://doi.org/10.1080/14693062.2017.1415198
Quemin, S., & Trotignon, R. (2019). Intertemporal emissions trading and market design : an application to the EU ETS, 5709(348).
REA. (2018). UK Goes Without Coal For A Record Breaking Two Months. Retrieved November 29, 2018, from https://www.r-e-a.net/news/uk-goes-without-coal-for-a-record-breaking-two-months
Republic of South Africa. Carbon Tax Act, 2019, Government Gazette § (2019). Republic of South Africa.
Roberts, D. (2014). California’s carbon market is leaking.
Siegmeier, J., Mattauch, L., & Edenhofer, O. (2018). Capital beats coal: How collecting the climate rent increases aggregate investment. Journal of Environmental Economics and Management, 88, 366–378. https://doi.org/10.1016/j.jeem.2017.12.006
Smith, S., & Swierzbinski, J. (2007). Assessing the performance of the UK Emissions Trading Scheme. Environmental and Resource Economics, 37(1), 131–158.
Somanathan, E., Sterner, T., & Sugiyama, T. (2014). National and Sub-national Policies and Institutions. Climate Change 2014: Mitigation of Climate Change. Contribution of Working Group III to the Fifth Assessment Report of the Intergovernmental Panel on Climate Change. https://doi.org/10.1002/zamm.19860660603
Stiglitz, J. E., & Stern, N. H. (2017). Report of the High-Level Commission on Carbon Prices.
Sutter, K. R. (2018). Western Climate Initiative: Stability reigns after Ontario exit as all current and future allowances sell. Retrieved December 11, 2018, from http://blogs.edf.org/climate411/2018/08/21/western-climate-initiative-stability-reigns-after-ontario-

The Future of Carbon Pricing in the UK
114
exit-as-all-current-and-future-allowances-sell/
The European Parliament and Council. (2009). Directive 2009/29/EC amending Directive 2003/87/EC so as to improve and extend the greenhouse gas emission allowance trading scheme of the Community. Retrieved from http://eur-lex.europa.eu/legal-content/EN/TXT/PDF/?uri=CELEX:32009L0029&from=en
UK Department for Business Energy & Industrial Strategy. (2019). Letter commissioning Committee on Climate Change advice on UK ETS. Retrieved from https://assets.publishing.service.gov.uk/government/uploads/system/uploads/attachment_data/file/799576/Final_CCC_Commission_letter_020519_v2.pdf
UK Government and Devolved Administrations. (2019). The Future of UK Carbon Pricing.
UK Woodland Carbon Code. (2019). UK Woodland Carbon Registry. Retrieved from https://www.woodlandcarboncode.org.uk/uk-woodland-carbon-registry
UNFCCC. (2019). United Kingdom. 2019 KP Common Reporting Format (CRF) Table.
Vaiciulis, R. (2013). Linking the California and Québec Emissions Trading Schemes.
Vitelli, A. (2018). Record volatility roils EU carbon markets. Retrieved December 7, 2018, from http://www.petroleum-economist.com/articles/low-carbon-energy/renewables/2018/record-volatility-roils-eu-carbon-markets
Vivid Economics. (2015). Carbon Leakage Theory, Evidence and Policy Design. Washington D.C.
Vivid Economics. (2018a). Emissions Trading in Mexico: Analysis of Carbon Leakage Risks.
Vivid Economics. (2018b). Oregon Sectoral Competitiveness under Carbon Pricing. Retrieved from http://www.vivideconomics.com/publications/oregon-sectoral-competitiveness-under-carbon-pricing
Vivid Economics, Motu Economic and Public Policy Research, & EDF. (2016). Emissions Trading in Practice: A Handbook on Design and Implementation.
WCI. (2014). California Cap-and-Trade Program and Québec Cap-and-Trade System Joint Auction of Greenhouse Gas Allowances on November 19, 2014: Auction Notice.
WCI Economic Modelling Team. (2012). Discussion Draft Economic Analysis Supporting the Cap-and-Trade Program - California and Québec.
World Bank Group. (2019). State and Trends of Carbon Pricing 2019. https://doi.org/10.1596/978-1-4648-0725-1
Zuckerman, J., Laughlin, K., Abramskiehn, D., & Wang, X. (2014). Cap and Trade in Practice: Barriers and Opportunities for Industrial Emissions Reductions in California CPI Working Paper.

The Future of Carbon Pricing in the UK
Contact us
Vivid Economics Limited 163 Eversholt Street London NW1 1BU United Kingdom
T: +44 (0)844 8000 254 [email protected]
Company profile
Vivid Economics is a leading strategic economics consultancy with global reach. We strive to create lasting value for our clients, both in government and the private sector, and for society at large.
We are a premier consultant in the policy-commerce interface and resource- and environment-intensive sectors, where we advise on the most critical and complex policy and commercial questions facing clients around the world. The success we bring to our clients reflects a strong partnership culture, solid foundation of skills and analytical assets, and close cooperation with a large network of contacts across key organisations.