Embed Size (px)
Citation preview

The Future of Arid Land Agriculture: The Aral Sea Basin
of Central Asia and the San Joaquin-Tulare Basin of CA.
Waterscape International Group

Purpose-Why Look at the Aral? Compare the Aral Sea Basin to
Tulare Basin Learn a bit about arid land, irrigated
agriculture Provide California with a “window
into the future” Informational presentation

Conversions 1 sq. km = 100 hectares 1 hectare = 2.5 acres 1 sq. mile = 640 acres = 259
hectares 1 acre-foot = 1230 cubic meters 1 cubic km = 813,000 acre-feet

Features of SJ & Tulare Basins Southern Half of
the Central Valley 84,000 sq km Sacramento to
Bakersfield
Sierras, Coast Ranges, Tehachapi, Delta
Silicate-rich Sierran Sands, Coast Range Alluvium Flood Basin Deposits

Map of SJ Tulare Basins

Close-up View

Features of Aral Sea Basin 3,995,900 thousand sq.km. (all of
Central Asia) 53,017 thousand people

Map of Aral Sea Basin

Aral Sea Basin-Population
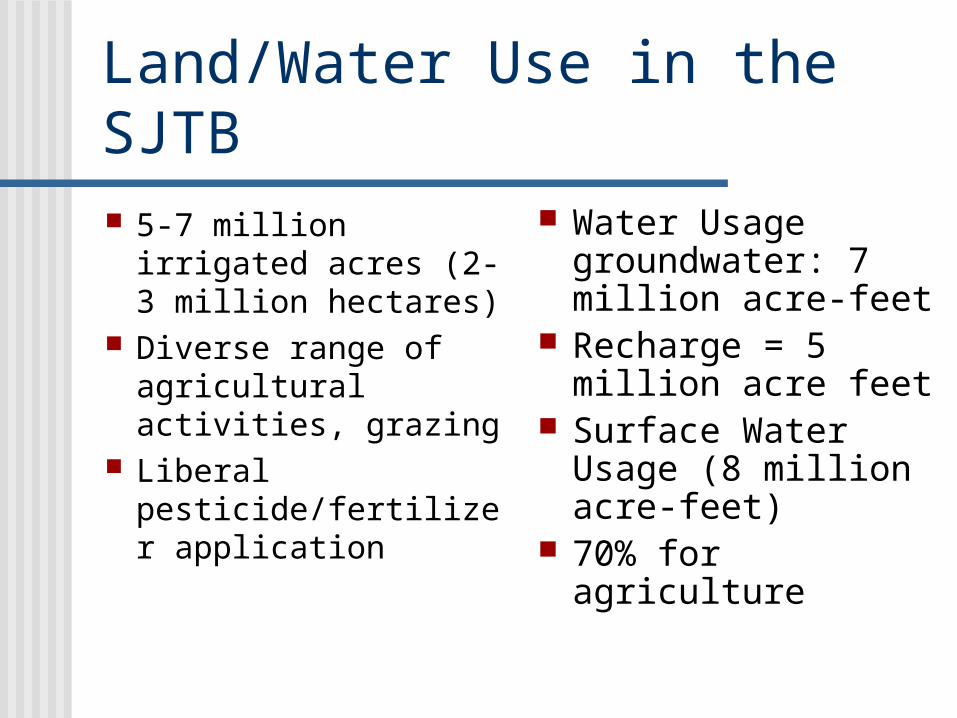
Land/Water Use in the SJTB 5-7 million
irrigated acres (2-3 million hectares)
Diverse range of agricultural activities, grazing
Liberal pesticide/fertilizer application
Water Usage groundwater: 7 million acre-feet
Recharge = 5 million acre feet
Surface Water Usage (8 million acre-feet)
70% for agriculture

Land/Water Use in Aral Total Mean Surface
Water Flow = 116 cubic km (60 into Aral Sea)
Annual Usage >95% Groundwater
Reserves ~31 cubic km
Annual Usage = 10 cubic km
Cotton & Grain 75%
Irrigated lands have doubled (7.5-7.9 million hectares).
Total Cultivated 10 million hectares
Agriculture in the region dates back to the 6th-7th centuries B.C

SJ Tulare Basin-Land Cover

SJ Tulare Basin - DEM

Aral Sea Basin-Land Cover

Drainage Irrigation Type of agriculture One big evaporation dish Irrigation (>90% furrow irrigation) Drainage (Aral Sea Basin installed
drainage late) What to do with the drainage?

Irrigation Canals

Impact of Arid Land Agriculture Salinization Trace Elements Pesticides Nutrients
Reduced Runoff

Effect on SJ Tulare Basin NAWQA facts Decline in Ag.
Productivity Drinking water
(ground and surface) quality and availability declines
In-stream use impact

Effect on Aral Sea Basin Decline in
agricultural productivity (salinization and trace elements)
Decline in drinking water quality (pesticides, fertilizers, salt)
Air quality
Decline in drinking water quantity (diversions, pumpage)
Reduction in the sea dimensions
Increase in evaporation and drainage-collecting water, water salinity considerably increased from 9.94 g/litre in 1965, to about 15 g/litre in 1996

Effect on Aral Sea Basin (cont.) Salinized Land in
Uzbekistan1982: 12,000 sq. km 1985: 16,430 sq. km
Inflow to Aral SeaHistoric: 56 cub km 1966-70: 47 cub km 1981-85: 2 cub km

Year 1991 1992 1993 1994 1995 1996 1997
Total 3680 2539 2163 1519 570 471 805
Fish Catch from Maly Aral
Metric Tons
All 24 species of native fish have died off.

Aral Sea Surface Area Change

Abandoned Fishing Boats
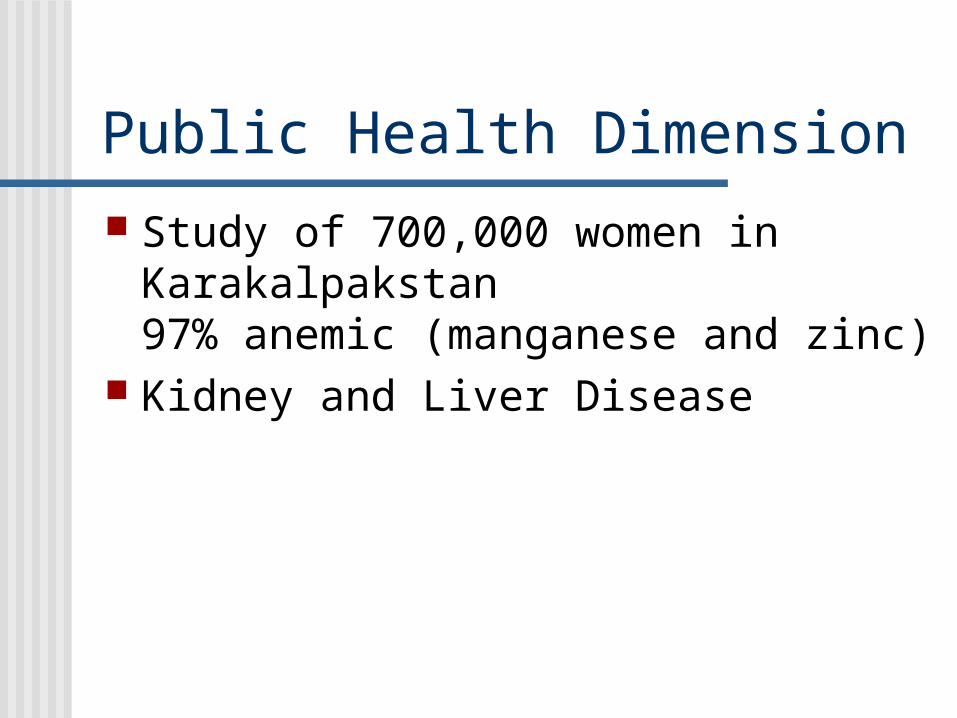
Public Health Dimension Study of 700,000 women in
Karakalpakstan97% anemic (manganese and zinc)
Kidney and Liver Disease

What’s being done?
SJTB CVPIA, CALFED 303 (d) CWA
Listings TMDLs DWSAP Program CAA Suit
Aral Sea Basin World Bank Funding is a large
issue

The Upshot Exploiting agricultural productivity over a
very shot period of time. Permanently impairing your groundwater
and surface water as a drinking water source
Permanently devegetating the landscape Negatively influencing public health
through air, soil, and water quality Destroying fisheries and natural habitat

Enough, In-time? Stop drainage, gw contamination? Regrowth of natural vegetative
cover? Bare soil evaporation. What can be done? Line canals, better drainage, etc?
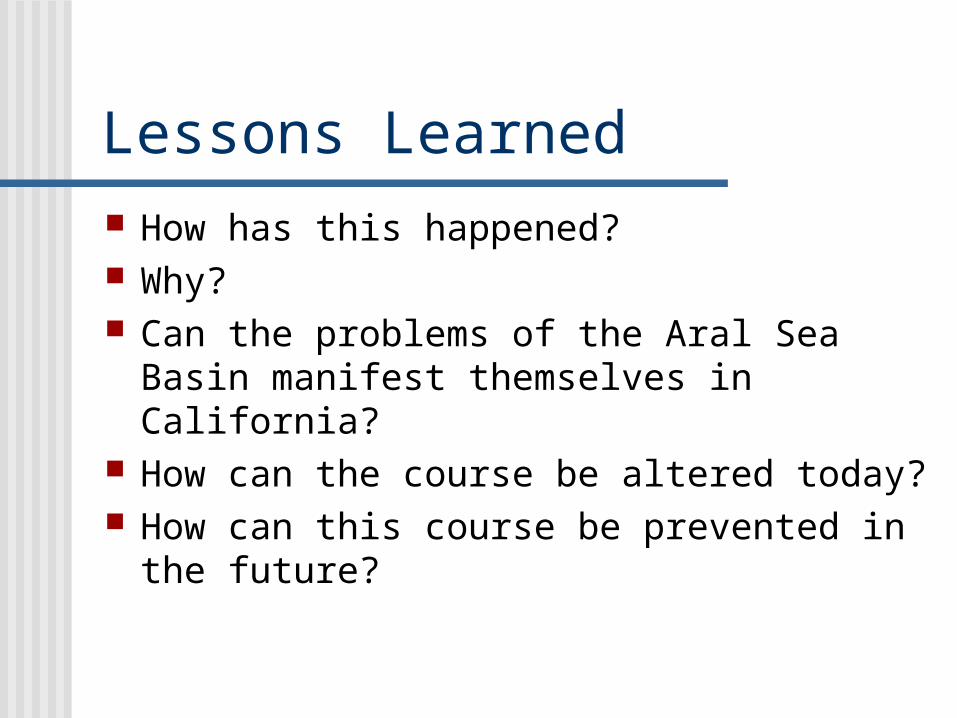
Lessons Learned How has this happened? Why? Can the problems of the Aral Sea Basin
manifest themselves in California? How can the course be altered today? How can this course be prevented in the
future?

References National report: "On the environment state and use of
natural resources in the Republic of Uzbekistan". State Committee on Nature protection of Uzbekistan. Tashkent, 1998.
K.Isentaev. "Geological structure and perspectives of oil and gas reserves of the Aral Sea". Workshop report. Almaty, 1997.
Ministerial conference of the Central Asia. "Assessment of the environment". Aarhus, Denmark, 1998.
J.Mahambetova. "Non-government union "Aral tenizi". Aralsk, 1999.