Embed Size (px)
Citation preview

The Future of ABC at Sandvik Tooling
- Incorporating ABC with information systems in order to drive business development from a cost point of view
Jenny Andersson Camilla Salomonsson
The Future of ABC at Sandvik Tooling
2
© Andersson, Jenny; Salomonsson, Camilla
Department of Automatic Control
Lund Institute of Technology
Box 118
SE-221 00 Lund
Sweden
Department of Business Administration
Lund University School of Economics and Management
PO-Box 7080
SE-220 07 Lund
Sweden
Master Thesis, Technology Management - Nbr 150/2008
ISSN 1651-0100
ISRN LUTVDG/TVTM--08/5150--/SE
KFS i Lund AB
Lund 2008
Printed in Sweden

The Future of ABC at Sandvik Tooling
3
Abstract
Title: The Future of ABC at Sandvik Tooling – Incorporating ABC
with information systems in order to drive business
development from a cost point of view.
Authors: Jenny Andersson and Camilla Salomonsson.
Supervisor: Charlotta Johnsson – Department of Automatic Control,
Lund University.
Carl-Henric Nilsson – Department of Business Administration,
Lund University.
Mats Jacobsson – Tooling Supply Finance, Sandvik Tooling.
Core Issue: Many companies have not been successful with their
implementation of the ABC model. The number of companies
using the ABC model for allocating overhead cost is still low.
Companies who once used the ABC model have abandoned it.
The ABC model has also been accused of not capturing the
complexity within a company, causing information system, and
other information systems such as Excel, to exceed their
capacity.
Purpose: The purpose of this thesis is to examine how a company based
ABC model corresponds with the theoretical model, in order to
give feedback to theory from a practical case and vice versa.
The relationship between ABC models and information
systems will also be evaluated in order to find means to
optimize the link between them. Points for evaluating
information systems from an ABC point of view will be
presented.
Methodology: An abductive approach and a qualitative method have been
used for this study. Information has mainly been gathered
through interviews in order to build the empirical chapter.
Secondary sources such as academic articles have been used
for the theoretical framework.

The Future of ABC at Sandvik Tooling
4
Conclusions: A conclusion we have drawn is that complexity is a villain
when it comes to designing ABC models and the relating
information systems. The compatibility of Sandvik Tooling’s
information systems in terms of ABC is deemed as inadequate.
We recommend the development of an ABC module to the
existing information systems. In order to make it possible to
develop/design and implement system supporting ABC,
standardization of the terminology, as well as parts of the
calculation making up the standard cost, is necessary.
Keywords: Activity Based Costing, ABC, Cost Allocation Process,
Overhead Cost, Sandvik Tooling, Information System,
Transactions.
The Future of ABC at Sandvik Tooling
5
Acknowledgements
Working with this thesis has been an incredible learning experience. We have been
met with an impressing enthusiasm from Sandvik Tooling employees who all have
offered their help and guidance. This positive experience has made this last semester
of our education enjoyable and we would like to express our gratitude to all those
who have shown interest in and contributed to our work.
This thesis would not have been possible without the help of our supervisor at
Sandvik Tooling, Mats Jacobsson, who continually offered us support and valuable
insights. We have also had valuable input from Karin H. Andersson and Annika
Gunnarsson-Wahlund, along with the entire GE department in Gimo. Our gratitude
also goes out to Cindy Kennedy in Mebane, and the entire staff in Mebane who made
us feel like we were at home. We are also very grateful to Norma Gray at Sandvik
Tooling in Fair Lawn for hosting us and helping us take our work to a higher level.
We would also like to acknowledge Stefan Magnusson at Sandvik Tooling in
Sandviken who helped with making it possible for us to do our thesis at Sandvik
Tooling. We have been in contact with a large number of employees at Sandvik
Tooling, and even though they are not mentioned above, our gratitude goes out to
them for their contributions to our work.
Our appreciation goes out to our supervisors Charlotta Johnsson, Department of
Automatic Control, and Carl-Henric Nilsson, Department of Business Administration,
both at Lund University, for their guidance throughout the semester. We would also
like to thank our reference group at school, Anna Bladh and Anna Ström, for their
valuable input.
Lund 05-23-08
Jenny Andersson & Camilla Salomonsson

The Future of ABC at Sandvik Tooling
6
The Future of ABC at Sandvik Tooling
7
Table of Contents 1 INTRODUCTION ........................................................................................................... 9
1.1 BACKGROUND ........................................................................................................... 9 1.2 CORE ISSUE ............................................................................................................. 11 1.3 PURPOSE .................................................................................................................. 13 1.4 DEMARCATION ........................................................................................................ 13 1.5 ABBREVIATIONS AND DEFINITIONS ......................................................................... 14
2 METHODOLOGY ........................................................................................................ 16
2.1 MODE OF OPERATION .............................................................................................. 16 2.2 GATHERING DATA ................................................................................................... 17 2.3 THE NATURE OF THE DATA ..................................................................................... 18
2.3.1 Interviews ........................................................................................................... 18 2.4 VALIDITY AND RELIABILITY .................................................................................... 19
3 THEORETICAL FRAMEWORK ............................................................................... 21
3.1 INTRODUCTION TO THEORETICAL FRAMEWORK ...................................................... 21 3.2 ACTIVITY BASED COSTING ...................................................................................... 23
3.2.1 Designing ABC ................................................................................................... 24 3.2.2 The Conceptual Framework of ABC ................................................................... 26 3.2.3 Activity Based Budgeting – Operational Control ............................................... 26 3.2.4 Time-Driven ABC ............................................................................................... 28
3.3 FOCUSING ON TRANSACTIONS ................................................................................. 32 3.4 TECHNICAL SOLUTION ............................................................................................. 34
3.4.1 ISA95 .................................................................................................................. 35 3.4.2 Linking ABC to systems ...................................................................................... 36 3.4.3 Measuring Systems ............................................................................................. 37
3.5 SUMMATION OF THE THEORETICAL FRAMEWORK .................................................... 40
4 EMPIRICAL FOUNDATION ...................................................................................... 41
4.1 BACKGROUND ......................................................................................................... 41 4.2 INTRODUCTION TO ABC AT SANDVIK TOOLING ...................................................... 41
4.2.1 The Conceptual Framework of Sandvik Tooling ................................................ 42 4.3 MAPPING OF ABC IN GIMO ...................................................................................... 43
4.3.1 Direct Material Cost ........................................................................................... 44 4.3.2 Direct Cost Center .............................................................................................. 45 4.3.3 Indirect Cost Center ........................................................................................... 47
4.3.3.1 Allocating by Direct Cost Center ........................................................................... 49 4.3.3.2 Allocating by ABC Cost Center ............................................................................. 49 4.3.3.3 Allocating to R&D Cost ......................................................................................... 52 4.3.3.4 Allocating by Indirect Cost Center ......................................................................... 52
4.4 MAPPING OF ABC IN MEBANE ................................................................................ 52 4.4.1 Flow Group ........................................................................................................ 53 4.4.2 Direct Material Cost ........................................................................................... 54 4.4.3 Direct Cost Center .............................................................................................. 55 4.4.4 Indirect Cost Center ........................................................................................... 57
4.4.4.1 Allocating by Direct Cost Center ........................................................................... 58 4.4.4.2 Allocating by ABC Cost Center ............................................................................. 59 4.4.4.3 Allocating to R&D Cost ......................................................................................... 62 4.4.4.4 Allocating by Indirect Cost Center ......................................................................... 62
The Future of ABC at Sandvik Tooling
8
4.5 TECHNICAL SOLUTION ............................................................................................. 62 4.5.1 GSS Module ........................................................................................................ 63 4.5.2 Standard Pk Process in GSS ............................................................................... 65
5 COMPARISONS ........................................................................................................... 67
5.1 ABC COMPARISON .................................................................................................. 67 5.1.1 Direct Material Cost ........................................................................................... 68 5.1.2 Direct Cost Center .............................................................................................. 68 5.1.3 Indirect Cost Center ........................................................................................... 69
5.1.3.1 Allocating by Direct Cost Center ........................................................................... 70 5.1.3.2 Allocating by ABC Cost Center ............................................................................. 70 5.1.3.3 Allocating to R&D Cost ......................................................................................... 72 5.1.3.4 Allocating by Indirect Cost Center ......................................................................... 72
6 DISCUSSION ................................................................................................................. 73
6.1 ACTIVITY BASED COSTING ...................................................................................... 73 6.1.1 Terminology ........................................................................................................ 75
6.2 TECHNICAL SOLUTION ............................................................................................. 76 6.2.1 GSS Compatibility with ABC .............................................................................. 76 6.2.2 Practice versus Theory ....................................................................................... 78
6.3 MERGING ABC WITH INFORMATION SYSTEMS ........................................................ 79 6.3.1 Taking It to the Next Level .................................................................................. 79 6.3.2 Points for Evaluating the Information System from an ABC Point of View ....... 80
6.4 SUMMATION OF THE DISCUSSION ............................................................................ 82
7 CONCLUSIONS AND RECOMMENDATIONS ....................................................... 83
LIST OF REFERENCES ....................................................................................................... 85
APPENDIX I ........................................................................................................................... 88

The Future of ABC at Sandvik Tooling
9
1 Introduction
This chapter presents an introduction to the chosen subject for the thesis, as well as
the core issues. At the end of the chapter the purpose and the demarcation will be
presented.
1.1 Background
Due to technological change, global competition, and system development the
demand for cost systems has changed. Even so, the overall goal of businesses is to
meet customer needs in a profitable manner and at the same time, deliver the highest
attainable level of quality. In order to conduct business, a company needs information
regarding:1
- What factors matter to customers
- True costs of services or products
- Possible improvements
- Action taken in order to achieve all of the above
From a historic point of view, direct labor and direct material have been the most
important production factors within manufacturing. The cost of direct labor and direct
material were easily traced back to an individual product. Throughout time,
manufacturing has changed from being done by hand to being automated.2 The latter
has caused a drastic decrease in labor costs and, at the same time, an increase in the
overhead costs, in both size and importance.3 Overhead cost is the gathered amount of
direct and allocated cost for manufacturing, excluding the cost for direct labor and
purchased materials.4 Today the direct labor costs only make up a fraction of a
company’s total cost.5
The traditional cost account model allocates costs based on direct labor and direct
material.6 These factors are closely related to the production volume
7. This way of
1 Forrest, Edward Activity Based Management – A Comprehensive Implementation Guide
(1996), p. 299. 2 Stålh, Jan-Eric Industriella Tillverkningssystem – Länken mellan teknik och ekonomi (2007),
p. 8. 3 Daing Nasir Ibrahim and Ruhanita Maelah “Factors Influencing Activity Based Costing
(ABC) Adoption in Manufacturing Industry” (2007), p. 113. 4 Miller, Jeffrey G. and Vollman, Thomas E. ”The Hidden Factory” (1985), p. 1-5. 5 Cooper, Robin and Kaplan, Robert S. “Measure Costs Right: Make the Right Decisions”
(1988), p. 1. 6 Ainsworth, Penne “ABC overhead analysis beats traditional approach” (1995), p. 1.

The Future of ABC at Sandvik Tooling
10
allocating overhead costs thereby relies on the assumption that overhead is driven by
volume, but not all overhead cost can be related to the product in this manner.8 The
practical use of the traditional cost account model has thereby been questioned, since
most of the overhead costs are non-manufacture related. Criticism against the
traditional cost account model regards whether it can provide managers with accurate,
relevant and timely information.9
During the same time as criticism against the traditional cost account model arose, the
Activity Based Costing (ABC) model was introduced.10 The ABC model was first
mentioned in a publication in 1987 by Robert S. Kaplan and William J. Bruns.11 Since
then there has been a countless number of books and articles published regarding
ABC, all describing the power of the model and promising a solution on how a
company can improve its performance.12 Despite promises of finding the pot of gold
at the end of the rainbow, the number of companies using the ABC model for
allocating overhead cost is still low; many companies still use the traditional cost
account model.13 Companies who once used the ABC model have abandoned it
because it took too long to implement and the implementation and maintenance costs
were too high. The ABC model also failed to capture the complexity of company’s
operations and activities.14
There may be other reasons for companies not being successful with their
implementation of the ABC model, such as limits in organizational capacity. Only a
fraction of companies are taking advantage of the full potential of cost management.
The reason may be that companies need integrated information derived from multiple
sources in order to realize the full potential of cost management, an integration only
provided by an Enterprise Resource Planning (ERP) system. The installation of an
ERP system is made at a considerable expense; therefore, companies must be aware
of the limitations.15
7 Daing N. I. and Ruhanita M. (2007), p. 113. 8 Ainsworth, P. (1995), p. 1. 9 Daing N. I. and Ruhanita M. (2007), p. 113. 10 Ibid. 11 Bruns, William J. and Kaplan, Robert S. Accounting and Management – A Field Study
Perspective (1987). 12 Frost, William ABCs of Activity Based Management – Crushing Competition Through
Performance Improvement (2005), p. ix. 13 Daing N. I. and Ruhanita M. (2007), p. 113. 14 Anderson, Steven R. and Kaplan, Robert S. “Time-Driven Activity-Based Costing” (2004),
p. 1. 15 Cooper, Robin and Kaplan, Roberts S. Cost and Effect – Using Integrated Cost Systems to
Drive Profitability and Performance (1998), p. viii-x.
The Future of ABC at Sandvik Tooling
11
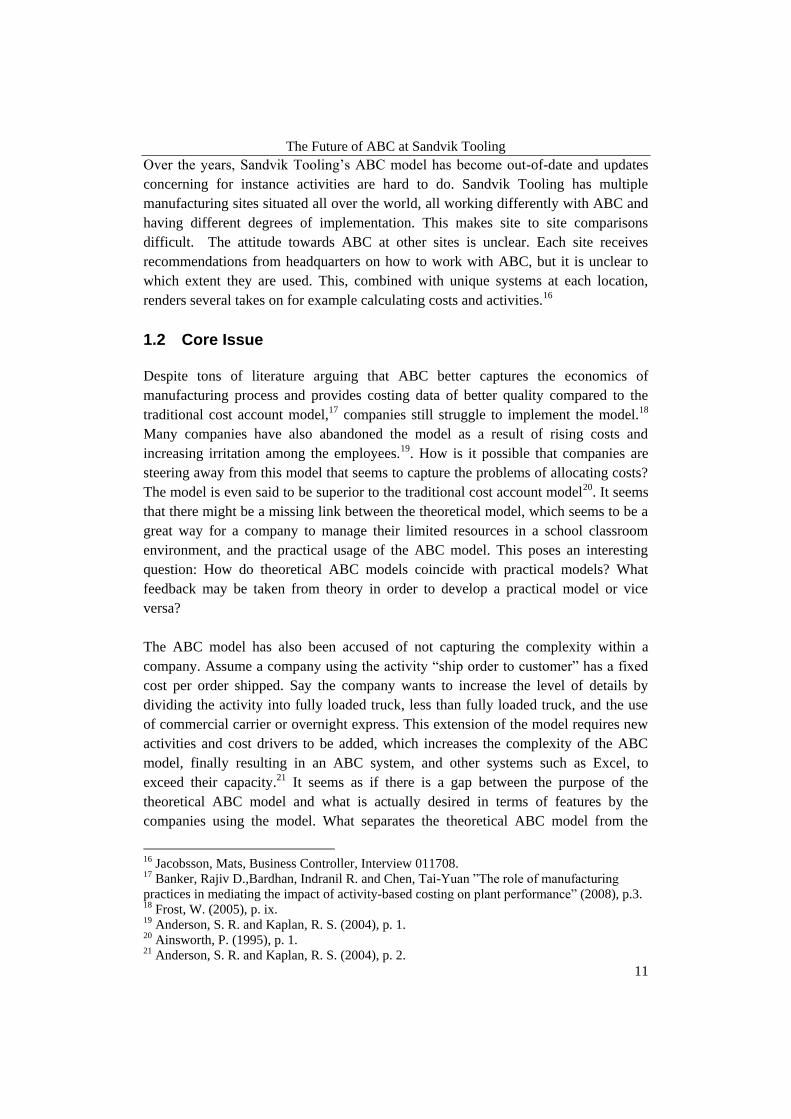
Over the years, Sandvik Tooling’s ABC model has become out-of-date and updates
concerning for instance activities are hard to do. Sandvik Tooling has multiple
manufacturing sites situated all over the world, all working differently with ABC and
having different degrees of implementation. This makes site to site comparisons
difficult. The attitude towards ABC at other sites is unclear. Each site receives
recommendations from headquarters on how to work with ABC, but it is unclear to
which extent they are used. This, combined with unique systems at each location,
renders several takes on for example calculating costs and activities.16
1.2 Core Issue
Despite tons of literature arguing that ABC better captures the economics of
manufacturing process and provides costing data of better quality compared to the
traditional cost account model,17 companies still struggle to implement the model.18
Many companies have also abandoned the model as a result of rising costs and
increasing irritation among the employees.19. How is it possible that companies are
steering away from this model that seems to capture the problems of allocating costs?
The model is even said to be superior to the traditional cost account model20. It seems
that there might be a missing link between the theoretical model, which seems to be a
great way for a company to manage their limited resources in a school classroom
environment, and the practical usage of the ABC model. This poses an interesting
question: How do theoretical ABC models coincide with practical models? What
feedback may be taken from theory in order to develop a practical model or vice
versa?
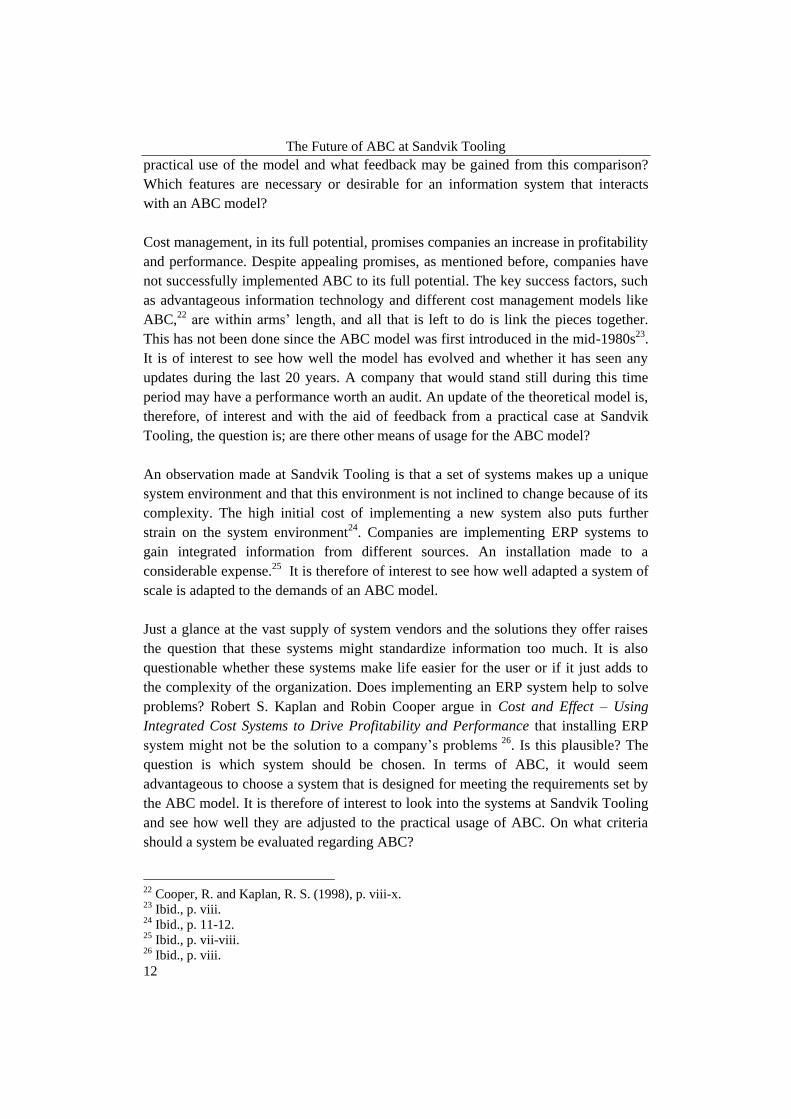
The ABC model has also been accused of not capturing the complexity within a
company. Assume a company using the activity “ship order to customer” has a fixed
cost per order shipped. Say the company wants to increase the level of details by
dividing the activity into fully loaded truck, less than fully loaded truck, and the use
of commercial carrier or overnight express. This extension of the model requires new
activities and cost drivers to be added, which increases the complexity of the ABC
model, finally resulting in an ABC system, and other systems such as Excel, to
exceed their capacity.21 It seems as if there is a gap between the purpose of the
theoretical ABC model and what is actually desired in terms of features by the
companies using the model. What separates the theoretical ABC model from the
16 Jacobsson, Mats, Business Controller, Interview 011708. 17 Banker, Rajiv D.,Bardhan, Indranil R. and Chen, Tai-Yuan ”The role of manufacturing
practices in mediating the impact of activity-based costing on plant performance” (2008), p.3. 18 Frost, W. (2005), p. ix. 19 Anderson, S. R. and Kaplan, R. S. (2004), p. 1. 20 Ainsworth, P. (1995), p. 1. 21 Anderson, S. R. and Kaplan, R. S. (2004), p. 2.
The Future of ABC at Sandvik Tooling
12
practical use of the model and what feedback may be gained from this comparison?
Which features are necessary or desirable for an information system that interacts
with an ABC model?
Cost management, in its full potential, promises companies an increase in profitability
and performance. Despite appealing promises, as mentioned before, companies have
not successfully implemented ABC to its full potential. The key success factors, such
as advantageous information technology and different cost management models like
ABC,22 are within arms’ length, and all that is left to do is link the pieces together.
This has not been done since the ABC model was first introduced in the mid-1980s23.
It is of interest to see how well the model has evolved and whether it has seen any
updates during the last 20 years. A company that would stand still during this time
period may have a performance worth an audit. An update of the theoretical model is,
therefore, of interest and with the aid of feedback from a practical case at Sandvik
Tooling, the question is; are there other means of usage for the ABC model?
An observation made at Sandvik Tooling is that a set of systems makes up a unique
system environment and that this environment is not inclined to change because of its
complexity. The high initial cost of implementing a new system also puts further
strain on the system environment24. Companies are implementing ERP systems to
gain integrated information from different sources. An installation made to a
considerable expense.25 It is therefore of interest to see how well adapted a system of
scale is adapted to the demands of an ABC model.
Just a glance at the vast supply of system vendors and the solutions they offer raises
the question that these systems might standardize information too much. It is also
questionable whether these systems make life easier for the user or if it just adds to
the complexity of the organization. Does implementing an ERP system help to solve
problems? Robert S. Kaplan and Robin Cooper argue in Cost and Effect – Using
Integrated Cost Systems to Drive Profitability and Performance that installing ERP
system might not be the solution to a company’s problems 26. Is this plausible? The
question is which system should be chosen. In terms of ABC, it would seem
advantageous to choose a system that is designed for meeting the requirements set by
the ABC model. It is therefore of interest to look into the systems at Sandvik Tooling
and see how well they are adjusted to the practical usage of ABC. On what criteria
should a system be evaluated regarding ABC?
22 Cooper, R. and Kaplan, R. S. (1998), p. viii-x. 23 Ibid., p. viii. 24 Ibid., p. 11-12. 25 Ibid., p. vii-viii. 26 Ibid., p. viii.

The Future of ABC at Sandvik Tooling
13
Sandvik Tooling has dozens of in-house software systems that make up the system
environment.27 This unique system environment limits Sandvik Tooling in the
number of new systems that can be implemented and to what extent the new systems
can be utilized, but also to what extent the old systems can be updated and changed.28
The generated ABC information is dependent on the systems and thereby the choices
regarding activities and cost drivers are limited. The problem with a limited system
environment lies in the difficulties to find measurable activities and cost drivers.29
The limitations in the systems hinder old activities and cost drivers to be replaced by
new ones or new activities and cost drivers to be added to the model.30 The cost
drivers that seem best in theory may not work in practice.31
1.3 Purpose
The purpose of this thesis is to examine how a company based ABC model
corresponds with theoretical models. This examination will render feedback as to how
the ABC model works in practice at Sandvik Tooling as well as how it coincides with
the theoretical ABC model. The relationship between ABC models and the
information system environment will also be evaluated in order to find means to
optimize the link between them. Furthermore, points for evaluating systems from an
ABC point of view will be presented.
1.4 Demarcation
The focus of this study will be limited to looking at the theoretical models concerning
ABC and seeing how well they coincide with practical models. The study of the topic
in practice will be done at Sandvik Tooling, limited to the Sandvik Tooling division
and the manufacturing sites in Gimo, Sweden, and Mebane, North Carolina, USA.
Furthermore, the business area for the manufacturing of tools will be in focus and in
some cases, when in depth investigation is required; the product group milling cutters
will be the subject of study. We have also limited the thesis to looking at standard
products.
The ABC model at Sandvik Tooling is part of the process of determining the standard
cost. Therefore, the study will present the process of calculating the standard cost,
both in Gimo as well as in Mebane, in order to get a cross-site comparison and to be
able to provide useful feedback of how multiple sites work with ABC. Furthermore
27 Jacobsson, M. 012208. 28 Lindberg, Tomas, Project Leader, Interview 031808. 29 Kennedy, Cindy, Controller, Interview 031908. 30 Lindberg, T. 031808. 31 Ibid.

The Future of ABC at Sandvik Tooling
14
the information system for ABC and standard cost calculation used in Mebane will be
the object of study.
1.5 Abbreviations and Definitions
Systems: Term system used in Chapter 1 Introduction and 3 Theoretical Framework
is the equivalent of what we refer to as information system throughout the thesis.
The abbreviations uses in the thesis is presented in the Table 1.1.
Table 1.1 Table of abbreviations.
Abbreviation Translation
ABB Activity Based Budgeting
ABC Activity Based Costing
AOU Allocation from Other Units
CAS Cost per Assortment
CCtr Cost Center
CMH Cost per Man-hour
CWO Cost per Work Order
DC Distribution Center
DCH Direct Cost per Hour
DHR Direct Hourly Rate
ED Ejector Drill
EOQ Economic Order Quantity
ERP Enterprise Resource Planning
FG Flow Group
GSS Group Supplier System
HT Cost per Heat Treatment per Piece
MES Manufacturing Execution System
R&D Research and Development
Standard Pk Standard Produktionskostnad (The Standard Cost of
Production)
Std PkABC Standard Pk Activity Based Costing Cost
Std Pkdirect Standard Pk Direct Cost

The Future of ABC at Sandvik Tooling
15
Std Pkmtrl Standard Pk Direct Material Cost
TDABC Time-Driven Activity Based Costing
OV Cost for Outside Vendor
WO Work Order

The Future of ABC at Sandvik Tooling
16
2 Methodology
Methodology is a systematic approach for the gathering and processing of data.32
This chapter is devoted to describing the course of action taken for the thesis.
Initially, the tools and techniques when gathering information will be presented,
along with why they have been chosen and what effects they might have on the end
result. This chapter will end with a discussion regarding the criticism of sources.
2.1 Mode of Operation
The first standpoint we had to take was deciding which strategy we would have for
getting a grip on the issue presented to us by Sandvik Tooling. Since deciding the
core issue for the thesis was an iterative process, we had to enter this project with an
open mind. Being open minded was important because we did not want to overlook
important information in the beginning, just on the basis of having a clear mindset
where we wanted to end up with the thesis.
During the initial stage of the thesis, we had to go back and modify the core issue in
order to assure that all stake holders were satisfied with the journey we were about to
embark on. We have chosen to go back and question our choices, and in some cases,
re-work our drafts in order to assure that we were on the right track, as well as
assuring that we were working in line with our core issue. We believe this strengthens
our result because we have not made any hasty decisions and we have continually
questioned our findings. The data we have collected has been continually reviewed in
order to assure that it met our, as well as our supervisors’, requirements.
The abductive approach is a combination of induction and deduction. This approach
is commonly used within case studies and was deemed suitable for our thesis. In
accordance with the inductive approach, the author has a starting point in empirical
data but at the same time does not discard from the theoretical perspectives, which is
closer to the deductive way of working.33 For our thesis, the collection of the
empirical data thereby had to be done parallel with the research for building up the
theoretical framework. An abductive approach was determined superior to a sole
inductive or deductive way of working because, we could combine the benefits of
induction and deduction. We also felt that we wanted to bring an update to the
academic theories, as well as give theoretical insight concerning ABC to Sandvik
Tooling.
32 Rienecker, Lotte and Jörgensen, Peter Stray Att skriva en bra uppsats (2002), p. 158. 33 Alvesson, Mats and Sköldberg, Kaj Tolkning och reflektion – Vetenskapsfilosofi och
kvalitativ metod (1994), p. 42.
The Future of ABC at Sandvik Tooling
17
When our core issue had been agreed upon, we decided to look further into the
academic theories regarding ABC. We wanted to test how well a theoretical ABC
model worked in practice. Therefore, the data concerning the core issue was first
gathered at Sandvik Tooling site in Gimo, and then applied to relevant academic
theories and models. However, because the thesis was of a comparing nature, and
took place at two sites, we had to start from scratch when we arrived in Mebane in
order to get a clear picture of how they worked with ABC. This was then followed by
putting the data to the test by comparing it to academic theories. Because we were
going to look into how the information systems handle ABC data, we chose to include
academic theories regarding information systems. To add a third aspect to the
theoretical framework, theories regarding transactions were also included. The
foundation for the theoretical framework is further presented in Chapter 3.1
Introduction to Theoretical Framework.
2.2 Gathering Data
Having an explorative issue will require choosing a method that will generate several
nuances.34 It also requires a demarcation within the study, for example, a selected
number of units. This is in line with the qualitative method.35 A qualitative method
was chosen for this thesis because we did not have a predetermined core issue when
we started working, which is in line with the qualitative method36. The core issue took
its shape along the way and finally resulted in being explorative. We wanted to find a
new angle to approach the issue from the academic, as well as the practical side, of
the thesis. Because the issue was broad, we chose to have clearly determined
demarcations. We have limited ourselves to two studying two production sites and we
have made further demarcations within these sites.
Since we had access to the key employees who work in relation to our core issue, we
decided that we would perform interviews. We felt that interviews, if conducted
correctly, would allow our information providers to supply nuanced data. A
qualitative method allows the information given by the employees to have few
limitations.37
Because we did not enter into this project with a topic set in stone, and our knowledge
of the area was limited, we started out by doing interviews that gave us information
34 Jacobsen, Dag Ingvar Vad, hur och varför? – Om metodval i företagsekonomi och andra
samhällsvetenskapliga ämnen (2002), p. 55-57. 35 Holme, Idar Magne and Solvang, Bernt Krohn Forskningsmetodik – Om kvalitativa och
kvantitativa metoder (1997), p. 79. 36 Jacobsen, D. I. (2002), p. 145. 37 Ibid., p. 142-146.

The Future of ABC at Sandvik Tooling
18
on a broader scope. This was done because we wanted to understand the Sandvik
Tooling organization and how an ABC model might be related to other departments,
for example, the interaction between finance and production. Along the way, we
found out who the key people within ABC were. We found that the case with ABC at
Sandvik Tooling was that, although it is a large organization, there were only a
number of people who have key information within our issue. In Mebane, for
instance, there is only one controller. The key employees within ABC were the focus
of our interviews. Although, the risk with us singling out employees is that we might
have gotten influenced by the information provider. We acknowledged this risk and
put a lot of effort into verifying the results from our empirical findings with other key
employees who might have knowledge within the area.
The negative aspect with having done all these interviews is that it has been a time-
consuming process. The interviews have in most cases required follow-up
conversations and because we have re-located between sites, some of the
conversations have been limited to e-mail correspondence. This has given us
responses in written form obtained straight from the source.
2.3 The Nature of the Data
Primary data is when the author obtains information straight from a source.38
2.3.1 Interviews
We have chosen to use individual and open interviews as primary data. This was
deemed appropriate because we only had a few information providers who could be
subjected to interviews. An individual and open interview is characterized by an open
conversation between the author and information provider. The interview can be
conducted over the telephone or face–to–face. The conversation is open and there are
no limits to what the information provider can say. The down side with using open
individual interviews is that we might have been influenced by the information
provider, as well as getting their individual opinions as part of their answer. 39 We
have tried discarding individual opinions, and instead, we have focused on developing
our own opinions regarding the issue in preparation for the conclusion of the thesis.
This has been done by repeatedly documenting our key findings and discussing it
without the influence of others.
We prepared our individual and open interviews thoroughly and made sure they were
of an open character. The questions were, in most cases, sent to the information
38 Lundahl, Ulf and Skärvad, Per-Hugo Utredningsmetodik för samhällsvetare och ekonomer
(1999) , p. 52. 39 Jacobsen, D. I.(2002), p. 160-167.
The Future of ABC at Sandvik Tooling
19
provider in advance so that all parties were prepared for the interview. We have
encouraged the information provider to speak freely, and we only interrupted the
information provider when we sensed the interview was beginning to stray off topic.
Throughout the telephone interviews and e-mails conversations, we have posed
questions which encouraged the information provider to give an open answer. In
order to strengthen the credibility of the interview, we chose to document the
responses given by the information provide in written form. After an interview, we
have cross-referenced our notes. A recording device was ruled out as an option
because we felt this might prevent the information provider from talking freely. It
may also have made the information provider decline our request for an interview.
Data that is not obtained straight from the source is secondary data to the author.
Information, in this case, is based on someone else’s opinion. It is also common that
the secondary data is gathered with a different purpose for the research.40 To prevent
this outcome, we chose not to use secondary data that is entirely used from one
source. Academic articles, making up the theoretical framework, have been cross-
referenced with articles addressing the same issue. We have throughout the thesis,
questioned the credibility of the data from secondary sources since it may have been
manipulated to suit its context.
The secondary data that has been used in this report is made up by academic articles
and journals. Academic books have also been used. The reason that this type of
secondary data has been used was to get a broader view and to look outside the
company to gain inspiration from the academic world.
We have chosen to not use company internal sources because the data is confidential
and limited to Sandvik Tooling employees. Since further study might be done within
this field, but within Sandvik Tooling’s walls, we have chosen to not use these
sources. Media articles regarding Sandvik Tooling were not of interest for this report
because we had insight into the company and access to people working with our topic
in practice. We decided that Sandvik Tooling related information would best be
obtained internally.
2.4 Validity and Reliability
The empirical data has to meet two requirements despite the nature of the data. The
first one is validity and the other one is reliability. Validity means that the empirical
data has to be both relevant and valid; meaning measuring the data that is of value for
40 Jacobsen, D. I. (2002), p. 153.

The Future of ABC at Sandvik Tooling
20
the author. Reliability aims to explain whether the empirical data is reliable and
credible.41
Throughout our thesis, we have had check points with the information providers at
Sandvik Tooling concerning our empirical findings. This was done in order to ensure
validity for our readers. Several information providers have read the report at
different times in order to assure that our empirical findings have evolved correctly.
This was especially relevant since we have mapped the process of calculating
standard cost; a very detailed series of steps. We also questioned our findings
regularly in order to assure that the data corresponded with the thesis’ problem and
purpose.
Reliability is a prerequisite in order to achieve validity.42 During interviews it is
common that the information provider is affected and influenced by the interviewer.43
We felt that this phenomenon may have an affect on the end result; rendering it
distorted. We have encouraged the information providers to answer freely with open
questions. The information providers have also been given time to prepare with
questions that have been dispatched in advance. We have also let the information
provider read drafts of the thesis in order to verify the contents.
41 Jacobsen, D. I. (2002), p. 21. 42 Lundahl, U. and Skärvad, P-H.(1999) , p. 152. 43 Jacobsen, D. I. (2002), p. 269- 271.

The Future of ABC at Sandvik Tooling
21
3 Theoretical Framework
This chapter will present the academic theories in order to help address the thesis’s
issue and to fulfill the purpose. As presented in the initial chapter, the link between
ABC and information systems will be addressed in order to seek possible means for
achieving cost performance improvement. The theoretical framework will be made up
by a triangulation between ABC, and academic theories regarding transactions and
technical solutions for information systems.
3.1 Introduction to Theoretical Framework
In order to analyze the true cost of manufacturing, the ABC model will be presented.
This chapter will include background with the traditional cost allocation model to
provide the readers with an insight into the strengths and weaknesses of the ABC
model for the upcoming chapters of the thesis. Because the assignment required a
study of ABC process at Sandvik Tooling, it was deemed necessary to present how an
ABC model might be designed according to academic theory. This will provide
adequate information of how the process of allocating costs might be designed in
practice, and furthermore, provide data for comparing theory with practice. ABC at
Sandvik Tooling is part of the calculation of standard cost and, therefore, a section
about Activity Based Budgeting (ABB) will be presented. ABB is a way to ensure an
increase in the accuracy of presenting costs44, which coincides with the standard cost
process at Sandvik Tooling.
It was considered interesting to look at manufacturing costs from a transaction
perspective and to see if it could be linked to activities. An additional reason for
looking at costs from this point of view was to see if a pattern for determining why
manufacturing costs occur could be found. The fact that transactions are an exchange
in information lead to believe that there might be a link between information systems
and the flow of information or transactions. It was also believed that this academic
theory could help to develop a model of information system evaluation.
Academic theories to support the link between ABC, transactions, and technical
solutions regarding information system handling will be presented. This is done in
order to prove a link between ABC, transactions and information systems, and with
an optimized link between the three areas performance improvement could be
achieved.
44 Cooper, Robin and Kaplan, Robert S. “The Promise – and Peril – of Integrated Cost
Systems” (1998), p. 1-7.

The Future of ABC at Sandvik Tooling
22
The technical solutions and information system related theories are presented in order
to see how informational hierarchies can be designed. This will lead to a discussion
whether the information at a given level is adequate or abundant for its purpose. This
hierarchy of activities/information of the information system and cost model will help
to decide the level of detail necessary for the information system. As part of the
discussion regarding technical solutions, the ISA95 standard will be presented
because of its ability to declare activities significant for decision making within the
functional hierarchy levels45. It is therefore of interest to see how well an information
system environment copes with the demands from the ABC model. This will make up
a foundation for designing a model of evaluating information systems from a cost
perspective. The study of ABC, transactions costs and information systems is done to
bring additional input to the development of an evaluation model. The transaction
analysis will further help the discussion whether one information system or several is
the optimal case. Transactions could make it possible to see where there is a
redundancy in transactions/activities/information.
The theoretical framework for this thesis will be constituted by a triangulation
between academic theories regarding ABC, transactions and technical solutions
through information systems (Figure 3.1). The theoretical framework will be
illustrated by the circles and show how the theoretical field has been narrowed down
to the chosen topic for the thesis (Figure 3.2, Figure 3.5 and Figure 3.6). At the end of
this chapter, a summation of the theoretical framework will be presented (Figure 3.8).
Figure 3.1 The theoretical framework making up the thesis.
45 ISA-95.00.01-2000 “Enterprise-Control System Integration, Part 1: Models and
Terminology” (2000).
ABC Trans- actions
Technical Solution

The Future of ABC at Sandvik Tooling
23
3.2 Activity Based Costing
Figure 3.2 The theoretical framework in terms of ABC.
Cost accounting models have, throughout time, provided managers with cost
information upon which important decisions can be made.46 These decisions could be
made regarding long-term strategic decisions concerning service or production mix,
the lowering of prices, sourcing issues, and make or buy options.47
The traditional cost account model – allocating resources and costs by the base direct
labor (hours or dollars) and direct material48 – were introduced when direct costs,
such as labor, still made up a large part of a company’s manufacturing cost. The
model has since then become out-of-date, and managers within multiple product
assortment companies are facing problems with having distorted cost information.
The increase in overhead costs have resulted in that only a fraction of the total
manufacturing cost is made up by direct labor.49
In the middle of the 1980’s, a new cost accounting model, by the name Activity Based
Costing (ABC), was introduced. This model offered an alternate and more accurate
way of allocating costs;50 especially for companies facing the problem with rising
overhead costs. The theory behind the ABC model is that all the activities within a
company exist to support the product.51 The ABC model aims to show the amount of
overhead resource consumed, as well as how much unused capacity costs.52
46 Cooper, R. and Kaplan, R. S. (1988), p. 1. 47 Forrest, E. (1996), p. 298. 48 Ainsworth, P. (1995), p. 1. 49 Cooper, R. and Kaplan, R. S. (1988), p. 1. 50 Raab, Carola and Mayer, Karl J. “Exploring the Use of Activity Based Costing in the
Restaurant Industry” (2004), p. 85. 51 Cooper, R. and Kaplan, R. S. (1988), p. 1-2. 52 Raab, C. and Mayer, K. J. (2004), p. 85.
ABC

The Future of ABC at Sandvik Tooling
24
3.2.1 Designing ABC
The outlay of an ABC cost accounting model is made up by three guidelines. The first
rule is to focus on costly resources, meaning finding the resources where the new cost
system or method could have a vast impact. For example, if a company whose total
manufacturing cost is mainly made up by factory costs, the focus will be on trying to
trace manufacturing overhead to products.53
The second and third rule put together aims to find the resources that are distorted
under the traditional cost account system. These resources are uncorrelated with the
traditional cost allocation basis – direct labor and direct material. An additional
question to ask oneself is which consequences affect the cost structure once the
company increases its assortment, as well as makes it more diversified, or increases
its customer base, market channels or the processing technology.54
The ABC model is made up by two steps.55
The first step is to allocate cost of
resources to activities, and in the second step costs are further allocated to the
product.56 The process for allocating cost of resource to activities is made by resource
cost drivers. The next step, allocating cost of activity to product, is made by activity
cost drivers.57 In order to make it possible to separate the two allocation processes,
the allocation base in the first step is referred to as resource cost driver and in the
second step activity cost driver. The hierarchy in the model is done to avoid
unnecessary cost allocations (Figure 3.3).58
53 Cooper, R. and Kaplan, R. S. (1988), p. 3, 5-6. 54 Ibid. 55 Raab, C. and Mayer, K. J. (2004), p. 81. 56 Thyssen, Jesper, Israelsen, Poul and Jorgensen, Brian “Activity-based costing as a method
for assessing the economics of modularization – A case study and beyond” (2006), p.3-4. 57 Higgins, Brian K. and Young, S. Mark “Improving operations: Not as simple as ABC”
(2001), p. 19. 58 Thyssen, J., Israelsen, P.l and Jorgensen, B. (2006), p.3-4.

The Future of ABC at Sandvik Tooling
25
Figure 3.359
Illustration of the flow of Activity Based Costing (ABC).
Designing an ABC cost model also requires the accurate gathering of information
regarding direct material and direct labor, as well as the insight that cost allocation
cannot be done with flawless accuracy. The accuracy may have to make room for
complexity, since an increase in accuracy often generates a large number of cost
drivers,60 which renders high complexity.61
There are also two cost types that should not be included in the ABC cost allocation
model; parts of the Resource and Development (R&D) costs and the costs of excess
capacity. The R&D costs can be divided in two parts, R&D costs related to
modification and improvements of existing products and lines and R&D cost related
to entirely new products. R&D costs related to modification and improvements of
existing products and lines are R&D costs allocated to the product in mind and are to
be allocated to the product. The second R&D category – R&D cost related to entirely
new products are related to development and should not to be included in the ABC
cost allocation model.62
The cost of excess capacity should not be included in the ABC allocation model, and
should furthermore not be linked to individual products. Say for example a plant’s
total annual cost is 5 million dollars and the full capacity is 1 million products; the
ABC cost will then be 5 dollars per product (5 million dollars divided by 1 million
products). But if the following year’s manufacturing turns out to be worse and the
volumes only exceed to 500,000 products, the ABC cost per product would be 10
dollars. The products will then be hit with a different ABC cost because of the change
in volume, even though the capacity of the machines and workers has not changed. 59 Cooper, R. and Kaplan, R. S. (1998), p. 6. 60 Homburg, Carsten “A note on optimal cost driver selection in ABC” (2001), p. 1. 61 Anderson, S. R. and Kaplan, R. S. (2004), p. 1-7. 62 Cooper, R. and Kaplan, R. S. (1988), p. 3, 5-6.
Product 2
Activity Based Costing
Resources
Activities
Resource Cost Driver
Activity Cost Drivers
Product 3 Product 1

The Future of ABC at Sandvik Tooling
26
Allocating cost to a product in this way will generate a fluctuating ABC cost, which
may lead to a negative spiral. The cost system reports a higher cost, which encourages
the managers to increase the price. The change in price will generate a decrease in
demand and this will render a volume drop, which once again will lead to an increase
in the ABC cost.63
3.2.2 The Conceptual Framework of ABC
Activity: An activity is a procedure or process that allows work to be carried out. All
activities consume resources. ABC shows activities which are being performed along
with the cause and whereabouts. The consumption of resources can then be related to
activities and also services and products.64
Activity Cost Driver: The Activity Cost Driver measures how much of the activity
the product has consumed.65 The activity cost driver generates an activity cost driver
rate, which is used for allocating the costs to the product. The activity cost driver is
calculated by the total cost of activity divided by the unit volume for the activity cost
driver.66
Resource Cost Driver: The resource cost driver is the percentage generated by the
cost of resource consumed for the activity. Say you have two activities and the cost of
resource is 1,000,000 dollars. The resource cost driver is then the percentage used for
splitting the cost of resource and allocating the costs to the activities. Assume the cost
of resource is to be spilt 50-50 between the two activities; the resource cost driver will
be the two percentages 50 percent and 50 percent.67
3.2.3 Activity Based Budgeting – Operational Control
Activity Based Budgeting (ABB) allows managers to determine a resource’s future
supply and practical capacity. The resource’s budgeted expenses and quantity can
then be used as feedback to the operational control system, which has information
regarding actual spending in opposition to the budget.68 ABB has the purpose of
linking budgets and activities. A strong link is important because adjustments can be
made if a fluctuation in demand were to come. 69 An integrated system makes ABB
possible for managers from a practical point of view. As pointed out by
63 Cooper, R. and Kaplan, R. S. (1988), p. 5-6. 64 Forrest, E. (1996), p. 300. 65 Raab, C. and Mayer, K. J. (2004), p. 85. 66 Higgins, B. K. and Young, S. M. (2001), p. 19. 67 Ibid., p. 19. 68 Cooper, R. and Kaplan, R. S. (1998), p. 1-7. 69 Serritzlew, Sören “Lining Budget to Activity: A Test of the Effect of Output-Purchase
Budgeting” (2006), p. 101-120.
The Future of ABC at Sandvik Tooling
27
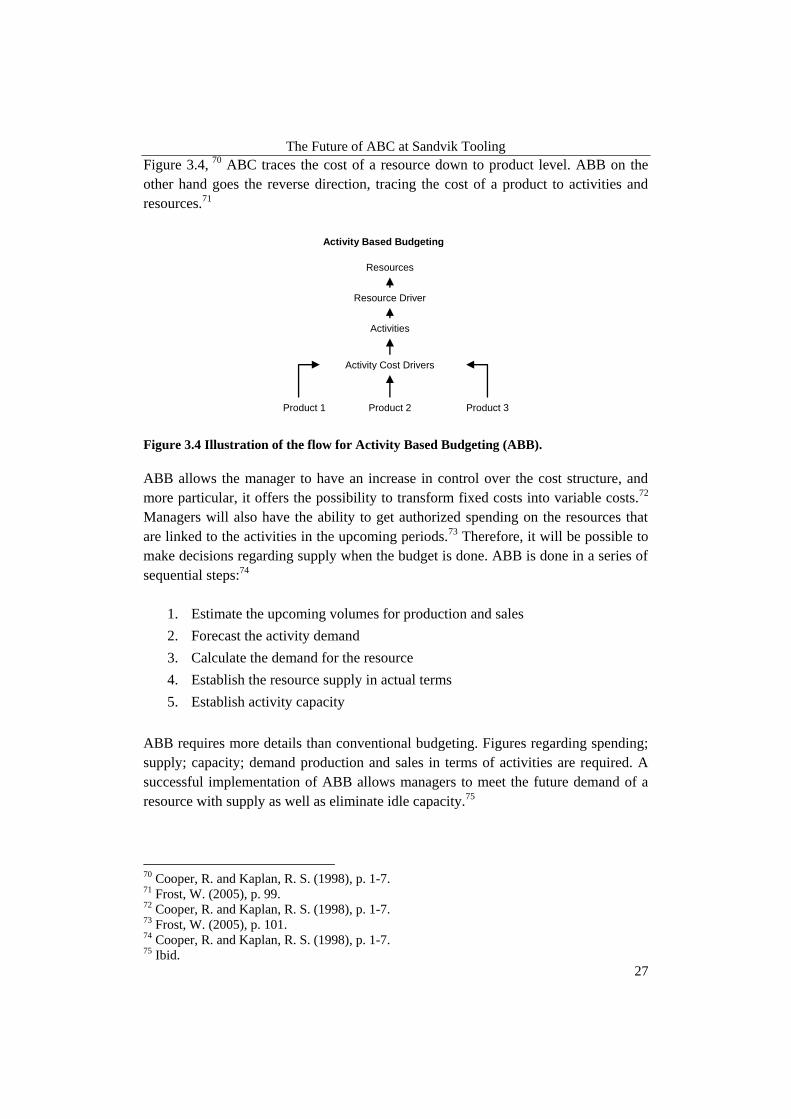
Figure 3.4, 70 ABC traces the cost of a resource down to product level. ABB on the
other hand goes the reverse direction, tracing the cost of a product to activities and
resources.71
Figure 3.4 Illustration of the flow for Activity Based Budgeting (ABB).
ABB allows the manager to have an increase in control over the cost structure, and
more particular, it offers the possibility to transform fixed costs into variable costs.72
Managers will also have the ability to get authorized spending on the resources that
are linked to the activities in the upcoming periods.73 Therefore, it will be possible to
make decisions regarding supply when the budget is done. ABB is done in a series of
sequential steps:74
1. Estimate the upcoming volumes for production and sales
2. Forecast the activity demand
3. Calculate the demand for the resource
4. Establish the resource supply in actual terms
5. Establish activity capacity
ABB requires more details than conventional budgeting. Figures regarding spending;
supply; capacity; demand production and sales in terms of activities are required. A
successful implementation of ABB allows managers to meet the future demand of a
resource with supply as well as eliminate idle capacity.75
70 Cooper, R. and Kaplan, R. S. (1998), p. 1-7. 71 Frost, W. (2005), p. 99. 72 Cooper, R. and Kaplan, R. S. (1998), p. 1-7. 73 Frost, W. (2005), p. 101. 74 Cooper, R. and Kaplan, R. S. (1998), p. 1-7. 75 Ibid.
Activity Based Budgeting
Resources
Activities
Resource Driver
Activity Cost Drivers
Product 2 Product 3 Product 1

The Future of ABC at Sandvik Tooling
28
3.2.4 Time-Driven ABC
There is an alternative to performing ABC the traditional way and it does not require
a total abandonment of the model. It is rather a simplified version of the ABC model,
called Time-Driven ABC (TDABC).76 The TDABC model is a method for
overcoming the costs for implementing and maintaining the traditional ABC model.77
With this approach, the manager estimates the resources that a product, a transaction,
or a customer might demand as opposed to splitting resource cost into activities,
followed by customers or products.78
TDABC requires two parameters for each resource; supplying capacity in terms of
cost per time unit and consumption of capacity by product, service and customer in
terms of unit time. An alternate unit of measures than time could for example be cost
per cubic meter. The TDABC allows the user to use time-equations and the
information for the equations can easily be imported from an ERP system. This
makes the model easy to maintain and update.79 The job left for the managers are not
to survey how much time an employee spends on different tasks, but it is rather a job
of estimating the practical capacity of resource supplied in putting it in relation to
theoretical capacity.80
The process of determining TDABC can be illustrated by the following example
(Table 3.1). Say that a company has a customer service department consisting of 28
employees. One person has a theoretical capacity of supplying 31,680 minutes a
quarter, assuming the person works 8 hours a day and 22 days a month (8 hours
multiplied by 22 days and multiplied by 60 minutes renders 10,560 minutes a month.
Multiplied by 3 months; 31,680 minutes a quarter). Practical capacity would then be
80percent to 85 percent (an estimation considered as a rule of thumb for the model) of
the theoretical capacity. The common way of estimating a person’s practical capacity
is to set it as 80 percent of the theoretical capacity, and as for a machine’s practical
capacity it will be 85 percent of the theoretical capacity. This renders approximately
25,000 minutes a quarter (or 700,000 minutes in total for the entire department), in
practical capacity supplied from this person. The cost of capacity supplied – the
overhead cost – can then be divided by the unit of practical capacity in order to obtain
the cost per minute when supplying capacity. If overhead cost would for example
76 Anderson, S. R. and Kaplan, R. S. (2004), p. 1-7. 77 Varíla, Mikko, Seppänen, Marko and Suomala, Petri “Detailed cost modeling: a case study
in warehouse logistic” (2007), p. 187-188. 78 Anderson, S. R. and Kaplan, R. S. (2004), p. 1-7. 79 Varíla, M., Seppänen, M. and Suomala, P. (2007), p. 187-188. 80 Anderson, S. R. and Kaplan, R. S. (2004), p. 1-7.
The Future of ABC at Sandvik Tooling
29
amount to 560000 dollars, and divided by 700,000 minutes, then this would render a
rate of 0.8 dollars per minute for supplying capacity.81
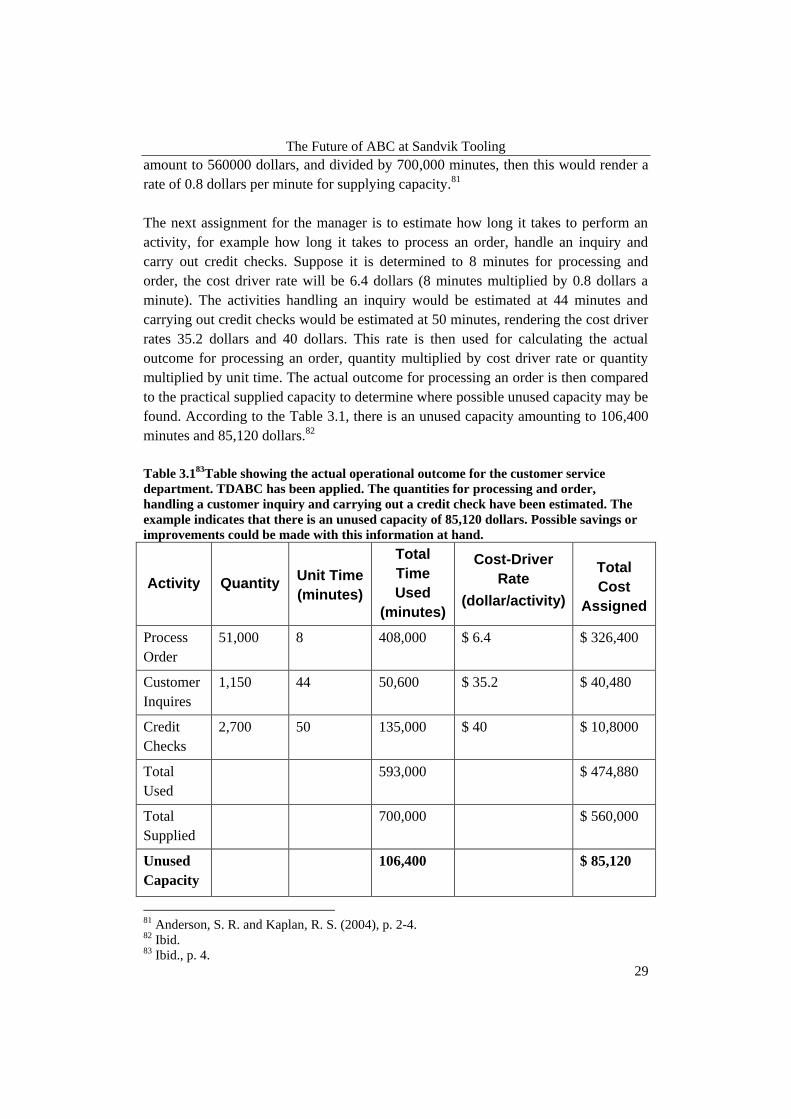
The next assignment for the manager is to estimate how long it takes to perform an
activity, for example how long it takes to process an order, handle an inquiry and
carry out credit checks. Suppose it is determined to 8 minutes for processing and
order, the cost driver rate will be 6.4 dollars (8 minutes multiplied by 0.8 dollars a
minute). The activities handling an inquiry would be estimated at 44 minutes and
carrying out credit checks would be estimated at 50 minutes, rendering the cost driver
rates 35.2 dollars and 40 dollars. This rate is then used for calculating the actual
outcome for processing an order, quantity multiplied by cost driver rate or quantity
multiplied by unit time. The actual outcome for processing an order is then compared
to the practical supplied capacity to determine where possible unused capacity may be
found. According to the Table 3.1, there is an unused capacity amounting to 106,400
minutes and 85,120 dollars.82
Table 3.183
Table showing the actual operational outcome for the customer service
department. TDABC has been applied. The quantities for processing and order,
handling a customer inquiry and carrying out a credit check have been estimated. The
example indicates that there is an unused capacity of 85,120 dollars. Possible savings or
improvements could be made with this information at hand.
Activity Quantity Unit Time
(minutes)
Total
Time
Used
(minutes)
Cost-Driver
Rate
(dollar/activity)
Total
Cost
Assigned
Process
Order
51,000 8 408,000 $ 6.4 $ 326,400
Customer
Inquires
1,150 44 50,600 $ 35.2 $ 40,480
Credit
Checks
2,700 50 135,000 $ 40 $ 10,8000
Total
Used
593,000 $ 474,880
Total
Supplied
700,000 $ 560,000
Unused
Capacity
106,400
$ 85,120
81 Anderson, S. R. and Kaplan, R. S. (2004), p. 2-4. 82 Ibid. 83 Ibid., p. 4.
The Future of ABC at Sandvik Tooling
30
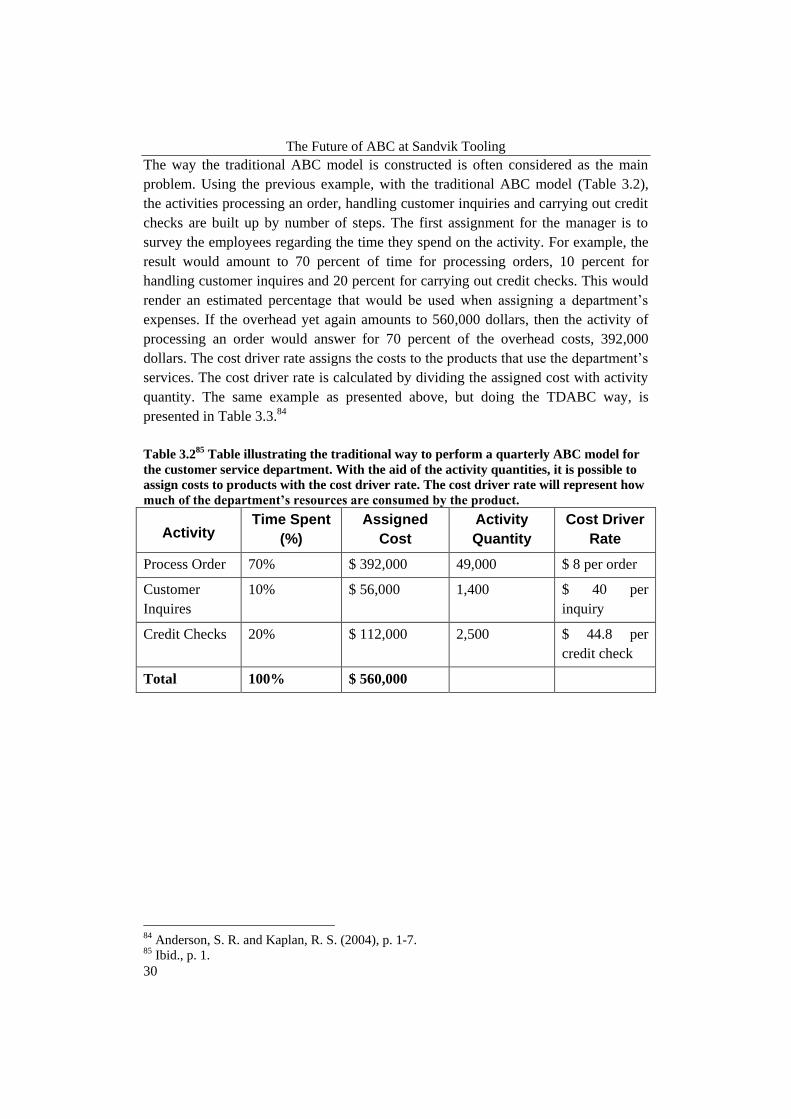
The way the traditional ABC model is constructed is often considered as the main
problem. Using the previous example, with the traditional ABC model (Table 3.2),
the activities processing an order, handling customer inquiries and carrying out credit
checks are built up by number of steps. The first assignment for the manager is to
survey the employees regarding the time they spend on the activity. For example, the
result would amount to 70 percent of time for processing orders, 10 percent for
handling customer inquires and 20 percent for carrying out credit checks. This would
render an estimated percentage that would be used when assigning a department’s
expenses. If the overhead yet again amounts to 560,000 dollars, then the activity of
processing an order would answer for 70 percent of the overhead costs, 392,000
dollars. The cost driver rate assigns the costs to the products that use the department’s
services. The cost driver rate is calculated by dividing the assigned cost with activity
quantity. The same example as presented above, but doing the TDABC way, is
presented in Table 3.3.84
Table 3.285
Table illustrating the traditional way to perform a quarterly ABC model for
the customer service department. With the aid of the activity quantities, it is possible to
assign costs to products with the cost driver rate. The cost driver rate will represent how
much of the department’s resources are consumed by the product.
Activity Time Spent
(%)
Assigned
Cost
Activity
Quantity
Cost Driver
Rate
Process Order 70% $ 392,000 49,000 $ 8 per order
Customer
Inquires
10% $ 56,000 1,400 $ 40 per
inquiry
Credit Checks 20% $ 112,000 2,500 $ 44.8 per
credit check
Total 100% $ 560,000
84 Anderson, S. R. and Kaplan, R. S. (2004), p. 1-7. 85 Ibid., p. 1.
The Future of ABC at Sandvik Tooling
31
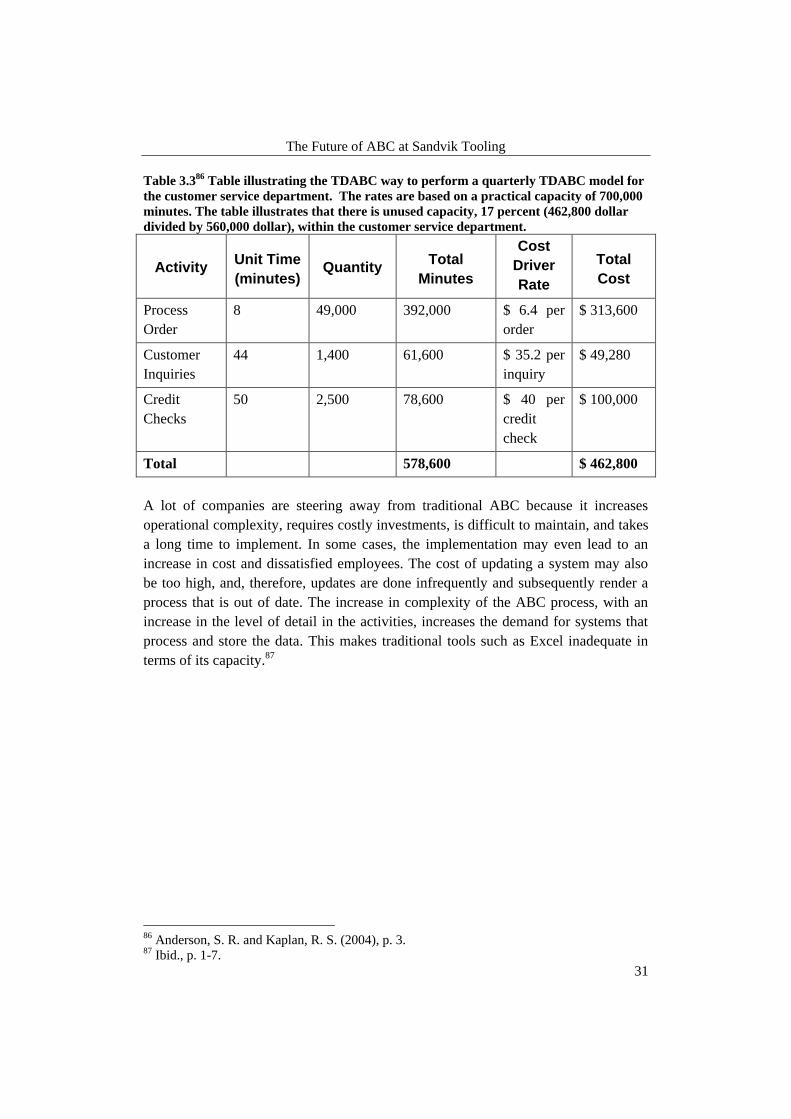
Table 3.3
86 Table illustrating the TDABC way to perform a quarterly TDABC model for
the customer service department. The rates are based on a practical capacity of 700,000
minutes. The table illustrates that there is unused capacity, 17 percent (462,800 dollar
divided by 560,000 dollar), within the customer service department.
Activity Unit Time
(minutes) Quantity
Total
Minutes
Cost
Driver
Rate
Total
Cost
Process
Order
8 49,000 392,000 $ 6.4 per
order
$ 313,600
Customer
Inquiries
44 1,400 61,600 $ 35.2 per
inquiry
$ 49,280
Credit
Checks
50 2,500 78,600 $ 40 per
credit
check
$ 100,000
Total 578,600 $ 462,800
A lot of companies are steering away from traditional ABC because it increases
operational complexity, requires costly investments, is difficult to maintain, and takes
a long time to implement. In some cases, the implementation may even lead to an
increase in cost and dissatisfied employees. The cost of updating a system may also
be too high, and, therefore, updates are done infrequently and subsequently render a
process that is out of date. The increase in complexity of the ABC process, with an
increase in the level of detail in the activities, increases the demand for systems that
process and store the data. This makes traditional tools such as Excel inadequate in
terms of its capacity.87
86 Anderson, S. R. and Kaplan, R. S. (2004), p. 3. 87 Ibid., p. 1-7.

The Future of ABC at Sandvik Tooling
32
3.3 Focusing on Transactions
Figure 3.5 The theoretical framework narrowed down to ABC and Transactions.
Manufacturing is responsible for the largest sum of overhead costs;88 being driven by
transactions.89 A transaction is defined as an exchange of information and/or material
that is required to push production along; a process not necessarily resulting in a
physical product. It is rather a gathering of the entire product that is offered to the
customer, meaning the total transactions that a responsible for quality, variety, on-
time delivery and superior design.90 The transactions that cause costs to occur are
closely linked to how complex the plant’s operations are. The complexity of a plant is
said to increase when the number of products increases.91
Conquering overhead cost is a constant battle for manufacturing managers,92 but
understanding the transactions related to resource consumption may help to identify
the area for cost reduction as well as product and process improvement.93 Profitability
and competitiveness are closely linked with manufacturing overhead and if it is of a
substantial amount, the impact may be great. Furthermore, managers have to be
equipped to manage the costs they are held responsible for in an effective manner.
Today, productivity is more likely to be achieved by a manager if overhead is cut as
an alternative for direct labor.94
Managers tackle the problem of controlling overhead costs and what causes them to
occur. Direct material and direct labor, and what drives them, is easier to grasp but
88 Miller, J. G. and Vollman, T. E. (1985), p. 1-5. 89 Banker, Rajiv D., Potter, Gordon and Schroeder, Roger G. “An empirical analysis of
manufacturing overhead cost drivers” (1995), p. 1. 90 Miller, J. G. and Vollman, T. E. (1985), p. 1-5. 91 Banker, R. D., Potter, G. and Schroeder, R. G. (1995), p. 2. 92 Miller, J. G. and Vollman, T. E. (1985), p. 1-5. 93 Johnson, Thomas H. “Activity-Based Information: A blueprint for World-Class
Management Accounting” (1988), p. 23-31. 94 Miller, J. G. and Vollman, T. E. (1985), p. 1-5.
ABC Trans-
actions

The Future of ABC at Sandvik Tooling
33
what drives the overhead costs is more complicated. Models regarding this problem
exist, but they explain how costs are allocated rather than explaining how they
actually occur. The bill of material, for example, relates the costs in terms of number
of products produced. Unit output does normally correlate with overhead costs, but it
is important to bear in mind that unit outputs may not always render overhead costs.
This may lead to a distorted focus among managers when it comes to determining
activities that cause overhead; focusing on measures regarding direct labor or
output.95
Increasing productivity through automation has led to a decrease in labor costs, but an
increase in overhead costs.96 Maintaining and supporting automated equipment also
renders an increase in overhead costs. Automation is the most commonly
acknowledged way to reduce transaction costs. Transactions can be automated with
the aid of integrated systems that only require information to be entered a single time.
Although, having “sub-systems” is a common scene, it often renders a surplus in
transactions. With integrated systems, it is possible to increase effectiveness, improve
understanding and accuracy. Having the same information at different organizational
levels may result in transactions that are superfluous. A computer system that is
successfully implemented should result in having transactions occur only once. The
management of overhead costs can be done effectively in the following steps:97
1. Analyze transactions to see which are necessary and then improve the way
they are carried out
2. Increase operational stability
3. Rely on automation, as well as the integration of systems
If, in fact, overhead costs are driven by transactions, then managers must take control
of the key transactions. These should be evaluated in terms of whether or not they are
suitable or if they could be carried out more effectively. Improving transaction cost
derived from overhead can also be done by adjusting the detail of the data reported
into the systems. The data could then be evaluated on how fine and frequent it is.
Abundant data is not necessary.98
95 Miller, J. G. and Vollman, T. E. (1985), p. 1-5. 96 Daing N. I. and Ruhanita M. (2007), p. 113. 97 Miller, J. G. and Vollman, T. E. (1985), p. 1-5. 98 Ibid., p. 1-5.

The Future of ABC at Sandvik Tooling
34
3.4 Technical Solution
Figure 3.6 The theoretical framework narrowed down to ABC, Transactions and
Technical Solution.
One of the great perils when implementing an ABC system is finding the appropriate
cost drivers to allocate the activity cost to products.99 An Enterprise Resource
Planning (ERP) system is an information system used for planning the resources
needed to make, ship, as well as account for a customer order. An ERP system allows
information to flow between different business functions and offers a structure when
building a database of the necessary data for performing the business operations and
decision making.100
An ERP system can help with increasing the information regarding the cost drivers’
reliability and availability. A popular feature is the integration of functions, such as
cost and management accounting, materials management and production planning.
The relational data allows functions to share information without duplicating it.101
Manufacturing Execution System (MES) is implemented to support a company’s
production process. It is furthermore used to close the gap between the ERP system
and the lower system levels, for example, those addressing equipment control. MES
could provide information between the higher level systems and lower level systems
and act as means for decision making between the two. (The term operational control
system, as discussed in Chapter 3.4 Technical Solution, is regarded as the same MES
by the authors of the thesis)102
99 Baxendale, Sidney J. and Jama Farah ”What ERP Can Offer” (2003), p. 54-57. 100 Singh, Mohini and Waddel Di E-Business Innovation and Change Management (2004), p.
121. 101 Baxendale, S. J. and Jama F. (2003), p. 54-57. 102 Chung, Sheng-Luen and Jeng MuDer ”Manufacturing Execution System (MES) for
Semiconductor Manufacturing” (2002), p. 1.
ABC Trans-
actions
Technical Solution

The Future of ABC at Sandvik Tooling
35
3.4.1 ISA95103
The ISA95 standard is made up of a set of standards. Part 1 of the standard provides
standard terminology and models describing the interface between enterprise
activities and control activities. With the aid of standardized terminology, and a
consistent number of models and concepts aiming to integrate control systems and
business systems, an increase in communication can be obtained. The outcome
rendered from this optimization may lead to the reduction of costs.
The standard defines a hierarchical model, consisting of three, different levels of
decision making (Figure 3.7). The levels within the model are: Business Planning and
Logistics, Manufacturing Operations and Control, Batch Control, Continuous
Control and Discrete Control. The interface between business planning and logistics
and manufacturing operations is the focus of this standard. The interface is normally
the link between plant production and scheduling and operation management, as well
as plant floor coordination. Each level includes a number of activities.
Figure 3.7 Illustration of the hierarchical model.
Enterprise systems and control systems have to inter-operate and integrate. The
standard may therefore be used upon the implementation of new product offerings.
The objective is to reduce cost, risk and other factors related to implementation.
103 ISA-95.00.01-2000 (2000).
Business Planning and Logistics
Manufacturing Operations and Control
Continuous Control
Discrete Control
Batch Control
Level 4
Level 3
Level 2, 1, 0

The Future of ABC at Sandvik Tooling
36
3.4.2 Linking ABC to systems104
Today’s executives have a countless number of sources concerning cost and financial
information. Operational control systems and ABC systems have different functions
and are separated for good reasons. Operational control systems offer financial
feedback regarding process effectiveness. An ABC system, on the other hand, offers a
view on customer and product profitability, as well as areas where possible
improvements can be made. It is important to acknowledge that the two systems have
different purposes, provide different information and are different in terms of
requirements regarding timeliness and accuracy. Integrating these two systems can
only be done partially and it must be done thoroughly. An unsuccessful integration
may result in a single system that cannot execute neither system’s operation. The
systems should interact with each other and trade information about efficiency and
the use of capacity.
Operational control systems work in accordance with efforts to achieve continuous
improvements. Data must, therefore, be accurate and timely, as well as traceable to a
work group. A system tends to incorporate non–financial information such as scrap,
defects and cycle time. These are recorded on a daily basis and on batch level to offer
employees the necessary feedback on how efficient the process is. The operational
systems accumulate some financial information, regarding cost of the resources that
are used within the process. These resources include material, people, energy, and
machines.
ABC systems offer the managers a strategic overview of the business. The system
allows costs to be traced from resources, for example machines, to processes and
activities and then further on to a service, a product or a customer. The gathered cost
of resources can then be included in the overall strategic cost of customers and
products. This offers an insight into the organizational hierarchy and profitability at
different levels.
104 Cooper, R. and Kaplan, R. S. (1998), p. 1-7.

The Future of ABC at Sandvik Tooling
37
3.4.3 Measuring Systems105
The integration of cost and performance measurement systems, from a financial point
of view, can be done in a four-stage model. The four stages building up the model
are:
1. Stage I Systems – Inadequate for Financial Reporting
2. Stage II Systems – Financial Reporting-driven
3. Stage III Systems – Specialized
4. Stage IV Systems – Integrated
Most companies have systems characterized by Stage II Systems, but some
company’s systems can still be classified as not working, in other words Stage I
Systems. These companies can easily acquire and install an ERP system taking them
to the next stage. The first step using the model is to identify at what stage the
systems is located before it can be taken to the next stage.
The most characterizing feature for Stage I Systems is inadequacy in terms of
financial reporting. The systems, with inferior internal actions for recording
transactions, either have transactions recorded incorrectly or not recorded at all. Stage
I Systems are also characterized by letting the allocation of overhead cost be done
with incorrect algorithms.
The Stage I Systems are often found in newly emerging companies that lack the time
and resources to upgrade their financial systems, or mature companies that have
continued to use their so called legacy systems. A system installed a decade ago is
based on obsolete technology and is nearly impossible to maintain, there are
undocumented updates and changes that together have resulted in a system where no
one understands the logic of the system along with the fact that the designers of the
system have left the company years ago. Even so, the system cannot be eliminated
since it is the only system keeping track of the financial transactions. The Stage I
Systems can also exist in industries that once had adequate systems for financial
reporting, but over the years has become inadequate as a result of acquisitions.
The characteristics for Stage I Systems can be summarized as:
1. Requiring an extensive amount of resources and time to consolidate reporting
units within the company and to close the books
2. The occurrence of unexpected variances when reconciling physical inventory
against book values
105 Cooper, R. and Kaplan, R. S. (1998), p. 11-24, 286.

The Future of ABC at Sandvik Tooling
38
3. Having large inventory write downs after external and internal audits
4. Having several postclosing adjustments done to the financial accounts
5. Lacking auditability and integrity
The Stage II Systems, compared to Stage I Systems, are adequate for financial
reporting, but not for allocating costs to products. Overhead cost and other indirect
cost to products may be aggregate on a financial account level, but faults occurring at
product-unit level eliminate each other and make the system inadequate for cost
allocation. Many of the Stage II Systems are also still using direct labor as a base for
cost allocation. A base for overhead cost allocation that made sense 50-80 years ago,
when direct labor was still a high fraction of total manufacturing costs.
Today many companies with Stage II Systems have tried to update their systems by
adding machine hours as a new base for allocating overhead cost or creating a cost
pool, where overhead costs are collected and allocated by a percentage markup. Some
companies have also defined additional cost centers to match the increased diversity
of machines and production processes in their plant. Despite these improvements, the
underlying economics of companies with diverse customers, multiple products and
complex processes are still not being reflected. The assumption made when using
additional bases is that overhead cost varies with volume or number of units, and not
by a wide selection of products the plant has capacity to produce.
Another flaw within Stage II Systems is the way the systems only allocate factory
cost and other manufacturing cost to the product. Other costs such as selling,
marketing, distribution, and R&D are not being assigned to a cost object. This way of
allocating cost is, however, adequate for financial reporting, but not for decision
making. The Stage II Systems’ structure build for supporting financial reporting also
hinders a company’s continuous learning and improvement by not supplying
managers and employees with the accurate information and feedback.
Stage II Systems characteristics are summarized by:
1. The systems fulfill requirements for financial reporting
2. The costs for Stage II Systems are collected by responsibility centers and not
by business processes and activities
3. Stage II Systems report distorted product and customer costs. Some Stage II
Systems do not have customer cost at all
4. Feedback to employees and managers are provided by Stage II Systems, but
the feedback is reported too late and is too financial

The Future of ABC at Sandvik Tooling
39
Stage III Systems are made up of three different financial systems. One is the
traditional financial system, classified as Stage II Systems. Two is an activity based
cost system collecting data from both the traditional financial systems and from other
information systems to measure the costs of products, processes and activities more
accurately. The third system making up Stage III Systems is an operational feedback
system, supplying employees with accurate, financial and non–financial, timely,
information. Both the ABC system and the operational feedback system collect data
from Stage II Systems and, therefore, the leap going from Stage II Systems to Stage
III Systems does not have to be costly when investing in new computer hardware and
software.
The one thing to keep in mind when developing Stage III Systems is that ABC and
operational feedback systems differs in the level of detail and reporting. For example,
an ABC system generates feedback of the resource demands by product, customer
and service, and not how the demands are met. This feedback on effectiveness is
generated from the operational feedback system. Therefore, two systems are
recommended to be developed, one that meets the requirements for an ABC system
and one for operational feedback, not a combined system.
The fourth and final stage is the Stage IV Systems, constituted by both concepts,
theory, data, and information supplied by Stage I-III Systems. The Stage IV Systems
are also characterized by an integrated ABC and operational feedback system
providing the foundation for external financial statements, but also designed to
provide a foundation for maximizing the benefits for decision-making both for
managers and employees.
The Stage IV Systems is the final stage in reaching the full potential of cost
management. It can, therefore, be tempting for companies to skip one or more steps.
An action not to be recommended since the success of reaching full potential is based
on knowledge retrieved from all previously presented steps.

The Future of ABC at Sandvik Tooling
40
3.5 Summation of the Theoretical framework
The triangle at the crossing point of the three circles holds the summation of our
theoretical chapter. A summation of the academic theories is presented below in
(Figure 3.8). We have chosen to illustrate the overhead costs by the outer triangle.
The overhead costs are fed into three points of the triangle and go through a series of
steps in order to reach the product. The steps presented are, according to us, the most
important and significant when designing or developing a correct cost allocation
process.
Figure 3.8 Summation of the theoretical framework.
ABC Trans-
actions
Technical Solution
ABC
Technical Solution
Transactions
Product
Resource
Activity
Cost Driver
Key Transactions
Information Flow
Activity
System Environment
Unit of Measure
Data/Interface
Overhead Cost
Overhead Cost Overhead Cost

The Future of ABC at Sandvik Tooling
41
4 Empirical Foundation
This chapter presents Sandvik Tooling’s cost allocation process at two sites. The
subjects of the empirical study have been the manufacturing plant in Gimo, Sweden
and Mebane, the United States. The cost allocation process in total is presented in
order to illustrate for the readers how the ABC model, as part of the total process, is
used in practice. A mapping of the information systems used for the cost allocation
process is also presented.
4.1 Background
Sandvik is divided into three divisions; Sandvik Mining and Construction, Sandvik
Materials Technology and Sandvik Tooling. Sandvik Tooling is composed of a
number of independent brands specializing in metal cutting, super abrasive
components and wear parts. The products consist of cemented-carbide, high-speed
steel, cubic boron nitride, synthetic diamond and special ceramics. Sandvik has a total
of 42,000 employees and in part 15,000 belonging to Sandvik Tooling. The main
office is located in Sandviken, Sweden.106 The manufacturing layout for units
producing tools at the sites in Gimo and in Mebane are grouped by flow group.107
(See Appendix I for a theoretical definition of different manufacturing layouts.)
4.2 Introduction to ABC at Sandvik Tooling
The first ABC model within Sandvik Tooling was established in 1991 in Gimo,
Sweden. The model has since then been implemented worldwide, but in different
degrees. To date, ABC is not entirely used within the Sandvik Tooling
organization.108 The ABC model in Gimo and Mebane is used as part of the
calculation of the estimated cost of production of a piece/product to be manufactured,
Standard Produktionkostnad (Standard Pk).109
The Standard Pk is the method used by Sandvik Tooling to calculate the full cost of
production, including both indirect production costs and administration costs charged
to production.110 A Standard Pk is made up of three parts: direct material costs (Std
Pkmtrl), direct costs (Std Pkdirect) and ABC costs (Std PkABC). The three costs in total
make up the estimated cost of production for each product that is set to be
106 Sandvik AB, home page, http://www.sandvik.com, 012008. 107 Jacobsson, M. 012408./Kennedy, C. 031108. 108 Jacobsson, M. 011608. 109 Jacobsson, M. 011608./Kennedy, C. 031108. 110 Andersson, Karin, Head of Finance Department, Interview 020108.

The Future of ABC at Sandvik Tooling
42
manufactured (Equation 4.9 and Equation 4.20).111 The purpose of the Standard Pk is
to estimate the real costs of manufacturing as accurately as possible112, and to
compare the real cost of production against the budget.113
The cost allocation process to determine the Standard Pk consists of a series of steps,
starting out with the estimation of the budgeted cost of production.114 The process of
allocating ABC costs is part of a larger allocation model. The model starts out with
having a sum of budgeted costs that are split into cost groups. Initially, these costs are
not affected by ABC, but throughout the cost allocation process, some selected costs
will go through the Sandvik Tooling ABC model. The study of ABC at Sandvik
Tooling will, therefore, include their entire cost allocation process.115 Allocating costs
to the Standard Pk for the plant in Gimo and in Mebane is presented in detail in
Chapter 4.3 Mapping of ABC in Gimo and 4.4 Mapping of ABC in Mebane along with
an illustrated overview for each site in Figure 4.1 and Figure 4.6. The theoretical term
overhead cost is at Sandvik Tooling equal to the term indirect cost, and is therefore
throughout Chapter 4 Empirical Foundation and 5 Comparisons referred to as
indirect cost.
4.2.1 The Conceptual Framework of Sandvik Tooling
Allocation Key: Allocation Key is defined as the basis for splitting costs from one
location to another, such as Cost Center to Cost Center.116
Cost Center: A Cost Center is a location for collecting costs. The Cost Center can be
classified into three major types Direct Cost Center, Indirect Cost Center and ABC
Cost Center. All of these types are made up of several Cost Centers, holding detailed
information on how and to whom the costs are to be allocated. Throughout the thesis,
in the equations and tables, the Cost Center specification will be referred to as
CCtr.117
Cost Driver: A Cost Driver is defined as activity related to the production process.118
Flow Group Cost Center: A Flow Group Cost Center is defined as Cost Center that
is made up of a product or product family and not by machine type.119
111 Kennedy, C. 031908. 112 Lindberg, T. 031808. 113 Ibid. 020708. 114 Andersson, K. 020108./ Kennedy, C. 031108. 115 Gauffin,Veronica, Cost Accountant, Interview 012508. 116 Jacobsson, M. 042308. 117 Kennedy, C. 031408. 118 Giardino-Gray, Norma, Financial Manager Tooling Supply NAFTA, Interview 042908. 119 Ibid. 042808.

The Future of ABC at Sandvik Tooling
43
Indirect Cost: The term indirect cost is equal to the theoretical term overhead cost.
Rate: Rate is defined as the cost per Cost Driver unit. An example of a Cost Driver
unit is Number of Articles if the Cost Driver is Assortment.120
Standard Pk: The Standard Pk is the result of the process of allocating budgeted
costs to the budgeted production volume. The Standard Pk aims to present, as
accurately as possible, a cost per product, as well as to cover all manufacturing
costs.121
4.3 Mapping of ABC in Gimo
The cost allocation process for determine Standard Pk starts out with an update of last
year’s data, concerning for instance the material price, the operational time of
production and volume. The budgeted cost is then estimated, and split into three parts:
direct material cost, direct cost and indirect cost. The direct material costs are
allocated directly to the Standard Pk, and the direct costs and indirect costs are
allocated through Cost Centers. The Direct Costs Centers and Indirect Cost Centers
are also charged with allocated costs from other internal units, Allocation from Other
Units (AOU).122 The process of allocating of direct material cost, direct cost and
indirect cost are described in detail in Chapters 4.3.1 Direct Material Cost, 4.3.2
Direct Cost Center and 4.3.3 Indirect Cost Center, and by Figure 4.1. The disposition
of the sub–chapters is made from the boxes and the arrows in Figure 4.1. The
introduction to each sub-chapter is made by a figure based on Figure 4.1. The boxes
and arrows in figure Figure 4.2, Figure 4.3, Figure 4.4 and Figure 4.5 mark the part of
the allocation process that is addressed and is highlighted with a dark frame. The
boxes and arrows that are not addressed in the process are shaded
120 Jacobsson, M. 042308. 121 Ibid. 122 Andersson, K. 021908.
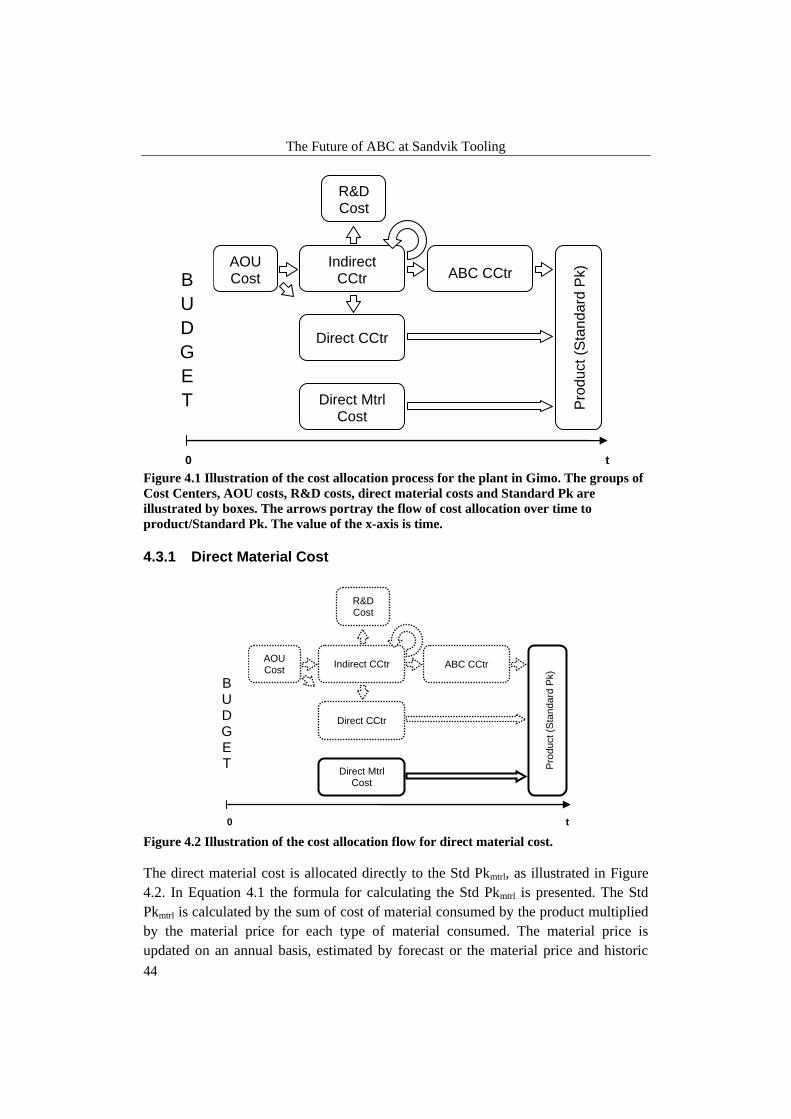
The Future of ABC at Sandvik Tooling
44
Figure 4.1 Illustration of the cost allocation process for the plant in Gimo. The groups of
Cost Centers, AOU costs, R&D costs, direct material costs and Standard Pk are
illustrated by boxes. The arrows portray the flow of cost allocation over time to
product/Standard Pk. The value of the x-axis is time.
4.3.1 Direct Material Cost
Figure 4.2 Illustration of the cost allocation flow for direct material cost.
The direct material cost is allocated directly to the Std Pkmtrl, as illustrated in Figure
4.2. In Equation 4.1 the formula for calculating the Std Pkmtrl is presented. The Std
Pkmtrl is calculated by the sum of cost of material consumed by the product multiplied
by the material price for each type of material consumed. The material price is
updated on an annual basis, estimated by forecast or the material price and historic
Indirect CCtr
R&D Cost
AOU Cost
Direct CCtr
Direct Mtrl Cost
ABC CCtr
Pro
duct (S
tan
da
rd P
k)
B U D G E T
0 t
R&D Cost
AOU Cost
Direct CCtr
Direct Mtrl Cost
Indirect CCtr ABC CCtr
Pro
du
ct
(Sta
ndard
Pk)
B
U
D
G
E
T
0 t

The Future of ABC at Sandvik Tooling
45
data. In the Equation 4.1 the amount of consumed material is referred in as mi and the
material price as pi.123
𝑆𝑡𝑑 𝑃𝑘𝑚𝑡𝑟𝑙 = 𝑚𝑖 ∙ 𝑝𝑖
𝑛
𝑖=1
Equation 4.1 Formula for calculating the Standard Pk material (Std Pkmtrl). The constant
mi (unit of measure: kg or percentage of a piece) stands for the amount of consumed
material and pi (unit of measure: kronor/kg or kronor/piece) is the material price that
stems from the mi. The variable of counter n is the number of different material used for
the actual manufacturing of the product.
4.3.2 Direct Cost Center
Figure 4.3 Illustration of the cost allocation flow for the Direct Cost Centers.
The process of allocation direct costs, in Gimo, is made through Direct Cost Centers
as illustrated in Figure 4.3. The Direct Cost Centers are grouped by Flow Group.124
As presented in the figure AOU costs are allocated and added to the Direct Cost
Centers. The Direct Cost Centers are made up by both direct cost and indirect cost.
The indirect costs are allocated through Indirect Cost Centers to the Direct Cost
Centers as presented in the Figure 4.4.125 The direct costs are then allocated to Std
Pkdirect by the cost per hour; Direct Cost per Hour (DCH). The DCH varies among
Cost Centers and is thereby calculated as presented in Equation 4.2. The DCH are in
the unit of measure man-time.126
123 Andersson, K. 021908. 124 Jacobsson, M. 280408. 125 Gunnarsson-Wahlund, Annika, Cost Accountant, Interview 040108. 126 Lundahl, Dan, Production Controller, Interview 032508.
B U D G E T
Indirect CCtr
R&D Cost
AOU Cost
Direct CCtr
Direct Mtrl Cost
ABC CCtr
Pro
duct (S
tan
da
rd P
k)
0 t
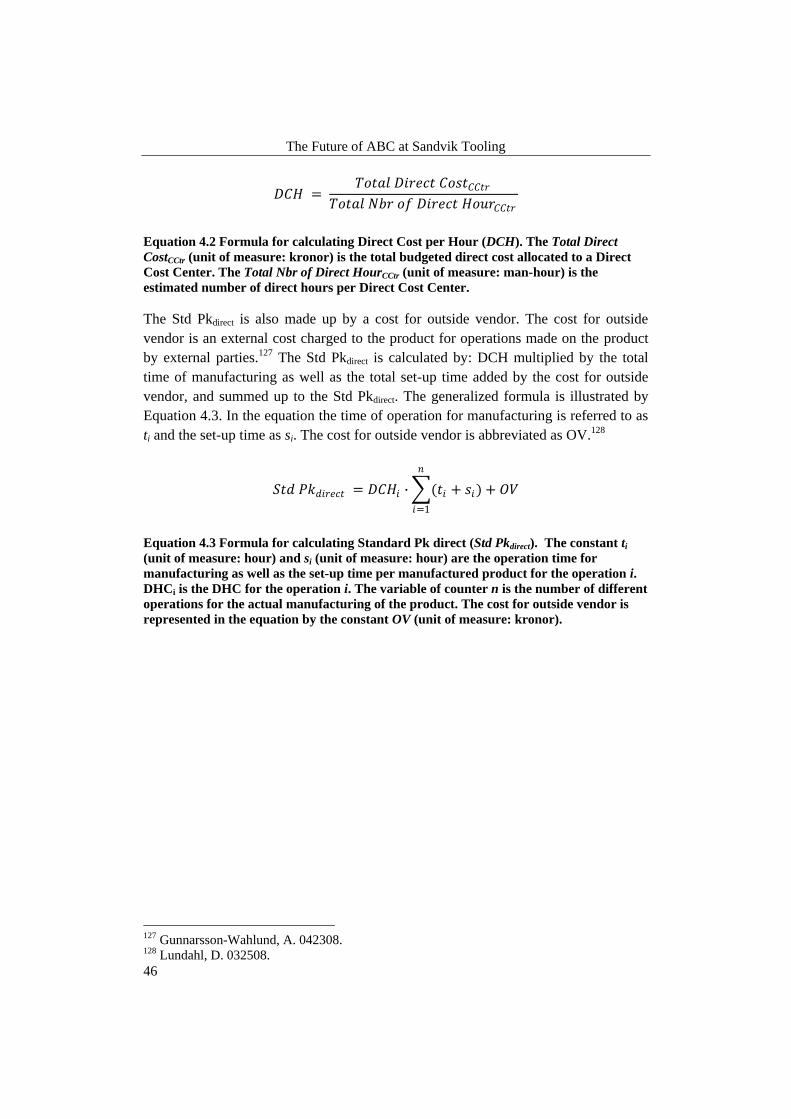
The Future of ABC at Sandvik Tooling
46
𝐷𝐶𝐻 = 𝑇𝑜𝑡𝑎𝑙 𝐷𝑖𝑟𝑒𝑐𝑡 𝐶𝑜𝑠𝑡𝐶𝐶𝑡𝑟
𝑇𝑜𝑡𝑎𝑙 𝑁𝑏𝑟 𝑜𝑓 𝐷𝑖𝑟𝑒𝑐𝑡 𝐻𝑜𝑢𝑟𝐶𝐶𝑡𝑟
Equation 4.2 Formula for calculating Direct Cost per Hour (DCH). The Total Direct
CostCCtr (unit of measure: kronor) is the total budgeted direct cost allocated to a Direct
Cost Center. The Total Nbr of Direct HourCCtr (unit of measure: man-hour) is the
estimated number of direct hours per Direct Cost Center.
The Std Pkdirect is also made up by a cost for outside vendor. The cost for outside
vendor is an external cost charged to the product for operations made on the product
by external parties.127 The Std Pkdirect is calculated by: DCH multiplied by the total
time of manufacturing as well as the total set-up time added by the cost for outside
vendor, and summed up to the Std Pkdirect. The generalized formula is illustrated by
Equation 4.3. In the equation the time of operation for manufacturing is referred to as
ti and the set-up time as si. The cost for outside vendor is abbreviated as OV.128
𝑆𝑡𝑑 𝑃𝑘𝑑𝑖𝑟𝑒𝑐𝑡 = 𝐷𝐶𝐻𝑖 ∙ (𝑡𝑖
𝑛
𝑖=1
+ 𝑠𝑖) + 𝑂𝑉
Equation 4.3 Formula for calculating Standard Pk direct (Std Pkdirect). The constant ti
(unit of measure: hour) and si (unit of measure: hour) are the operation time for
manufacturing as well as the set-up time per manufactured product for the operation i.
DHCi is the DHC for the operation i. The variable of counter n is the number of different
operations for the actual manufacturing of the product. The cost for outside vendor is
represented in the equation by the constant OV (unit of measure: kronor).
127 Gunnarsson-Wahlund, A. 042308. 128 Lundahl, D. 032508.
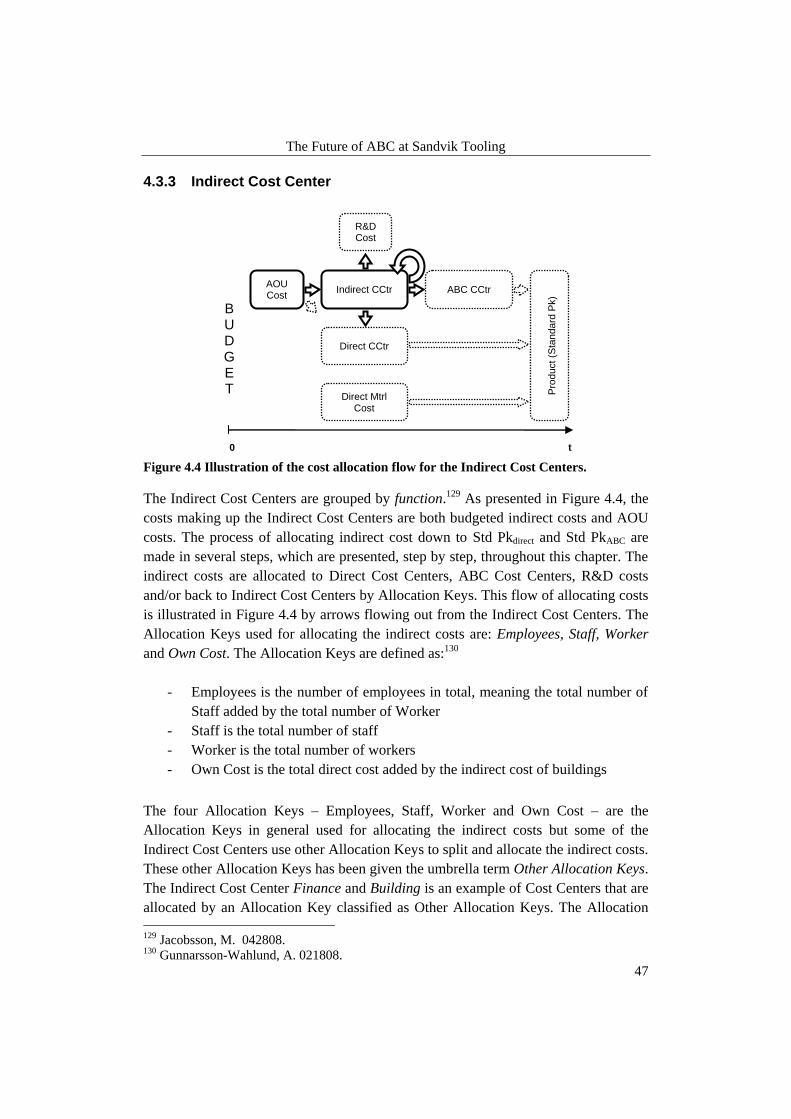
The Future of ABC at Sandvik Tooling
47
4.3.3 Indirect Cost Center
Figure 4.4 Illustration of the cost allocation flow for the Indirect Cost Centers.
The Indirect Cost Centers are grouped by function.129 As presented in Figure 4.4, the
costs making up the Indirect Cost Centers are both budgeted indirect costs and AOU
costs. The process of allocating indirect cost down to Std Pkdirect and Std PkABC are
made in several steps, which are presented, step by step, throughout this chapter. The
indirect costs are allocated to Direct Cost Centers, ABC Cost Centers, R&D costs
and/or back to Indirect Cost Centers by Allocation Keys. This flow of allocating costs
is illustrated in Figure 4.4 by arrows flowing out from the Indirect Cost Centers. The
Allocation Keys used for allocating the indirect costs are: Employees, Staff, Worker
and Own Cost. The Allocation Keys are defined as:130
- Employees is the number of employees in total, meaning the total number of
Staff added by the total number of Worker
- Staff is the total number of staff
- Worker is the total number of workers
- Own Cost is the total direct cost added by the indirect cost of buildings
The four Allocation Keys – Employees, Staff, Worker and Own Cost – are the
Allocation Keys in general used for allocating the indirect costs but some of the
Indirect Cost Centers use other Allocation Keys to split and allocate the indirect costs.
These other Allocation Keys has been given the umbrella term Other Allocation Keys.
The Indirect Cost Center Finance and Building is an example of Cost Centers that are
allocated by an Allocation Key classified as Other Allocation Keys. The Allocation
129 Jacobsson, M. 042808. 130 Gunnarsson-Wahlund, A. 021808.
B U D G E T
Indirect CCtr
R&D Cost
AOU Cost
Direct CCtr
Direct Mtrl Cost
ABC CCtr
Pro
duct (S
tandard
Pk)
0 t

The Future of ABC at Sandvik Tooling
48
Key for allocate the costs of Finance is Assortment and the Allocation Key for
allocation the costs of Building is Space. A summation of all the Allocation Keys are
presented in Table 4.1.131
Table 4.1 Table of Allocation Keys.
Allocation Key
Employees
Staff
Worker
Own Cost
Other Allocation Keys (Assortment, Space etc.)
The Allocation Keys generate a percentage that is used to split the indirect cost.
Different Indirect Cost Centers allocate by different Allocation Keys. Which
allocating key/keys to use is/are decided by the Indirect Cost Center. The percentages
for allocating the indirect costs could also be decided by the person responsible for
the Cost Center. The method for calculating the percentages varies from person to
person. Some people use methods or directives to calculate the percentages and others
based their percentages on an estimate. The accuracy of the percentages varies
therefore depending on the people whom are head of the Cost Center.132 The same
percentages used the year before is often used the following year. This loop can be
traced back several years. The reason the head of the Cost Center does not change the
percentages is because changes to the business have not occurred during their time as
the head of Cost Center. The percentages are looked over on a yearly basis.133
An example of a cost allocation flow through an Indirect Cost Center is building cost,
located at the Indirect Cost Center Building, which including heating costs, electricity
costs and maintenance costs. The building costs are looped several times and through
several Cost Centers. The costs of Building are first split by the Allocation Key Space
and are allocated to both Direct Cost Centers and Indirect Cost Centers. The buildings
costs, which are allocated to the Indirect Cost Centers, are then allocated by the
percentage generated by the Allocation Keys to Direct Cost Centers, ABC Cost
Centers and back to Indirect Cost Centers. The building costs are then allocated
further through the Cost Centers, and eventually allocated to the Standard Pk.134
131 Gunnarsson-Wahlund, A. 021808 132 Ibid. 133 Andersson, K. 030408. 134 Gunnarsson-Wahlund, A. 043008.

The Future of ABC at Sandvik Tooling
49
4.3.3.1 Allocating by Direct Cost Center
As previously described, the Indirect Cost Centers allocated to four different types of
Cost Centers/larger groups of costs; one of these types is the Direct Cost Centers. The
indirect costs are split by the Allocation Keys presented above and allocated to the
Direct Cost Centers, and then further down to Std Pkdirect as described in Chapter 4.3.2
Direct Cost Center. As presented above the costs of buildings are an example of
indirect costs that are allocated, by Allocation Key Space, to the Direct Cost
Centers.135
4.3.3.2 Allocating by ABC Cost Center
Figure 4.5 Illustration of the cost allocation flow for the ABC Cost Centers.
The ABC model is used as a part of the process for allocating indirect costs to the Std
PkABC. The allocation process of allocation is made through ABC Cost Centers
(Figure 4.5), which are grouped by Cost Drivers and products.136 The Indirect Cost
Centers allocate indirect costs to the ABC Cost Centers, that further allocate the
indirect costs to Std PkABC. The indirect costs that are allocated to ABC Cost Centers
are referred to as ABC costs. The ABC Cost Centers use Cost Drivers and Rates to
allocate the ABC costs to the Std PkABC. The Std PkABC is calculated as presented in
Equation 4.8.137
The Cost Drivers and their Rates for allocating ABC costs are: Man-hour and Cost
per Man-hour (CMH), Assortment and Cost per Assortment (CAS), WO and Cost per
135 Gunnarsson-Wahlund, A. 021808. 136 Jacobsson, M. 280408. 137 Andersson, K. 021908
Indirect CCtr
B U D G E T
R&D Cost
AOU Cost
Direct CCtr
Direct Mtrl Cost
ABC CCtr
Pro
duct (S
tand
ard
Pk)
0 t
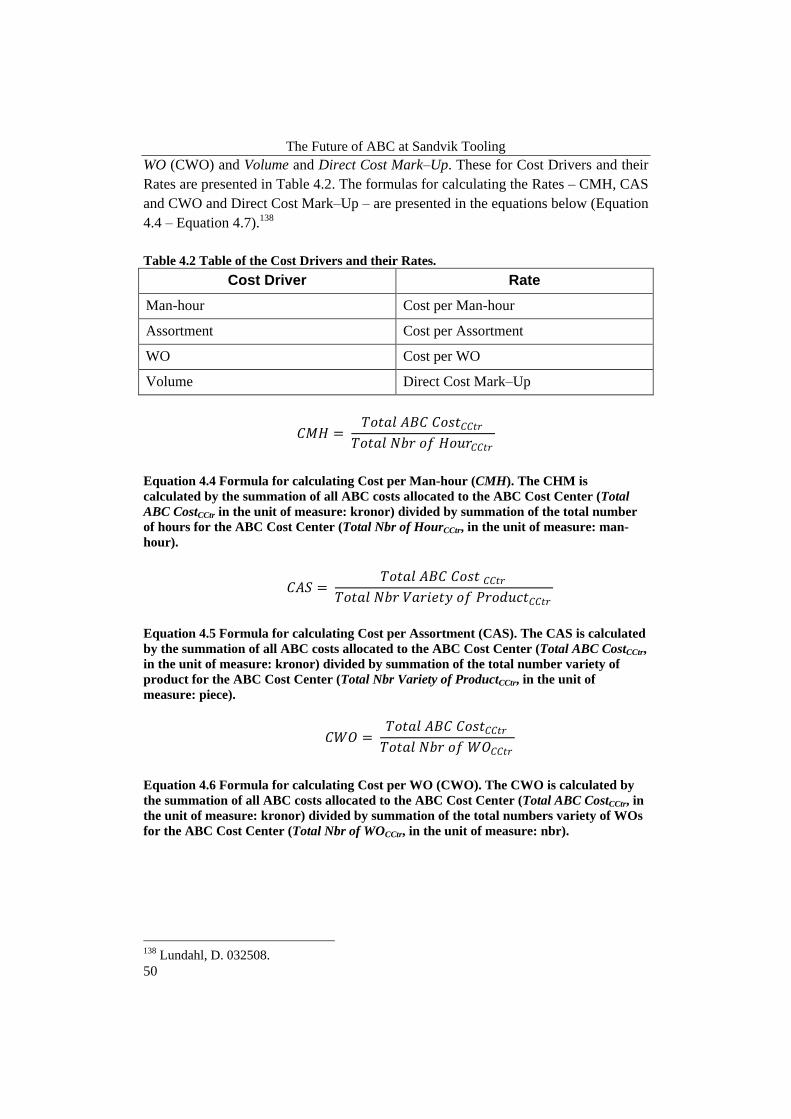
The Future of ABC at Sandvik Tooling
50
WO (CWO) and Volume and Direct Cost Mark–Up. These for Cost Drivers and their
Rates are presented in Table 4.2. The formulas for calculating the Rates – CMH, CAS
and CWO and Direct Cost Mark–Up – are presented in the equations below (Equation
4.4 – Equation 4.7).138
Table 4.2 Table of the Cost Drivers and their Rates.
Cost Driver Rate
Man-hour Cost per Man-hour
Assortment Cost per Assortment
WO Cost per WO
Volume Direct Cost Mark–Up
𝐶𝑀𝐻 = 𝑇𝑜𝑡𝑎𝑙 𝐴𝐵𝐶 𝐶𝑜𝑠𝑡𝐶𝐶𝑡𝑟𝑇𝑜𝑡𝑎𝑙 𝑁𝑏𝑟 𝑜𝑓 𝐻𝑜𝑢𝑟𝐶𝐶𝑡𝑟
Equation 4.4 Formula for calculating Cost per Man-hour (CMH). The CHM is
calculated by the summation of all ABC costs allocated to the ABC Cost Center (Total
ABC CostCCtr in the unit of measure: kronor) divided by summation of the total number
of hours for the ABC Cost Center (Total Nbr of HourCCtr, in the unit of measure: man-
hour).
𝐶𝐴𝑆 = 𝑇𝑜𝑡𝑎𝑙 𝐴𝐵𝐶 𝐶𝑜𝑠𝑡 𝐶𝐶𝑡𝑟
𝑇𝑜𝑡𝑎𝑙 𝑁𝑏𝑟 𝑉𝑎𝑟𝑖𝑒𝑡𝑦 𝑜𝑓 𝑃𝑟𝑜𝑑𝑢𝑐𝑡𝐶𝐶𝑡𝑟
Equation 4.5 Formula for calculating Cost per Assortment (CAS). The CAS is calculated
by the summation of all ABC costs allocated to the ABC Cost Center (Total ABC CostCCtr,
in the unit of measure: kronor) divided by summation of the total number variety of
product for the ABC Cost Center (Total Nbr Variety of ProductCCtr, in the unit of
measure: piece).
𝐶𝑊𝑂 = 𝑇𝑜𝑡𝑎𝑙 𝐴𝐵𝐶 𝐶𝑜𝑠𝑡𝐶𝐶𝑡𝑟𝑇𝑜𝑡𝑎𝑙 𝑁𝑏𝑟 𝑜𝑓 𝑊𝑂𝐶𝐶𝑡𝑟
Equation 4.6 Formula for calculating Cost per WO (CWO). The CWO is calculated by
the summation of all ABC costs allocated to the ABC Cost Center (Total ABC CostCCtr, in
the unit of measure: kronor) divided by summation of the total numbers variety of WOs
for the ABC Cost Center (Total Nbr of WOCCtr, in the unit of measure: nbr).
138 Lundahl, D. 032508.

The Future of ABC at Sandvik Tooling
51
𝐷𝑖𝑟𝑒𝑐𝑡𝐶𝑜𝑠𝑡𝑀𝑎𝑟𝑘𝑈𝑝 = 𝑇𝑜𝑡𝑎𝑙 𝐴𝐵𝐶 𝐶𝑜𝑠𝑡𝐶𝐶𝑡𝑟
𝑇𝑜𝑡𝑎𝑙 𝐷𝑖𝑟𝑒𝑐𝑡 𝐶𝑜𝑠𝑡𝐶𝐶𝑡𝑟
Equation 4.7 Formula for calculating Direct Cost Mark–Up (DirectCostMarkUp). The
Direct Cost Mark–Up is calculated by the summation of all ABC costs allocated to the
ABC Cost Center (Total ABC CostCCtr, in the unit of measure: kronor) divided by
summation of the total direct costs for the ABC Cost Center (Total Direct CostCCtr, in the
unit of measure: kronor).
The Cost Drivers and thereby the Rates vary by ABC Cost Center, meaning each
ABC Cost Center just uses one Rate to allocate costs to the Std PkABC, but the four
Cost Drivers and their Rates are used by more than one ABC Cost Center.139 The
ABC Cost Centers follow rules on how to allocate and which Rate to use.140 An ABC
Cost Center can also allocate to multiple products. This renders, since the Allocation
Keys vary by ABC Cost Center, that the product may not be hit by CMH, CAS, CWO
or Direct Cost Mark–Up (The constant CMH, CAS, CWO or Direct Cost Mark–Up
are set to zero in Equation 4.8). The Standard PkABC is calculated by adding: the CHM
multiplied by the sum of the total time of manufacturing and the total set-up time, the
Direct Cost Mark-Up multiplied by the Standard Pkdirect, the CAS divided by the
estimated number of pieces corresponding to the yearly volume, and the CWO
divided by the number of pieces per WO.141
𝑆𝑡𝑑 𝑃𝑘𝐴𝐵𝐶 = 𝐶𝑀𝐻𝑖 ∙ (𝑡𝑖 + 𝑠𝑖)
𝑛
𝑖=1
+ 𝐷𝑖𝑟𝑒𝑐𝑡𝐶𝑜𝑠𝑡𝑀𝑎𝑟𝑘𝑈𝑝𝑖 ∙ 𝑆𝑡𝑑 𝑃𝑘𝑑𝑖𝑟𝑒𝑐𝑡
+𝐶𝐴𝑆𝑖
𝑁𝑏𝑟 𝑜𝑓 𝑃𝑖𝑒𝑐𝑒𝑖+
𝐶𝑊𝑂𝑖𝑁𝑏𝑟 𝑜𝑓 𝑃𝑖𝑒𝑐𝑒 𝑊𝑂𝑖
Equation 4.8 Formula for calculating Standard Pk ABC (Std PkABC). The constant ti
(unit of measure: hour) and si (unit of measure: hour) are the operation time for
manufacturing as well as the set-up time per manufactured product for the operation i.
The variable of counter n is the number of different operations for the actual
manufacturing of the product. Nbr of Piece (unit of measure: piece) is the total number
of pieces that correspond to the yearly volume. Nbr of Piece WO (unit of measure: piece)
is the number of products per WO.
The Standard Pk is made up by three parts as described earlier. The last part in the
cost allocation process is thereby to sum up the three parts. The summation of the
Standard Pk is made as presented in Equation 4.9.142
139 Andersson, K. 021908. 140 Lundahl, D. 032508. 141 Ibid. 142 Andersson, K. 021908.
The Future of ABC at Sandvik Tooling
52
𝑆𝑡𝑑 𝑃𝑘 = 𝑆𝑡𝑑 𝑃𝑘𝑚𝑡𝑟𝑙 + 𝑆𝑡𝑑 𝑃𝑘𝑑𝑖𝑟𝑒𝑐𝑡 + 𝑆𝑡𝑑 𝑃𝑘𝐴𝐵𝐶
Equation 4.9 Formula for calculating Standard Pk (Std Pk).
4.3.3.3 Allocating to R&D Cost
The indirect costs for R&D are allocated to the larger group of cost R&D Cost. These
indirect costs are not allocated to the Standard Pk and are thereby not presented
further.143
4.3.3.4 Allocating by Indirect Cost Center
As presented by the circular arrow in the Figure 4.4, the Indirect Cost Centers allocate
indirect costs back to Indirect Cost Centers. The loop – Indirect Cost Centers to
Indirect Cost Centers – loops back multiple times, but the indirect costs are eventually
allocated to the Standard Pk through the Direct Cost Centers and/or ABC Cost
Centers. The indirect costs may also be allocated to the larger group of cost R&D
Cost. The process of allocating indirect costs through Indirect Cost Centers is
described in Chapter 4.3.3 Indirect Cost Center.144
4.4 Mapping of ABC in Mebane
The first step of the cost allocation process in Mebane is to estimate the number of
products that will be manufactured within each Flow Group, during the upcoming
year. This renders an estimated quantity, and, together with historical data, a base for
estimating budget costs will be achieved. The estimated budget is then split into three
groups: direct material cost, direct cost and indirect cost. Then, it is allocated to the
product by Cost Drivers and Rates through Cost Centers. The direct material cost is
allocated directly onto the product. Direct costs and indirect costs are split to Direct
Cost Centers and Indirect Cost Centers.145
The Indirect Cost Centers are partly constituted by budgeted costs and AOU costs and
are furthermore directed to Direct Cost Centers, ABC Cost Centers, R&D costs and
Indirect Cost Center. This renders the result that ABC Cost Centers are built up by
indirect costs. Each Direct Cost Center is linked to each individual Flow Group and
the operation heat treatment.146 The allocation model for Mebane is presented in
Figure 4.6. As in Chapter 4.3 Mapping of ABC in Gimo the disposition of the sub-
chapters are made by the boxes and arrows in Figure 4.6. The introduction to each
sub-chapter is made by a figure based on Figure 4.6. The boxes and arrows in figure
143 Andersson, K. 021908. 144 Gunnarsson-Wahlund, A. 021808. 145 Kennedy, C. 031108. 146 Ibid.
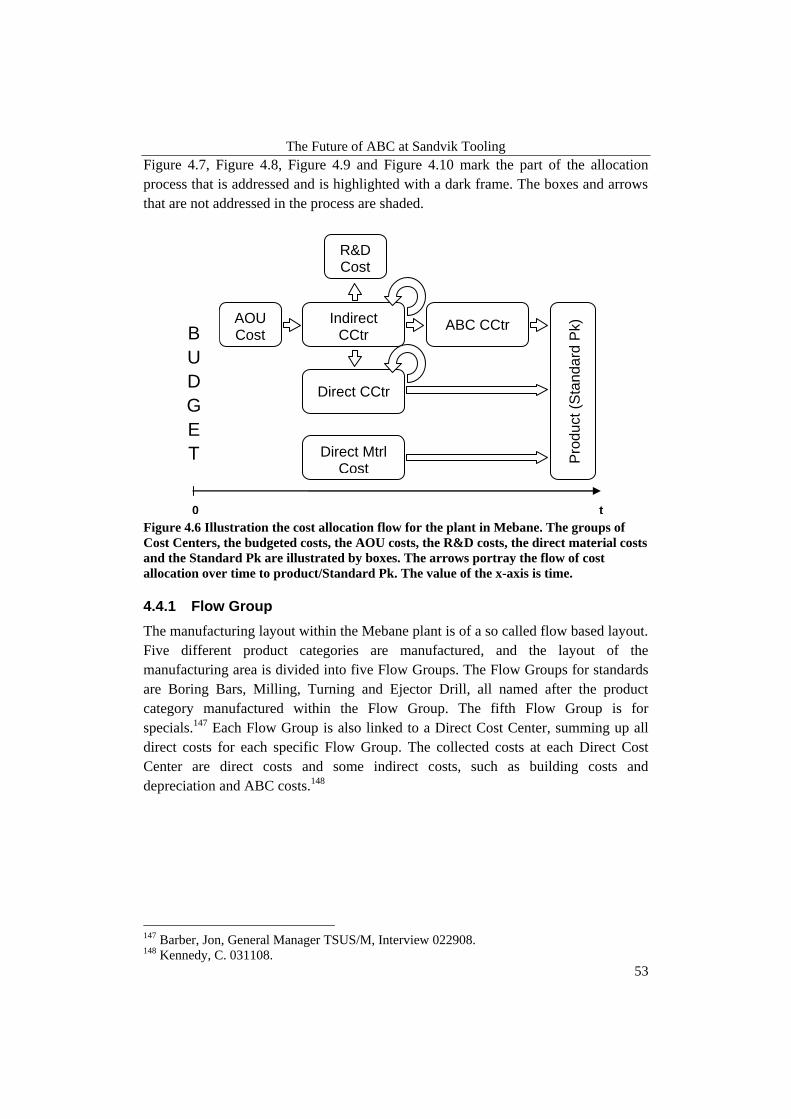
The Future of ABC at Sandvik Tooling
53
Figure 4.7, Figure 4.8, Figure 4.9 and Figure 4.10 mark the part of the allocation
process that is addressed and is highlighted with a dark frame. The boxes and arrows
that are not addressed in the process are shaded.
Figure 4.6 Illustration the cost allocation flow for the plant in Mebane. The groups of
Cost Centers, the budgeted costs, the AOU costs, the R&D costs, the direct material costs
and the Standard Pk are illustrated by boxes. The arrows portray the flow of cost
allocation over time to product/Standard Pk. The value of the x-axis is time.
4.4.1 Flow Group
The manufacturing layout within the Mebane plant is of a so called flow based layout.
Five different product categories are manufactured, and the layout of the
manufacturing area is divided into five Flow Groups. The Flow Groups for standards
are Boring Bars, Milling, Turning and Ejector Drill, all named after the product
category manufactured within the Flow Group. The fifth Flow Group is for
specials.147 Each Flow Group is also linked to a Direct Cost Center, summing up all
direct costs for each specific Flow Group. The collected costs at each Direct Cost
Center are direct costs and some indirect costs, such as building costs and
depreciation and ABC costs.148
147 Barber, Jon, General Manager TSUS/M, Interview 022908. 148 Kennedy, C. 031108.
R&D Cost
AOU Cost
Direct CCtr
Direct Mtrl Cost
Indirect CCtr
ABC CCtr
Pro
du
ct
(Sta
ndard
Pk)
B
U
D
G
E
T
0 t

The Future of ABC at Sandvik Tooling
54
4.4.2 Direct Material Cost
Figure 4.7 Illustration of the cost allocation flow for the direct material cost.
The direct material cost is made up by the cost of material and the cost of any work
performed by an outside vendor. These costs are estimated with the aid of historical
data from the previous year’s costs, added to the estimated price change in material
and in outside vendor. The estimated cost of direct material is multiplied by the
material consumed when manufacturing the product and added by the cost of outside
vendor. This collected cost makes up the Std Pkmtr l (Equation 4.10). The allocation of
material cost is presented in Figure 4.7. 149
𝑆𝑡𝑑 𝑃𝑘𝑚𝑡𝑟𝑙 = (𝑚𝑖 ∙ 𝑝𝑖) + 𝑂𝑉
𝑛
𝑖=1
Equation 4.10 Formula for calculating the Standard Pk material (Std Pkmtrl). The
constant mi (unit of measure: pound or percentage of a piece) stands for amount of
consumed material and pi (unit of measure: dollar/pound or dollar/piece) is the material
price stem from the mi. The cost for outside vendor is presented by the constant OV
(unit of measure: dollar).
149 Kennedy, C. 031308.
0 t
B U D G E T Direct Mtrl
Cost
R&D Cost
AOU Cost
Direct CCtr
Indirect CCtr ABC CCtr
Pro
duct (S
tand
ard
Pk)

The Future of ABC at Sandvik Tooling
55
4.4.3 Direct Cost Center
Figure 4.8 Illustration of the cost allocation flow for the Direct Cost Centers.
The Direct Cost Centers are constituted by direct costs and indirect costs. The Direct
Cost Centers can be divided into two major groups, Cost Center by Flow Group
(Flow Group Cost Center) and Cost Center by operation. The Cost Center by
operation, Heat Treatment, is the only one of its kind and is allocated back to the
Flow Group Costs Centers. This is illustrated by the circular arrow in Figure 4.8.150
The total cost allocated to Heat Treatment (Total Cost of Heat Treatment) is split and
allocated to each Flow Group Cost Center. The Total Cost of Heat Treatment per
Flow Group is then allocated equally to each individual product that uses the
operation (Cost of Heat Treatment per Piece). The allocation could also be done by
splitting Total Cost of Heat Treatment equally among all products that use the
operation, independent of Flow Group. The calculation of Cost of Heat Treatment per
Piece is presented in Equation 4.11, and is abbreviated as HT in the equation.151
𝐻𝑇 = 𝑇𝑜𝑡𝑎𝑙 𝐶𝑜𝑠𝑡 𝑜𝑓 𝐻𝑇
𝑇𝑜𝑡𝑎𝑙 𝑁𝑏𝑟 𝑃𝑖𝑒𝑐𝑒𝑠 𝐻𝑒𝑎𝑡 𝑇𝑟𝑒𝑎𝑡𝑒𝑑
Equation 4.11 Formula for calculating the Cost of Heat Treatment per piece (HT). The
Total Cost of Heat is presented by Total Cost of HT (unit of measure: dollar). Total Nbr
Pieces Heat Treated (unit of measure: piece) is the estimated total number of pieces to be
heat treated.
150 Kennedy, C. 031108. 151 Ibid. 031308.
0 t
B U D G E T
Direct Mtrl Cost
R&D Cost
AOU Cost
Direct CCtr
Indirect CCtr ABC CCtr
Pro
duct (S
tandard
Pk)

The Future of ABC at Sandvik Tooling
56
The direct costs that are allocated directly to the Flow Group Cost Centers, and the
indirect costs that are allocated to the Flow Group Cost Centers, are flowed down to
the product by the Rate Direct Hourly Rate (DHR). DHR is the direct average cost
Rate by the hour per Flow Group, calculated by Equation 4.12. DHR varies between
the Flow Group Cost Centers.152 In the equation Flow Group is shorted as FG. The
estimated number of hours per Flow Group is the estimated time (unit of measure
machine-hour) it takes to manufacture the estimated number of pieces within the
Flow Group.153
𝐷𝐻𝑅 = 𝑇𝑜𝑡𝑎𝑙 𝐷𝑖𝑟𝑒𝑐𝑡 𝐶𝑜𝑠𝑡𝐹𝐺 − 𝑇𝑜𝑡𝑎𝑙 𝐶𝑜𝑠𝑡 𝑜𝑓 𝐻𝑇 𝐹𝐺
𝑇𝑜𝑡𝑎𝑙 𝑁𝑏𝑟 𝑜𝑓 𝐻𝑜𝑢𝑟𝐹𝐺
Equation 4.12 Formula for calculating the Direct Hourly Rate (DHR). The DHR per
Flow Group is calculated by the total direct cost (Total Direct CostFG, in the unit of
measure: dollar) subtracted by the total cost of heat treatment (Total Cost of HTFG, in the
unit of measure: dollar) and divided by the estimated number of hours (Total Nbr of
HourFG, in the unit of measure: hour).
The Std Pkdirect is made up by the total costs of manufacturing per piece, added by the
Cost of Heat Treatment per Piece (Equation 4.13). To obtain the total cost of
manufacturing per piece, the sum of the total time of manufacturing and the total set-
up time is multiplied by the DHR. In Equation 4.13 the operation time of
manufacturing is referred to as ti and the set-up time as si.154
𝑆𝑡𝑑 𝑃𝑘𝑑𝑖𝑟𝑒𝑐𝑡 = 𝐷𝐻𝑅𝑖 ∙ (𝑡𝑖 + 𝑠𝑖) + 𝐻𝑇
𝑛
𝑖=1
Equation 4.13 Formula for calculating the Standard Pk direct (Std Pkdirect). The constant
ti (unit of measure: hour) is the operation time for manufacturing and si (unit of
measure: hour) is the set-up time per manufactured product, for the operation i. DHRi is
the DHR or the Flow Group i. The variable of counter n is the number of different
operations for the actual manufacturing of the product. The Cost of Heat Treatment per
piece is represented by the constant HT (unit of measure: dollar/piece).
152 Kennedy, C. 031308. 153 Ibid. 031908. 154 Ibid. 031308.
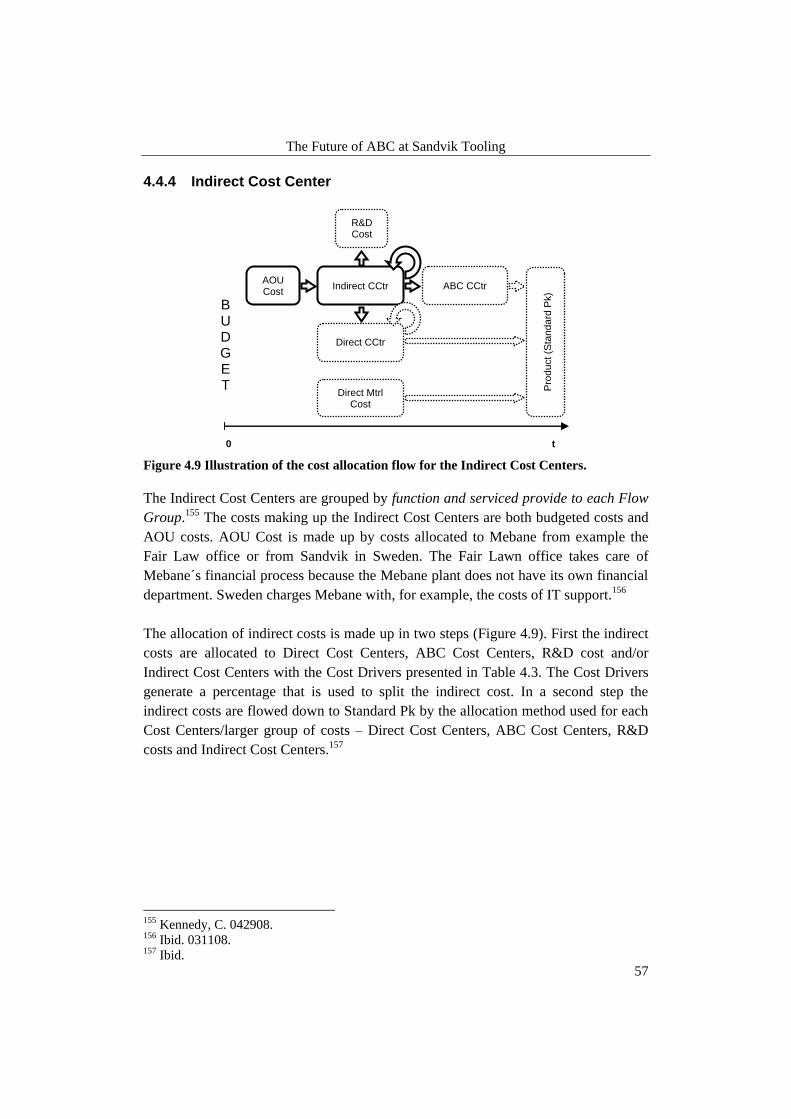
The Future of ABC at Sandvik Tooling
57
4.4.4 Indirect Cost Center
Figure 4.9 Illustration of the cost allocation flow for the Indirect Cost Centers.
The Indirect Cost Centers are grouped by function and serviced provide to each Flow
Group.155 The costs making up the Indirect Cost Centers are both budgeted costs and
AOU costs. AOU Cost is made up by costs allocated to Mebane from example the
Fair Law office or from Sandvik in Sweden. The Fair Lawn office takes care of
Mebane´s financial process because the Mebane plant does not have its own financial
department. Sweden charges Mebane with, for example, the costs of IT support.156
The allocation of indirect costs is made up in two steps (Figure 4.9). First the indirect
costs are allocated to Direct Cost Centers, ABC Cost Centers, R&D cost and/or
Indirect Cost Centers with the Cost Drivers presented in Table 4.3. The Cost Drivers
generate a percentage that is used to split the indirect cost. In a second step the
indirect costs are flowed down to Standard Pk by the allocation method used for each
Cost Centers/larger group of costs – Direct Cost Centers, ABC Cost Centers, R&D
costs and Indirect Cost Centers.157
155 Kennedy, C. 042908. 156 Ibid. 031108. 157 Ibid.
0 t
B U D G E T
Direct Mtrl Cost
R&D Cost
AOU Cost
Direct CCtr
Indirect CCtr ABC CCtr
Pro
duct (S
tandard
Pk)
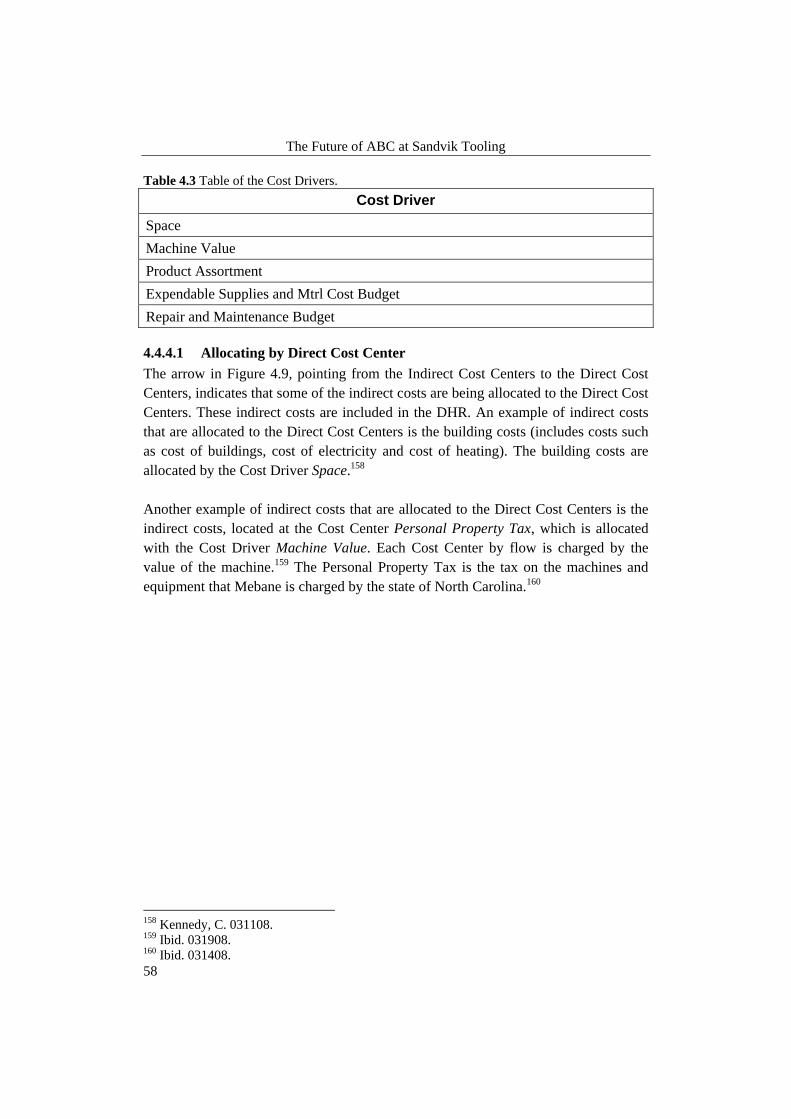
The Future of ABC at Sandvik Tooling
58
Table 4.3 Table of the Cost Drivers.
Cost Driver
Space
Machine Value
Product Assortment
Expendable Supplies and Mtrl Cost Budget
Repair and Maintenance Budget
4.4.4.1 Allocating by Direct Cost Center
The arrow in Figure 4.9, pointing from the Indirect Cost Centers to the Direct Cost
Centers, indicates that some of the indirect costs are being allocated to the Direct Cost
Centers. These indirect costs are included in the DHR. An example of indirect costs
that are allocated to the Direct Cost Centers is the building costs (includes costs such
as cost of buildings, cost of electricity and cost of heating). The building costs are
allocated by the Cost Driver Space.158
Another example of indirect costs that are allocated to the Direct Cost Centers is the
indirect costs, located at the Cost Center Personal Property Tax, which is allocated
with the Cost Driver Machine Value. Each Cost Center by flow is charged by the
value of the machine.159 The Personal Property Tax is the tax on the machines and
equipment that Mebane is charged by the state of North Carolina.160
158 Kennedy, C. 031108. 159 Ibid. 031908. 160 Ibid. 031408.

The Future of ABC at Sandvik Tooling
59
4.4.4.2 Allocating by ABC Cost Center
Figure 4.10 Illustration of the cost allocation flow for the ABC Cost Centers.
The Indirect Cost Centers allocate indirect costs to ABC Cost Centers by a
percentage.161 The process of allocating indirect costs through ABC Cost Centers is
presented in Figure 4.10. The indirect costs, which are allocated to ABC Cost
Centers, are referred to as ABC costs. The ABC costs are allocated to Std PkABC by
Method of Charging Cost to Standard Pk, presented in Table 4.4. The Method of
Charging Cost to Standard also makes up the grouping of the ABC Cost Centers. The
five ABC Cost Center thereby are named: Piece Charge – ED, Piece Charge – Other,
WO Charge – ED, WO Charge – Other and Pk Mark–Up. 162
Table 4.4 Table of the ABC Cost Centers and their Method of Charging Cost to
Standard Pk.
ABC CCtr Method of Charging Cost to
Standard Pk
Piece Charge – ED Fixed Charge per ED Piece
Piece Charge – Other Fixed Charge per Other Piece
WO Charge – ED Fixed Charge per ED WO
WO Charge – Other Fixed Charge per WO Other
Pk Mark–Up Pk Mark–Up
161 Giardino-Gray, N. 022708. 162 Kennedy, C. 042908.
0 t
B U D G E T
Direct Mtrl Cost
R&D Cost
AOU Cost
Direct CCtr
Indirect CCtr ABC CCtr
Pro
duct (S
tandard
Pk)

The Future of ABC at Sandvik Tooling
60
The ABC cost is allocated differently depending on the ABC Cost Center. The ABC
costs are split and allocated either between the Ejector Drill (ED) products or the
other standard products put together (Other). The manufacturing of the ED product is
highly man intensive compared to the rest of the Flow Group within standard
products, having a fully automated manufacturing. This is the reason for splitting the
ABC costs between the ED and Other.163
The ABC costs related to the ED Flow Group are allocated by Fixed Charge per ED
Piece and Fixed Charge per ED WO. The Other ABC costs are allocated by the
Method of Charging Cost to Standard Pk Fixed Charge per Other Piece and Fixed
Charge per WO Other. These four Methods of Charging Cost to Standard Pk generate
fixed amounts, which are calculated annually. The formulas used to calculate the
Method of Charging Cost to Standard Pk are presented in Equation 4.14 – Equation
4.17. Fixed Charge per ED Piece and Fixed Charge per Other Piece are calculated by
the same formula, like for Fixed Charge per ED WO and Fixed Charge per WO
Other.164
𝐹𝑖𝑥𝑒𝑑 𝐶𝑎𝑟𝑔𝑒 𝑝𝑒𝑟 𝐸𝐷 𝑃𝑖𝑒𝑐𝑒 =𝑇𝑜𝑡𝑎𝑙 𝐴𝐵𝐶 𝐶𝑜𝑠𝑡𝑃𝑖𝑒𝑐𝑒 𝐶𝑎𝑟𝑔𝑒 −𝐸𝐷
𝑇𝑜𝑡𝑎𝑙 𝑁𝑏𝑟 𝑜𝑓 𝐸𝐷 𝑃𝑖𝑒𝑐𝑒
Equation 4.14 Formula for calculating the Fixed Charge per ED Piece. The Total CostPiece
Charge-ED (unit of measure: dollar) is the summation of all ABC amounts allocated to the
ABC Cost Center Piece Charge – ED. Total Nbr of ED Piece (unit of measure: piece) is
the total number of ED pieces.
𝐹𝑖𝑥𝑒𝑑 𝐶𝑎𝑟𝑔𝑒 𝑝𝑒𝑟 𝐸𝐷 𝑊𝑂 = 𝑇𝑜𝑡𝑎𝑙 𝐴𝐵𝐶 𝐶𝑜𝑠𝑡𝑊𝑂 𝐶𝑎𝑟𝑔𝑒 −𝐸𝐷
𝑇𝑜𝑡𝑎𝑙 𝑁𝑏𝑟 𝑜𝑓 𝐸𝐷 𝑊𝑂
Equation 4.15 Formula for calculating the Fixed Charge per ED WO. The Total CostWO
Charge-ED (unit of measure: dollar) is the summation of all ABC amounts allocated to the
ABC Cost Center WO Charge – ED. Total Nbr of ED WO (unit of measure: nbr) is the
total number of ED WO.
𝐹𝑖𝑥𝑒𝑑 𝐶𝑎𝑟𝑔𝑒 𝑝𝑒𝑟 𝑂𝑡𝑒𝑟 𝑃𝑖𝑒𝑐𝑒 = 𝑇𝑜𝑡𝑎𝑙 𝐴𝐵𝐶 𝐶𝑜𝑠𝑡𝑃𝑖𝑒𝑐𝑒 𝐶𝑎𝑟𝑔𝑒 −𝑂𝑡𝑒𝑟
𝑇𝑜𝑡𝑎𝑙 𝑁𝑏𝑟 𝑜𝑓 𝑂𝑡𝑒𝑟 𝑃𝑖𝑒𝑐𝑒
Equation 4.16 Formula for calculating the Fixed Charge per Other Piece. The Total
CostPiece Charge-Other (unit of measure: dollar) is the summation of all ABC amounts
allocated to the ABC Cost Center Piece Charge – Other. Total Nbr of Other Piece (unit
of measure: piece) is the total number of Other pieces.
163 Kennedy, C. 031108. 164 Ibid.

The Future of ABC at Sandvik Tooling
61
𝐹𝑖𝑥𝑒𝑑 𝐶𝑎𝑟𝑔𝑒 𝑝𝑒𝑟 𝑊𝑂 𝑂𝑡𝑒𝑟 = 𝑇𝑜𝑡𝑎𝑙 𝐴𝐵𝐶 𝐶𝑜𝑠𝑡𝑊𝑂 𝐶𝑎𝑟𝑔𝑒 −𝑂𝑡𝑒𝑟
𝑇𝑜𝑡𝑎𝑙 𝑁𝑏𝑟 𝑜𝑓 𝑂𝑡𝑒𝑟 𝑊𝑂
Equation 4.17 Formula for calculating the Fixed Charge per WO Other. The TotalCostWO
Charge-Other (unit of measure: dollar) is the summation of all ABC amounts allocated to the
ABC Cost Center WO Charge – Other. Total Nbr of Other WO (unit of measure: nbr) is
the total number of other WO.
The Std PkABC is then calculated by equations presented in Equation 4.18. The
products classified as ED are calculated by the fixed amount generated by Fixed
Charge per ED Piece and Fixed Charge per ED WO. In other case the fixed amounts
generated by Fixed Charge per Other Piece and Fixed Charge per WO Other are used
as the Cost per Piece (Fixed ChargePiece) and Cost per WO.165
𝑆𝑡𝑑 𝑃𝑘𝐴𝐵𝐶 = 𝐶𝑜𝑠𝑡 𝑝𝑒𝑟 𝑃𝑖𝑒𝑐𝑒 +𝐶𝑜𝑠𝑡 𝑝𝑒𝑟 𝑊𝑂
𝑁𝑏𝑟 𝑜𝑓 𝑃𝑖𝑒𝑐𝑒 𝑊𝑂
Equation 4.18 Formula for calculating the Standard Pk ABC (Std PkABC). Depending on
which category – ED or Other, the product belongs to, the constant Cost per Piece is
replaced by either the fixed amount calculated by Fixed Charge per ED Piece or Fixed
charge per Other Piece. The same rules are applied on Cost per WO, but instead the
constant is replaced by the fixed amount Fixed charge per ED WO or Fixed charge per
WO Other. Nbr of Piece WO (unit of measure: piece) is the total number of pieces within
a WO.
The final step in calculating the Standard Pk for a product is to sum up all costs
related to the Standard Pk – Std Pkmtrl, Std Pkdirect and Std PkABC – and then multiply
the sum by the percentage Pk Mark–Up. The calculation of the total Standard Pk is
presented in Equation 4.20. The formula of calculation the Pk Mark–Up is described
in Equation 4.19.166
𝑃𝑘𝑀𝑎𝑟𝑘𝑈𝑝 =𝑇𝑜𝑡𝑎𝑙 𝐶𝑜𝑠𝑡𝑃𝑘 𝑀𝑎𝑟𝑘 −𝑈𝑃
𝑇𝑜𝑡𝑎𝑙 𝑃𝑟𝑜𝑑𝑢𝑐𝑡𝑖𝑜𝑛 𝐶𝑜𝑠𝑡
Equation 4.19 Formula for calculating the Pk Mark–Up (PkMarkUp). The Total CostPk
Mark-Up (unit of measure: dollar) is the summation of all ABC amounts allocated to the
ABC Cost Center Pk Mark–Up. The Total Production Cost (unit of measure: dollar) is
the sum of all cost – direct material cost, direct costs, indirect costs.
𝑆𝑡𝑑 𝑃𝑘 = (1 + 𝑃𝑘𝑀𝑎𝑟𝑘𝑈𝑝) ∙ (𝑆𝑡𝑑 𝑃𝑘𝑚𝑡𝑟𝑙 + 𝑆𝑡𝑑 𝑃𝑘𝑑𝑖𝑟𝑒𝑐𝑡 + 𝑆𝑡𝑑 𝑃𝑘𝐴𝐵𝐶 )
Equation 4.20 Formula for calculating the Standard Pk (Std Pk).
165 Giardino-Gray, N. 041608. 166 Kennedy, C. 031908.

The Future of ABC at Sandvik Tooling
62
4.4.4.3 Allocating to R&D Cost
The indirect costs for R&D are allocated monthly to Sandvik in Sweden. The indirect
costs that are allocated back to Sweden are costs for new product development or start
up cost, for setting up new manufacturing process or concept. The reengineering cost,
on the other hand, is not allocated to the R&D costs, but is allocated within the
plant.167
4.4.4.4 Allocating by Indirect Cost Center
As preened in Figure 4.9 by the looped arrow, Indirect Cost Centers allocate indirect
costs back once to Indirect Cost Centers. These indirect costs are then allocated to the
product through ABC Cost Centers, described in detailed in Chapter 4.4.4.2
Allocating by ABC Cost Center. The only costs looped once within the Indirect Cost
Centers are the building costs. These indirect costs are allocated to both Direct Cost
Centers and to Indirect Cost Centers by the Cost Driver Space. The building costs that
are allocated to the Indirect Cost Centers are in a second step allocated to ABC Cost
Centers, and then allocated to Std PkABC.168
4.5 Technical Solution
The last stage within the cost allocation process is to calculate the Standard Pk in an
information system. This process is referred to as the Standard Pk process. The
information system used for calculating the Standard Pk in Mebane is the Group
Supplier System (GSS). The GSS is a Sandvik Tooling in-house built information
system used for reporting and planning.169 GSS is a data source and acts as an
umbrella for a number of modules. These modules gather and store data concerning
the product’s journey from WO (work order) start-up until the WO is closed and sold
to the customer. The modules in GSS are as follows: Carin, Skeleton, Pk–Module,
GSS MIS, and Production Follow-Up.170 The user of GSS cannot modify it to meet
personal preferences. The information system comes only in an English language
version.171 In Gimo, GSS is likely to be implemented. They are currently running
Zenith, Carin, Sopic and Skeleton and an information system equivalent to GSS MIS.
The Standard Pk process is done in Pre-Calculation Program (a translation of the
Swedish name of the information system Förkalkyleringsprogrammet).172
167 Kennedy, C. 031408. 168 Ibid. 031108. 169 Giardino-Gray, N. 022508. 170 Ibid. 041608. 171 Ögren, Thomas, Process and System Co-Ordinator, Interview 020808. 172 Jacobsson, M. 042808.

The Future of ABC at Sandvik Tooling
63
The flow of the WO, from set-up to finished good, starts when the customer places an
order. In the case of Sandvik Tooling’s manufacturing, there is only one customer, the
Distribution Center (DC). Sopic–P, the ordering information system, takes the order
and passes it on to Zenith (Zenith is the information system for inventory control,
finished goods and production stock, and acts as the database for checking material
requirements). The order will be checked in Zenith to see whether the product is in
stock or if it has to be manufactured. Zenith feeds information into the GSS modules
used in Mebane.173
4.5.1 GSS Module
Carin is a database of products. Carin also controls information regarding the article
and the parameters of how it should work in the other information systems. When
data is added or changed in Carin, it will be passed on to the connecting information
systems. For example, if a new article code has to be generated, it will be done in
Carin and then this product code populates the other information systems. Also, if a
change is made to an Economic Order Quantity (EOQ) in Zenith, then Carin must be
updated.174 At the product level, Carin is a copy of Zenith, but it contains a date
function for holding the Standard Pk date before going live in the information system,
and then release it to Zenith and Sopic–P.175
The Skeleton module holds the instructions on how to make the product. This
information is provided by the engineers, who build the Skeleton. Skeleton provides
information for the yearly calculation of the Standard Pk, during which a copy of the
live Skeleton database is sent to the Pk–Module. The engineers can then make any
required changes to the Skeleton, for the upcoming year, without touching the live
data base. If requested, the Standard Pk may be copied back in to Skeleton live
module, but after the Standard Pk calculation is completed. The Skeleton module
sends the current “instructions” to GSS MIS when a work order is printed.176
The GSS MIS module is used for reporting within the shop floor. GSS MIS holds the
DHR and the Method of Charging Cost to Pk – Fixed Charge per ED Piece, Fixed
Charge per Other Piece, Fixed Charge per ED WO, Fixed Charge per WO Other, and
Pk Mark-Up. GSS MIS provides the DHR and the Method of Charging Cost to
Standard Pk to Pk–Module during the Standard Pk process. When the order to make a
product in placed in Zenith, the production planner gets a notification about a WO
suggestion. This then gets approved or disapproved. If approved, the WO is opened in
GSS MIS. The information system checks “instructions” from Skeleton as to how the
173 Giardino-Gray, N. 012808. 174 Kaminski, Bernard, Production Manager, Interview 041608. 175 Giardino-Gray, N. 041608. 176 Kennedy, C. 031308.

The Future of ABC at Sandvik Tooling
64
product should be produced.177 Time and material used on the shop floor is reported
into GSS MIS. The actual WO cost is calculated by GSS MIS, taking the DHR
multiplied by the labor hours reported, material used in the WO multiplied by the
current cost of material in Carin, the cost of any reported rejected material is
calculated with the above costs up to the point of the rejection, and the occurrence of
cost drivers multiplied by the Method of Charging Cost to Standard Pk.178
The Pk–Module holds information and calculates new Standard Pk for standard
products only. The Standard Pk process is done yearly. The Pk–Module can be re-run
several times throughout the Standard Pk process, allowing the user to review the
costs until satisfactory before going live in the information system and updating Carin
with the new year Standard Pk. The Pk–Module consists of four parts; new EOQ,
costs of material, DHR and Method of Charging Cost to Standard Pk, and Skeleton
input.179
New EOQs are calculated based on sales forecasts, run times, etc., by the Materials
group. The EOQ is loaded into Carin and then to the Pk–Module. The DHR and
Method of Charging Cost to Standard Pk are based on the budget, and are calculated
in an Excel spread sheet. The DHR are keyed in manually into the GSS MIS or Pk–
Module, and Method of Charging Cost to Standard Pk is keyed into GSS MIS.180 The
calculation of Std Pkmtrl, Std Pkdirect and Std PkABC in the information system cannot be
changed because it is locked in the information system. These formulas were
determined about a decade ago. The calculated DHR and Method of Charging Cost to
Standard Pk, on the other hand, are adjustable.181
New costs of material are updated in Pk–Module by two methods. If the raw material
is sourced by Sandvik Tooling, Zenith updates Pk–Module, and freight and duty
factors can be added. If the material is externally sourced, the new cost of material is
manually entered into Pk–Module. The Pk–Module receives a copy of the live
Skeleton database from Skeleton. The Pk–Module receives and sends information to
Carin, which holds the product master.182
The Production Follow-Up information system presents daily/weekly/monthly reports
of the data entered into GSS MIS. Business Objects, IC, GSS Follow-Up are the
reporting information systems collecting data from GSS and putting it into databases,
177 Giardino-Gray, N. 012808. 178 Ibid. 050208. 179 Ibid. 041608 180 Ibid. 181 Ögren, T. 020808. 182 Giardino-Gray, N. 041608.

The Future of ABC at Sandvik Tooling
65
reports are predetermined in GSS follow up, user created in the other information
systems.183
4.5.2 Standard Pk Process in GSS184
As discussed in the Chapter concerning ABC mapping in Mebane, determining the
Standard Pk is made up by a series of steps. This cost allocation process in carried out
on Excel spread sheets as well as in the different modules within the GSS modules.
The cost allocation process to determine the Standard Pk is done in the last quarter of
the year and after the budget is set.
1. The Standard Pk process starts out when the DHR are supplied to the logistics
department in order for them to calculate the EOQ.
2. The minimum and maximum order quantities are reviewed in Carin. This is
done throughout the year by the production group, and will give an indication
of the capacity at hand. If for instance an EOQ exceeds the maximum
quantity, then the order will not go through. In Mebane, the maximum
quantities are set in order to prevent machines from getting tied up. Minimum
quantities are not used in Mebane because the product’s nature allows order
quantities be small. A customer may for instance order a single Milling
Cutter. Minimum order quantities can be used at other production locations.
3. The engineers enter/review the instructions on how to make the product in
Skeleton. This information will include a product’s planned set-up time and
run-time.
4. Rates for duty and freight of raw material, such as steel ordered from
Sweden, will be entered into GSS MIS.
5. Skeletons are updated and sent to the Pk–Module.
6. Zenith sends the transfer prices for raw material ordered from Sandvik
Tooling. New year standard costs for external sourced raw material are
entered manually into PK–Module.
7. EOQ are loaded into Carin by the logistics department, and then sent to Pk–
Module.
8. DHR and Method of Charging Cost to Standard Pk are entered into the Pk–
Module and/or GSS MIS. The DHR and Method of Charging Cost to
Standard Pk are calculated in an Excel spread sheet.
9. The Pk–Module gets updated with all of the information provided by modules
within the steps above. The Pk–Module processes the information and then
sends it back to the other modules when requested.
10. Final calculation of Standard Pk is completed in Pk–Module.
183 Giardino-Gray, N. 041608. 184 Giardino-Gray, N. 041608. /Kennedy, C. 031308.

The Future of ABC at Sandvik Tooling
66
11. The Pk–Module will send the calculated Standard Pk to Carin. Carin will in
turn send it to Sopic–P on the go-live date because Sopic–P lacks a date
function. Sopic–P will use the Standard Pk in order to determine the Supplier
Unit Price (SUP). This is done in Sopic–P by applying a markup percentage
to the Standard Pk. The SUP will be sent to Zenith. Zenith sends an SSP
(Stock to Stock Price) to affiliate DCs’, and a transfer price to Sopic–S for
stock being sold to an external customer. With the provided information, a
suggested sales price will determined. This is based on what the market will
bear.
12. GSS is updated in live with the Standard Pk, costs of material, the year’s
DHR, the year’s Method of Charging Cost to Standard Pk and updated
skeletons.

The Future of ABC at Sandvik Tooling
67
B U D G E T
0 t
Indirect CCtr
R&D Cost
AOU Cost
Direct CCtr
Direct Mtrl Cost
ABC CCtr
Pro
duct (S
tand
ard
Pk)
0 t
B U D G E T Direct Mtrl
Cost
R&D Cost
AOU Cost
Direct CCtr
Indirect CCtr
ABC CCtr
Pro
duct (S
tand
ard
Pk)
5 Comparisons
This chapter will present the key differences separating the cost allocations process
used in Gimo and in Mebane
5.1 ABC Comparison
The cost allocation model used in Gimo and in Mebane is illustrated in Table 5.1. The
dark arrows in the figure mark the differences between the cost allocation model used
in Gimo, compared to the model used in Mebane. The arrows marking the differences
represent the allocation of AOU Cost to Direct Cost Centers, Indirect Cost Centers to
Indirect Cost Centers and Direct Cost Centers to Direct Cost Centers. The remaining
flow of cost allocation is similar.
Table 5.1 Comparison of the cost allocation process in Gimo and in Mebane. The cost
allocation process used in Gimo is presented at the top in the figure. The cost allocation
process used in Mebane is presented at the bottom. The differences between the two cost
allocation processes are marked with dark arrows. The value of both x-axis is time.
Gimo
Mebane

The Future of ABC at Sandvik Tooling
68
5.1.1 Direct Material Cost
The allocation of the direct material cost, both in Gimo and in Mebane, is made in
similar ways. The price of material is estimated by historical data and with forecasts
regarding changes in the material price during the upcoming year. The direct material
costs are allocated to the Std Pkmtrl by the calculation of estimated amount of
consumed material multiplied by the estimated price of material. The unit of measure,
for instance kilos versus pounds, may differ since the system of measurement
separates the two countries. One additional thing separating the two processes of
allocating direct material costs is the cost for outside vendor, which is added to the
Std Pkmtrl in Mebane, but not in Gimo. The two formulas for calculating the Std Pkmtrl
in Gimo and in Mebane is presented, side by side, in Table 5.2.
Table 5.2 Comparison of Std Pkmtrl. The equation used to calculate Std Pkmtrl in Gimo is
presented to the left in the table. The formula used in Mebane is presented to the right.
Gimo Mebane
𝑆𝑡𝑑 𝑃𝑘𝑚𝑡𝑟𝑙 = 𝑚𝑖 ∙ 𝑝𝑖
𝑛
𝑖=1
𝑆𝑡𝑑 𝑃𝑘𝑚𝑡𝑟𝑙 = (𝑚𝑖 ∙ 𝑝𝑖) + 𝑂𝑉
𝑛
𝑖=1
5.1.2 Direct Cost Center
The Direct Cost Centers are grouped, both in Gimo and in Mebane, by Flow Group,
with the exception of one Direct Cost Center in Mebane that is group by operation.
This Direct Cost Center allocates its direct costs to the Flow Group Cost Center and
this loop – Direct Cost Center allocating to Direct Cost Center – separates the two
allocation processes in Gimo and in Mebane. Otherwise, both processes of allocating
direct costs through the Direct Cost Centers are made directly to the Std Pkdirect,
containing both direct costs and indirect costs. The Direct Cost Centers in Gimo are
also made up by AOU costs.
The allocation of the costs, located at Direct Cost Centers, to Std Pkdirect is made by
DCH or DHR. Formulas for calculating both DCH and DHR are presented in Table
5.3. DCH and DHR are calculated alike, but with the difference in the unit of
measure. The DCH is in the unit of measure man-hour compared to the DHR which is
in the unit of measure machine-hour. The Std Pkdirect, for both sites, is also calculated
in a similar way. The DCH/DHR, is multiplied by total time of operation, plus the
total set-up time, added by a constant. The one thing that separates the two formulas
is the value of the constant. In the formula used in Gimo, the constant is made up by
cost for outside vendor. In Mebane the constant added to the Std Pkdirect is the cost of
heat treatment. The comparison of the two formulas is presented in Table 5.4.
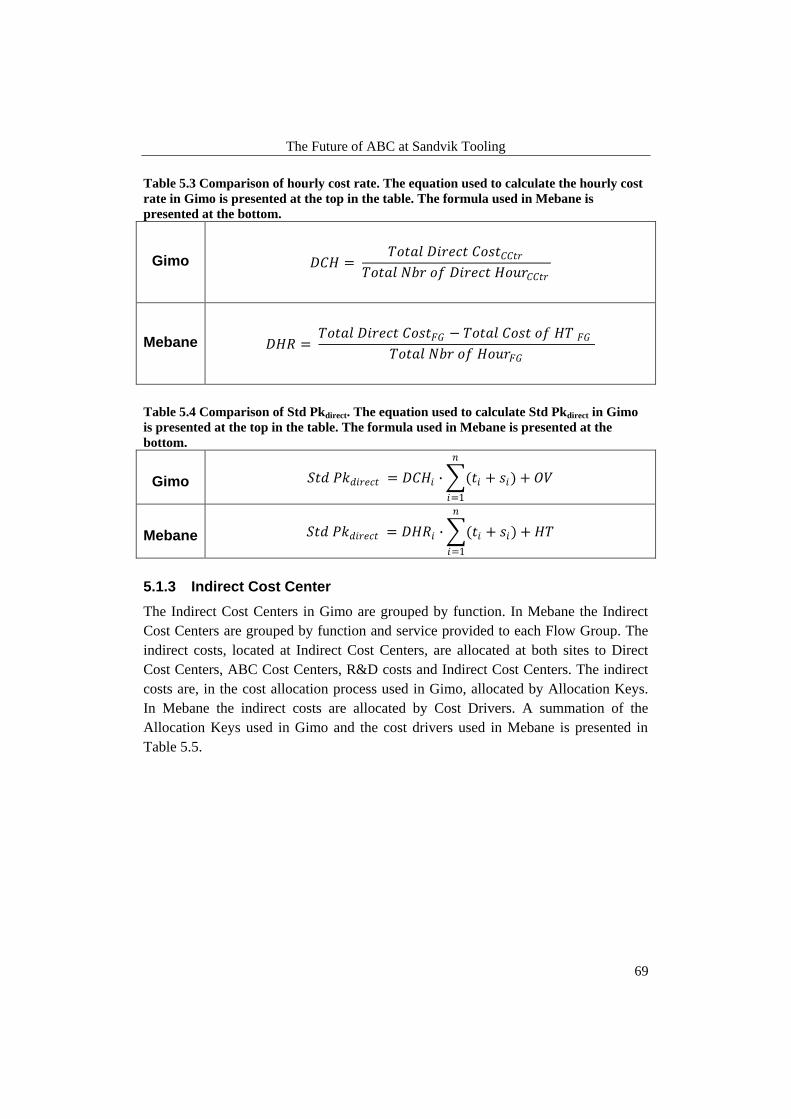
The Future of ABC at Sandvik Tooling
69
Table 5.3 Comparison of hourly cost rate. The equation used to calculate the hourly cost
rate in Gimo is presented at the top in the table. The formula used in Mebane is
presented at the bottom.
Gimo
𝐷𝐶𝐻 = 𝑇𝑜𝑡𝑎𝑙 𝐷𝑖𝑟𝑒𝑐𝑡 𝐶𝑜𝑠𝑡𝐶𝐶𝑡𝑟
𝑇𝑜𝑡𝑎𝑙 𝑁𝑏𝑟 𝑜𝑓 𝐷𝑖𝑟𝑒𝑐𝑡 𝐻𝑜𝑢𝑟𝐶𝐶𝑡𝑟
Mebane
𝐷𝐻𝑅 = 𝑇𝑜𝑡𝑎𝑙 𝐷𝑖𝑟𝑒𝑐𝑡 𝐶𝑜𝑠𝑡𝐹𝐺 − 𝑇𝑜𝑡𝑎𝑙 𝐶𝑜𝑠𝑡 𝑜𝑓 𝐻𝑇 𝐹𝐺
𝑇𝑜𝑡𝑎𝑙 𝑁𝑏𝑟 𝑜𝑓 𝐻𝑜𝑢𝑟𝐹𝐺
Table 5.4 Comparison of Std Pkdirect. The equation used to calculate Std Pkdirect in Gimo
is presented at the top in the table. The formula used in Mebane is presented at the
bottom.
Gimo 𝑆𝑡𝑑 𝑃𝑘𝑑𝑖𝑟𝑒𝑐𝑡 = 𝐷𝐶𝐻𝑖 ∙ (𝑡𝑖
𝑛
𝑖=1
+ 𝑠𝑖) + 𝑂𝑉
Mebane 𝑆𝑡𝑑 𝑃𝑘𝑑𝑖𝑟𝑒𝑐𝑡 = 𝐷𝐻𝑅𝑖 ∙ (𝑡𝑖 + 𝑠𝑖) + 𝐻𝑇
𝑛
𝑖=1
5.1.3 Indirect Cost Center
The Indirect Cost Centers in Gimo are grouped by function. In Mebane the Indirect
Cost Centers are grouped by function and service provided to each Flow Group. The
indirect costs, located at Indirect Cost Centers, are allocated at both sites to Direct
Cost Centers, ABC Cost Centers, R&D costs and Indirect Cost Centers. The indirect
costs are, in the cost allocation process used in Gimo, allocated by Allocation Keys.
In Mebane the indirect costs are allocated by Cost Drivers. A summation of the
Allocation Keys used in Gimo and the cost drivers used in Mebane is presented in
Table 5.5.

The Future of ABC at Sandvik Tooling
70
Table 5.5 Comparison of the mean used to split indirect costs. In the Gimo, it is done by
Allocation Keys, which are presented to the left in table. In Mebane, Cost Drivers are
used, which are presented to the right in the table.
Allocation Key
(Gimo)
Cost Driver
(Mebane)
Employees Space
Staff Machine Value
Worker Product Assortment
Own Cost Expendable Supplies and Mtrl Cost
Budget
Other Allocation Keys (Assortment,
Space etc.)
Rapair and Maintenance Budget
5.1.3.1 Allocating by Direct Cost Center
The process of allocating indirect costs to Direct Cost Centers in Gimo and in
Mebane is done in similar ways, with a slight difference in the mean of splitting the
indirect costs. In Gimo, the indirect costs are allocated by Allocation Keys, and in
Mebane, indirect costs are allocated by Cost Drivers. The indirect costs for both sites
are included in DCH or DHR and allocated to Std Pkdirect. The process of allocating
through Direct Cost Centers to Std Pkdirect is described in detail in Chapter 5.1.2
Direct Cost Center.
5.1.3.2 Allocating by ABC Cost Center
The process of allocating indirect costs to Std PkABC is made through ABC Cost
Centers. The ABC Cost Centers are, in Gimo, grouped by Cost Drivers and products
and in Mebane the ABC Cost Centers are grouped by Method of Charging Cost to
Standard Pk. The ABC costs are allocated to the Std PkABC by Cost Drivers and their
Rates, as well as by Method of Charging Cost to Standard Pk. A summation of the
Cost Drivers and their Rates as well as the Method of Charging Cost to Standard Pk is
presented in Table 5.6.

The Future of ABC at Sandvik Tooling
71
Table 5.6 Comparison of the mean for allocating ABC costs. In the Gimo the ABC costs
are allocated by Cost Driver and their Rates, which are presented to the left in table. The
allocation used in Mebane is presented to the right in the table. This is done by Method
of Charging Cost to Standard Pk.
Cost Driver
(Gimo)
Rate
(Gimo)
Method of Charging
Cost to Standard Pk
(Mebane)
Man-hour Cost per Man-hour Fixed Charge per ED
Piece
Assortment Cost per Assortment Fixed Charge per Other
Piece
WO Cost per WO Fixed Charge per ED WO
Volume Direct Cost Mark–Up Fixed Charge per WO
Other
Pk Mark–Up
The calculation of Std PkABC, for both sites, is presented in Table 5.7. As presented in
the table, the Std PkABC is calculated by the amount generated by the Cost Driver and
their Rates, as well as by Method of Charging Cost to Standard Pk. The Cost Driver
and their Rates, and Method of Charging Cost to Standard Pk differs between the two
sites and thereby the terms for calculating Std PkABC differs, except for the term Cost
per WO which both sites have in common.
Table 5.7 Comparison of Std PkABC. The equation used to calculate Std PkABC in Gimo is
presented at the top in the table. The formula used in Mebane is presented at the bottom.
Gimo
𝑆𝑡𝑑 𝑃𝑘𝐴𝐵𝐶 = 𝐶𝑀𝐻𝑖 ∙ (𝑡𝑖 + 𝑠𝑖)
𝑛
𝑖=1
+ 𝐷𝑖𝑟𝑒𝑐𝑡𝐶𝑜𝑠𝑡𝑀𝑎𝑟𝑘𝑈𝑝𝑖 ∙ 𝑆𝑡𝑑 𝑃𝑘𝑑𝑖𝑟𝑒𝑐𝑡
+𝐶𝐴𝑆𝑖
𝑁𝑏𝑟 𝑜𝑓 𝑃𝑖𝑒𝑐𝑒𝑖+
𝐶𝑊𝑂𝑖𝑁𝑏𝑟 𝑜𝑓 𝑃𝑖𝑒𝑐𝑒 𝑊𝑂𝑖
Mebane 𝑆𝑡𝑑 𝑃𝑘𝐴𝐵𝐶 = 𝐶𝑜𝑠𝑡 𝑝𝑒𝑟 𝑃𝑖𝑒𝑐𝑒 +𝐶𝑜𝑠𝑡 𝑝𝑒𝑟 𝑊𝑂
𝑁𝑏𝑟 𝑜𝑓 𝑃𝑖𝑒𝑐𝑒 𝑊𝑂
The formula for calculating Cost per WO, for both Gimo and Mebane, is presented in
Table 5.8. As illustrated in the table, in Gimo, the Cost per Order is dependent on
ABC Cost Center, and thereby all products may not be hit by the Cost of Order. In
Mebane the Cost of WO is split in two and calculated for two product groups, the ED
and Other. The products belonging to the ED Flow Group are hit by the Cost of Order
generated by Fixed Charge per ED WO and the remaining products are hit by the

The Future of ABC at Sandvik Tooling
72
Cost of Order generated by Fixed Charge per WO Other. In other words all products
in Mebane are hit by a Cost of Order.
Table 5.8 Comparison of Cost per WO. The equation used to calculate Std PkABC in
Gimo is presented at the top in the table. The formula used in Mebane is presented at the
bottom.
Gimo 𝐶𝑊𝑂 = 𝑇𝑜𝑡𝑎𝑙 𝐴𝐵𝐶 𝐶𝑜𝑠𝑡𝐶𝐶𝑡𝑟𝑇𝑜𝑡𝑎𝑙 𝑁𝑏𝑟 𝑜𝑓 𝑊𝑂𝐶𝐶𝑡𝑟
Mebane
𝐹𝑖𝑥𝑒𝑑 𝐶𝑎𝑟𝑔𝑒 𝑝𝑒𝑟 𝐸𝐷 𝑊𝑂 = 𝑇𝑜𝑡𝑎𝑙 𝐴𝐵𝐶 𝐶𝑜𝑠𝑡𝑊𝑂 𝐶𝑎𝑟𝑔𝑒 −𝐸𝐷
𝑇𝑜𝑡𝑎𝑙 𝑁𝑏𝑟 𝑜𝑓 𝐸𝐷 𝑊𝑂
𝐹𝑖𝑥𝑒𝑑 𝐶𝑎𝑟𝑔𝑒 𝑝𝑒𝑟 𝑊𝑂 𝑂𝑡𝑒𝑟 = 𝑇𝑜𝑡𝑎𝑙 𝐴𝐵𝐶 𝐶𝑜𝑠𝑡𝑊𝑂 𝐶𝑎𝑟𝑔𝑒 −𝑂𝑡𝑒𝑟
𝑇𝑜𝑡𝑎𝑙 𝑁𝑏𝑟 𝑜𝑓 𝑂𝑡𝑒𝑟 𝑊𝑂
After calculating the three groups of costs making up the Standard Pk – Std Pkmtrl, Std
Pkdirect and Std PkABC – the Standard Pk is calculated. These groups of costs are the
same at both plants, but they are built up differently as presented in Chapters 5.1.1
Direct Material Cost, 5.1.2 Direct Cost Center and 5.1.3 Indirect Cost Center. The
Standard Pk is also calculated differently; as presented in Table 5.9. The calculation
of Standard Pk in Gimo is obtained by summing up of the three parts and in Mebane
the three parts are first summed up and the multiplied by the Pk Mark–Up.
Table 5.9 Comparison of Std Pk. The equation used to calculate Std Pk in Gimo is
presented at the top of the table. The formula used in Mebane is presented at the bottom.
Gimo 𝑆𝑡𝑑 𝑃𝑘 = 𝑆𝑡𝑑 𝑃𝑘𝑚𝑡𝑟𝑙 + 𝑆𝑡𝑑 𝑃𝑘𝑑𝑖𝑟𝑒𝑐𝑡 + 𝑆𝑡𝑑 𝑃𝑘𝐴𝐵𝐶
Mebane 𝑆𝑡𝑑 𝑃𝑘 = (1 + 𝑃𝑘𝑀𝑎𝑟𝑘𝑈𝑝) ∙ (𝑆𝑡𝑑 𝑃𝑘𝑚𝑡𝑟𝑙 + 𝑆𝑡𝑑 𝑃𝑘𝑑𝑖𝑟𝑒𝑐𝑡 + 𝑆𝑡𝑑 𝑃𝑘𝐴𝐵𝐶 )
5.1.3.3 Allocating to R&D Cost
The Indirect Cost Centers, at both sites, allocate indirect costs to R&D costs. These
costs are not allocated to the Standard Pk, and are thereby not described further.
5.1.3.4 Allocating by Indirect Cost Center
The Indirect Cost Centers allocate indirect costs back to Indirect Cost Centers. This is
the case for the cost allocation process used both in Gimo and in Mebane. The loop –
Indirect Cost Center to Indirect Cost Center – is in the case of Gimo looped multiple
times, and in Mebane the loop is just looped once. The cost allocation process
through Indirect Cost Centers is presented in Chapter 5.1.3 Indirect Cost Center.
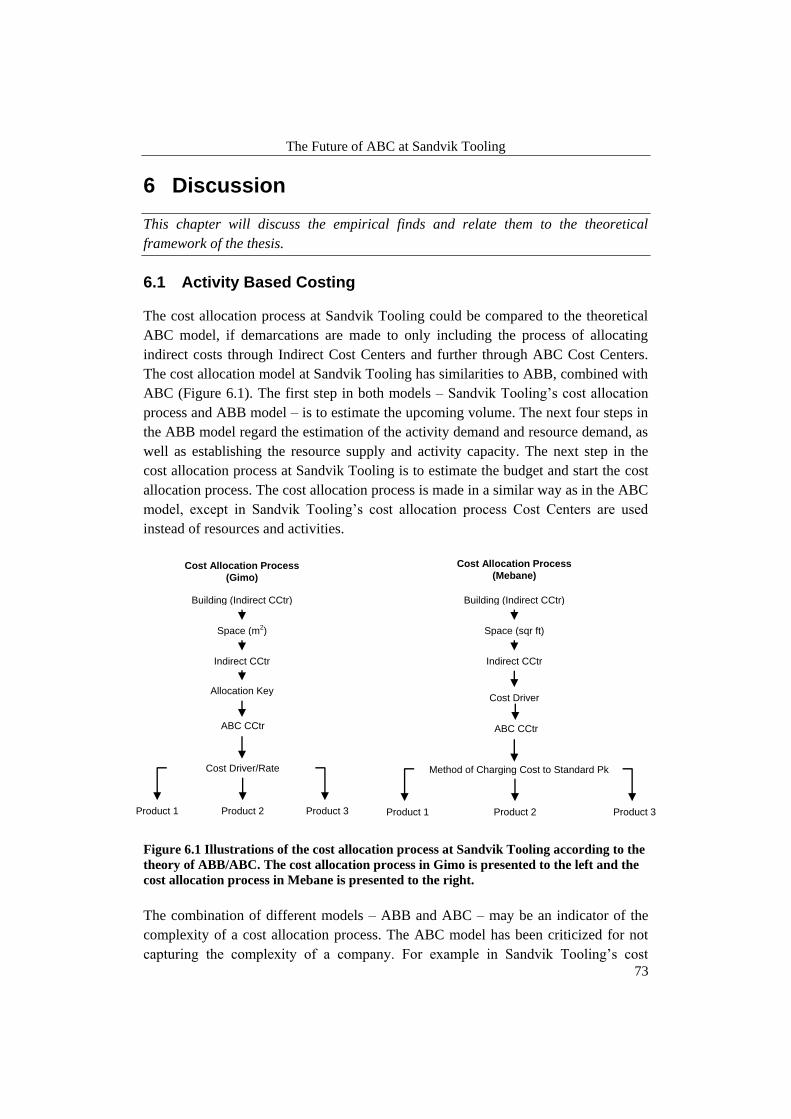
The Future of ABC at Sandvik Tooling
73
6 Discussion
This chapter will discuss the empirical finds and relate them to the theoretical
framework of the thesis.
6.1 Activity Based Costing
The cost allocation process at Sandvik Tooling could be compared to the theoretical
ABC model, if demarcations are made to only including the process of allocating
indirect costs through Indirect Cost Centers and further through ABC Cost Centers.
The cost allocation model at Sandvik Tooling has similarities to ABB, combined with
ABC (Figure 6.1). The first step in both models – Sandvik Tooling’s cost allocation
process and ABB model – is to estimate the upcoming volume. The next four steps in
the ABB model regard the estimation of the activity demand and resource demand, as
well as establishing the resource supply and activity capacity. The next step in the
cost allocation process at Sandvik Tooling is to estimate the budget and start the cost
allocation process. The cost allocation process is made in a similar way as in the ABC
model, except in Sandvik Tooling’s cost allocation process Cost Centers are used
instead of resources and activities.
Figure 6.1 Illustrations of the cost allocation process at Sandvik Tooling according to the
theory of ABB/ABC. The cost allocation process in Gimo is presented to the left and the
cost allocation process in Mebane is presented to the right.
The combination of different models – ABB and ABC – may be an indicator of the
complexity of a cost allocation process. The ABC model has been criticized for not
capturing the complexity of a company. For example in Sandvik Tooling’s cost
ABC CCtr
Cost Allocation Process
(Gimo)
Building (Indirect CCtr)
Indirect CCtr
Space (m2)
Allocation Key
Cost Driver/Rate
Product 2 Product 3 Product 1
ABC CCtr
Cost Allocation Process
(Mebane)
Building (Indirect CCtr)
Indirect CCtr
Space (sqr ft)
Cost Driver
Product 2 Product 3 Product 1
Method of Charging Cost to Standard Pk

The Future of ABC at Sandvik Tooling
74
allocation process costs are allocated in several steps – costs are allocated through
Indirect Cost Centers, ABC Cost Centers and Direct Cost Centers. In the theoretical
ABC model costs are first group by resources, then allocated to activities and further
down to the product. This few levels of allocation may not be possible to implement
in practice without an increase in the number of cost drives, leading to an increase in
complexity. A combination of the theoretical model and the practical use of it might
render the best result; limiting the number of cost drivers combined with a
minimization of the levels of allocations. Today the three parts making up the
Standard Pk are calculated differently as well as for the Standard Pk in total. A
standardization of the calculations is probably the first step in order to get a more
standardized process.
According to theory, transactions and complexity are closely linked to each other.
Several levels of allocations may be a source for the increase in transactions, for
example the looping within Sandvik Tooling’s cost allocation process, as well as their
use of several cost drivers. If the number of transactions is limited, it may be easier to
trouble shoot. There are advantages and disadvantages with having several allocation
steps and cost drivers. One thing to take into consideration is where to draw the line
in the terms of number of allocations and cost drivers. Instead of having a 1,000
mediocre transaction, it may be better to indentifying the 100 most important
transactions, and understand how they occur, where come from and where they go.
This clarity will with the trouble shooting process.
There is an additional risk with making the ABC model too complicated; the risk of
leaving people out of the model. Say an employee working on the shop floor starts
out by working only day shifts. Along the way, the same employee starts putting in
overtime and working night shifts. This will complicate the ABC model because there
are different pay checks to be given to the employee. Add in the time factor as well;
each hour for overtime or regular time has to be documented. The level and amount
of information is easy to acquire, but is all this information really necessary? At some
point the level of detail in the information has to start working against the company
rather than being useful.
Assume the same employee has a cost responsibility. Another way of testing if the
model is too complicated is checking if the employee knows why his or her division
is hit by the current amount of allocated costs. If the employee gets 50 percent of a
cost allocated to its unit, how should the employee check this percentage? This could
require a time consuming process, as pointed out earlier, a process of troubleshooting
that may be too complicated to fulfill. It may be a good idea to allow the employee in
this case to check if the amount allocated costs are reasonable, but if the process only
flows one way, then this result is not likely to be obtained.

The Future of ABC at Sandvik Tooling
75
6.1.1 Terminology
The terminology within Sandvik Tooling is not consistent with theory. However,
inspiration could be taken from theory in order to develop standardized terminology.
Allocation Key (Gimo) and Cost Driver (Mebane) could be seen as the practical
equivalent of a resource cost driver. Cost Driver (Gimo) and Method of Charging
may be regarded as activity cost driver. Lastly, Rate (Gimo) may be considered as an
activity cost driver rate.
The same term may have two meanings, for example the Cost Driver Assortment
(Gimo) and Product Assortment (Mebane). Assortment stands for the variety in the
product assortment, in other word numbers of articles. Product Assortment on the
other hand split the costs between the two groups, ED and Other; groups constituted
by several articles. A more correct name of the Cost Driver Product Assortment may
instead be Product Group. Having differences in terminology or using the terms with
different meanings may hamper the standardization of Sandvik Tooling’s cost
allocation process.
A standardized ABC model, used in a standardized information system, would lead to
taking a step further towards having comparable manufacturing sites. This would also
render the possibility to benchmark. But the question is how do you turn two sites that
are different in size, located at different sides of the world, that have different
traditions, cultures, unit of measures, into comparable units in terms of ABC? A
company is built up by resources and activities that make each unit unique. Should
the price for obtaining comparability be at the loss of uniqueness and flexibility? The
process of standardizing should be done in small steps and not to full extent. It is
important to point out that standardization should not be at the loss of uniqueness. If
say an idea about a new cost driver where to come up at a unit, it is important to
evaluate whether it could benefit the unit locally or even the gathered total of units.
Therefore it is important to constantly question, renew and update the ABC model.
In the case of the site in Mebane, we found that there were ideas concerning
customized cost drivers. Unfortunately, GSS could not be modified to meet this
demand. If the factors for tweaking an old information system to meet the
requirements, say for a new cost driver, the information system has an effect on how
the ABC model should be designed. Should the case not be the reverse? The
information system should meet the demands of the ABC model and not the other
way around. In the case of GSS, the modules are not well suited for ABC. Excel
spread sheets are used frequently when applying ABC to the Standard Pk. An
additional risk with trying to obtain comparable units, in terms of ABC data, is that if
The Future of ABC at Sandvik Tooling
76
information is too standardized that it may not be advanced enough to provide
reports.
6.2 Technical Solution
6.2.1 GSS Compatibility with ABC
Because GSS is built up by a number of modules, all having a part in the calculation
of Standard Pk, there is not an actual module with the sole purpose of calculating
ABC. The process of calculating the rates (such as DHR and Method of Charging
Cost to Standard Pk) for the Standard Pk is done in Excel spread sheets. The
downside with using Excel spread sheets, when working with ABC, is that there is
room for entering incorrect calculations. For example, if a rate has to be entered
manually into an information system, like the case with the DHR and Method of
Charging Cost to Standard Pk in GSS, then there is a risk that an incorrect value may
populate the information system, as well as the adjoining information systems. This
fault may in fact be corrected easily, but the process of trouble shooting may be time
consuming because the root problem might be located in several information systems
or even in an Excel spread sheet.
Entering rates into an information system may also lead to the manipulation of data. If
guidelines are sent out regarding how to construct the calculation of ABC costs, then
there is a risk that this kind of standardization will meet its purpose. Say the rates are
calculated outside the information system, in an Excel spread sheet, then the way the
rates have been calculated might have been tampered with in order to get a
satisfactory result that can be presented to supervisors. We are not saying that this is
the case in Mebane or at any other Sandvik Tooling facility, but for the sake of the
discussion this was deemed necessary to point out. It is important to see what
operations may exist behind an information system, especially if this information
system is old and not equipped to handle updated ABC models.
The diversified information system environment with GSS, and its adjoining
information systems, has lead to a lot of different takes how one information system
actually works in relation to one another and even their importance compared to each
other. When trying to map the information system environment at Sandvik Tooling
, depending on who we talked to, an information system could incorrectly be put at
the center of focus. In the case of Zenith and GSS, we found that depending who we
talked to; GSS could be a module within Zenith or an information system by itself. It
seems that, depending on the area in which an individual works and in which
information system, then the individual’s information system will be at the center of
focus. Although, this is a natural outcome since information systems or modules have
different functions and users, but there is a risk with not having a clear understanding

The Future of ABC at Sandvik Tooling
77
of how the information systems are intertwined. A change in one information system,
may affect another information system, and furthermore the user and his or her work.
The trouble with having a lot of transactions is that they might cause more trouble
than actually help. The issue with having several information systems that talk to each
other, like the case with GSS, is that a lot of transactions are created. Data is passed
from one information system to another. As pointed out with having a large number
of information systems building up the information system environment, this data
affects other employee’s work. When minimizing the number of transactions, and
identifying the key transaction, then the possibility of increasing traceability would be
obtained. It is important that everybody knows where the information they provide is
heading, and where the information they are getting comes from. Furthermore it is
important to understand what affects a change may have in one information system,
and what affect may have in another information system. Is a change automatically
rendered in the adjoining information systems if one information system is changed?
In terms of transactions, it is also important to question which information is actually
necessary for each individual to do their job. With a centralized control unit, that
wants to standardize other units, it is important to evaluate what information is
actually necessary and should be required of the unit. Some information may not even
be useful for reports. Given a high level of detail in an information system, then the
sky is limit to what information can be derived from the information system.
The positive aspect with GSS is that it is an in house built information system, and the
knowledge to support and maintain it lies within Sandvik Tooling’s walls. If in fact an
adjustment needs to be done, external consultants do not need to be contracted.
Furthermore, the fact that GSS is built up by several modules makes it more flexible
than one large information system, for example an ERP system.
An ERP system on the other hand has the advantages of the way it interacts with
control systems. If the ISA95 standard is used upon implementation, risks may be
avoided and costs may be lowered. However, this is, by our belief, only in theory. A
vast ERP system has to in the case at Sandvik Tooling be able to interact with several
in-house built information systems. These information systems might need further
modifications in order to be able to communicate with an ERP system. This may
contradict the ISA95 standard and its promise to lower costs. However, the standard
talks about the importance of having standardized terminology. As pointed out earlier,
a set of standardized terms in terms of ABC would be a valuable tool for Sandvik
Tooling.

The Future of ABC at Sandvik Tooling
78
The smaller modules can be tailored to meet the users’ demands, say for instance the
engineers’ needs in Skeleton versus the production managers’ needs in GSS MIS.
Further customization and updates need to be done to GSS concerning ABC, but
these changes may coincide with having to update the Standard Pk process.
A module for calculating ABC would allow the process of calculating the rates to be
more automated, rather than by doing it manually in Excel. Having these calculations
done in a separate module would help with populating the adjoining information
systems with the correct rates. If the rates are calculated in a standardized ABC
module, with standardized formulas, then the opportunity of benchmarking and
comparing units from all over the world may increase. The reports deriving from this
information would then be more focused, and the origin of the data could easily be
traced. A positive feature with GSS is also the possibility of “faking” the date for
going live with the Standard Pk. This encourages a more thorough process of
presenting the costs in as accurate terms as possible.
In the day of the computer era, there is also the possibility of making the ABC model
too complicated. Maybe it is more advantageous to do the calculations in Excel? It
would render a process that is less complex and it would keep things simple.
Sometimes the simplest answers may have the greatest impact. Doing the calculations
in Excel would also avoid the costs of investing in a new information system, if in
fact they are too old to be adjusted to newer ways of working. Having the ABC
calculations entirely done in Excel would give the individual calculating the rates an
increase in control. It would also offer the advantage of being able to customize the
calculation to meet local needs. Having the calculations done in Excel may also
indicate that the information systems are not equipped to handle the calculations of
ABC costs. The information systems could have become out of date and need an
update.
6.2.2 Practice versus Theory
The theoretical ABC model addresses the issue of making the model too complex to
implement or even to handle. Although, the academic theories regarding the model
seldom talk about having the features of the information system affect the complexity,
a practical ABC model is dependent on the information system environment. If the
information system is not updated, then the ABC model will not become state of the
art. The question is then, who controls who and who should calls the shots? One
measure that might be taken is to do to a wide spread information system update and
scrap all outdated information systems. Depending on the routines of the company,
say for example the cost allocation process at Sandvik Tooling, it may not be as easy
as it seems to start over from scratch. With a new information system the business
may be put at risk, employees will have to be trained, or there might be internal

The Future of ABC at Sandvik Tooling
79
political related issues hindering the change. It is important to realize that changing
information systems, and its adjoining processes, for instance a cost allocation
process, is a growing process. The trick is staying updated and not getting stuck in the
old ways of working.
An additional issue with the ABC model is that it does not address the issues with
having multiple sites, all having their own unique features, and how this should be
maintained. Companies that are present in multiple countries have to take into
consideration the differences among culture, traditions or more simple things like
terminology and unit of measure. A modern ABC model has to be flexible enough to
meet local needs. Academic theories seldom talk about this issue when designing the
ABC model. Having multiple information systems also renders an information system
environment where there are multiple flows of information. This flow stems to a final
source. It is therefore hard to troubleshoot and find the location of a problem since the
source of the information flow may come from multiple information systems.
TDABC is slightly less suitable for larger companies, where it is hard to do the
estimations that the model requires. The biggest risk with the model is that the
estimations may re-occur year to year, solely because the employees lack the
knowledge or willingness to evaluate the times they provide to the manager. If this is
the case, then the purpose of the model is not met. TDABC model could therefore
render results that are not all as reliable as the authors of the article leads the readers
to believe. We also believe that there might be a risk of, contrary to what the authors
might say, the model increasing complexity within a company after being
implemented for a number of years. In the case of Sandvik Tooling, and their
allocation processes with several loops, there might be a risk that TDABC may not
lead to decreasing complexity in the long run.
6.3 Merging ABC with Information Systems
6.3.1 Taking It to the Next Level
The more data that is entered into the information system, the more data needs to be
processed. This is a time consuming process. As mentioned earlier the academic
theories seldom talk about the risk of making the ABC models too time consuming in
relation to the information systems. They do talk about making them too complex in
terms of ABC variables, but in the day of the computer era, information systems may
do whatever you want them do to. The difficulty is to get the interaction between
ABC and information systems to interact in a way that prospers the other. The
difficulty is not to enter information into the information system; the difficulty is to
enter the correct information. Having the correct information attainable makes it

The Future of ABC at Sandvik Tooling
80
possible to process reports with relevant information. This information could then be
as the basis for decision making.
If employees are allowed to brain storm freely, the chances are that abundant
variables can be entered into the ABC model and the information systems. Everybody
may have their own personal preferences on what they want an information system to
do. For instance, a 1,000 cost drivers could be identified, but it is more difficult to
identify 100 that are the most crucial and important ones. This is linked to the
importance of finding the key transactions within the organization. A simple ABC
model, which is built up thoroughly with relevant information along with an
information system, may be a simple solution, even for a big company.
Sandvik Tooling's information system environment can according to theory be
classified as Stage II Systems. GSS alone can be classified as Stage II Systems. The
first step of reaching next stage – Stage III Systems – is to implement an ABC
system. Implementing an ABC module/information system in a worldwide company
with multiple sites, requires, a standardized cost allocation process. How should
standardization be performed? We believe the first step should be the standardization
of the terminology used at Sandvik Tooling's manufacturing sites. This might be a
complicated transformation because of the differences between units; each site has its
own history and way of working. Changing routines and starting all over with say a
new set of standardized terminology may be a slow and unsuccessful process that
beats the purpose. The less amount of standardization may on the other hand offer
each site an increase in control. This would not benefit taking ABC one step further
and using it for other means, such as benchmarking.
6.3.2 Points for Evaluating the Information System from an ABC Point of View
When deciding whether to invest in a new ABC, there are a certain number of factors
that should be taken into consideration. First and foremost, the existing information
system’s capacity and features should be mapped. The first standpoint to take is to
evaluate whether the information system fulfills its purpose and if it does what it is
supposed to do. The question whether a new information system is necessary should
also be posed since Excel may be an adequate tool. It should also be clearly specified
what the user wants the information system to do. Other standpoints that should be
taken into consideration are:
Extend existing information system – it may or may not be necessary to develop an
entirely new information system or module. The feature for building a new
information system may already exist within another information system.

The Future of ABC at Sandvik Tooling
81
Link to internal information systems – the new information system should be able
to communicate with existing information systems and have a working interface with
them. I should be possible to link data, in other words import and/or export data. This
link should be reliable.
Link to an external source – the information system should be able to import/export
data to Excel.
An information system by itself or a module within a larger information system
– this is important to consider because it might lead to eliminating redundancy in
information. The same information is not always necessary at multiple locations.
Be built in-house or purchased externally
Maintainable – the costs and resources of maintaining the information system should
not be at a great expense. The information system should also be easy to update.
Support updates – the information system should be able to be updated if a new
ABC model is introduced.
Customized features – the information system should have the option to customize
the features within the information system.
Accessible information – the information system should provide all parties working
within the information system with the information they need. The level of detail
should be relevant to the user.
User friendliness – It is important to evaluate whether the information system will
require a lot of training for the user.
Manual operation – rates could be entered manually into the information system
Calculate - ABC costs, indirect cost, direct cost and material cost
Provide reports – These reports should include information such as historic data and
valuable ABC information.
Traceable information – the information provided by the information system should
be traceable if it comes from another source
Multiple languages – not everybody speaks or is used to speaking/reading in
English.

The Future of ABC at Sandvik Tooling
82
6.4 Summation of the Discussion
Figure 6.2 illustrates a summation of the cost allocation process at Sandvik Tooling.
Like the theoretical triangle presented in Chapter 3.5 Summation of the Theoretical
framework, the overhead costs, or the indirect costs as they referred to at Sandvik
Tooling, are fed into the three points of the triangle. The dots within the ABC flow
illustrate that there is a loop going back to the previous steps. The transaction flow is
divided into several transactions that have not been singled out to being key
transactions. The technical solution is made up by an Excel solution that generates a
rate that is entered into GSS. This flow is presented in a lighter color because it is not
a solution that is tailored to meet the demands of an ABC model.
Figure 6.2 Summation of the Discussion.
Overhead Cost
Overhead Cost Overhead Cost
ABC
Technical Solution
Transactions
Product
Excel
System
DHR/Method of Charging Cost to Standard Pk
Information Flow
ABC CCtr
Cost Driver/Method of Charging Cost to Standard Pk
…
Allocation Key/Cost Driver
Indirect CCtr

The Future of ABC at Sandvik Tooling
83
7 Conclusions and Recommendations
This chapter will present the conclusions and recommendations according to our
discussion, empirical findings and theoretical framework.
The conclusions we have been able to draw regarding the information systems
environment at Sandvik Tooling is that it is crucial to keep the information systems
updated. It is also important provide the employees information about how the
information system environment is built up. This would facilitate the trouble shooting
process. We found that there are many views on how the information system
environment is built up. In the case of Sandvik Tooling, the old information systems
have too much control. If an information system is too old, then the case with
developing an ABC model is that it will be adjusted to the information system. We
believe it should be the reversed scenario – the ABC model sees few limits with the
possibilities of development in the information system.
The compatibility of GSS in terms of ABC is deemed as inadequate. If GSS is to be
installed in Gimo, we would recommend the development of an ABC module. This
module should be able to communicate with the adjoining modules of GSS. Another
alternative is to develop more advanced Excel spread sheets and then linking them to
the GSS modules. Either course of action should be done internal within Sandvik
Tooling’s walls.
An additional conclusion is drawn regarding the standardization of units. In order to
make it possible to develop/design and implement ABC modules, standardization of
the terminology, as well as parts of the calculation making up the Standard Pk, is
necessary. Standardization of the terminology may also facilitate the communication
between units, as well as for benchmarking purposes in the future. Inspiration for new
terminology may be found in the theoretical framework presented in this thesis.
Suggested terminology is as follows:
1. Renaming Allocation Key (Gimo) and Cost Driver (Mebane) to resource cost
driver
2. Renaming Cost Driver (Gimo) and Method of Charging Cost to Standard Pk
(Mebane) to activity cost driver
3. Referred to the Rates (Gimo) as activity cost driver rate
A conclusion we have drawn, with our theoretical framework and our empirical
foundation, is that complexity is a villain when it comes to designing ABC models
and the relating information systems. As we have pointed out earlier, we believe the

The Future of ABC at Sandvik Tooling
84
key to success is identifying the 100 most important transactions, resources/activities
or cost drivers, instead of having a 1,000 that are not used. We believe it is important
to do this cut, and then provide information that can be used by each production site.
This would create a clear picture of the organization, as well as being in line with
benchmarking. It would also increase traceability and facilitate trouble shooting. As
pointed out earlier, it is important that employees are familiar with the design of the
information system environment and ABC model. This would facilitate the process of
knowing who to contact if a problem were arise.
The Future of ABC at Sandvik Tooling
85
List of References
Printed Sources
Alvesson, Mats and Sköldberg, Kaj (1994) Tolkning och reflektion –
Vetenskapsfilosofi och kvalitativ metod Studentlitteratur, Lund.
Bruns, William J. and Kaplan, Robert S. (1987) Accounting and Management – A
Field Study Perspective Harvard Business Scholl Press.
Cooper, Robin and Kaplan, Roberts S. (1998) Cost and Effect – Using Integrated
Cost Systems to Drive Profitability and Performance Harvard Business School Press.
Forrest, Edward (1996) Activity Based Management – A Comprehensive
Implementation Guide McGrawy-Hill.
Frost, William (2005) ABCs of Activity Based Management – Crushing Competition
Through Performance Improvement iUniverse.
Holme, Idar Magne and Solvang, Bernt Krohn (1997) Forskningsmetodik – Om
kvalitativa och kvantitativa metoder Studentlitteratur, Lund.
Jacobsen, Dag Ingvar (2002) Vad, hur och varför? – Om metodval i företagsekonomi
och andra samhällsvetenskapliga ämnen Studentlitteratur, Lund.
Lundahl, Ulf and Skärvad, Per-Hugo (1999) Utredningsmetodik för samhällsvetare
och ekonomer Studentlitteratur, Lund.
Rienecker, Lotte and Jörgensen, Peter Stray (2020) Att skriva en bra uppsats Liber.
Stålh, Jan-Eric (2007) Industriella Tillverkningssystem – Länken mellan teknik och
ekonomi Lund Universitet.
Academic Articles
Ainsworth, Penne (1995) “ABC overhead analysis beats traditional approach” The
Practical Accountant Volume: 28 Issue: 7 Page: 49-55.
Anderson, Steven R and Kaplan, Robert S. (2004) “Time-Driven Activity-Based
Costing” Harvard Business Review Volume: 82 Issue: 11 Page: 131-138.
Banker, Rajiv D.,Bardhan, Indranil R. and Chen, Tai-Yuan (2008) ”The role of
manufacturing practices in mediating the impact of activity-based costing on plant
performance” Accounting Organization and Society Volume: 33 Issue: 1 Page: 1-19.
Banker, Rajiv D., Potter, Gordon and Schroeder, Roger G. (1995) “An empirical
analysis of manufacturing overhead cost drivers” Journal of Accounting & Economics
Volume: 19 Issue: 1 Page: 115-138.
The Future of ABC at Sandvik Tooling
86
Baxendale, Sidney J. and Jama Farah (2003) ”What ERP Can Offer” Strategic
Finance Volume: 85 Issue: 2 Page: 54-57.
Chung, Sheng-Luen and Jeng MuDer (2002) ”Manufacturing Execution System
(MES) for Semiconductor Manufacturing” Systems, Man and Cybernetics,2002 IEEE
International Conference on Volume: 4 Page: p. 7-11.
Cooper, Robin and Kaplan, Robert S. (1988) “Measure Costs Right: Make the Right
Decisions” Harvard Business Review Volume: 66 Issue: 5 Page: 96-104.
Cooper, Robin and Kaplan, Robert S. (1998) “The Promise – and Peril – of Integrated
Cost Systems” Harvard Business Review Volume: 76 Issue: 4 Page: 109-119.
Daing Nasir Ibrahim and Ruhanita Maelah (2007) “Factors Influencing Activity
Based Costing (ABC) Adoption in Manufacturing Industry” Investment Management
and Financial Innovations Volume: 4 Issue: 2 Page: 113-124.
Higgins, Brian K. and Young, S. Mark (2001) “Improving operations: Not as simple
as ABC” Journal of Corporate Accounting & Finance Volume: 12 Issue: 3 Page: 15-
34.
Homburg, Carsten (2001) “A note on optimal cost driver selection in ABC”
Management Accounting Research Volume: 12 Issue: 2 Page: 197-205.
ISA-95.00.01-2000 (2000) “Enterprise-Control System Integration, Part 1: Models
and Terminology”
Johnson, Thomas H. (1988) “Activity-Based Information: A blueprint for World-
Class Management Accounting” Management Accounting Volume: 69 Issue: 12
Page: 23-31.
Nilsson, Carl-Henric (1994) “Methodological Reflections, Extended Version”
Working Paper: Dep of Industrial Engineering, The Faculty of Engineering at Lunds
University and School of Economic and Management at Lunds University.
Miller, Jeffrey G. and Vollman, Thomas E. (1985) ”The Hidden Factory” Harvard
Business Review Volume: 63 Issue: 5 Page: 142-151.
Raab, Carola and Mayer, Karl J. (2004)“Exploring the Use of Activity Based Costing
in the Restaurant Industry” Haworth Press Volume: 4 Issue: 2 Page: 79-96.
Serritzlew, Sören (2006) “Lining Budget to Activity: A Test of the Effect of Output-
Purchase Budgeting” Public Budgeting & Finance Volume: 26 Issue: 2 Page: 101-
120.
Thyssen, Jesper, Israelsen, Poul and Jorgensen, Brian (2006) “Activity-based costing
as a method for assessing the economics of modularization – A case study and
beyond” International Journal of Production Economics Volume: 103 Issue: 1 Page:
252.

The Future of ABC at Sandvik Tooling
87
Varíla, Mikko, Seppänen, Marko and Suomala, Petri (2007) “Detailed cost modeling:
a case study in warehouse logistic” International Journal of Physical Distribution &
Logistics Management Volume: 37 Issue: 3 Page: 184.
Electronic Sources
Sandvik AB, home page, http://www.sandvik.com, January 20 2008.
Singh, Mohini and Waddel Di (2004) E-Business Innocation and Change
Management Hershey.
Information providers
Andersson, Karin, Head of Finance Department, Interview February 1, February 19
and March 4 2008.
Barber, Jon, General Manager Tooling Supply US/Mebane, Interview March 29
2008.
Gauffin,Veroni, Cost Accountant, Interview January 1 2008.
Giardino-Gray, Norma, Financial Manager Tooling Supply NAFTA, Interview
February 7, February 25, April, 16, April 28, April 29 and May 2 2008.
Gunnarsson-Wahlund, Annika, Cost Accountant, Interview February 18, April 1,
April 23 and April 30 2008.
Jacobsson, Mats, Business Controller, Interview January 16, January 19, January 22,
January 24, April 23 and April 28 2008.
Kaminski, Bernard, Production Manager, Interview March 16 2008.
Kennedy, Cindy, Controller, Interview March 11, March 13, March 14, March 19 and
April 29 2008.
Lindberg, Tomas, Project Leader, Interview February 7 and March 18 2008.
Lundal, Dan, Production Controller, Interview March 25 2008.
Ögren, Thomas, Process and System Co-Ordinator, Interview February 8 2008.

The Future of ABC at Sandvik Tooling
88
Appendix I
Plant Layout185
Different elements decide the positioning of the manufacturing machines and the
layout of a plant. The layout may be determined by the manufacturing process, in
other word the handling of material within the value added process of manufacturing
or by the machines physical location. The plant layout may have three categories:
Layout by Operation, Flow Based Layout, and Layout by Product. Which one to
choose, is often made by the volume of manufacturing, or the flow of product through
the manufacturing plant.
Layout by Operation
A Layout by Operation is a layout where the machines, within the manufacturing
plant, are positioned by operation. The Layout by Operation is best suitable for a wide
product assortment, since the operational sequences can be modified to follow an
individual product’s needs. The downside is a complicated flow of handling of
material, long internal transports and the rise of queue lines in front of the machines.
The Layout by Operation is illustrated in Figure 0.1.
Figure 0.1 The Layout by operation. The figure illustrates an example of a plant layout,
where the machines are arranged by operation. Each machine is presented by a symbol
– triangle, circle or square and different manufacturing operations are illustrated by
different shapes of symbols; a triangle is equal to drilling, a circle turning and a square is
equal to the manufacturing operation, milling. The manufacturing process, for a
product, is illustrated by the line with arrow showing the direction through the plant.
185 Stålh, J-E. (2007), p. 22-23.
Drilling
Turning
Milling
The Flow of
Operation

The Future of ABC at Sandvik Tooling
89
Flow Based Layout
In a Flow Based Layout the machines are position by operational sequence for a
product, and not by the operation of the machines. The favorable side of this type of
layout, is that it generates a high speed throughout the manufacturing. The downside
on the other hand, is the many fixed setups. The manufacturing types most suitable
for the Flow Based Layout, are mass production and products consisting of several
manufacturing operations. The Flow Based Layout is illustrated in Figure 0.2.
Figure 0.2 The Flow Based Layout. The figure illustrates an example of a plan layout,
where the machines are positioned by the operation flow of sequence for a product. As
for the Figure 0.1 the machines are illustrated by symbols – triangle equals drilling,
circle equals turning and square equals milling. The manufacturing flow through the
plant is presented by a line and arrows.
Layout by Product
The characteristic of the third category, Layout by Product, are different operations,
For example, operations such as processing and assembling takes place in one spot
because of the size or the weight of a product manufactured within the manufacturing
area which makes moving of the product difficult. Example of products, using Layout
of Product, are airplanes, ships and houses.
Drilling
Turning
Milling
The Flow of Operation