Embed Size (px)
Citation preview

12.1.1 The Fundamental Counting Principle
The sun is an active star, which produces solar flares (F) and explosions of gas clouds (C). Astronomers keep watch for these events because they can harm satellites and astronauts in space. Predicting when the next storm will happen is not easy to do. The problems below are solved by writing out all of the possibilities, then calculating the probability of the particular outcome! Solar flare photo courtesy TRACE/NASA
Problem 1 – During a week of observing the sun, astronomers detected 1 solar flare (F). What was the probability (as a fraction) that it happened on Wednesday? Problem 2 – During the same week, two gas clouds were ejected (C), but not on the same days. What is the probability (as a fraction) that a gas cloud was ejected on Wednesday? Problem 3 – Suppose that the flares and the gas clouds had nothing to do with each other, and that they occurred randomly. What is the probability (as a fraction) that both a flare and a gas cloud were spotted on Wednesday? (Astronomers would say that these phenomena are uncorrelated because the occurrence of one does not mean that the other is likely to happen too).
Space Math http://spacemath.gsfc.nasa.gov

Answer Key 1 – Answer: There are only 7 possibilities: F X X X X X X X X X F X X X X X X X X X F X F X X X X X X X X X F X X X X F X X X X X X X X X F X So the probability for any one day is 1/7. 2 – Here we have to distribute 2 storms among 7 days. For advanced students, there are 7! / (2! 5!) = 7 x 6 / 2 = 21 possibilities which the students will work out by hand: C C X X X X X X C C X X X X X X C C X X X X X X C C X X C X C X X X X X C X C X X X X X C X C X X X X X C X C X C X X C X X X X C X X C X X X X C X X C X X X X C X X C C X X X C X X X C X X X C X X X C X X X C X X X X C C X C X X X X C X X C X X X X C X X X X C X C C X X X X X C X X X X X C C There are 6 possibilities (in red) for a cloud appearing on Wednesday (Day 3), so the probability is 6/21. 3 – We have already tabulated the possibilities for each flare and gas cloud to appear separately on a given day. Because these events are independent of each other, the probability that on a given day you will spot a flare and a gas cloud is just 1/7 x 6/21 or 6/147. This is because for every possibility for a flare from the answer to Problem 1, there is one possibility for the gas clouds. There are a total of 7 x 21 = 147 outcomes for both events taken together. Because there are a total of 1 x 6 outcomes where there is a flare and a cloud on a particular day, the fraction becomes (1 x 6)/147 = 6/147.
12.1.1
Space Math http://spacemath.gsfc.nasa.gov

12.1.2 The Fundamental Counting Principle
The sun is an active star, which produces solar flares (F) and explosions of gas clouds (C). Astronomers keep watch for these events because they can harm satellites and astronauts in space. Predicting when the next storm will happen is not easy to do. The problems below are solved by writing out all of the possibilities, then calculating the probability of the particular outcome! Photo of a coronal mass ejection courtesy SOHO/NASA.
Problem 1 – During a particularly intense week for solar storms, three flares were spotted along with two massive gas cloud explosions. What is the probability (as a fraction) that none of these events occurred on Friday? Problem 2 - Does the probability matter if we select any one of the other 6 days?
Space Math http://spacemath.gsfc.nasa.gov

12.1.2 Answer Key
Problem 1 – Here we have to distribute 2 cloud events (C) among 7 days. For advanced students, there are 7! / (2! 5!) = 7 x 6 / 2 = 21 possibilities which the students will work out by hand, in this case starting with Monday as the first place in the sequence: C C X X X X X X C C X X X X X X C C X X X X X X C C X X C X C X X X X X C X C X X X X X C X C X X X X X C X C X C X X C X X X X C X X C X X X X C X X C X X X X C X X C C X X X C X X X C X X X C X X X C X X X C X X X X C C X C X X X X C X X C X X X X C X X X X C X C C X X X X X C X X X X X C C Next, we have to distribute 3 flares (F) among 7 days. There will be 7! / (3! 4!) = (7 x 6 x 5) /(3 x 2) = 35 possibilities as follows: F F F X X X X F X X F F X X X F F F X X X X X F F F X X F F X F X X X F X X F X F X X F F X F X X X X F F X F X F F X X F X X F X X F X X F X F F X X F X X X F F X X F F F X X X F X F X X X F F X X F F X X X F X X F X F F X F F X X X X F F X X X F X F X F X F F X X X X F X F X F F X F F X X X F X X X X F F X F X F X F X X X F X X F F F X F X F X X X F X F X X F X X X F F F X F X F X X F X X F X X F F X X X X F F X F F X F X X X F X F X X F X F X X X F X F F X F X X X F F X X X X F F F For each cloud event (21 possibilities) there are 35 possibilities for flare events, so the total number of arrangements is 21 x 35 = 735. Friday is the fifth location in each sequence. The number of sequences of cloud events in which no cloud appears in the fifth slot is highlighted in red. There are 15 possibilities. For the solar flares, there are 20 possibilities, so because these are independent, the total number is 15 x 20 = 300. So, the probability that there will be no solar storms on Friday is 300/735 Problem 2 – Students may redo the calculation for any of the other days. The resulting probability should always be 300/735. This is because the events are not correlated with any particular day, so the day choice is random as well.
Space Math http://spacemath.gsfc.nasa.gov
12.1.3The Fundamental Counting Principle
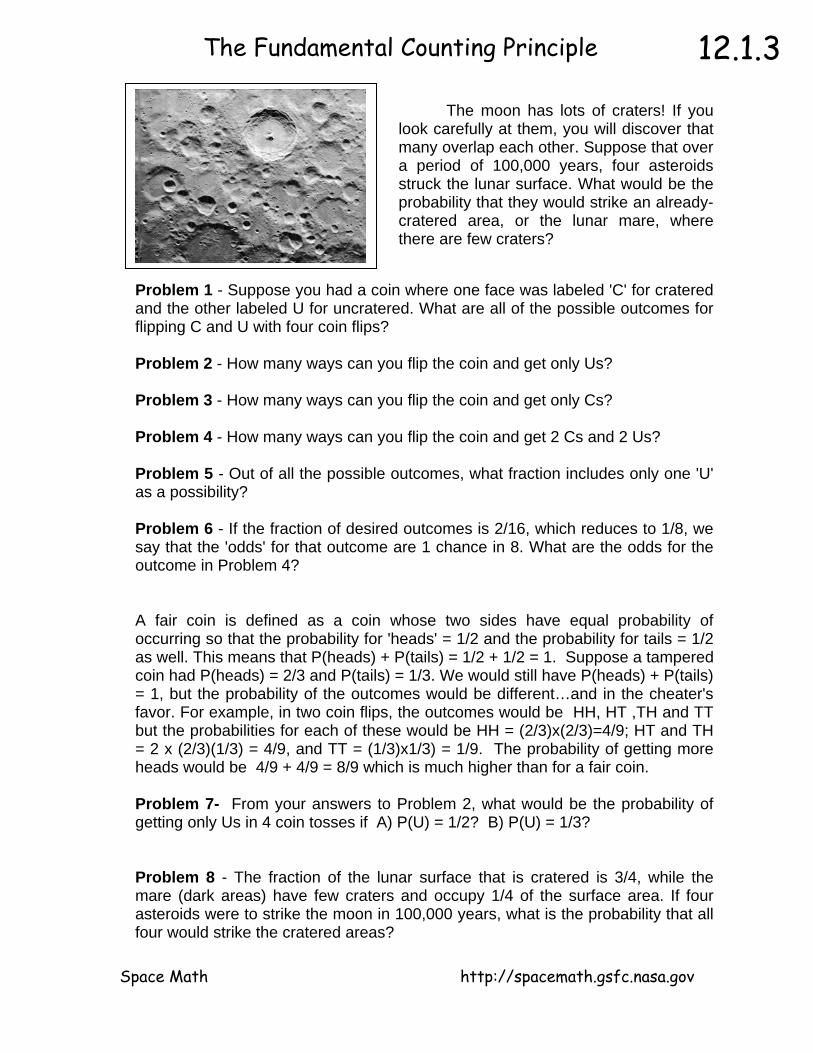
The moon has lots of craters! If you look carefully at them, you will discover that many overlap each other. Suppose that over a period of 100,000 years, four asteroids struck the lunar surface. What would be the probability that they would strike an already-cratered area, or the lunar mare, where there are few craters?
Problem 1 - Suppose you had a coin where one face was labeled 'C' for cratered and the other labeled U for uncratered. What are all of the possible outcomes for flipping C and U with four coin flips? Problem 2 - How many ways can you flip the coin and get only Us? Problem 3 - How many ways can you flip the coin and get only Cs? Problem 4 - How many ways can you flip the coin and get 2 Cs and 2 Us? Problem 5 - Out of all the possible outcomes, what fraction includes only one 'U' as a possibility? Problem 6 - If the fraction of desired outcomes is 2/16, which reduces to 1/8, we say that the 'odds' for that outcome are 1 chance in 8. What are the odds for the outcome in Problem 4? A fair coin is defined as a coin whose two sides have equal probability of occurring so that the probability for 'heads' = 1/2 and the probability for tails = 1/2 as well. This means that P(heads) + P(tails) = 1/2 + 1/2 = 1. Suppose a tampered coin had P(heads) = 2/3 and P(tails) = 1/3. We would still have P(heads) + P(tails) = 1, but the probability of the outcomes would be different…and in the cheater's favor. For example, in two coin flips, the outcomes would be HH, HT ,TH and TT but the probabilities for each of these would be HH = (2/3)x(2/3)=4/9; HT and TH = 2 x (2/3)(1/3) = 4/9, and TT = (1/3)x1/3) = 1/9. The probability of getting more heads would be 4/9 + 4/9 = 8/9 which is much higher than for a fair coin. Problem 7- From your answers to Problem 2, what would be the probability of getting only Us in 4 coin tosses if A) P(U) = 1/2? B) P(U) = 1/3? Problem 8 - The fraction of the lunar surface that is cratered is 3/4, while the mare (dark areas) have few craters and occupy 1/4 of the surface area. If four asteroids were to strike the moon in 100,000 years, what is the probability that all four would strike the cratered areas?
Space Math http://spacemath.gsfc.nasa.gov

Answer Key Problem 1 - The 16 possibilities are as follows: C U U U C C U U U C U C C U C C U C U U C U C U U U C C U C C C U U C U C U U C C C C U C C C C U U U C U C C U C C U C U U U U Note if there are two outcomes for each coin flip, there are 2 x 2 x 2 x 2 = 16 independent possibilities. Problem 2 - There is only one outcome that has 'U U U U' Problem 3 - There is only one outcome that has 'C C C C' Problem 4 - From the tabulation, there are 6 ways to get this outcome in any order. Problem 5 - There are 4 outcomes that have only one U out of the 16 possible outcomes, so the fraction is 4/16 or 1/4. Problem 6 - The fraction is 6 / 16 reduces to 3/8 so the odds are 3 chances in 8. Problem 7: A) There is only one outcome with 'U, U, U, U', and if each U has a probability of 1/2, then the probability is (1/2) x (1/2) x (1/2) x (1/2) = 1/16 B) If each U has a probability of 1/3, then the probability is (1/3) x (1/3) x (1/3) x (1/3) = 1/81 Problem 8 - P(U) = 1/4 while P(C)= 3/4, so the probability that all of the impacts are in the cratered regions is the outcome C C C C , so its probability is (3/4) x (3/4) x (3/4) x (3/4) = 81 / 256 = 0.32.
12.1.3
Space Math http://spacemath.gsfc.nasa.gov

12.2.1 Combinations and the Binomial Theorem
Solar storms can affect our satellite and electrical technologies, and can also produce health risks. For over 100 years, scientists have kept track of these harsh ‘space weather’ events, which come and go with the 11-year sunspot cycle. During times when many sunspots are present on the solar surface, daily storms are not uncommon. These storms come in two distinct types: Solar flares, which cause radio interference and health risks, and coronal mass ejections, which affect satellites and cause the Northern Lights.
Problem 1 – During a particular week in 2001, on a given day of the week, the Sun produced either a coronal mass ejection, S, or an X-ray solar flare, X. Use the Binomial Theorem to compute all of the possible terms for (S + X)7 that represents the number of possible outcomes for S and X on each of the seven days. Problem 2 – What does the term represented by 7C3 S
4X
3 = 21 S
4X
3 represent?
Problem 3 – In counting up all of the possible ways that the two kinds of storms can occur during a 7-day week, what are the most likely number of S and X-type storms you might expect to experience during this week? Problem 4 – How much more common are weeks with 3 S-type storms and 4 X-type storms than weeks with 1 S-type storm and 6 X-type storms?
Space Math http://spacemath.gsfc.nasa.gov

Answer Key 12.2.1 Problem 1 – During a particular week in 2001, on a given day of the week, the Sun
produced either a coronal mass ejection, S, or an X-ray solar flare, X. Use the Binomial Theorem to compute all of the possible terms for (S + X)7. Answer: The Binomial expansion is
7C7 S0X
7 + 7C6 S
1X
6 + 7C5 S
2X
5 + 7C4 S
3X
4 + 7C3 S
4X
3 + 7C2 S
5X
2 + 7C1 S
6X
1
+7C0 S7X
0
which can be evaluated using the definition of nCr to get: = X
7 + 7 S
1X
6 + 21 S
2X
5 + 35 S
3X
4 + 35 S
4X
3 + 21 S
5X
2 + 7 S
6X
1 + S
7
Problem 2 – What does the term represented by 7C3 S
4X
3 = 21 S
4X
3 represent?
Answer: If you were to tally up the number of ways that 4 S-type storms and 3 X-type storms could be distributed among the 7 days in a week, you would get 21 different ‘line ups’ for the sequence of these storms. For instance during the 7 consecutive days, one of these would be S,X,X,S,S,X,S Problem 3 – In counting up all of the possible ways that the two kinds of storms can occur during a 7-day week, what are the most likely number of S and X-type storms you might expect to experience during this week? Answer: The two possibilities consisting of 3 days of S-type and 4 days of X-type storms, and 4 days of S-type and 3 days of X-type storms each have the largest number of possible combinations: 35. Problem 4 – How much more common are weeks with 3 S-type storms and 4 X-type storms than weeks with 1 S-type storm and 6 X-type storms? Answer: From the Binomial Expansion, the two relevant terms are 7 S
1X
6 and 35
S3X
4. The ratio of the leading coefficients gives the ratio of the relative frequency
from which we see that 35/7 = 5 times more likely to get 3 S-type and 4 X-type storms.
Space Math http://spacemath.gsfc.nasa.gov

12.2.2 Combinations and the Binomial Theorem
Solar storms can affect our satellite and electrical technologies, and can also produce health risks. For over 100 years, scientists have kept track of these harsh ‘space weather’ events, which come and go with the 11-year sunspot cycle. During times when many sunspots are present on the solar surface, daily storms are not uncommon. These storms come in two distinct types: Solar flares, which cause radio interference and health risks, and coronal mass ejections, which affect satellites and cause the Northern Lights.
Problem 1 – During a particular week in 2001, on a given day of the week, the Sun produced either a coronal mass ejection, S, or an X-ray solar flare, X. From an additional study, astronomers determined that it is twice as likely for a coronal mass ejection to occur than an X-ray solar flare. Use the Binomial Theorem to compute all of the possible terms for (2S + X)7. Problem 2 – How much more common are weeks with 5 S-type storms and 2 X-type storms than weeks with 1 S-type storm and 6 X-type storms?
Space Math http://spacemath.gsfc.nasa.gov
Answer Key 12.2.2 Problem 1 – During a particular week in 2001, on a given day of the week, the Sun
produced either a coronal mass ejection, S, or an X-ray solar flare, X. From an additional study, astronomers determined that it is twice as likely for a coronal mass ejection to occur than an X-ray solar flare. Use the Binomial Theorem to compute all of the possible terms for (2S + X)7. Answer: First let a = 2S and b = X, then use the binomial expansion to determine (a + b)
7 :
7C7 a0b
7 + 7C6 a
1b
6 + 7C5 a
2b
5 + 7C4 a
3b
4 + 7C3 a
4b
3 + 7C2 a
5b
2 + 7C1 a
6b
1
+7C0 a7b
0
which can be evaluated using the definition of nCr to get: = b
7 + 7 a
1b
6 + 21 a
2b
5 + 35 a
3b
4 + 35 a
4b
3 + 21 a
5b
2 + 7 a
6b
1 + a
7
now substitute a = 2S and b = X to get = X
7 + 14 S
1X
6 + 84 S
2X
5 + 280 S
3X
4 + 560 S
4X
3 + 672 S
5X
2 + 448 S
6X
1 + 128S
7
Problem 2 – How much more common are weeks with 5 S-type storms and 2 X-type storms than weeks with 1 S-type storm and 6 X-type storms? Answer: The two relevant terms are 14 S
1X
6 and 672 S
5X
2. The ratio of the
leading coefficients gives the ratio of the relative frequency from which we see that 672/14 = 48 times more likely to get 5 S-type and 2 X-type storms.
Space Math http://spacemath.gsfc.nasa.gov

12.4.1 Probability of Compound Events
One of the most basic activities that scientists perform with their data is to look for correlations between different kinds of events or measurements in order to see if a pattern exists that could suggest that some new 'law' of nature might be operating. Many different observations of the Sun and Earth provide information on some basic phenomena that are frequently observed. The question is whether these phenomena are related to each other in some way. Can we use the sighting of one phenomenon as a prediction of whether another kind of phenomenon will happen? During most of the previous sunspot cycle (January-1996 to June-2006), astronomers detected 11,031 coronal mass ejections, (CME: Top image) of these 1186 were 'halo' events. Half of these were directed toward Earth. During the same period of time, 95 solar proton events (streaks in the bottom image were caused by a single event) were recorded by the GOES satellite network orbiting Earth. Of these SPEs, 61 coincided with Halo CME events. Solar flares (middle image) were also recorded by the GOES satellites. During this time period, 21,886 flares were detected, of which 122 were X-class flares. Of the X-class flares, 96 coincided with Halo CMEs, and 22 X-class flares also coincided with 22 combined SPE+Halo CME events. There were 6 X-flares associated with SPEs but not associated with Halo CMEs. A total of 28 SPEs were not associated with either Halo CMEs or with X-class solar flares. From this statistical information, construct a Venn Diagram to interrelate the numbers in the above findings based on resent NASA satellite observations, then answer the questions below.
1 - What are the odds that a CME is directed toward Earth? 2 - What fraction of the time does the sun produce X-class flares? 3 - How many X-class flares are not involved with CMEs or SPEs? 4 - If a satellite spotted both a halo coronal mass ejection and an X-class solar flare, what is the probability that a solar proton event will occur? 5 - What percentage of the time are SPEs involved with Halo CMEs, X-class flares or both? 6 - If a satellite just spots a Halo CME, what are the odds that an X-class flare or an SPE or both will be observed? 7 - Is it more likely to detect an SPE if a halo CME is observed, or if an X-class flare is observed? 8 - If you see either a Halo CME or an X-class flare, but not both, what are the odds you will also see an SPE? 9 - If you observed 100 CMEs, X-class flares and SPEs, how many times might you expect to see all three phenomena?
Space Math http://spacemath.gsfc.nasa.gov

12.4.1Answer Key:
Venn Diagram Construction. 1. There are 593 Halo CMEs directed to Earth so 593 = 74 with flares + 39 with SPEs + 22 both SPEs and Flares + 458 with no SPEs or Flares.. 2. There are 95 SPEs. 95 = 39 with CMEs + 6 with flares + 22 with both flares and CMEs + 28 with no flares or CMEs 3. There are 122 X-class flares. 122 = 74 With CMEs only + 6 with SPEs only + 22 both CMEs and SPEs + 20 with no CMEs or SPEs.
1 - What are the odds that a CME is directed toward Earth? 593/11031 = 0.054 odds = 1 in 19 2 - What fraction of the time does the sun produce X-class flares? 122/21886 = 0.006 3 - How many X-class flares are not involved with CMEs or SPEs? 122 - 74 - 22 - 6 = 20. 4 - If a satellite spotted BOTH a halo coronal mass ejection and an X-class solar flare, what is the probability that a solar proton event will occur? 22/(74+22) = 0.23 5 - What percentage of the time are SPEs involved with Halo CMEs, X-class flares or both? 100% x (39+22+6 / 95) = 70.1 % 6 - If a satellite just spots a Halo CME, what are the odds that an X-class flare or an SPE or both will be observed? 39+22+74 / 593 = 0.227 so the odds are 1/0.227 or about 1 in 4. 7 - Is it more likely to detect an SPE if a halo CME is observed, or if an X-class flare is observed? (6+22)/95 = 0.295 or 1 out of 3 times for X-flares (39+22)/95 = 0.642 or 2 out of 3 for Halo CMEs It is more likely to detect an SPE if a Halo CME occurs by 2 to 1. 8 - If you see either a Halo CME or an X-class flare, but not both, what are the odds you will also see an SPE? 39+6 / 95 = 0.50 so the odds are 1/0.50 or 2 to 1 . 9 - If you observed 100 CMEs, X-class flares and SPEs, how many times might you expect to see all three phenomena? 100 x 22/(95+122+593) = 3 times
Space Math http://spacemath.gsfc.nasa.gov

12.4.2 Probability of Compound Events
Without an atmosphere, there is nothing to prevent millions of pounds a year of rock and ice fragments from raining down upon the lunar surface. Traveling at 10,000 miles per hour (19 km/s), they are faster than a speeding bullet and are utterly silent and invisible until they strike. Is this something that lunar explorers need to worry about?
Problem 1 - Between 1972 and 1992, military infra-sound sensors on Earth detected 136 atmospheric detonations caused by meteors releasing blasts carrying an equivalent energy of nearly 1,000 tons of TNT - similar to small atomic bombs, but without the radiation. Because many were missed, the actual rates could be 10 times higher. If the radius of Earth is 6,378 km, A) what is the rate of these deadly impacts on Earth in terms of impacts per km2 per year? B) Assuming that the impact rates are the same for Earth and the Moon, suppose a lunar colony has an area of 10 km2. How many years would they have to wait between meteor impacts? Problem 2 - Between 2005-2007, NASA astronomers counted 100 flashes of light from meteorites striking the lunar surface - each equivalent to as much as 100 pounds of TNT. If the surveyed area equaled 1/4 of the surface area of the Moon, and the lunar radius is 1,737 km, A) What is the arrival rate of these meteorites in meteorites per km2 per year? B) If a lunar colony has an area of 10 km2, how long on average would it be between impacts? Problem 3 - According to H.J. Melosh (1981) meteoroids as small as 1-millimeter impact a body with a 100-km radius about once every 2 seconds. A) What is the impact rate in units of impacts per m2 per hour? B) If an astronaut spent a cumulative 1000 hours moon walking and had a spacesuit surface area of 10 m2, how many of these deadly impacts would he receive? C) How would you interpret your answer to B)?
Damage to Space Shuttle Endeavor in 2000 from a micrometeoroid or debris impact . The crater is about 1mm across. (Courtesy - JPL/NASA)
Space Math http://spacemath.gsfc.nasa.gov

12.4.2 Answer Key
Problem 1 - A) The surface area of Earth is 4 π (6378)2 = 5.1 x 10⁸ km2. The rate is R = 136 x 10 impacts / 20 years / 5.1 x 10⁸ km2 = 1.3 x 10⁻⁷ impacts/km2/year. B) The number of impacts/year would be 1.3 x 10⁻⁷ impacts/km2/year x 10 km2 = 1.3 x 10⁻⁶ impacts/year . The time between impacts would be 1/1.3 x 10-6 = 769,000 years! Problem 2 - A) The total surface area of the Moon is 4 π (1737)2 = 3.8 x 10⁷ km2. Only 1/4 of this is surveyed so the area is 9.5 x 10⁵ km2. Since 100 were spotted in 2 years, the arrival rate is R = 100 impacts/2 years/ 9.5 x 10⁵ km2 = 5.3 x 10⁻⁵ impacts/km2/year. B) The rate for this area is 10 km2 x 5.3 x 10-5 impacts/km2/year = 5.3 x 10⁻⁴ impacts/year, so the time between impacts is about 1/ 5.3 x 10-4 = 1,900 years Problem 3 - A) A sphere 100-km in radius has a surface area of 4 π (100,000)2 = 1.3 x 10¹¹ m2. The impacts arrive every 2 seconds on average, which is 2/3600 = 5.6 x 10⁻⁴ hours. The rate is, therefore, R = 1 impacts / (1.3 x 10¹¹ m2 X 5.6 x 10-4 hours) = 1.4 x 10⁻⁸ impacts/m2/hour. B) The number of impacts would be 1.4 x 10⁻⁸ impacts/m2/hour x 10 m2 x 1000 hours = 1.4 x 10⁻⁵ impacts. C) Because the number of impacts is vastly less than 1 ( a certainty), he should not worry about such deadly impacts unless he had reason to suspect that the scientists miscalculated the impact rates for meteorites this small. Another way to look at this low number is to turn it around and say that the astronaut would have to take 1/ 1.4 x 10⁻⁵ about 71,000 such 1000-hour moon walks in order for one impact to occur. Alternately, the time between such events is 71,000 x 1000 hours = 71 million years!
Space Math http://spacemath.gsfc.nasa.gov

12.4.3 Probability of Compound Events
There are many situations in astronomy where probability and area go hand in hand! The problems below can be modeled by using graph paper shaded to represent the cratered areas. The moon's surface is heavily cratered, as the Apollo 11 photo to the left shows. The total area covered by them is more than 70% of the lunar surface!
1 – A 40km x 40km area of the Moon has 5 non-overlapping craters, each about 5km in radius. A) What fraction of this area is covered by craters? B) What is the percentage of the cratered area to the full area? C) Draw a square representing the surveyed region and shade the fraction covered by craters. 2 - During an 8-day period, 2 days were randomly taken off for vacation. A) What fraction of days are vacation days? B) What is the probability that Day-5 was a vacation day? C) Draw a square whose shaded area represents the fraction of vacation days. 3 – An asteroid capable of making a circular crater 40-km across impacts this same 40km x 40km area dead-center. About what is the probability that it will strike a crater that already exists in this region? 4 – During an 8-day period, 2 days were randomly taken of for vacation, however, during each 8-day period there were 4 consecutive days of rain that also happened randomly during this period of time. What is the probability that at least one of the rain days was a vacation day? (Hint: list all of the possible 8-day outcomes.) Inquiry – How can you use your strategy in Problem 4 to answer the following question: An asteroid capable of making a circular crater 20-km across impacts this same 40km x 40km area dead-center. What is the probability that it will strike a crater that already exists in this region?
Space Math http://spacemath.gsfc.nasa.gov

Answer Key
1 – Answer: A) The area of a crater with a circular shape, is A = π (5km)2 = 78.5 km2, so 5 non-overlapping craters have a total area of 393 km2. The lunar area is 40 km x 40km = 1600 km2, so the fraction of cratered area is 393/1600 = 0.25. B) The percentage cratered is 0.25 x 100% = 25%. C) Students will shade-in 25% of the squares. 2 - Answer: A) 2 days/8 days = 0.25 B) .25 x 100% = 25%. C) The square should have 25% of area shaded. 3 –Answer: The area of the impact would be π (20km)2 = 1240 km2 . The area of the full region is 1600 km2. The difference in area is the amount of lunar surface not impacted and equals 360 km2. Because the cratered area is 393 km2 and is larger then the unimpacted area, the probability is 100% that at least some of the cratered area will be affected by the new crater. 4 – R = Rain days Vacation: There are 8 x 7/2 = 28 possibilities R R R R X X X X X R R R R X X X X X R R R R X X X X X R R R R X X X X X R R R R Rain ‘area’ = 50%. For each of the 5 possibilities for a rain period, there are 28 possibilities for a vacation series, which makes 5 x 28 = 140 combinations of rain and vacation. For a single rain pattern out of the 5, there are 28 vacation patterns, and of these, 50% will include at least one vacation day in the rain, because the other half of the days avoid the rain days entirely. So, out of the 140 combinations, 70 will include rain days and 70 will not, again reflecting the fact that the ‘area’ of the rain days is 50% of the total days. Inquiry: The already cratered area is ¼ of the total. The area of the new impact is π (10km)2 = 314 km2 which is 314/1600 = 1/5 of the total area. Draw a series of S=20 cells (like the 8-day pattern). The new crater represents 20x1/5 = 4 consecutive cells shaded. Work out all of the possible ways that 20 x 1/4 = 5 previously cratered areas can be distributed over the 20 days so that one of them falls within the 4 consecutive cells of the new crater. Example: X P X P X N N N N X X X X P X P X X P X X = not cratered area, P = previously cratered area, N = new crater impact. We are looking for: Probability = (The number of trials where a P is inside the ‘N’ region) / M , where M = the total number of possible trials. Because there are 17 possibilities for the Ns, and 20!/ (15! 5!) = (20 x 19) / 2 = 190 possibilities for where the 5 Ps can go, m = 17 x 190 = 3230 . These do not all have to be worked out by hand to find the number of trials where a P is inside an N region in the series. You can also reduce the value of S so long as you keep the relative areas between N, V and P the same.
12.4.3
Space Math http://spacemath.gsfc.nasa.gov

12.4.4 The Probability of Compound Events
Solar flares are violent releases of energy from the sun that last 10 to 20 minutes and produce intense flashes of x-rays, which travel at the speed of light to Earth. Coronal mass ejections (CMEs) are enormous releases of matter (plasma) from the sun that travel at nearly a million miles per hour to Earth. When a CME is directed towards Earth it is called a Halo CME because the sun looks like it is surrounded by a halo of glowing gas. We know that only CMEs cause the Northern Lights because of the way that they affect Earth's magnetic field. The question we want to answer is, 'Do flares cause CMEs to happen, or vice versa? Dr. C. A. Flair is trying to decide if there is a relationship between CMEs and flares by studying how many of these events occur, and how often CMEs and flares coincide. He has created the following list:
Solar Flares 22 Halo CME 12 Both Flares and Halo CMEs 7
The scientist decides to analyze the results. His first step is to construct a Venn Diagram to display the data. Place the data in the correct locations.
Problem 1 - What is the total number of individual events involved in this sample? Problem 2 - What does the overlapping part of the diagram represent? Problem 3 - Based on this data, what is the probability of a flare occurring? Problem 4 - What is the probability of a CME Halo occurring? Problem 5 - What fraction of the time do flares and a CMEs occur at the same time? Problem 6 - In your own words, what would be your answer to the question?
Space Math http://spacemath.gsfc.nasa.gov

12.4.4 Answer Key
5 7 15
Problem 1 - What is the total number of individual events involved in this sample? Answer: There are 22 flare events, 12 CME events and 7 combined events for a total of 41 solar ‘storm’ events of all three kinds. Problem 2 - What does the overlapping part of the diagram represent? Answer: It represents the number of events where both Halo CMEs and solar flares are involved in a solar storm. Problem 3 - Based on this data, what is the probability of a flare occurring? Answer: Out of the 41 events, a flare will occur with a probability of (22/41) x 100% = 53.7 % of the time. Problem 4 - What is the probability of a CME Halo occurring? Answer: Out of the 41 events, a CME will occur (12/41) x 100% = 29.3% Problem 5 - What fraction of the time do flares and a CMEs occur at the same time? Answer: Of the 41 events, both flares and CMEs happen (7/41) x 100% = 17.0% of the time. Problem 6 - In your own words, what would be your answer to the question? Answer: Solar flares hardly ever occur at the same time as CMEs (17% of the time) and so the reason that CMEs happen probably doesn't usually have anything to do with solar flares.
Space Math http://spacemath.gsfc.nasa.gov

12.5.1 Probability of Independent Events
We all make decisions every day, sometimes hundreds of them without realizing it! Each decision has a probability of leading to a successful outcome or one that eventually leads to problems later on. A similar kind of problem involves reliability. Space Shuttles, jet planes and televisions depend on thousands or even millions of components working reliably. Each component needs to be built, and some components are more reliable than others.
Suppose you have a simple radio that consists of three parts. If each part has a 1/100 chance of failing in the next month, and the failure of one component does NOT affect the other components, the independent probability that the radio will keep working in the next month is P = (0.99) x (0.99) x (0.99) = 0.97, so it has a 3% chance of failing after one month. Similarly, if three independent decisions are needed in order to have a successful outcome, and each decision is 99% reliable, then the probability that the final outcome will be successful is 97%. Problem 1 – Suppose that you make 100 decisions each day, and that these decisions are independent of each other. Suppose also that you had a day in which you successfully met 98% of your goals. What was the average success probability that you had to meet for each of the 100 decisions you made? Problem 2 – According to various US surveys, 6% of adults doubt that NASA landed astronauts on the Moon (Gallop Survey 1999); 18% believe that the Sun goes around the Earth (Gallop Survey 1999); 31% believe in astrology (Harris Poll 2008); 18% do not believe that global warming is occurring (ABC-Washington Post Poll, 2009); 38% of adults believe that Earth is less than 10,000 years old (Gallop Poll, 2005) and 51% of adults reject the scientific theory of evolution (Newsweek Survey, 2007). The surveys typically included 2,000 adults. Based on these surveys, and a US population of 170 million registered voters, how many voters believe the Moon landings were a hoax, that the Sun goes around the Earth, that astrology accurately predicts the future, that the Earth is less than 10,000 years old, that global warming is not real, that evolution is not correct?
Space Math http://spacemath.gsfc.nasa.gov
Answer Key 12.5.1 Problem 1 – Suppose that you make 100 decisions each day, and that these
decisions are independent of each other. Suppose also that you had a day in which you successfully met 98% of your goals. What was the average success probability that you had to meet for each of the 100 decisions you made? Answer: 0.98 = P
100. Solve this by taking logarithms and evaluating them to get:
Log(0.98) = 100 LogP -0.0088 / 100 = Log P then P = 10
-0.000088 so P = 0.99979
This means that each of your 100 decissions had to be nearly perfect and successful 99.98% of the time! Problem 2 – According to various US surveys, 6% of adults doubt that NASA landed astronauts on the Moon (Gallop Survey 1999); 18% believe that the Sun goes around the Earth (Gallop Survey 1999); 31% believe in astrology (Harris Poll 2008); 18% do not believe that global warming is occurring (ABC-Washington Post Poll, 2009); 38% of adults believe that Earth is less than 10,000 years old (Gallop Poll, 2005) and 51% of adults reject the scientific theory of evolution (Newsweek Survey, 2007). The surveys typically included 2,000 adults. Based on these surveys, and a US population of 170 million registered voters, how many voters believe the Moon landings were a hoax, that the Sun goes around the Earth, that astrology accurately predicts the future, that the Earth is less than 10,000 years old, that global warming is not real, that evolution is not correct? Answer: Assuming that these are independent probabilities: 0.06 doubt that NASA landed astronauts on the Moon 0.18 believe that the Sun goes around the Earth 0.31 believe in astrology 0.18 do not believe that global warming is occurring 0.38 believe that Earth is less than 10,000 years old 0.51 reject the scientific theory of evolution The fraction of voters who agree with all of the above is P = 0.06 x 0.18 x 0.31 x 0.18 x 0.38 x 0.51 P = 0.00017 Assuming that the sample of 2000 surveyed were representative of the 170 million voters, the number of voters who agree with all of the above statements is 170,000,000 x 0.00017 = 28,900 voters.
Space Math http://spacemath.gsfc.nasa.gov

12.6.1 Finding Binomial Probabilities using Combinations
Solar storms can affect our satellite and electrical technologies, and can also produce health risks. For over 100 years, scientists have kept track of these harsh ‘space weather’ events, which come and go with the 11-year sunspot cycle. During times when many sunspots are present on the solar surface, daily storms are not uncommon. These storms come in two distinct types: Solar flares, which cause radio interference and health risks, and coronal mass ejections, which affect satellites and cause the Northern Lights.
Problem 1 – During a particular week in 2001, on a given day of the week, the Sun produced either a coronal mass ejection, S, or an X-ray solar flare, X. Use the Binomial Theorem to compute all of the possible terms for (S + X)7. Problem 2 – What does the term represented by 7C3 S
4X
3 = 21 S
4X
3 represent?
Problem 3 – During an average month in 2001 there were 25 coronal mass ejections and 5 X-flares. What is the probability of A) observing a coronal mass ejection during a given day? B) Observing an X-flare during a given day? Problem 4 – Using the probabilities derived in Problem 3, what is the most likely number of X-flares and coronal mass ejections spotted during a given week?
Space Math http://spacemath.gsfc.nasa.gov

Answer Key 12.6.1 Problem 1 – During a particular week in 2001, on a given day of the week, the Sun
produced either a coronal mass ejection, S, or an X-ray solar flare, X. Use the Binomial Theorem to compute all of the possible terms for (S + X)7. Answer: The Binomial expansion is
7C7 S0X
7 + 7C6 S
1X
6 + 7C5 S
2X
5 + 7C4 S
3X
4 + 7C3 S
4X
3 + 7C2 S
5X
2 + 7C1 S
6X
1
+7C0 S7X
0
which can be evaluated using the definition of nCr to get: = X
7 + 7 S
1X
6 + 21 S
2X
5 + 35 S
3X
4 + 35 S
4X
3 + 21 S
5X
2 + 7 S
6X
1 + S
7
Problem 2 – What does the term represented by 7C3 S
4X
3 = 21 S
4X
3 represent?
Answer: If you were to tally up the number of ways that 4 S-type storms and 3 X-type storms could be distributed among the 7 days in a week, you would get 21 different ‘line ups’ for the sequence of these storms. For instance during the 7 consecutive days, one of these would be S,X,X,S,S,X,S Problem 3 – During an average month in 2001 there were 25 coronal mass ejections and 5 X-flares. What is the probability of A) observing a coronal mass ejection during a given day? B) Observing an X-flare during a given day? Answer: P(X) = 5/30 = 0.17 and P(S) = 25/30 = 0.83 Problem 4 – Using the probabilities derived in Problem 3, what is the most likely number of X-flares and coronal mass ejections spotted during a given week? Answer: Substitute X = P(X) = 0.17 and S = P(S) = 0.83 into the binomial expansion and evaluate each term. X
7 + 7 S
1X
6 + 21 S
2X
5 + 35 S
3X
4 + 35 S
4X
3 + 21 S
5X
2 + 7 S
6X
1 + S
7
The probabilities are: 0.000004 + 0.00014 + 0.002 + 0.017 + 0.082 + 0.24 + 0.39 + 0.27 so the most likely case would be 6 coronal mass ejections and one x-flare during an average week.
Space Math http://spacemath.gsfc.nasa.gov
12.6.2 Finding Trinomial Probabilities
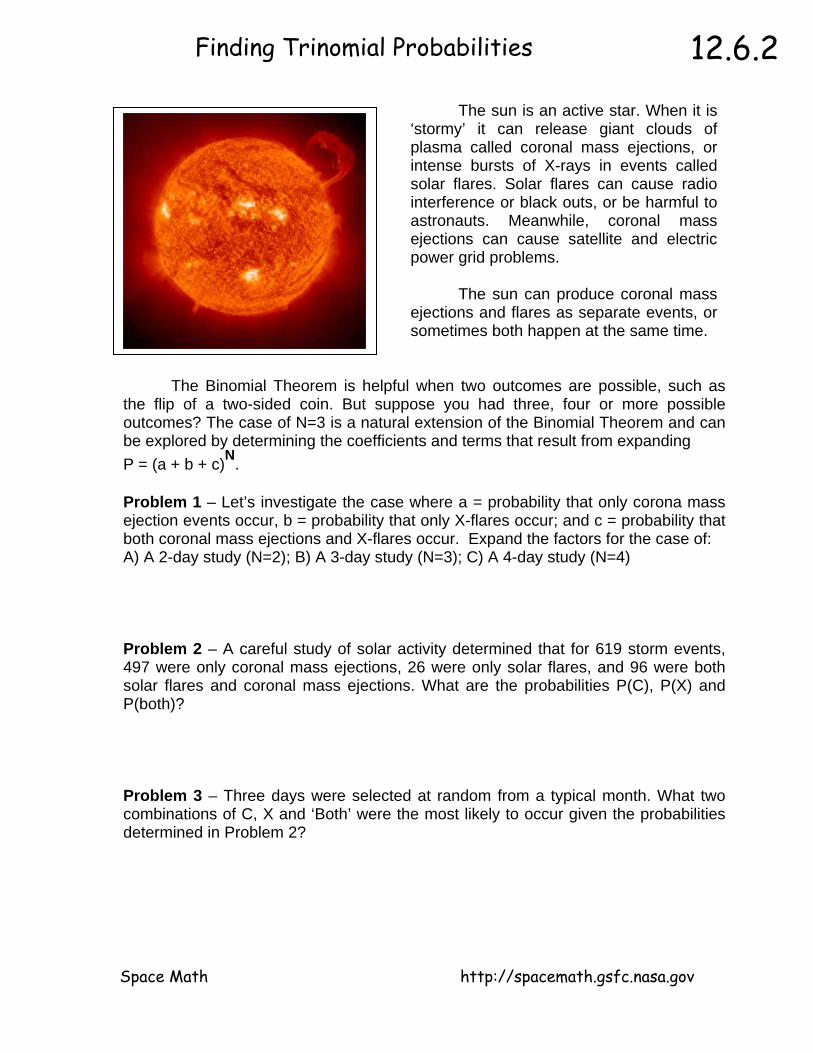
The sun is an active star. When it is ‘stormy’ it can release giant clouds of plasma called coronal mass ejections, or intense bursts of X-rays in events called solar flares. Solar flares can cause radio interference or black outs, or be harmful to astronauts. Meanwhile, coronal mass ejections can cause satellite and electric power grid problems. The sun can produce coronal mass ejections and flares as separate events, or sometimes both happen at the same time.
The Binomial Theorem is helpful when two outcomes are possible, such as the flip of a two-sided coin. But suppose you had three, four or more possible outcomes? The case of N=3 is a natural extension of the Binomial Theorem and can be explored by determining the coefficients and terms that result from expanding P = (a + b + c)N. Problem 1 – Let’s investigate the case where a = probability that only corona mass ejection events occur, b = probability that only X-flares occur; and c = probability that both coronal mass ejections and X-flares occur. Expand the factors for the case of: A) A 2-day study (N=2); B) A 3-day study (N=3); C) A 4-day study (N=4) Problem 2 – A careful study of solar activity determined that for 619 storm events, 497 were only coronal mass ejections, 26 were only solar flares, and 96 were both solar flares and coronal mass ejections. What are the probabilities P(C), P(X) and P(both)? Problem 3 – Three days were selected at random from a typical month. What two combinations of C, X and ‘Both’ were the most likely to occur given the probabilities determined in Problem 2?
Space Math http://spacemath.gsfc.nasa.gov

Answer Key 12.6.2 Problem 1 – Let’s investigate the case where a = probability that only corona mass
ejection events occur, b = probability that only X-flares occur; and c = probability that both coronal mass ejections and X-flares occur. Expand the factors for the case of: A) A 2-day study (N=2); B) A 3-day study (N=3); C) A 4-day study (N=4) Answer: (N=2): P(2) = C
2 + X
2 + B
2 + 2XC + 2CB +2XB
(N=3) P(3) = C
3 + X
3 + B
3 + 3CX
2 +3CB
2 + 3XC
2 + 3BC
2 + 3XB
2 + 3X
2B + 6XBC
(N=4) P(4) = C
4 + X
4 + B
4 + 4CX
3 + 4CB
3 + 6C
2X
2 + 6C
2B
2 + 4XC
3 + 4BC
3 + 12
CXB2 + 12 CBX
2 + 12XBC
2 + 4XB
3 + 3X
2B
2 + 3BX
3 + BX
3
Problem 2 – A careful study of solar activity determined that for 619 storm events, 497 were only coronal mass ejections, 26 were only solar flares, and 96 were both solar flares and coronal mass ejections. What are the probabilities P(C), P(X) and P(both)? Answer: P(C) = 497/619 so P(C) = 0.8 P(X) = 26/619 so P(X) = 0.04 P(Both) = 96 / 619 so P(Both) = 0.16. Problem 3 – Three days were selected at random from a typical month. What two combinations of C, X and ‘Both’ were the most likely to occur given the probabilities determined in Problem 2? Answer: For N=3: P(3) = C
3 + X
3 + B
3 + 3CX
2 +3CB
2 + 3XC
2 + 3BC
2 + 3XB
2 + 3X
2B + 6XBC
Since X = 0.04, C=0.8 and B=0.16 we have P(3) = 0.51 + 0.000064 + 0.0041 + 0.0038 + 0.061 + 0.077 + 0.31 + 0.0031 + 0.00077 + 0.031 The two most common combinations are for: 1) C
3 : All three days to only have coronal mass ejections (C); and
2) 3BC2 : two coronal mass ejections (C) and one day where both a flare and a
coronal mass ejection occur (B).
Space Math http://spacemath.gsfc.nasa.gov
12.6.3 Finding Binomial Probabilities using Combinations
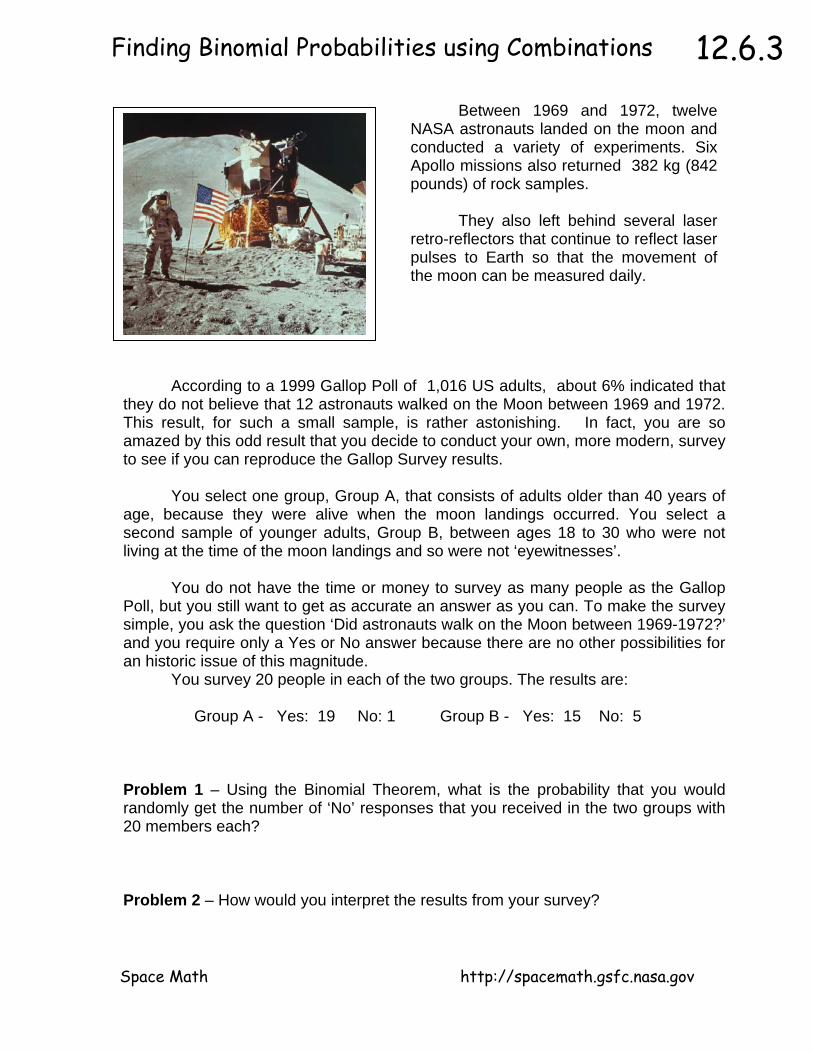
Between 1969 and 1972, twelve NASA astronauts landed on the moon and conducted a variety of experiments. Six Apollo missions also returned 382 kg (842 pounds) of rock samples. They also left behind several laser retro-reflectors that continue to reflect laser pulses to Earth so that the movement of the moon can be measured daily.
According to a 1999 Gallop Poll of 1,016 US adults, about 6% indicated that they do not believe that 12 astronauts walked on the Moon between 1969 and 1972. This result, for such a small sample, is rather astonishing. In fact, you are so amazed by this odd result that you decide to conduct your own, more modern, survey to see if you can reproduce the Gallop Survey results. You select one group, Group A, that consists of adults older than 40 years of age, because they were alive when the moon landings occurred. You select a second sample of younger adults, Group B, between ages 18 to 30 who were not living at the time of the moon landings and so were not ‘eyewitnesses’. You do not have the time or money to survey as many people as the Gallop Poll, but you still want to get as accurate an answer as you can. To make the survey simple, you ask the question ‘Did astronauts walk on the Moon between 1969-1972?’ and you require only a Yes or No answer because there are no other possibilities for an historic issue of this magnitude. You survey 20 people in each of the two groups. The results are: Group A - Yes: 19 No: 1 Group B - Yes: 15 No: 5 Problem 1 – Using the Binomial Theorem, what is the probability that you would randomly get the number of ‘No’ responses that you received in the two groups with 20 members each? Problem 2 – How would you interpret the results from your survey?
Space Math http://spacemath.gsfc.nasa.gov
12.6.3 Answer Key
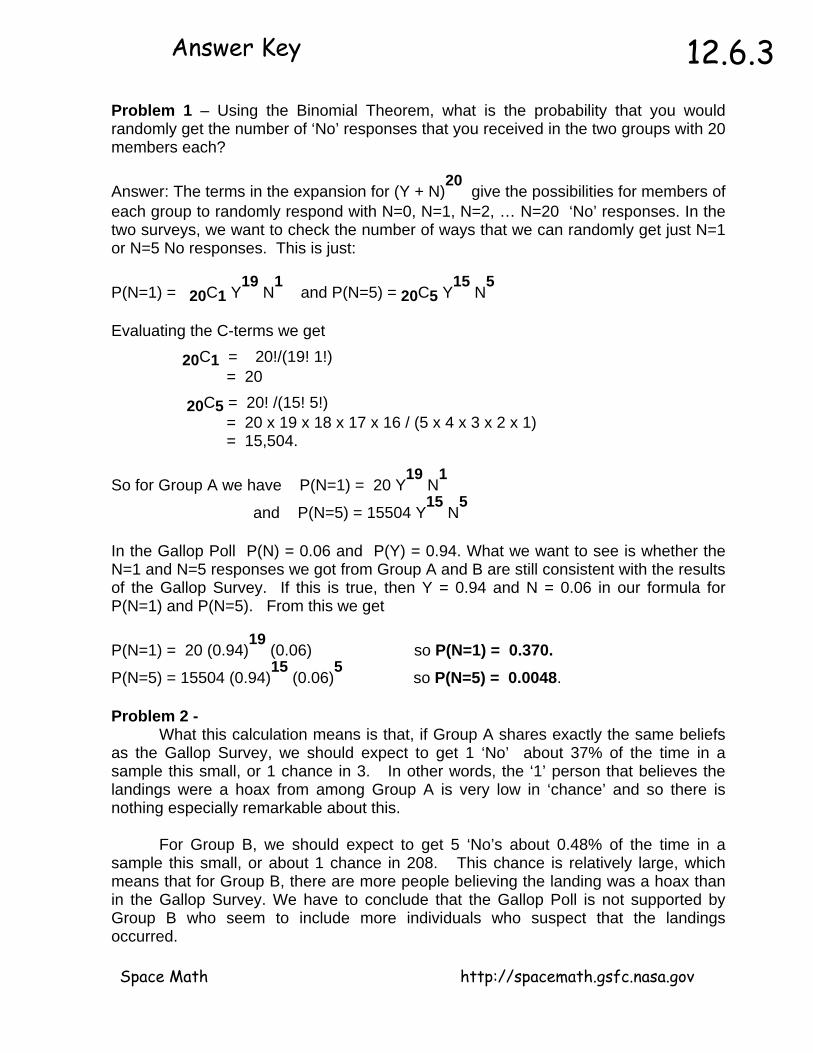
Problem 1 – Using the Binomial Theorem, what is the probability that you would randomly get the number of ‘No’ responses that you received in the two groups with 20 members each? Answer: The terms in the expansion for (Y + N)
20 give the possibilities for members of
each group to randomly respond with N=0, N=1, N=2, … N=20 ‘No’ responses. In the two surveys, we want to check the number of ways that we can randomly get just N=1 or N=5 No responses. This is just: P(N=1) = 20C1 Y
19 N
1 and P(N=5) = 20C5 Y
15 N
5
Evaluating the C-terms we get 20C1 = 20!/(19! 1!) = 20 20C5 = 20! /(15! 5!) = 20 x 19 x 18 x 17 x 16 / (5 x 4 x 3 x 2 x 1) = 15,504. So for Group A we have P(N=1) = 20 Y
19 N
1
and P(N=5) = 15504 Y15
N5
In the Gallop Poll P(N) = 0.06 and P(Y) = 0.94. What we want to see is whether the N=1 and N=5 responses we got from Group A and B are still consistent with the results of the Gallop Survey. If this is true, then Y = 0.94 and N = 0.06 in our formula for P(N=1) and P(N=5). From this we get P(N=1) = 20 (0.94)
19 (0.06) so P(N=1) = 0.370.
P(N=5) = 15504 (0.94)15
(0.06)5
so P(N=5) = 0.0048. Problem 2 - What this calculation means is that, if Group A shares exactly the same beliefs as the Gallop Survey, we should expect to get 1 ‘No’ about 37% of the time in a sample this small, or 1 chance in 3. In other words, the ‘1’ person that believes the landings were a hoax from among Group A is very low in ‘chance’ and so there is nothing especially remarkable about this. For Group B, we should expect to get 5 ‘No’s about 0.48% of the time in a sample this small, or about 1 chance in 208. This chance is relatively large, which means that for Group B, there are more people believing the landing was a hoax than in the Gallop Survey. We have to conclude that the Gallop Poll is not supported by Group B who seem to include more individuals who suspect that the landings occurred.
Space Math http://spacemath.gsfc.nasa.gov

12.7.1 Normal Distributions
Astronomers make many measurements of a variety of physical quantities such as a star’s brightness or the position of a comet. The measurements can be ‘binned’ and averaged to get a mean value, and from this the standard deviation, σ, can be determined.
The area table for a Normal distribution is given by: Sigma 1 2 3 4 5 6 Area 0.682689 0.271810 0.042800 0.002637 0.000063 0.00000057
The areas are calculated for each interval in sigma and are summed over both the positive and negative sides of the curve. Example, the area between 1 and 2 sigma is 0.136 for the negative side and + 0.136 for the positive side for a total area of 0.272 Problem 1 – An astronomer is looking for the faintest possible stars in a recent digital image that contains 1000 x 3600 pixels. A typical star will appear as a faint patch of light filling 3x3 pixels. How many of these non-overlapping star patches are there in this image? Problem 2 – To eliminate spots that could just be noise in the camera CCD and not real stars, suppose the astronomer only considers a bright patch a bonefide star if its brightness is at a level of between 5-sigma or higher. A) How many 5-sigma false-stars might there be in his image? B) If the average sky brightness is 250 digital counts, and the sigma is 12 counts, how bright does the faintest star candidate have to be in order for it to probably not be a false star?
Space Math http://spacemath.gsfc.nasa.gov

Answer Key 12.7.1 Problem 1 – An astronomer is looking for the faintest possible stars in a recent digital
image that contains 1000 x 3600 pixels. A typical star will appear as a faint patch of light filling 3x3 pixels. How many of these non-overlapping star patches are there in this image? Answer: 1000x3600/9 = 400,000 patches. Problem 2 – To eliminate spots that could just be noise in the camera CCD and not real stars, suppose the astronomer only considers a bright patch a bonefide star if its brightness is at a level of between 5-sigma or higher. A) How many 5-sigma false-stars might there be in his image? B) If the average sky brightness is 250 digital counts, and the sigma is 12 counts, how bright does the faintest star candidate have to be in order for it to probably not be a false star? Answer: A) The total area under the Normal distribution equals 400,000 samples. The number of false stars is found in the table: Sigma 1 2 3 4 5 6 Area 0.682689 0.271810 0.042800 0.002637 0.000063 0.00000057 Stars 273,076 108,724 17,120 1,055 25 0 A) At 5-sigma, there would be 25 false stars out of the 400,000 areas searched. B) B = 250 + 5 x (12) = 310 digital units.
Space Math http://spacemath.gsfc.nasa.gov

12.7.2 Normal Distributions
There are many situations for which an astronomer might want to know how common a random value equal to a measured value is. If the value of a measurement statistically equals a likely value based on the Normal curve, the data is rejected as random ‘noise’, rather than a new discovery! Usually, only measurements greater than 5-sigma above the mean is considered statistically significant with high confidence.
The area table for a Normal distribution is given by: Sigma 1 2 3 4 5 Area 0.682689 0.271810 0.042800 0.002637 0.000063 The areas are calculated for each interval in sigma and are summed over both the positive and negative sides of the curve. Example, the area between 1 and 2 sigma is 0.136 for the negative side and + 0.136 for the positive side for a total area of 0.272 . Note: Use A=0.272 when the sign of the number does not matter, and A=0.136 if the sign of the number does matter. Problem 1 – On a warm day, the average speed of air molecules is 1800 km/hr, and the standard deviation is 700 km/hr. A) What is the probability that you will find air molecules traveling faster than 4,600 km/hr? B) If these molecules are in a vacuum chamber containing 10 billion molecules, how many will be traveling faster than 4,600 km/hr? Problem 2 – NASA’s Kepler satellite measures the brightness of 100,000 stars every few hours to search for changes that could be caused by a transiting planet. Suppose that for one of these stars, the brightness is 340 microJanskys with a standard deviation of 2 microJanskys. During one day it measures the star’s brightness and obtains the following numbers: 335, 338, 330, 336 and 338. A) If 1-sigma equals 2 microJanskys, how many sigmas from the average value of 340 microJanskys do each of the five measurements fall? B) Which of the five measurements has the highest probability of not being a random measurement error? C) For the entire collection of data for all 100,000 stars measured every hour for three months, how many ‘false positive’ measurements resembling a transiting planet might you expect to find?
Space Math http://spacemath.gsfc.nasa.gov
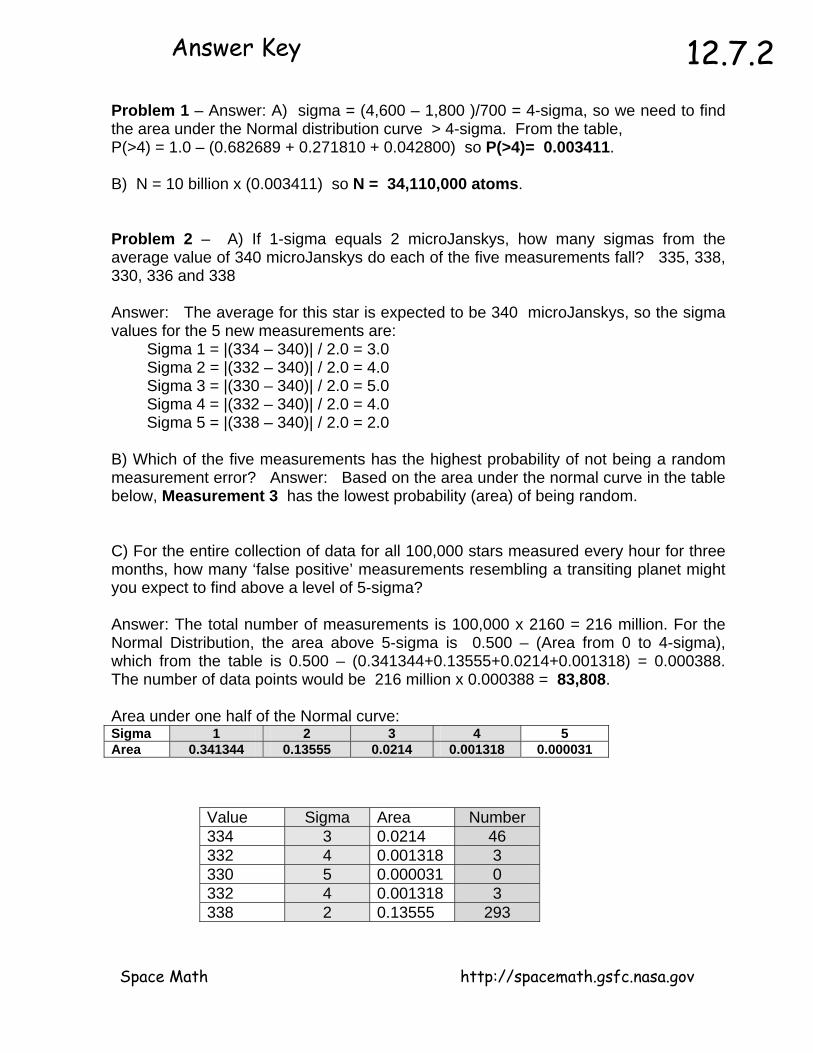
Answer Key 12.7.2 Problem 1 – Answer: A) sigma = (4,600 – 1,800 )/700 = 4-sigma, so we need to find
the area under the Normal distribution curve > 4-sigma. From the table, P(>4) = 1.0 – (0.682689 + 0.271810 + 0.042800) so P(>4)= 0.003411. B) N = 10 billion x (0.003411) so N = 34,110,000 atoms. Problem 2 – A) If 1-sigma equals 2 microJanskys, how many sigmas from the average value of 340 microJanskys do each of the five measurements fall? 335, 338, 330, 336 and 338 Answer: The average for this star is expected to be 340 microJanskys, so the sigma values for the 5 new measurements are: Sigma 1 = |(334 – 340)| / 2.0 = 3.0 Sigma 2 = |(332 – 340)| / 2.0 = 4.0 Sigma 3 = |(330 – 340)| / 2.0 = 5.0 Sigma 4 = |(332 – 340)| / 2.0 = 4.0 Sigma 5 = |(338 – 340)| / 2.0 = 2.0 B) Which of the five measurements has the highest probability of not being a random measurement error? Answer: Based on the area under the normal curve in the table below, Measurement 3 has the lowest probability (area) of being random. C) For the entire collection of data for all 100,000 stars measured every hour for three months, how many ‘false positive’ measurements resembling a transiting planet might you expect to find above a level of 5-sigma? Answer: The total number of measurements is 100,000 x 2160 = 216 million. For the Normal Distribution, the area above 5-sigma is 0.500 – (Area from 0 to 4-sigma), which from the table is 0.500 – (0.341344+0.13555+0.0214+0.001318) = 0.000388. The number of data points would be 216 million x 0.000388 = 83,808. Area under one half of the Normal curve: Sigma 1 2 3 4 5 Area 0.341344 0.13555 0.0214 0.001318 0.000031
Value Sigma Area Number 334 3 0.0214 46 332 4 0.001318 3 330 5 0.000031 0 332 4 0.001318 3 338 2 0.13555 293
Space Math http://spacemath.gsfc.nasa.gov

12.7.3 Normal Distributions
What does it really mean to determine the average and standard deviation of a set of measurements? Astronomers have to deal with this basic question all the time because they are dealing with objects that cannot be visited to make normal measurements as we would under laboratory conditions. Here is a step-by-step example!
An astronomer wants to determine the temperature of 10 stars like our own sun that are identical in mass, diameter and luminosity. From the detailed knowledge of our Sun, suppose the Sun's exact surface temperature is 5,700 K. If the other stars are exact duplicates of our Sun, they should also have the same temperature. The particular ten stars that the astronomer selected are, in fact, slightly different than the Sun in ways impossible for the astronomer to measure with the best available instruments. The table below gives the measured temperatures along with their reasons for not matching our Sun exactly; reasons that the astronomer is not aware of: Star Temp. (K) Reason for Difference
A 5,750 There is 1% more hydrogen in the star B 5,685 The star is 100 million years younger than the sun C 5,710 The radius of the star is 1% smaller than the sun D 5,695 The radius of the star is 2% larger than the sun E 5,740 The luminosity of the star is 1 percent larger than the sun F 5,690 The luminosity is 1% smaller than the sun G 5,725 The star has 3% more helium than the sun H 5,701 The star has a bright sunspot with a high temperature I 5,735 The abundance of calcium is 5% lower than the sun J 5,681 The amount of sodium is 1% greater than for the sun
Problem 1 – What is the average temperature, and standard deviation, σ, of this sample of ‘twins’ to our sun? Problem 2 – How does this sampling compare with a classroom experiment to determine the distribution of student heights?
Space Math http://spacemath.gsfc.nasa.gov

Answer Key 12.7.3 Problem 1 – What is the average temperature of this sample of ‘twins’ to our sun?
Answer: Average Ta = (5750+5685+5710+5695+5740+5690+5725+5701+5735+5681)/10 = 5712 K. To calculate the S.D first subtract the average temperature, 5712 from each temperature, square this number, sum all the ten ‘squared’ numbers; divide by 10-1 = 9, and take the square-root: Star Temp. (K) T-Tave Squared Sigma range
A 5,750 +38 1444 1-2 B 5,685 -27 729 1-2 C 5,710 -2 4 0-1 D 5,695 -17 289 0-1 E 5,740 +28 784 1-2 F 5,690 -22 484 0-1 G 5,725 +13 169 0-1 H 5,701 -11 121 0-1 I 5,735 +23 529 0-1 J 5,681 -31 961 1-2
Sum (squares)= 5514 σ = (5514/9)
1/2 σ = 25 K
Problem 2 – How does this sampling compare with a classroom experiment to determine the distribution of student heights? Answer: The table shows the range of sigmas in which the various points fall. For example, Star B: T=5,685 so 5685-5712 = -27, but 1-sigma = 25K so this point is between -1 and -2 sigma from the mean value. Counting the number of stars whose temperatures fall within each rank in the temperature distribution we see that 60% fall between +/- 1 sigma, and 100% fall between 0 and 2 sigma. This is similar to the Normal Distribution for which 68% should fall within 1-sigma and 95.4% within 2-sigma in a random sample (Note: 10 x 0.954 = 9.54 stars or 10 stars). There are no exceptional points in this limited sample that represent larger deviations from the mean value than 2-sigma. Each student has their own physical reason for being the height that they are in a specific classroom. Most of these reasons cannot be measured such as genetic pre-disposition, and nutrition. Just as the astronomer selected 10 stars because they are ‘sun-like’ we would select a classroom of 30 students in a specific school with students of a common age, give or take a few months. We measure the height of each student of the same age range, and calculate an average height for that age, and a standard deviation that is influenced by the factors that we cannot measure (genetics, nutrition). If we could, we would further divide our groups and calculate a new average and S.D..
Space Math http://spacemath.gsfc.nasa.gov