Embed Size (px)
Citation preview
HAL Id: hal-01084299https://hal.inria.fr/hal-01084299
Submitted on 27 May 2020
HAL is a multi-disciplinary open accessarchive for the deposit and dissemination of sci-entific research documents, whether they are pub-lished or not. The documents may come fromteaching and research institutions in France orabroad, or from public or private research centers.
L’archive ouverte pluridisciplinaire HAL, estdestinée au dépôt et à la diffusion de documentsscientifiques de niveau recherche, publiés ou non,émanant des établissements d’enseignement et derecherche français ou étrangers, des laboratoirespublics ou privés.
Distributed under a Creative Commons Attribution - NonCommercial - NoDerivatives| 4.0International License
The functional response predicts the effect of resourcedistribution on the optimal movement rate of consumers
Vincent Calcagno, Frédéric Grognard, Frédéric Hamelin, Eric Wajnberg,Ludovic Mailleret
To cite this version:Vincent Calcagno, Frédéric Grognard, Frédéric Hamelin, Eric Wajnberg, Ludovic Mailleret. The func-tional response predicts the effect of resource distribution on the optimal movement rate of consumers.Ecology Letters, Wiley, 2014, 17 (12), pp.1570-1579. �10.1111/ele.12379�. �hal-01084299�

LETTER The functional response predicts the effect of resource
distribution on the optimal movement rate of consumers
Vincent Calcagno,1* Fr�ed�eric
Grognard,2 Fr�ed�eric M. Hamelin,3
�Eric Wajnberg1 and Ludovic
Mailleret1,2
1INRA Institut Sophia Agrobiotech
(ISA) 400 route des Chappes,
Sophia Antipolis, France2INRIA BIOCORE 2004 route des
Lucioles, Sophia-Antipolis, France3INRA Agrocampus Ouest Rennes,
France
*Correspondence:
E-mail: vincent.calcagno@
sophia.inra.fr
Abstract
Understanding how often individuals should move when foraging over patchy habitats is a centralquestion in ecology. By combining optimality and functional response theories, we show analyti-cally how the optimal movement rate varies with the average resource level (enrichment) andresource distribution (patch heterogeneity). We find that the type of functional response predictsthe effect of enrichment in homogeneous habitats: enrichment should decrease movement fordecelerating functional responses, but increase movement for accelerating responses. An intermedi-ate resource level thus maximises movement for type-III responses. Counterintuitively, greatermovement costs favour an increase in movement. In heterogeneous habitats predictions furtherdepend on how enrichment alters the variance of resource distribution. Greater patch variancealways increases the optimal rate of movement, except for type-IV functional responses. While thefunctional response is well established as a fundamental determinant of consumer–resourcedynamics, our results indicate its importance extends to the understanding of individual move-ment strategies.
Keywords
Behaviour, dispersal, enrichment, Marginal Value Theorem, modelling, patchy habitats, spatialheterogeneity.
Ecology Letters (2014) 17: 1570–1579
INTRODUCTION
Population biologists and community ecologists have longstudied consumer–resource interactions, and the functionlinking the consumption rate to the density of resource, i.e.the functional response, was promptly identified as a keyelement. The functional response has been shown to deter-mine the type of density-dependence in predator–preysystems (Hassell 2000), or their stability and response toenrichment (Rosenzweig et al. 1971). Qualitative features ofthe functional response are most of the time sufficient forqualitative prediction, and broad categories of functionalresponses have thus been identified and documented in avariety of taxa. To understand the factors bringing up thesedifferent functional responses, functional response theoryrepeatedly borrows from behavioural ecology, optimal forag-ing theory and movement ecology, in order to propose real-istic functions grounded in behavioural mechanisms (Abrams1982; Casas et al. 1993; McKenzie et al. 2009; Leeuwenet al. 2013). The reverse is much less true, however. Whilemuch research has offered theoretical predictions on optimalbehaviours and optimal movement strategies, these very sel-dom relate to the functional response. “Functional response”is often not found in the index of modern behavioural ecol-ogy or movement ecology textbooks (e.g. Danchin et al.2008; Krebs & Davies 2009; Westneat & Fox 2010; M�endezet al. 2013).The marginal value theorem (MVT; Charnov 1976;
Stephens & Krebs 1986; Brown 1988), one of the most suc-cessful optimal foraging models, is an example of this. Thetheorem predicts how long a forager should stay within a
resource patch before leaving in search of a new patch, theso-called optimal residence time. Prediction is based on twosynthetic habitat characteristics: (1) the curve of resourceacquisition within patches, called the gain function, whichencapsulates the search and processing of resource items, and(2) the average time it takes to move between patches, calledthe travel time, which summarises the distance betweenpatches and the difficulty to reach them. Whereas for simplifi-cation, the MVT assumes an ideal patchy structure, thisabstracts the often observed tendency of animals to engage inarea-restricted search in the presence of resource items (within‘patches’), and to adopt extensive search in resource devoidareas (‘inter-patch’ movements; McIntyre & Wiens 1999;Klaassen et al. 2006; Kuefler et al. 2013; Benhamou 2014).The tendency to stay within patches thus controls the speed atwhich individuals progress through the overall habitat: thelonger the average residence time, the smaller the average rateof movement. This connection between residence time andmovement speed can be made explicit by formulating thetheorem in continuous space (Arditi & Dacorogna 1988). Assuch, the MVT can serve as a general framework to under-stand how resource distribution should affect the movementof individuals in structured landscapes (Belisle 2005; Holyoaket al. 2008; Owen-Smith et al. 2010).Even though routinely applied to consumer taxa including
plants (Pleasants 1989; Astrom et al. 1990; Cassini et al. 1990;Livoreil & Giraldeau 1997; Wajnberg et al. 2000; Davidson &Morris 2001; McNickle & Cahill 2009), the MVT has no spe-cific relationship to consumer–resource interactions. Gainfunctions may stand for any fitness-improving quantity, whichconfers high generality but also limited analytical progress
© 2014 The Authors. Ecology Letters published by John Wiley & Sons Ltd and CNRS.This is an open access article under the terms of the Creative Commons Attribution-NonCommercial-NoDerivs License, which permits use and
distribution in any medium, provided the original work is properly cited, the use is non-commercial and no modifications or adaptations are made.
Ecology Letters, (2014) 17: 1570–1579 doi: 10.1111/ele.12379

(Stephens & Krebs 1986; Westneat & Fox 2010; Calcagnoet al. 2014). Accordingly, most MVT studies are concernedwith the simplest qualitative predictions that could be drawnfrom the theorem (Stephens & Krebs 1986; McNamara et al.2006): the effect of increasing the travel time between patches,giving-up densities and the relative exploitation of patcheswithin habitats (for reviews see Nonacs 2001; Wajnberg 2006).In contrast, general predictions on how the average level ofresources and their distribution in a habitat should affectoverall movement have remained elusive, and the MVT is yetto be fully exploited in this regard.Here, we introduce into the MVT an explicit resource con-
sumption model, based on a general functional response.Using recent mathematical developments (Calcagno et al.2014), we derive analytically the effect of patch resource levelson optimal residence times, and thus optimal movement rates.We show that predicting the effect of enrichment, albeit diffi-cult based on the original MVT gain functions, simplifiesgreatly in light of the functional response: it depends on thequalitative type (concavity) of the response (decelerating, lin-ear, or accelerating). We further study how predictions areaffected by foraging costs and by the heterogeneity of theresource distribution. In particular, we establish that the aver-age movement rate should invariably increase with habitatheterogeneity, except for type-IV functional responses.
MODEL AND METHODS
Patches are characterised by their resource level n0. Once anindividual enters a patch and starts to exploit it, the resourcelevel drops, and we denote by n(t) its value after t time units.Note that the resource level is usually considered a number ora density, but may also be a percentage for species thatrespond to the fraction of not-attacked-yet resource (e.g. par-asitoids or tree-browsers; Astrom et al. 1990; Wajnberg et al.2000). In this context, the gain function of an individual isgiven by
FðtÞ ¼ cZ t
0
hðnðsÞÞds� mt� lT; ð1Þ
with initial condition n(0) = n0.The first term represents resource intake (gross gain), with
parameter c a conversion factor controlling the value of theresource. The instantaneous rate of resource consumption,summed from 0 to t, is given by the functional response h(Holling 1959; Hassell 2000). Foraging costs, if any, are dis-counted to obtain net gain (Stephens & Krebs 1986; Brown1988). Parameter m represents the per-unit-of-time cost whenin the patch, and parameter l the cost when moving betweenpatches, given that it takes on average T units of time to finda patch (Stephens & Krebs 1986).The dynamics of resource depletion are governed by the
classical consumption equation
_n ¼ �hðnÞ=S ð2Þwhere the positive constant S accounts for the scale (e.g.surface, volume or total number, depending on what n is) ofpatches.
Taken together, eqns 1 and 2 can generate very diverseshapes of gain function, depending on the functional responseh and on the foraging costs l and m (Fig. 1). A pattern ofdiminishing returns is ensured by resource depletion, eventhough type-IV functional responses may cause gain functionsto be initially accelerating, i.e. sigmoid, for high resource lev-els. Importantly, qualitatively dissimilar functional responsescan yield qualitatively similar gain functions (Fig. 1a).According to the MVT, optimal foragers should stay in
patches for some time t*, as defined by
_Fðt�Þ ¼ Fðt�ÞTþ t�
ð3Þ
The optimal residence time t� makes both sides of the equa-tion equal to the long-term average rate of gain (a proxy offitness), which is then maximised. This equation has a well-known graphical solution, illustrated in Fig. 1b. One predic-tion is that patches should be depleted down to a certainresource level n� ¼ nðt�Þ, called the giving-up density (GUD;Brown 1988). The MVT extends to heterogeneous habitats,where different patches have different resource levels. In thiscase, there is one similar equation for each type of patch,though no graphical solution exists (see online SupportingInformation).Equations 1, 2 and 3 together define the optimal residence
time t� for some resource level n0. Even though the equa-tions cannot be solved explicitly, we can characterise theeffect of n0 on t�, for any functional response, through sensi-tivity analysis (Calcagno et al. 2014). Only key results willbe presented in the main text; all mathematical derivationsare collected in the online Supporting Information. Analyti-cal predictions will be confronted with numerical simulationsof eqns 1–3, for specific functions classically used for func-tional responses. We first present results for homogeneoushabitats, and then study the consequences of patch hetero-geneity.
RESULTS
Effect of enrichment on movement rate
If one considers the gain function only, as is customary inMVT studies, predicting the sign of variation of t� with n0 isquite difficult: it requires estimating precisely the second time-derivative of F (Supporting Information). However, when sta-ted in terms of the functional response h, predictions simplifygreatly. The optimal residence time increases with enrichmentif and only if:
dh
dn
����n�[
hðn0Þ � hðn�Þn0 � n� þ Tðm� lÞ=Sc �
hðn0Þ � hðn�Þn0 � n�
ð4Þ
The rightmost expression is exact if foraging costs are simi-lar (m = l) or are neglected, as is often done when resourceacquisition translates directly into offspring production (e.g.for parasitoids laying eggs in hosts; Hassell 2000; Wajnberg2006). It is thus a good approximation when costs are small
© 2014 The Authors. Ecology Letters published by John Wiley & Sons Ltd and CNRS.
Letter Functional response and optimal movement rate 1571

relative to potential patch value (big Sc/T) and/or are not toodifferent.Inequality 4 constitutes a simple qualitative criterion on the
type of functional response, on the interval of resource levelsðn�; n0Þ. Starting with the rightmost expression, we see that alinear functional response h(n) = bn yields the equalitydhðn�Þ=dn ¼ ðhðn0Þ � hðn�ÞÞ=ðn0 � n�Þ ¼ b. From this, wededuce that the inequality is never satisfied when h is acceler-ating (concave-up), and always satisfied when h is decelerating(concave-down), on ðn�; n0Þ. A graphical argument is pre-sented in the Supporting Information (Fig. S1). As a conse-quence, the optimal movement rate should increase with n0for accelerating functional responses (e.g. Holling type-III atlow resource levels). Conversely, it should decrease with n0 fordecelerating functional responses (e.g. Holling type-II). Alinear functional response is the knife-edge case where theoptimal movement strategy does not change with enrichment.These predictions are corroborated by numerical simulationspresented in Fig. 2a. We used a flexible power-law functionh(n) = nh (Rosenzweig et al. 1971) to span the range fromdecelerating (0 < h < 1) to accelerating (h > 1) responses. Thevariation of t� switches sign when crossing the linear case
(Fig. 2b). When foraging costs are not negligible and are notthe same between and within patches, predictions are simplyshifted (Fig. 2b). If costs are greater within patches (m > l),T(m�l)/Sc is positive and the inflated denominator makesinequality 4 easier to satisfy: enrichment is thus more likely todecrease movement. Conversely, if costs of moving betweenpatches are greater (l > m), the inequality is harder to satisfy:enrichment is more likely to increase movement. Costs ofmoving thus have the indirect effect of favouring an increasein movement with enrichment, even though their direct effectis to lower the optimal movement rate (Stephens & Krebs1986).These results can also be applied to more complex func-
tional responses. Type-IV functional responses do not yieldparticular predictions; they behave just like decelerating (type-II) responses. In contrast, sigmoid functional responses (e.g.Holling type-III) should cause the optimal residence time todecline, and then rise again, under sustained enrichment. Thisfollows from their being accelerating at low resource levelsand decelerating at high resource levels. The optimal rate ofmovement is thus maximum for some intermediate resourcelevel, as confirmed in numerical simulations (Fig. 3). Note
(a)
(b)
Figure 1 Gain functions for resource consumers. (a) Functions resulting from four contrasted functional responses (linear, decelerating, accelerating and
dome-shaped/type-IV; inset) and no foraging costs. Functions used: Holling’s type-II disk equation (decelerating); n3/2 (accelerating); quadratic polynomial
(type-IV). In the latter case, two resource levels were used (arrows). Note that the gain function is sigmoid for the higher resource level, not for the lower.
(b) Introducing foraging costs. Cost of moving between patches (l; dashed curve); cost within patches (m; dotted curve); or both (dotted-dashed curve). The
starting point was the linear case from panel a (solid curve), for which the graphical solution of the MVT eqn 3 is also shown: the line going through
(�T,0) is tangential to the gain function at t�.
© 2014 The Authors. Ecology Letters published by John Wiley & Sons Ltd and CNRS.
1572 V. Calcagno et al. Letter

that the movement-maximising resource level does notcoincide with the inflection point of the functional response(Fig. 3). In the absence of foraging costs, it is always greater,and foraging costs may shift its position up or down, depend-ing on whether l or m is greater (eqn 4; Fig. 3).
Enrichment in heterogeneous habitats
So far all patches were assumed to have the same resourcelevel n0. In nature, it is arguably more common for the distri-bution of resources to depart from homogeneity, different
1 2 3 4 5
1
2
3
4
5
6
Power-law exponent of functional response
Linear
Res
pons
e of
t
o en
richm
ent
Decelerating
1 2 3 4 5
1
2
3
4
5
6
Time in patch
Cum
ulat
ed g
ain
Cum
ulat
ed g
ain
Accelerating
1.0 2.01.5
0.00
0.05
0.10
0.15
0.5
–0.05
–0.10
(a) (b)
Figure 2 Enrichment in homogeneous habitats. (a) The optimal residence time t� increases with enrichment in the case of a decelerating functional response
(Holling’s type-II disk equation; bottom); but decreases in the case of an accelerating functional response (n3/2; top). (b) Numerically computed proportional
variation of t� with n0 (y-axis), as a function of the power-law exponent h in the functional response nh (x-axis; log-scale). Solid curve: no foraging costs, and
equal costs; Dashed curve: cost of moving between patches only; Dotted curve: cost within patches only. Remember that the movement rate decreases with t�.
Figure 3 Sigmoid (type-III) functional responses. The numerically computed optimal residence time t* (y-axis) is plotted as a function of resource level
(x-axis; log scale). The disk equation n2/(2+n2) was used for the functional response (inset). Its inflection point is materialised by a vertical solid line. Solid
curve: no foraging costs, or equal costs; Dashed curve: cost of moving between patches only; Dotted curve: cost within patches only. Remember that the
movement rate decreases with t*.
© 2014 The Authors. Ecology Letters published by John Wiley & Sons Ltd and CNRS.
Letter Functional response and optimal movement rate 1573

patches having different resource levels. An important ques-tion is how the average rate of movement should respond tooverall enrichment. Does it behave just like in an averagehomogeneous habitat, or does the resource distribution mat-ter? To answer this question, we study how the average resi-dence time ht�j i varies with the average resource level hn0ji.The bracket notation stands for the average over the habitat:if a fraction pj of patches has some characteristic yj,hyji = ∑jpjyj.There are many different ways to enrich a heterogeneous
habitat. All can be described by an impact vector x = (x1,x2,. . .), containing the distribution of the enrichment effortover the different patch-types. Graphically, this defines adirection in the space of patch resource levels, along whichenrichment proceeds (Fig. 4a). Using the same methods asbefore (Supporting Information), it can be shown that theaverage residence time increases with enrichment if and only if
dh
dn
����n�[
hðn0jÞ� �
H�hðn�Þ
n0j� �� n� þ Tðm� lÞ=Sc �
hðn0jÞ� �
H�hðn�Þ
n0j� �� n�
; ð5Þ
where hhðn0jÞiH is a harmonic mean, weighted by the impactsxj:
hðn0jÞ� �
H¼ xj
� �=
xjhðn0jÞ
� �: ð6Þ
Inequality 5 is very similar to ineqn 4, n0 at the denomina-tor being replaced with its average value. However, h(n0) atthe numerator is replaced with the weighted harmonic meanin eqn 6, not by hðhn0jiÞ. Compared to a homogeneous habitatof average richness, predictions thus further depend on howenrichment is distributed over patches. The main result is thatpredictions are shifted in a direction controlled by the relativequality of enriched patches. Again, the type of functionalresponse is key: in general, enriching rich patches, by increas-ing the harmonic mean hhðn0jÞiH, favours an increase in move-ment rate, and enriching poor patches favours a decrease, butthe opposite can be true for type-IV responses.To understand this, we first assume that all enrichment is
concentrated on one single patch-type i. The correspondingimpact vector is parallel to one axis in the space of patchresource levels (xi = 1 and xj 6¼i = 0; Fig. 4a). From eqn 6, itfollows hhðn0jÞiH = h(n0i). Compared to inequality 4, ineqn 5is thus easier to satisfy (which favours a decrease in move-ment) if h(n0i) < hðhn0jiÞ, but more difficult to satisfy (whichfavours an increase in movement) if h(n0i)>hðhn0jiÞ. For allincreasing functional responses (including type-III), thisimplies, respectively, n0i < hn0ji, i.e. a poorer-than-averagepatch, and n0i > hn0ji, i.e. a richer-than-average patch.As an example, with a linear functional response and no
foraging costs, enrichment had no effect in a homogeneoushabitat (Fig. 2). In a heterogeneous habitat, enriching thepoorer patches should thus decrease the average movementrate, and enriching the richer patches should increase move-ment. This can be verified in the numerical simulations of Fig.4a. We can further see that for type-II functional responses(Fig. 4b), enriching the richer patches can increase the averagemovement rate, whereas enrichment always decreased move-ment in homogeneous habitats. Conversely, for accelerating
responses (Fig. 4c), enriching the poorer patches can decreasethe average movement rate, which enrichment can never do ina homogeneous habitat. Of course, if the enriched patcheshave average richness, h(n0i) = hðhn0jiÞ and we recover in allcases exactly the same predictions as for a homogeneous habi-tat (see Fig. S2 in Supporting Information). Interestingly, theeffect of enrichment on the average movement rate does notdepend, qualitatively, on the number of patches impacted (pi),only on their relative quality.Type-IV functional responses may yield different predictions
because they can be decreasing functions of resource level. Insuch cases, h(n0i) < hðhn0jiÞ if n0i is greater, not smaller, thanaverage. Predictions are thus reversed: enriching the poorestpatches favours an increase in the optimal movement rate,and vice versa. This occurs at high enough resource levels, forwhich the gain functions have sigmoid shape (Fig. 1a). Atlower resource levels, predictions are as for other functionalresponses.These results help understand what happens if several
patch-types are enriched simultaneously: the outcome willdepend on whether poor or rich patches are most impacted.For instance, one natural way to enrich a heterogeneous habi-tat is to spread the enrichment effort evenly over all patches.Formally, this means xi = xj for all i and j, corresponding toan impact vector parallel to the first diagonal (Fig. 4a). Poorand rich patches are all enriched with equal intensity, whichwe have seen has opposite effects on ht�j i. However, since thepoor patches are proportionally more impacted, the effects donot balance out: the poor patches dominate (see SupportingInformation). The net result is thus to favour a decrease inthe movement rate, compared to the prediction for a homoge-neous habitat, as is visible in Fig. 4a, except for type-IV func-tional responses at high resource levels. Another interestingenrichment scenario is to have all patches impacted in equalproportion, so that the impact vector has elements xj propor-tional to n0j (Fig. 4a). In these conditions, the contributionsof the different patch-types do balance out perfectly, and theresponse of movement always has the same sign (though pos-sibly different magnitude) as in a homogeneous habitat (seeSupporting Information). This can be verified in all panels ofFig. 4.Overall, a heterogeneous habitat responds to enrichment
just like a homogeneous habitat if only average patches areenriched, or if all patches are enriched by proportionally thesame amount. These scenarios increase the mean of theresource distribution without otherwise changing its hetero-geneity, as measured by the coefficient of variation (CV). Thedifference in predictions between homogeneous and heteroge-neous habitats is thus determined by how enrichment affectsthe CV of the resource distribution (Fig. 4a). This prompts usto study the intrinsic effect of habitat heterogeneity on theoptimal movement rate.
Effect of resource heterogeneity on movement rate
Whereas it is well established that in heterogeneous habitatsindividuals should spend more time on better patches(Stephens & Krebs 1986; Valone & Brown 1989; Wajnberget al. 2000), it is not clear how the overall rate of movement
© 2014 The Authors. Ecology Letters published by John Wiley & Sons Ltd and CNRS.
1574 V. Calcagno et al. Letter
(a) (b)
(c) (d)
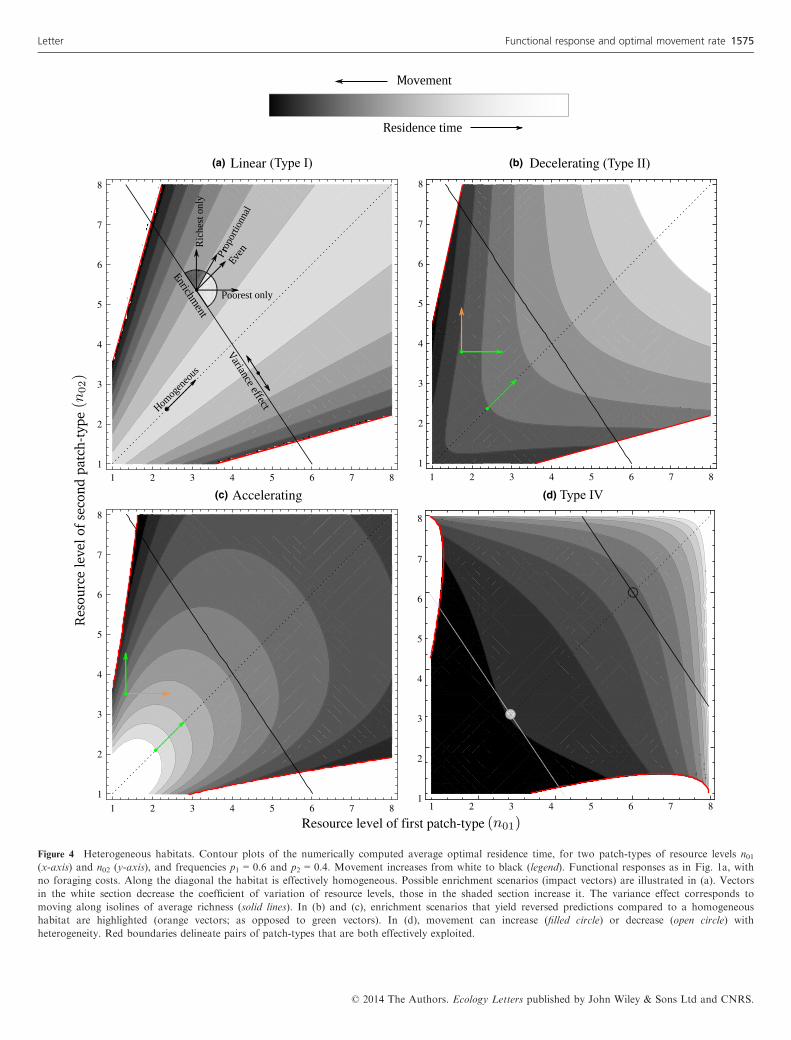
Figure 4 Heterogeneous habitats. Contour plots of the numerically computed average optimal residence time, for two patch-types of resource levels n01(x-axis) and n02 (y-axis), and frequencies p1 = 0.6 and p2 = 0.4. Movement increases from white to black (legend). Functional responses as in Fig. 1a, with
no foraging costs. Along the diagonal the habitat is effectively homogeneous. Possible enrichment scenarios (impact vectors) are illustrated in (a). Vectors
in the white section decrease the coefficient of variation of resource levels, those in the shaded section increase it. The variance effect corresponds to
moving along isolines of average richness (solid lines). In (b) and (c), enrichment scenarios that yield reversed predictions compared to a homogeneous
habitat are highlighted (orange vectors; as opposed to green vectors). In (d), movement can increase (filled circle) or decrease (open circle) with
heterogeneity. Red boundaries delineate pairs of patch-types that are both effectively exploited.
© 2014 The Authors. Ecology Letters published by John Wiley & Sons Ltd and CNRS.
Letter Functional response and optimal movement rate 1575

should vary with patch variance. To understand the intrinsiceffect of heterogeneity, we can analyse the effect of makingpatches more or less similar, keeping the average resourcelevel constant, i.e. a variance effect. This corresponds to hav-ing impact vectors parallel to an isoline of average richness(Fig. 4a). As this is not enrichment, some xj values in theimpact vector are negative, and ineqn 5 does not apply. How-ever, predictions are even clearer (Supporting Information):the variation of ht�j i has the same sign as hxj=hðn0jÞi. Consid-ering only two patches, the conclusion is that making themmore dissimilar, i.e. increase patch variance, should alwaysincrease (decrease) the average movement rate, for increasing(decreasing) functional responses (see Supporting Informa-tion). This is consistent with our previous results, as enrichingthe richest patches and impoverishing the poorest were indi-vidually shown to favour an increase in the movement rate,with the exception of type-IV responses. The prediction isstronger though, since the sign of variation is predictedregardless of the concavity of the functional response. Here,what matters is the slope of the functional response.Applying the argument to all pairs of patches in a habitat,
we conclude that for a given average resource level, the opti-mal rate of movement is minimal when resources are distrib-uted homogeneously, and increases with patch variance,except for type-IV functional responses at high resource levels.The prediction applies at the level of entire habitats: for thesame average resource level, more heterogeneous habitatsshould generally cause individuals to move more. This is visi-
ble in the numerical results of Figure 4 (note that the patternis inverted at sufficiently high resource levels in Fig. 4d). Italso applies if only a few individual patches are manipulatedin an otherwise constant habitat. In this case, the movement-promoting effect of patch variance is preserved, thoughslightly less pronounced than for whole habitats (Fig. 5).
DISCUSSION
The MVT offers a general theoretical connection between theattributes of patchy habitats and optimal movement strategies(Stephens & Krebs 1986). Residence times are an importantaspect of individual life histories, amenable to observationand with definite connections to behaviour and decision-making (McNamara et al. 2006; Wajnberg 2006). Moreover,they determine the rate of movement, and thus the realisedconnectivity between the different parts of a landscape (Belisle2005), ultimately affecting patterns at larger scales, such asthe spatial spread of introduced populations or the magnitudeof gene flow (Bowler & Benton 2005). In consequence, it is ofgreat interest to understand how optimal residence timesshould respond to enrichment and vary with the distributionof resources. By coupling the MVT to an explicit resourceconsumption model, we obtained general predictions regard-ing how the optimal residence times, and thus the averagemovement rate, should vary with the level of resource and itsdistribution over patches. Two main results emerged: (1) theeffect of enrichment can be predicted quite simply in terms of
0 5 10 15 20 25 30 350.0
0.5
1.0
1.5
2.0
2.5
3.0
On poor patch
Average
On rich patch
Patch variance
Opt
imal
resi
denc
e tim
e
Figure 5 Variance effect. For increasingly dissimilar patch-types (x-axis), the optimal residence time on the richer patches, on the poorer patches and the
average residence time ht�j i are shown. The average resource level is constant at hn0ji = 6. Solid lines: the two patch-types compose the entire habitat, in
equal frequencies. Dotted lines: the two patch-types are just two individual patches, in an otherwise unchanged habitat. In both cases, the average residence
time drops below its value in the homogeneous case (horizontal dashed line). Holling’s type-II functional response; foraging costs within patches m = 0.1;
travel time T = 1.5. Remember that the movement rate decreases with t*.
© 2014 The Authors. Ecology Letters published by John Wiley & Sons Ltd and CNRS.
1576 V. Calcagno et al. Letter

the type of functional response, and (2) increasing habitat het-erogeneity should in general cause an increased rate of move-ment.Increasing the average resource level of habitat patches does
not have a universal effect on the optimal rate of movement:the latter may vary in any direction. Though this was sus-pected from graphical intuition (Danchin et al. 2008), no gen-eral picture has emerged for lack of analytical tractability.Theoretical investigations had to stick with simple gain func-tions, for which it was reported that the optimal strategy wasinvariant to enrichment (e.g. Charnov & Parker 1995; Calcag-no et al. 2014). Indeed, the most often used gain functionn0(1 � exp(�bt)) amounts, in the context of resource consum-ers, to assuming a linear (type-I) functional response and noforaging costs, in which case enrichment has no effect on theoptimal movement rate. However, this invariance here provedto be a knife-edge case. In general, an optimal forager shouldadjust its movement rate following enrichment, in one direc-tion or the other, and this depends directly on the type offunctional response: it should move less between patches ifthe functional response is decelerating (e.g. type-II), but movemore if it is accelerating. One consequence of this is that sig-moid functional responses (e.g. type-III) cause the optimalmovement rate to be maximised for some intermediateresource level (Fig. 3). This big picture can be shifted in onedirection or the other when foraging costs are taken intoaccount. Costs of foraging within patches (m) and costs ofmoving between patches (l) make the optimal movement ratemore likely to decrease or to increase with enrichment, respec-tively. Predictions remain unchanged if the two costs aresimilar, however (l = m).It seems paradoxical at first that a forager should spend less
time on patches that have been enriched, and thus waste pro-portionally more time moving between patches. What is evenmore paradoxical is that this outcome is most likely whencosts of moving are high (l > m). This seemingly contradictsthe more intuitive results that, in a given habitat, a foragershould always stay longer on the better patches (Brown 1988;Wajnberg et al. 2000), and that greater costs of moving(higher l) should make individuals more sedentary (Stephens& Krebs 1986). To understand this behavioural ‘paradox ofenrichment’ (Rosenzweig et al. 1971), one must first realisethat increasing the quality of patches does increase therewards of staying longer in a patch, but simultaneouslyincreases the rewards of moving to another patch. The netvariation of the optimal strategy depends on the balancebetween these two forces (Calcagno et al. 2014). This meta-phor helps understand the role of the functional response. Anaccelerating functional response is such that enrichmentmostly boosts the rate of resource consumption in the earlystages of patch exploitation, but not so much in later stages.This is because the shape of the function works againstresource depletion, so that the rate of consumption varies lessand less as time passes. On the contrary, with a deceleratingfunctional response, the boost in consumption rate is modestin freshly entered patches, but more pronounced towards theend of patch exploitation. Hence, the rewards of moving to anew patch increase more in the first case, and that of stayinglonger in the local patch increase more in the second. Our
results indicate that the two forces cancel out only for linearfunctional responses and identical foraging costs; otherwisethey may swing the balance either way. This balance of forcesalso explains the counterintuitive interaction between the costof moving and enrichment. Indeed, with greater costs of mov-ing, individuals move less frequently between patches, andthus relatively overexploit patches compared to the optimumin the absence of costs. Upon enriching patches, the increasedrewards of moving to a fresh patch thus surpass the increasedrewards of staying in an already overexploited patch, makingthe optimal rate of movement more likely to increase overall.A second important result is the prediction that, all else
equal, making resource levels more variable among patches(i.e. increasing patch variance) increases the optimal move-ment rate, under quite general conditions (Fig. 4). Previoustheoretical MVT studies did not detect this variance effect ofthe resource distribution (Olsson & Holmgren 1999). When aheterogeneous habitat is enriched, the variance effect addsonto the enrichment effect discussed above, possibly confusingit. As an example, simulation studies often use Poisson ornegative binomial distributions for resource levels, whosemean parameter is used to vary habitat richness (e.g. Olsson& Holmgren 1999; Wajnberg et al. 2013). Our results explainwhy in these simulations, despite assuming linear functionalresponses and no foraging costs, a decline in movement withenrichment is observed, contradicting analytical investigations(Charnov & Parker 1995). This is really not an enrichmenteffect, but rather a variance effect: a by-product of increasingthe mean of such distributions is to decrease their coefficientof variation, and it is this reduced heterogeneity that causesthe optimal movement rate to decline (see Fig. 4a). This indi-cates that the scaling of variance to mean is a critical propertyof the resource distribution in heterogeneous habitats.Though correlational and experimental studies have often
reported that individuals move faster through resource-depleted areas and spend more time in resource-rich areas(e.g. Avgar et al. 2013; Kuefler et al. 2013), it is not clear howthese two effects should play out. Our results indicate thatindividuals would under-consider, i.e. quit faster, poor patchesto a greater extent than they over-consider rich patches(Fig. 5). This effect is reminiscent, although in a different con-text, of the risk allocation hypothesis for foragers that alter-nate between low-risk and high-risk environments (Lima &Bednekoff 1999; Westneat & Fox 2010). It states that uponincreasing the contrast between the two environments, individ-uals should decrease their feeding time (increase vigilance) inthe disfavourable (high-risk) environment at a faster rate thanincrease their feeding time in the favourable (low-risk)environment, if a greater fraction of time is spent in the latter.In our model, there is added complexity as individuals adap-tively control the time they spend in the different patch-types,but the end result is that they allocate more time to favour-able (rich) patches. Hence, there is a striking similarity: indi-viduals disregard the disfavourable condition (poor patches/high-risk environments) at a faster rate than they specialiseonto the favourable (rich patches/low-risk environments). Inour movement context, the net effect is to make individualsmove more (sample more patches) when there is greater spa-tial heterogeneity in the distribution of resources. This is not
© 2014 The Authors. Ecology Letters published by John Wiley & Sons Ltd and CNRS.
Letter Functional response and optimal movement rate 1577

an expected result, considering that spatial heterogeneity indiffusion rate is in itself known to decrease the overall rate ofspread (Shigesada & Kawasaki 1997). But heterogeneity inmovement rate cannot be a substitute for heterogeneity inresource level, which underlines the importance of using expli-cit ecological models to connect resources and movement(Schick et al. 2008).Interestingly, simulation studies of Bayesian foragers have
observed that average patch residence time decreased withpatch heterogeneity (Green 1980; Olsson & Holmgren 1999),in agreement with our general finding. Bayesian foragingmodels incorporate some realistic behavioural constraints andstochasticity in resource capture (McNamara et al. 2006). Thiscauses some deviations from the ideal MVT predictions. Inparticular, Bayesian foragers do not respond as strongly topatch variance, and there remains a positive associationbetween patch richness and GUD (Olsson & Holmgren 1999;McNamara et al. 2006). Such conservative strategies are fre-quently observed in animals (Valone & Brown 1989; Nonacs2001). That the effect of habitat variance on average move-ment rate is nevertheless as expected from the MVT suggestsit is a robust prediction.Some experimental evidence indicates that habitat heteroge-
neity promotes overall movement. Food-deprived darklingbeetles tended to have greater net movement when resourceswere disposed in a clumped manner rather than more uni-formly in experimental fields (McKenzie et al. 2009). Achilleamillefolium roots grew over greater total distance when soilwas enriched as patches rather than homogeneous (McNickle& Cahill 2009). In artificial patchy mesocosms, Godbold et al.(2011) reported that net movement of various macroarthro-pods was greater when resource distribution was more hetero-geneous. Though this is in general agreement with ourprediction, data that explicitly connect resources and individ-ual movements are still too rare to draw any conclusion, espe-cially at the level of whole habitats (Avgar et al. 2013). It isthus important to stress that the prediction applies not onlyat the habitat level but also for any pair of patches within agiven habitat (Fig. 5). Hence, standard experimental methodsinvolving artificial patches with controlled resource contentcan be readily used to test the prediction, provided focus is onaverage residence time rather than giving-up densities (Valone& Brown 1989; Morris & Davidson 2000; Price & Correll2001).In summary, we showed that the distribution of resources
has two distinct effects on the optimal movement rate: (1) anaverage effect, and (2) a variance effect. Both are stronglyconditioned by the shape of the functional response, thoughin different ways. The average effect can be positive or nega-tive, depending on the concavity of the functional response(i.e. decelerating, linear or accelerating). The variance effectcan also be positive or negative, but this depends on the slopeof the functional response (i.e. decreasing or not). Both effectsoperate simultaneously when enriching heterogeneous habi-tats, so that enrichment can have contrasted effects dependingon the variance-to-mean scaling.Since type-II functional responses are considered to be by
far the most common (Jeschke et al. 2002), increasing the
average level of resource and its variance are both expected todecrease movement quite generally. However, there is amplevariation among taxa (Jeschke et al. 2004). Type-III func-tional responses are not so uncommon, especially in inverte-brates, and for such organisms a non-monotonous effect ofenrichment on movement rate can be expected. The effect ofenrichment should be weakest and most variable for organ-isms that harbour type-I functional responses, such as filter-feeders, while organisms with type-IV responses could responddifferently to the level of habitat heterogeneity depending onthe average resource level. Our results show that the func-tional response is central in determining the response of opti-mal foragers to the resource level in their habitat, as it iscentral in determining the temporal dynamics of consumer–resource interactions in population and community ecology.We suggest that further coupling of optimal foraging studiesand explicit consideration of the functional response (e.g.Price & Correll 2001; Nolet & Klaassen 2009; Avgar et al.2011) would be beneficial, and may help explain some of theobserved variability. By linking MVT and consumer–resourcetheories, we hope to stimulate investigations of how changesin resource distributions impact movement strategies in frag-mented habitats.
ACKNOWLEDGEMENTS
We thank Jacques Brodeur for discussions. VC was funded byINRA, project AAP-SPE-2012-04-05-20.
AUTHORSHIP
LM, FG & EW initiated the work. VC conducted the researchwith LM & FG. VC wrote the manuscript with input from allauthors.
REFERENCES
Abrams, P. (1982). Functional responses of optimal foragers. Am. Nat.,
120, 382–390.Arditi, R. & Dacorogna, B. (1988). Optimal foraging on arbitrary
food distributions and the definition of habitat patches. Am. Nat., 131,
837–846.Astrom, M., Lundberg, P. & Danell, K. (1990). Partial prey consumption
by browsers: trees as patches. J. Anim. Ecol., 59, 287–300.Avgar, T., Kuefler, D. & Fryxell, J.M. (2011). Linking rates of diffusion
and consumption in relation to resources. Am. Nat., 178, 182–190.Avgar, T., Mosser, A., Brown, G.S. & Fryxell, J.M. (2013).
Environmental and individual drivers of animal movement patterns
across a wide geographical gradient. J. Anim. Ecol., 82, 96–106.Belisle, M. (2005). Measuring landscape connectivity: the challenge of
behavioral landscape ecology. Ecology, 86, 1988–1995.Benhamou, S. (2014). Of scales and stationarity in animal movements.
Ecol. Lett., 17, 261–272.Bowler, D. & Benton, T. (2005). Causes and consequences of animal
dispersal strategies: relating individual behaviour to spatial dynamics.
Biol. Rev., 80, 205–225.Brown, J. (1988). Patch use as an indicator of habitat preference,
predation risk, and competition. Behav. Ecol. Sociobiol., 22, 37–47.Calcagno, V., Grognard, F., Wajnberg, E. & Mailleret, L. (2014). How
optimal foragers should respond to habitat changes: a reanalysis of the
marginal value theorem. J. Math. Biol., 69, 1237–1265.
© 2014 The Authors. Ecology Letters published by John Wiley & Sons Ltd and CNRS.
1578 V. Calcagno et al. Letter

Casas, J., Gurney, W., Nisbet, R. & Roux, O. (1993). A probabilistic
model for the functional response of a parasitoid at the behavioural
time-scale. J. Anim. Ecol., 62, 194–204.Cassini, M.H., Kacelnik, A. & Segura, E.T. (1990). The tale of the
screaming hairy armadillo, the guinea pig and the marginal value
theorem. Anim. Behav., 39, 1030–1050.Charnov, E. (1976). Optimal foraging the marginal value theorem. Theor.
Popul. Biol., 9, 129–136.Charnov, E. & Parker, G. (1995). Dimensionless invariants from foraging
theory’s marginal value theorem. Proc. Natl Acad. Sci. USA, 92, 1446–1450.
Danchin, �E., Giraldeau, L., C�ezilly, F. et al. (2008). Behavioural Ecology.
Oxford University Press Oxford, England.
Davidson, D. & Morris, D. (2001). Density-dependent foraging effort of
deer mice (Peromyscus maniculatus). Funct. Ecol., 15, 575–583.Godbold, J.A., Bulling, M.T. & Solan, M. (2011). Habitat structure
mediates biodiversity effects on ecosystem properties. Proc. Biol. Sci.,
278, 2510–2518.Green, R.F. (1980). Bayesian birds: a simple example of Oaten’s
stochastic model of optimal foraging. Theor. Popul. Biol., 18, 244–256.Hassell, M. (2000). The Spatial and Temporal Dynamics of Host-parasitoid
Interactions. Oxford University Press, New York, USA.
Holling, C.S. (1959). Some characteristics of simple types of predation
and parasitism. Can. Entomol., 91, 385–398.Holyoak, M., Casagrandi, R., Nathan, R., Revilla, E. & Spiegel, O.
(2008). Trends and missing parts in the study of movement ecology.
Proc. Natl Acad. Sci. USA, 105, 19060–19065.Jeschke, J.M., Kopp, M. & Tollrian, R. (2002). Predator functional
responses: discriminating between handling and digesting prey. Ecol.
Monogr., 72, 95–112.Jeschke, J.M., Kopp, M. & Tollrian, R. (2004). Consumer-food systems:
why type I functional responses are exclusive to filter feeders. Biol.
Rev., 79, 337–349.Klaassen, R.H., Nolet, B.A. & Bankert, D. (2006). Movement of foraging
tundra swans explained by spatial pattern in cryptic food densities.
Ecology, 87, 2244–2254.Krebs, J.R. & Davies, N.B. (2009). Behavioural Ecology: An Evolutionary
Approach. Blackwell publishing Oxford, UK.
Kuefler, D., Avgar, T. & Fryxell, J.M. (2013). Density- and resource-
dependent movement characteristics in a rotifer. Funct. Ecol., 27, 323–328.
Leeuwen, E.V., Jansen, V., Dieckmann, U., Rossberg, A. et al. (2013). A
generalized functional response for predators that switch between
multiple prey species. J. Theor. Biol., 328, 89–98.Lima, S.L. & Bednekoff, P.A. (1999). Temporal variation in danger drives
antipredator behavior: the predation risk allocation hypothesis. Am.
Nat., 153, 649–659.Livoreil, B. & Giraldeau, L. (1997). Patch departure decisions by spice
finches foraging singly or in groups. Anim. Behav., 54, 967–977.McIntyre, N.E. & Wiens, J.A. (1999). Interactions between landscape
structure and animal behavior: the roles of heterogeneously distributed
resources and food deprivation on movement patterns. Landscape
Ecol., 14, 437–447.McKenzie, H.W., Lewis, M.A. & Merrill, E.H. (2009). First passage time
analysis of animal movement and insights into the functional response.
B. Math. Biol., 71, 107–129.McNamara, J.M., Green, R.F. & Olsson, O. (2006). Bayes theorem and
its applications in animal behaviour. Oikos, 112, 243–251.
McNickle, G.G. & Cahill, J.F. (2009). Plant root growth and the
marginal value theorem. Proc. Natl Acad. Sci. USA, 106, 4747–4751.M�endez, V., Campos, D. & Bartumeus, F. (2013). Stochastic Foundations
in Movement Ecology. Springer-verlag, Berlin Heidelberg, GER.
Morris, D. & Davidson, D. (2000). Optimally foraging mice match patch
use with habitat differences in fitness. Ecology, 81, 2061–2066.Nolet, B. & Klaassen, M. (2009). Retrodicting patch use by foraging
swans in a heterogeneous environment using a set of functional
responses. Oikos, 118, 431–439.Nonacs, P. (2001). State dependent behavior and the marginal value
theorem. Behav. Ecol., 12, 71–83.Olsson, O. & Holmgren, N.M. (1999). Gaining ecological information
about Bayesian foragers through their behaviour. I. Models with
predictions. Oikos, 87, 251–263.Owen-Smith, N., Fryxell, J. & Merrill, E. (2010). Foraging theory
upscaled: the behavioural ecology of herbivore movement. Philos.
Trans. R. Soc. Lond., B, Biol. Sci., 365, 2267–2278.Pleasants, J.M. (1989). Optimal foraging by nectarivores: a test of the
marginal-value theorem. Am. Nat., 134, 51–71.Price, M. & Correll, R. (2001). Depletion of seed patches by Merria’s
kangaroo rats: are gud assumptions met? Ecol. Lett., 4, 334–343.Rosenzweig, M.L. (1971). Paradox of enrichment: destabilization of
exploitation ecosystems in ecological time. Science, 171, 385–387.Schick, R.S., Loarie, S.R., Colchero, F., Best, B.D., Boustany, A., Conde,
D.A., Halpin, P.N., Joppa, L.N., McClellan, C.M. & Clark, J.S.
(2008). Understanding movement data and movement processes:
current and emerging directions. Ecol. Lett., 11, 1338–1350.Shigesada, N. & Kawasaki, K. (1997). Biological Invasions: Theory and
Practice. Oxford University Press, New York, USA.
Stephens, D. & Krebs, J. (1986). Foraging Theory. Princeton University
Press, Princeton, USA.
Valone, T.J. & Brown, J.S. (1989). Measuring patch assessment abilities
of desert granivores. Ecology, 70, 1800–1810.Wajnberg, �E. (2006). Time allocation strategies in insect parasitoids: from
ultimate predictions to proximate behavioral mechanisms. Behav. Ecol.
Sociobiol., 60, 589–611.Wajnberg, E., Fauvergue, X. & Pons, O. (2000). Patch leaving decision
rules and the marginal value theorem: an experimental analysis and a
simulation model. Behav. Ecol., 11, 577.
Wajnberg, E., Hoffmeister, T. & Coquillard, P. (2013). Optimal within-
patch movement strategies for optimising patch residence time: an agent-
based modelling approach. Behav. Ecol. Sociobiol., 67, 2053–2063.Westneat, D. & Fox, C. (2010). Evolutionary Behavioral Ecology. Oxford
University Press, New York, USA.
SUPPORTING INFORMATION
Additional Supporting Information may be downloaded viathe online version of this article at Wiley Online Library(www.ecologyletters.com).
Editor, David HoskenManuscript received 28 July 2014First decision made 18 August 2014Manuscript accepted 11 September 2014
© 2014 The Authors. Ecology Letters published by John Wiley & Sons Ltd and CNRS.
Letter Functional response and optimal movement rate 1579