Embed Size (px)
Citation preview

Chapter 8
The functional organization of theventral visual pathway and itsrelationship to object recognition
Kalanit Grill-Spector
AbstractHumans recognize objects at an astonishing speed and with remarkableease. However, the functional organization of the system that enables thisremarkable human ability is not well understood. Here we examine whetherthe human ventral stream is organized more around stimulus content orrecognition task. We scanned subjects while they performed one of twotasks: object detection (objects versus textures) or subordinate identification(e.g. pigeons versus birds). In order to limit success at recognition, pictureswere presented briefly and then masked. For each subject we searchedfor cortical regions where activity was correlated with correct answers,separately for each category and task. Analysis by task revealed that, foreach category, regions correlated with correct detection and correctidentification were similar. However, analysis by stimulus revealed thatdifferent patterns of activation across occipitotemporal areas werecorrelated with successful identification of different categories. Analysisof regions whose activity was correlated with face recognition revealed ahigher signal for faces (compared to birds and guitars) only in trials inwhich faces were perceived, but not in trials in which faces were notdetected. Overall, these results indicate that the functional organization ofhigher-order areas in the human ventral stream is organized more aroundstimulus content than recognition task. These results provide new insightsinto the representations underlying our ability visually to recognize objects.
8.1 IntroductionHumans recognize objects and faces instantly and effortlessly. What are the underlyingneural mechanisms in our brains that allow us to detect and discriminate amongobjects so efficiently?
Kanwisher-08 9/16/03 9:27 AM Page 169
Multiple ventral occipitotemporal regions anterior to retinotopic cortex (Grill-Spector et al. 1998) respond preferentially to various objects compared to textures(Malach et al. 1995). Indeed, several studies provide evidence that the activation ofoccipitotemporal object areas is correlated with subjects’ perception of objects in avariety of experimental paradigms and tasks (Tong et al. 1998; Grill-Spector et al. 2000;James et al. 2000; Hasson et al. 2001; Kleinschmidt et al. 2002). Further evidence sug-gests that these regions play a critical role in object recognition, since lesions to thefusiform gyrus and occipitotemporal junction produce various recognition deficits(Damasio 1990; Damasio et al. 1990; Farah 1992), and electrical stimulation of theseregions interferes with recognition (Puce et al. 1999).
Functional imaging studies have revealed that some of these regions respond maximally to specific object categories, such as faces (Puce et al. 1995; Kanwisher et al. 1997), places (Aguirre et al. 1998; Epstein and Kanwisher 1998), body parts(Downing et al. 2001), letter strings (Puce et al. 1996), tools (Martin et al. 1996), andanimals (Martin et al. 1996; Chao et al. 1999). These results suggest that areas that elicit a maximal response for a particular category are dedicated to the recognition of that category. However, there are many difficulties underlying this idea. First,comparing activation between a handful of object categories is problematic because it depends on the choice of categories. Secondly, while there is maximal activation toone category the activation to other categories is not negligible (Ishai et al. 1999;Haxby et al. 2001). Thirdly, comparing the amplitude of activation to object categoriesdoes not exclude the possibility that the underlying representation might not be ofwhole objects (Fujita et al. 1992; Grill-Spector et al. 1998; Lerner et al. 2001; Tsunoda et al. 2001). Finally, objects from different categories differ in many dimensions and it is possible that the source of higher activation for a category is not restricted to visual differences.
How is the functional organization of these object-selective regions related to ourability to recognize objects? One view, proposed by Kanwisher (2000), is that the ventraltemporal cortex contains a limited number of modules specialized for the recognitionof special categories, such as faces, places, and body parts, and the remaining cortex,which exhibits little selectivity for particular object categories, is a general-purposemechanism for the perception of any shape of any kind of visually presented object.A second model, proposed by Haxby et al. (2001), is an ‘object form topography’ inwhich occipitotemporal cortex has a topographically organized representation of formattributes. The representation of an object is reflected by a distinct pattern of responseacross ventral cortex, and this distributed activation produces the visual percept.In contrast to the Kanwisher model, Haxby and colleagues propose that submaximalactivations across the ventral stream may be as important as the maximal activations(see also Avidan et al. 2002). A third view, posited by Tarr and Gauthier (2000), is that theorganization is based according to the perceptual processes carried out and not by thecontent of information processed. Here the fundamental idea is that different cognitive
FUNCTIONAL NEUROIMAGING OF VISUAL COGNITION170
Kanwisher-08 9/16/03 9:27 AM Page 170
processes require different computations, that are instantiated in different parts ofthe visual cortex.
Here we examine whether the functional organization of object-selective regions inoccipitotemporal cortex is based on the content of information processed or on com-putations dedicated to specific perceptual processes. To distinguish between thesealternatives we scanned subjects while they performed different recognition tasks:object detection or subordinate-level identification (Rosch et al. 1976) on three objectcategories—faces, birds, and guitars. We asked two experimental questions: (1) withineach task, are the same or different regions correlated with success at recognizing different categories; and (2) for each stimulus category, are the same or differentregions correlated with success at different recognition tasks?
8.2 Parsing object recognition into component stagesWhat are the stages of processing involved in visual object recognition? Hierarchicalmodels of object recognition suggest that recognition involves several processing steps,proceeding from low-level stages that extract local visual information about features(Livingstone and Hubel 1988; Gallant et al. 1993), contours (von der Heydt et al. 1984),and boundaries (Lamme 1995; Zhou et al. 2000), to high-level stages that performrecognition by matching the incoming visual stimulus to stored representations ofobjects. Many models of recognition posit an intermediate stage at which the object issegmented from the rest of the image. Underlying this idea is the intuition that an effi-cient object recognition system should not operate indiscriminately on just any regionof an image, because most such regions will not correspond to distinct objects. Instead,researchers have argued that stored object representations should be accessed only forimage regions selected as candidate objects by a prior image segmentation process(Rubin 1958; Nakayama et al. 1995; Driver and Baylis 1996). However, other evidence(Peterson 1994) suggests that object recognition may influence segmentation, and mayperhaps precede image segmentation.
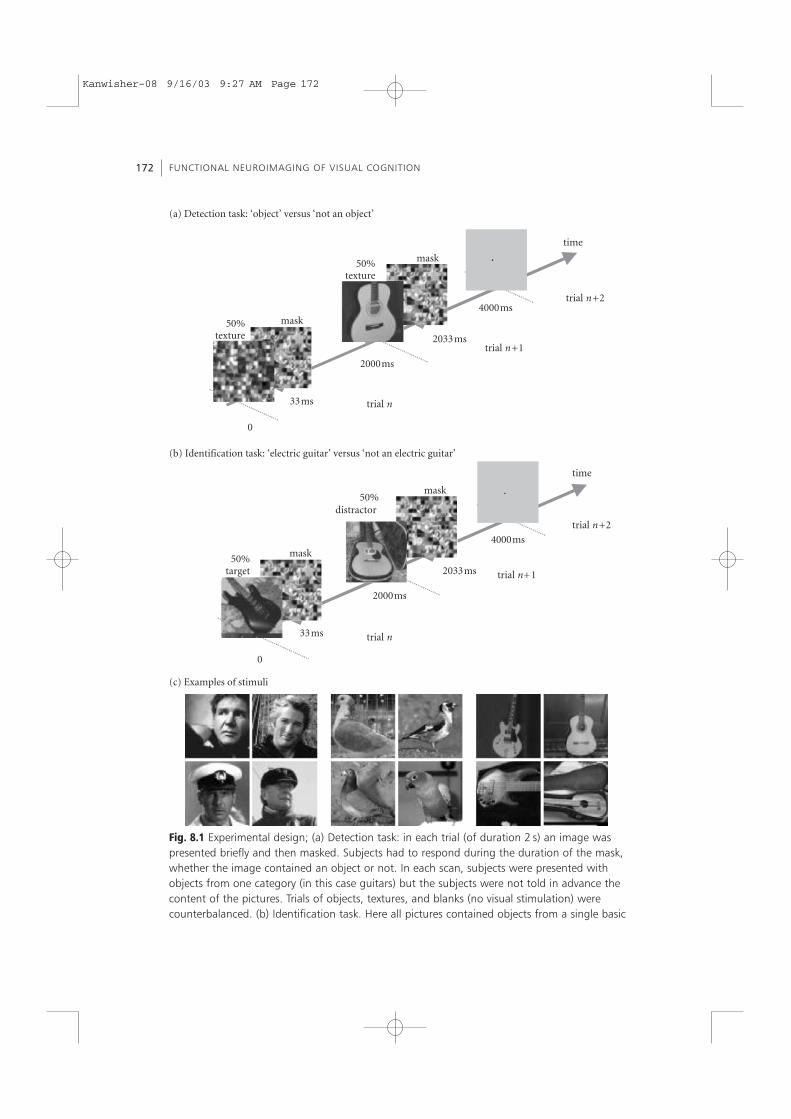
To tease apart processing stages involved in visual recognition we varied stimulusexposure duration and measured behavioral performance on three different recogni-tion tasks, each designed to tap into a different candidate stage of object recognition:detection, categorization, and identification. The detection task was designed to be aminimalist test of object segmentation that does not require recognition. Here subjectswere asked to decide whether a gray-scale image contained an object or not. They weretold that they did not have to recognize the object to report its presence. Half of thetrials contained objects from 10 categories and half of the trials consisted of texturepatterns created by randomly scrambling object images to 225 squares to equate meanluminance and local low-level features (see Fig. 8.1a). The second task was objectcategorization, in which subjects were required to categorize the object in the picturefrom a set of 10 possible categories: face, bird, dog, fish, flower, house, car, boat, guitar,
THE FUNCTIONAL ORGANIZATION OF THE VENTRAL VISUAL PATHWAY 171
Kanwisher-08 9/16/03 9:27 AM Page 171
FUNCTIONAL NEUROIMAGING OF VISUAL COGNITION172
(c) Examples of stimuli
2000ms
time
4000ms
33ms
2033ms
trial n
trial n+2
0
mask
mask
50%texture
50%texture
2000ms
0
time
4000ms
33ms
2033ms
trial n
trial n+1
(b) Identification task: ‘electric guitar’ versus ‘not an electric guitar’
mask
mask50%
target
distractor50%
(a) Detection task: ‘object’ versus ‘not an object’
.
trial n+1
trial n+2
Fig. 8.1 Experimental design; (a) Detection task: in each trial (of duration 2 s) an image waspresented briefly and then masked. Subjects had to respond during the duration of the mask,whether the image contained an object or not. In each scan, subjects were presented withobjects from one category (in this case guitars) but the subjects were not told in advance thecontent of the pictures. Trials of objects, textures, and blanks (no visual stimulation) werecounterbalanced. (b) Identification task. Here all pictures contained objects from a single basic
Kanwisher-08 9/16/03 9:27 AM Page 172
or trumpet. In the identification task subjects were instructed to discriminate a particu-lar subordinate member of a category from other members of that category. Possibleanswers were: Harrison Ford, pigeon, German shepherd, shark, rose, barn, VW beetle,sailboat, electric guitar versus ‘other’, i.e. other male faces, other birds, other cars, etc.In all three tasks, the frequency of each category was 10% and for each basic-level cate-gory half of the images were from a single subordinate class. Images were presented infive durations (between 17 and 167 ms) in a counterbalanced order.
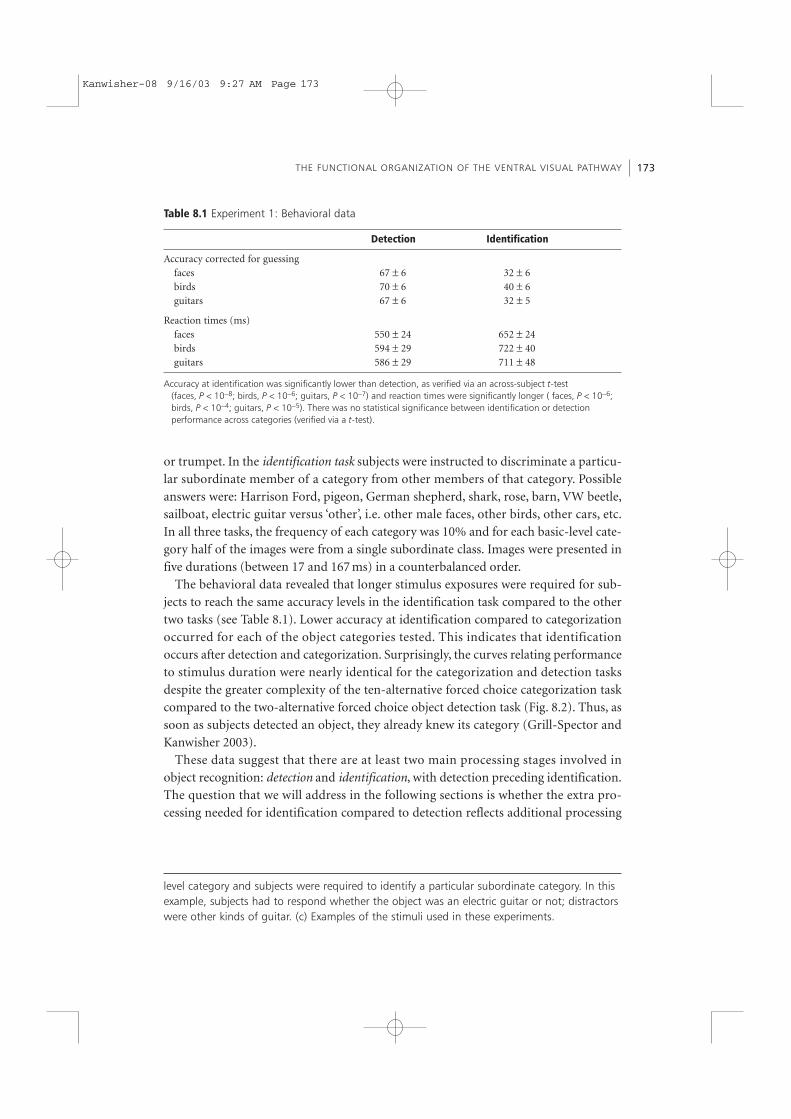
The behavioral data revealed that longer stimulus exposures were required for sub-jects to reach the same accuracy levels in the identification task compared to the othertwo tasks (see Table 8.1). Lower accuracy at identification compared to categorizationoccurred for each of the object categories tested. This indicates that identificationoccurs after detection and categorization. Surprisingly, the curves relating performanceto stimulus duration were nearly identical for the categorization and detection tasksdespite the greater complexity of the ten-alternative forced choice categorization taskcompared to the two-alternative forced choice object detection task (Fig. 8.2). Thus, assoon as subjects detected an object, they already knew its category (Grill-Spector andKanwisher 2003).
These data suggest that there are at least two main processing stages involved inobject recognition: detection and identification, with detection preceding identification.The question that we will address in the following sections is whether the extra pro-cessing needed for identification compared to detection reflects additional processing
THE FUNCTIONAL ORGANIZATION OF THE VENTRAL VISUAL PATHWAY 173
level category and subjects were required to identify a particular subordinate category. In thisexample, subjects had to respond whether the object was an electric guitar or not; distractorswere other kinds of guitar. (c) Examples of the stimuli used in these experiments.
Table 8.1 Experiment 1: Behavioral data
Detection Identification
Accuracy corrected for guessingfaces 67 ± 6 32 ± 6birds 70 ± 6 40 ± 6guitars 67 ± 6 32 ± 5
Reaction times (ms)faces 550 ± 24 652 ± 24birds 594 ± 29 722 ± 40guitars 586 ± 29 711 ± 48
Accuracy at identification was significantly lower than detection, as verified via an across-subject t-test(faces, P < 10−8; birds, P < 10−6; guitars, P < 10−7) and reaction times were significantly longer ( faces, P < 10−6;birds, P < 10−4; guitars, P < 10−5). There was no statistical significance between identification or detectionperformance across categories (verified via a t-test).
Kanwisher-08 9/16/03 9:27 AM Page 173
within the same cortical area, or whether it requires additional processing at subse-quent stages.
8.3 Regions correlated to detection or identification of threeobject categories
Our behavioral data indicates that subjects’ performance in detection and categoriza-tion is similar. Therefore, in the fMRI experiments, we chose to use only two tasks: detec-tion and identification. Here we asked subjects to perform either a detection task (seeFig. 8.1a) that required subjects to detect the presence of an object without having torecognize it, or an identification task (Fig. 8.1b) that required subjects to discriminatebetween objects belonging to the same basic level category (Rosch et al. 1976). Wemanipulated subjects’ ability to recognize objects by presenting pictures very briefly,for 33 or 50 ms1 and then masking the images with a texture pattern. Due to the briefvisual presentation, in some trials subjects could identify or detect objects, and in oth-ers they could not. When subjects viewed this display, we measured both behavioralperformance and brain activation in a rapid event-related design experiment, using a3T fMRI scanner.2 In contrast to conventional fMRI experiments, in which areas aredefined based on their amplitude of activation to different types of stimuli, here we localized areas that were correlated with detection or identification object, using‘individual subjects’ behavioral data.
In the detection task, subjects were asked to decide whether or not a gray-scale imagecontained an object. Half the trials contained objects from one basic level category andhalf the trials contained texture patterns. The identification task required subjects to
FUNCTIONAL NEUROIMAGING OF VISUAL COGNITION174
–100
102030405060708090
100
0 50 100 150 200
Exposure (ms)
Acc
ura
cy c
orre
cted
for
gues
sin
g
DetectionCategorizationIdentification
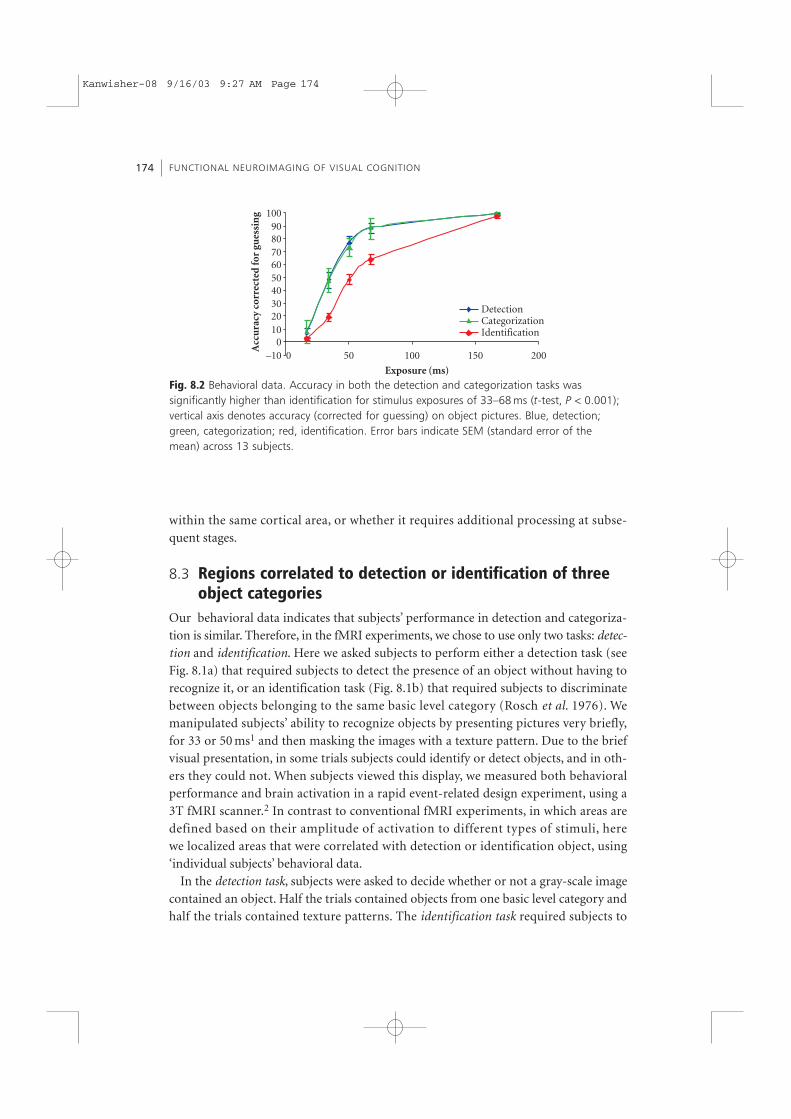
Fig. 8.2 Behavioral data. Accuracy in both the detection and categorization tasks wassignificantly higher than identification for stimulus exposures of 33–68 ms (t-test, P < 0.001);vertical axis denotes accuracy (corrected for guessing) on object pictures. Blue, detection;green, categorization; red, identification. Error bars indicate SEM (standard error of themean) across 13 subjects.
Kanwisher-08 9/16/03 9:27 AM Page 174
discriminate a particular subordinate member of a category (e.g. electric guitar) fromother members of that category (e.g. other guitars) that share a common structure.Here all images belonged to one category (in this example guitars). Half of the imageswere different pictures of the target subordinate category and half of the images wereother objects from the same basic level category. In separate scans subjects were askedto perform one of the two tasks (detection or identification) on one of three objectcategories: faces, guitars, or birds.
Importantly, in these experiments, in each trial subjects viewed an image they hadnever seen before, so performance could not be affected by prior knowledge of particu-lar images. Further, objects from each category and subordinate class were depicted invarious viewing conditions and with different backgrounds (see Fig. 8.1c) to reducethe probability that subjects would use a small set of low-level features to performthese tasks.
The behavioral performance of subjects is given in Table 8.1. Similar to the ten-categoryexperiment, for all object categories accuracy was significantly lower and reaction timessignificantly longer for the identification task compared to the detection task. Reactiontimes for detection were on the average 125 ms shorter than identification, suggestingthat it occurs prior to identification. This occured for all three categories, includingfaces (Tanaka 2001). The differences in performance in the detection and identificationtasks indicate that subjects were indeed performing different perceptual tasks duringthese scans.
8.4 Detection experimentFor each subject we searched for regions that were correlated with successful detectionseparately for each category. Thus, we ran a statistical test searching for regions thatshowed a higher signal in trials in which objects were present and subjects successfullydetected their presence (hits) compared to trials in which objects were present but sub-jects failed to detect their presence (misses). Texture stimuli were not included in thestatistical analysis. This analysis was performed individually for each subject on a voxelby voxel basis. Importantly, in all trials a picture of an object from the same basic levelcategory was shown for the same exposure duration. The only difference between trialswas whether subjects succeeded or failed to detect the object.
For each of the categories, we found regions correlated with successful detection(examples of maps for faces and guitars are given in Fig. 8.3). These included the lateraloccipital cortex (LO) and ventral occipitotemporal (VOT) areas including the occipi-totemporal sulcus (OTS) and the fusiform gyrus. While we found for each object cate-gory regions that were correlated with successful detection, the pattern of activationacross the human ventral stream was different for different categories. Hence, differentsubregions within higher-level areas were correlated with the detection of differentcategories.
THE FUNCTIONAL ORGANIZATION OF THE VENTRAL VISUAL PATHWAY 175
Kanwisher-08 9/16/03 9:27 AM Page 175
8.5 Identification experimentWe performed a similar analysis for the identification experiment. Here we searchedfor regions that showed a higher signal in trials in which subjects were successful atidentification. ‘Hits’ were defined as trials in which the target subordinate category waspresent and subjects answered correctly (e.g. electric guitar present and subjectsresponded ‘electric guitar’). ‘Misses’ were trials in which the target subordinate cate-gory was present, but subjects answered incorrectly (e.g. electric guitar present but
FUNCTIONAL NEUROIMAGING OF VISUAL COGNITION176
Subject: B.I.
Detect faces
Fusiform
LOLO
Fusiform
Fusiform
LOLO
Fusiform
Identify faces
LOLO
Detect guitars
LO
OTS
LO
OTS
Identify guitars
right left
OTSOTS
(a)
(b)
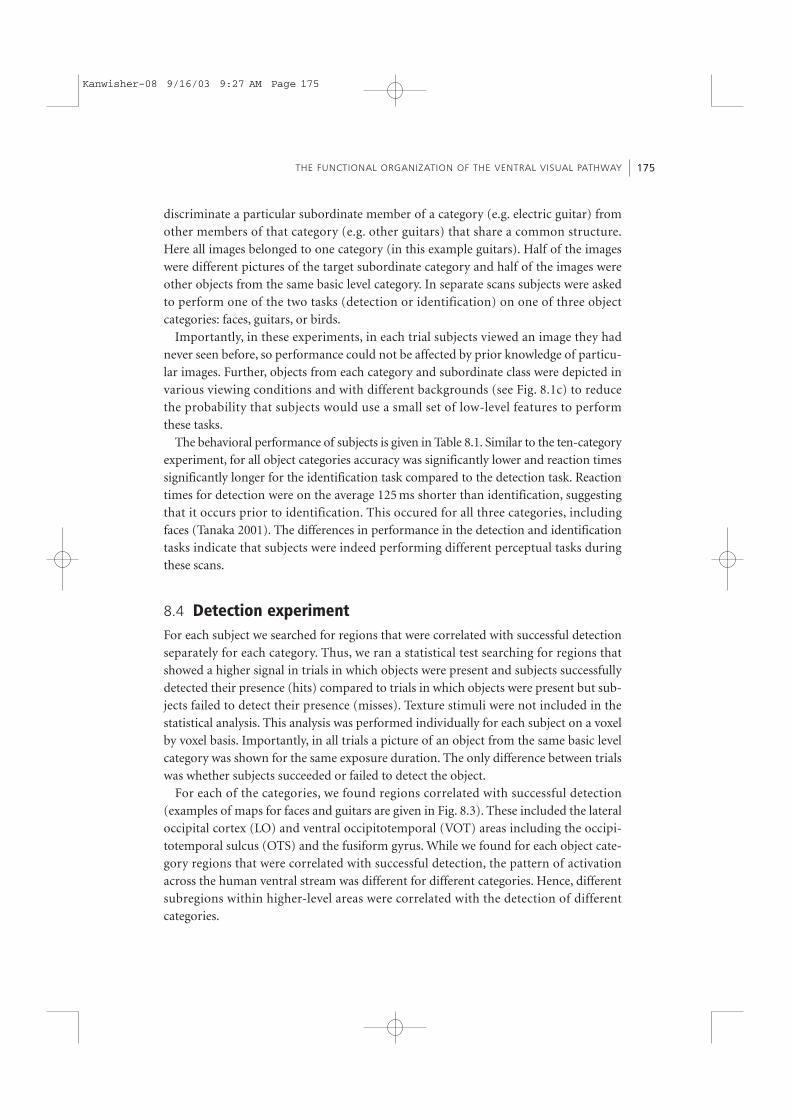
Fig. 8.3 Areas correlated with correct detection and identification. (a) Areas correlated withhits > misses in the detection task shown on the inflated brain for one representative subjectfor two of the categories tested. Statistical analysis was performed using FS-fast softwaredeveloped at MGH and brainalyzer software written by K.G.S. Brain reconstruction was per-formed using Freesurfer (Dale et al. 1999; Fischl et al. 1999, 2001). Color code indicates sta-tistical significance (yellow, P < 10−4; red: P < 10−2). (b) Areas correlated with hits > misses inthe identification task shown on the inflated brain of the same subject shown in (a). Colorcode indicates statistical significance (yellow, P < 10−4; red, P < 10−2).
Kanwisher-08 9/16/03 9:27 AM Page 176

subject responded ‘not an electric guitar’). Here catch trials contained other objectsfrom the same basic level category (e.g. other guitars), but were not included in the sta-tistical analysis.3 This analysis was performed independently for each subject and cate-gory. Results are given in Fig. 8.3. Similar to the detection experiment, for each objectcategory we found regions in the human ventral stream that were correlated withsuccessful identification. Again, the pattern of activated areas across the human ventralstream that was correlated with successful identification was different for differentcategories.
8.6 Question 1: When we keep the category constant,are the same or different regions correlated with successat different tasks?
For each category we superimposed the maps of regions correlated with successfulidentification and successful detection and tested for conjunction effects. This super-position shows that when the category was kept constant there was a large degree ofoverlap between voxels that were correlated with detection and identification (yellowvoxels in Fig. 8.4a). Across subjects, 60 ± 7% of the activated voxels were correlatedwith success at both object detection and object identification. Thus, most of the voxelswere correlated with both identification and detection for each of the object categories.Thus, when the category was kept constant, similar regions across the human ventralstream were correlated with successful identification and detection.
8.7 Question 2: When we keep the task constant are thesame or different regions correlated with recognition ofdifferent object categories?
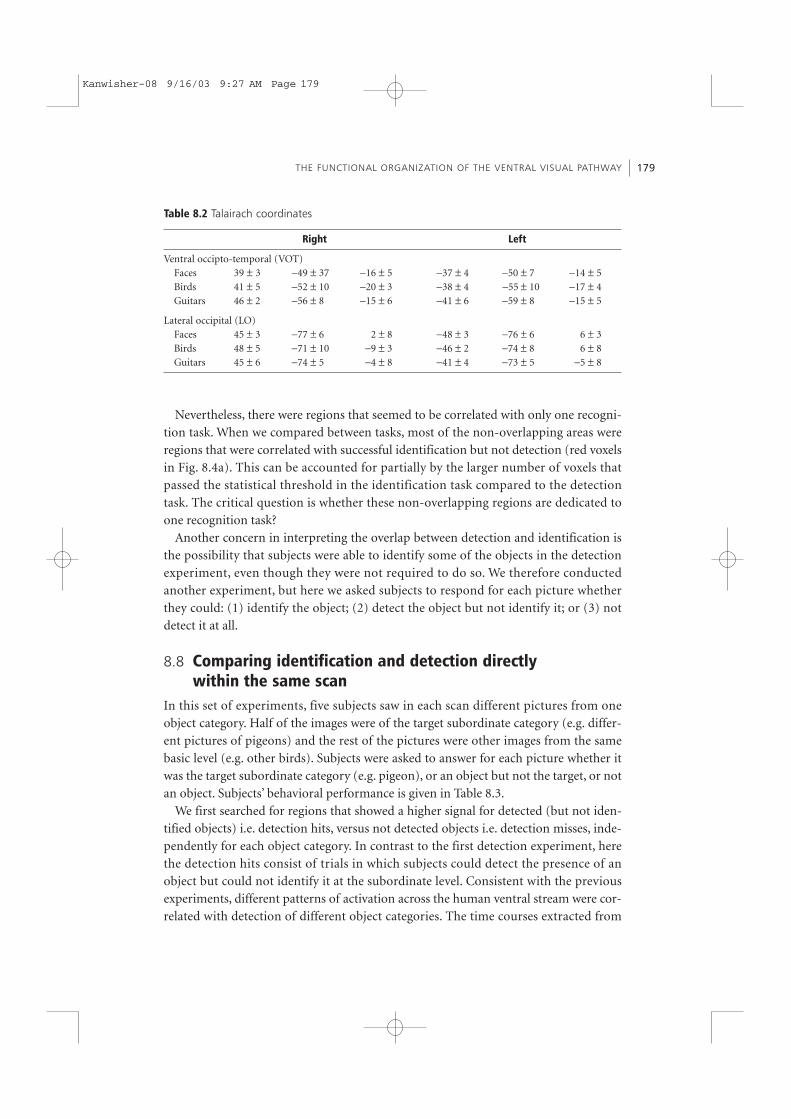
Next we superimposed maps of areas correlated with identification of faces, guitars,and birds, to test whether these areas are overlapping or distinct (see Fig. 8.4b). Whenwe superimposed maps of areas correlated with the identification of two object cate-gories, most of the voxels were not overlapping. Across subjects, only 33 ± 10% of theactivated voxels were correlated with the identification of two different categories.Taliarach coordinates for the center of activated regions in the identification task aregiven in Table 8.2. Thus, when the task was kept constant, largely different regionsacross the ventral stream were correlated with success at identifying different objectcategories.
The results of the superposition analysis reveal that there was approximately twice asmuch overlap between areas that were correlated with detection and identification of aparticular category, than the amount of overlap between areas that were correlatedwith identification of different object categories. This suggests that the organization inthe ventral stream is more around visual content rather than perceptual task.
THE FUNCTIONAL ORGANIZATION OF THE VENTRAL VISUAL PATHWAY 177
Kanwisher-08 9/16/03 9:27 AM Page 177
FUNCTIONAL NEUROIMAGING OF VISUAL COGNITION178
birds
(b) Overlap by category: identification task
faces
overlap
guitars
faces
overlap
birds
guitars
overlap
Subject: B.P.
(a) Overlap by task
correct detection
correct identification
overlap
faces birds guitars
right left
Subject: B.P.
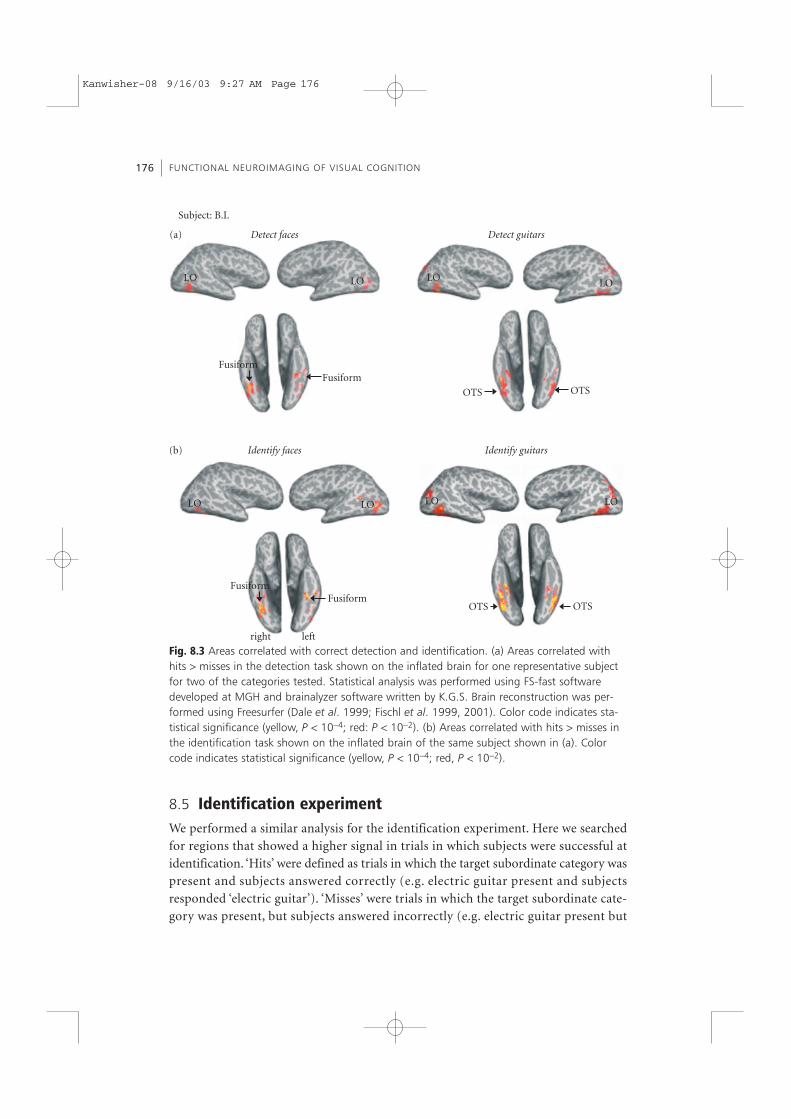
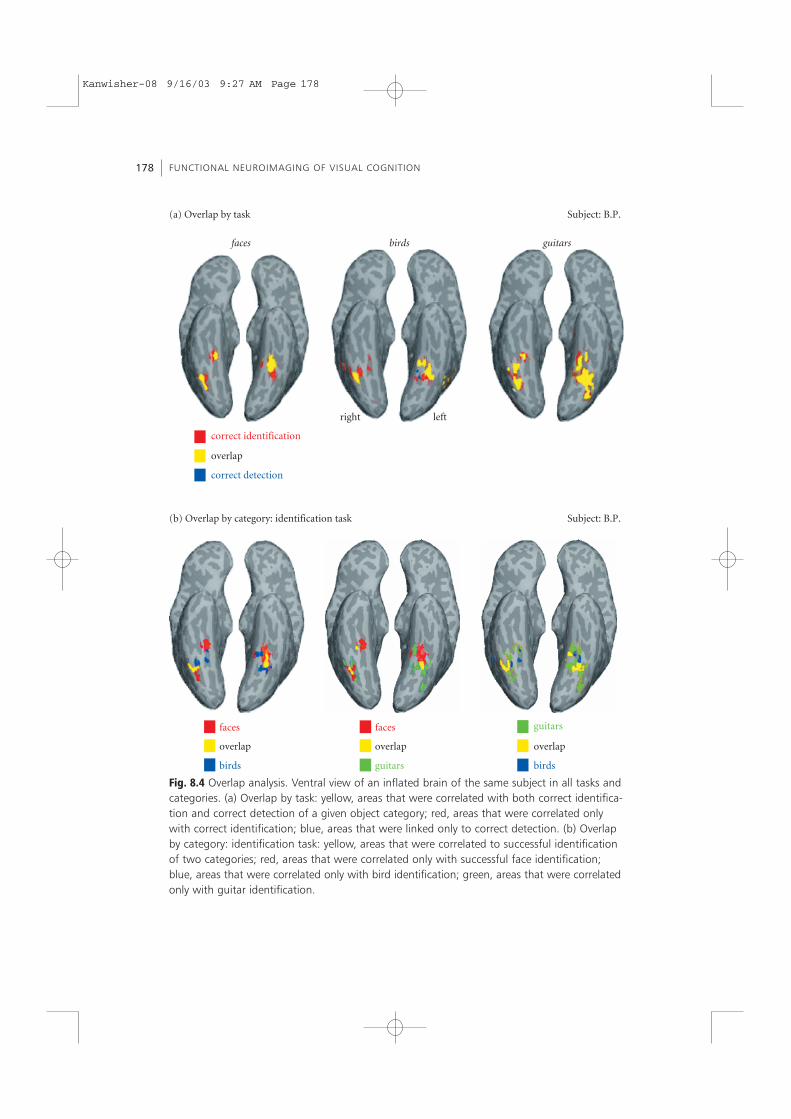
Fig. 8.4 Overlap analysis. Ventral view of an inflated brain of the same subject in all tasks andcategories. (a) Overlap by task: yellow, areas that were correlated with both correct identifica-tion and correct detection of a given object category; red, areas that were correlated onlywith correct identification; blue, areas that were linked only to correct detection. (b) Overlapby category: identification task: yellow, areas that were correlated to successful identificationof two categories; red, areas that were correlated only with successful face identification;blue, areas that were correlated only with bird identification; green, areas that were correlatedonly with guitar identification.
Kanwisher-08 9/16/03 9:27 AM Page 178
Nevertheless, there were regions that seemed to be correlated with only one recogni-tion task. When we compared between tasks, most of the non-overlapping areas wereregions that were correlated with successful identification but not detection (red voxelsin Fig. 8.4a). This can be accounted for partially by the larger number of voxels thatpassed the statistical threshold in the identification task compared to the detectiontask. The critical question is whether these non-overlapping regions are dedicated toone recognition task?
Another concern in interpreting the overlap between detection and identification isthe possibility that subjects were able to identify some of the objects in the detectionexperiment, even though they were not required to do so. We therefore conductedanother experiment, but here we asked subjects to respond for each picture whetherthey could: (1) identify the object; (2) detect the object but not identify it; or (3) notdetect it at all.
8.8 Comparing identification and detection directlywithin the same scan
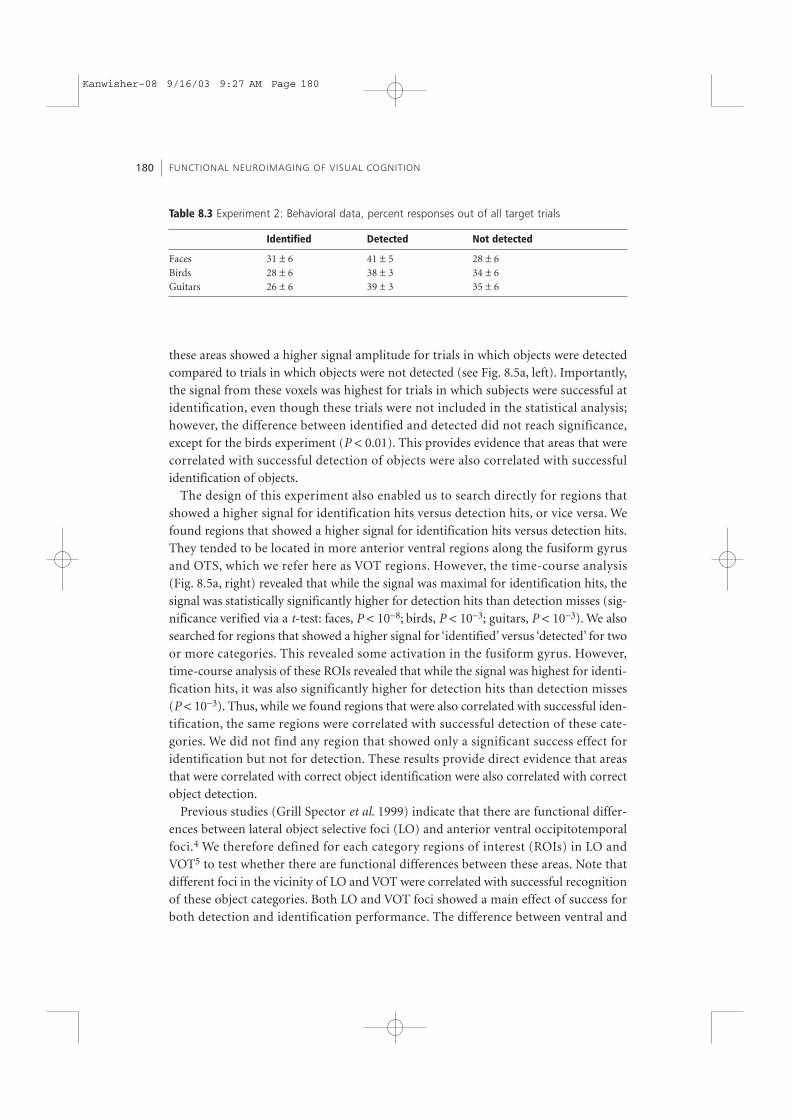
In this set of experiments, five subjects saw in each scan different pictures from oneobject category. Half of the images were of the target subordinate category (e.g. differ-ent pictures of pigeons) and the rest of the pictures were other images from the samebasic level (e.g. other birds). Subjects were asked to answer for each picture whether itwas the target subordinate category (e.g. pigeon), or an object but not the target, or notan object. Subjects’ behavioral performance is given in Table 8.3.
We first searched for regions that showed a higher signal for detected (but not iden-tified objects) i.e. detection hits, versus not detected objects i.e. detection misses, inde-pendently for each object category. In contrast to the first detection experiment, herethe detection hits consist of trials in which subjects could detect the presence of anobject but could not identify it at the subordinate level. Consistent with the previousexperiments, different patterns of activation across the human ventral stream were cor-related with detection of different object categories. The time courses extracted from
THE FUNCTIONAL ORGANIZATION OF THE VENTRAL VISUAL PATHWAY 179
Table 8.2 Talairach coordinates
Right Left
Ventral occipto-temporal (VOT)Faces 39 ± 3 −49 ± 37 −16 ± 5 −37 ± 4 −50 ± 7 −14 ± 5Birds 41 ± 5 −52 ± 10 −20 ± 3 −38 ± 4 −55 ± 10 −17 ± 4Guitars 46 ± 2 −56 ± 8 −15 ± 6 −41 ± 6 −59 ± 8 −15 ± 5
Lateral occipital (LO)Faces 45 ± 3 −77 ± 6 2 ± 8 −48 ± 3 −76 ± 6 6 ± 3Birds 48 ± 5 −71 ± 10 −9 ± 3 −46 ± 2 −74 ± 8 6 ± 8Guitars 45 ± 6 −74 ± 5 −4 ± 8 −41 ± 4 −73 ± 5 −5 ± 8
Kanwisher-08 9/16/03 9:27 AM Page 179
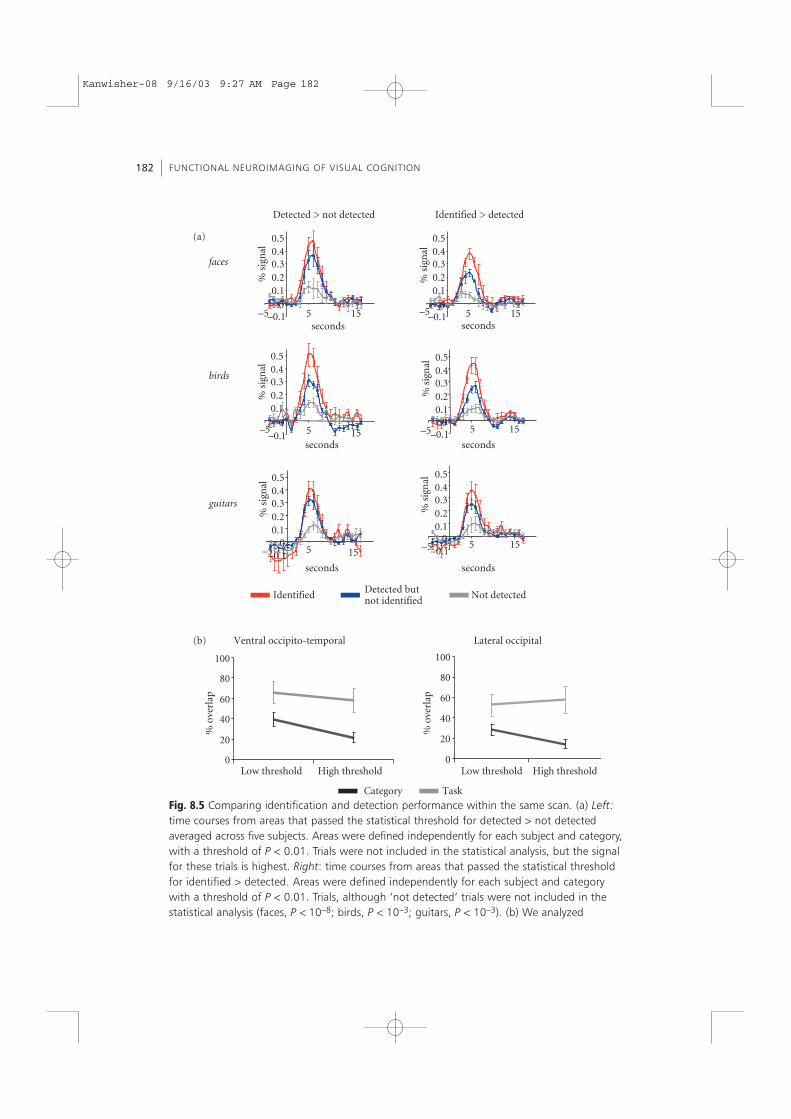
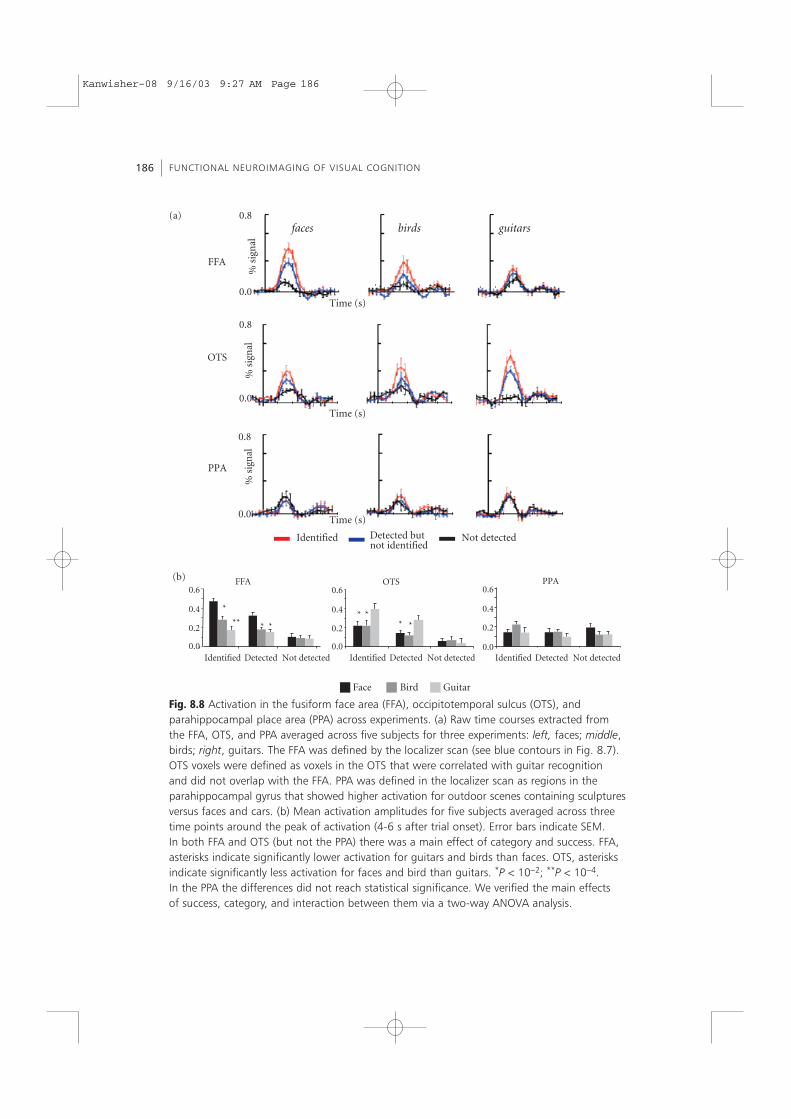
these areas showed a higher signal amplitude for trials in which objects were detectedcompared to trials in which objects were not detected (see Fig. 8.5a, left). Importantly,the signal from these voxels was highest for trials in which subjects were successful atidentification, even though these trials were not included in the statistical analysis;however, the difference between identified and detected did not reach significance,except for the birds experiment (P < 0.01). This provides evidence that areas that werecorrelated with successful detection of objects were also correlated with successfulidentification of objects.
The design of this experiment also enabled us to search directly for regions thatshowed a higher signal for identification hits versus detection hits, or vice versa. Wefound regions that showed a higher signal for identification hits versus detection hits.They tended to be located in more anterior ventral regions along the fusiform gyrusand OTS, which we refer here as VOT regions. However, the time-course analysis(Fig. 8.5a, right) revealed that while the signal was maximal for identification hits, thesignal was statistically significantly higher for detection hits than detection misses (sig-nificance verified via a t-test: faces, P < 10−8; birds, P < 10−3; guitars, P < 10−3). We alsosearched for regions that showed a higher signal for ‘identified’ versus ‘detected’ for twoor more categories. This revealed some activation in the fusiform gyrus. However,time-course analysis of these ROIs revealed that while the signal was highest for identi-fication hits, it was also significantly higher for detection hits than detection misses (P < 10−3). Thus, while we found regions that were also correlated with successful iden-tification, the same regions were correlated with successful detection of these cate-gories. We did not find any region that showed only a significant success effect foridentification but not for detection. These results provide direct evidence that areasthat were correlated with correct object identification were also correlated with correctobject detection.
Previous studies (Grill Spector et al. 1999) indicate that there are functional differ-ences between lateral object selective foci (LO) and anterior ventral occipitotemporalfoci.4 We therefore defined for each category regions of interest (ROIs) in LO andVOT5 to test whether there are functional differences between these areas. Note thatdifferent foci in the vicinity of LO and VOT were correlated with successful recognitionof these object categories. Both LO and VOT foci showed a main effect of success forboth detection and identification performance. The difference between ventral and
FUNCTIONAL NEUROIMAGING OF VISUAL COGNITION180
Table 8.3 Experiment 2: Behavioral data, percent responses out of all target trials
Identified Detected Not detected
Faces 31 ± 6 41 ± 5 28 ± 6Birds 28 ± 6 38 ± 3 34 ± 6Guitars 26 ± 6 39 ± 3 35 ± 6
Kanwisher-08 9/16/03 9:27 AM Page 180
THE FUNCTIONAL ORGANIZATION OF THE VENTRAL VISUAL PATHWAY 181
lateral foci was the magnitude of the effect across tasks. VOT foci exhibited a signifi-cant signal increase from detection misses to detection hits and also a significant signalincrease from detection hits to identification misses. Both of these effects were statisti-cally significant for all categories (P < 0.01). In LO the signal increased significantlyfrom not detection misses to detection hits for all categories (P < 0.001), but theincrease in the signal strength from detection hits to identification hits was statisticallysignificant only for birds (P < 0.01). These results may suggest a hierarchy within theventral stream, with LO regions contributing more to object detection/segmentationand VOT foci involved both in object detection and object identification.
Finally, we directly compared overlap by task and overlap by category in this experi-ment. Here, we performed the overlap analysis at two threshold levels6 to ensure thatour results do not depend on the choice of the threshold (see Fig. 8.5b). The resultsdemonstrate that for both threshold levels the overlap by task was far greater than theoverlap by category. At low thresholds the overlap by task was greater by twofold com-pared to overlap by category, and in higher thresholds the overlap by task was greaterby threefold. These differences were statistical significant (LO, high threshold, P < 10−5;low threshold, P < 10−6; VOT, high threshold, P < 10−6; low threshold, P < 10−7).Importantly, at both threshold levels the majority of voxels that were correlated withcorrect recognition of one category were not the same voxels that were correlated withsuccessful recognition of another category. Note that increasing the threshold leveldecreases the extent of activated areas. The finding that overlap by category is smallerat higher thresholds suggests that smaller ROI are more homogeneous and thus displaya higher degree of category specificity. Thus, this analysis strengthens the conclusionthat there is a higher degree of overlap by task compared to overlap by category andfurther show that this result does not depend on the choice of the threshold.
8.9 False identificationOur data so far suggest that activation in higher-order areas is predictive of success atobject recognition. These regions were not activated to the same degree whenever anobject stimulus was present; rather they were activated when the stimulus was thereand the subject could report its presence consciously. The false-alarm data provideanother demonstration that the activation was correlated with subjects’ reports ratherthan with the presence of the stimulus.
In the first set of experiments we did not have a sufficient number of false-alarmtrials to be able to measure a reliable signal. In the second set of experiments, 2 out of5 subjects produced a sufficient number of false-alarm trials (17% and 22% of thenon-target trials) to obtain a measurable signal. False alarms consisted of trials inwhich objects from the same basic level category as the target category (e.g. birds) wereincorrectly identified as the target subordinate category (e.g. pigeons). Interestingly, thesignal for falsely identified trials (green in Fig. 8.6) was almost as high as identification
Kanwisher-08 9/16/03 9:27 AM Page 181
FUNCTIONAL NEUROIMAGING OF VISUAL COGNITION182
IdentifiedDetected butnot identified
Not detected
Detected > not detected Identified > detected
–0.10
0.10.20.30.40.5
0.10.20.30.40.5
0.10.20.30.40.5
0.10.20.30.40.5
0.10.20.30.40.5
0.10.20.30.40.5
–5
% s
ign
al
–0.10
–5
% s
ign
al
–0.10
–5 5 15
5 15
5 15
5 15
5 15
5 15seconds
seconds
% s
ign
al
–0.10
–5seconds
seconds
seconds seconds
% s
ign
al–0.1
0–5
% s
ign
al
–0.10
–5
% s
ign
al
birds
faces
guitars
(a)
(b)
0
20
40
60
80
100
Low threshold High threshold
% o
verl
ap
0
20
40
60
80
100
Low threshold High threshold
% o
verl
ap
Ventral occipito-temporal Lateral occipital
Category Task
Fig. 8.5 Comparing identification and detection performance within the same scan. (a) Left:time courses from areas that passed the statistical threshold for detected > not detectedaveraged across five subjects. Areas were defined independently for each subject and category,with a threshold of P < 0.01. Trials were not included in the statistical analysis, but the signalfor these trials is highest. Right: time courses from areas that passed the statistical thresholdfor identified > detected. Areas were defined independently for each subject and categorywith a threshold of P < 0.01. Trials, although ‘not detected’ trials were not included in thestatistical analysis (faces, P < 10−8; birds, P < 10−3; guitars, P < 10−3). (b) We analyzed
Kanwisher-08 9/16/03 9:27 AM Page 182
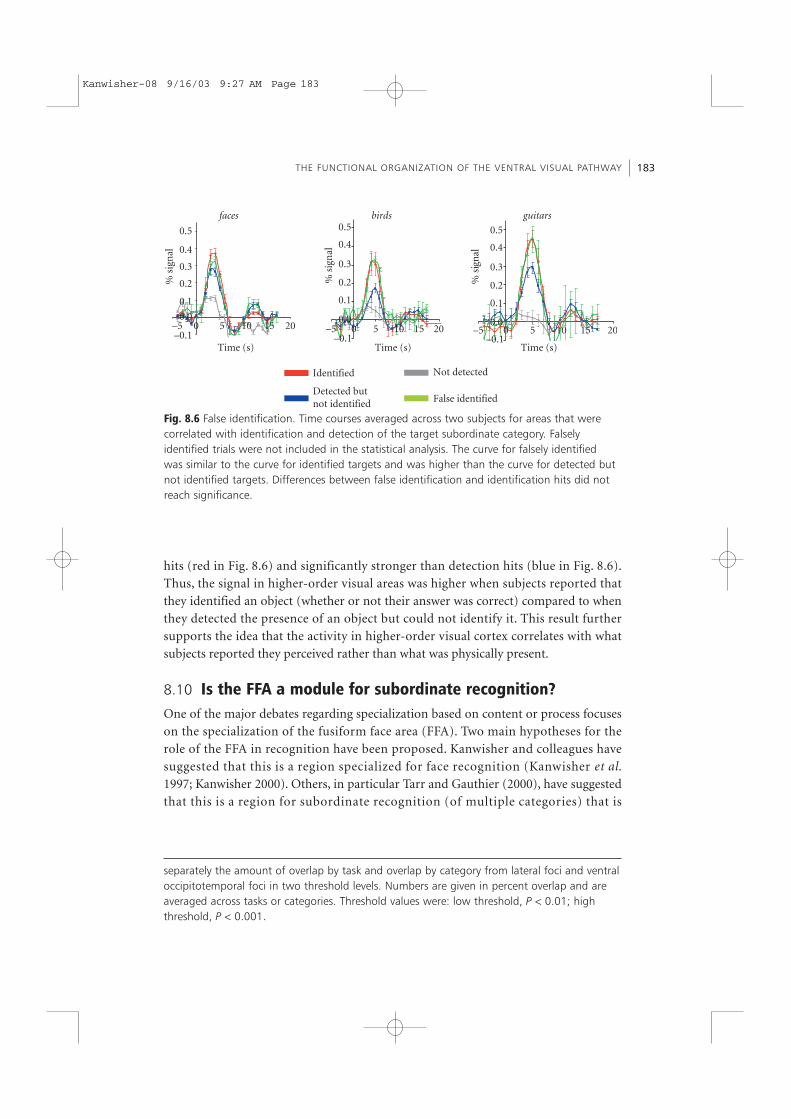
hits (red in Fig. 8.6) and significantly stronger than detection hits (blue in Fig. 8.6).Thus, the signal in higher-order visual areas was higher when subjects reported thatthey identified an object (whether or not their answer was correct) compared to whenthey detected the presence of an object but could not identify it. This result furthersupports the idea that the activity in higher-order visual cortex correlates with whatsubjects reported they perceived rather than what was physically present.
8.10 Is the FFA a module for subordinate recognition?One of the major debates regarding specialization based on content or process focuseson the specialization of the fusiform face area (FFA). Two main hypotheses for therole of the FFA in recognition have been proposed. Kanwisher and colleagues havesuggested that this is a region specialized for face recognition (Kanwisher et al.1997; Kanwisher 2000). Others, in particular Tarr and Gauthier (2000), have suggestedthat this is a region for subordinate recognition (of multiple categories) that is
THE FUNCTIONAL ORGANIZATION OF THE VENTRAL VISUAL PATHWAY 183
% s
ign
al
Time (s)Time (s)Time (s)
% s
ign
al
–0.1 –0.1 –0.1
0.0
0.1
0.2
0.3
0.4
0.5
0.0
0.1
0.2
0.3
0.4
0.5
0.0
0.1
0.2
0.3
0.4
0.5
–5 50 10 15 20 –5 50 10 15 20 –5 50 10 15 20
% s
ign
al
birds guitarsfaces
Identified
Detected but not identified
Not detected
False identified
Fig. 8.6 False identification. Time courses averaged across two subjects for areas that werecorrelated with identification and detection of the target subordinate category. Falselyidentified trials were not included in the statistical analysis. The curve for falsely identifiedwas similar to the curve for identified targets and was higher than the curve for detected butnot identified targets. Differences between false identification and identification hits did notreach significance.
separately the amount of overlap by task and overlap by category from lateral foci and ventraloccipitotemporal foci in two threshold levels. Numbers are given in percent overlap and areaveraged across tasks or categories. Threshold values were: low threshold, P < 0.01; highthreshold, P < 0.001.
Kanwisher-08 9/16/03 9:27 AM Page 183
automated by expertise. These authors argue that faces (and expert categories) areautomatically accessed at the subordinate level and therefore face recognition recruitsthe FFA.
These two hypotheses posit different outcomes for FFA activation in our experi-ments. The first hypothesis that FFA is a module for face recognition predicts that theactivation of the FFA should be correlated with both face identification and face detec-tion but not with identification of other object categories. In contrast, the secondhypothesis, that the FFA is involved in subordinate identification, predicts that the acti-vation of the FFA should be linked to successful identification of all categories, butshould not be correlated with correct detection of faces (or other objects).
To directly test these hypotheses for each subject, we used an independent localizerscan to define the FFA based on a face selectivity test. In the localizer scan we used ablock design experiment in which subjects passively viewed pictures of faces, cars,novel objects (abstract sculptures) in outdoor scenes and textures. The FFA wasdefined for each subject as the regions in the fusiform gyrus that showed a higher sig-nal for faces compared to cars and novel objects, with a significance level of P < 10−4
(see blue in Fig. 8.7).First, we compared the locus of regions activated by correct versus incorrect identifi-
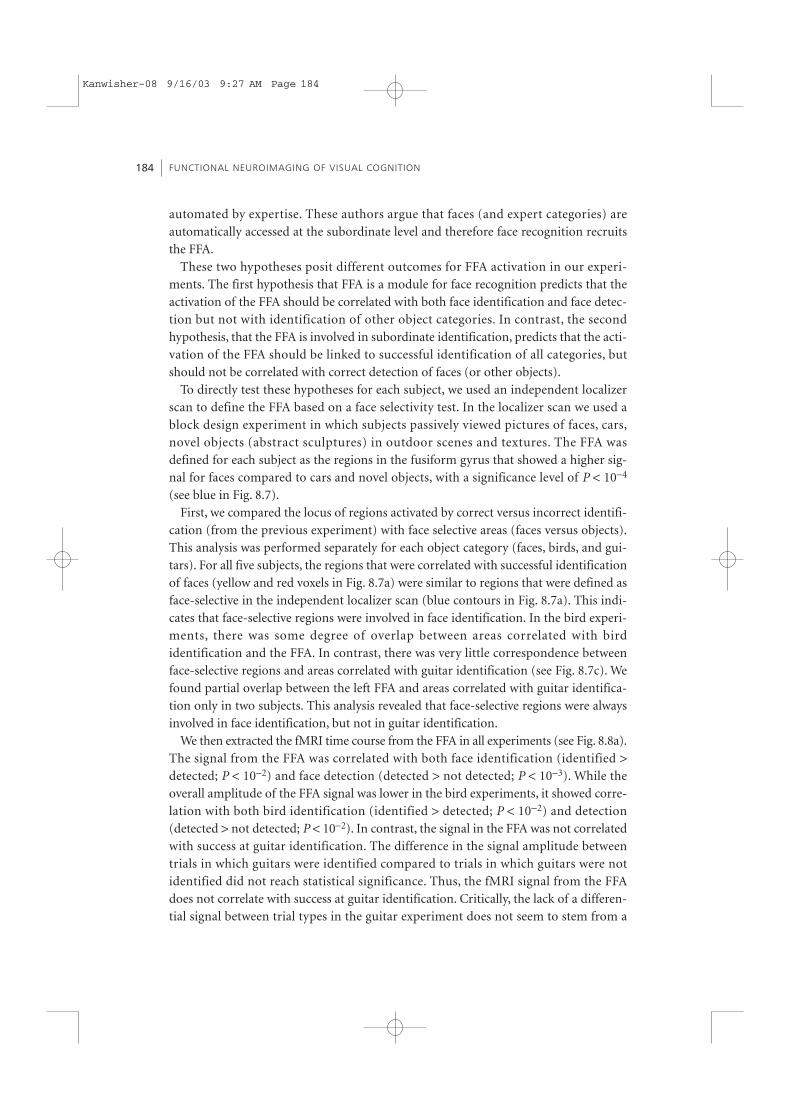
cation (from the previous experiment) with face selective areas (faces versus objects).This analysis was performed separately for each object category (faces, birds, and gui-tars). For all five subjects, the regions that were correlated with successful identificationof faces (yellow and red voxels in Fig. 8.7a) were similar to regions that were defined asface-selective in the independent localizer scan (blue contours in Fig. 8.7a). This indi-cates that face-selective regions were involved in face identification. In the bird experi-ments, there was some degree of overlap between areas correlated with birdidentification and the FFA. In contrast, there was very little correspondence betweenface-selective regions and areas correlated with guitar identification (see Fig. 8.7c). Wefound partial overlap between the left FFA and areas correlated with guitar identifica-tion only in two subjects. This analysis revealed that face-selective regions were alwaysinvolved in face identification, but not in guitar identification.
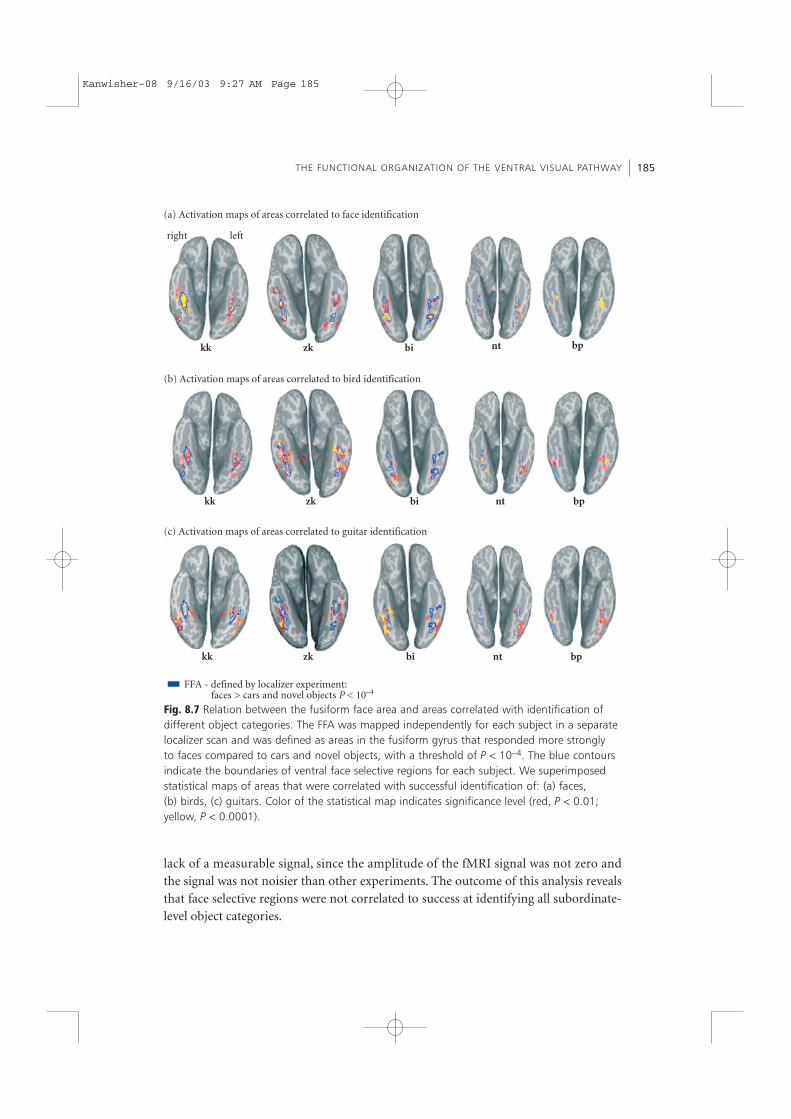
We then extracted the fMRI time course from the FFA in all experiments (see Fig. 8.8a).The signal from the FFA was correlated with both face identification (identified >detected; P < 10−2) and face detection (detected > not detected; P < 10−3). While theoverall amplitude of the FFA signal was lower in the bird experiments, it showed corre-lation with both bird identification (identified > detected; P < 10−2) and detection(detected > not detected; P < 10−2). In contrast, the signal in the FFA was not correlatedwith success at guitar identification. The difference in the signal amplitude betweentrials in which guitars were identified compared to trials in which guitars were notidentified did not reach statistical significance. Thus, the fMRI signal from the FFAdoes not correlate with success at guitar identification. Critically, the lack of a differen-tial signal between trial types in the guitar experiment does not seem to stem from a
FUNCTIONAL NEUROIMAGING OF VISUAL COGNITION184
Kanwisher-08 9/16/03 9:27 AM Page 184
lack of a measurable signal, since the amplitude of the fMRI signal was not zero andthe signal was not noisier than other experiments. The outcome of this analysis revealsthat face selective regions were not correlated to success at identifying all subordinate-level object categories.
THE FUNCTIONAL ORGANIZATION OF THE VENTRAL VISUAL PATHWAY 185
bikk bpntzk
FFA - defined by localizer experiment: faces > cars and novel objects P < 10–4
(a) Activation maps of areas correlated to face identification
(b) Activation maps of areas correlated to bird identification
(c) Activation maps of areas correlated to guitar identification
bikk bpntzk
bikk bpntzk
right left
Fig. 8.7 Relation between the fusiform face area and areas correlated with identification ofdifferent object categories. The FFA was mapped independently for each subject in a separatelocalizer scan and was defined as areas in the fusiform gyrus that responded more stronglyto faces compared to cars and novel objects, with a threshold of P < 10−4. The blue contoursindicate the boundaries of ventral face selective regions for each subject. We superimposedstatistical maps of areas that were correlated with successful identification of: (a) faces,(b) birds, (c) guitars. Color of the statistical map indicates significance level (red, P < 0.01;yellow, P < 0.0001).
Kanwisher-08 9/16/03 9:27 AM Page 185
FUNCTIONAL NEUROIMAGING OF VISUAL COGNITION186
(b)
Identified Detected Not detected Identified Detected Not detected Identified Detected Not detected
Face Bird Guitar
OTS
*** *
0.0
0.2
0.4
0.6
0.0
0.2
0.4
0.6PPA
**
FFA
*
**
0.0
0.2
0.4
0.6
faces birds guitars
0.0
0.8
0.0
0.8
0.0
0.8
OTS
FFA
PPA
Identified Detected but not identified
Not detected
% s
ign
al%
sig
nal
% s
ign
al
Time (s)
Time (s)
Time (s)
(a)
Fig. 8.8 Activation in the fusiform face area (FFA), occipitotemporal sulcus (OTS), andparahippocampal place area (PPA) across experiments. (a) Raw time courses extracted fromthe FFA, OTS, and PPA averaged across five subjects for three experiments: left, faces; middle,birds; right, guitars. The FFA was defined by the localizer scan (see blue contours in Fig. 8.7).OTS voxels were defined as voxels in the OTS that were correlated with guitar recognitionand did not overlap with the FFA. PPA was defined in the localizer scan as regions in theparahippocampal gyrus that showed higher activation for outdoor scenes containing sculpturesversus faces and cars. (b) Mean activation amplitudes for five subjects averaged across threetime points around the peak of activation (4-6 s after trial onset). Error bars indicate SEM.In both FFA and OTS (but not the PPA) there was a main effect of category and success. FFA,asterisks indicate significantly lower activation for guitars and birds than faces. OTS, asterisksindicate significantly less activation for faces and bird than guitars. *P < 10−2; **P < 10−4.In the PPA the differences did not reach statistical significance. We verified the main effectsof success, category, and interaction between them via a two-way ANOVA analysis.
Kanwisher-08 9/16/03 9:27 AM Page 186
The activation maps in Fig. 8.7 indicate that for all subjects there was a region in theOTS lateral to the FFA that was correlated with guitar identification. For each subjectwe defined ROIs in the OTS that were correlated with guitar identification but did notoverlap with the FFA. Time courses extracted from the OTS revealed an opposite pro-file of activation relative to FFA activation (see Fig. 8.8a). While OTS voxels reveal amain effect of success, the higher signal for identification hits versus detection hits inthe OTS reached significance (P < 10−3) for guitars but did not reach significance forfaces or birds. Surprisingly, OTS voxels demonstrated a main effect of category prefer-ence for guitars (see Fig. 8.8b). This category preference was revealed despite the factthat the selection of these voxels was not based on category selectivity.
The category preference in the FFA (for faces) and OTS (for guitars) was not automatic.On trials in which objects were present, but not detected, the fMR signal from both theFFA and OTS was lowest. Importantly, in this condition there was no statistically sig-nificant difference between the activations to different categories, in either the FFA orOTS (see Fig. 8.8b). However, on trials in which objects were detected or identified, thesignal was significantly higher in the FFA for faces compared to both birds and guitars(and the converse was true for OTS activation). This indicates that the higher activa-tion for the preferred category does not occur automatically but only when a perceptoccurs.
Is the FFA a module dedicated to subordinate identification? The data presented hereindicate that the FFA is not a module for subordinate categorization of all categories.First, the signal from the FFA is predictive of success at both detection and identificationof faces (and birds). Secondly, the signal from the FFA was correlated with successfulidentification of faces but not guitars. Thus, it is not correlated with identification ofall object categories. However, we found a different region in the OTS that was correlated with successful identification of guitars, showing that our failure to find thiseffect in the FFA was not due to some artifact. These results argue against the hypothe-sis suggested by Tarr and Gauthier (2000) that the role of the FFA is fine-grained subordinate discrimination between objects of any category.
8.11 DiscussionIn sum, our data show that when the category was held constant but subjects per-formed different recognition tasks (fine-grained identification or object detection)similar regions in the human ventral stream were activated. However, when the taskwas kept constant and subjects were required to identify different object categories,
THE FUNCTIONAL ORGANIZATION OF THE VENTRAL VISUAL PATHWAY 187
FFA, the interaction between faces and guitars was found for ‘detected’ compared with ‘notdetected’ (F > 6; P < 0.01) and for ‘identified’ compared with ‘detected’ (F > 4; P < 0.05).OTS: ‘detected’ compared with ‘not detected’, F > 6, P < 0.01; ‘identified’ compared with‘detected’, F > 6.7; P < 0.001.
Kanwisher-08 9/16/03 9:27 AM Page 187
different regions of the human ventral stream were activated. Even at the lowestthresholds there was twice as much overlap by task than content. This suggests that thehuman ventral stream is organized more around visual content than visual process (at least the processes treated here). Furthermore, we have shown that areas that werecorrelated with correct recognition of a category were also selective to that category,but only when the objects were detected or identified. Finally, our data show that theFFA is not a module for subordinate identification of any object category.
Our data reveal that similar regions within higher order areas were correlated withcorrect identification and detection when the object category was held constant.Surprisingly, even the most anterior regions along the ventral stream showed correla-tion with success at both detection and identification. This occurred despite the lack ofnecessity for explicit visual recognition in the detection task. In all areas that showedcorrelation with success at recognition, the signal was stronger for trials in whichobjects were successfully identified compared to trials in which objects were detectedbut not identified and lowest when objects were not detected at all. One possible expla-nation for the higher signal for identification compared to detection within the sameregions is that identification requires longer processing times, and thus is a conse-quence of more neural processing. Since the bold signal sums up all the neural activa-tions (Logothetis et al. 2001) this will be measured as a larger fMRI signal. Thus, oneimplication of these results is that the additional processing necessary for identifica-tion compared to detection occurs within the same cortical regions.
We found some differences between lateral-occipital and ventral occipitotemporalregions that were correlated with successful visual recognition. While the overlap bytask analysis revealed that most of the voxels in LO and VOT were correlated with bothidentification and detection of an object category, some of the voxels in LO and VOTwere correlated with detection but not with identification. Overall, LO regions contained a higher percentage of voxels that were correlated primarily with detectionand not identification compared to VOT. Thus, if we consider a hierarchy of visualareas involved in object recognition, LO seems to be a candidate for a processing stageprior to VOT.
While there was substantially more segregation by category than by task, we did notfind 100% overlap or segregation by either task or category. However, what clearlyemerges is that the level of visual processing (at least those tested here) is not the majorguideline for differentiating between regions in the ventral stream; object type seemsto play a more critical role in differentiating among subdivisions of the human ventralstream. What still remains unknown is the precise nature of object representation inthese regions, which could be whole objects, object fragments or even complex featuresand feature conjunctions.
Our data show that the recognition of a category is correlated with a distributed, dis-tinct, and replicable pattern of activation across higher-order brain areas. This result isconsistent with an ‘object form topography’ (Edelman et al. 1998; Haxby et al. 2001).
FUNCTIONAL NEUROIMAGING OF VISUAL COGNITION188
Kanwisher-08 9/16/03 9:27 AM Page 188
However, there are several important differences between the current results and thoseof Haxby et al. (2001). In their study Haxby et al. (2001) examined where there is infor-mation about object categories in ventral cortex. They showed that the response to agiven category could be determined by the distributed pattern of activation across allventral occipitotemporal cortex. Importantly, their analysis revealed that it was possi-ble to predict the category of the object even when regions that showed maximal acti-vation to a particular category were excluded. In contrast, the experiments describedhere examined which areas are used for visual recognition tasks. Our data suggest thatthe activation that is correlated with successful recognition of a category does notextend across all VOT. Rather, subregions within the VOT tend to be correlated withsuccessful recognition of a category, and these were the same regions that showedhigher activation for that category.
One of the predictions from Haxby et al. (2001) is that it is possible to predict from thepattern of activation across regions that showed a higher signal for house, the object category, (even faces, which are not the preferred category). To test directly whether oursubjects used house-selective regions in the parahippocampal place area (PPA) to recog-nize objects, we extracted time courses from PPA ROIs.7 Unlike the activation in the OTSand FFA, the time courses extracted from the PPA did not show either a main effect ofsuccess (see Fig. 8.8a) or category (see Fig. 8.8b). Thus, the signal from the PPA was notcorrelated with successful recognition of these three object categories. Thus, while Haxbyet al. (2001) suggest that activation in the PPA conveys information about all object cate-gories, our data indicate that the PPA does not seem to be utilized for the recognition ofseveral categories. Moreover, the fact that there exists a region within the ventral streamthat is not correlated with correct recognition further strengthens the conclusion that notall regions within the VOT contribute equally to visual recognition of specific categories.
Another mystery that remains unresolved is why the higher activation for specificcategories is localized and replicable across subjects? Malach et al. (2002) have sug-gested that category preference emerges from resolution needs, which are tightly linkedto eccentricity bias (Levy et al. 2001; Hasson et al. 2002; Malach, et al. 2002). Howeverthis explanation does not fully account for the experiments described here. Here, allidentification experiments required high visual acuity, yet different regions of the ven-tral stream were correlated with the identification of different categories. One possibil-ity (that remains to be examined) is that regions along the OTS have a foveal bias.Another possibility is that eccentricity bias is not the only parameter that governsobject-form topography in the human ventral stream.
However, this explanation does not fully account for the experiments described here.Here, all identification experiments required high visual acuity—yet different regionsof the ventral stream were correlated with the identification of different categories.One possibility (that remains to be examined) is that regions along the OTS have afoveal bias. Another possibility is that eccentricity bias is not the only parameter thatgoverns object-form topography in the human ventral stream.
THE FUNCTIONAL ORGANIZATION OF THE VENTRAL VISUAL PATHWAY 189
Kanwisher-08 9/16/03 9:27 AM Page 189
Finally, we address the issue of modularity. While our data argue against the hypoth-esis that the FFA is a module for subordinate recognition, they also pose some con-straints on the hypothesis that the FFA is a module dedicated solely for face recognition.While the signal from the FFA was highest for faces, it was also correlated with successat bird identification and detection. This correlation between the FFA signal and suc-cess at bird detection and identification occurred despite the fact that our subjects werenot bird experts. One possibility is that neurons within the FFA are selective to bothhuman and animal faces or face features. Birds (and other animals) have faces and faceparts such as eyes, mouths, etc. Thus one possible interpretation of these results is thatthe axis of differentiation between subregions within ventral cortex is animate/inanimaterather than faces/objects, and the activation of FFA may be necessary for recognition ofanimate categories that contain faces. However, this remains to be verified.
Another difficulty in interpreting the function of the FFA as a module for face recog-nition is that the signal in an adjacent region in the OTS showed a success effect forfaces, even though the signal was smaller for faces compared to guitars. One possibleexplanation is that this was caused by partial voluming artifacts. Another alternative isthat the OTS contains some general shape processors that are used for both object andface recognition. Hopefully, in the near future we should be able to distinguish betweenthese two alternatives by imaging the brain at higher resolutions.
To conclude, our data shows that the functional organization of object and faceselective regions in the ventral visual pathway is organized on stimulus content ratherthan object recognition task (detection vs. identification). The experiments describedhere provide important insights to the functional organization of higher-order visualareas in and their role in visual recognition.
Notes1. For each subject we determined the exposure of images for the fMRI experiments by running
a behavioral experiment prior to the scan, in which we showed masked images for variousdurations. The exposure duration was defined as the minimal exposure duration in which eachsubject could detect at least 50% of the images. This duration was fixed for a given subject andvaried between 33 and 50 ms across subjects who participated in the fMRI scans.
2. Scanning parameters: MGH, Siemens allegra, head-only scanner; 10 oblique slices, 3.125 × 3.125 ×4 mm; covering the occipital, posterior parietal and temporal lobes; FOV = 20 cm; TR = 1 s;TE = 43 ms; flip angle = 60°.
3. Correct rejects are not plotted here since the behavioral data on the non-target object images isambiguous. One possibility is that these objects were rejected because subjects correctly identifiedthem as a different subordinate category. However, it is possible that subjects could not identifythem at all, and therefore these pictures were rejected.
4. Here we refer to these regions as VOT, in previous publications we referred to them as LOa.
5. VOT foci were defined as foci within the OTS and fusiform gyrus that were correlated withsuccessful recognition. LO foci were located around the lateral occipital sulcus (LOS) and inferioroccipital gyrus (IOG), lateral to a lower meridian representation. Both VOT and LO foci liebeyond retinotopic cortex (see Grill-Spector et al. 2000, for details).
FUNCTIONAL NEUROIMAGING OF VISUAL COGNITION190
Kanwisher-08 9/16/03 9:27 AM Page 190
6. The thresholds used here were chosen to be the lowest and highest thresholds possible in the con-ditions of these experiments. The low threshold used was P < 0.01, similar to that of Experiment 1.Decreasing the threshold to lower values resulted in detecting voxels outside the brain that weretypically noise. The higher threshold was a value of P < 0.001.
7. For most subjects further increasing the value of threshold resulted in detecting few active voxels.Here we used a somewhat a non-standard test to define the PPA, and we used it as a post-hocanalysis method to define the relevant ROI. We searched for regions that showed a higher signalfor outdoor scenes containing abstract sculptures compared to faces, cars, and textures in thelocalizer scan. This contrast activates regions in LO and in a lower thresholds region in theparahippocampal gyrus. For this analysis we took only the regions within the parahippocampalgyues that corresponded anatomically with the PPA (Epstein and Kanwisher 1998) that werestatistically significant in this test.
AcknowledgementsMany thanks to Nancy Kanwisher for invigorating discussions and for her continuoussupport of this research. This research has been funded by HSFP LT0670 to K.G.S.
ReferencesAguirre, G. K., Zarahn, E., and D’Esposito, M. (1998). An area within human ventral cortex sensitive
to ‘building’ stimuli: evidence and implications. Neuron, 21(2), 373–83.
Allison, T., Puce, A., Spencer, D. D., and McCarthy, G. (1999). Electrophysiological studies of humanface perception. I: Potentials generated in occipitotemporal cortex by face and non-face stimuli.Cereb Cortex, 9(5), 415–30.
Avidan, G., Hasson, U., Hendler, T., Zohary, E., and Malach, R. (2002). Analysis of the neuronalselectivity underlying low fMRI signals. Curr Biol, 12(12), 964–72.
Chao, L. L., Haxby, J. V., and Martin, A. (1999). Attribute-based neural substrates in temporal cortexfor perceiving and knowing about objects. Nat Neurosci, 2(10), 913–19.
Dale, A. M., Fischl, B., and Sereno, M. I. (1999). Cortical surface-based analysis I: Segmentation andsurface reconstruction. NeuroImage, 9, 179–94.
Damasio, A. R. (1990). Category-related recognition defects as a clue to the neural substrates ofknowledge. Trends Neurosci, 13(3), 95–8.
Damasio, A. R., Tranel, D., and Damasio, H. (1990). Face agnosia and the neural substrates ofmemory. Annu Rev Neurosci, 13, 89–109.
Downing, P. E., Jiang, Y., Shuman, M., and Kanwisher, N. (2001). A cortical area selective for visualprocessing of the human body. Science, 293(5539), 2470–3.
Driver, J. and Baylis, G. C. (1996). Edge-assignment and figure-ground segmentation in short-termvisual matching. Cognit Psychol, 31(3), 248–306.
Epstein, R. and Kanwisher, N. (1998). A cortical representation of the local visual environment.Nature, 392(6676), 598–601.
Farah, M. J. (1992). Agnosia. Curr Opin Neurobiol, 2(2), 162–4.
Fischl, B., Sereno, M. I., and Dale, A. M. (1999). Cortical surface-based analysis II: Inflation,Flattening, a surface-based coordinate system. NeuroImage, 9, 195–207.
Fischl, B., Liu, A., and Dale, A. M. (2001). Automated manifold surgery: Constructing geometricallyaccurate and topologically correct models of the human cerebral cortex. EEE Transactions onMedical Imaging, 20(1), 70–80.
THE FUNCTIONAL ORGANIZATION OF THE VENTRAL VISUAL PATHWAY 191
Kanwisher-08 9/16/03 9:27 AM Page 191

Fujita, I., Tanaka, K., Ito, M., and Cheng, K. (1992). Columns for visual features of objects in monkeyinferotemporal cortex. Nature, 360(6402), 343–6.
Gallant, J. L., Braun, J., and Van Essen, D. C. (1993). Selectivity for polar, hyperbolic, and Cartesiangratings in macaque visual cortex. Science, 259(5091), 100–3.
Gauthier, I., Tarr, M. J., Anderson, A. W., Skudlarski, P., and Gore, J. C. (1999). Activation of the mid-dle fusiform ‘face area’ increases with expertise in recognizing novel objects. Nat Neurosci, 2(6),568–73.
Grill-Spector, K. and Kanwisher, N. (2003, submitted). Visual recognition: as soon as you see it youknow what it is.
Grill-Spector, K., Kushnir, T., Hendler, T., Edelman, S., Itzchak, Y., and Malach, R. (1998). A sequenceof object-processing stages revealed by fMRI in the human occipital lobe. Hum Brain Mapp, 6(4),316–28.
Grill-Spector, K., Kushnir, T., Hendler, T., and Malach, R. (2000). The dynamics of object-selectiveactivation correlate with recognition performance in humans. Nat Neurosci, 3(8), 837–43.
Hasson, U., Hendler, T., Ben Bashat, D., and Malach, R. (2001). Vase or face? A neural correlate ofshape-selective grouping processes in the human brain. J Cogn Neurosci, 13(6), 744–53.
Hasson, U., Levy, I., Behrmann, M., Hendler, T., and Malach, R. (2002). Eccentricity bias as an organ-izing principle for human high-order object areas. Neuron, 34(3), 479–90.
Haxby, J. V., Gobbini, M. I., Furey, M. L., Ishai, A., Schouten, J. L., and Pietrini, P. (2001). Distributedand overlapping representations of faces and objects in ventral temporal cortex. Science,293(5539), 2425–30.
Ishai, A., Ungerleider, L. G., Martin, A., Schouten, J. L., and Haxby, J. V. (1999). Distributed represen-tation of objects in the human ventral visual pathway. Proc Natl Acad Sci USA, 96(16), 9379–84.
James, T. W., Humphrey, G. K., Gati, J. S., Menon, R. S., and Goodale, M. A. (2000). The effects ofvisual object priming on brain activation before and after recognition. Curr Biol, 10(17), 1017–24.
Kanwisher, N. (2000). Domain specificity in face perception. Nat Neurosci, 3(8), 759–63.
Kanwisher, N., McDermott, J., and Chun, M. M. (1997). The fusiform face area: a module in humanextrastriate cortex specialized for face perception. J Neurosci, 17(11), 4302–11.
Kleinschmidt, A., Buchel, C., Hutton, C., Friston, K. J., and Frackowiak, R. S. (2002). The neuralstructures expressing perceptual hysteresis in visual letter recognition. Neuron, 34(4), 659–66.
Lamme, V. A. (1995). The neurophysiology of figure-ground segregation in primary visual cortex.J Neurosci, 15(2), 1605–15.
Lerner, Y., Hendler, T., Ben-Bashat, D., Harel, M., and Malach, R. (2001). A hierarchical axis of objectprocessing stages in the human visual cortex. Cereb Cortex, 11(4), 287–97.
Levy, I., Hasson, U., Avidan, G., Hendler, T., and Malach, R. (2001). Center-periphery organization ofhuman object areas. Nat Neurosci, 4(5), 533–9.
Livingstone, M. and Hubel, D. (1988). Segregation of form, color, movement, and depth: anatomy,physiology, and perception. Science, 240(4853), 740–9.
Logothetis, N. K., Pauls, J., Augath, M., Trinath, T., and Oeltermann, A. (2001). Neurophysiologicalinvestigation of the basis of the fMRI signal. Nature, 412(6843), 150–7.
Malach, R., Reppas, J. B., Benson, R. R., Kwong, K. K., Jiang, H., Kennedy, W. A., Ledden, P. J., Brady,T. J., Rosen, B. R., and Tootell, R. B. (1995). Object-related activity revealed by functional mag-netic resonance imaging in human occipital cortex. Proc Natl Acad Sci USA, 92(18), 8135–9.
Malach, R., Levy, I., and Hasson, U. (2002). The topography of high-order human object areas.Trends Cogn Sci, 6(4), 176–84.
Martin, A., Wiggs, C. L., Ungerleider, L. G., and Haxby, J. V. (1996). Neural correlates of category-specific knowledge. Nature, 379(6566), 649–52.
FUNCTIONAL NEUROIMAGING OF VISUAL COGNITION192
Kanwisher-08 9/16/03 9:27 AM Page 192

Nakayama, K., He, Z. J., and Shimojo S, (1995). Visual surface representation: a critical link betweenlower-level and higher-level vision. In Kosslyn, S. M. and Osherson, D. N. (Eds.), An invitation tocognitive science: visual cognition. MIT press, Cambridge, MA.
Peterson, M. A. (1994). Shape recognition can and does occur before figure-ground organization.Curr Direct Psychol Sci, 3, 105–11.
Puce, A., Allison, T., Gore, J. C., and McCarthy, G. (1995). Face-sensitive regions in human extrastri-ate cortex studied by functional MRI. J Neurophysiol, 74(3), 1192–9.
Puce, A., Allison, T., Asgari, M., Gore, J. C., and McCarthy, G. (1996). Differential sensitivity ofhuman visual cortex to faces, letterstrings, and textures: a functional magnetic resonance imagingstudy. J Neurosci, 16(16), 5205–15.
Rosch, E. M., Mervis, C. B., Gray, M. D., Johnson, D. M., and Boyes-Braem, P. (1976). Basic objects innatural categories. Cognit Psychol, 8, 382–439.
Rubin, E. (1958). Figure and ground. In W. M. Beardslee (Ed.), Readings in perception. New York: VanNostrand.
Tanaka, J. (2001). The entry point of face recognition: evidence for face expertise. J Exp Psychol Gen,130(3), 534–543.
Tarr, M. J. and Gauthier, I. (2000). FFA: a flexible fusiform area for subordinate-level visual process-ing automatized by expertise. Nat Neurosci, 3(8), 764–9.
Tong, F., Nakayama, K., Vaughan, J. T., and Kanwisher, N. (1998). Binocular rivalry and visual aware-ness in human extrastriate cortex. Neuron, 21(4), 753–9.
Tsunoda, K., Yamane, Y., Nishizaki, M., and Tanifuji, M. (2001). Complex objects are represented inmacaque inferotemporal cortex by the combination of feature columns. Nat Neurosci, 4(8),832–8.
von der Heydt, R., Peterhans, E., and Baumgartner, G. (1984). Illusory contours and cortical neuronresponses. Science, 224(4654), 1260–2.
Zhou, H., Friedman, H. S., and von der Heydt, R. (2000). Coding of border ownership in monkeyvisual cortex. J Neurosci, 20(17), 6594–611.
THE FUNCTIONAL ORGANIZATION OF THE VENTRAL VISUAL PATHWAY 193
Kanwisher-08 9/16/03 9:27 AM Page 193

Kanwisher-08 9/16/03 9:27 AM Page 194