Embed Size (px)
Citation preview
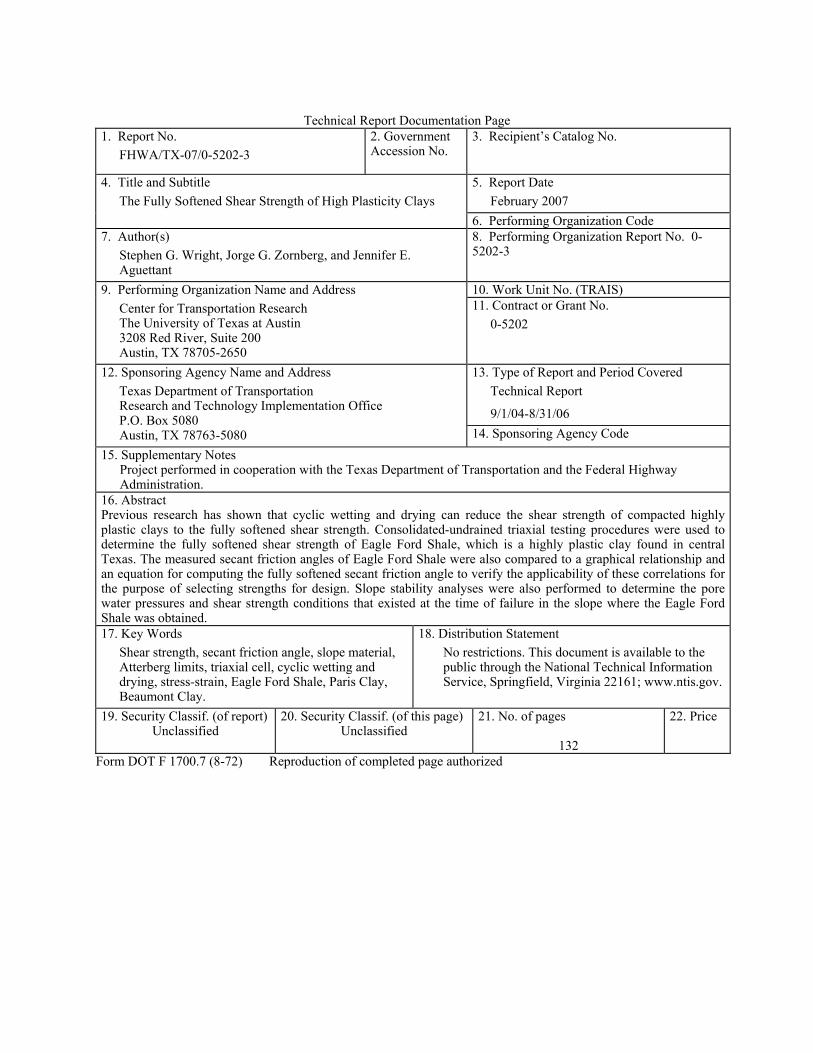
Technical Report Documentation Page
1. Report No. FHWA/TX-07/0-5202-3
2. Government Accession No.
3. Recipient’s Catalog No.
5. Report Date February 2007
4. Title and Subtitle The Fully Softened Shear Strength of High Plasticity Clays
6. Performing Organization Code 7. Author(s)
Stephen G. Wright, Jorge G. Zornberg, and Jennifer E. Aguettant
8. Performing Organization Report No. 0-5202-3
10. Work Unit No. (TRAIS) 9. Performing Organization Name and Address Center for Transportation Research The University of Texas at Austin 3208 Red River, Suite 200 Austin, TX 78705-2650
11. Contract or Grant No. 0-5202
13. Type of Report and Period Covered Technical Report
9/1/04-8/31/06
12. Sponsoring Agency Name and Address Texas Department of Transportation Research and Technology Implementation Office P.O. Box 5080 Austin, TX 78763-5080 14. Sponsoring Agency Code
15. Supplementary Notes Project performed in cooperation with the Texas Department of Transportation and the Federal Highway Administration.
16. Abstract Previous research has shown that cyclic wetting and drying can reduce the shear strength of compacted highly plastic clays to the fully softened shear strength. Consolidated-undrained triaxial testing procedures were used to determine the fully softened shear strength of Eagle Ford Shale, which is a highly plastic clay found in central Texas. The measured secant friction angles of Eagle Ford Shale were also compared to a graphical relationship and an equation for computing the fully softened secant friction angle to verify the applicability of these correlations for the purpose of selecting strengths for design. Slope stability analyses were also performed to determine the pore water pressures and shear strength conditions that existed at the time of failure in the slope where the Eagle Ford Shale was obtained. 17. Key Words
Shear strength, secant friction angle, slope material, Atterberg limits, triaxial cell, cyclic wetting and drying, stress-strain, Eagle Ford Shale, Paris Clay, Beaumont Clay.
18. Distribution Statement No restrictions. This document is available to the public through the National Technical Information Service, Springfield, Virginia 22161; www.ntis.gov.
19. Security Classif. (of report) Unclassified
20. Security Classif. (of this page) Unclassified
21. No. of pages
132
22. Price
Form DOT F 1700.7 (8-72) Reproduction of completed page authorized

iii
THE FULLY SOFTENED SHEAR STRENGTH OF HIGH PLASTICITY CLAYS Stephen G. Wright Jorge G. Zornberg Jennifer E. Aguettant
CTR Technical Report: 0-5202-3 Report Date: February 2007 Project: 0-5202 Project Title: Determination of Field Suction Values in High PI Clays for
Various Surface Conditions and Drain Installations Sponsoring Agency: Texas Department of Transportation Performing Agency: Center for Transportation Research at The University of Texas at
Austin Project performed in cooperation with the Texas Department of Transportation and the Federal Highway Administration.
iv
Center for Transportation Research The University of Texas at Austin 3208 Red River Austin, TX 78705 www.utexas.edu/research/ctr Copyright (c) 2007 Center for Transportation Research The University of Texas at Austin All rights reserved Printed in the United States of America
v
Disclaimers Author's Disclaimer: The contents of this report reflect the views of the authors, who
are responsible for the facts and the accuracy of the data presented herein. The contents do not necessarily reflect the official view or policies of the Federal Highway Administration or the Texas Department of Transportation (TxDOT). This report does not constitute a standard, specification, or regulation.
Patent Disclaimer: There was no invention or discovery conceived or first actually reduced to practice in the course of or under this contract, including any art, method, process, machine manufacture, design or composition of matter, or any new useful improvement thereof, or any variety of plant, which is or may be patentable under the patent laws of the United States of America or any foreign country.
Engineering Disclaimer NOT INTENDED FOR CONSTRUCTION, BIDDING, OR PERMIT PURPOSES.
Project Engineer: Stephen G. Wright, Texas P.E. No. 49007
P.E. Designation: Research Supervisor

vi
vii
Table of Contents 1. Introduction............................................................................................................................... 1
1.1 Introduction............................................................................................................................1 2. Fully Softened Shear Strength................................................................................................. 5
2.1 Introduction............................................................................................................................5 2.2 Fully Softened Shear Strength of Natural and Excavated Slopes..........................................5 2.3 Fully Softened Shear Strength of Embankments...................................................................6 2.4 Causes of Delayed Failures....................................................................................................7 2.5 Correlations for Fully Softened Secant Friction Angle .........................................................8 2.6 Summary................................................................................................................................9
3. Physical Properties of Eagle Ford Shale............................................................................... 11 3.1 Introduction..........................................................................................................................11 3.2 Site Description....................................................................................................................11 3.3 Precipitation Information Near the Time of Failures...........................................................12 3.4 Physical Properties of Slope Material..................................................................................12
3.4.1 Grain Size Distribution ................................................................................................ 13 3.4.2 Atterberg Limits........................................................................................................... 14 3.4.3 Moisture-Dry Unit Weight Relationship ..................................................................... 15 3.4.4 Specific Gravity ........................................................................................................... 16 3.4.5 Hydraulic Conductivity................................................................................................ 16
4. Triaxial Specimen Preparation and Testing Set-up ............................................................ 17 4.1 Introduction..........................................................................................................................17
4.1.1 As-Compacted Specimens ........................................................................................... 17 4.1.2 Specimens Normally Consolidated from a Slurry ....................................................... 20 4.1.3 Specimens Exposed to Cyclic Wetting and Drying..................................................... 24
4.2 Special Procedure for Consolidating at Low Effective Stresses..........................................29 5. Consolidated-Undrained Triaxial Compression Tests with Pore Water Pressure
Measurements on Eagle Ford Shale Specimens........................................................... 33 5.1 Overview..............................................................................................................................33 5.2 As-Compacted Consolidated-Undrained Triaxial Compression Specimens .......................33 5.3 Specimens Normally Consolidated from a Slurry ...............................................................36 5.4 Specimens Subjected to Cyclic Wetting and Drying...........................................................37 5.5 Comparison of Specimens Normally Consolidated from a Slurry and Subjected to
Cyclic Wetting and Drying ............................................................................................43 5.6 Unconsolidated-Undrained Triaxial Compression Tests.....................................................44
6. Comparison of the Shear Strength of Eagle Ford Shale with Paris and Beaumont Clay................................................................................................................................... 47
6.1 Overview..............................................................................................................................47 6.2 As-Compacted Specimens ...................................................................................................47 6.3 Specimens Normally Consolidated from a Slurry ...............................................................49 6.4 Specimens Subjected to Cyclic Wetting and Drying...........................................................50 6.5 Discussion of Previously Presented Data ............................................................................52 6.6 Differences in Strength of Eagle Ford Shale, Paris Clay and Beaumont Clay....................56
viii
7. Comparison of Fully Softened Friction Angles with Correlations..................................... 57 7.1 Overview..............................................................................................................................57 7.2 Comparison of Eagle Ford Shale with Stark et al. (2005) ...................................................58
7.2.1 Comparison of Fully Softened Secant Friction Angles of Specimens Subjected to Wetting and Drying ...................................................................................................... 59
7.2.2 Comparison of Fully Softened Secant Friction Angles of Specimens Normally Consolidated from a Slurry............................................................................................... 61
7.3 Comparison of Eagle Ford Shale with Wright (2005).........................................................62 7.4 Comparison of Paris and Beaumont Clay with Correlations...............................................64 7.5 Summary..............................................................................................................................64
8. Slope Stability Analysis .......................................................................................................... 65 8.1 Overview..............................................................................................................................65 8.2 Stability Analysis.................................................................................................................65
8.2.1 Strength Envelopes for Conditions before and After Wetting and Drying.................. 65 8.2.2 Strength Envelope for Residual Strength Condition.................................................... 66 8.2.3 Total Unit Weight ........................................................................................................ 68 8.2.4 Pore Water Pressures ................................................................................................... 69
8.3 Results of the Slope Stability Analyses ...............................................................................69 8.3.1 Analyses Using the Strength before Wetting and Drying............................................ 69 8.3.2 Analyses Using the Strength after Wetting and Drying............................................... 70 8.3.3 Analyses Using the Residual Strength......................................................................... 73
8.4 Discussion of Slope Stability Analyses ...............................................................................74 9. Conclusions.............................................................................................................................. 77 References.................................................................................................................................... 79 Appendix A: Specimen Consolidation in the Triaxial Cell ..................................................... 83 Appendix B: Moisture Content-Dry Unit Weight Data for All Specimens ........................... 87 Appendix C: Filter Paper, Membrane, and Area Corrections............................................... 91
Filter Paper Correction...............................................................................................................91 Membrane Correction ................................................................................................................92 Area Correction..........................................................................................................................92
Appendix D: Results from Consolidated-Undrained Triaxial Compression Tests for all Specimens ................................................................................................................... 95
ix
List of Figures Figure 2.1: Comparison of peak, residual and fully softened shear strength envelopes
(from Skempton 1970)........................................................................................................ 5 Figure 3.1: Location of failed embankment where testing material was obtained. ...................... 12 Figure 3.2: Hydrometer analysis for Eagle Ford Shale................................................................. 14 Figure 3.3: Standard and Modified Proctor compaction curves for Eagle Ford Shale. ................ 15 Figure 4.1: Disassembled mold with bases that produce 3-inch and 5-inch specimens. .............. 18 Figure 4.2: Assembled mold with bases used to produce 3-inch and 5-inch specimens. ............. 18 Figure 4.3: Marsh-Bellofram actuator air piston with aluminum rod........................................... 19 Figure 4.4: Compaction of specimen using the Marsh-Bellofram actuator air piston.................. 19 Figure 4.5: Assembled consolidation tubes and consolidating specimens. .................................. 22 Figure 4.6: Trimmed slurry specimen on triaxial cell pedestal with vertical filter paper
drains................................................................................................................................. 23 Figure 4.7: Cyclic wetting and drying specimen holder and compacted specimen...................... 25 Figure 4.8: Submerged specimens during the wetting portion of cyclic wetting and drying
test series........................................................................................................................... 26 Figure 4.9: Top view of specimen in a specimen holder before trimming. .................................. 26 Figure 4.10: Acrylic extruder and stainless steel cutting tube. ..................................................... 27 Figure 4.11: Cutting tube and specimen on acrylic extruder. ....................................................... 27 Figure 4.12: Trimmed and extruded specimen. ........................................................................... 27 Figure 4.13: Trimmed and extruded specimen in cellophane cradle. ........................................... 28 Figure 4.14: Trimmed and extruded specimen set upright on the triaxial cell base. .................... 28 Figure 4.15: Diagram of low effective stress saturation and consolidation setup. ....................... 30 Figure 4.16: Low effective stress saturation setup for an effective stress of 2 psi. ...................... 31 Figure 4.17: Low effective stress consolidation setup for an effective stress of 3 psi. .............. 31 Figure 5.1: Stress-strain curves for as-compacted specimens of Eagle Ford Shale...................... 34 Figure 5.2: Modified Mohr-Coulomb diagram for as-compacted specimens of Eagle Ford
Shale.................................................................................................................................. 35 Figure 5.3: Modified Mohr failure envelope for as-compacted specimens of Eagle Ford
Shale.................................................................................................................................. 36 Figure 5.4: Stress-strain curves for Eagle Ford Shale normally consolidated from a slurry. ....... 38 Figure 5.5: Modified Mohr-Coulomb diagram for normally consolidated specimens of
Eagle Ford Shale. .............................................................................................................. 39
x
Figure 5.6: Modified Mohr failure envelope for specimens of Eagle Ford Shale normally consolidated from a slurry. ............................................................................................... 40
Figure 5.7: Stress-strain curves for specimens of Eagle Ford Shale subjected to cyclic wetting and drying. ........................................................................................................... 41
Figure 5.8: Modified Mohr-Coulomb diagram for specimens of Eagle Ford Shale subjected to cyclic wetting and drying.............................................................................. 42
Figure 5.9: Modified Mohr failure envelope for specimens of Eagle Ford Shale subjected to cyclic wetting and drying.............................................................................................. 43
Figure 5.10: Comparison of failure envelopes for specimens of Eagle Ford Shale normally consolidated from a slurry and exposed to wetting and drying......................... 44
Figure 5.11: Unconsolidated-undrained triaxial tests for Eagle Ford Shale wet and dry of optimum. ........................................................................................................................... 45
Figure 6.1: Variation in final moisture content with effective consolidation pressure for as-compacted specimens................................................................................................... 48
Figure 6.2: Mohr failure envelopes for Paris clay, Beaumont clay, and Eagle Ford Shale. ......... 48 Figure 6.3: Variation in moisture content versus effective consolidation pressure for
specimens normally consolidated from a slurry. .............................................................. 49 Figure 6.4: Comparison of normally consolidated specimens of Paris clay, Beaumont
clay, and Eagle Ford Shale................................................................................................ 50 Figure 6.5: Variation in moisture content versus effective consolidation pressure for
specimens subjected to cyclic wetting and drying............................................................ 51 Figure 6.6: Comparison of specimens of Paris clay, Beaumont clay, and Eagle Ford Shale
subjected to wetting and drying. ....................................................................................... 52 Figure 6.7: Comparison of the variation in final moisture content with increasing
effective consolidation pressure for Eagle Ford Shale specimens.................................... 53 Figure 6.8: The variation of void ratio with effective consolidation pressure for Eagle
Ford Shale specimens. ...................................................................................................... 53 Figure 6.9: The variation of void ratio with effective consolidation pressure for Paris clay
specimens.......................................................................................................................... 54 Figure 6.10: The variation of void ratio with effective consolidation pressure for
Beaumont clay specimens................................................................................................. 54 Figure 6.11: Comparison of normalized void ratios of Eagle Ford Shale, Paris clay, and
Beaumont clay. ................................................................................................................. 55 Figure 6.12: The effect of wetting and drying on the transition from the compacted to the
normally consolidated state............................................................................................... 56 Figure 7.1: Definition of secant friction angle.............................................................................. 57 Figure 7.2: Relationship between the fully softened friction angle and liquid limit (Stark
et al. 2005). ....................................................................................................................... 58
xi
Figure 7.3: Relationship used to interpolate values of the fully softened secant friction angles for Eagle Ford Shale at effective normal stresses of 50 kPa and 100 kPa............. 59
Figure 7.4: Comparison of Stark et al.’s (2005) data with an interpolated value of Eagle Ford Shale subjected to cyclic wetting and drying at an effective normal stress of 50 kPa................................................................................................................................ 60
Figure 7.5: Comparison of Stark et al.’s (2005) data with an interpolated value of Eagle Ford Shale subjected to cyclic wetting and drying at an effective normal stress of 100 kPa.............................................................................................................................. 60
Figure 7.6: Comparison of Stark et al.’s (2005) data at an effective normal stress of 50 kPa with specimens of Eagle Ford Shale normally consolidated from a slurry. .............. 61
Figure 7.7: Comparison of Stark et al.’s (2005) data at an effective normal stress of 100 kPa with specimens of Eagle Ford Shale normally consolidated from a slurry. .............. 62
Figure 7.8: Comparison of the fully softened secant friction angles measured and calculated using Wright’s (2005) correlation for Eagle Ford Shale subjected to cyclic wetting and drying.................................................................................................. 63
Figure 7.9: Comparison of the fully softened secant friction angles measured and calculated using Wright’s (2005) correlation for specimens of Eagle Ford Shale normally consolidated from a slurry. ................................................................................ 64
Figure 8.1: Slope geometry used during stability analyses. ......................................................... 65 Figure 8.2: Comparison of residual strength from Wright’s (2005) equation and Stark et
al. (2005). .......................................................................................................................... 68 Figure 8.3: Critical circle using the strength before wetting and drying with the slip
surface allowed to pass behind the crest (ru = 0.78). ........................................................ 70 Figure 8.4: Critical circle using the strength before wetting and drying with the slip
surface restricted to the slope face (ru = 0.93). ................................................................. 71 Figure 8.5: Critical circle using the strength after wetting and drying with the slip surface
allowed to pass behind the crest (ru = 0.33). ..................................................................... 71 Figure 8.6: Critical circle using the strength after wetting and drying with the slip surface
restricted to the slope face (ru = 0.43). .............................................................................. 72 Figure 8.7: Critical circle using the strength after wetting and drying with the slip surface
restricted to the upper, steepest part of the slope (ru = 0.53). ........................................... 72 Figure 8.8: Critical circle using the residual strength with the slip surface restricted to the
slope face (ru = 0).............................................................................................................. 74 Figure 8.9: Critical circle using the residual strength with the slip surface restricted to the
upper, steepest part of the slope (ru = 0). .......................................................................... 74

xii
xiii
List of Tables Table 3.1: Monthly precipitation in winter and spring of 1992, 1999, and 2003. ........................ 13 Table 3.2: Index properties of Eagle Ford Shale, Paris clay, and Beaumont clay........................ 15 Table 5.1: Compaction parameters for unconsolidated-undrained triaxial specimens. ................ 45 Table 5.2: Unconsolidated-undrained strength parameters for Eagle Ford Shale. ....................... 46 Table 7.1: Interpolated secant friction angles for effective normal stresses of 50 kPa and
100 kPa.............................................................................................................................. 59 Table 8.1: Mohr failure envelopes for “as-compacted” and after wetting and drying
conditions.......................................................................................................................... 66 Table 8.2: Residual strength nonlinear Mohr failure envelope data. ............................................ 67 Table 8.3: Total unit weights for soil in as-compacted condition and after wetting and
drying before and after saturation and consolidation........................................................ 69 Table A.1: Consolidation data for as-compacted specimens of Eagle Ford Shale. ...................... 84 Table A.2: Consolidation data for specimens of Eagle Ford Shale normally consolidated
from a slurry...................................................................................................................... 84 Table A.3: Consolidation data for specimens of Eagle Ford Shale subjected to cyclic
wetting and drying. ........................................................................................................... 85 Table B.1: Moisture content and dry unit weight data for as-compacted specimens. .................. 87 Table B.2: Moisture content and dry unit weight data for specimens normally
consolidated from a slurry. ............................................................................................... 88 Table B.3: Moisture content and dry unit weight data for specimens subjected to cyclic
wetting and drying. ........................................................................................................... 89

xiv
1
1. Introduction
1.1 Introduction
Many Texas highway embankments experience shallow slope failures. The failures can
cause traffic disruptions, and over time remediation can become costly, especially for slopes that
experience repeated failures. Therefore, it is important to design these embankments to prevent
such failures.
This report documents the shear strength evaluation conducted as part of project 0-5202.
This shear strength evaluation complements the hydraulic characterization described in report 0-
5202-2 (Kuhn and Zornberg, 2006). An evaluation of depth of moisture fluctuations and stability
analysis are also provided in that report. An overview of the different components of the project
is summarized in report 0-5202-1.
The backfill material comprising the slopes that fail is typically compacted high plasticity
clay or shale. Seasonal variations in moisture content due to cycles of wetting and drying can
cause cracks to develop in the slopes, which can serve as conduits for infiltration of moisture.
Most failures occur during seasons of high precipitation that follow dry periods during which
cracking may have occurred.
Kayyal and Wright (1991) examined the effects of cyclic wetting and drying on the shear
strength of compacted specimens of two highly plastic clays, the Paris clay and Beaumont clay,
which are found in Texas. They determined the effective stress failure envelopes from
consolidated-undrained triaxial compression tests with pore water pressure measurements for (1)
specimens exposed to cyclic wetting and drying and (2) specimens normally consolidated from a
slurry. They observed that the Mohr failure envelopes for specimens subjected to wetting and
drying were very similar to the Mohr failure envelopes for specimens that were prepared by
consolidating soil normally from a slurry. The close agreement between these failure envelopes
led to the conclusion that cyclic wetting and drying can reduce the shear strength of compacted
highly plastic clay to the normally consolidated condition. Skempton (1970) defined the "fully
softened" shear strength as the peak drained shear strength of clay under normally consolidated
conditions. Thus, Kayyal and Wright inferred that the shear strength at failure of compacted high
plasticity clays that experience periods of wetting and drying is equal to the fully softened shear
strength.
2
Stark et al. (2005) developed a correlation between the secant friction angle for fully
softened conditions and the effective confining stress, liquid limit, and clay size fraction. Wright
(2005) used the work of Stark et al. (2005), coupled with an empirical equation for cohesionless
soils relating the secant friction angle and the effective confining pressure developed by Duncan
et al. (1989), to develop a set of equations for calculating the secant friction angle in terms of the
liquid limit and the effective normal stress. Wright (2005) calculated secant friction angles of the
Paris and Beaumont clays using these equations and showed that the calculated secant friction
angles agree well with the laboratory measured secant friction angles. Further comparison of
laboratory measured secant friction angles and values obtained by these two correlations are
made later in this document for Eagle Ford Shale, which is another highly plastic soil from
central Texas.
The focus of this research component is to further examine the fully softened shear
strength of high plasticity clays and shales using procedures similar to those of Kayyal and
Wright (1991) to test Eagle Ford Shale. The effective stress failure envelope of Eagle Ford Shale
is measured and compared to those for the Paris and Beaumont clays. The fully softened secant
friction angles of Eagle Ford Shale are also compared with the estimated values of the fully
softened secant friction angles from the correlations developed by Wright (2005) and Stark et al
(2005).
Chapter 2 presents a discussion on the fully softened shear strength of high plasticity
clays and shales. The location where the Eagle Ford Shale used in this study was obtained and
the soil index properties are presented in Chapter 3. Three series of consolidated-undrained
triaxial compression tests with pore water pressure measurements were performed on specimens
prepared in different manners: compacted, compacted and then subjected to cyclic wetting and
drying, and normally consolidated from a slurry. The details of the preparation methods and
equipment are presented in Chapter 4.
The effective stress Mohr failure envelopes and stress-strain curves for the triaxial
specimens of Eagle Ford Shale are presented in Chapter 5. The fully softened secant friction
angles of the specimens normally consolidated from a slurry and those subjected to cyclic
wetting and drying are also compared in this section. The effective stress failure envelopes for
Eagle Ford Shale are compared with those for Paris clay and Beaumont clay in Chapter 6. The
measured, fully softened secant friction angles are compared to the correlations by Stark et al.
(2005) and Wright (2005) in Chapter 7. Using the slope geometry and soil parameters discussed
3
in Chapter 3, a slope stability analysis is performed for the slope where the Eagle Ford Shale
tested in this study was obtained. Results of the slope stability analysis are presented in Chapter
8. Conclusions and recommendations are offered in Chapter 9.

4
5
2. Fully Softened Shear Strength
2.1 Introduction
In 1937 Taylor acknowledged that once a soil reached its peak strength, the resistance
often fell to a lower value upon further shear deformation. This idea was reiterated in 1964 when
Skempton defined this lower value of strength as the residual strength condition. Skempton
(1964) concluded that the residual strength is applicable to slope stability analyses of natural
slopes and excavations in stiff fissured over-consolidated clays as well as slopes in these
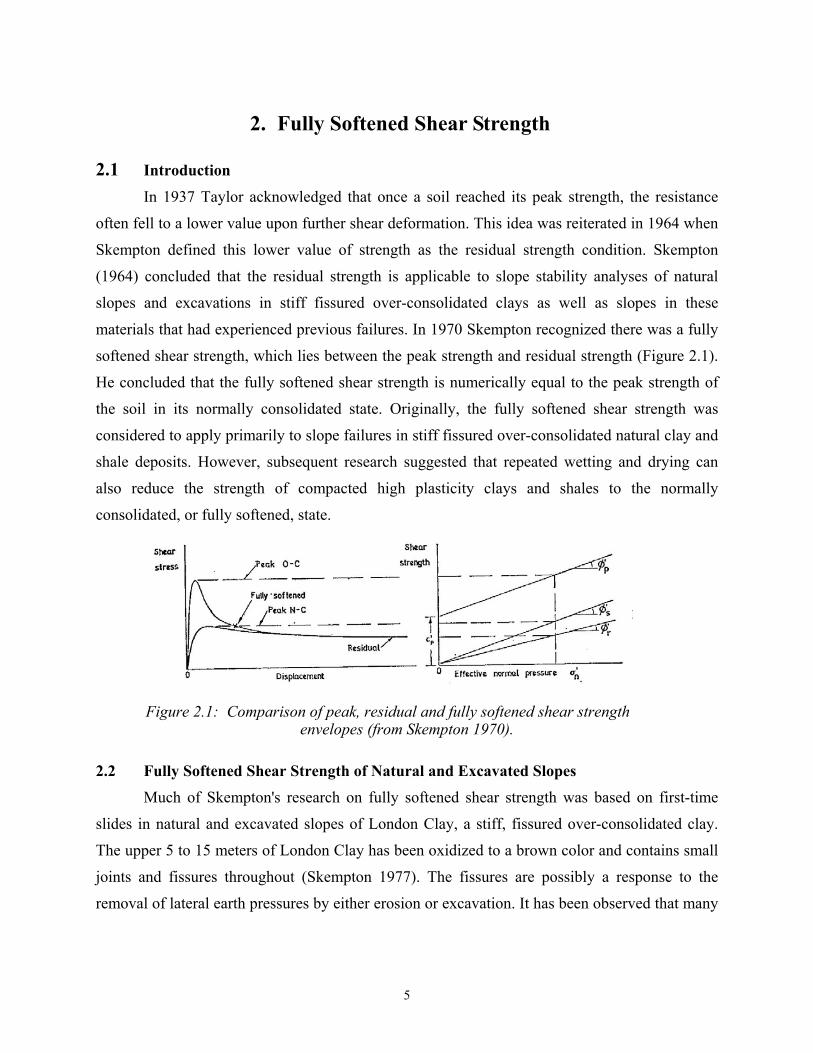
materials that had experienced previous failures. In 1970 Skempton recognized there was a fully
softened shear strength, which lies between the peak strength and residual strength (Figure 2.1).
He concluded that the fully softened shear strength is numerically equal to the peak strength of
the soil in its normally consolidated state. Originally, the fully softened shear strength was
considered to apply primarily to slope failures in stiff fissured over-consolidated natural clay and
shale deposits. However, subsequent research suggested that repeated wetting and drying can
also reduce the strength of compacted high plasticity clays and shales to the normally
consolidated, or fully softened, state.
Figure 2.1: Comparison of peak, residual and fully softened shear strength
envelopes (from Skempton 1970).
2.2 Fully Softened Shear Strength of Natural and Excavated Slopes
Much of Skempton's research on fully softened shear strength was based on first-time
slides in natural and excavated slopes of London Clay, a stiff, fissured over-consolidated clay.
The upper 5 to 15 meters of London Clay has been oxidized to a brown color and contains small
joints and fissures throughout (Skempton 1977). The fissures are possibly a response to the
removal of lateral earth pressures by either erosion or excavation. It has been observed that many
6
slides that occurred in cuts in brown London Clay do not extend down into the lower, more intact
blue London Clay.
Fissures and joints can reduce the strength of stiff over-consolidated clays and shales
(Skempton 1964). Fissures and joints become points of stress concentration and act as conduits
for direct infiltration of precipitation to lower layers. Fissures likely contribute to the progressive
failure mechanism (Skempton 1977). During progressive failure, as the peak strength is passed at
a point of stress concentration within the soil, the strength at this point decreases causing
additional stress to be applied onto some other point until the peak strength has been surpassed at
this location also (Skempton 1964).
Skempton (1970) recommended the fully softened shear strength as the applicable
strength for first-time slides in excavations of homogeneous stiff fissured clays. However, Mesri
and Shahien (2003) suggested that part of the slip surface may be at the residual strength
condition even for first-time slides in excavated stiff clays and shales. Anisotropy and bedding
planes due to geologic deposition may naturally produce residual strength conditions within
slopes. They indicated that if part of the slip surface is not already at the residual condition prior
to excavation, the residual strength can develop by progressive failure.
Gullà et al. (2006) performed oedometer and direct shear tests on highly plastic clay
specimens from Italy. The specimens used to determine the intact strength were obtained from a
depth of 0.3 meters to 1 meter below the surface. The soil was fissured to a depth of 0.3 meters
due to weathering. Other specimens were subjected to cycles of wetting, drying, freezing, and
thawing for various durations of time before testing. It was found that as the duration of
weathering increased, the strength approached that of reconstituted, or normally consolidated,
specimens. The void ratio also increased with increasing duration of weathering. This loosening
of soil structure and decrease in strength towards the normally consolidated state due to
weathering is similar to what Kayyal and Wright (1991) describe for compacted clays.
2.3 Fully Softened Shear Strength of Embankments
Researchers at The University of Texas at Austin have been studying shallow slope
failures in compacted highly plastic clay for many years. Kayyal and Wright (1991) conducted
consolidated-undrained triaxial compression tests with pore water pressure measurements on
Paris and Beaumont clay, which are highly plastic clays found in Texas. They observed that
repeated wetting and drying of compacted high plasticity clay reduces the strength to the
normally consolidated, or fully softened, strength. The effective stress shear strength envelopes
7
for specimens normally consolidated from a slurry and specimens subjected to cyclic wetting and
drying were very similar. Also, failure envelopes for Paris and Beaumont clay showed
nonlinearity at low effective stresses and negligible cohesion.
2.4 Causes of Delayed Failures
Many of the excavation failures in London Clay occurred up to forty to fifty years after
construction. Originally Skempton (1964) attributed the delayed failures to strain-softening;
however, Vaughan and Walbancke’s studies on cut slopes in London Clay (1973) have shown
that the long times to failure are primarily due to the slow equilibration of pore water pressures
in high plasticity clays and shales. Vaughan and Walbancke chose to represent the average pore
water pressure along a potential failure surface by an average pore water pressure ratio, ru. The
pore water pressure ratio, ru, was apparently first used by Bishop and Morgenstern (1960) and is
defined as the ratio of the pore water pressure, u, to the total overburden pressure, γh, at the point
of interest, where γ is the unit weight of the soil and h is the depth below the surface. Both values
measured in slopes and back-calculated from slope failures showed the average pore water
pressure ratio increased with increasing time from a negative value to a nearly constant positive
value of approximately 0.3.
Others have found similar values of the pore water pressure ratio. For example,
piezometric data from Sudbury Hill of an excavation in London Clay that was excavated in 1903
and failed in 1949, revealed that the average pore water pressure ratio along the slip surface was
0.26 (Skempton 1977). This is very close to the equilibrium value of ru found by Vaughan and
Walbancke (1973). In 1970 research by P.M. James further supported evidence that the
equilibrium average pore pressure ratio value was between 0.25 and 0.35 with 0.3 being an
acceptable value for back analysis (Skempton 1977).
Additional piezometric data were obtained from cuts in primarily blue London Clay at
Hendon Motorway at Edgwarebury in 1973 (Vaughan and Walbancke 1973, Skempton 1977).
Blue London Clay is mostly unweathered and does not contain fissures. Piezometers were
installed nine years after excavation, yet significant negative pore water pressures still existed,
providing further support of the long pore water pressure equilibration times.
Assuming a value of 0.3 for the average pore water pressure ratio and a factor of safety of
1.0, Skempton (1977) performed back analyses of five first-time slides, which occurred at least
45 years after excavation in brown London Clay. He found that the best fit to the data was a
linear envelope defined by c′ = 1 kN/m2 and φ′ = 20° with a lower bound of c′ = 0 kN/m2 and φ′
8
= 20°. This provides supporting evidence that using the effective cohesion equal to zero in the
fully softened strength condition is a reasonable assumption for estimating the long term stability
of a first-time slide in highly plastic clay.
Kayyal and Wright (1991) also performed back analyses of embankments in Paris and
Beaumont clay using measured shear strength envelopes in order to determine the pore water
pressures that existed at the time of failure. They found that failures would not be expected when
using the as-compacted strength of the soils because excessively high pore water pressures (ru =
0.9 to 1.0) would have to be present. They concluded that the strength of specimens subjected to
cyclic wetting and drying provided a better estimate of the strength in these slopes that failed.
Even with the reduced strengths due to wetting and drying the pore water pressures needed to be
relatively high (ru = 0.5 to 0.6) to explain the failures.
2.5 Correlations for Fully Softened Secant Friction Angle
Stark and Eid (1997) measured the fully softened shear strength under effective normal
stresses typically encountered in first-time slope failures. Remolded normally consolidated
specimens were prepared and sheared at effective normal stresses of 50, 100, and 400 kPa in a
modified ring shear apparatus. The specimen preparation procedure detailed by Mesri and
Cepeda-Diaz (1986) for direct shear test specimens was followed (Stark et al. 2005). The
specimens used in the modified ring shear apparatus were prepared from remolded shale,
mudstone, and claystone.
Stark and Eid (1997) also performed isotropically consolidated drained triaxial
compression tests on remolded specimens of 24 high plasticity shales. Two specimens per soil
were sheared at effective consolidation pressures of 70 and 275 kPa. It was observed that the
modified ring shear apparatus produced a fully softened friction angle approximately 2.5° less
than that of the drained triaxial compression test. Believing the state of stresses in a triaxial
compression test to be a better representation of the stress conditions in the field during first-time
slides, Stark and Eid (1997) increased the friction angles measured in the modified ring shear
apparatus by 2.5°.
Based on their test data Stark and Eid (1997) developed relationships between the drained
fully softened secant friction angle and the liquid limit of the soil. These relationships were later
revised by Stark et al. (2005). According to the relationships the drained, fully softened secant
friction angle decreases with increasing liquid limit, effective normal stress, and clay fraction.
9
Wright (2005) used Stark et al.'s (2005) data to develop a correlation and equation for the
secant friction angle based on previous work by Duncan et al. (1989) for cohesionless soils.
Duncan et al.’s original equation related the secant friction angle to the logarithm of the effective
confining pressure, σ3′ by
⎟⎟⎠
⎞⎜⎜⎝
⎛−=
a
'3
10''
o'secant p
σlogΔφφφ (2.1)
where, φo′ is the secant friction angle at an effective confining pressure of one atmosphere, Δφ′ is
the change in the secant friction angle with each ten-fold increase in confining pressure, and pa is
atmospheric pressure.
Based on an equation of the form of Equation 2.1 and the data from Stark et al. (2005),
Wright determined values of φo′ and Δφ′. Expressing the effective stress in terms of the effective
normal stress on the failure plane, σ′f, Wright’s correlation between the fully softened secant
friction angle and the logarithm of the effective normal stress is as follows:
( ) ⎟⎟⎠
⎞⎜⎜⎝
⎛°−°−°=
a
'f
10LL10'secant p
σlog6ωlog16.755.3φ (2.2)
where, ωLL is the liquid limit, and the other parameters are as defined above. Equation 2.2 was
developed using only the data from Stark et al. (2005) that had a clay fraction greater than or
equal to 50% (Wright 2005). Upon comparison of the secant friction angles from Stark et al. with
those calculated using Equation 2.2, Wright (2005) showed that Equation 2.2 gives a slightly
poorer estimate of the secant friction angle at low effective normal stresses (50 kPa) and a
slightly better estimate than Stark et al.’s curves for higher effective normal stresses (100 kPa
and 400 kPa).
2.6 Summary
Fully softened shear strengths are applicable to first-time slides in natural and excavated
slopes of stiff fissured over-consolidated material where there has also not been any prior large
shear displacement. The fully softened shear strength is also applicable to compacted slopes of
high plasticity clays and shales exposed to wetting and drying. The failure envelope for fully
softened conditions passes through the origin of a Mohr diagram. It should be noted, however,
that although there is no cohesion intercept, the failure envelope is curved at low effective
stresses.
The following chapters present results of a field and laboratory investigation to determine
the shear strength of a highly plastic soil obtained from a slope that had experienced seasonal
10
wetting and drying in the field. Tests were performed using procedures that were similar to those
used by Kayyal and Wright (1991) to test Paris and Beaumont clay. Specimens were prepared by
compaction, compaction and then subjected to cyclic wetting and drying, and normally
consolidated from a slurry.
11
3. Physical Properties of Eagle Ford Shale
3.1 Introduction
The soil selected for testing is highly plastic clay from a slope that had experienced
repeated shallow slope failures. The location and description of the slope along with the physical
properties of the soil are presented in this chapter.
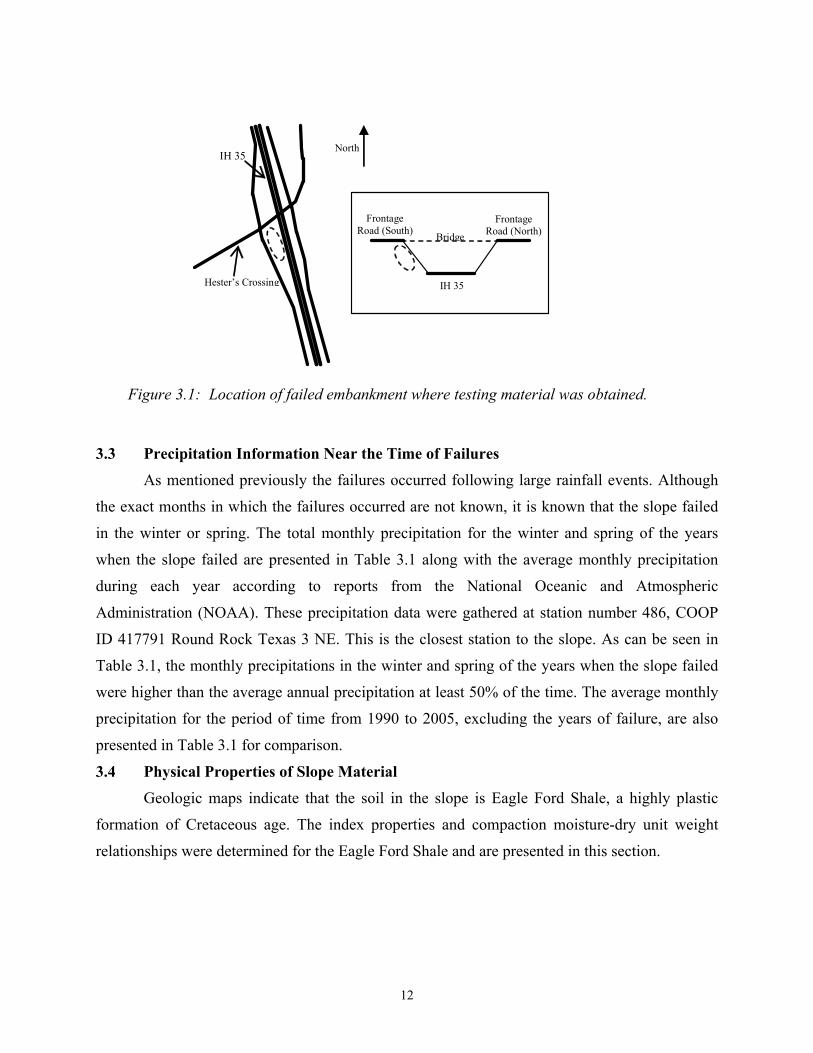
3.2 Site Description
The slope selected for study is located in the Austin District of the Texas Department of
Transportation (TxDOT). The slope lies along South Interstate Highway 35 (S IH-35) in the
southwest quadrant of the intersection with Hester’s Crossing in Round Rock, Texas. The slope
was created by a cut through Eagle Ford Shale during the construction of IH-35 and later
excavated to its existing limits in 1983 when IH-35 was widened. The slope has a height of
approximately 21 feet above IH-35 with respect to the southbound exit ramp leading to Sundance
Parkway. The grade of the slope after widening IH-35 was approximately 3:1 (horizontal:
vertical).
According to TxDOT employees, the first of three failures occurred in approximately
1992 and was repaired by pushing the material back into place. In the spring of 1999 the slope
failed a second time. This time the remediation consisted of excavating beyond the failed
material and replacing the excavated material with granular backfill. The existing slope material
at the crest of the slope was tilled, moisture conditioned, and compacted according to the TxDOT
“ordinary compaction” method (Item 132 of Texas Standard Specifications 2004) to improve
stability. The slope experienced its third failure in the spring of 2003 and was repaired by
excavating the material in the failure zone and replacing it with crushed rock. All of the slope
failures occurred after large precipitation events and were located along the same 200-300 foot
length of slope. The depth of the slide was generally between 8-10 feet.
TxDOT employees stated that this particular slope remains wet most of the year. This is
supported by the presence of cat-of-nine tails at the base of the slope just north of the failed slope
where the slope is believed to drain.
12
Figure 3.1: Location of failed embankment where testing material was obtained.
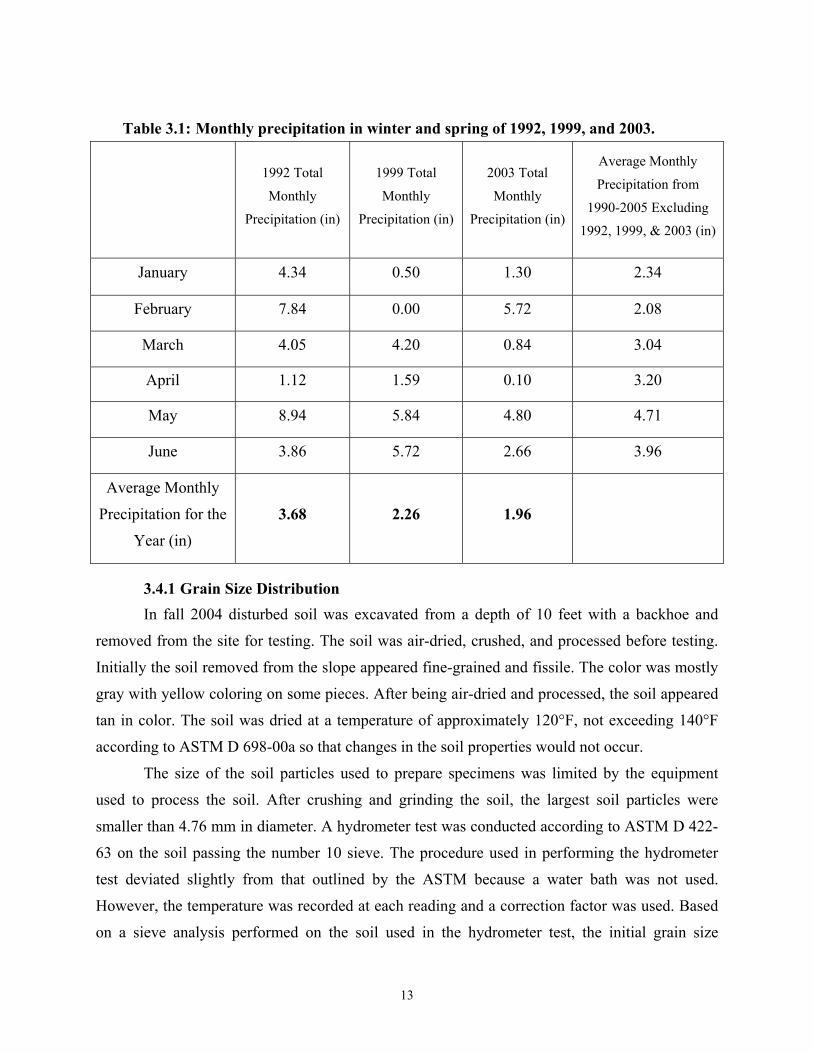
3.3 Precipitation Information Near the Time of Failures
As mentioned previously the failures occurred following large rainfall events. Although
the exact months in which the failures occurred are not known, it is known that the slope failed
in the winter or spring. The total monthly precipitation for the winter and spring of the years
when the slope failed are presented in Table 3.1 along with the average monthly precipitation
during each year according to reports from the National Oceanic and Atmospheric
Administration (NOAA). These precipitation data were gathered at station number 486, COOP
ID 417791 Round Rock Texas 3 NE. This is the closest station to the slope. As can be seen in
Table 3.1, the monthly precipitations in the winter and spring of the years when the slope failed
were higher than the average annual precipitation at least 50% of the time. The average monthly
precipitation for the period of time from 1990 to 2005, excluding the years of failure, are also
presented in Table 3.1 for comparison.
3.4 Physical Properties of Slope Material
Geologic maps indicate that the soil in the slope is Eagle Ford Shale, a highly plastic
formation of Cretaceous age. The index properties and compaction moisture-dry unit weight
relationships were determined for the Eagle Ford Shale and are presented in this section.
Hester’s Crossing IH 35
Frontage Road (South)
Frontage Road (North)Bridge
NorthIH 35
13
Table 3.1: Monthly precipitation in winter and spring of 1992, 1999, and 2003.
1992 Total
Monthly
Precipitation (in)
1999 Total
Monthly
Precipitation (in)
2003 Total
Monthly
Precipitation (in)
Average Monthly
Precipitation from
1990-2005 Excluding
1992, 1999, & 2003 (in)
January 4.34 0.50 1.30 2.34
February 7.84 0.00 5.72 2.08
March 4.05 4.20 0.84 3.04
April 1.12 1.59 0.10 3.20
May 8.94 5.84 4.80 4.71
June 3.86 5.72 2.66 3.96
Average Monthly
Precipitation for the
Year (in)
3.68 2.26 1.96
3.4.1 Grain Size Distribution In fall 2004 disturbed soil was excavated from a depth of 10 feet with a backhoe and
removed from the site for testing. The soil was air-dried, crushed, and processed before testing.
Initially the soil removed from the slope appeared fine-grained and fissile. The color was mostly
gray with yellow coloring on some pieces. After being air-dried and processed, the soil appeared
tan in color. The soil was dried at a temperature of approximately 120°F, not exceeding 140°F
according to ASTM D 698-00a so that changes in the soil properties would not occur.
The size of the soil particles used to prepare specimens was limited by the equipment
used to process the soil. After crushing and grinding the soil, the largest soil particles were
smaller than 4.76 mm in diameter. A hydrometer test was conducted according to ASTM D 422-
63 on the soil passing the number 10 sieve. The procedure used in performing the hydrometer
test deviated slightly from that outlined by the ASTM because a water bath was not used.
However, the temperature was recorded at each reading and a correction factor was used. Based
on a sieve analysis performed on the soil used in the hydrometer test, the initial grain size
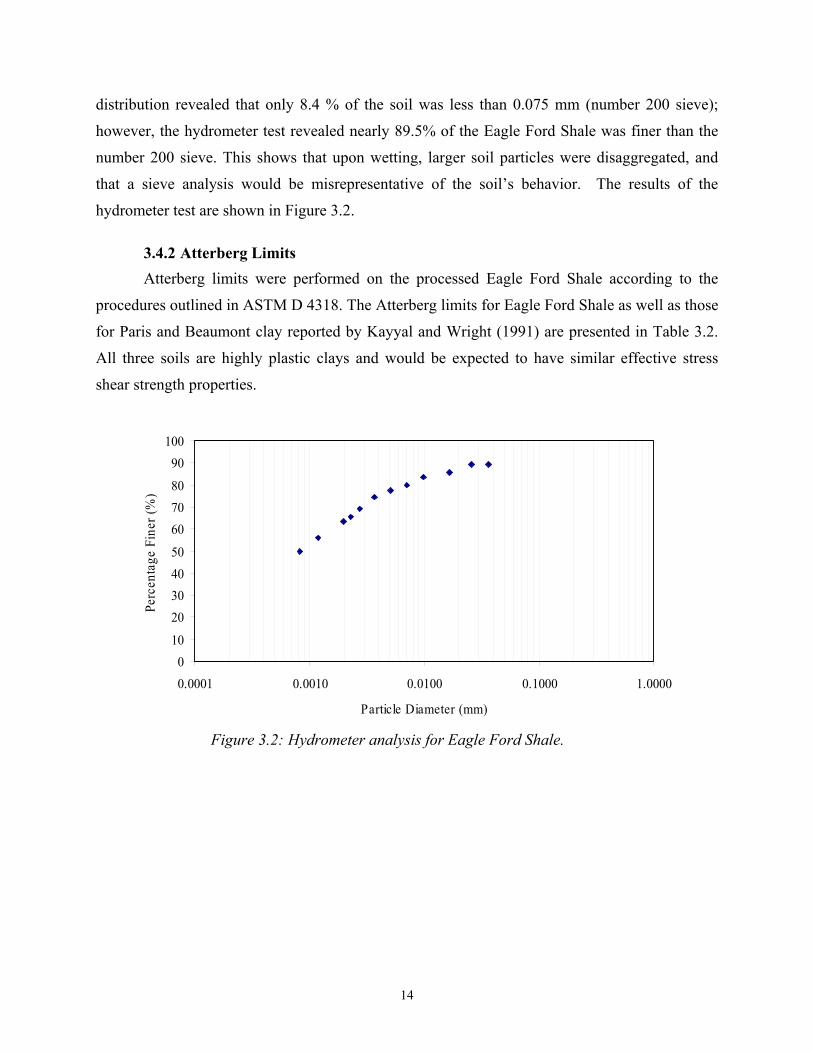
14
distribution revealed that only 8.4 % of the soil was less than 0.075 mm (number 200 sieve);
however, the hydrometer test revealed nearly 89.5% of the Eagle Ford Shale was finer than the
number 200 sieve. This shows that upon wetting, larger soil particles were disaggregated, and
that a sieve analysis would be misrepresentative of the soil’s behavior. The results of the
hydrometer test are shown in Figure 3.2.
3.4.2 Atterberg Limits Atterberg limits were performed on the processed Eagle Ford Shale according to the
procedures outlined in ASTM D 4318. The Atterberg limits for Eagle Ford Shale as well as those
for Paris and Beaumont clay reported by Kayyal and Wright (1991) are presented in Table 3.2.
All three soils are highly plastic clays and would be expected to have similar effective stress
shear strength properties.
010
20304050
607080
90100
0.0001 0.0010 0.0100 0.1000 1.0000
Particle Diameter (mm)
Perc
enta
ge F
iner
(%)
Figure 3.2: Hydrometer analysis for Eagle Ford Shale.
15
Table 3.2: Index properties of Eagle Ford Shale, Paris clay, and Beaumont clay.
85
90
95
100
105
110
115
120
6 8 10 12 14 16 18 20 22 24 26 28 30 32 34
Moisture Content (%)
Dry
Uni
t Wei
ght (
pcf)
St andard P roctor
Modified P roctor
Zero Air Voids
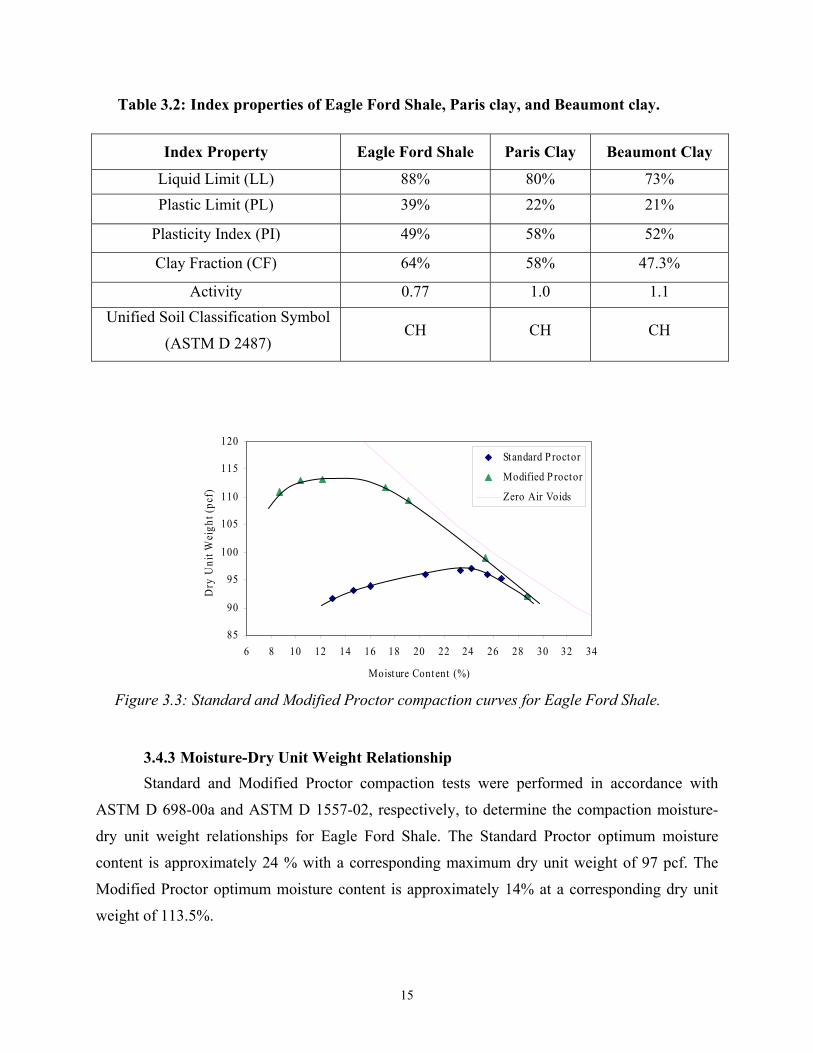
Figure 3.3: Standard and Modified Proctor compaction curves for Eagle Ford Shale.
3.4.3 Moisture-Dry Unit Weight Relationship Standard and Modified Proctor compaction tests were performed in accordance with
ASTM D 698-00a and ASTM D 1557-02, respectively, to determine the compaction moisture-
dry unit weight relationships for Eagle Ford Shale. The Standard Proctor optimum moisture
content is approximately 24 % with a corresponding maximum dry unit weight of 97 pcf. The
Modified Proctor optimum moisture content is approximately 14% at a corresponding dry unit
weight of 113.5%.
Index Property Eagle Ford Shale Paris Clay Beaumont Clay
Liquid Limit (LL) 88% 80% 73%Plastic Limit (PL) 39% 22% 21%
Plasticity Index (PI) 49% 58% 52%
Clay Fraction (CF) 64% 58% 47.3%
Activity 0.77 1.0 1.1Unified Soil Classification Symbol
(ASTM D 2487) CH CH CH
16
3.4.4 Specific Gravity Two specific gravity measurements were performed on the fraction of soil passing the
No. 4 sieve in accordance with ASTM D 854-02. The specific gravity values from the two
measurements were approximately 2.73 and 2.74 for an average of approximately 2.74.
3.4.5 Hydraulic Conductivity A flexible-walled permeameter test was conducted on a compacted specimen of soil with
a height-to-diameter ratio of approximately 0.5. The specimen was compacted at a moisture
content of approximately 23.6%, which is within 1% of optimum (24%), and a dry unit weight of
98.7 pcf (γd,max = 97.5 pcf). This is comparable to the compaction conditions of the compacted
triaxial specimens described in Chapter 4. After saturation and consolidation at an effective
stress of 4 psi, a hydraulic gradient of 20 was applied between the top and bottom of the
specimen. Shallow slope failures typically occur under low effective stresses; therefore, a low
effective consolidation stress was used to determine the hydraulic conductivity. The flow rate
into and out of the specimen was measured until the ratio of the outflow to inflow was at least
0.99. The hydraulic conductivity was found to be approximately 8 x 10⁻⁹ ft/min (4 x 10⁻⁹ cm/s).
The hydraulic conductivity was also computed from the consolidation data for a triaxial
specimen compacted at a moisture content of 22.5% and a dry unit weight of 96.8 pcf. The
specimen had a final effective consolidation pressure of 2 psi. The hydraulic conductivity of this
specimen was approximately 1 x 10⁻⁸ ft/min (5 x 10⁻⁹ cm/s), which is reasonably close to the
value obtained by the flexible-walled permeameter test.
17
4. Triaxial Specimen Preparation and Testing Set-up
4.1 Introduction
Three series of consolidated-undrained triaxial compression tests with pore water
pressure measurements were performed on specimens of Eagle Ford Shale. The first series
involved compacted specimens. The second series involved specimens normally consolidated
from a slurry. The third series entailed compacting specimens and then exposing them to
repeated cycles of wetting and drying. The method of preparation and the equipment involved
for each series is described in the following sections.
4.1.1 As-Compacted Specimens In the first series of tests, specimens were compacted and immediately placed in the
triaxial apparatus for testing.
4.1.1.1 Soil Preparation
Specimens were compacted from the fraction of Eagle Ford Shale that passed a number
40 sieve. The soil was mixed dry of optimum to a moisture content of approximately 23% which
is within 1% of the optimum moisture content (24%). Once mixed, the soil was sealed in two
plastic bags, and the moisture content was allowed to equilibrate for at least 16 hours in a room
maintained at 100% humidity prior to compaction as specified by ASTM D 2850-03a and ASTM
D 4767-02.
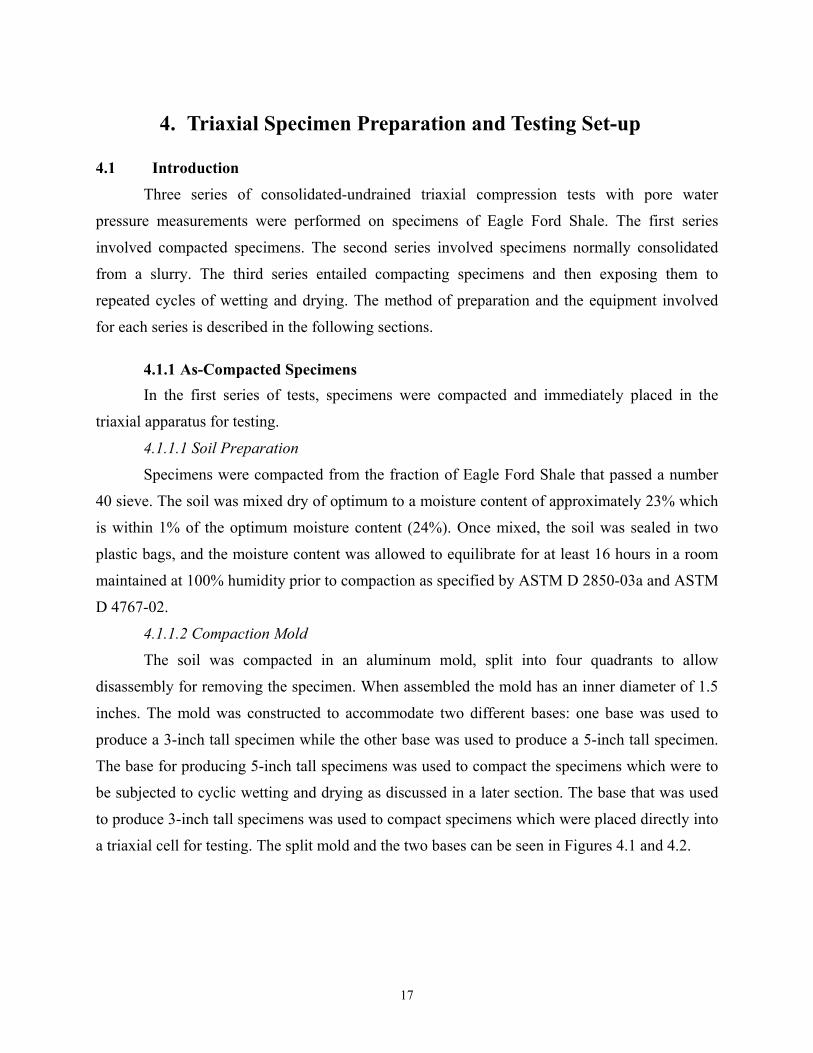
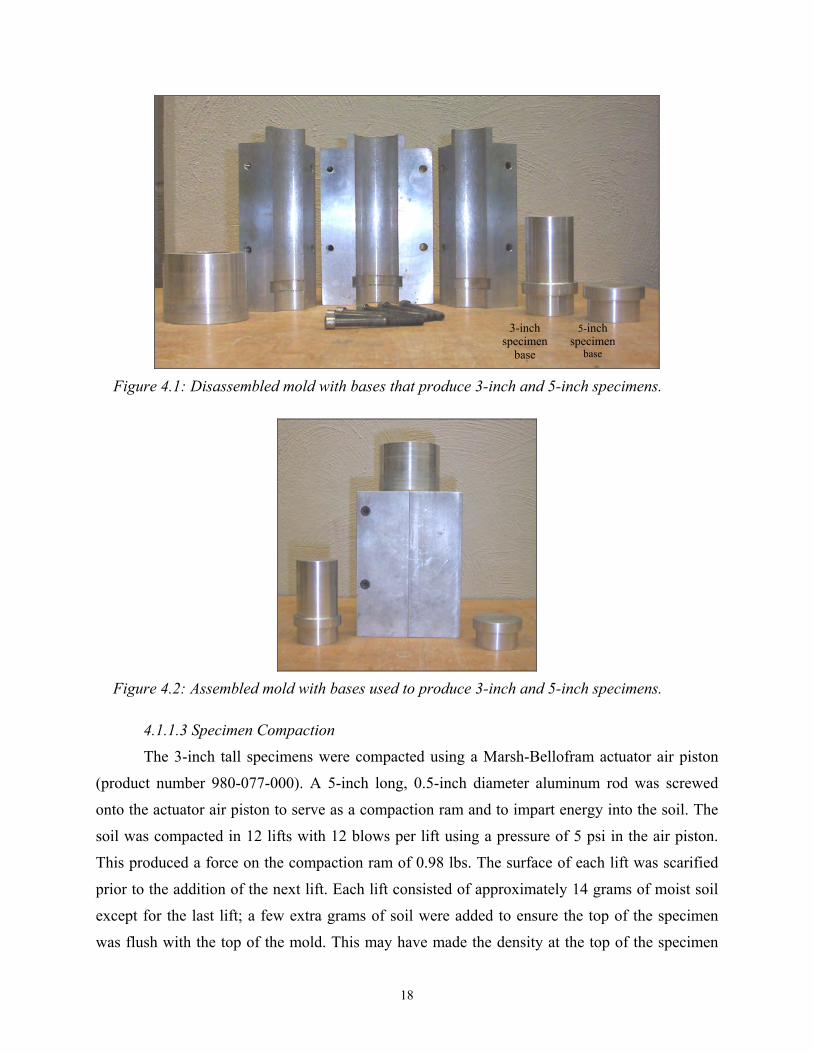
4.1.1.2 Compaction Mold
The soil was compacted in an aluminum mold, split into four quadrants to allow
disassembly for removing the specimen. When assembled the mold has an inner diameter of 1.5
inches. The mold was constructed to accommodate two different bases: one base was used to
produce a 3-inch tall specimen while the other base was used to produce a 5-inch tall specimen.
The base for producing 5-inch tall specimens was used to compact the specimens which were to
be subjected to cyclic wetting and drying as discussed in a later section. The base that was used
to produce 3-inch tall specimens was used to compact specimens which were placed directly into
a triaxial cell for testing. The split mold and the two bases can be seen in Figures 4.1 and 4.2.
18
Figure 4.1: Disassembled mold with bases that produce 3-inch and 5-inch specimens.
Figure 4.2: Assembled mold with bases used to produce 3-inch and 5-inch specimens.
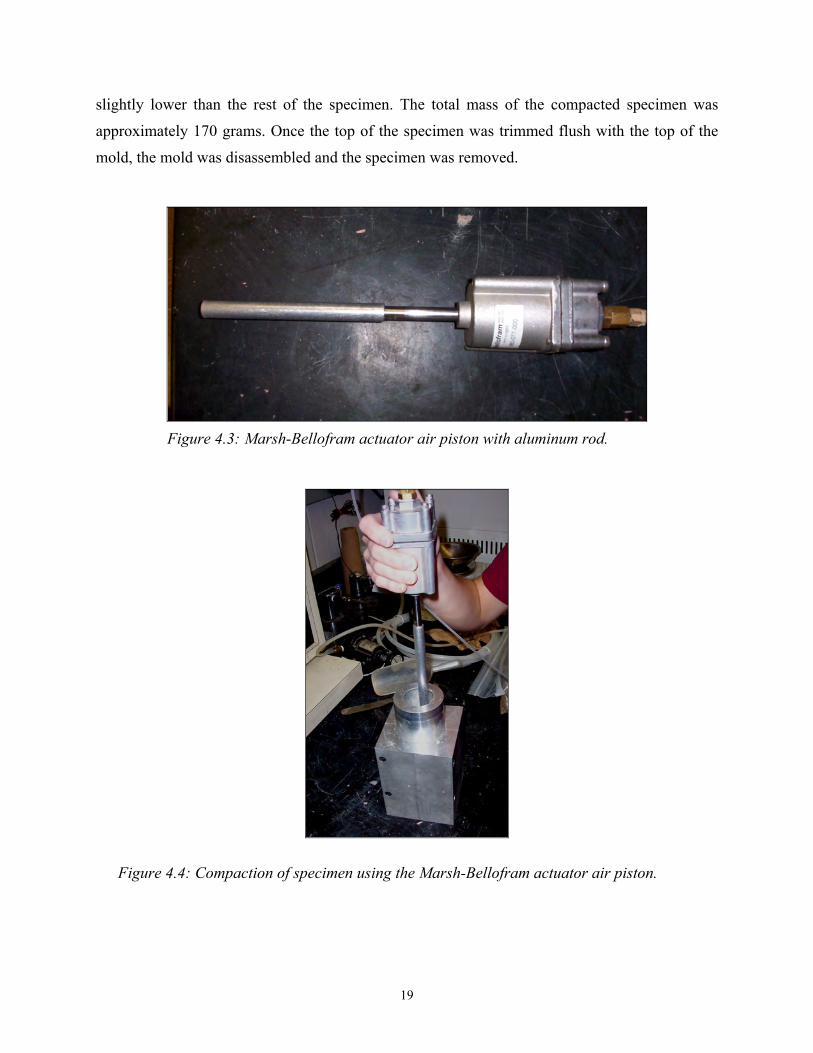
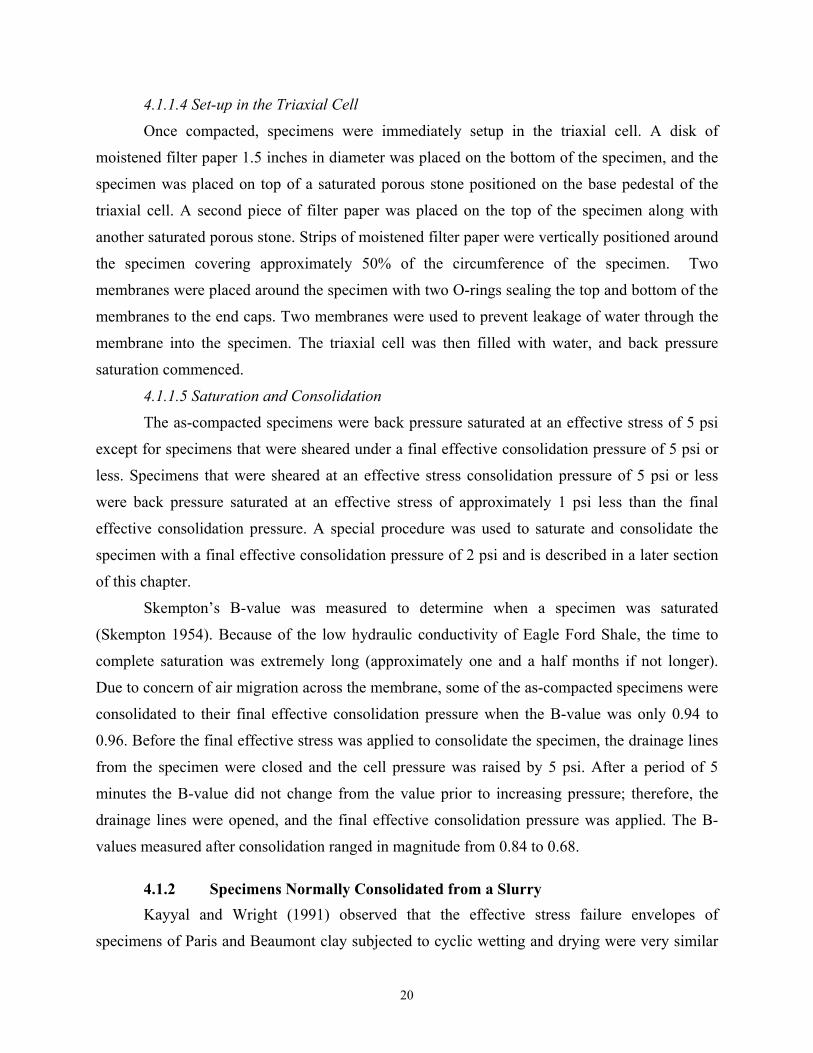
4.1.1.3 Specimen Compaction
The 3-inch tall specimens were compacted using a Marsh-Bellofram actuator air piston
(product number 980-077-000). A 5-inch long, 0.5-inch diameter aluminum rod was screwed
onto the actuator air piston to serve as a compaction ram and to impart energy into the soil. The
soil was compacted in 12 lifts with 12 blows per lift using a pressure of 5 psi in the air piston.
This produced a force on the compaction ram of 0.98 lbs. The surface of each lift was scarified
prior to the addition of the next lift. Each lift consisted of approximately 14 grams of moist soil
except for the last lift; a few extra grams of soil were added to ensure the top of the specimen
was flush with the top of the mold. This may have made the density at the top of the specimen
3-inch specimen
base
5-inch specimen
base
19
slightly lower than the rest of the specimen. The total mass of the compacted specimen was
approximately 170 grams. Once the top of the specimen was trimmed flush with the top of the
mold, the mold was disassembled and the specimen was removed.
Figure 4.3: Marsh-Bellofram actuator air piston with aluminum rod.
Figure 4.4: Compaction of specimen using the Marsh-Bellofram actuator air piston.
20
4.1.1.4 Set-up in the Triaxial Cell
Once compacted, specimens were immediately setup in the triaxial cell. A disk of
moistened filter paper 1.5 inches in diameter was placed on the bottom of the specimen, and the
specimen was placed on top of a saturated porous stone positioned on the base pedestal of the
triaxial cell. A second piece of filter paper was placed on the top of the specimen along with
another saturated porous stone. Strips of moistened filter paper were vertically positioned around
the specimen covering approximately 50% of the circumference of the specimen. Two
membranes were placed around the specimen with two O-rings sealing the top and bottom of the
membranes to the end caps. Two membranes were used to prevent leakage of water through the
membrane into the specimen. The triaxial cell was then filled with water, and back pressure
saturation commenced.
4.1.1.5 Saturation and Consolidation
The as-compacted specimens were back pressure saturated at an effective stress of 5 psi
except for specimens that were sheared under a final effective consolidation pressure of 5 psi or
less. Specimens that were sheared at an effective stress consolidation pressure of 5 psi or less
were back pressure saturated at an effective stress of approximately 1 psi less than the final
effective consolidation pressure. A special procedure was used to saturate and consolidate the
specimen with a final effective consolidation pressure of 2 psi and is described in a later section
of this chapter.
Skempton’s B-value was measured to determine when a specimen was saturated
(Skempton 1954). Because of the low hydraulic conductivity of Eagle Ford Shale, the time to
complete saturation was extremely long (approximately one and a half months if not longer).
Due to concern of air migration across the membrane, some of the as-compacted specimens were
consolidated to their final effective consolidation pressure when the B-value was only 0.94 to
0.96. Before the final effective stress was applied to consolidate the specimen, the drainage lines
from the specimen were closed and the cell pressure was raised by 5 psi. After a period of 5
minutes the B-value did not change from the value prior to increasing pressure; therefore, the
drainage lines were opened, and the final effective consolidation pressure was applied. The B-
values measured after consolidation ranged in magnitude from 0.84 to 0.68.
4.1.2 Specimens Normally Consolidated from a Slurry Kayyal and Wright (1991) observed that the effective stress failure envelopes of
specimens of Paris and Beaumont clay subjected to cyclic wetting and drying were very similar
21
to those of specimens normally consolidated from a slurry. To determine if the same finding
applied to Eagle Ford Shale, a second series of specimens was prepared by normally
consolidating a soil-water slurry mix in acrylic consolidation tubes.
4.1.2.1 Soil Preparation
A slurry was prepared by mixing approximately 130 grams of air-dried Eagle Ford Shale,
which had an initial moisture content of approximately 5.0% and passed a number 40 sieve
(0.425 mm), with 190 grams of distilled water to a moisture content of approximately 154%. The
water was added to the soil in small amounts. After each addition of water the mixture was
stirred with a spatula to break up large lumps of soil. When approximately 40 grams of water
remained to be added, the mixture was blended using a Hamilton Beach Commercial mixer.
Medium speed was used for a short period of time (approximately ten seconds) until the mixture
appeared well-blended. Once the slurry was well mixed, it was poured into an acrylic
consolidation tube. The remaining water was used to wash the slurry on the sides of the mixing
container into the tube. Any slurry that remained on the inner wall of the slurry tube was rinsed
away with distilled water as the slurry would cause friction between the inner tube wall and the
top loading cap. The initial height of the slurry in the tube was approximately 7 inches. After
consolidation the slurry was approximately 4.5 inches in height.
4.1.2.2 Consolidation Tube Description
The consolidation tubes each consist of an acrylic tube with an inner diameter of 1.5
inches and a length of 18 inches. The tube is attached to an acrylic base by three threaded rods
that are screwed down into an acrylic collar that fits around the top of the tube. Loads are applied
to the slurry by means of a piston which acts on an acrylic top cap inserted into the tube. The top
cap has a diameter of 1.48 inches, and a thin layer of vacuum grease is applied to the sides of the
top cap to reduce friction along the walls of the tube. Drainage is allowed through both the top
and the bottom of the slurry during consolidation by means of porous stones in the base and the
top cap. Filter paper is also placed between the porous stones and the slurry to prevent fine clay
particles from plugging the porous stones. A thin layer of vacuum grease is also applied to the
inside of the bottom of the tube to prevent friction between the consolidating slurry and the sides
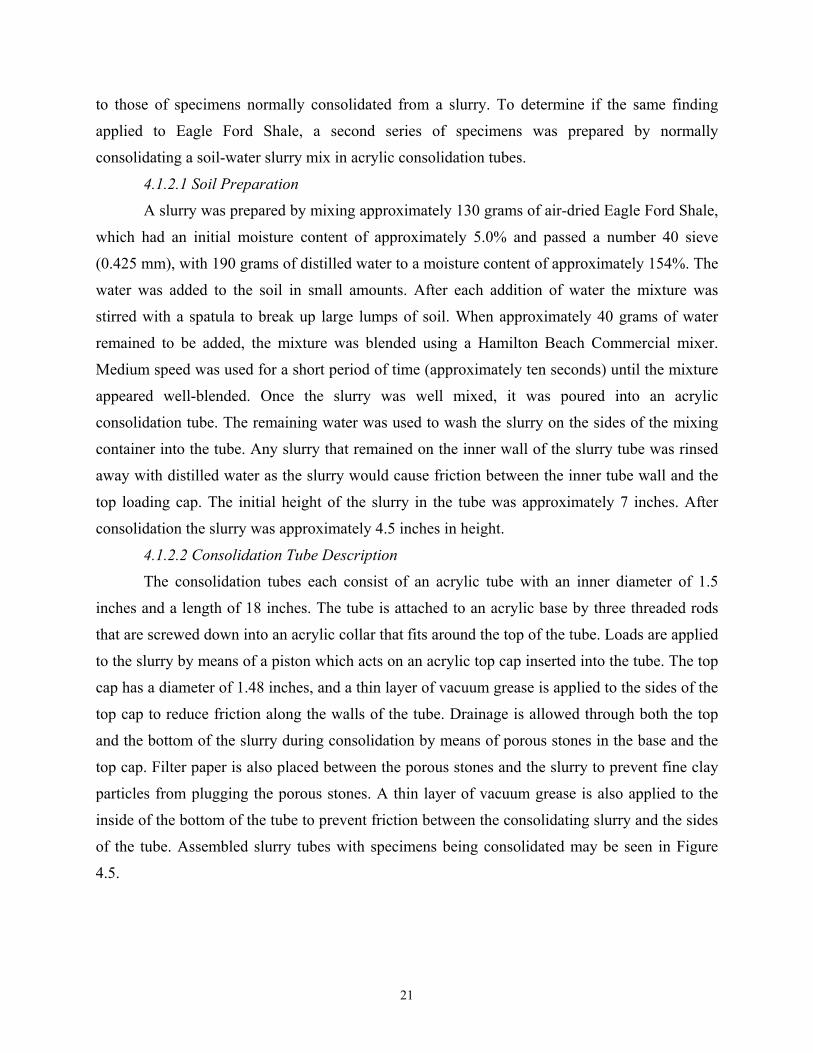
of the tube. Assembled slurry tubes with specimens being consolidated may be seen in Figure
4.5.
22
Figure 4.5: Assembled consolidation tubes and consolidating specimens.
4.1.2.3 Consolidation of Slurry
Initially the slurry was allowed to consolidate under only the weight of the top cap and
piston. The loads were applied to the piston in increments until the final target effective
consolidation pressure was reached. Under each applied load the slurry was allowed to
consolidate, and the next load was applied when primary consolidation appeared to be
completed. The specimens required approximately 25 to 30 days to consolidate in the
consolidation tubes. A final vertical consolidation pressure of 2 psi was applied to the specimen
whose final effective consolidation pressure in the triaxial cell was 3 psi. All other specimens
were consolidated to a final vertical consolidation pressure of 4 psi.
4.1.2.4 Specimen Extrusion
Once specimens were consolidated to the desired pressure, they were carefully removed
from the consolidation tubes. First the load was removed from the piston, and the water that had
drained through the top cap was poured from the tube. The threaded rods were unscrewed, and
the base was set aside. With the tube held horizontally, the piston was pushed until the specimen
Acrylic top cap
Loading piston
Consolidating specimen
23
was extruded approximately 0.5 inches. This portion of the specimen was trimmed and used to
measure the moisture content. A circular piece of filter paper 1.5 inches in diameter was placed
on the trimmed end, and the tube was rotated 90 degrees so that it was in the vertical position
above the pedestal of the triaxial cell, which was covered with a saturated porous stone. The
remainder of the specimen was extruded by pushing down on the piston and then trimmed to a
height of approximately 3 inches. A second circular piece of filter paper and a porous stone were
placed on top of the specimen. Strips of filter paper were then positioned around the
circumference of the specimen. Two membranes were placed around the specimen to prevent
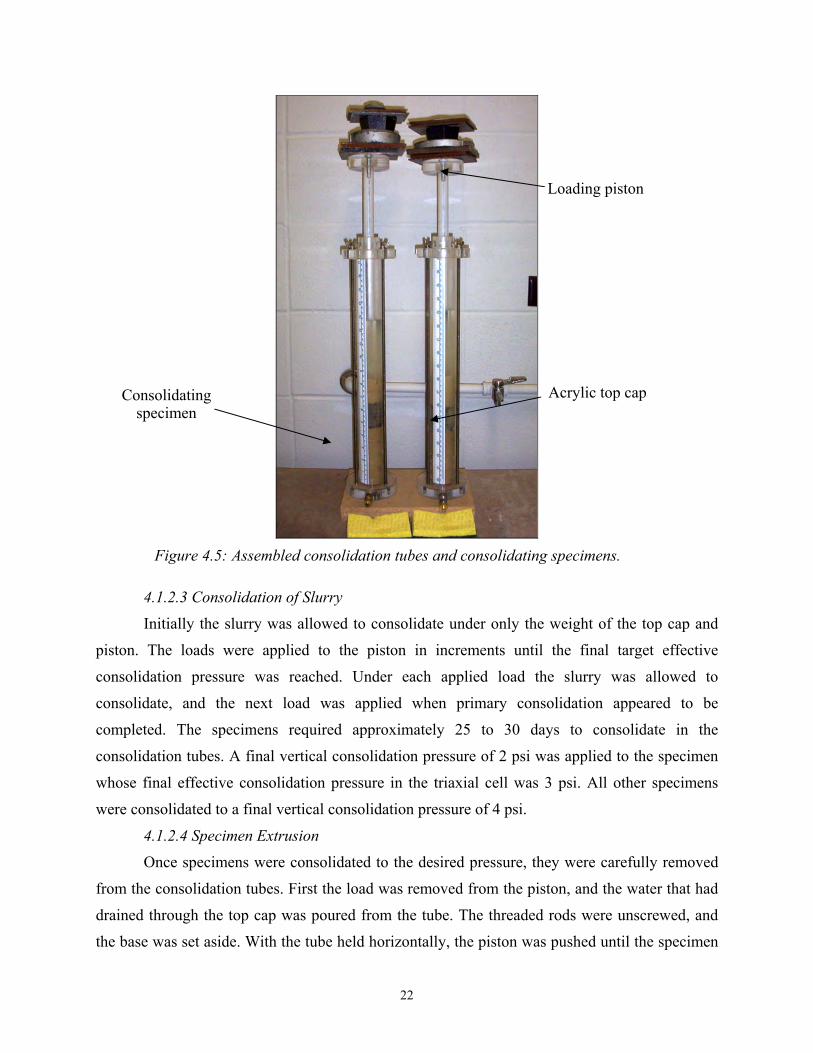
leakage, and two O-rings were used to seal the membranes to the top and bottom end caps.
Figure 4.6: Trimmed slurry specimen on triaxial cell pedestal with
vertical filter paper drains.
4.1.2.5 Saturation and Consolidation
Once specimens were setup in the triaxial cell, specimens whose final effective
consolidation pressure was to be greater than 5 psi were back pressure saturated at an effective
stress of 5 psi. For the specimens with a final effective consolidation pressure of 5 psi or less, the
effective stress during back pressure saturation was 1 psi lower than the final effective
consolidation pressure. The specimen with a final effective consolidation pressure of 3 psi was
saturated and consolidated using a special method which is described in a later section.
Skempton’s B-value was measured to determine when specimens were saturated (Skempton
24
1954). When the B-value reached at least 0.98, the final effective consolidation pressure was
applied.
4.1.3 Specimens Exposed to Cyclic Wetting and Drying The third series of specimens was prepared by compacting the specimens and then
subjecting them to cyclic wetting and drying before testing in the triaxial apparatus.
4.1.3.1 Soil Preparation
The specimens subjected to cyclic wetting and drying were prepared from the fraction of
soil passing a number 40 sieve and compacted to a moisture content of approximately 23%,
which is within 1% of the optimum moisture content (24%). After mixing with water, the soil
was allowed to equilibrate for at least 16 hours in a humidity room prior to compaction.
4.1.3.2 Specimen Compaction
The specimens were compacted in 8 lifts with 45 blows per lift using the air piston
described earlier. A pressure of 15 psi in the air piston was used to achieve Standard Proctor
effort. This produced a force of 2.95 lbs. on the 0.5-inch diameter compaction rod.
Approximately 35 grams of soil per lift were used, and the surface of each lift was scarified prior
to the addition of the subsequent lift. Specimens were compacted in the split mold described
earlier using the base pedestal that produced 5-inch tall specimens. Specimens were compacted
to a height of 5 inches to accommodate the decrease in height caused by cyclic wetting and
drying and the accompanying lateral expansion of the specimen. After each specimen was
compacted, the top of the specimen was trimmed flush with the top of the mold, the mold was
disassembled, and the specimen was weighed. The trimmings were used to obtain an initial
moisture content for the specimen in the compacted state.
4.1.3.3 Wetting and Drying Procedure
For wetting and drying, the compacted specimens were placed in special specimen
holders designed by Kayyal and Wright (1991). The specimen holders consist of a cylindrical
metallic screen approximately 1.7 inches in diameter resting on a screen base supported by
acrylic rings and threaded rods. The square openings in the screen are 0.425 mm in size. The
screen allows water to infiltrate the specimen from all sides while preventing the specimen from
disintegrating completely. The specimens were subjected to 20 cycles of wetting and drying.
Kayyal and Wright (1991) determined that each cycle should consist of a period of drying and
wetting with the first “cycle” entailing wetting, drying, and rewetting. Each wetting and drying
period lasted for 24 hours after which Kayyal and Wright (1991) observed no significant change
25
in moisture content. Kayyal and Wright also found that after 20 cycles there was no apparent
further particle breakdown.
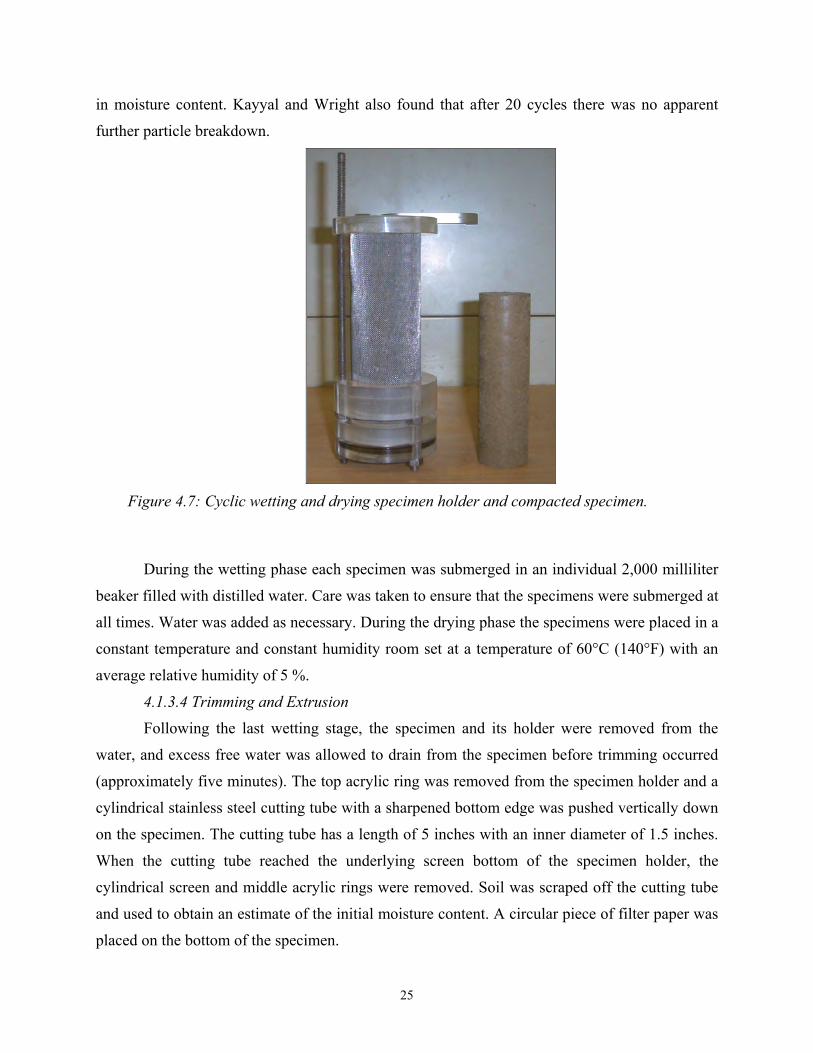
Figure 4.7: Cyclic wetting and drying specimen holder and compacted specimen.
During the wetting phase each specimen was submerged in an individual 2,000 milliliter
beaker filled with distilled water. Care was taken to ensure that the specimens were submerged at
all times. Water was added as necessary. During the drying phase the specimens were placed in a
constant temperature and constant humidity room set at a temperature of 60°C (140°F) with an
average relative humidity of 5 %.
4.1.3.4 Trimming and Extrusion
Following the last wetting stage, the specimen and its holder were removed from the
water, and excess free water was allowed to drain from the specimen before trimming occurred
(approximately five minutes). The top acrylic ring was removed from the specimen holder and a
cylindrical stainless steel cutting tube with a sharpened bottom edge was pushed vertically down
on the specimen. The cutting tube has a length of 5 inches with an inner diameter of 1.5 inches.
When the cutting tube reached the underlying screen bottom of the specimen holder, the
cylindrical screen and middle acrylic rings were removed. Soil was scraped off the cutting tube
and used to obtain an estimate of the initial moisture content. A circular piece of filter paper was
placed on the bottom of the specimen.
26
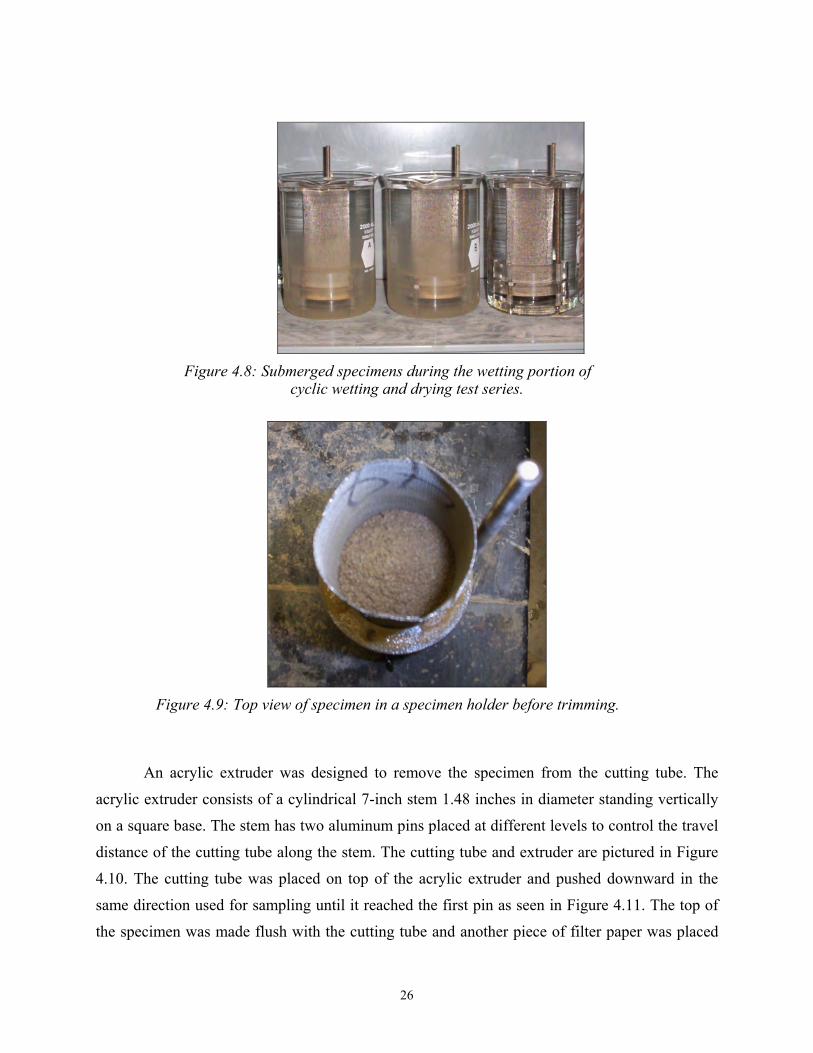
Figure 4.8: Submerged specimens during the wetting portion of
cyclic wetting and drying test series.
Figure 4.9: Top view of specimen in a specimen holder before trimming.
An acrylic extruder was designed to remove the specimen from the cutting tube. The
acrylic extruder consists of a cylindrical 7-inch stem 1.48 inches in diameter standing vertically
on a square base. The stem has two aluminum pins placed at different levels to control the travel
distance of the cutting tube along the stem. The cutting tube and extruder are pictured in Figure
4.10. The cutting tube was placed on top of the acrylic extruder and pushed downward in the
same direction used for sampling until it reached the first pin as seen in Figure 4.11. The top of
the specimen was made flush with the cutting tube and another piece of filter paper was placed
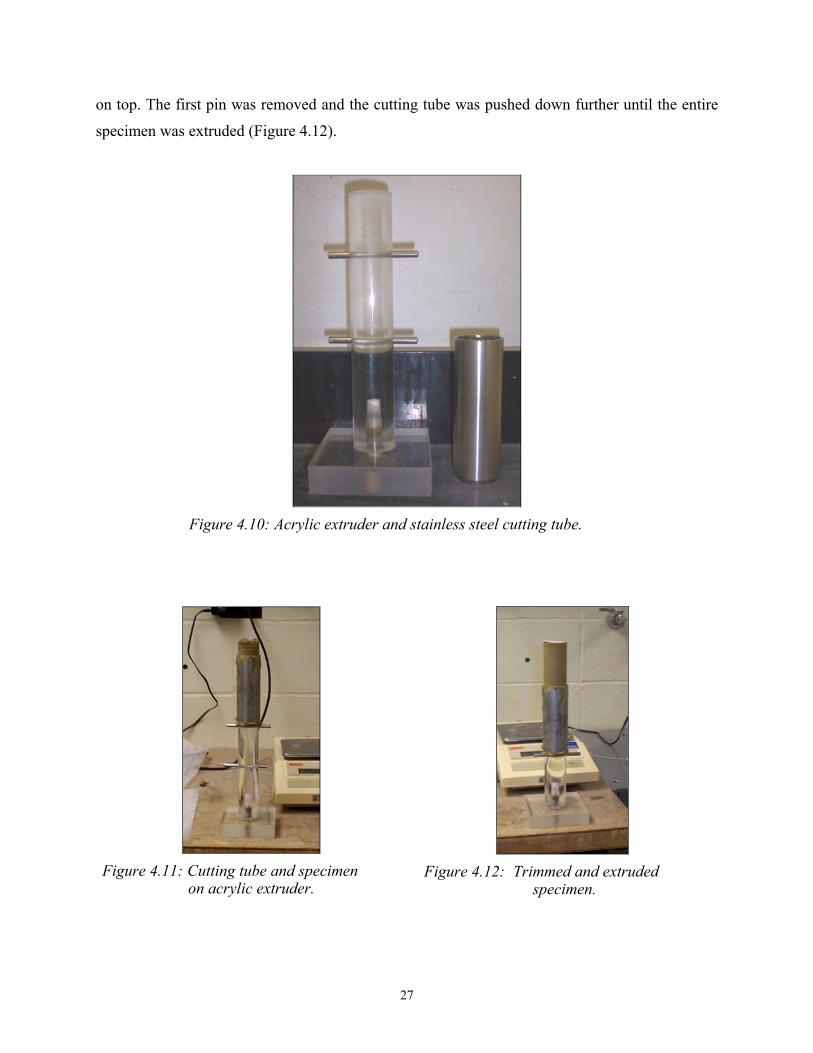
27
on top. The first pin was removed and the cutting tube was pushed down further until the entire
specimen was extruded (Figure 4.12).
Figure 4.10: Acrylic extruder and stainless steel cutting tube.
Figure 4.11: Cutting tube and specimen
on acrylic extruder.
Figure 4.12: Trimmed and extruded
specimen.
28
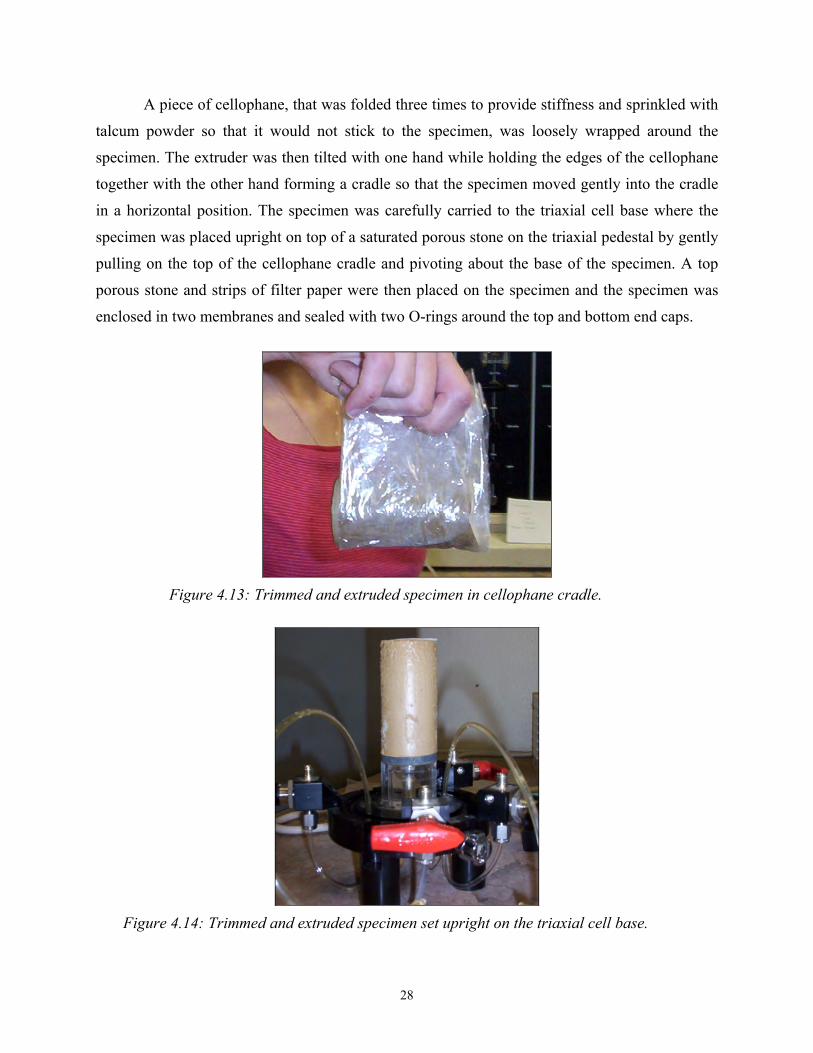
A piece of cellophane, that was folded three times to provide stiffness and sprinkled with
talcum powder so that it would not stick to the specimen, was loosely wrapped around the
specimen. The extruder was then tilted with one hand while holding the edges of the cellophane
together with the other hand forming a cradle so that the specimen moved gently into the cradle
in a horizontal position. The specimen was carefully carried to the triaxial cell base where the
specimen was placed upright on top of a saturated porous stone on the triaxial pedestal by gently
pulling on the top of the cellophane cradle and pivoting about the base of the specimen. A top
porous stone and strips of filter paper were then placed on the specimen and the specimen was
enclosed in two membranes and sealed with two O-rings around the top and bottom end caps.
Figure 4.13: Trimmed and extruded specimen in cellophane cradle.
Figure 4.14: Trimmed and extruded specimen set upright on the triaxial cell base.
29
4.1.3.5 Saturation and Consolidation
Specimens with a final effective consolidation pressure greater than 5 psi were back-
pressure saturated at an effective consolidation pressure of 5 psi. For those specimens that had a
final effective consolidation pressure less than or equal to 5 psi, the effective consolidation
pressure during back-pressure saturation was 1 psi less than the final effective consolidation
pressure, except for the specimen that had a final effective consolidation pressure of 1 psi. The
effective stress during back-pressure saturation for this particular specimen was 0.5 psi. Once a
B-value of at least 0.98 was achieved, the specimen was consolidated to the final effective stress.
For the specimen consolidated to an effective stress of 50 psi, the B-value prior to consolidation
was 0.96. A B-value of 0.2 was measured following consolidation, which cannot be explained at
this time; however, it is thought that there was possibly an air bubble in the drainage lines or the
pore water pressure transducer was not working properly during saturation.
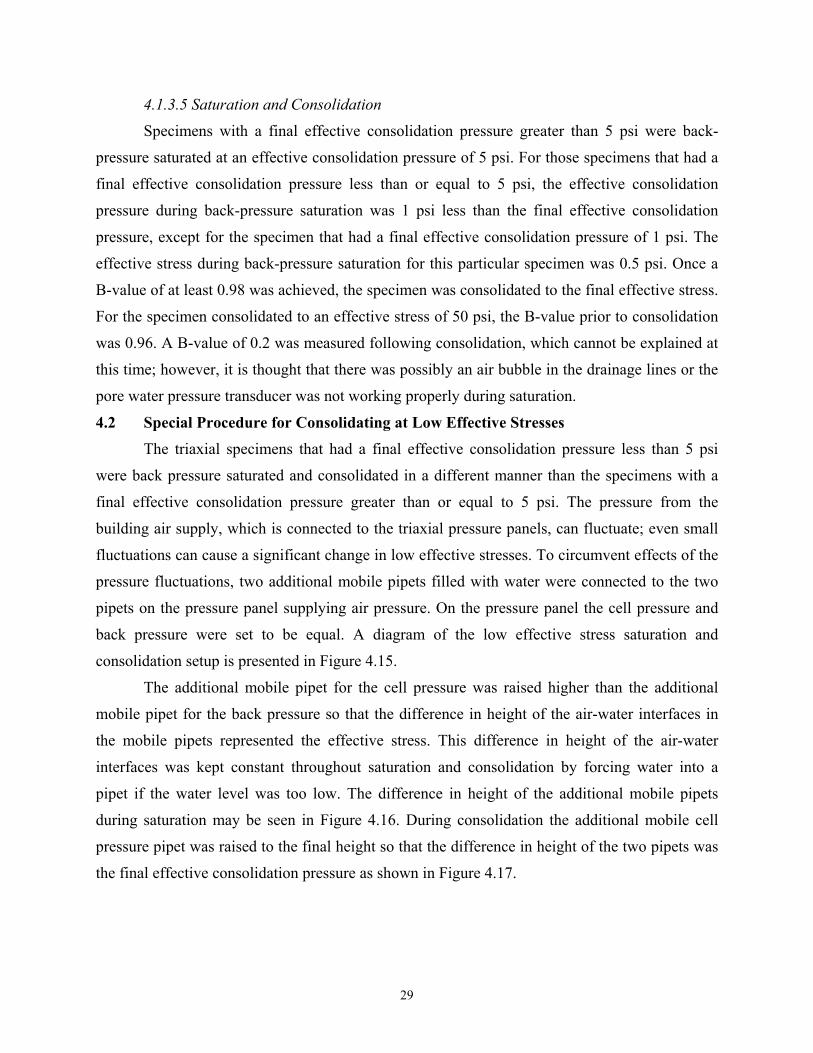
4.2 Special Procedure for Consolidating at Low Effective Stresses
The triaxial specimens that had a final effective consolidation pressure less than 5 psi
were back pressure saturated and consolidated in a different manner than the specimens with a
final effective consolidation pressure greater than or equal to 5 psi. The pressure from the
building air supply, which is connected to the triaxial pressure panels, can fluctuate; even small
fluctuations can cause a significant change in low effective stresses. To circumvent effects of the
pressure fluctuations, two additional mobile pipets filled with water were connected to the two
pipets on the pressure panel supplying air pressure. On the pressure panel the cell pressure and
back pressure were set to be equal. A diagram of the low effective stress saturation and
consolidation setup is presented in Figure 4.15.
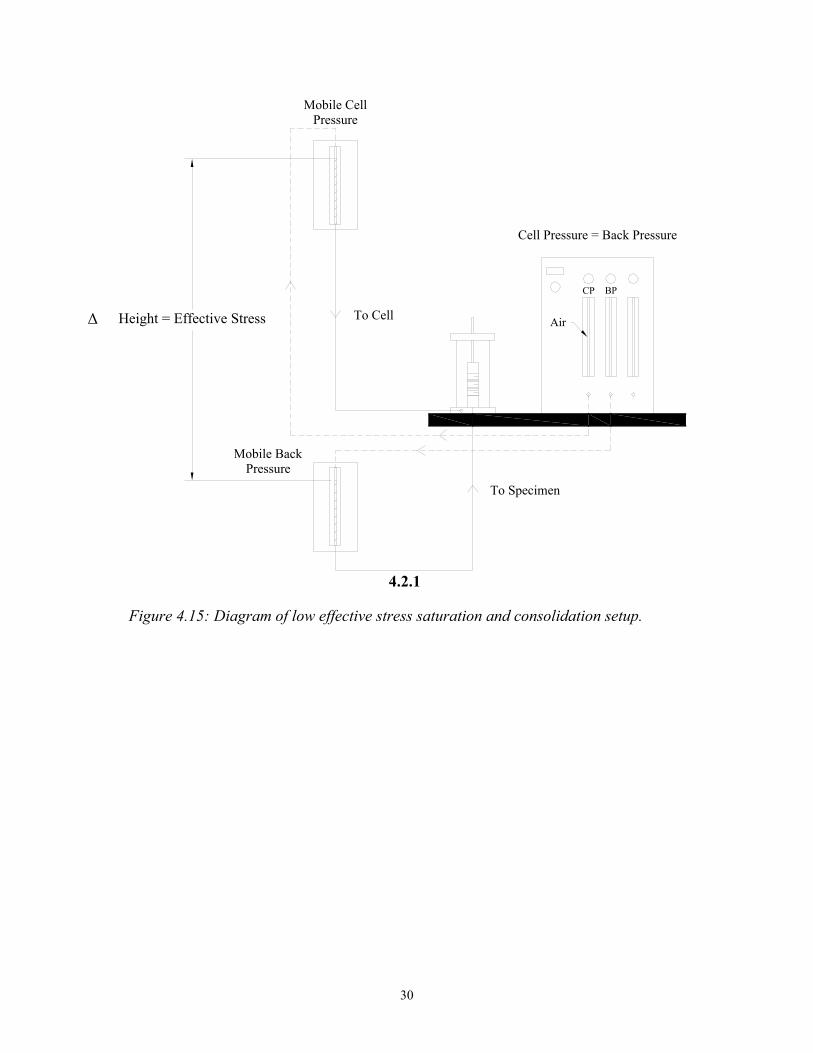
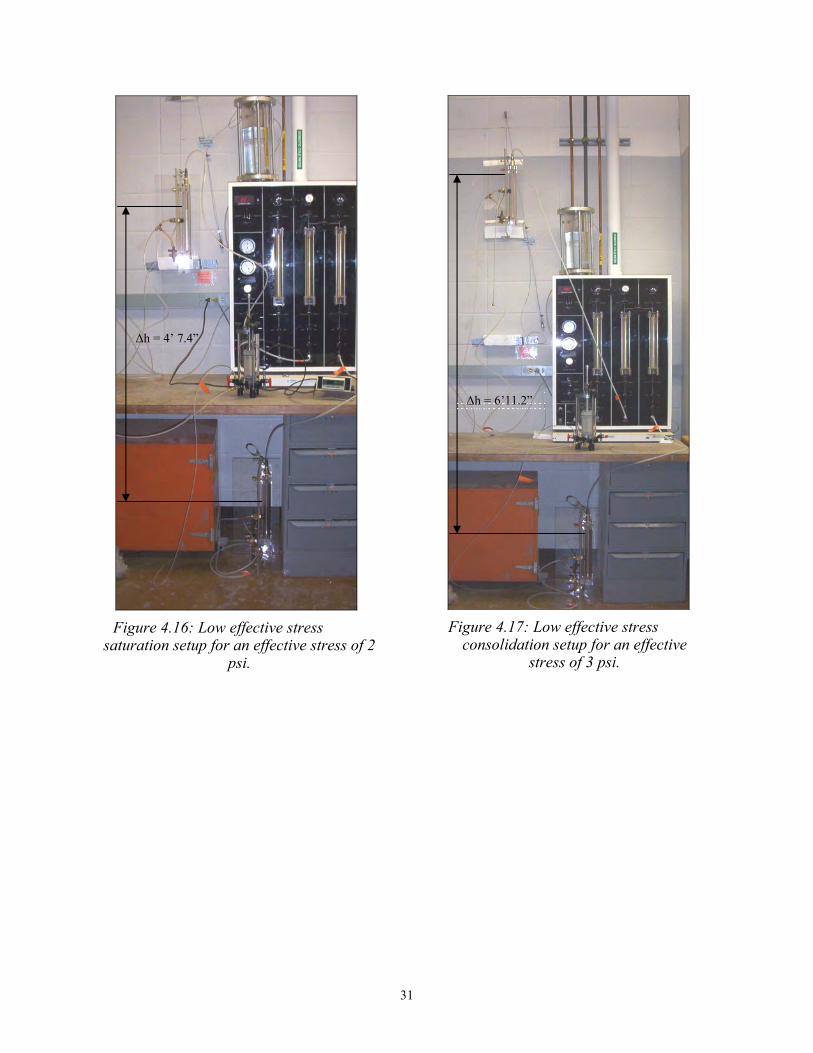
The additional mobile pipet for the cell pressure was raised higher than the additional
mobile pipet for the back pressure so that the difference in height of the air-water interfaces in
the mobile pipets represented the effective stress. This difference in height of the air-water
interfaces was kept constant throughout saturation and consolidation by forcing water into a
pipet if the water level was too low. The difference in height of the additional mobile pipets
during saturation may be seen in Figure 4.16. During consolidation the additional mobile cell
pressure pipet was raised to the final height so that the difference in height of the two pipets was
the final effective consolidation pressure as shown in Figure 4.17.
30
Mobile Cell Pressure
Mobile Back Pressure
Height = Effective Stress
Cell Pressure = Back Pressure
To Cell
To Specimen
CP BP
Air
4.2.1
Figure 4.15: Diagram of low effective stress saturation and consolidation setup.
Δ
31
Figure 4.16: Low effective stress
saturation setup for an effective stress of 2 psi.
Figure 4.17: Low effective stress
consolidation setup for an effective stress of 3 psi.
Δh = 4’ 7.4”
Δh = 6’11.2”

32
33
5. Consolidated-Undrained Triaxial Compression Tests with Pore Water Pressure Measurements on Eagle Ford Shale Specimens
5.1 Overview
Isotropically consolidated-undrained triaxial compression tests with pore water pressure
measurements were performed on the various specimens of Eagle Ford Shale according to
ASTM D 4746-02. The purpose of the tests on the specimens normally consolidated from a
slurry and those subjected to cyclic wetting and drying was to determine the fully softened shear
strength of Eagle Ford Shale. The specimens tested in the as-compacted state served as a basis
for comparison and judging the magnitude of softening effects. The stress paths and failure
envelopes along with the stress-strain curves are presented and compared in the following
sections of this chapter for each group of specimens. The undrained strength of Eagle Ford Shale
in the as-compacted condition was also examined by conducting a series of unconsolidated-
undrained triaxial compression tests.
Rates of loading during shear were calculated from data obtained during consolidation of
the specimens. Specimens were generally sheared at rates slower than those calculated to ensure
pore water pressure equalization in the specimen during loading. The times for primary
consolidation, coefficients of consolidation, calculated times to failure, and deformation rates are
presented in Appendix A.
5.2 As-Compacted Consolidated-Undrained Triaxial Compression Specimens
Five consolidated-undrained triaxial compression tests with pore water pressure
measurements were performed on as-compacted specimens using a range of effective
consolidation pressures from 2 psi to 40 psi. The stress-strain curves and stress paths for the
specimens are presented in Figures 5.1 and 5.2.
The stress-strain curves for the as-compacted specimens are presented in Figure 5.1. It
appears that the higher the effective consolidation pressure, the more softening that occurs once
the peak strength is reached. Specimens reached failure corresponding to points where the stress
path became approximately tangent to the failure envelope at axial strains ranging from 1 to 7 %.
The test of the as-compacted specimen with an effective consolidation pressure of 15 psi was
ended inadvertently at a much lower strain than it should have been; however, from Figure 5.1 it
appears that the specimen had reached failure according to the point of stress path tangency to
the failure envelope.
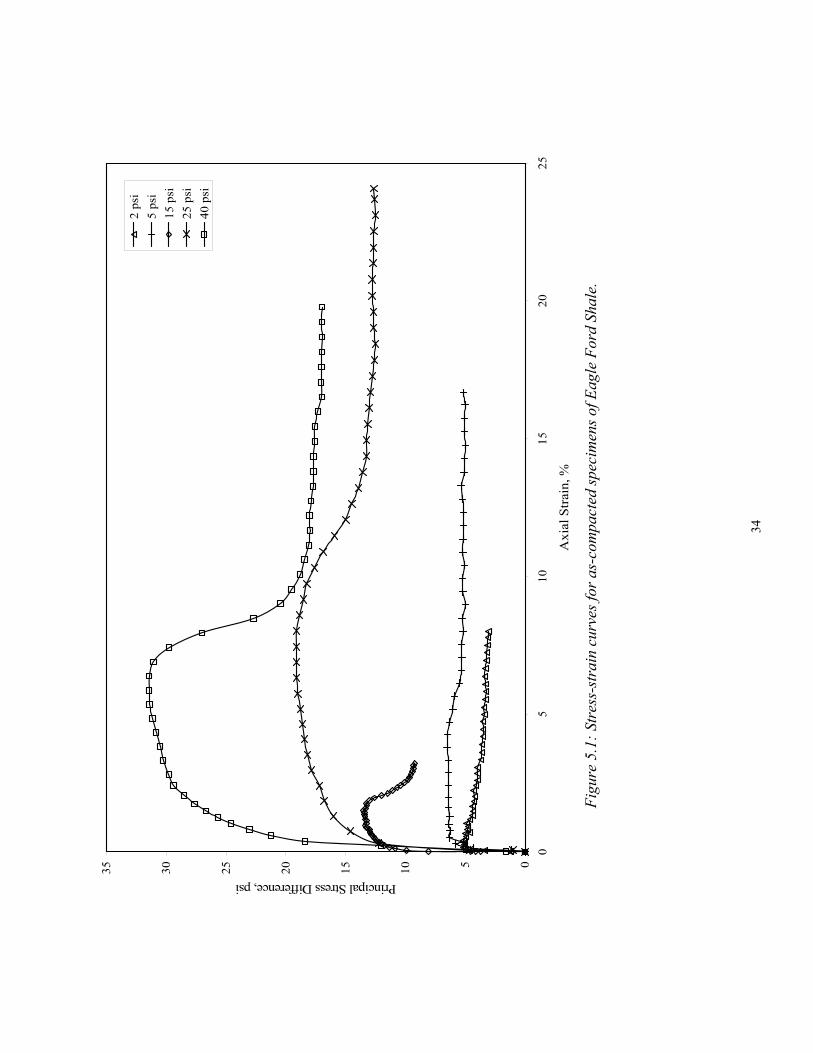
34
05101520253035
05
1015
2025
Axi
al S
trai
n, %
Principal Stress Difference, psi
2 ps
i5
psi
15 p
si25
psi
40 p
si
Fi
gure
5.1
: Str
ess-
stra
in c
urve
s for
as-
com
pact
ed sp
ecim
ens o
f Eag
le F
ord
Shal
e.
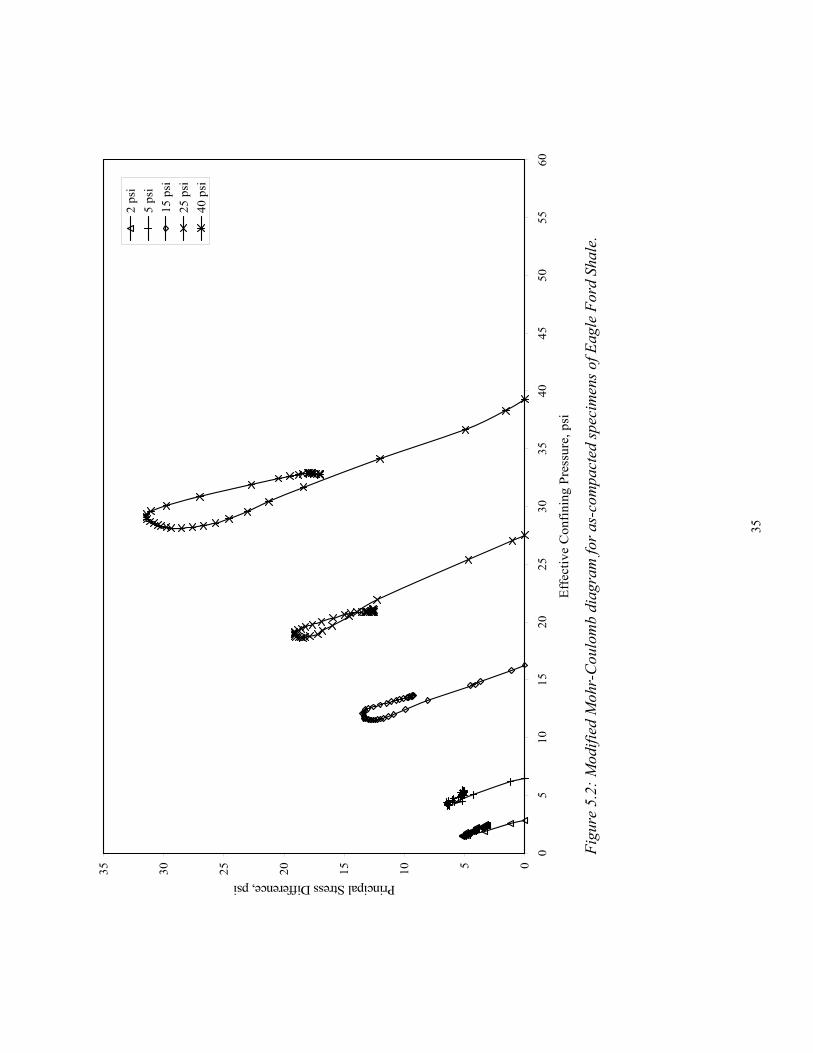
35
05101520253035
05
1015
2025
3035
4045
5055
60
Effe
ctiv
e C
onfin
ing
Pres
sure
, psi
Principal Stress Difference, psi
2 ps
i5
psi
15 p
si25
psi
40 p
si
Fi
gure
5.2
: Mod
ified
Moh
r-C
oulo
mb
diag
ram
for a
s-co
mpa
cted
spec
imen
s of E
agle
For
d Sh
ale.
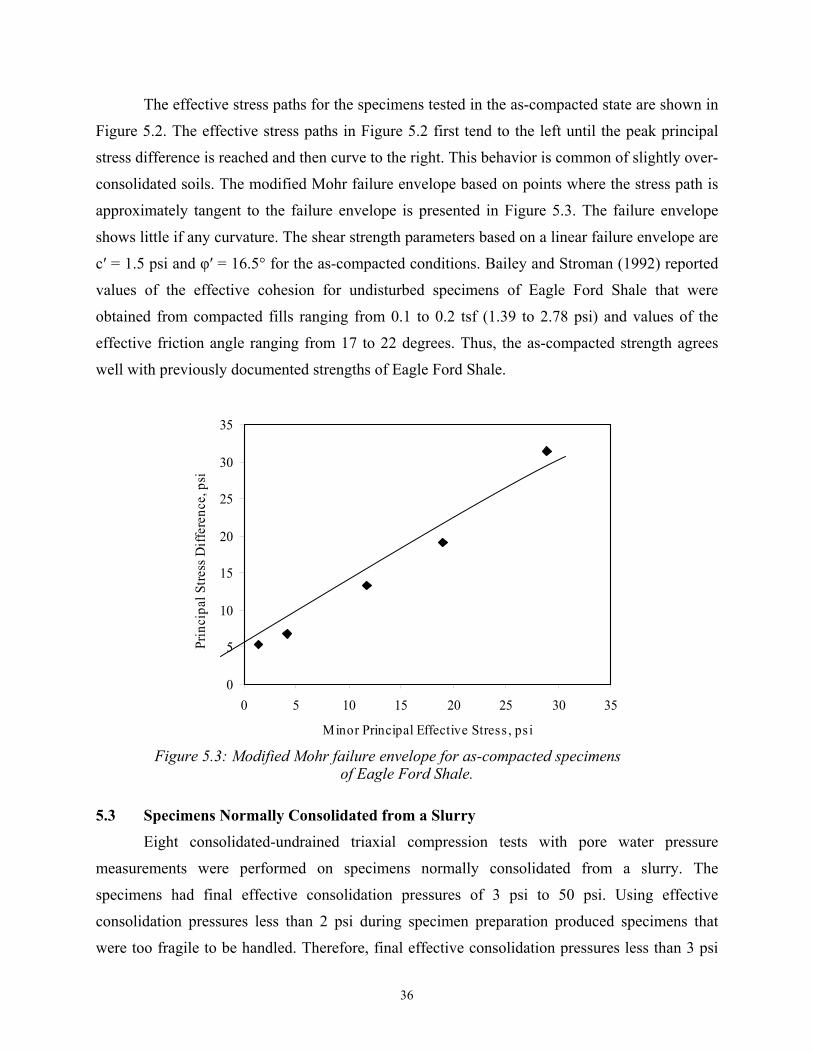
36
The effective stress paths for the specimens tested in the as-compacted state are shown in
Figure 5.2. The effective stress paths in Figure 5.2 first tend to the left until the peak principal
stress difference is reached and then curve to the right. This behavior is common of slightly over-
consolidated soils. The modified Mohr failure envelope based on points where the stress path is
approximately tangent to the failure envelope is presented in Figure 5.3. The failure envelope
shows little if any curvature. The shear strength parameters based on a linear failure envelope are
c′ = 1.5 psi and φ′ = 16.5° for the as-compacted conditions. Bailey and Stroman (1992) reported
values of the effective cohesion for undisturbed specimens of Eagle Ford Shale that were
obtained from compacted fills ranging from 0.1 to 0.2 tsf (1.39 to 2.78 psi) and values of the
effective friction angle ranging from 17 to 22 degrees. Thus, the as-compacted strength agrees
well with previously documented strengths of Eagle Ford Shale.
0
5
10
15
20
25
30
35
0 5 10 15 20 25 30 35
Minor Principal Effective Stress , ps i
Prin
cipa
l Stre
ss D
iffer
ence
, psi
Figure 5.3: Modified Mohr failure envelope for as-compacted specimens
of Eagle Ford Shale.
5.3 Specimens Normally Consolidated from a Slurry
Eight consolidated-undrained triaxial compression tests with pore water pressure
measurements were performed on specimens normally consolidated from a slurry. The
specimens had final effective consolidation pressures of 3 psi to 50 psi. Using effective
consolidation pressures less than 2 psi during specimen preparation produced specimens that
were too fragile to be handled. Therefore, final effective consolidation pressures less than 3 psi
37
were not used to avoid having the specimens being over-consolidated. The stress-strain curves
and the effective stress paths for the specimens normally consolidated from a slurry are shown in
Figures 5.4 And 5.5.
The stress-strain curves in Figure 5.4 show a decrease in stress after the peak principal
stress difference was reached. The points where the stress path was approximately tangent to the
failure envelope occurred at strains ranging from 1% to 10%. The decrease in stress following
failure was more noticeable in specimens consolidated to final effective stresses greater than 25
psi. The two specimens with effective consolidation pressures of 15 psi show very different
behavior; one specimen, 15 psi (2), showed a peak principal stress difference at a much lower
strain than the other specimen at the same effective consolidation pressure. Both specimens had
B-values of 0.98 prior to consolidation. From Figure 5.5 it can be seen that pore water pressures
increased in all specimens throughout shear, which is to be expected for normally consolidated
soils.
A modified Mohr failure envelope is drawn through the points of failure based on stress
path tangency in Figure 5.6. Although there is scatter in the data for the normally consolidated
specimens, it appears that the failure envelope is curved at low effective stresses. Had further
tests been possible at effective stresses less than 3 psi, the failure envelope would be expected to
pass through the origin. A value of zero cohesion is generally expected for normally consolidated
clay, unless the soil is cemented.
5.4 Specimens Subjected to Cyclic Wetting and Drying
Triaxial compression tests with pore water pressure measurements were conducted on
nine specimens after they were subjected to 20 cycles of wetting and drying. The specimens were
consolidated to final effective stresses ranging from 1 to 50 psi. Figures 5.7 and 5.8 present the
stress-strain curves and the effective stress paths for these specimens.
The stress-strain curves for specimens subjected to cyclic wetting and drying are
presented in Figure 5.7. The stress-strain curve for the specimen with an effective consolidation
pressure of 36 psi ends abruptly due to a loss in power during testing. The reduction in principal
stress difference with increasing axial strain is more pronounced for specimens with effective
confining stresses greater than or equal to 25 psi. However, the failure does not appear to be as
brittle-like as for the as-compacted specimens. Failure defined by the points where the effective
stress paths became approximately tangent to the failure envelope occurred at strains ranging
from 4% to 11%.
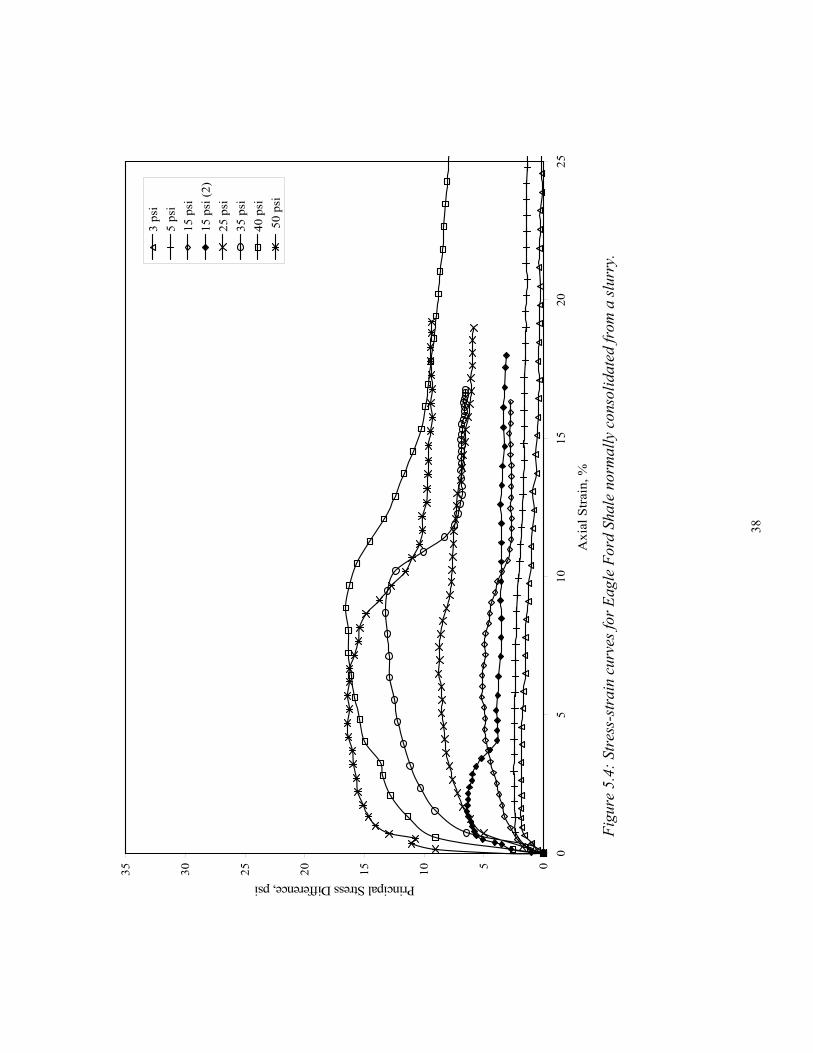
38
05101520253035
05
1015
2025
Axi
al S
trai
n, %
Principal Stress Difference, psi3
psi
5 ps
i15
psi
15 p
si (2
)25
psi
35 p
si40
psi
5
0 ps
i
Fi
gure
5.4
: Str
ess-
stra
in c
urve
s for
Eag
le F
ord
Shal
e no
rmal
ly c
onso
lidat
ed fr
om a
slur
ry.

39
05101520253035
05
1015
2025
3035
4045
5055
60
Effe
ctiv
e C
onfin
ing
Pres
sure
, psi
Principal Stress Difference, psi
3 ps
i5
psi
15 p
si15
psi
(2)
25 p
si35
psi
40 p
si50
psi
Fi
gure
5.5
: Mod
ified
Moh
r-C
oulo
mb
diag
ram
for n
orm
ally
con
solid
ated
spec
imen
s of E
agle
For
d Sh
ale.
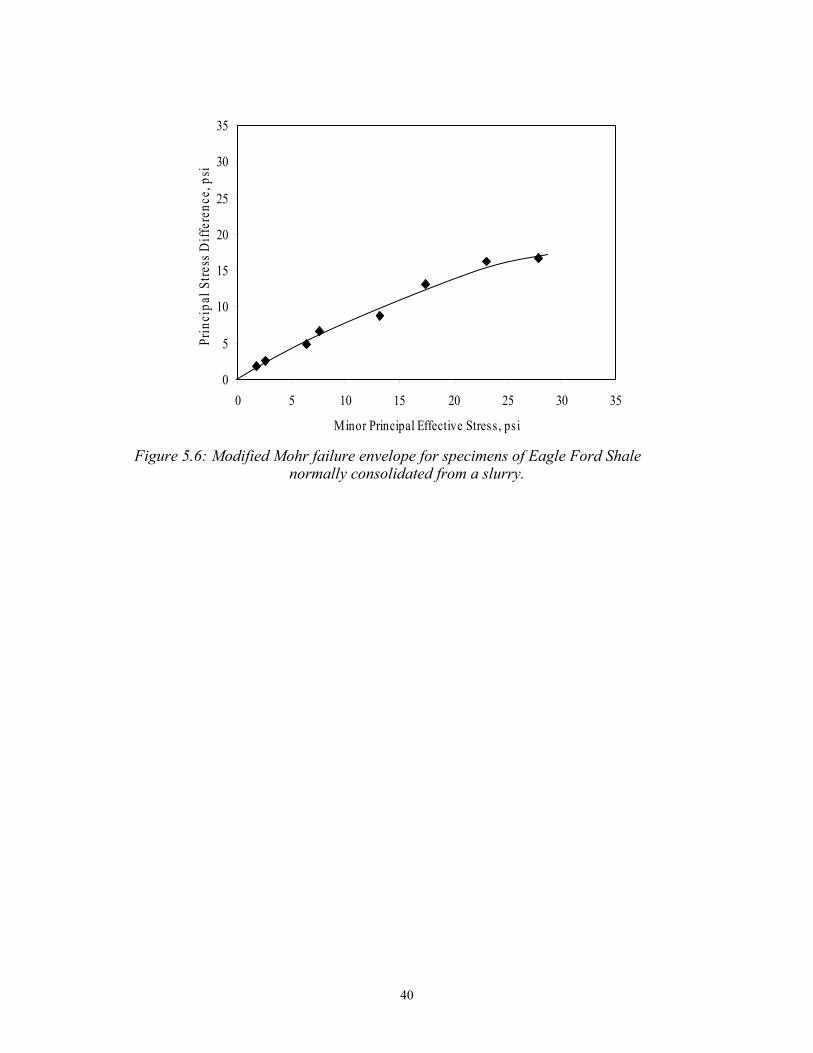
40
0
5
10
15
20
25
30
35
0 5 10 15 20 25 30 35
Minor Principal Effective Stress , psi
Prin
cipa
l Stre
ss D
iffer
ence
, psi
Figure 5.6: Modified Mohr failure envelope for specimens of Eagle Ford Shale
normally consolidated from a slurry.
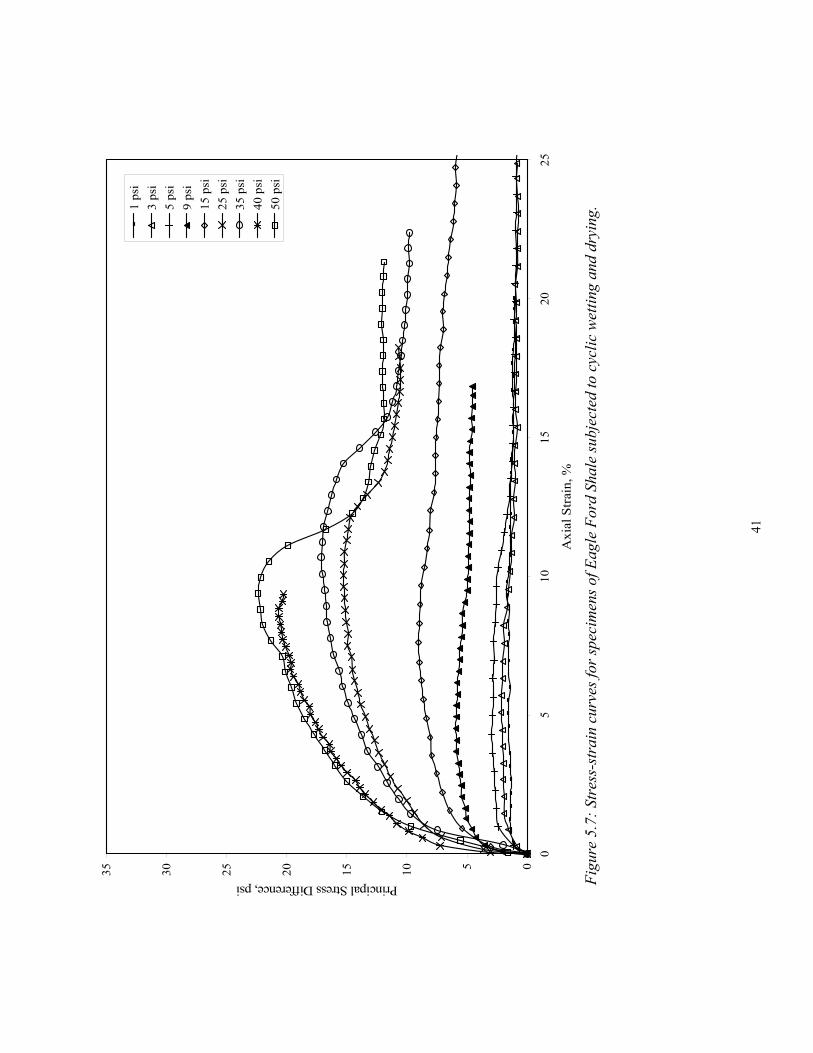
41
05101520253035
05
1015
2025
Axi
al S
train
, %
Principal Stress Difference, psi
1 ps
i3
psi
5 ps
i9
psi
15 p
si25
psi
35 p
si40
psi
50 p
si
Fi
gure
5.7
: Str
ess-
stra
in c
urve
s for
spec
imen
s of E
agle
For
d Sh
ale
subj
ecte
d to
cyc
lic w
ettin
g an
d dr
ying
.
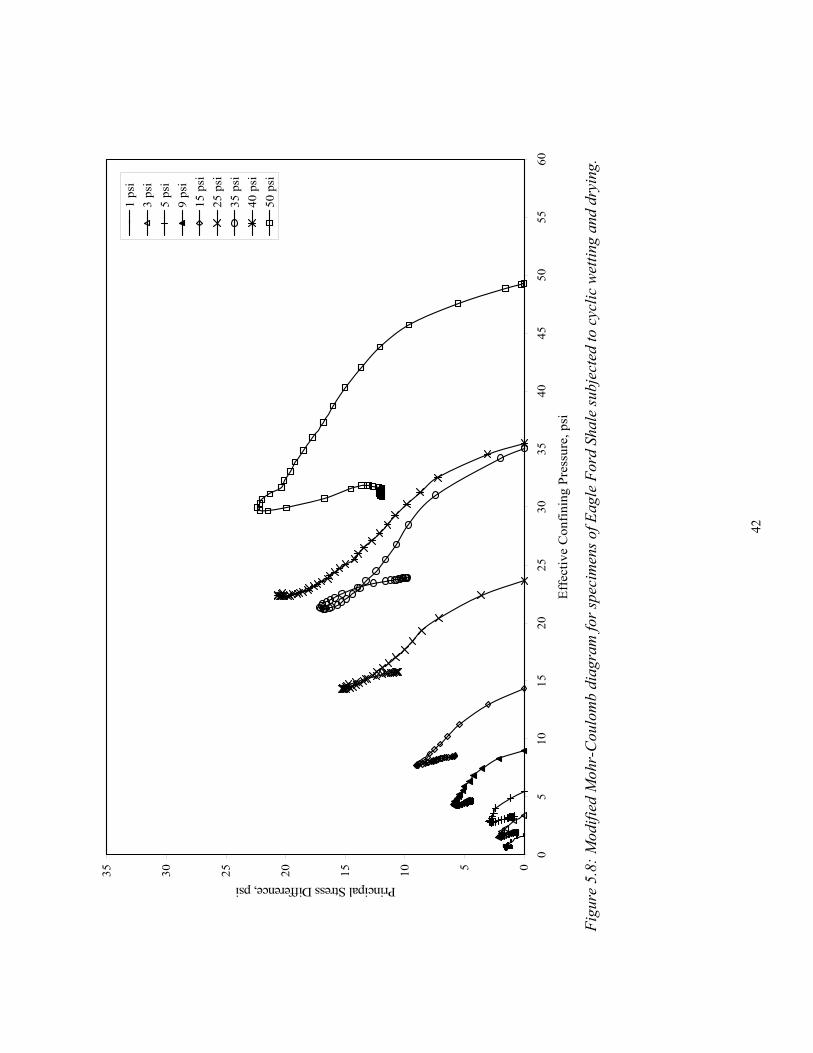
42
05101520253035
05
1015
2025
3035
4045
5055
60
Eff
ectiv
e C
onfi
ning
Pre
ssur
e, p
si
Principal Stress Difference, psi
1 ps
i3
psi
5 ps
i9
psi
15 p
si25
psi
35 p
si40
psi
50 p
si
Fi
gure
5.8
: Mod
ified
Moh
r-C
oulo
mb
diag
ram
for s
peci
men
s of E
agle
For
d Sh
ale
subj
ecte
d to
cyc
lic w
ettin
g an
d dr
ying
.
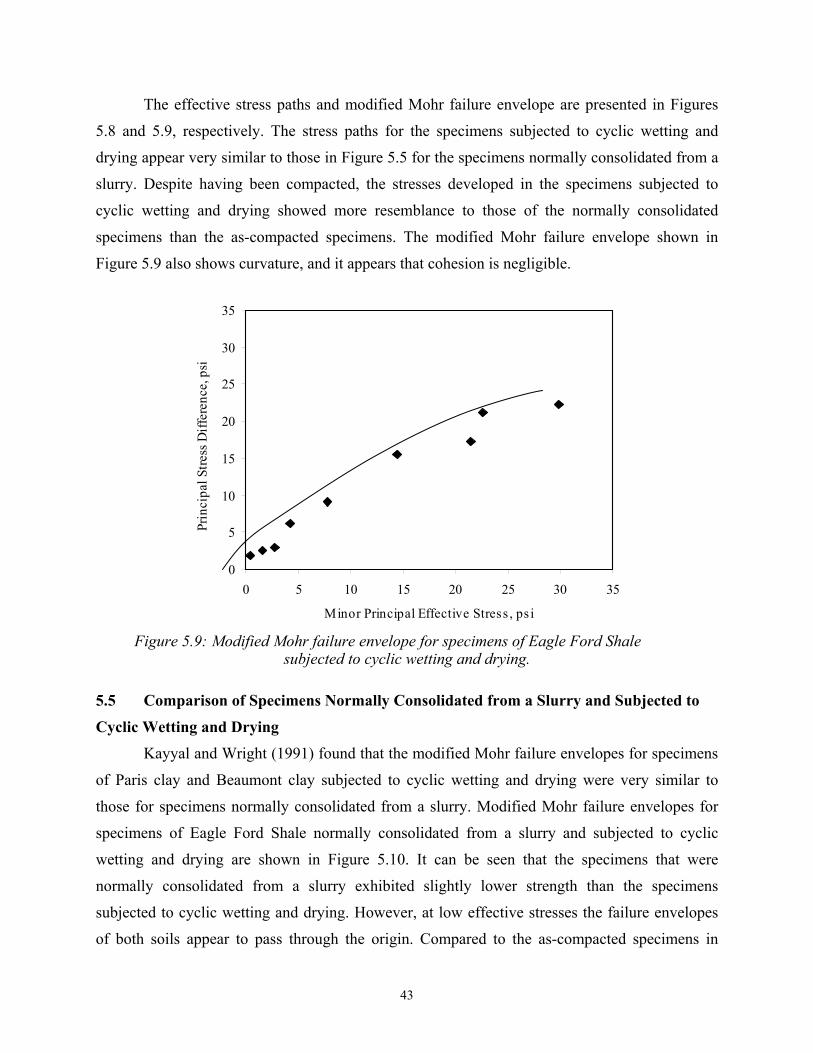
43
The effective stress paths and modified Mohr failure envelope are presented in Figures
5.8 and 5.9, respectively. The stress paths for the specimens subjected to cyclic wetting and
drying appear very similar to those in Figure 5.5 for the specimens normally consolidated from a
slurry. Despite having been compacted, the stresses developed in the specimens subjected to
cyclic wetting and drying showed more resemblance to those of the normally consolidated
specimens than the as-compacted specimens. The modified Mohr failure envelope shown in
Figure 5.9 also shows curvature, and it appears that cohesion is negligible.
0
5
10
15
20
25
30
35
0 5 10 15 20 25 30 35
Minor Principal Effective Stress , ps i
Prin
cipa
l Stre
ss D
iffer
ence
, psi
Figure 5.9: Modified Mohr failure envelope for specimens of Eagle Ford Shale
subjected to cyclic wetting and drying.
5.5 Comparison of Specimens Normally Consolidated from a Slurry and Subjected to
Cyclic Wetting and Drying
Kayyal and Wright (1991) found that the modified Mohr failure envelopes for specimens
of Paris clay and Beaumont clay subjected to cyclic wetting and drying were very similar to
those for specimens normally consolidated from a slurry. Modified Mohr failure envelopes for
specimens of Eagle Ford Shale normally consolidated from a slurry and subjected to cyclic
wetting and drying are shown in Figure 5.10. It can be seen that the specimens that were
normally consolidated from a slurry exhibited slightly lower strength than the specimens
subjected to cyclic wetting and drying. However, at low effective stresses the failure envelopes
of both soils appear to pass through the origin. Compared to the as-compacted specimens in
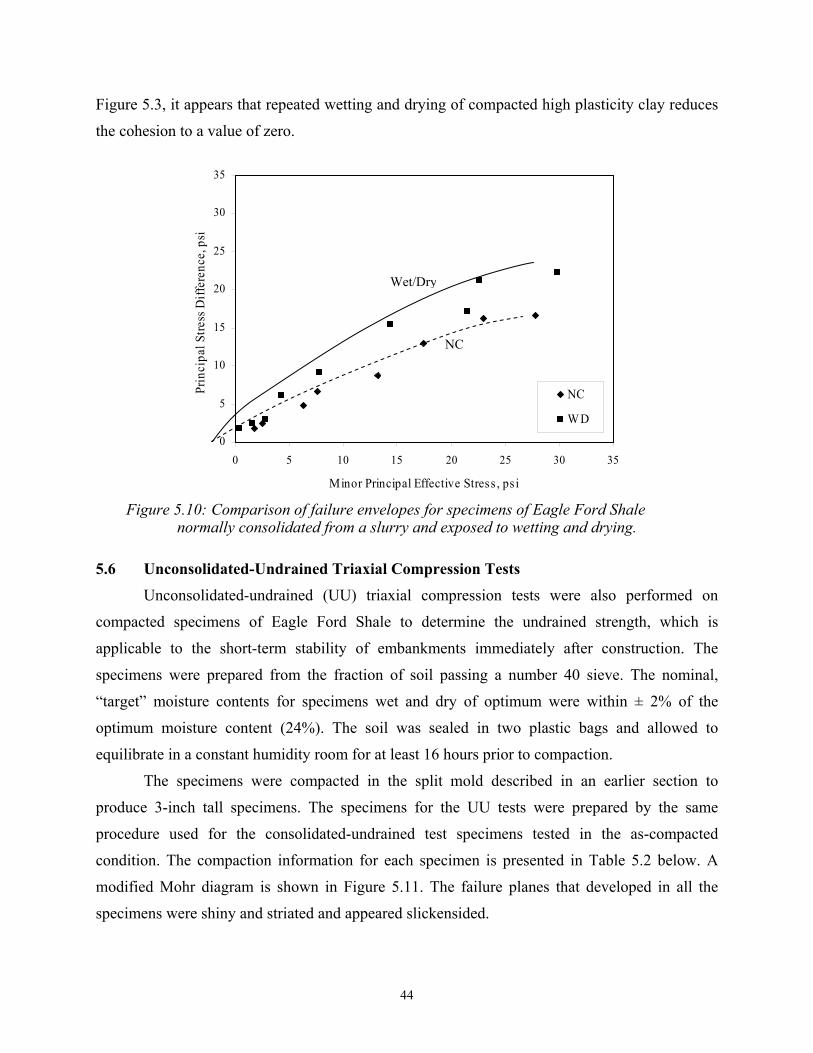
44
Figure 5.3, it appears that repeated wetting and drying of compacted high plasticity clay reduces
the cohesion to a value of zero.
0
5
10
15
20
25
30
35
0 5 10 15 20 25 30 35
Minor Principal Effective Stress , ps i
Prin
cipa
l Stre
ss D
iffer
ence
, psi
NC
WD
Figure 5.10: Comparison of failure envelopes for specimens of Eagle Ford Shale
normally consolidated from a slurry and exposed to wetting and drying.
5.6 Unconsolidated-Undrained Triaxial Compression Tests
Unconsolidated-undrained (UU) triaxial compression tests were also performed on
compacted specimens of Eagle Ford Shale to determine the undrained strength, which is
applicable to the short-term stability of embankments immediately after construction. The
specimens were prepared from the fraction of soil passing a number 40 sieve. The nominal,
“target” moisture contents for specimens wet and dry of optimum were within ± 2% of the
optimum moisture content (24%). The soil was sealed in two plastic bags and allowed to
equilibrate in a constant humidity room for at least 16 hours prior to compaction.
The specimens were compacted in the split mold described in an earlier section to
produce 3-inch tall specimens. The specimens for the UU tests were prepared by the same
procedure used for the consolidated-undrained test specimens tested in the as-compacted
condition. The compaction information for each specimen is presented in Table 5.2 below. A
modified Mohr diagram is shown in Figure 5.11. The failure planes that developed in all the
specimens were shiny and striated and appeared slickensided.
Wet/Dry
NC
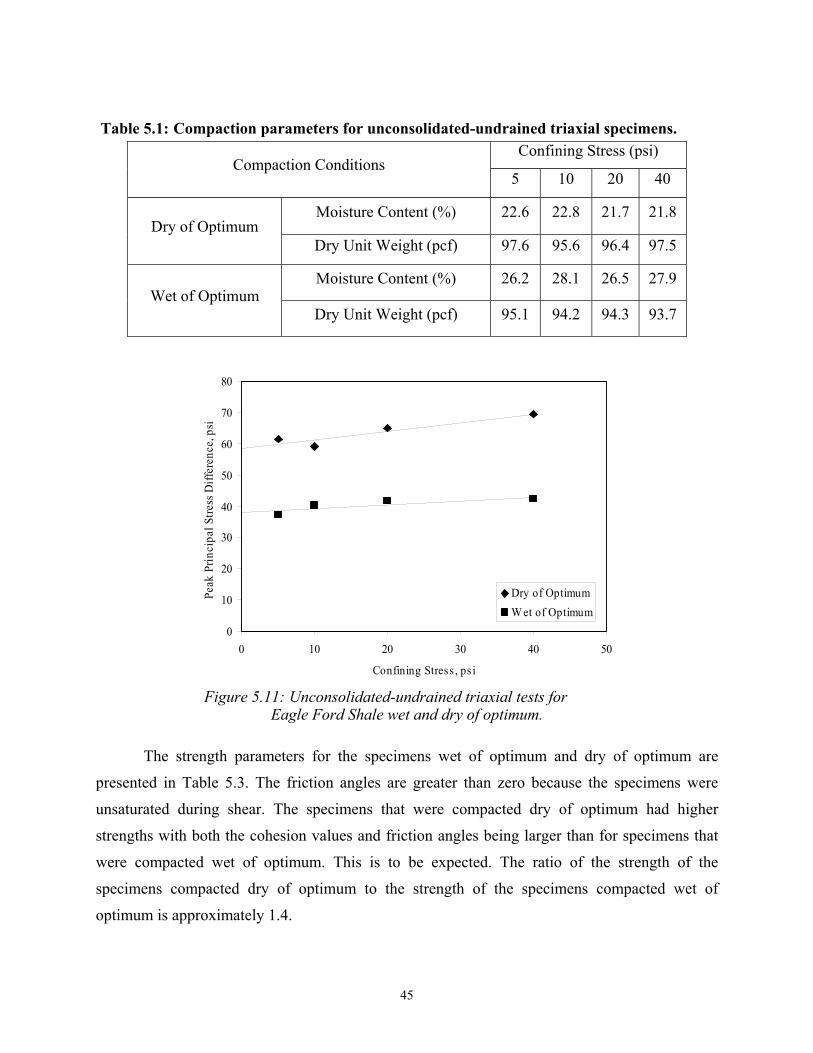
45
Table 5.1: Compaction parameters for unconsolidated-undrained triaxial specimens. Confining Stress (psi)
Compaction Conditions 5 10 20 40
Moisture Content (%) 22.6 22.8 21.7 21.8 Dry of Optimum
Dry Unit Weight (pcf) 97.6 95.6 96.4 97.5
Moisture Content (%) 26.2 28.1 26.5 27.9 Wet of Optimum
Dry Unit Weight (pcf) 95.1 94.2 94.3 93.7
0
10
20
30
40
50
60
70
80
0 10 20 30 40 50
Confining Stress , ps i
Peak
Prin
cipa
l Stre
ss D
iffer
ence
, psi
Dry of OptimumW et of Optimum
Figure 5.11: Unconsolidated-undrained triaxial tests for
Eagle Ford Shale wet and dry of optimum.
The strength parameters for the specimens wet of optimum and dry of optimum are
presented in Table 5.3. The friction angles are greater than zero because the specimens were
unsaturated during shear. The specimens that were compacted dry of optimum had higher
strengths with both the cohesion values and friction angles being larger than for specimens that
were compacted wet of optimum. This is to be expected. The ratio of the strength of the
specimens compacted dry of optimum to the strength of the specimens compacted wet of
optimum is approximately 1.4.
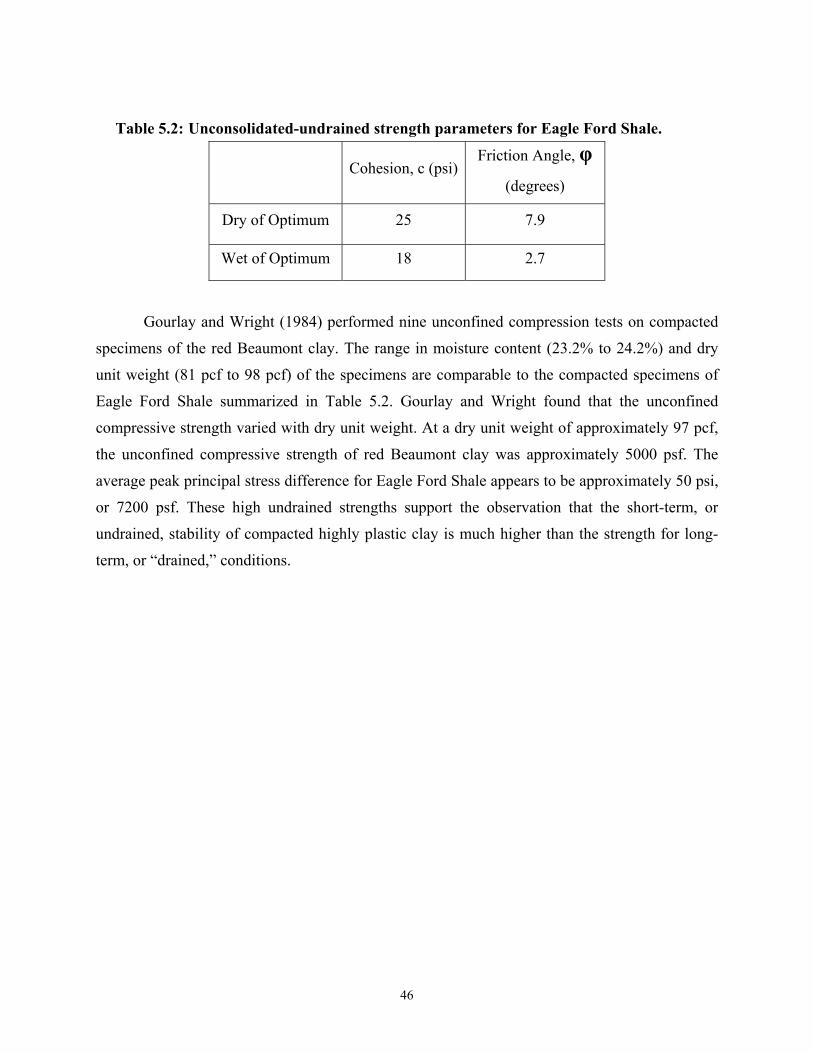
46
Table 5.2: Unconsolidated-undrained strength parameters for Eagle Ford Shale.
Cohesion, c (psi)Friction Angle, φ
(degrees)
Dry of Optimum 25 7.9
Wet of Optimum 18 2.7
Gourlay and Wright (1984) performed nine unconfined compression tests on compacted
specimens of the red Beaumont clay. The range in moisture content (23.2% to 24.2%) and dry
unit weight (81 pcf to 98 pcf) of the specimens are comparable to the compacted specimens of
Eagle Ford Shale summarized in Table 5.2. Gourlay and Wright found that the unconfined
compressive strength varied with dry unit weight. At a dry unit weight of approximately 97 pcf,
the unconfined compressive strength of red Beaumont clay was approximately 5000 psf. The
average peak principal stress difference for Eagle Ford Shale appears to be approximately 50 psi,
or 7200 psf. These high undrained strengths support the observation that the short-term, or
undrained, stability of compacted highly plastic clay is much higher than the strength for long-
term, or “drained,” conditions.
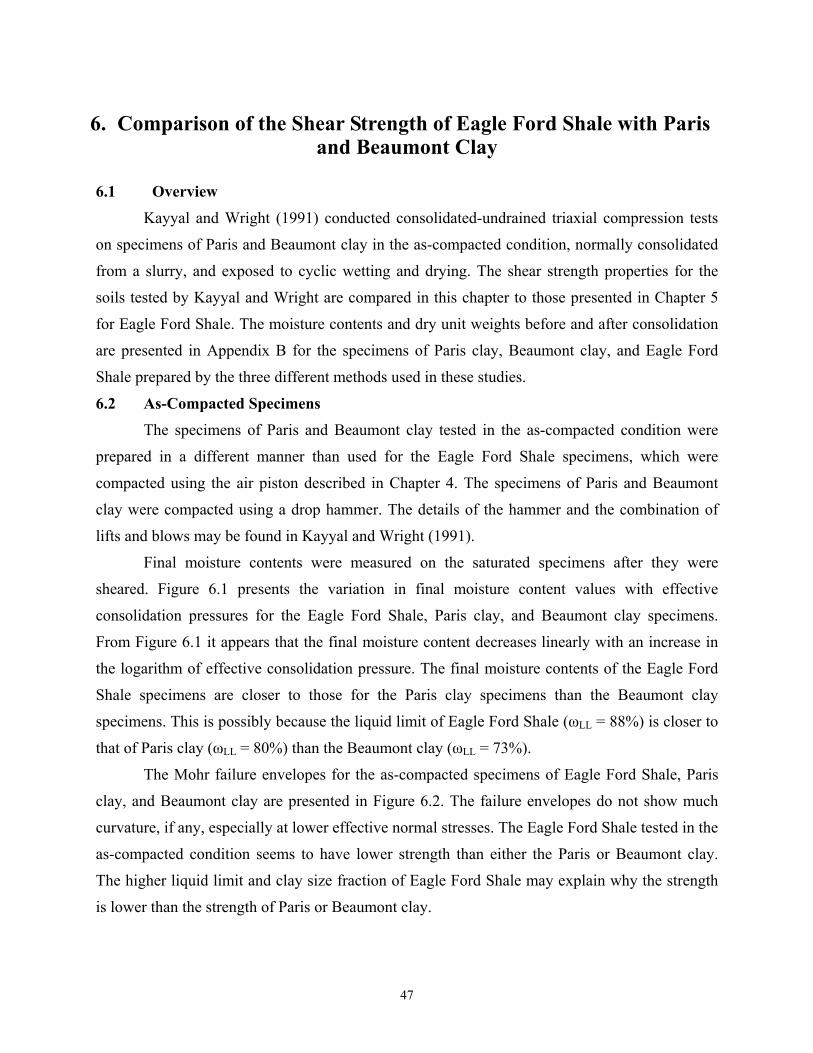
47
6. Comparison of the Shear Strength of Eagle Ford Shale with Paris and Beaumont Clay
6.1 Overview
Kayyal and Wright (1991) conducted consolidated-undrained triaxial compression tests
on specimens of Paris and Beaumont clay in the as-compacted condition, normally consolidated
from a slurry, and exposed to cyclic wetting and drying. The shear strength properties for the
soils tested by Kayyal and Wright are compared in this chapter to those presented in Chapter 5
for Eagle Ford Shale. The moisture contents and dry unit weights before and after consolidation
are presented in Appendix B for the specimens of Paris clay, Beaumont clay, and Eagle Ford
Shale prepared by the three different methods used in these studies.
6.2 As-Compacted Specimens
The specimens of Paris and Beaumont clay tested in the as-compacted condition were
prepared in a different manner than used for the Eagle Ford Shale specimens, which were
compacted using the air piston described in Chapter 4. The specimens of Paris and Beaumont
clay were compacted using a drop hammer. The details of the hammer and the combination of
lifts and blows may be found in Kayyal and Wright (1991).
Final moisture contents were measured on the saturated specimens after they were
sheared. Figure 6.1 presents the variation in final moisture content values with effective
consolidation pressures for the Eagle Ford Shale, Paris clay, and Beaumont clay specimens.
From Figure 6.1 it appears that the final moisture content decreases linearly with an increase in
the logarithm of effective consolidation pressure. The final moisture contents of the Eagle Ford
Shale specimens are closer to those for the Paris clay specimens than the Beaumont clay
specimens. This is possibly because the liquid limit of Eagle Ford Shale (ωLL = 88%) is closer to
that of Paris clay (ωLL = 80%) than the Beaumont clay (ωLL = 73%).
The Mohr failure envelopes for the as-compacted specimens of Eagle Ford Shale, Paris
clay, and Beaumont clay are presented in Figure 6.2. The failure envelopes do not show much
curvature, if any, especially at lower effective normal stresses. The Eagle Ford Shale tested in the
as-compacted condition seems to have lower strength than either the Paris or Beaumont clay.
The higher liquid limit and clay size fraction of Eagle Ford Shale may explain why the strength
is lower than the strength of Paris or Beaumont clay.
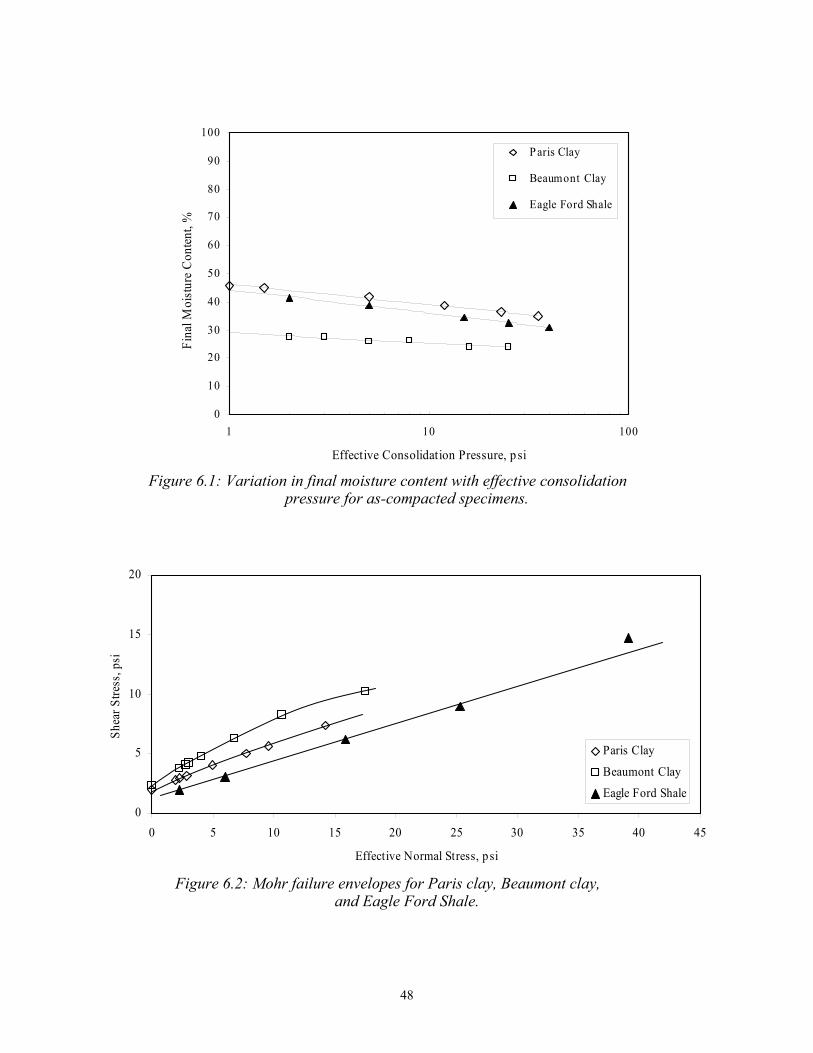
48
0
10
20
30
40
50
60
70
80
90
100
1 10 100
Effective Consolidation Pressure, p si
Fina
l Moi
stur
e C
onte
nt, %
P aris Clay
Beaumont Clay
Eagle Ford Shale
Figure 6.1: Variation in final moisture content with effective consolidation
pressure for as-compacted specimens.
0
5
10
15
20
0 5 10 15 20 25 30 35 40 45
Effective Normal Stress, psi
Shea
r Stre
ss, p
si
Paris Clay
Beaumont Clay
Eagle Ford Shale
Figure 6.2: Mohr failure envelopes for Paris clay, Beaumont clay,
and Eagle Ford Shale.
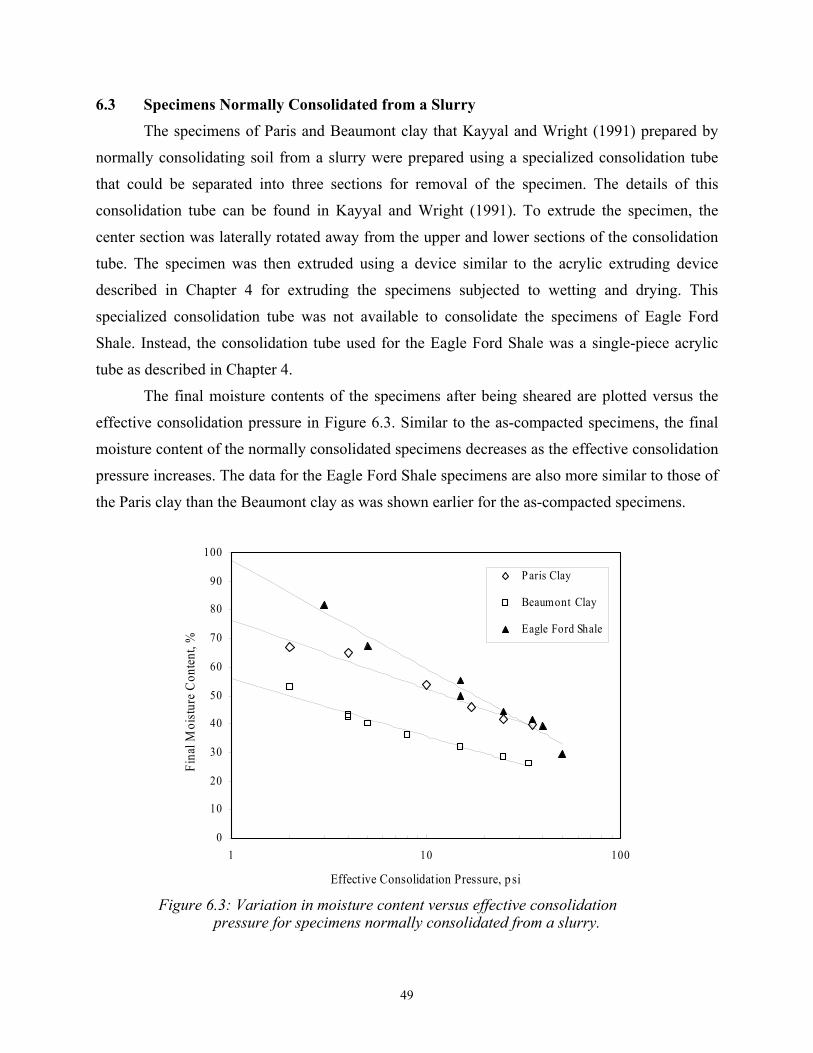
49
6.3 Specimens Normally Consolidated from a Slurry
The specimens of Paris and Beaumont clay that Kayyal and Wright (1991) prepared by
normally consolidating soil from a slurry were prepared using a specialized consolidation tube
that could be separated into three sections for removal of the specimen. The details of this
consolidation tube can be found in Kayyal and Wright (1991). To extrude the specimen, the
center section was laterally rotated away from the upper and lower sections of the consolidation
tube. The specimen was then extruded using a device similar to the acrylic extruding device
described in Chapter 4 for extruding the specimens subjected to wetting and drying. This
specialized consolidation tube was not available to consolidate the specimens of Eagle Ford
Shale. Instead, the consolidation tube used for the Eagle Ford Shale was a single-piece acrylic
tube as described in Chapter 4.
The final moisture contents of the specimens after being sheared are plotted versus the
effective consolidation pressure in Figure 6.3. Similar to the as-compacted specimens, the final
moisture content of the normally consolidated specimens decreases as the effective consolidation
pressure increases. The data for the Eagle Ford Shale specimens are also more similar to those of
the Paris clay than the Beaumont clay as was shown earlier for the as-compacted specimens.
0
10
20
30
40
50
60
70
80
90
100
1 10 100
Effective Consolidation Pressure, p si
Fina
l Moi
stur
e C
onte
nt, %
P aris Clay
Beaumont Clay
Eagle Ford Shale
Figure 6.3: Variation in moisture content versus effective consolidation
pressure for specimens normally consolidated from a slurry.
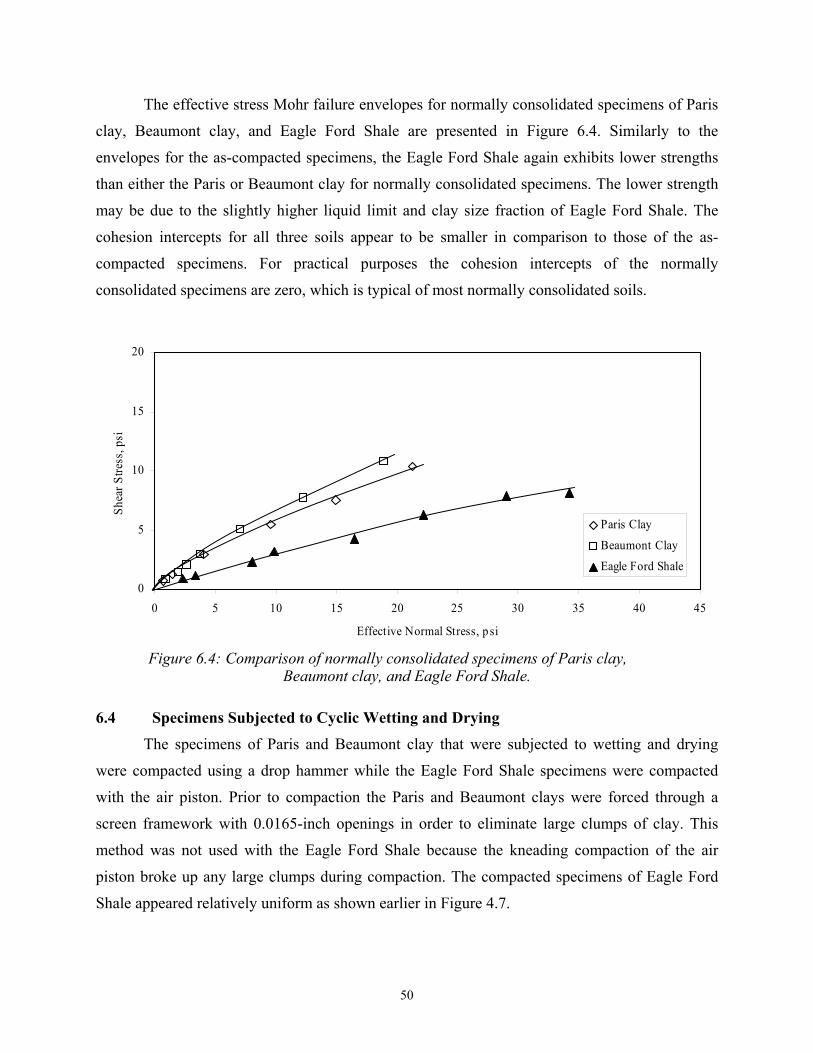
50
The effective stress Mohr failure envelopes for normally consolidated specimens of Paris
clay, Beaumont clay, and Eagle Ford Shale are presented in Figure 6.4. Similarly to the
envelopes for the as-compacted specimens, the Eagle Ford Shale again exhibits lower strengths
than either the Paris or Beaumont clay for normally consolidated specimens. The lower strength
may be due to the slightly higher liquid limit and clay size fraction of Eagle Ford Shale. The
cohesion intercepts for all three soils appear to be smaller in comparison to those of the as-
compacted specimens. For practical purposes the cohesion intercepts of the normally
consolidated specimens are zero, which is typical of most normally consolidated soils.
0
5
10
15
20
0 5 10 15 20 25 30 35 40 45
Effective Normal Stress, p si
Shea
r Stre
ss, p
si
Paris Clay
Beaumont Clay
Eagle Ford Shale
Figure 6.4: Comparison of normally consolidated specimens of Paris clay,
Beaumont clay, and Eagle Ford Shale.
6.4 Specimens Subjected to Cyclic Wetting and Drying
The specimens of Paris and Beaumont clay that were subjected to wetting and drying
were compacted using a drop hammer while the Eagle Ford Shale specimens were compacted
with the air piston. Prior to compaction the Paris and Beaumont clays were forced through a
screen framework with 0.0165-inch openings in order to eliminate large clumps of clay. This
method was not used with the Eagle Ford Shale because the kneading compaction of the air
piston broke up any large clumps during compaction. The compacted specimens of Eagle Ford
Shale appeared relatively uniform as shown earlier in Figure 4.7.
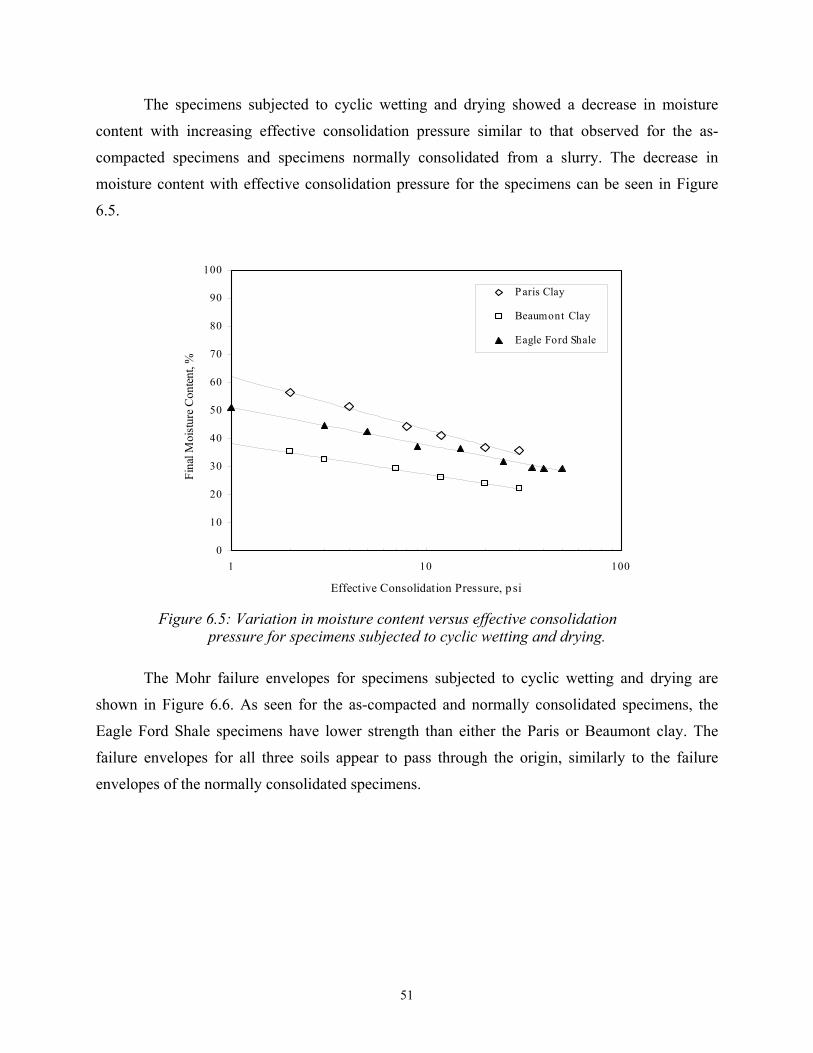
51
The specimens subjected to cyclic wetting and drying showed a decrease in moisture
content with increasing effective consolidation pressure similar to that observed for the as-
compacted specimens and specimens normally consolidated from a slurry. The decrease in
moisture content with effective consolidation pressure for the specimens can be seen in Figure
6.5.
0
10
20
30
40
50
60
70
80
90
100
1 10 100
Effective Consolidation Pressure, p si
Fina
l Moi
stur
e C
onte
nt, %
P aris Clay
Beaumont Clay
Eagle Ford Shale
Figure 6.5: Variation in moisture content versus effective consolidation
pressure for specimens subjected to cyclic wetting and drying.
The Mohr failure envelopes for specimens subjected to cyclic wetting and drying are
shown in Figure 6.6. As seen for the as-compacted and normally consolidated specimens, the
Eagle Ford Shale specimens have lower strength than either the Paris or Beaumont clay. The
failure envelopes for all three soils appear to pass through the origin, similarly to the failure
envelopes of the normally consolidated specimens.
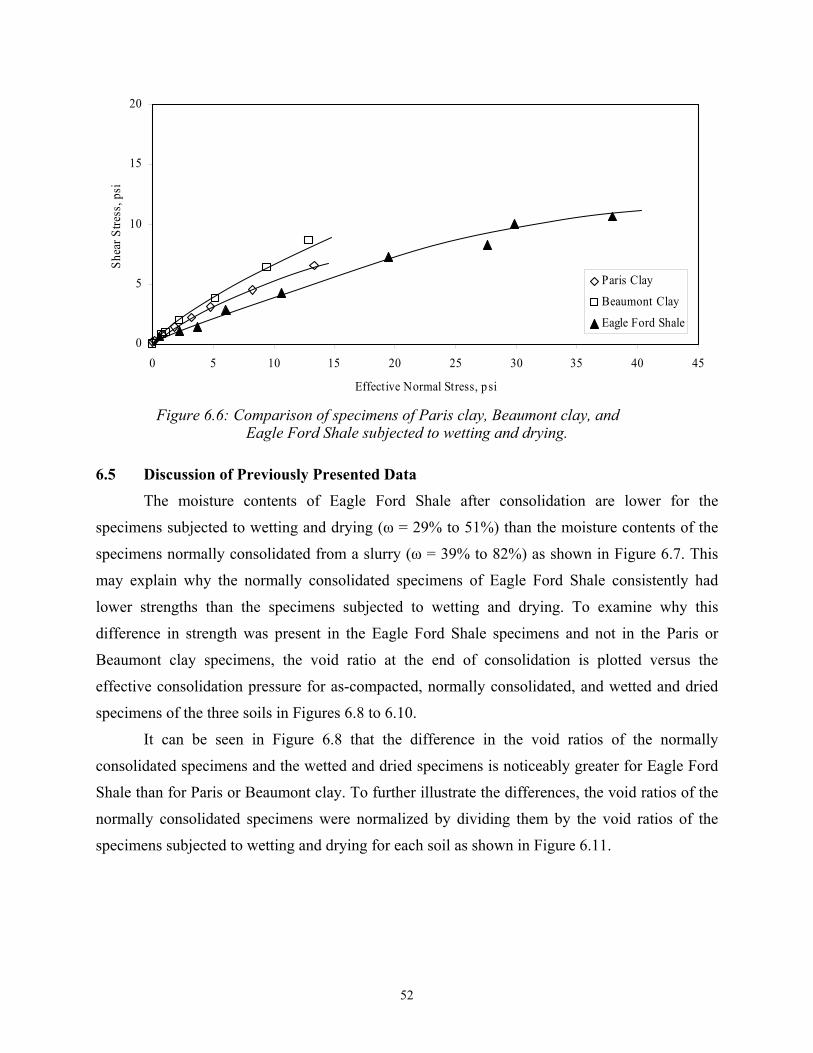
52
0
5
10
15
20
0 5 10 15 20 25 30 35 40 45
Effective Normal Stress, p si
Shea
r Stre
ss, p
si
Paris Clay
Beaumont Clay
Eagle Ford Shale
Figure 6.6: Comparison of specimens of Paris clay, Beaumont clay, and
Eagle Ford Shale subjected to wetting and drying.
6.5 Discussion of Previously Presented Data
The moisture contents of Eagle Ford Shale after consolidation are lower for the
specimens subjected to wetting and drying (ω = 29% to 51%) than the moisture contents of the
specimens normally consolidated from a slurry (ω = 39% to 82%) as shown in Figure 6.7. This
may explain why the normally consolidated specimens of Eagle Ford Shale consistently had
lower strengths than the specimens subjected to wetting and drying. To examine why this
difference in strength was present in the Eagle Ford Shale specimens and not in the Paris or
Beaumont clay specimens, the void ratio at the end of consolidation is plotted versus the
effective consolidation pressure for as-compacted, normally consolidated, and wetted and dried
specimens of the three soils in Figures 6.8 to 6.10.
It can be seen in Figure 6.8 that the difference in the void ratios of the normally
consolidated specimens and the wetted and dried specimens is noticeably greater for Eagle Ford
Shale than for Paris or Beaumont clay. To further illustrate the differences, the void ratios of the
normally consolidated specimens were normalized by dividing them by the void ratios of the
specimens subjected to wetting and drying for each soil as shown in Figure 6.11.
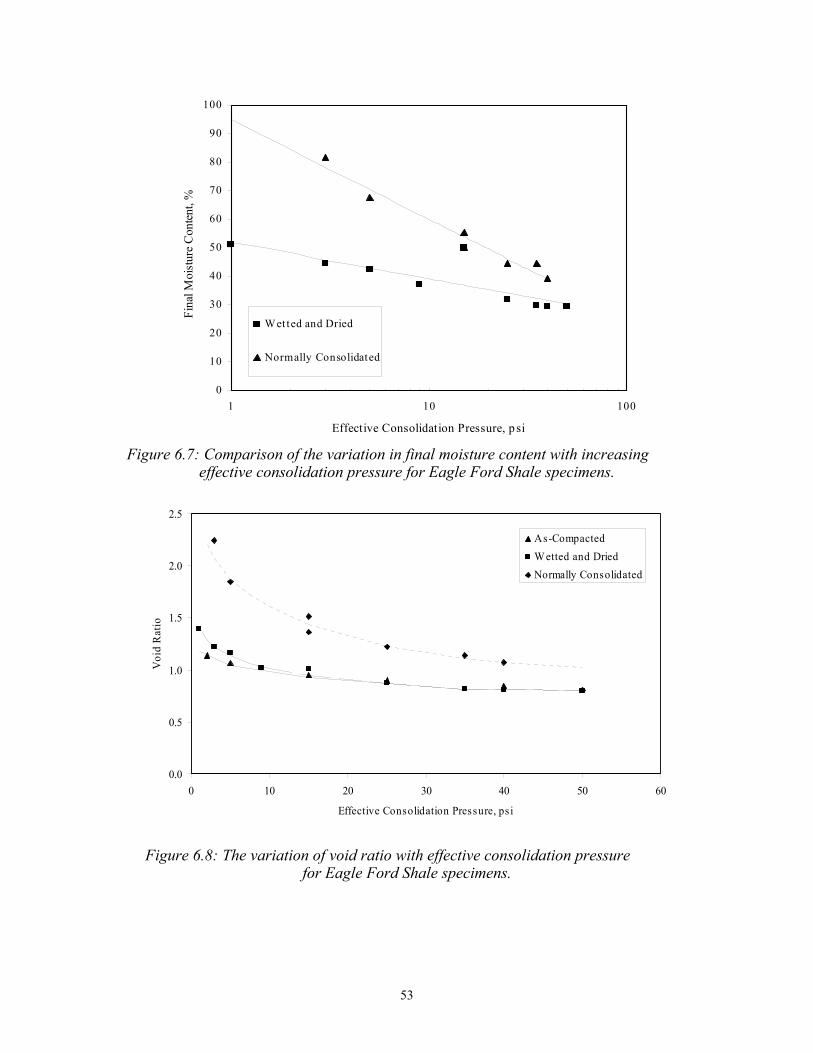
53
0
10
20
30
40
50
60
70
80
90
100
1 10 100
Effective Consolidation Pressure, p si
Fina
l Moi
stur
e C
onte
nt, %
Wet ted and Dried
Normally Consolidated
Figure 6.7: Comparison of the variation in final moisture content with increasing
effective consolidation pressure for Eagle Ford Shale specimens.
0.0
0.5
1.0
1.5
2.0
2.5
0 10 20 30 40 50 60
Effective Consolidation Pressure, ps i
Voi
d R
atio
As-CompactedW etted and DriedNormally Consolidated
Figure 6.8: The variation of void ratio with effective consolidation pressure for Eagle Ford Shale specimens.
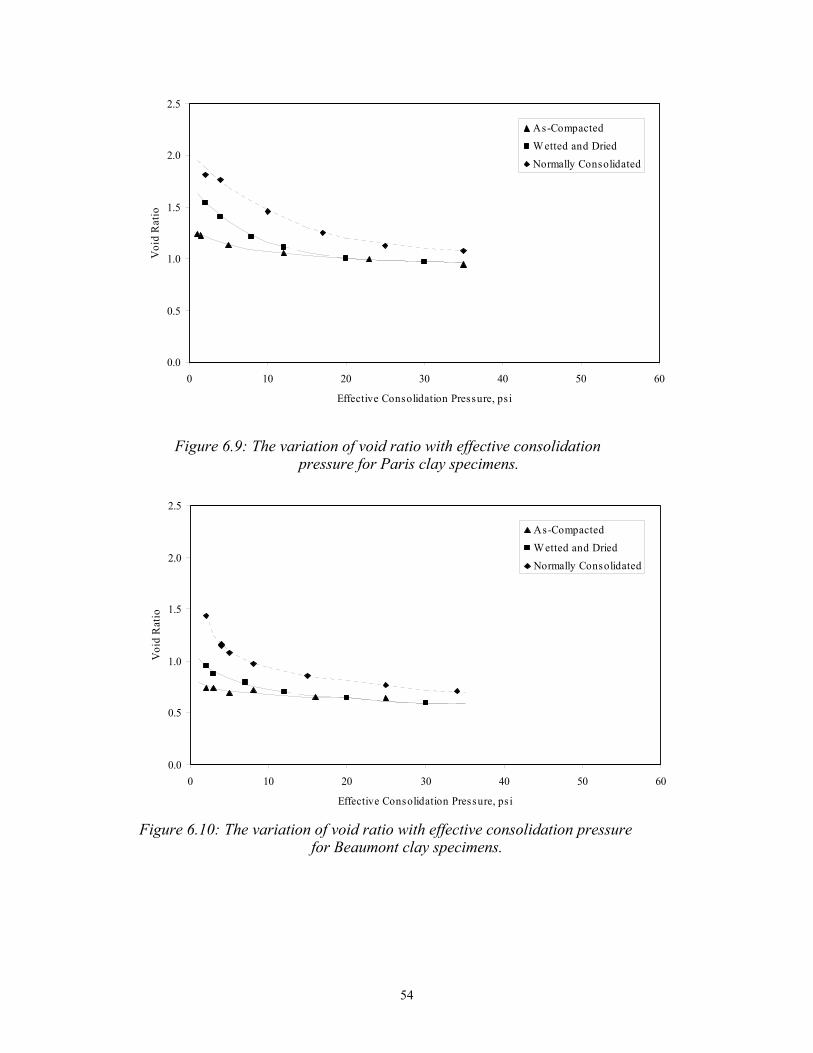
54
0.0
0.5
1.0
1.5
2.0
2.5
0 10 20 30 40 50 60
Effective Consolidation Pressure, ps i
Voi
d R
atio
As-CompactedWetted and DriedNormally Consolidated
Figure 6.9: The variation of void ratio with effective consolidation pressure for Paris clay specimens.
0.0
0.5
1.0
1.5
2.0
2.5
0 10 20 30 40 50 60
Effective Consolidation Pressure, ps i
Voi
d R
atio
As-CompactedWetted and DriedNormally Consolidated
Figure 6.10: The variation of void ratio with effective consolidation pressure
for Beaumont clay specimens.
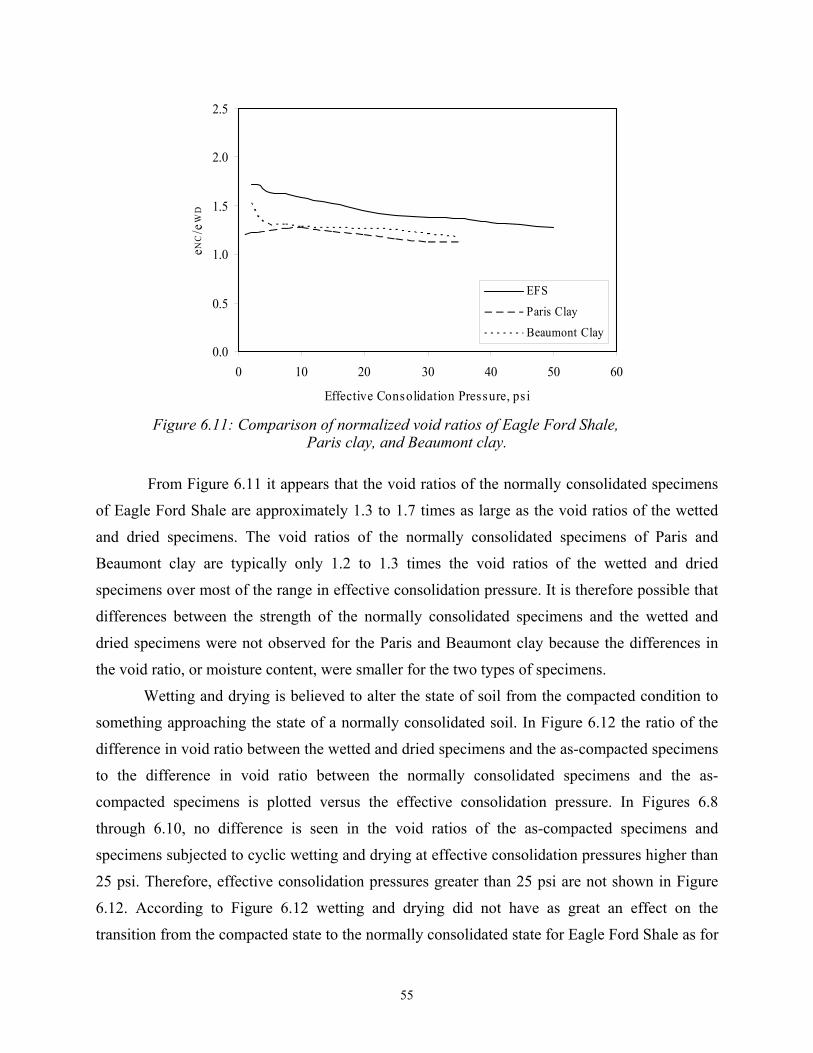
55
0.0
0.5
1.0
1.5
2.0
2.5
0 10 20 30 40 50 60
Effective Consolidation Pressure, ps i
eNC
/eW
D
EFS
Paris Clay
Beaumont Clay
Figure 6.11: Comparison of normalized void ratios of Eagle Ford Shale,
Paris clay, and Beaumont clay.
From Figure 6.11 it appears that the void ratios of the normally consolidated specimens
of Eagle Ford Shale are approximately 1.3 to 1.7 times as large as the void ratios of the wetted
and dried specimens. The void ratios of the normally consolidated specimens of Paris and
Beaumont clay are typically only 1.2 to 1.3 times the void ratios of the wetted and dried
specimens over most of the range in effective consolidation pressure. It is therefore possible that
differences between the strength of the normally consolidated specimens and the wetted and
dried specimens were not observed for the Paris and Beaumont clay because the differences in
the void ratio, or moisture content, were smaller for the two types of specimens.
Wetting and drying is believed to alter the state of soil from the compacted condition to
something approaching the state of a normally consolidated soil. In Figure 6.12 the ratio of the
difference in void ratio between the wetted and dried specimens and the as-compacted specimens
to the difference in void ratio between the normally consolidated specimens and the as-
compacted specimens is plotted versus the effective consolidation pressure. In Figures 6.8
through 6.10, no difference is seen in the void ratios of the as-compacted specimens and
specimens subjected to cyclic wetting and drying at effective consolidation pressures higher than
25 psi. Therefore, effective consolidation pressures greater than 25 psi are not shown in Figure
6.12. According to Figure 6.12 wetting and drying did not have as great an effect on the
transition from the compacted state to the normally consolidated state for Eagle Ford Shale as for
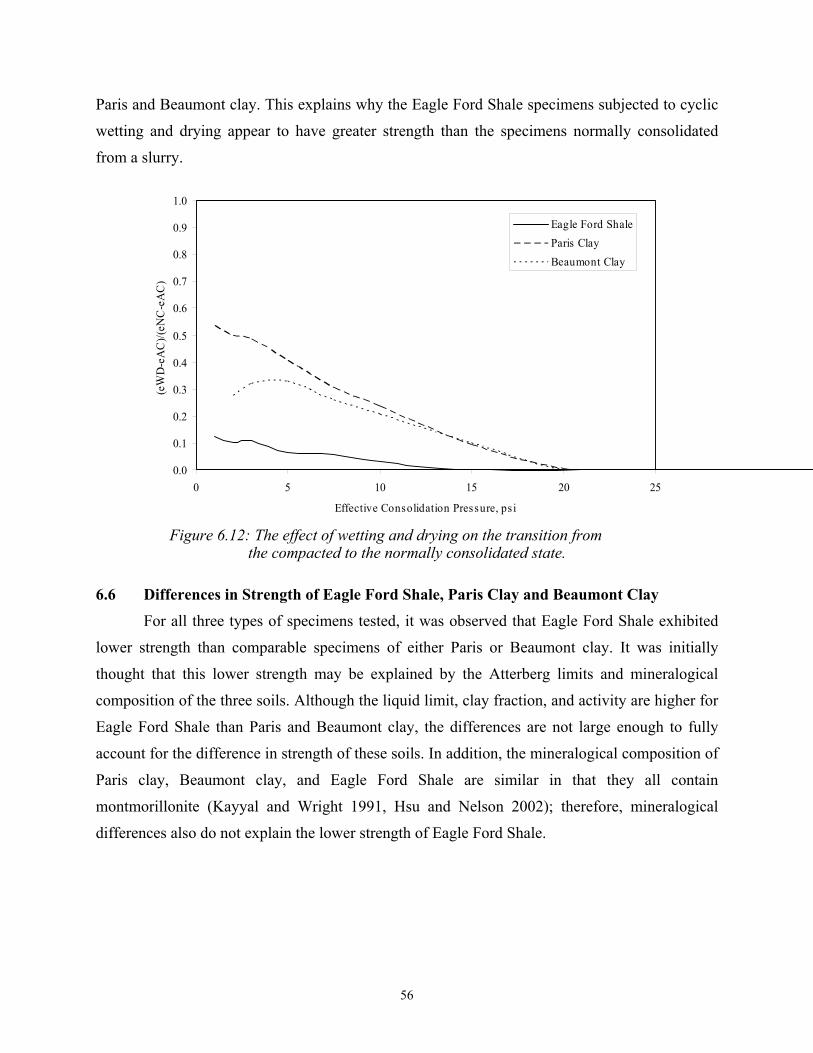
56
Paris and Beaumont clay. This explains why the Eagle Ford Shale specimens subjected to cyclic
wetting and drying appear to have greater strength than the specimens normally consolidated
from a slurry.
0.0
0.1
0.2
0.3
0.4
0.5
0.6
0.7
0.8
0.9
1.0
0 5 10 15 20 25
Effective Consolidation Pressure, psi
(eW
D-e
AC
)/(eN
C-e
AC
)
Eagle Ford ShaleParis ClayBeaumont Clay
Figure 6.12: The effect of wetting and drying on the transition from
the compacted to the normally consolidated state.
6.6 Differences in Strength of Eagle Ford Shale, Paris Clay and Beaumont Clay
For all three types of specimens tested, it was observed that Eagle Ford Shale exhibited
lower strength than comparable specimens of either Paris or Beaumont clay. It was initially
thought that this lower strength may be explained by the Atterberg limits and mineralogical
composition of the three soils. Although the liquid limit, clay fraction, and activity are higher for
Eagle Ford Shale than Paris and Beaumont clay, the differences are not large enough to fully
account for the difference in strength of these soils. In addition, the mineralogical composition of
Paris clay, Beaumont clay, and Eagle Ford Shale are similar in that they all contain
montmorillonite (Kayyal and Wright 1991, Hsu and Nelson 2002); therefore, mineralogical
differences also do not explain the lower strength of Eagle Ford Shale.
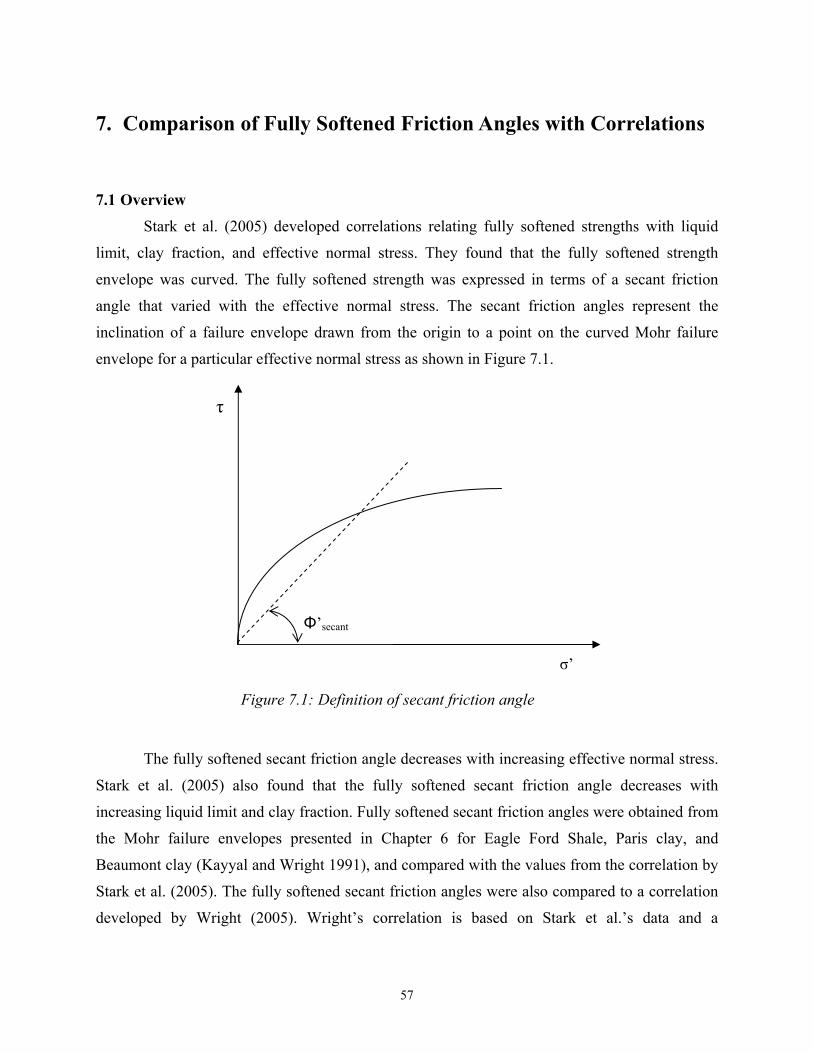
57
7. Comparison of Fully Softened Friction Angles with Correlations
7.1 Overview
Stark et al. (2005) developed correlations relating fully softened strengths with liquid
limit, clay fraction, and effective normal stress. They found that the fully softened strength
envelope was curved. The fully softened strength was expressed in terms of a secant friction
angle that varied with the effective normal stress. The secant friction angles represent the
inclination of a failure envelope drawn from the origin to a point on the curved Mohr failure
envelope for a particular effective normal stress as shown in Figure 7.1.
Figure 7.1: Definition of secant friction angle
The fully softened secant friction angle decreases with increasing effective normal stress.
Stark et al. (2005) also found that the fully softened secant friction angle decreases with
increasing liquid limit and clay fraction. Fully softened secant friction angles were obtained from
the Mohr failure envelopes presented in Chapter 6 for Eagle Ford Shale, Paris clay, and
Beaumont clay (Kayyal and Wright 1991), and compared with the values from the correlation by
Stark et al. (2005). The fully softened secant friction angles were also compared to a correlation
developed by Wright (2005). Wright’s correlation is based on Stark et al.’s data and a
Φ’secant
σ’
τ
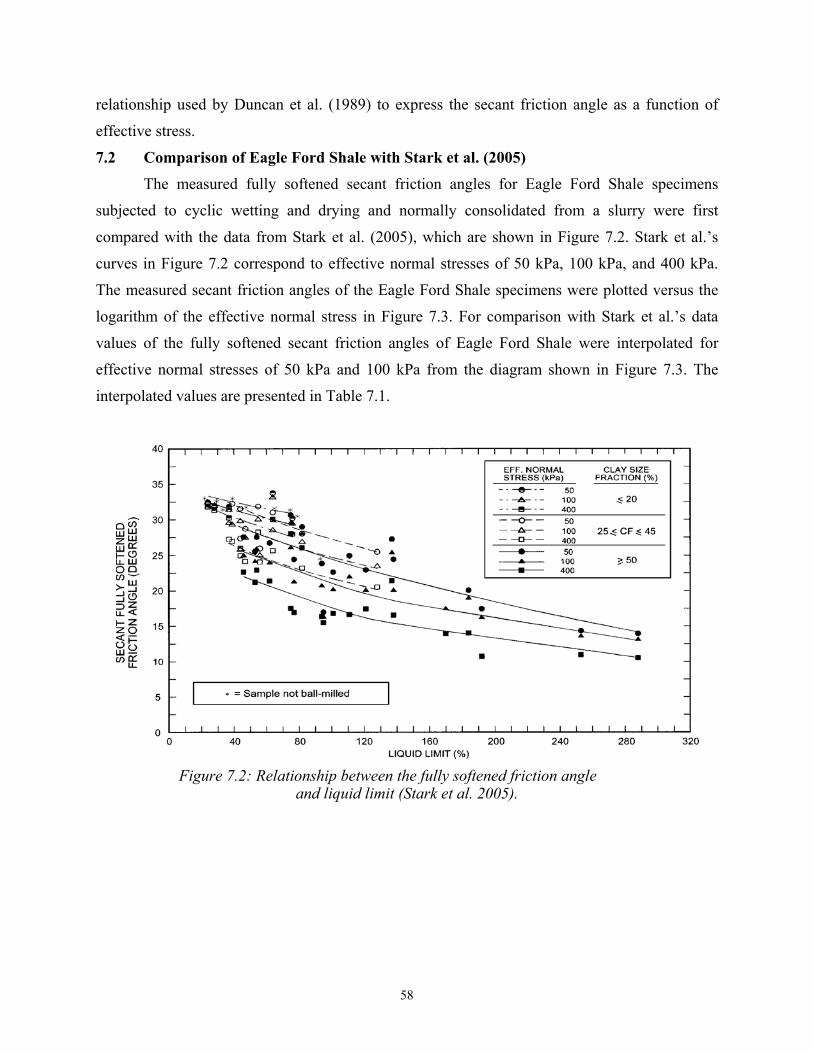
58
relationship used by Duncan et al. (1989) to express the secant friction angle as a function of
effective stress.
7.2 Comparison of Eagle Ford Shale with Stark et al. (2005)
The measured fully softened secant friction angles for Eagle Ford Shale specimens
subjected to cyclic wetting and drying and normally consolidated from a slurry were first
compared with the data from Stark et al. (2005), which are shown in Figure 7.2. Stark et al.’s
curves in Figure 7.2 correspond to effective normal stresses of 50 kPa, 100 kPa, and 400 kPa.
The measured secant friction angles of the Eagle Ford Shale specimens were plotted versus the
logarithm of the effective normal stress in Figure 7.3. For comparison with Stark et al.’s data
values of the fully softened secant friction angles of Eagle Ford Shale were interpolated for
effective normal stresses of 50 kPa and 100 kPa from the diagram shown in Figure 7.3. The
interpolated values are presented in Table 7.1.
Figure 7.2: Relationship between the fully softened friction angle
and liquid limit (Stark et al. 2005).
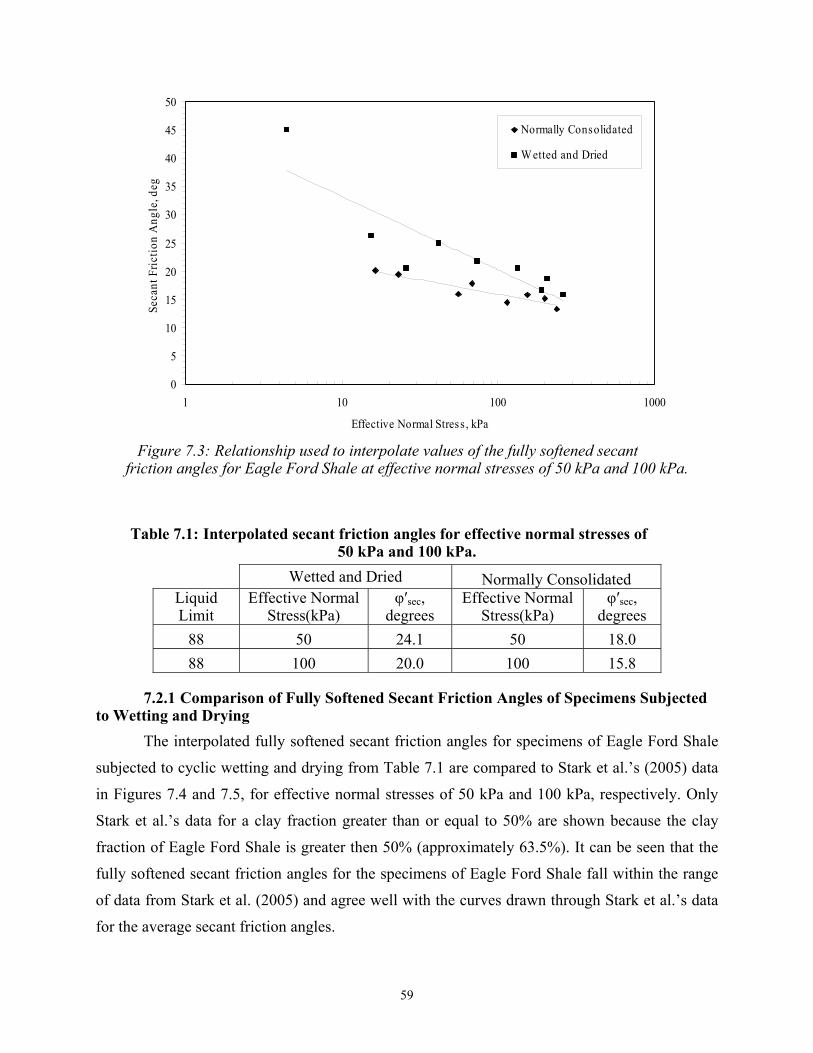
59
0
5
10
15
20
25
30
35
40
45
50
1 10 100 1000
Effective Normal Stress , kPa
Seca
nt F
rictio
n A
ngle
, deg
Normally Consolidated
Wetted and Dried
Figure 7.3: Relationship used to interpolate values of the fully softened secant
friction angles for Eagle Ford Shale at effective normal stresses of 50 kPa and 100 kPa.
Table 7.1: Interpolated secant friction angles for effective normal stresses of 50 kPa and 100 kPa.
Wetted and Dried Normally Consolidated Liquid Limit
Effective Normal Stress(kPa)
φ′sec, degrees
Effective Normal Stress(kPa)
φ′sec, degrees
88 50 24.1 50 18.0 88 100 20.0 100 15.8
7.2.1 Comparison of Fully Softened Secant Friction Angles of Specimens Subjected to Wetting and Drying
The interpolated fully softened secant friction angles for specimens of Eagle Ford Shale
subjected to cyclic wetting and drying from Table 7.1 are compared to Stark et al.’s (2005) data
in Figures 7.4 and 7.5, for effective normal stresses of 50 kPa and 100 kPa, respectively. Only
Stark et al.’s data for a clay fraction greater than or equal to 50% are shown because the clay
fraction of Eagle Ford Shale is greater then 50% (approximately 63.5%). It can be seen that the
fully softened secant friction angles for the specimens of Eagle Ford Shale fall within the range
of data from Stark et al. (2005) and agree well with the curves drawn through Stark et al.’s data
for the average secant friction angles.
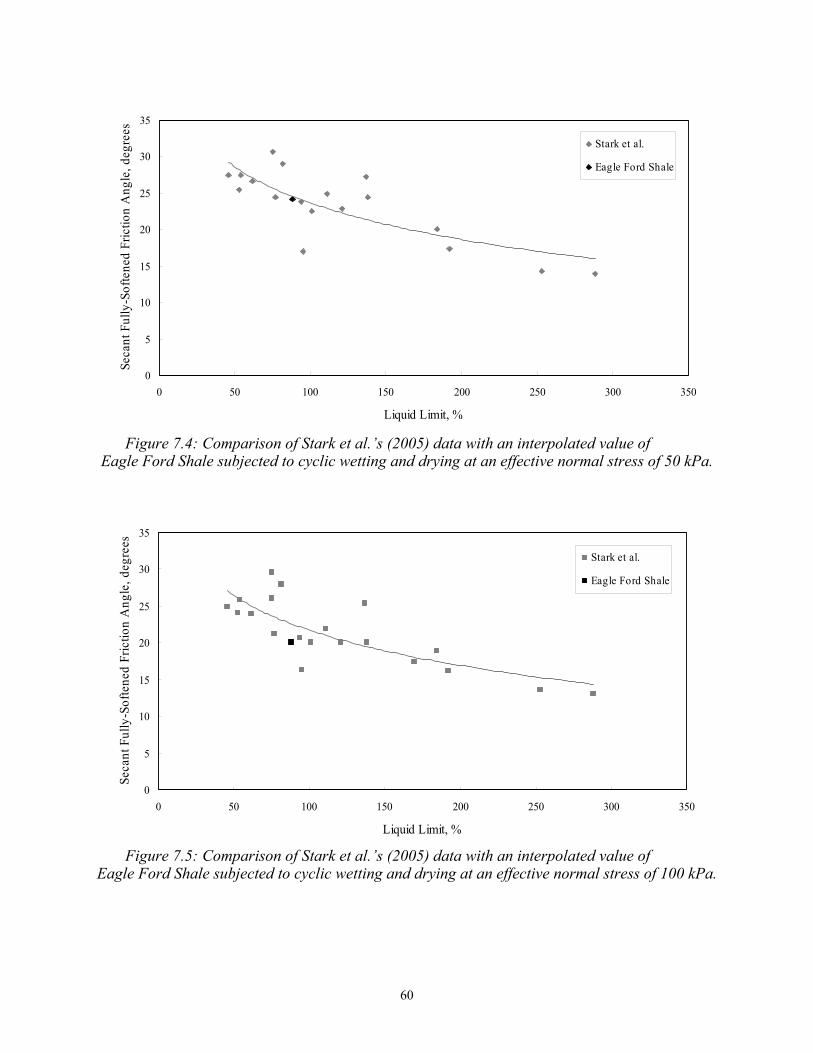
60
0
5
10
15
20
25
30
35
0 50 100 150 200 250 300 350
Liquid Limit, %
Seca
nt F
ully
-Sof
tene
d Fr
ictio
n A
ngle
, deg
rees
Stark et al.
Eagle Ford Shale
Figure 7.4: Comparison of Stark et al.’s (2005) data with an interpolated value of
Eagle Ford Shale subjected to cyclic wetting and drying at an effective normal stress of 50 kPa.
0
5
10
15
20
25
30
35
0 50 100 150 200 250 300 350
Liquid Limit, %
Seca
nt F
ully
-Sof
tene
d Fr
ictio
n A
ngle
, deg
rees
Stark et al.
Eagle Ford Shale
Figure 7.5: Comparison of Stark et al.’s (2005) data with an interpolated value of
Eagle Ford Shale subjected to cyclic wetting and drying at an effective normal stress of 100 kPa.
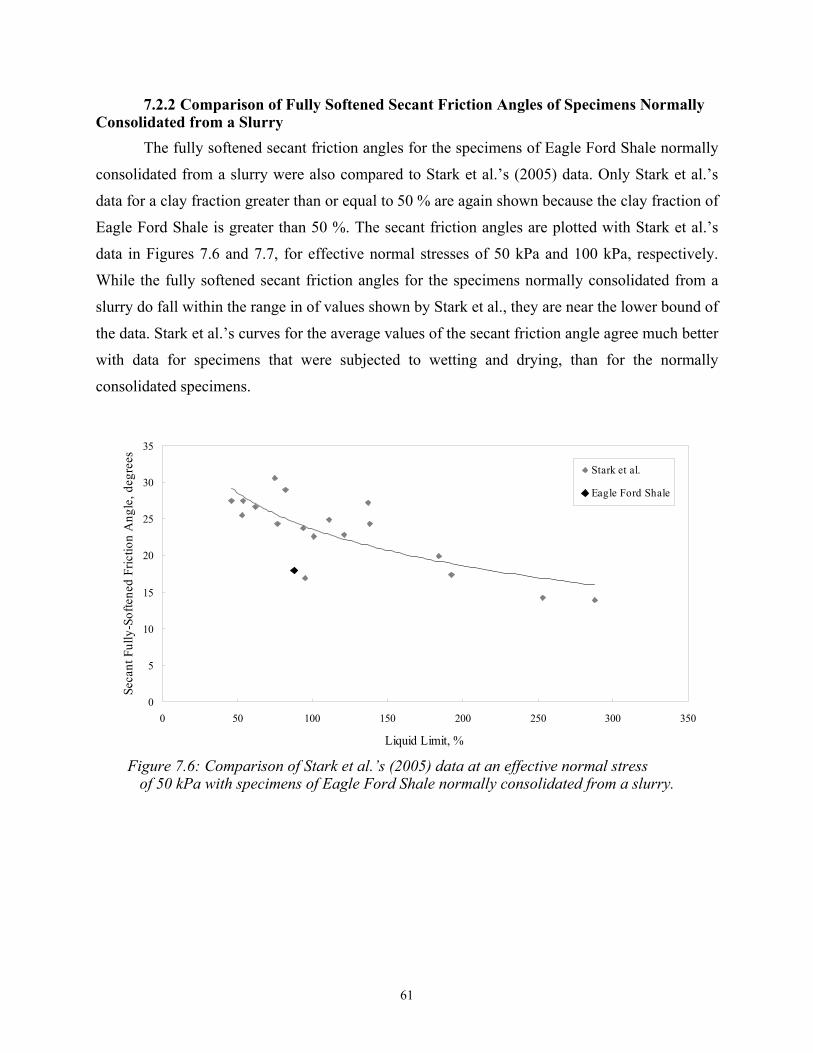
61
7.2.2 Comparison of Fully Softened Secant Friction Angles of Specimens Normally Consolidated from a Slurry
The fully softened secant friction angles for the specimens of Eagle Ford Shale normally
consolidated from a slurry were also compared to Stark et al.’s (2005) data. Only Stark et al.’s
data for a clay fraction greater than or equal to 50 % are again shown because the clay fraction of
Eagle Ford Shale is greater than 50 %. The secant friction angles are plotted with Stark et al.’s
data in Figures 7.6 and 7.7, for effective normal stresses of 50 kPa and 100 kPa, respectively.
While the fully softened secant friction angles for the specimens normally consolidated from a
slurry do fall within the range in of values shown by Stark et al., they are near the lower bound of
the data. Stark et al.’s curves for the average values of the secant friction angle agree much better
with data for specimens that were subjected to wetting and drying, than for the normally
consolidated specimens.
0
5
10
15
20
25
30
35
0 50 100 150 200 250 300 350
Liquid Limit, %
Seca
nt F
ully
-Sof
tene
d Fr
ictio
n A
ngle
, deg
rees
Stark et al.
Eagle Ford Shale
Figure 7.6: Comparison of Stark et al.’s (2005) data at an effective normal stress
of 50 kPa with specimens of Eagle Ford Shale normally consolidated from a slurry.
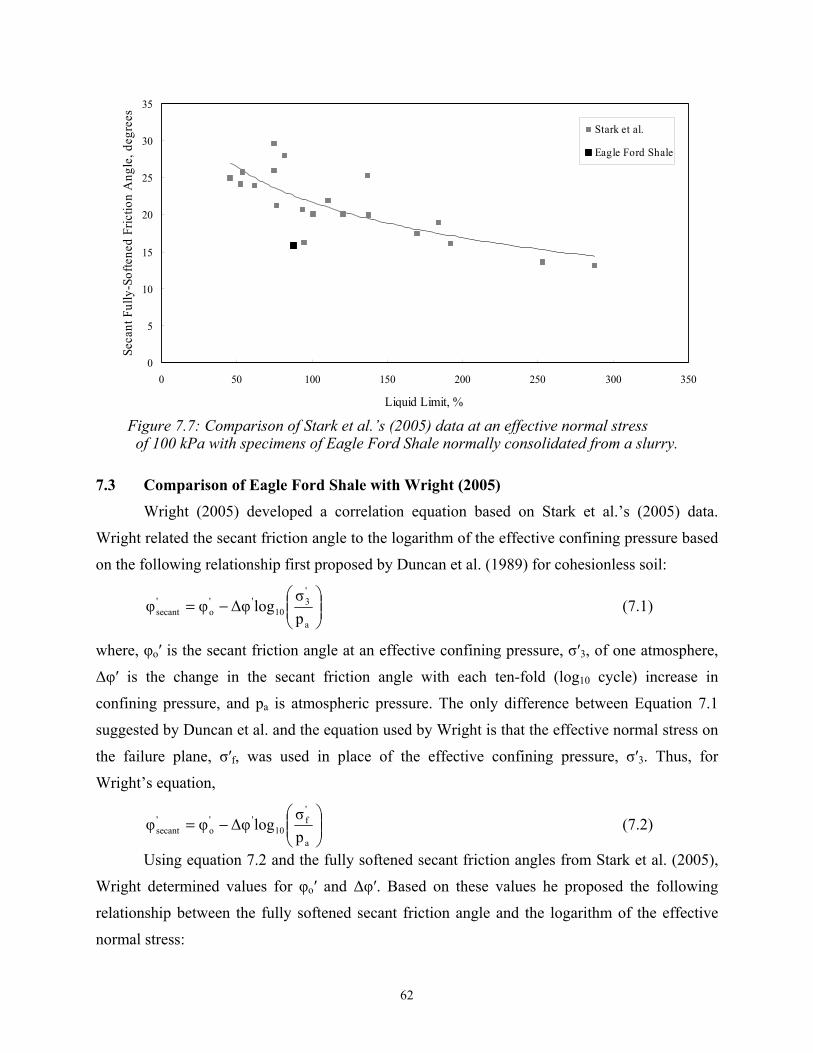
62
0
5
10
15
20
25
30
35
0 50 100 150 200 250 300 350
Liquid Limit, %
Seca
nt F
ully
-Sof
tene
d Fr
ictio
n A
ngle
, deg
rees
Stark et al.
Eagle Ford Shale
Figure 7.7: Comparison of Stark et al.’s (2005) data at an effective normal stress
of 100 kPa with specimens of Eagle Ford Shale normally consolidated from a slurry.
7.3 Comparison of Eagle Ford Shale with Wright (2005)
Wright (2005) developed a correlation equation based on Stark et al.’s (2005) data.
Wright related the secant friction angle to the logarithm of the effective confining pressure based
on the following relationship first proposed by Duncan et al. (1989) for cohesionless soil:
⎟⎟⎠
⎞⎜⎜⎝
⎛−=
a
'3
10''
o'secant p
σlogΔφφφ (7.1)
where, φo′ is the secant friction angle at an effective confining pressure, σ′3, of one atmosphere,
Δφ′ is the change in the secant friction angle with each ten-fold (log10 cycle) increase in
confining pressure, and pa is atmospheric pressure. The only difference between Equation 7.1
suggested by Duncan et al. and the equation used by Wright is that the effective normal stress on
the failure plane, σ′f, was used in place of the effective confining pressure, σ′3. Thus, for
Wright’s equation,
⎟⎟⎠
⎞⎜⎜⎝
⎛−=
a
'f
10''
o'secant p
σlogΔφφφ (7.2)
Using equation 7.2 and the fully softened secant friction angles from Stark et al. (2005),
Wright determined values for φo′ and Δφ′. Based on these values he proposed the following
relationship between the fully softened secant friction angle and the logarithm of the effective
normal stress:
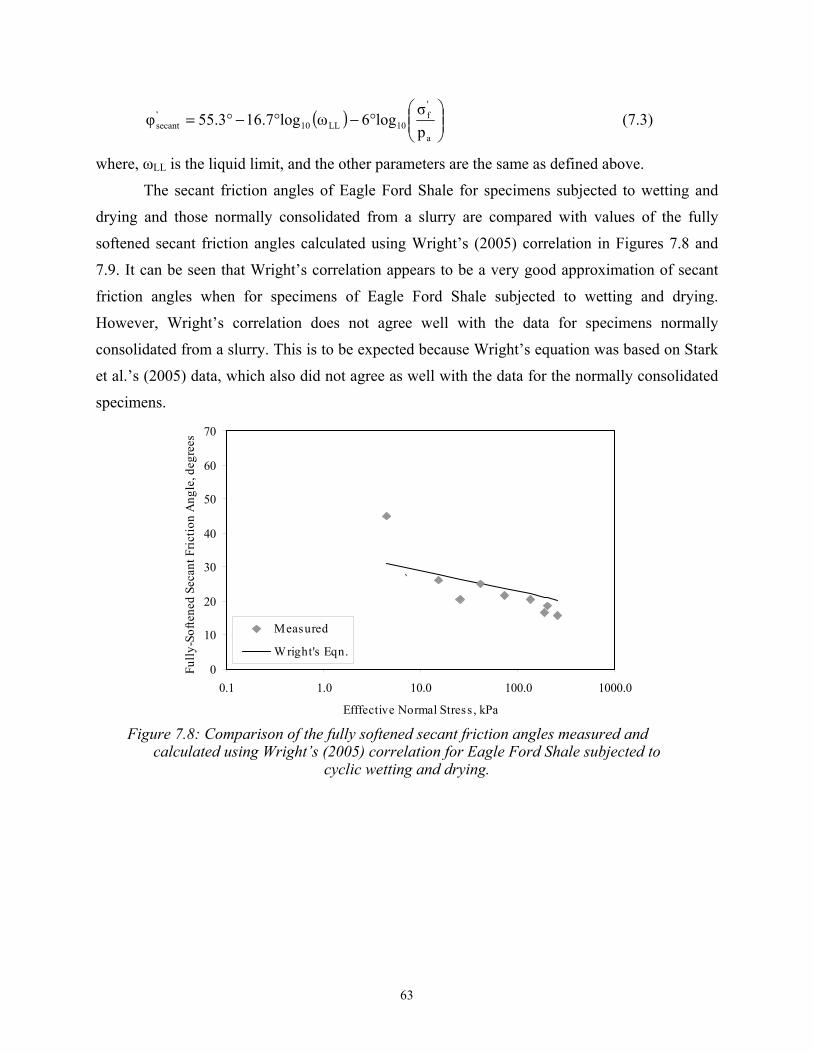
63
( ) ⎟⎟⎠
⎞⎜⎜⎝
⎛°−°−°=
a
'f
10LL10'secant p
σlog6ωlog16.755.3φ (7.3)
where, ωLL is the liquid limit, and the other parameters are the same as defined above.
The secant friction angles of Eagle Ford Shale for specimens subjected to wetting and
drying and those normally consolidated from a slurry are compared with values of the fully
softened secant friction angles calculated using Wright’s (2005) correlation in Figures 7.8 and
7.9. It can be seen that Wright’s correlation appears to be a very good approximation of secant
friction angles when for specimens of Eagle Ford Shale subjected to wetting and drying.
However, Wright’s correlation does not agree well with the data for specimens normally
consolidated from a slurry. This is to be expected because Wright’s equation was based on Stark
et al.’s (2005) data, which also did not agree as well with the data for the normally consolidated
specimens.
0
10
20
30
40
50
60
70
0.1 1.0 10.0 100.0 1000.0
Efffective Normal Stress , kPa
Fully
-Sof
tene
d Se
cant
Fric
tion
Ang
le, d
egre
es
Measured
Wright's Eqn.
`
Figure 7.8: Comparison of the fully softened secant friction angles measured and
calculated using Wright’s (2005) correlation for Eagle Ford Shale subjected to cyclic wetting and drying.
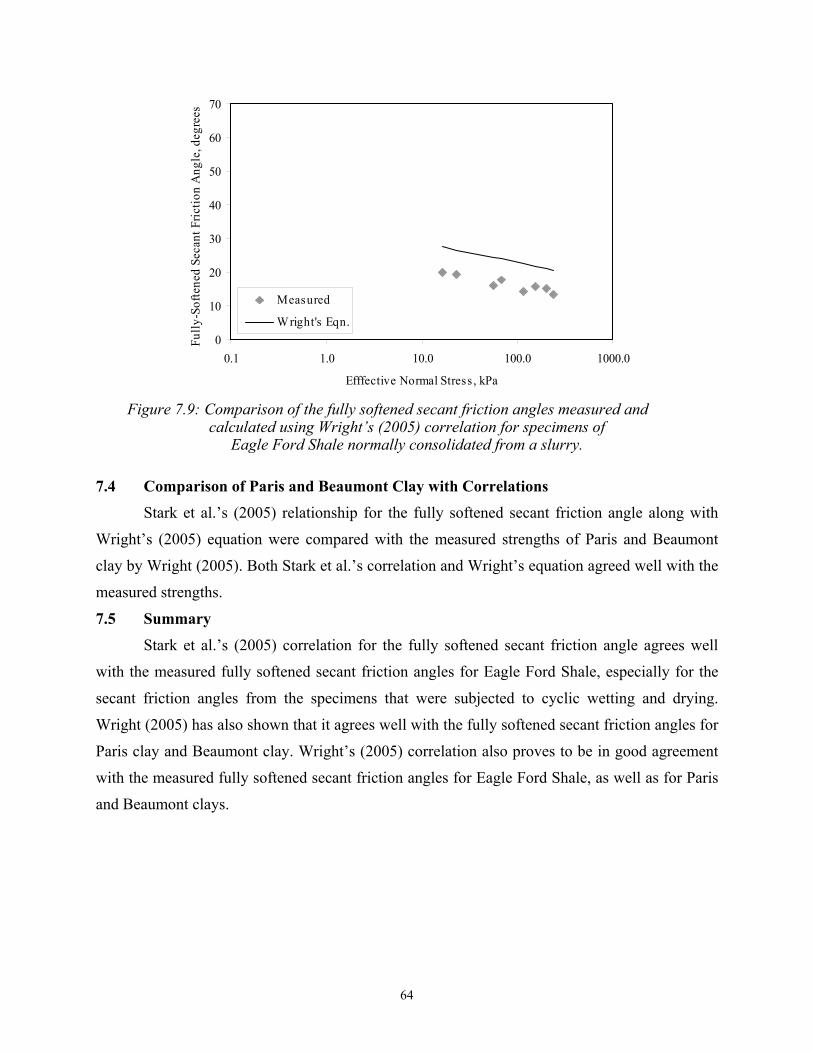
64
0
10
20
30
40
50
60
70
0.1 1.0 10.0 100.0 1000.0
Efffective Normal Stress , kPa
Fully
-Sof
tene
d Se
cant
Fric
tion
Ang
le, d
egre
es
Measured
Wright's Eqn.
Figure 7.9: Comparison of the fully softened secant friction angles measured and
calculated using Wright’s (2005) correlation for specimens of Eagle Ford Shale normally consolidated from a slurry.
7.4 Comparison of Paris and Beaumont Clay with Correlations
Stark et al.’s (2005) relationship for the fully softened secant friction angle along with
Wright’s (2005) equation were compared with the measured strengths of Paris and Beaumont
clay by Wright (2005). Both Stark et al.’s correlation and Wright’s equation agreed well with the
measured strengths.
7.5 Summary
Stark et al.’s (2005) correlation for the fully softened secant friction angle agrees well
with the measured fully softened secant friction angles for Eagle Ford Shale, especially for the
secant friction angles from the specimens that were subjected to cyclic wetting and drying.
Wright (2005) has also shown that it agrees well with the fully softened secant friction angles for
Paris clay and Beaumont clay. Wright’s (2005) correlation also proves to be in good agreement
with the measured fully softened secant friction angles for Eagle Ford Shale, as well as for Paris
and Beaumont clays.
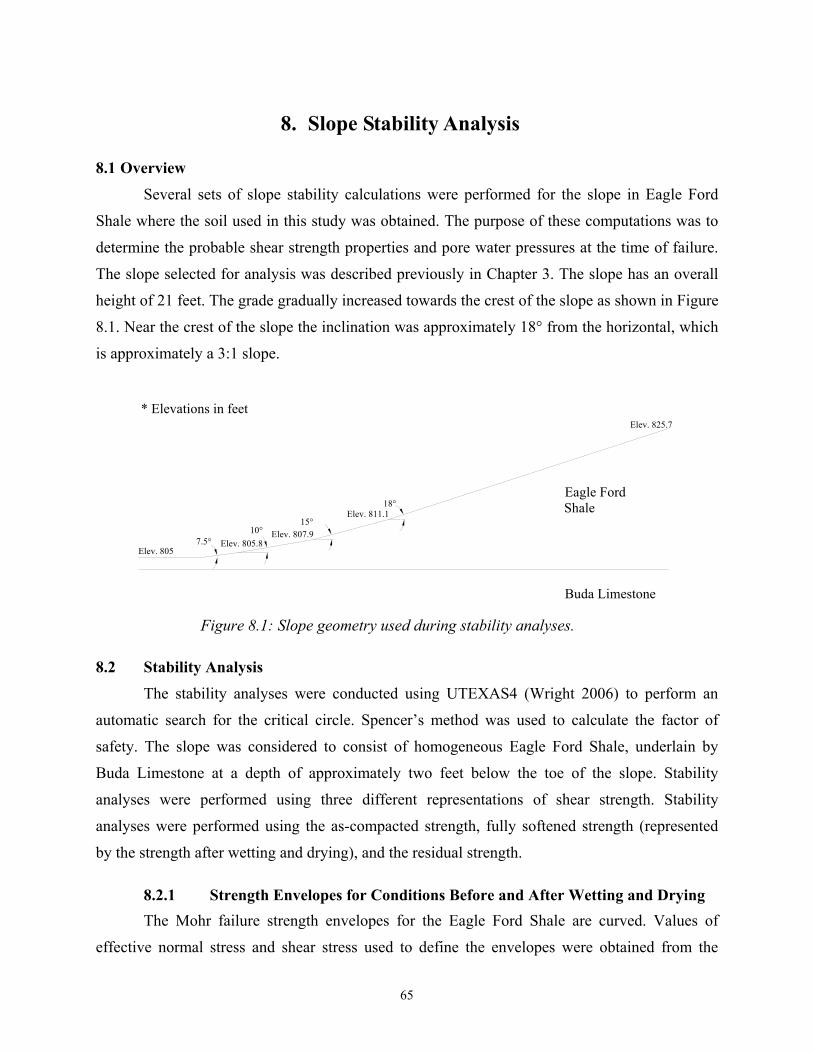
65
8. Slope Stability Analysis
8.1 Overview
Several sets of slope stability calculations were performed for the slope in Eagle Ford
Shale where the soil used in this study was obtained. The purpose of these computations was to
determine the probable shear strength properties and pore water pressures at the time of failure.
The slope selected for analysis was described previously in Chapter 3. The slope has an overall
height of 21 feet. The grade gradually increased towards the crest of the slope as shown in Figure
8.1. Near the crest of the slope the inclination was approximately 18° from the horizontal, which
is approximately a 3:1 slope.
7.5°
Eagle Ford Shale
Buda Limestone
15°
18°
10°Elev. 805.8
Elev. 807.9
Elev. 811.1
Elev. 825.7
Elev. 805
* Elevations in feet
Figure 8.1: Slope geometry used during stability analyses.
8.2 Stability Analysis
The stability analyses were conducted using UTEXAS4 (Wright 2006) to perform an
automatic search for the critical circle. Spencer’s method was used to calculate the factor of
safety. The slope was considered to consist of homogeneous Eagle Ford Shale, underlain by
Buda Limestone at a depth of approximately two feet below the toe of the slope. Stability
analyses were performed using three different representations of shear strength. Stability
analyses were performed using the as-compacted strength, fully softened strength (represented
by the strength after wetting and drying), and the residual strength.
8.2.1 Strength Envelopes for Conditions Before and After Wetting and Drying The Mohr failure strength envelopes for the Eagle Ford Shale are curved. Values of
effective normal stress and shear stress used to define the envelopes were obtained from the
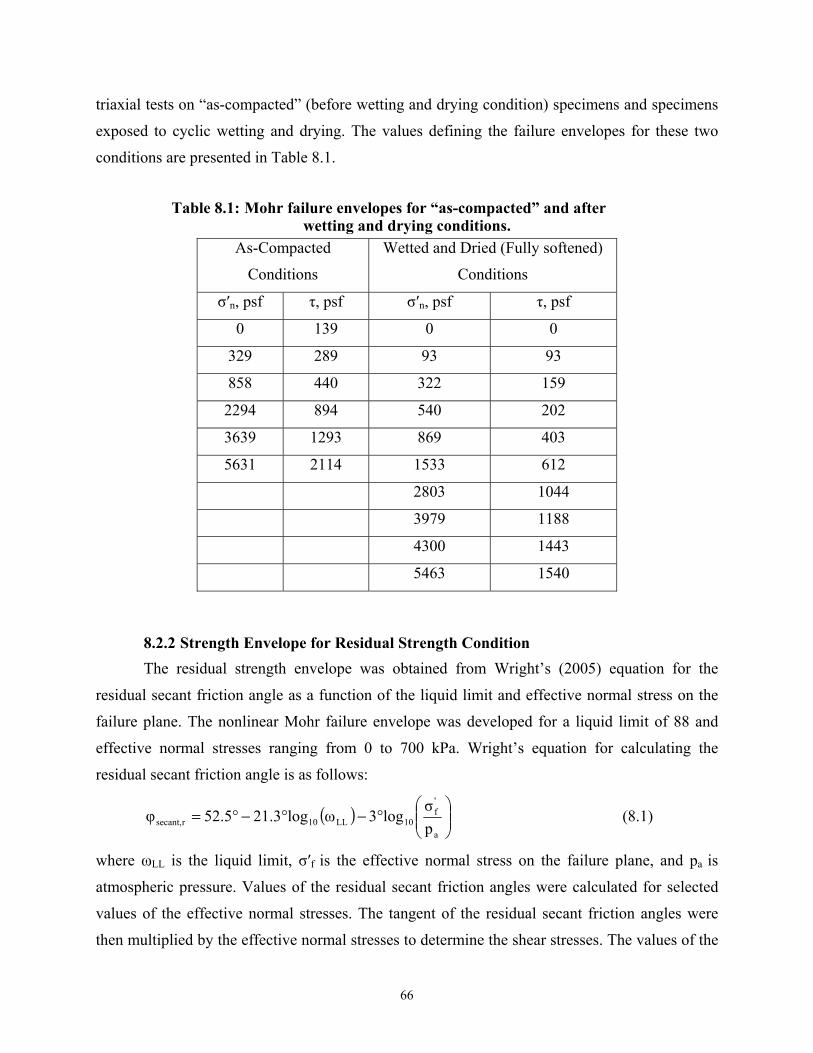
66
triaxial tests on “as-compacted” (before wetting and drying condition) specimens and specimens
exposed to cyclic wetting and drying. The values defining the failure envelopes for these two
conditions are presented in Table 8.1.
Table 8.1: Mohr failure envelopes for “as-compacted” and after wetting and drying conditions.
As-Compacted
Conditions
Wetted and Dried (Fully softened)
Conditions
σ′n, psf τ, psf σ′n, psf τ, psf
0 139 0 0
329 289 93 93
858 440 322 159
2294 894 540 202
3639 1293 869 403
5631 2114 1533 612
2803 1044
3979 1188
4300 1443
5463 1540
8.2.2 Strength Envelope for Residual Strength Condition The residual strength envelope was obtained from Wright’s (2005) equation for the
residual secant friction angle as a function of the liquid limit and effective normal stress on the
failure plane. The nonlinear Mohr failure envelope was developed for a liquid limit of 88 and
effective normal stresses ranging from 0 to 700 kPa. Wright’s equation for calculating the
residual secant friction angle is as follows:
( ) ⎟⎟⎠
⎞⎜⎜⎝
⎛°−°−°=
a
'f
10LL10rsecant, pσlog3ωlog21.352.5φ (8.1)
where ωLL is the liquid limit, σ′f is the effective normal stress on the failure plane, and pa is
atmospheric pressure. Values of the residual secant friction angles were calculated for selected
values of the effective normal stresses. The tangent of the residual secant friction angles were
then multiplied by the effective normal stresses to determine the shear stresses. The values of the
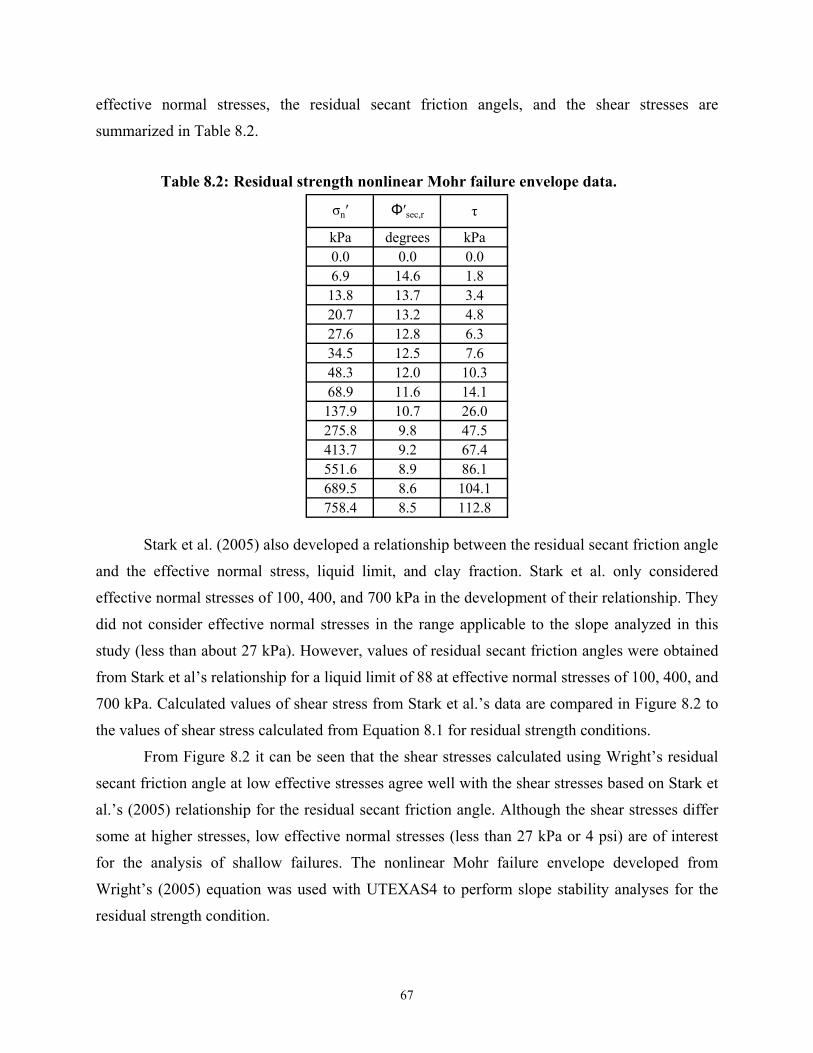
67
effective normal stresses, the residual secant friction angels, and the shear stresses are
summarized in Table 8.2.
Table 8.2: Residual strength nonlinear Mohr failure envelope data.
kPa degrees kPa0.0 0.0 0.06.9 14.6 1.813.8 13.7 3.420.7 13.2 4.827.6 12.8 6.334.5 12.5 7.648.3 12.0 10.368.9 11.6 14.1137.9 10.7 26.0275.8 9.8 47.5413.7 9.2 67.4551.6 8.9 86.1689.5 8.6 104.1758.4 8.5 112.8
σn′ Φ′sec,r τ
Stark et al. (2005) also developed a relationship between the residual secant friction angle
and the effective normal stress, liquid limit, and clay fraction. Stark et al. only considered
effective normal stresses of 100, 400, and 700 kPa in the development of their relationship. They
did not consider effective normal stresses in the range applicable to the slope analyzed in this
study (less than about 27 kPa). However, values of residual secant friction angles were obtained
from Stark et al’s relationship for a liquid limit of 88 at effective normal stresses of 100, 400, and
700 kPa. Calculated values of shear stress from Stark et al.’s data are compared in Figure 8.2 to
the values of shear stress calculated from Equation 8.1 for residual strength conditions.
From Figure 8.2 it can be seen that the shear stresses calculated using Wright’s residual
secant friction angle at low effective stresses agree well with the shear stresses based on Stark et
al.’s (2005) relationship for the residual secant friction angle. Although the shear stresses differ
some at higher stresses, low effective normal stresses (less than 27 kPa or 4 psi) are of interest
for the analysis of shallow failures. The nonlinear Mohr failure envelope developed from
Wright’s (2005) equation was used with UTEXAS4 to perform slope stability analyses for the
residual strength condition.
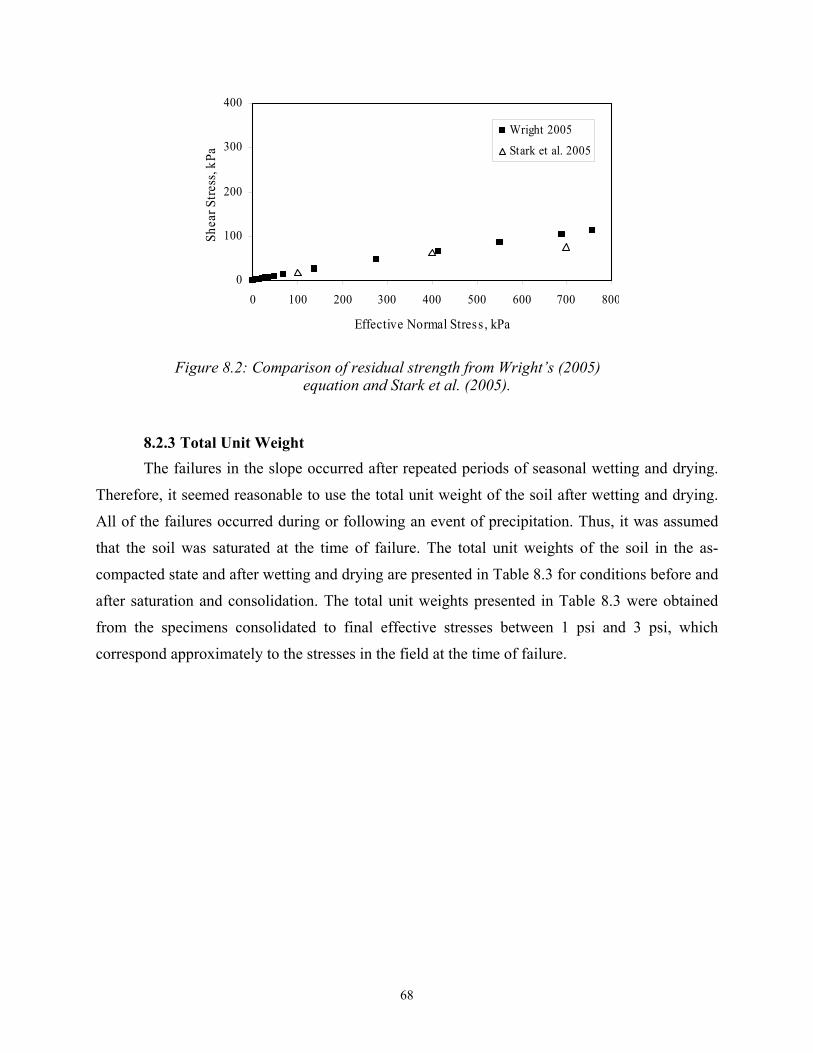
68
0
100
200
300
400
0 100 200 300 400 500 600 700 800
Effective Normal Stress , kPa
Shea
r Stre
ss, k
Pa
Wright 2005
Stark et al. 2005
Figure 8.2: Comparison of residual strength from Wright’s (2005) equation and Stark et al. (2005).
8.2.3 Total Unit Weight The failures in the slope occurred after repeated periods of seasonal wetting and drying.
Therefore, it seemed reasonable to use the total unit weight of the soil after wetting and drying.
All of the failures occurred during or following an event of precipitation. Thus, it was assumed
that the soil was saturated at the time of failure. The total unit weights of the soil in the as-
compacted state and after wetting and drying are presented in Table 8.3 for conditions before and
after saturation and consolidation. The total unit weights presented in Table 8.3 were obtained
from the specimens consolidated to final effective stresses between 1 psi and 3 psi, which
correspond approximately to the stresses in the field at the time of failure.
69
Table 8.3: Total unit weights for soil in as-compacted condition and after wetting and drying before and after saturation and consolidation.
As-Compacted Condition
After Wetting and Drying Effective
Consolidation Stress, psi Initial γ,
pcf Final γ,
pcf
Effective Consolidation Stress,
psi Initial γ, pcf
Final γ, pcf
2 119 113 1 105 108
3 105 111
The total unit weight of the soil used in the analyses was based on the unit weight of the
triaxial specimens that were subjected to cyclic wetting and drying and then saturated and
consolidated in the triaxial cell. A value for the total unit weight of Eagle Ford Shale of 110 pcf
was used for all the analyses.
8.2.4 Pore Water Pressures Slope stability analyses were conducted to determine the pore water pressures and
applicable shear strengths that existed at the time of failure. The pore water pressures were
represented by the average pore water pressure ratio, ru (Bishop and Morgenstern 1960) as
described in Chapter 2. Stability analyses were initially performed assuming no pore water
pressures. The pore water pressure ratio was then varied for each set of analyses to find the value
that produced a factor of safety of 1.00.
8.3 Results of the Slope Stability Analyses
Results of the slope stability analyses using the three different representations of shear
strength are presented below. Results are presented separately for each strength representation.
8.3.1 Analyses Using the Strength before Wetting and Drying The first series of slope stability analyses was performed using the as-compacted shear
strength envelope. Using the as-compacted shear strength, a factor of safety of 1.00 was obtained
for ru = 0.78. However, substantial tension existed in the upper part of the slope, and the slip
surface extended beyond the crest of the slope. The observed slip surface in the field occurred
within the face of the slope and did not intersect the crest or toe. Taking this into consideration,
the slip surface was constrained to be within the toe and the crest of the slope. Under these
70
conditions the factor of safety was 2.36 for zero pore water pressures. The value of ru required to
produce a factor of safety of 1.00 was 0.93. Again, a substantial part of the slip surface was
under tension.
The large positive value of ru required to produce a factor of safety of 1.00 indicates that
the pore water pressures at failure are so large that the effective stresses in the soil are close to
zero or even negative in some cases. Attempts to eliminate tension along the slip surface by
using a tension crack produced numerical difficulties as the depth of the tension crack would
have to be nearly equal to the depth of the slip surface. It seems clear that the as-compacted shear
strength is not applicable to the failure of the slope.
8.3.2 Analyses Using the Strength after Wetting and Drying The next series of slope stability calculations was performed using the shear strength envelope
for specimens subjected to cyclic wetting and drying. Initially stability calculations were
performed to locate the critical circle. A value of 0.33 for ru was found to produce a factor of
safety of 1.00.
Factor of safety: 1.00
Figure 8.3: Critical circle using the strength before wetting and drying with the slip surface allowed to pass behind the crest (ru = 0.78).
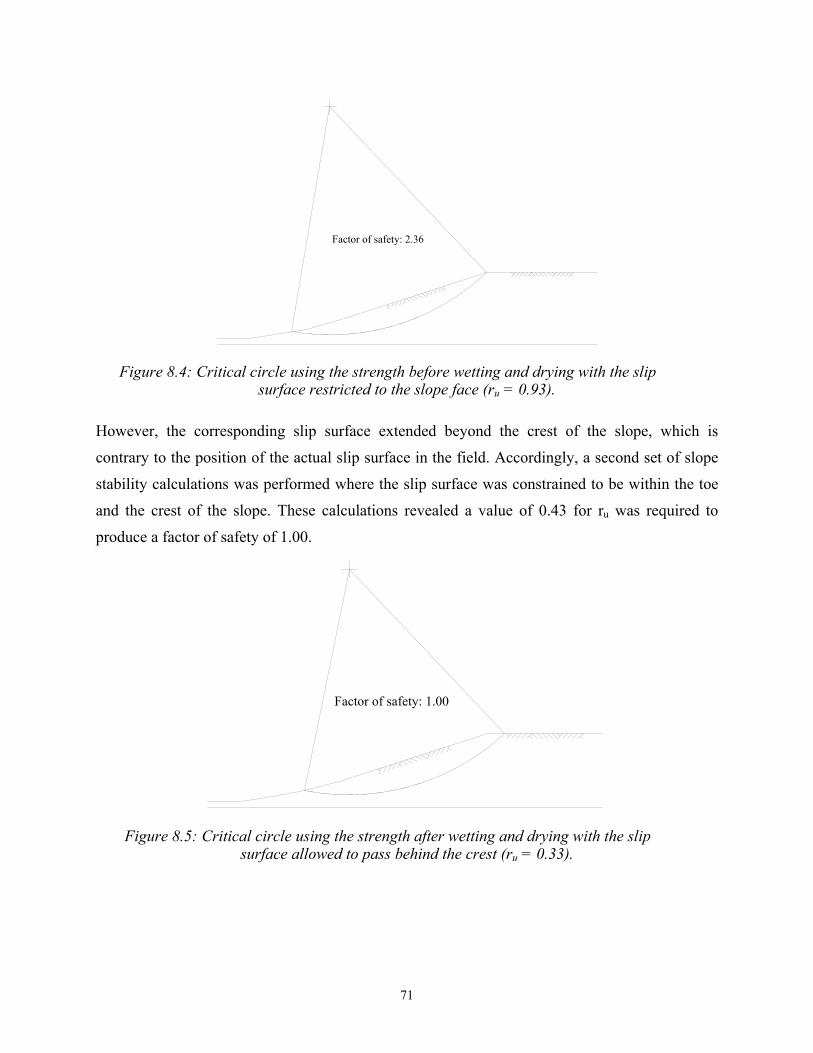
71
Factor of safety: 2.36
Figure 8.4: Critical circle using the strength before wetting and drying with the slip
surface restricted to the slope face (ru = 0.93).
However, the corresponding slip surface extended beyond the crest of the slope, which is
contrary to the position of the actual slip surface in the field. Accordingly, a second set of slope
stability calculations was performed where the slip surface was constrained to be within the toe
and the crest of the slope. These calculations revealed a value of 0.43 for ru was required to
produce a factor of safety of 1.00.
Factor of safety: 1.00
Figure 8.5: Critical circle using the strength after wetting and drying with the slip surface allowed to pass behind the crest (ru = 0.33).
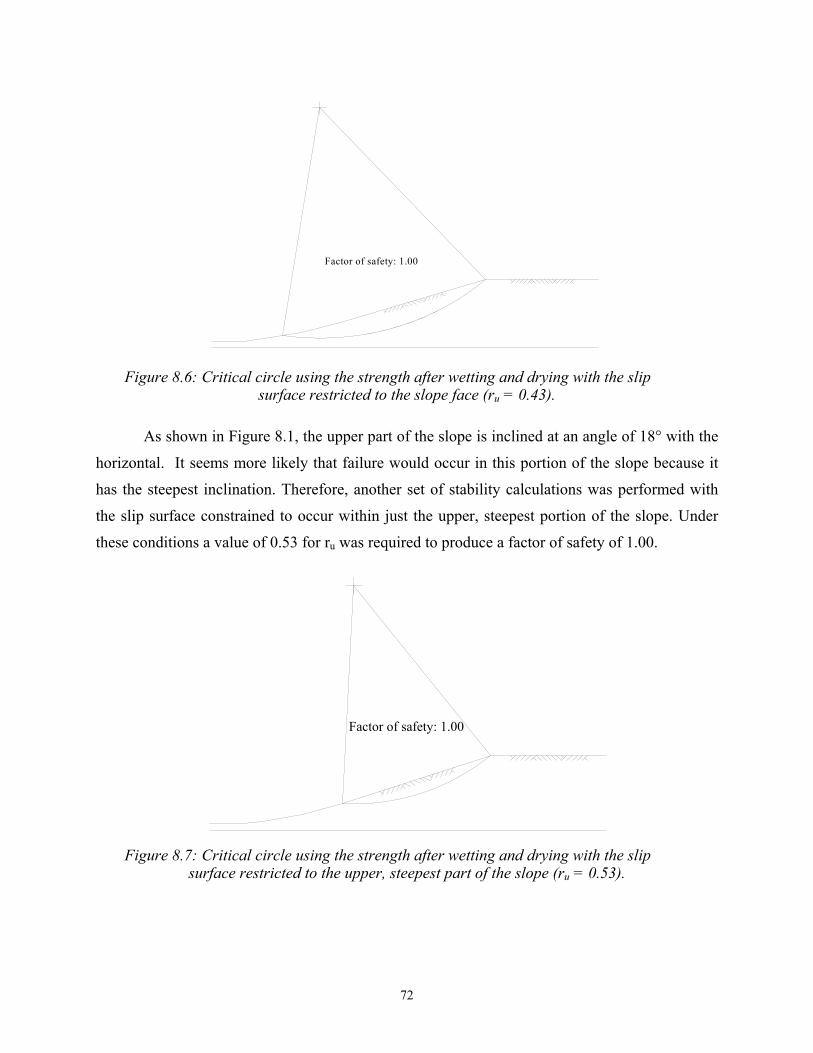
72
Factor of safety: 1.00
Figure 8.6: Critical circle using the strength after wetting and drying with the slip
surface restricted to the slope face (ru = 0.43).
As shown in Figure 8.1, the upper part of the slope is inclined at an angle of 18° with the
horizontal. It seems more likely that failure would occur in this portion of the slope because it
has the steepest inclination. Therefore, another set of stability calculations was performed with
the slip surface constrained to occur within just the upper, steepest portion of the slope. Under
these conditions a value of 0.53 for ru was required to produce a factor of safety of 1.00.
Factor of safety: 1.00
Figure 8.7: Critical circle using the strength after wetting and drying with the slip
surface restricted to the upper, steepest part of the slope (ru = 0.53).
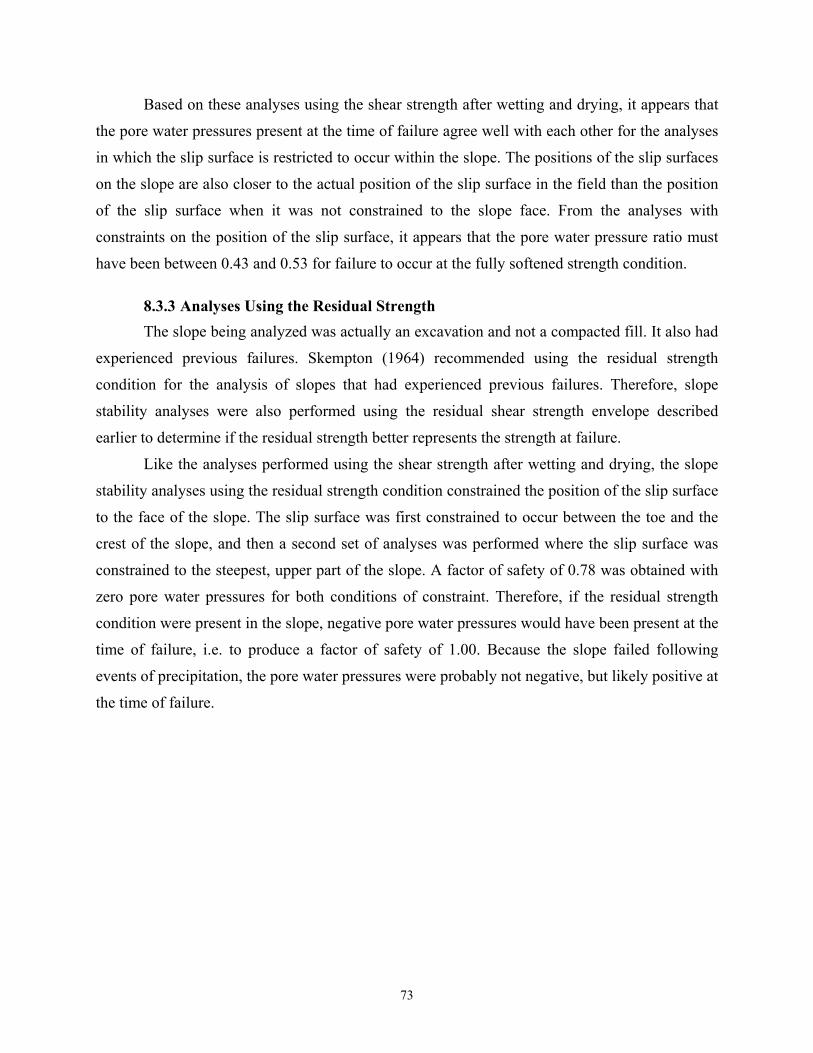
73
Based on these analyses using the shear strength after wetting and drying, it appears that
the pore water pressures present at the time of failure agree well with each other for the analyses
in which the slip surface is restricted to occur within the slope. The positions of the slip surfaces
on the slope are also closer to the actual position of the slip surface in the field than the position
of the slip surface when it was not constrained to the slope face. From the analyses with
constraints on the position of the slip surface, it appears that the pore water pressure ratio must
have been between 0.43 and 0.53 for failure to occur at the fully softened strength condition.
8.3.3 Analyses Using the Residual Strength The slope being analyzed was actually an excavation and not a compacted fill. It also had
experienced previous failures. Skempton (1964) recommended using the residual strength
condition for the analysis of slopes that had experienced previous failures. Therefore, slope
stability analyses were also performed using the residual shear strength envelope described
earlier to determine if the residual strength better represents the strength at failure.
Like the analyses performed using the shear strength after wetting and drying, the slope
stability analyses using the residual strength condition constrained the position of the slip surface
to the face of the slope. The slip surface was first constrained to occur between the toe and the
crest of the slope, and then a second set of analyses was performed where the slip surface was
constrained to the steepest, upper part of the slope. A factor of safety of 0.78 was obtained with
zero pore water pressures for both conditions of constraint. Therefore, if the residual strength
condition were present in the slope, negative pore water pressures would have been present at the
time of failure, i.e. to produce a factor of safety of 1.00. Because the slope failed following
events of precipitation, the pore water pressures were probably not negative, but likely positive at
the time of failure.
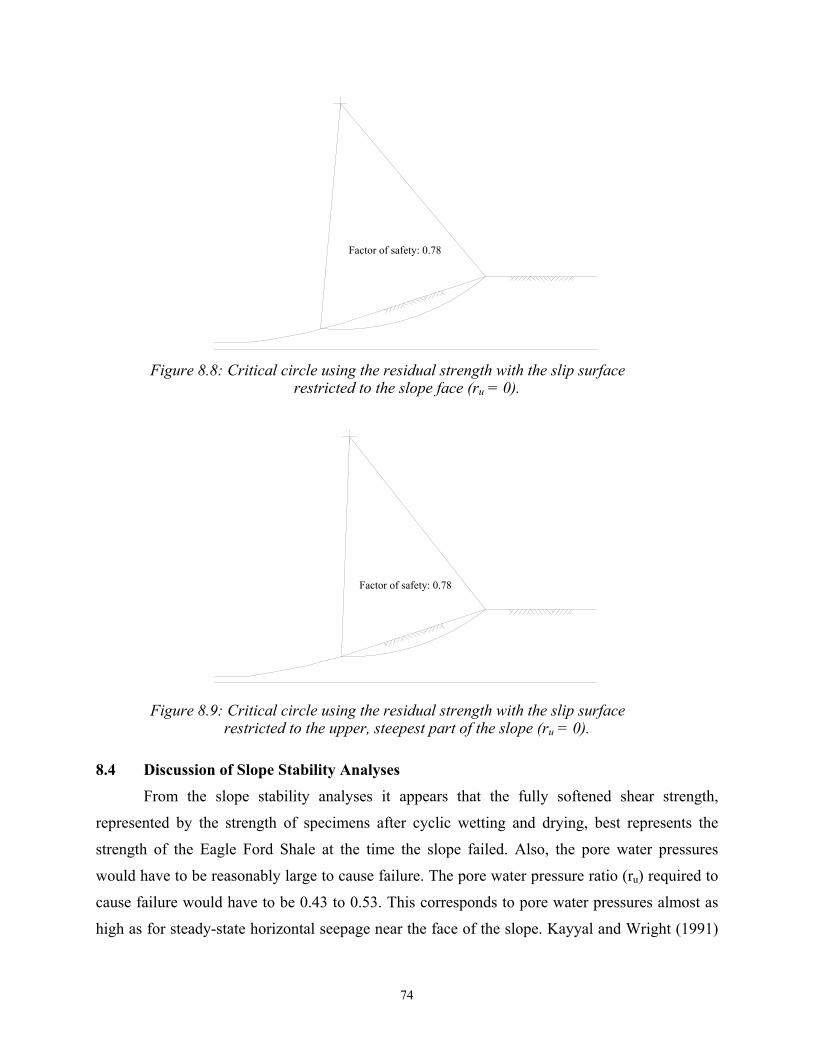
74
Factor of safety: 0.78
Figure 8.8: Critical circle using the residual strength with the slip surface
restricted to the slope face (ru = 0).
Factor of safety: 0.78
Figure 8.9: Critical circle using the residual strength with the slip surface restricted to the upper, steepest part of the slope (ru = 0).
8.4 Discussion of Slope Stability Analyses
From the slope stability analyses it appears that the fully softened shear strength,
represented by the strength of specimens after cyclic wetting and drying, best represents the
strength of the Eagle Ford Shale at the time the slope failed. Also, the pore water pressures
would have to be reasonably large to cause failure. The pore water pressure ratio (ru) required to
cause failure would have to be 0.43 to 0.53. This corresponds to pore water pressures almost as
high as for steady-state horizontal seepage near the face of the slope. Kayyal and Wright (1991)
75
similarly concluded from their slope stability analyses of embankments of Paris and Beaumont
clay that using the strength from specimens that were subjected to wetting and drying produced
factors of safety of 1.00 with ru = 0.5 to 0.6.
Aubeny and Lytton (2004) suggested that negative pore water pressures, or suction, may
be relied upon for strength in compacted slopes of high plasticity clay that have been exposed to
seasonal wetting and drying. They believed that failure is due to moisture diffusion and loss of
suction with time. However, as has been shown for slopes in Eagle Ford Shale, Paris clay, and
Beaumont clay (Kayyal and Wright 1991), positive pore water pressures must be present for
failure to occur.
The shear strength of the soil in the slope at the time of failure appears to have been
much less than the as-compacted strength, yet greater than the residual strength. For the as-
compacted strength to be applicable, extremely large positive pore water pressures would be
necessary to cause failure. This observation agrees with Kayyal and Wright (1991), who
similarly concluded that using the as-compacted strength of Paris and Beaumont clay caused
failure to occur at ru = 0.9 to 1.0. Also, the residual strength does not appear to be the applicable
strength at the time of failure because the analyses show that failure would have occurred when
there were negative pore water pressures, which does not seem reasonable.

76
77
9. Conclusions
Consolidated-undrained triaxial compression tests with pore water pressure
measurements were performed on specimens of Eagle Ford Shale prepared by three different
methods: compacted, compacted and then subjected to cyclic wetting and drying, and normally
consolidated from a slurry. The specimens consolidated from a slurry and subjected to cyclic
wetting and drying were prepared to determine the fully softened shear strength of Eagle Ford
Shale. It was observed that wetting and drying reduced the strength of compacted Eagle Ford
Shale; however, it did not reduce the strength to that of the soil in a normally consolidated
condition. The normally consolidated specimens had a higher void ratio than the specimens
subjected to cyclic wetting and drying, and this higher void ratio may have caused them to have
lower strengths.
The fully softened strength and the as-compacted strength of Eagle Ford Shale were
compared to the comparable strengths of Paris and Beaumont clay reported by Kayyal and
Wright (1991). Although Eagle Ford Shale appears to have lower strength than Paris and
Beaumont clay in both the fully softened state and the as-compacted state, the Mohr failure
envelopes for all three soils show curvature at low effective stresses and negligible cohesion after
being subjected to cyclic wetting and drying.
The measured fully softened secant friction angles of Eagle Ford Shale were compared to
relationships for the fully softened secant friction angle by Stark et al. (2005) and Wright (2005).
Both of these relationships appeared to show good agreement with the fully softened shear
strength of the specimens subjected to wetting and drying. Considering that Wright (2005) also
found good agreement between these relationships and the measured fully softened secant
friction angles of Paris and Beaumont clay, it seems reasonable to conclude that these
relationships may be used with confidence to select values of the fully softened secant friction
angle for the design of high plasticity clay slopes.
Slope stability analyses were performed using UTEXAS4 (Wright 2006) for the slope
where the Eagle Ford Shale was obtained for testing. The purpose of these analyses was to
determine the applicable shear strengths and the pore water pressures that existed at the time of
failure. Three shear strength envelopes were used to represent the strengths of the slope. The
shear strength envelopes of the soil in the as-compacted condition and after wetting and drying
were obtained from laboratory data; whereas, the residual strength envelope was obtained by
78
Wright’s (2005) equation for the residual secant friction angle. The slope stability analyses
indicated that the fully softened strength and high pore water pressures (ru = 0.43 to 0.53) are
applicable to the failure of the slope.
The research presented in the previous chapters along with the work by Kayyal and
Wright (1991) have shown that cyclic wetting and drying of compacted highly plastic clays and
shales can reduce the shear strength to the fully softened state. Also, the pore water pressures
must be reasonably high corresponding to ru values ranging from 0.43 to 0.53 to cause failure.
From the research presented in the previous chapters and the work by Kayyal and Wright
(1991), it has been shown that cyclic wetting and drying can cause a reduction in the strength of
compacted high plasticity clays to the fully softened shear strength. The depth of the zone of
reduced strength is discussed in report 0-5202-2 (Kuhn and Zornberg 2006). It is expected that
the depth of reduced strength is consistent with the depth of moisture fluctuations.
79
References
ASTM. 1963 (Reapproved 2002). “Designation D 422-63, Standard Test Method for Particle-Size Analysis of Soils.” American Society for Testing and Materials, Philadelphia.
ASTM. 2000. “Designation D 698-00a, Standard Test Methods for Laboratory Compaction Characteristics of Soil Using Standard Effort (12,400 ft-lbf/ft3 (600 kN-m/m3)).” American Society for Testing and Materials, Philadelphia.
ASTM. 2002. “Designation D 854-02, Standard Test Methods for Specific Gravity of Soil Solids by Water Pycnometer.” American Society for Testing and Materials, Philadelphia.
ASTM. 2002. “Designation D 1557-02, Standard Test Methods for Laboratory Compaction Characteristics of Soil Using Modified Effort (56,000 ft-lbf/ft3 (2,700 kN-m/m3)).” American Society for Testing and Materials, Philadelphia.
ASTM. 2002. “Designation D 4767-02, Standard Test Method for Consolidated Undrained Triaxial Compression Test for Cohesive Soils.” American Society for Testing and Materials, Philadelphia.
ASTM. 2003. “Designation D 2850-03a, Standard Test Method for Unconsolidated-Undrained Triaxial Compression Test on Cohesive Soils.” American Society for Testing and Materials, Philadelphia.
ASTM. 2005. “Designation D 4318-05, Standard Test Methods for Liquid Limit, Plastic Limit, and Plasticity Index of Soils.” American Society for Testing and Materials, Philadelphia.
Aubeny, C. P. and R. L. Lytton. 2004. “Shallow Slides in Compacted High Plasticity Clay Slopes.” Journal of Geotechnical and Geoenvironmental Engineering 130, no. 7 (July 1, 2004): 717-727.
Bailey, B. and W. R. Stroman. 1992. “Slopes and Embankments in Eagle Ford Clays.” In Proceedings of the Seventh International Conference on Expansive Soils, Volume 1 Held in Dallas, Texas August 3-5, 1992, 114-119.
Bishop, A. W. and D. J. Henkel. 1957. The Measurement of Soil Properties in the Triaxial Test. Edward Arnold Ltd., London, 190 pgs.
Bishop, A. W. and D. J. Henkel. 1962. The Measurement of Soil Properties in the Triaxial Test. Second Edition. Edward Arnold Ltd., London, 228 pgs.
Bishop, A. W. and N. Morgenstern. 1960. “Stability Coefficients for Earth Slopes.” Géotechnique 10, no. 4: 129-150.
Blight, G. E. 1963. “The Effect of Non-Uniform Pore Pressures on Laboratory Measurements of the Shear Strength of Soils.” ASTM Special Technical Publication, no. 361: 173-184.
80
Duncan J. M., R. C. Horz, and T. L. Yang. 1989. “Shear Strength Correlations for Geotechnical
Engineering.” Virginia Polytechnic Institute and State University, Blacksburg, August, 1989,
100 pgs.
Duncan, J. M. and H. B. Seed. 1985. “Errors in Strength Tests and Recommended Corrections.” Report No. TE 65-4, Department of Civil Engineering, University of California, Berkeley, California: 54.
Gourlay, A.W. and Wright, S.G. 1984. “Initial Laboratory Study of the Shear Strength Properties of Compacted Highly Plastic Clays used for Highway Embankment Construction in the Area of Houston, Texas.” A Report on Laboratory Testing Performed under Inter-agency Contract No.’s (82-83)2187 and (84-85) 1026, Center for Transportation Research, The University of Texas at Austin, (September 1984): 202 pgs.
Gullà, G., M. C. Mandaglio, and N. Moraci. 2005. “Influence of Degradation Cycles on the Mechanical Characteristics of Natural Clays.” In Proceedings of the 16th International Conference on Soil Mechanics and Geotechnical Engineering Held in Osaka, Japan September 12-16, 2005, 2521-2524.
Hsu, S-C. and P. P. Nelson. 2002. “Characterization of Eagle Ford Shale.” Engineering Geology 67, no. 1 (May 2002): 169-183. www.elsevier.com/locate/engeo.
James, P.M. 1970. Time Effects and Progressive Failure in Clay Slopes. Ph. D. Thesis, University of London.
Kayyal, M. K. and Wright S. G. 1991. "Investigation of Long-Term Strength Properties of Paris and Beaumont Clays in Earth Embankments," Research Report 1195-2F, Center for Transportation Research, The University of Texas at Austin, (November 1991):125 pgs.
Mesri, G. and A. F. Cepeda-Diaz. 1986. “Residual Shear Strength of Clays and Shales.” Géotechnique 36, no. 2 (June 1986): 269-274.
Mesri, G. and M. Shahien. 2003. “Residual Shear Strength Mobilized in First-Time Slope Failures.” Journal of Geotechnical and Geoenvironmental Engineering 129, no. 1 (January 1, 2003): 12-31.
NOAA Satellite and Information Service, <http://www7.ncdc.noaa.gov/IPS/getcoopstates.html> (accessed May 7, 2006).
Skempton, A. W. 1954. “The Pore Pressure Coefficients A and B.” Géotechnique 4, no. 4: 143-147.
Skempton, A. W. 1964. “Long-Term Stability of Clay Slopes.” Géotechnique 14, no. 2: 75-102.
Skempton, A. W. 1970. “First-Time Slides in Over-Consolidated Clays.” Géotechnique 20, no. 3 (September 1970): 320-324.
81
Skempton, A. W. 1977. “Slope Stability of Cuttings in Brown London Clay.” In Proceedings of the Ninth International Conference on Soil Mechanics Foundation Engineering Held in Tokyo, Japan 3 1977, 261-270.
Stark, T. D., H. Choi, and S. McCone. 2005. “Drained Shear Strength Parameters for Analysis of Landslides.” Journal of Geotechnical and Geoenvironmental Engineering 131, no. 5 (May 1, 2005): 575-588.
Stark, T. D. and H. T. Eid. 1997. “Slope Stability Analyses in Stiff Fissured Clays.” Journal of Geotechnical and Geoenvironmental Engineering 123, no. 4 (April 1997): 335-343.
Taylor, D.W. 1937. “Stability of Earth Slopes.” Journal of the Boston Society of Civil Engineers 24, no. 3 (July 1937) (Reprinted in Contributions to Soil Mechanics 1925-1940. Boston Society of Civil Engineers: 337-386).
Vaughan, P. R. and H. J. Walbancke. 1973. “Pore Pressure Changes and the Delayed Failure of Cutting Slopes in Overconsolidated Clay.” Géotechnique 23, no. 4 (December 1973): 531-539.
Wright, S. G. 2005. “Evaluation of Soil Shear Strengths for Slope and Retaining Wall Stability Analyses with Emphasis on High Plasticity Clays.” Project No. 5-1874-01, Center for Transportation Research, The University of Texas at Austin, (August 2005): 90 pgs.
Wright, S. G. (2006). UTEXAS4: A Computer Program for Slope Stability Analyses, Shinoak Software, Austin, Texas.

82
83
Appendix A: Specimen Consolidation in the Triaxial Cell
The consolidated-undrained triaxial compression specimens were isotropically
consolidated to their final effective consolidation stresses prior to shear. The final effective
consolidation stress was applied to the specimens by raising the cell pressure and holding the
back pressure constant so that the difference between the cell pressure and the back pressure
represented the effective stress. The valves leading to the specimen were left open during
consolidation to allow drainage. During consolidation the changes in the volume of the water in
the cell, which are representative of the changes in the volume of the specimen, were recorded
with time. The changes in volume of water were plotted against the logarithm of time and the
square root of time to determine when primary consolidation was completed. Consolidation was
considered complete when the slope of the curve of the change in volume with the logarithm of
time appeared to be flattening, and the specimen had entered secondary consolidation.
The times to failure, the coefficients of consolidation, the calculated deformation rates for
failure at 20% strain, and the actual deformation rates that were used to shear the specimens are
listed in the tables in this appendix. Although deformation rates were calculated for failure at
20% strain, failure was observed at much smaller strains. The rate of deformation is directly
related to the equalization of pore water pressures; therefore, defining failure at a larger strain,
may have reduced the time for pore water pressure equalization.
Times to failure, tf, were calculated from the coefficients of consolidation, cv, and the
length of the drainage path in the specimen. The specimens normally consolidated from a slurry
and subjected to cyclic wetting and drying were consolidated with drainage from the bottom of
the specimen only. The equation for the coefficient of consolidation by Bishop and Henkel
(1962) for a specimen with a radial boundary and drainage through one end only is as follows:
100
2
v 81tπHc = (A.1)
where, H is one-half the average height of the specimen during consolidation, and t100 is
determined by plotting the change in volume of the cell fluid during consolidation versus the
square root of time according to Bishop and Henkel (1957).
The specimens tested in the as-compacted condition were consolidated with filter paper
drains around the circumference of the specimen and drainage from both ends of the specimens.
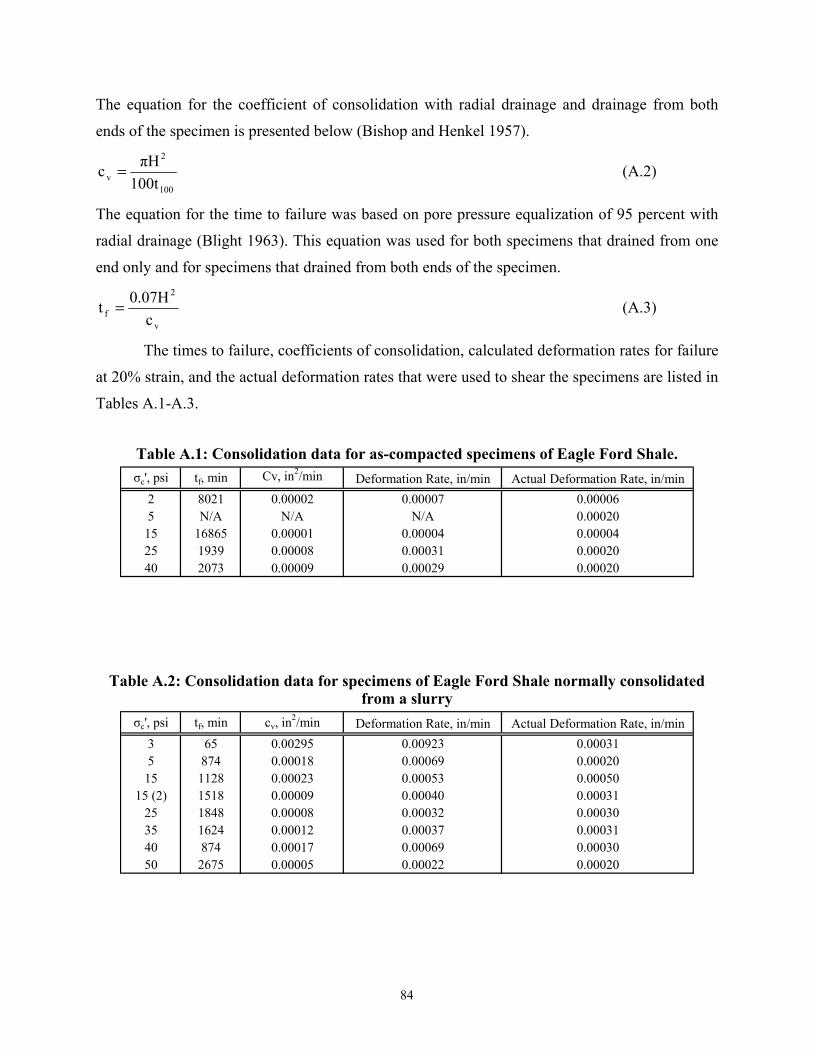
84
The equation for the coefficient of consolidation with radial drainage and drainage from both
ends of the specimen is presented below (Bishop and Henkel 1957).
100
2
v 100tπHc = (A.2)
The equation for the time to failure was based on pore pressure equalization of 95 percent with
radial drainage (Blight 1963). This equation was used for both specimens that drained from one
end only and for specimens that drained from both ends of the specimen.
v
2
f c0.07Ht = (A.3)
The times to failure, coefficients of consolidation, calculated deformation rates for failure
at 20% strain, and the actual deformation rates that were used to shear the specimens are listed in
Tables A.1-A.3.
Table A.1: Consolidation data for as-compacted specimens of Eagle Ford Shale. σc', psi tf, min Cv, in2/min Deformation Rate, in/min Actual Deformation Rate, in/min
2 8021 0.00002 0.00007 0.000065 N/A N/A N/A 0.0002015 16865 0.00001 0.00004 0.0000425 1939 0.00008 0.00031 0.0002040 2073 0.00009 0.00029 0.00020
Table A.2: Consolidation data for specimens of Eagle Ford Shale normally consolidated from a slurry
σc', psi tf, min cv, in2/min Deformation Rate, in/min Actual Deformation Rate, in/min
3 65 0.00295 0.00923 0.000315 874 0.00018 0.00069 0.0002015 1128 0.00023 0.00053 0.00050
15 (2) 1518 0.00009 0.00040 0.0003125 1848 0.00008 0.00032 0.0003035 1624 0.00012 0.00037 0.0003140 874 0.00017 0.00069 0.0003050 2675 0.00005 0.00022 0.00020
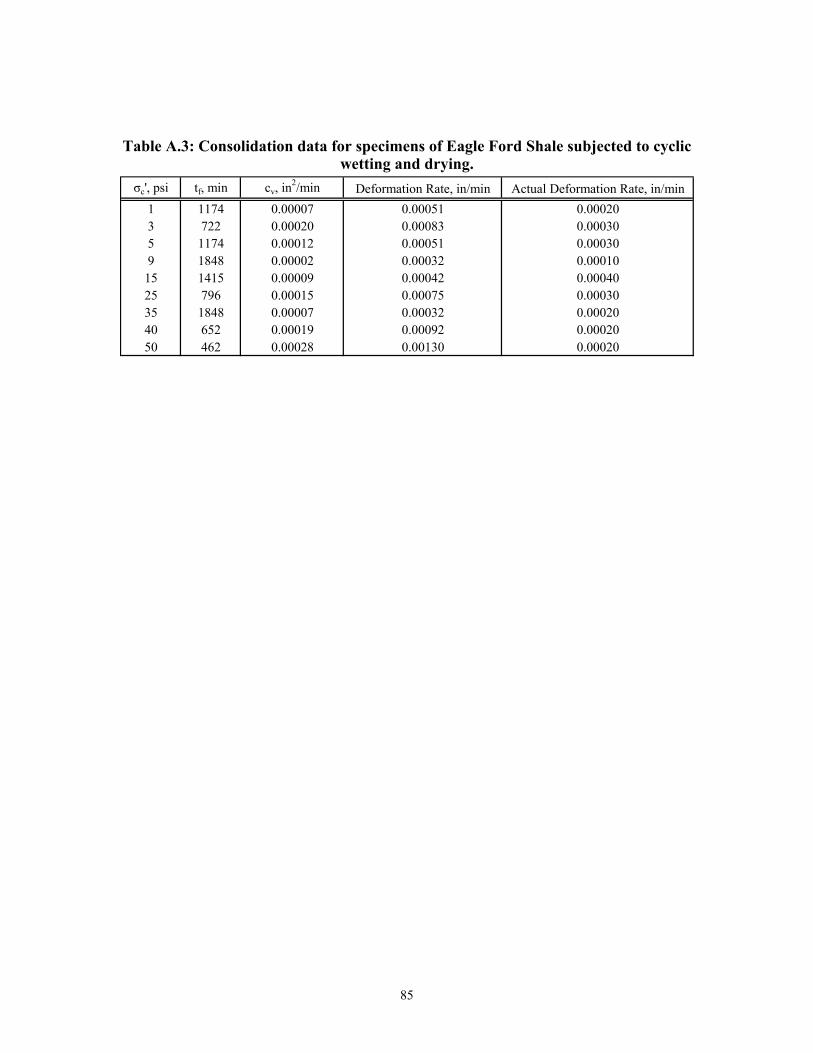
85
Table A.3: Consolidation data for specimens of Eagle Ford Shale subjected to cyclic wetting and drying.
σc', psi tf, min cv, in2/min Deformation Rate, in/min Actual Deformation Rate, in/min
1 1174 0.00007 0.00051 0.000203 722 0.00020 0.00083 0.000305 1174 0.00012 0.00051 0.000309 1848 0.00002 0.00032 0.0001015 1415 0.00009 0.00042 0.0004025 796 0.00015 0.00075 0.0003035 1848 0.00007 0.00032 0.0002040 652 0.00019 0.00092 0.0002050 462 0.00028 0.00130 0.00020

86
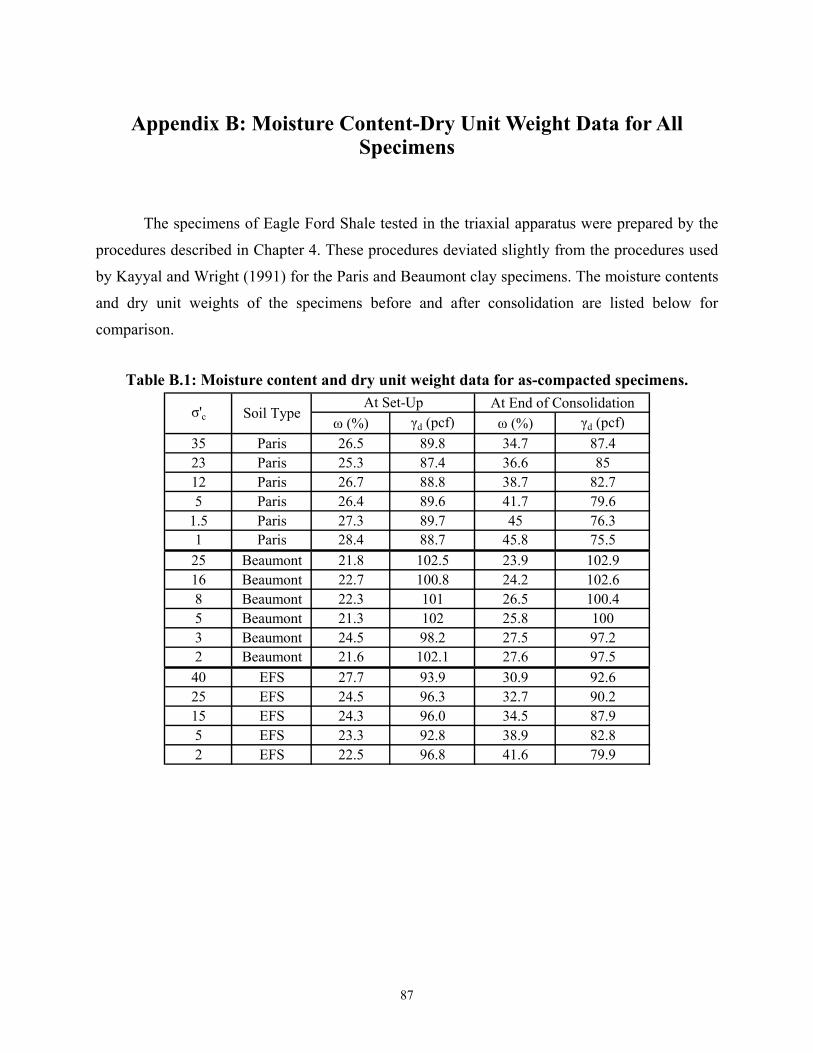
87
Appendix B: Moisture Content-Dry Unit Weight Data for All Specimens
The specimens of Eagle Ford Shale tested in the triaxial apparatus were prepared by the
procedures described in Chapter 4. These procedures deviated slightly from the procedures used
by Kayyal and Wright (1991) for the Paris and Beaumont clay specimens. The moisture contents
and dry unit weights of the specimens before and after consolidation are listed below for
comparison.
Table B.1: Moisture content and dry unit weight data for as-compacted specimens.
ω (%) γd (pcf) ω (%) γd (pcf)35 Paris 26.5 89.8 34.7 87.423 Paris 25.3 87.4 36.6 8512 Paris 26.7 88.8 38.7 82.75 Paris 26.4 89.6 41.7 79.6
1.5 Paris 27.3 89.7 45 76.31 Paris 28.4 88.7 45.8 75.525 Beaumont 21.8 102.5 23.9 102.916 Beaumont 22.7 100.8 24.2 102.68 Beaumont 22.3 101 26.5 100.45 Beaumont 21.3 102 25.8 1003 Beaumont 24.5 98.2 27.5 97.22 Beaumont 21.6 102.1 27.6 97.540 EFS 27.7 93.9 30.9 92.625 EFS 24.5 96.3 32.7 90.215 EFS 24.3 96.0 34.5 87.95 EFS 23.3 92.8 38.9 82.82 EFS 22.5 96.8 41.6 79.9
σ'c Soil TypeAt Set-Up At End of Consolidation
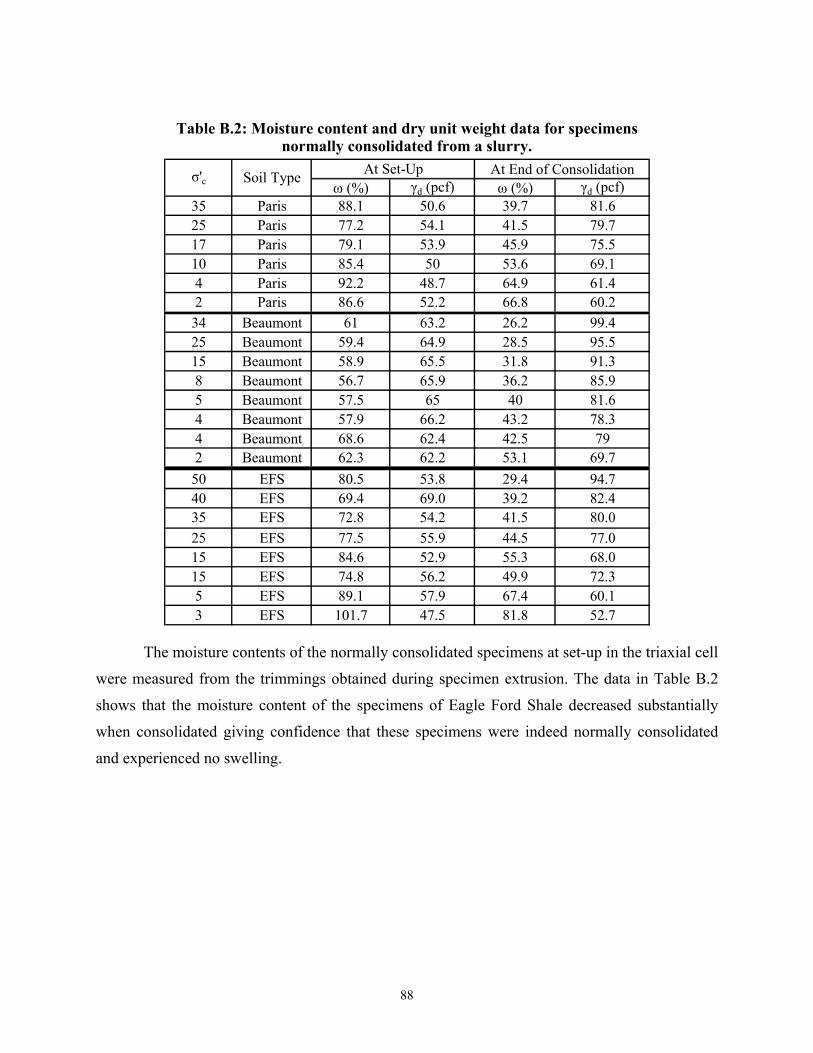
88
Table B.2: Moisture content and dry unit weight data for specimens normally consolidated from a slurry.
ω (%) γd (pcf) ω (%) γd (pcf)35 Paris 88.1 50.6 39.7 81.625 Paris 77.2 54.1 41.5 79.717 Paris 79.1 53.9 45.9 75.510 Paris 85.4 50 53.6 69.14 Paris 92.2 48.7 64.9 61.42 Paris 86.6 52.2 66.8 60.234 Beaumont 61 63.2 26.2 99.425 Beaumont 59.4 64.9 28.5 95.515 Beaumont 58.9 65.5 31.8 91.38 Beaumont 56.7 65.9 36.2 85.95 Beaumont 57.5 65 40 81.64 Beaumont 57.9 66.2 43.2 78.34 Beaumont 68.6 62.4 42.5 792 Beaumont 62.3 62.2 53.1 69.750 EFS 80.5 53.8 29.4 94.740 EFS 69.4 69.0 39.2 82.435 EFS 72.8 54.2 41.5 80.025 EFS 77.5 55.9 44.5 77.015 EFS 84.6 52.9 55.3 68.015 EFS 74.8 56.2 49.9 72.35 EFS 89.1 57.9 67.4 60.13 EFS 101.7 47.5 81.8 52.7
At End of Consolidationσ'c Soil Type At Set-Up
The moisture contents of the normally consolidated specimens at set-up in the triaxial cell
were measured from the trimmings obtained during specimen extrusion. The data in Table B.2
shows that the moisture content of the specimens of Eagle Ford Shale decreased substantially
when consolidated giving confidence that these specimens were indeed normally consolidated
and experienced no swelling.
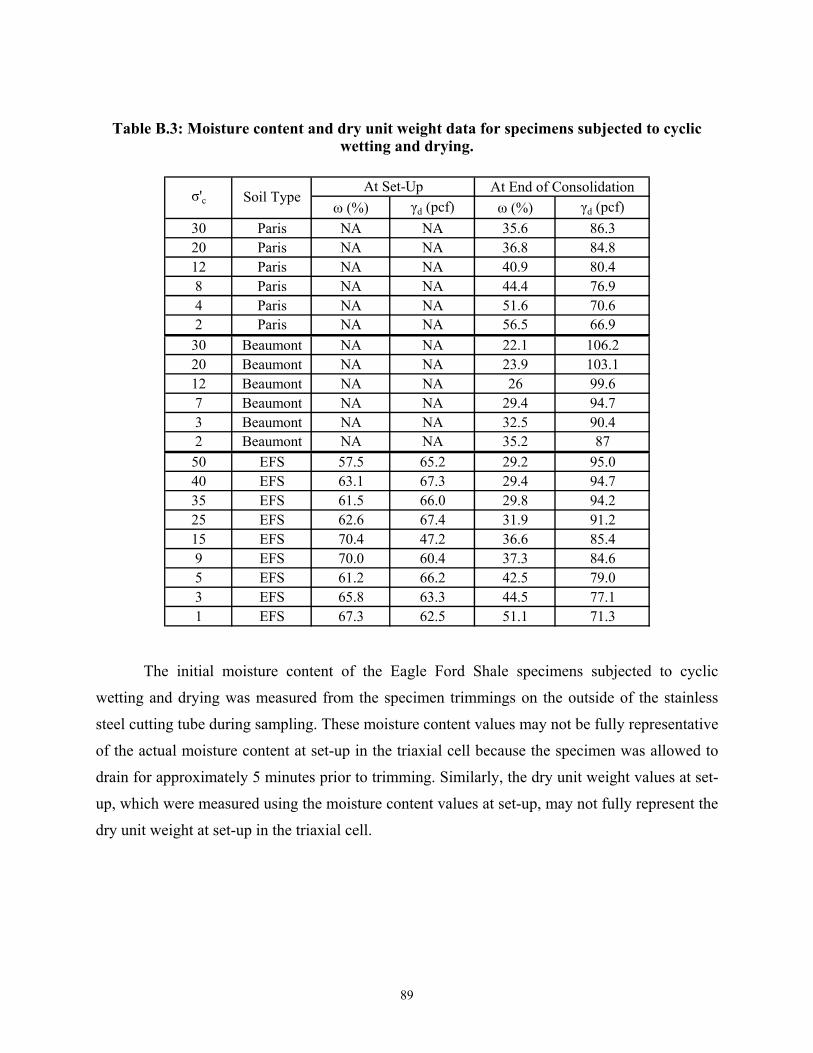
89
Table B.3: Moisture content and dry unit weight data for specimens subjected to cyclic wetting and drying.
ω (%) γd (pcf) ω (%) γd (pcf)30 Paris NA NA 35.6 86.320 Paris NA NA 36.8 84.812 Paris NA NA 40.9 80.48 Paris NA NA 44.4 76.94 Paris NA NA 51.6 70.62 Paris NA NA 56.5 66.930 Beaumont NA NA 22.1 106.220 Beaumont NA NA 23.9 103.112 Beaumont NA NA 26 99.67 Beaumont NA NA 29.4 94.73 Beaumont NA NA 32.5 90.42 Beaumont NA NA 35.2 8750 EFS 57.5 65.2 29.2 95.040 EFS 63.1 67.3 29.4 94.735 EFS 61.5 66.0 29.8 94.225 EFS 62.6 67.4 31.9 91.215 EFS 70.4 47.2 36.6 85.49 EFS 70.0 60.4 37.3 84.65 EFS 61.2 66.2 42.5 79.03 EFS 65.8 63.3 44.5 77.11 EFS 67.3 62.5 51.1 71.3
σ'c Soil TypeAt Set-Up At End of Consolidation
The initial moisture content of the Eagle Ford Shale specimens subjected to cyclic
wetting and drying was measured from the specimen trimmings on the outside of the stainless
steel cutting tube during sampling. These moisture content values may not be fully representative
of the actual moisture content at set-up in the triaxial cell because the specimen was allowed to
drain for approximately 5 minutes prior to trimming. Similarly, the dry unit weight values at set-
up, which were measured using the moisture content values at set-up, may not fully represent the
dry unit weight at set-up in the triaxial cell.

90
91
Appendix C: Filter Paper, Membrane, and Area Corrections
The difference in principal stresses calculated from the load recorded during shearing of a
triaxial specimen is not the actual difference in principal stresses sustained by the specimen.
Corrections were made for the load transmitted to the filter paper strips and membrane(s) along
with the changing cross-sectional area. Because some of the applied load is being taken by the
filter paper strips and membrane(s), the total axial load applied to the specimen is actually less
than the load that is recorded from the load cell. In a similar manner, the membrane also provides
lateral support to the specimen. As the specimen is loaded, the cross-sectional area of the
specimen is changing. The membrane supplies lateral resistance to the change in cross-sectional
area of the specimen if the radius of the specimen is getting larger due to Poisson’s ratio. Since
the difference in principal stresses is calculated as the applied load divided by cross-sectional
area, any changes in the cross-sectional area during shearing affect the calculated difference in
principal stresses.
Filter Paper Correction The filter paper drains were cut from Whatman No. 1Chromotography Paper. A
correction was applied to the axial stress to account for any load transferred to the filter paper
during shearing. No correction for the filter paper was made to the lateral stresses. The filter
paper correction that was applied to all triaxial specimens was based on the work of Duncan and
Seed (1965). The filter paper correction was computed according to Equation C.1.
sfpafp A
PkΔσ = (C.1)
where, Δσafp = Correction to the axial stress for load carried by filter paper drains.
kfp= Load carried by the filter paper drain per unit length of the perimeter covered by
the filter paper (0.165 lb/in; Gourlay and Wright, 1984).
P = Perimeter of the specimen covered by the filter paper.
As = Cross-sectional area of the specimen.
92
Membrane Correction The correction to the axial stress for the membrane(s) strength was taken from ASTM D
4746-02, and the correction to the lateral stress was obtained from Duncan and Seed (1985).
Corrections were applied to the axial and lateral stresses for the membrane(s) according to the
following equations:
( )c
atmmam D
εtE4Δσ
⋅= (C.2)
c
mmlmlm D
tEC
232⎟⎠⎞
⎜⎝⎛−=Δσ (C.3)
v
at
vat
lmCε
εεε
−−−
−+=
111
22 (C.4)
Where, Δσam = Correction to the axial stress for the load carried by the membrane(s).
Δσlm = Correction to the lateral stress for the membrane(s) strength.
Em = Young’s modulus for the membrane material (assumed to be 135 psi based on
Gourlay and Wright, 1984).
tm = Thickness of the membrane(s) = 0.0054 inches for two membranes.
Dc = Diameter of specimen after consolidation.
εat = Axial strain due to consolidation (in decimal form).
εv = Volumetric strain due to consolidation (in decimal form).
Area Correction All of the triaxial specimens exhibited a clearly defined shear plane at failure. The
correction for a changing cross-sectional area during shearing was taken from ASTM D 4746-02.
The area correction for a given axial load is as follows:
( )a1
c
ε1A
A−
= (C.5)
93
Where, A = Corrected cross-sectional area for a given applied axial load.
Ac = Average cross-sectional area of the specimen after consolidation.
εa1 = Axial strain for the given axial load.
The cross-sectional area at the end of consolidation was calculated by subtracting the
change in volume during consolidation from the initial volume and dividing by the height at the
end of consolidation.

94
95
Appendix D: Results from Consolidated-Undrained Triaxial Compression Tests for all Specimens
Data from the consolidated-undrained triaxial compression tests with pore water pressure
measurements for specimens of Eagle Ford Shale in the as-compacted condition, normally
consolidated from a slurry, and subjected to cyclic wetting and drying are presented in this
section. The tests are labeled according to the type of specimen and the final effective
consolidation pressure. The abbreviations for the specimen types are as follows: as-compacted
specimens (AC), specimens normally consolidated from a slurry (NC), and specimens subjected
to cyclic wetting and drying (WD). The data presented includes the deformation, applied force,
pore water pressure, axial strain, minor principal effective stress, difference in principal stresses,
and principal stress ratio. Each set of data is presented on a separate page.
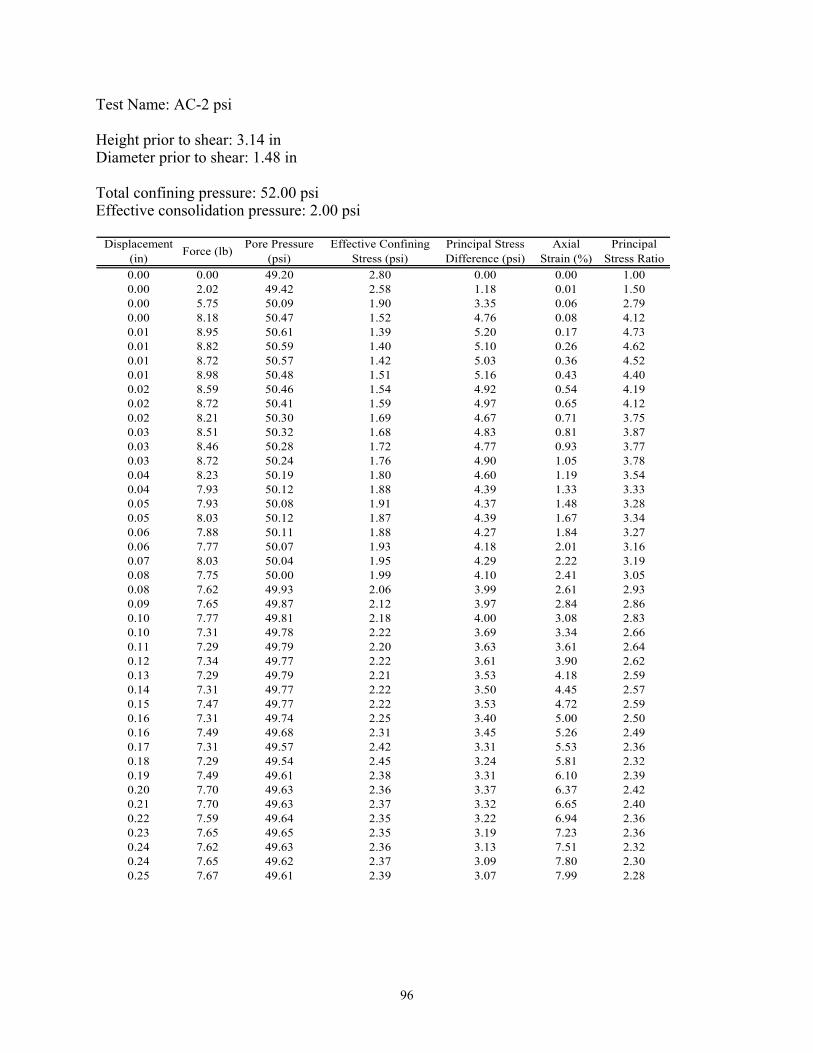
96
Test Name: AC-2 psi Height prior to shear: 3.14 in Diameter prior to shear: 1.48 in Total confining pressure: 52.00 psi Effective consolidation pressure: 2.00 psi
0.00 0.00 49.20 2.80 0.00 0.00 1.000.00 2.02 49.42 2.58 1.18 0.01 1.500.00 5.75 50.09 1.90 3.35 0.06 2.790.00 8.18 50.47 1.52 4.76 0.08 4.120.01 8.95 50.61 1.39 5.20 0.17 4.730.01 8.82 50.59 1.40 5.10 0.26 4.620.01 8.72 50.57 1.42 5.03 0.36 4.520.01 8.98 50.48 1.51 5.16 0.43 4.400.02 8.59 50.46 1.54 4.92 0.54 4.190.02 8.72 50.41 1.59 4.97 0.65 4.120.02 8.21 50.30 1.69 4.67 0.71 3.750.03 8.51 50.32 1.68 4.83 0.81 3.870.03 8.46 50.28 1.72 4.77 0.93 3.770.03 8.72 50.24 1.76 4.90 1.05 3.780.04 8.23 50.19 1.80 4.60 1.19 3.540.04 7.93 50.12 1.88 4.39 1.33 3.330.05 7.93 50.08 1.91 4.37 1.48 3.280.05 8.03 50.12 1.87 4.39 1.67 3.340.06 7.88 50.11 1.88 4.27 1.84 3.270.06 7.77 50.07 1.93 4.18 2.01 3.160.07 8.03 50.04 1.95 4.29 2.22 3.190.08 7.75 50.00 1.99 4.10 2.41 3.050.08 7.62 49.93 2.06 3.99 2.61 2.930.09 7.65 49.87 2.12 3.97 2.84 2.860.10 7.77 49.81 2.18 4.00 3.08 2.830.10 7.31 49.78 2.22 3.69 3.34 2.660.11 7.29 49.79 2.20 3.63 3.61 2.640.12 7.34 49.77 2.22 3.61 3.90 2.620.13 7.29 49.79 2.21 3.53 4.18 2.590.14 7.31 49.77 2.22 3.50 4.45 2.570.15 7.47 49.77 2.22 3.53 4.72 2.590.16 7.31 49.74 2.25 3.40 5.00 2.500.16 7.49 49.68 2.31 3.45 5.26 2.490.17 7.31 49.57 2.42 3.31 5.53 2.360.18 7.29 49.54 2.45 3.24 5.81 2.320.19 7.49 49.61 2.38 3.31 6.10 2.390.20 7.70 49.63 2.36 3.37 6.37 2.420.21 7.70 49.63 2.37 3.32 6.65 2.400.22 7.59 49.64 2.35 3.22 6.94 2.360.23 7.65 49.65 2.35 3.19 7.23 2.360.24 7.62 49.63 2.36 3.13 7.51 2.320.24 7.65 49.62 2.37 3.09 7.80 2.300.25 7.67 49.61 2.39 3.07 7.99 2.28
Principal Stress Difference (psi)
Axial Strain (%)
Principal Stress Ratio
Displacement (in) Force (lb) Pore Pressure
(psi)Effective Confining
Stress (psi)

97
Test Name: AC-5 psi Height prior to shear: 3.04 in Diameter prior to shear: 1.50 in Total confining pressure: 70.00 psi Effective consolidation pressure: 5.00 psi
0.00 0.00 63.50 6.50 0.00 0.00 1.000.00 2.07 63.84 6.16 1.16 0.06 1.200.00 7.59 64.93 5.07 4.28 0.13 1.860.01 10.36 65.59 4.40 5.81 0.30 2.320.01 9.26 65.51 4.49 5.18 0.36 2.160.02 11.35 65.86 4.14 6.33 0.52 2.530.02 11.30 65.90 4.10 6.26 0.76 2.530.03 11.61 65.90 4.09 6.38 1.01 2.560.04 11.53 65.90 4.10 6.28 1.30 2.530.05 11.86 65.88 4.12 6.40 1.62 2.550.06 11.99 65.85 4.15 6.41 1.98 2.540.07 12.04 65.81 4.19 6.39 2.41 2.530.09 12.15 65.77 4.23 6.41 2.87 2.510.10 12.22 65.72 4.28 6.41 3.33 2.500.12 12.50 65.67 4.33 6.52 3.80 2.510.13 12.50 65.60 4.40 6.48 4.25 2.470.14 12.27 65.50 4.50 6.31 4.71 2.400.16 11.84 65.42 4.58 6.04 5.17 2.320.17 11.66 65.31 4.69 5.90 5.65 2.260.19 10.94 65.22 4.78 5.48 6.12 2.150.20 10.71 65.13 4.87 5.32 6.58 2.090.21 10.71 65.09 4.91 5.28 7.05 2.080.23 10.82 65.06 4.94 5.30 7.53 2.070.24 10.66 65.04 4.96 5.18 8.02 2.050.26 10.89 65.01 4.99 5.26 8.49 2.050.27 10.46 65.00 5.00 5.00 8.97 2.000.29 10.92 64.98 5.02 5.20 9.44 2.030.30 11.05 64.95 5.05 5.22 9.93 2.040.32 10.84 64.94 5.06 5.08 10.41 2.000.33 11.15 64.91 5.09 5.20 10.88 2.020.35 11.23 64.87 5.13 5.20 11.36 2.010.36 11.17 64.85 5.15 5.13 11.83 2.000.37 11.33 64.81 5.19 5.17 12.32 2.000.39 11.51 64.78 5.22 5.21 12.80 2.000.40 11.84 64.76 5.24 5.34 13.29 2.020.42 11.43 64.74 5.26 5.10 13.78 1.970.43 11.46 64.72 5.28 5.07 14.27 1.960.45 11.40 64.71 5.29 5.00 14.76 1.950.46 11.61 64.68 5.32 5.06 15.25 1.950.48 11.71 64.64 5.36 5.06 15.73 1.940.49 11.71 64.60 5.40 5.02 16.23 1.930.51 12.08 64.56 5.44 5.16 16.67 1.95
Principal Stress Difference (psi)
Axial Strain (%)
Principal Stress Ratio
Displacement (in) Force (lb) Pore Pressure
(psi)Effective Confining
Stress (psi)
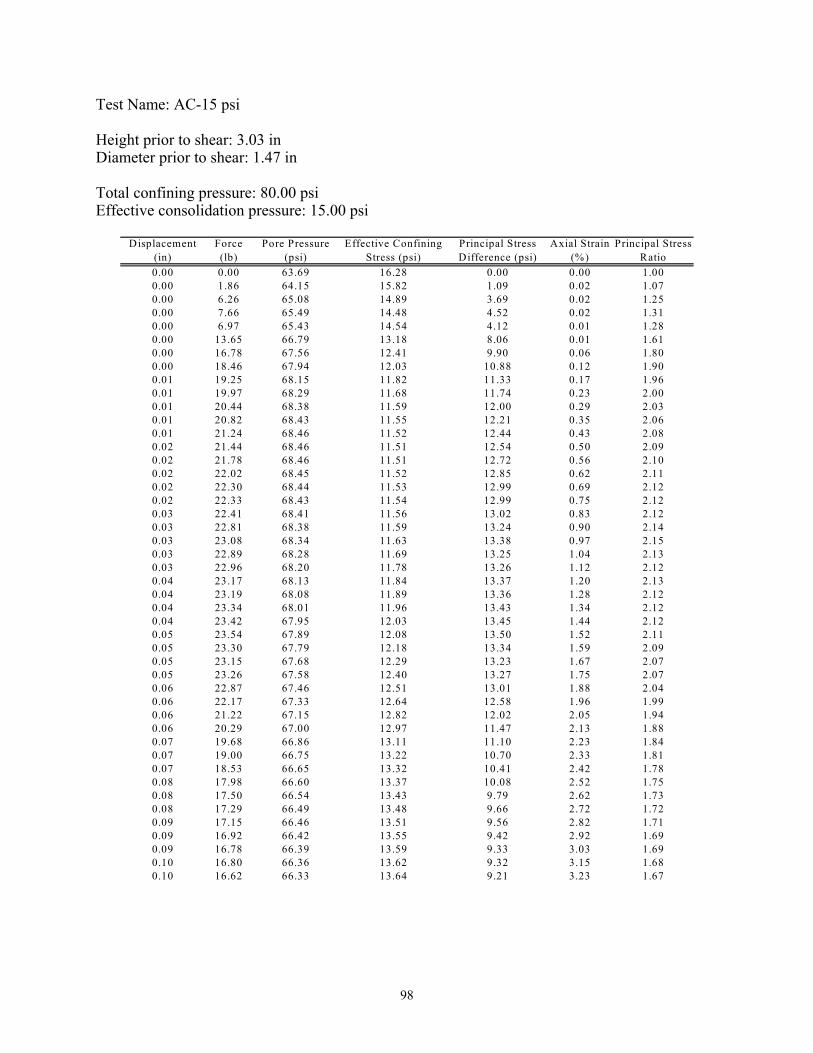
98
Test Name: AC-15 psi Height prior to shear: 3.03 in Diameter prior to shear: 1.47 in Total confining pressure: 80.00 psi Effective consolidation pressure: 15.00 psi
0.00 0.00 63.69 16.28 0.00 0.00 1.000.00 1.86 64.15 15.82 1.09 0.02 1.070.00 6.26 65.08 14.89 3.69 0.02 1.250.00 7.66 65.49 14.48 4.52 0.02 1.310.00 6.97 65.43 14.54 4.12 0.01 1.280.00 13.65 66.79 13.18 8.06 0.01 1.610.00 16.78 67.56 12.41 9.90 0.06 1.800.00 18.46 67.94 12.03 10.88 0.12 1.900.01 19.25 68.15 11.82 11.33 0.17 1.960.01 19.97 68.29 11.68 11.74 0.23 2.000.01 20.44 68.38 11.59 12.00 0.29 2.030.01 20.82 68.43 11.55 12.21 0.35 2.060.01 21.24 68.46 11.52 12.44 0.43 2.080.02 21.44 68.46 11.51 12.54 0.50 2.090.02 21.78 68.46 11.51 12.72 0.56 2.100.02 22.02 68.45 11.52 12.85 0.62 2.110.02 22.30 68.44 11.53 12.99 0.69 2.120.02 22.33 68.43 11.54 12.99 0.75 2.120.03 22.41 68.41 11.56 13.02 0.83 2.120.03 22.81 68.38 11.59 13.24 0.90 2.140.03 23.08 68.34 11.63 13.38 0.97 2.150.03 22.89 68.28 11.69 13.25 1.04 2.130.03 22.96 68.20 11.78 13.26 1.12 2.120.04 23.17 68.13 11.84 13.37 1.20 2.130.04 23.19 68.08 11.89 13.36 1.28 2.120.04 23.34 68.01 11.96 13.43 1.34 2.120.04 23.42 67.95 12.03 13.45 1.44 2.120.05 23.54 67.89 12.08 13.50 1.52 2.110.05 23.30 67.79 12.18 13.34 1.59 2.090.05 23.15 67.68 12.29 13.23 1.67 2.070.05 23.26 67.58 12.40 13.27 1.75 2.070.06 22.87 67.46 12.51 13.01 1.88 2.040.06 22.17 67.33 12.64 12.58 1.96 1.990.06 21.22 67.15 12.82 12.02 2.05 1.940.06 20.29 67.00 12.97 11.47 2.13 1.880.07 19.68 66.86 13.11 11.10 2.23 1.840.07 19.00 66.75 13.22 10.70 2.33 1.810.07 18.53 66.65 13.32 10.41 2.42 1.780.08 17.98 66.60 13.37 10.08 2.52 1.750.08 17.50 66.54 13.43 9.79 2.62 1.730.08 17.29 66.49 13.48 9.66 2.72 1.720.09 17.15 66.46 13.51 9.56 2.82 1.710.09 16.92 66.42 13.55 9.42 2.92 1.690.09 16.78 66.39 13.59 9.33 3.03 1.690.10 16.80 66.36 13.62 9.32 3.15 1.680.10 16.62 66.33 13.64 9.21 3.23 1.67
Principal Stress Difference (psi)
Axial Strain (%)
Principal Stress Ratio
Displacement (in)
Force (lb)
Pore Pressure (psi)
Effective Confining Stress (psi)

99
Test Name: AC-25 psi Height prior to shear: 3.06 in Diameter prior to shear: 1.44 in Total confining pressure: 85.00 psi Effective consolidation pressure: 25.00 psi
0.00 0.00 57.42 27.53 0.00 0.00 1.000.00 1.68 57.92 27.03 1.02 0.05 1.040.00 7.63 59.58 25.37 4.66 0.06 1.190.01 20.16 63.01 21.94 12.26 0.33 1.560.02 24.19 64.47 20.48 14.60 0.75 1.710.04 26.76 65.26 19.69 16.01 1.29 1.810.06 28.36 65.72 19.24 16.80 1.85 1.870.07 29.24 66.00 18.95 17.20 2.41 1.910.09 30.54 66.17 18.78 17.86 2.97 1.950.11 31.32 66.27 18.68 18.21 3.53 1.970.12 31.92 66.31 18.64 18.44 4.08 1.990.14 32.41 66.30 18.65 18.61 4.63 2.000.16 32.92 66.27 18.68 18.79 5.18 2.000.18 33.52 66.21 18.74 19.01 5.75 2.010.19 33.90 66.14 18.81 19.10 6.32 2.010.21 34.18 66.03 18.92 19.13 6.89 2.010.23 34.41 65.92 19.03 19.13 7.45 2.000.25 34.65 65.80 19.15 19.13 8.02 2.000.26 34.37 65.67 19.28 18.84 8.59 1.970.28 34.07 65.53 19.42 18.55 9.16 1.950.30 33.75 65.37 19.59 18.24 9.74 1.930.32 32.88 65.18 19.77 17.63 10.31 1.890.33 31.75 64.93 20.02 16.88 10.89 1.840.35 30.22 64.60 20.35 15.93 11.46 1.780.37 28.68 64.33 20.62 14.98 12.05 1.720.39 27.96 64.20 20.75 14.48 12.63 1.700.40 27.13 64.12 20.83 13.93 13.20 1.670.42 26.64 64.09 20.87 13.56 13.78 1.650.44 26.23 64.06 20.89 13.24 14.36 1.630.46 26.49 64.06 20.89 13.27 14.95 1.630.48 26.42 64.06 20.89 13.13 15.53 1.630.49 26.44 64.07 20.88 13.03 16.11 1.620.51 26.40 64.07 20.88 12.91 16.69 1.620.53 26.32 64.06 20.89 12.76 17.27 1.610.55 26.21 64.08 20.88 12.60 17.85 1.600.56 26.27 64.07 20.88 12.53 18.44 1.600.58 26.76 64.06 20.89 12.66 19.03 1.600.60 27.04 64.04 20.91 12.69 19.61 1.610.62 27.45 64.03 20.92 12.78 20.19 1.610.64 27.70 64.02 20.93 12.80 20.77 1.610.65 27.77 63.99 20.96 12.72 21.36 1.610.67 27.89 63.94 21.01 12.67 21.93 1.600.69 28.08 63.91 21.04 12.65 22.52 1.600.71 28.06 63.88 21.07 12.52 23.11 1.590.72 28.43 63.85 21.11 12.58 23.69 1.590.74 28.70 63.81 21.14 12.63 24.08 1.60
Principal Stress Difference (psi)
Axial Strain (%)
Principal Stress Ratio
Displacement (in) Force (lb) Pore Pressure
(psi)Effective Confining
Stress (psi)

100
Test Name: AC-40 psi Height prior to shear: 3.28 in Diameter prior to shear: 1.33 in Total confining pressure: 85.00 psi Effective consolidation pressure: 40.00 psi
0 .00 0.00 45 .56 39 .29 0 .00 0 .00 1 .000 .00 2.19 46 .58 38 .27 1 .57 0 .01 1 .040 .00 6.93 48 .19 36 .65 4 .95 0 .09 1 .140 .01 16 .83 50 .69 34 .15 12 .02 0 .23 1 .350 .01 25 .78 53 .19 31 .65 18 .37 0 .39 1 .580 .02 29 .94 54 .44 30 .40 21 .27 0 .59 1 .700 .03 32 .54 55 .31 29 .54 23 .04 0 .80 1 .780 .03 34 .82 55 .90 28 .94 24 .57 1 .02 1 .840 .04 36 .52 56 .29 28 .55 25 .70 1 .24 1 .900 .05 38 .08 56 .52 28 .32 26 .70 1 .49 1 .940 .06 39 .55 56 .66 28 .19 27 .62 1 .74 1 .970 .07 40 .98 56 .72 28 .13 28 .50 2 .05 2 .010 .08 42 .40 56 .73 28 .12 29 .39 2 .41 2 .040 .09 43 .15 56 .66 28 .19 29 .77 2 .82 2 .050 .11 44 .07 56 .57 28 .27 30 .25 3 .31 2 .060 .13 44 .68 56 .45 28 .40 30 .50 3 .82 2 .070 .14 45 .41 56 .31 28 .54 30 .82 4 .33 2 .070 .16 46 .13 56 .14 28 .70 31 .14 4 .84 2 .080 .18 46 .77 55 .96 28 .89 31 .39 5 .36 2 .080 .19 47 .11 55 .75 29 .09 31 .44 5 .87 2 .080 .21 47 .37 55 .53 29 .31 31 .43 6 .38 2 .070 .23 47 .11 55 .24 29 .61 31 .07 6 .89 2 .040 .24 45 .43 54 .79 30 .05 29 .77 7 .42 1 .990 .26 41 .51 54 .01 30 .83 26 .99 7 .95 1 .870 .28 35 .22 52 .96 31 .88 22 .70 8 .48 1 .710 .30 32 .01 52 .42 32 .42 20 .45 9 .01 1 .630 .31 30 .77 52 .21 32 .63 19 .52 9 .53 1 .600 .33 29 .87 52 .10 32 .75 18 .81 10 .06 1 .570 .35 29 .51 52 .03 32 .82 18 .45 10 .61 1 .560 .36 29 .11 51 .99 32 .86 18 .07 11 .13 1 .550 .38 29 .17 51 .97 32 .87 17 .98 11 .67 1 .540 .40 29 .43 51 .96 32 .89 18 .02 12 .21 1 .550 .42 29 .43 51 .93 32 .91 17 .90 12 .74 1 .540 .43 29 .32 51 .94 32 .91 17 .71 13 .27 1 .540 .45 29 .49 51 .96 32 .89 17 .69 13 .81 1 .540 .47 29 .70 51 .98 32 .86 17 .69 14 .35 1 .540 .49 29 .73 52 .01 32 .83 17 .58 14 .89 1 .530 .51 29 .94 52 .05 32 .80 17 .58 15 .44 1 .530 .52 29 .73 52 .06 32 .79 17 .32 15 .98 1 .530 .54 29 .41 52 .06 32 .78 17 .00 16 .52 1 .520 .56 29 .70 52 .05 32 .79 17 .06 17 .05 1 .520 .58 29 .85 52 .05 32 .80 17 .02 17 .60 1 .520 .59 30 .05 52 .04 32 .80 17 .00 18 .15 1 .520 .61 30 .24 52 .05 32 .80 16 .98 18 .69 1 .520 .63 30 .49 52 .06 32 .78 17 .00 19 .23 1 .520 .65 30 .66 52 .09 32 .75 16 .97 19 .78 1 .52
Principal S tress D ifference (psi)
A xial S train (% )
Principal S tress R atio
D isplacem ent (in)
Force (lb)
Pore P ressure (psi)
E ffective C onfining S tress (psi)

101
Test Name: NC-3 psi Height prior to shear: 3.29 in Diameter prior to shear: 1.46 in Total confining pressure: 38.00 psi Effective consolidation pressure: 3.00 psi
0.00 0.00 34.11 3.84 0.00 0.00 1.000.00 0.87 34.27 3.68 0.50 0.10 1.140.01 1.69 34.63 3.32 0.95 0.36 1.280.02 2.84 35.07 2.87 1.59 0.66 1.550.03 3.30 35.38 2.56 1.82 0.94 1.690.04 3.50 35.57 2.37 1.89 1.27 1.780.05 3.61 35.72 2.23 1.89 1.63 1.830.07 3.61 35.85 2.10 1.83 2.08 1.850.09 3.71 35.94 2.00 1.87 2.65 1.910.11 3.76 36.01 1.93 1.87 3.28 1.940.13 3.71 36.07 1.87 1.81 3.93 1.940.15 3.84 36.13 1.81 1.86 4.57 2.000.17 3.66 36.18 1.76 1.73 5.22 1.950.19 3.61 36.23 1.72 1.67 5.86 1.940.21 3.35 36.25 1.69 1.51 6.49 1.860.24 3.45 36.29 1.65 1.54 7.14 1.900.26 3.43 36.31 1.63 1.50 7.79 1.890.28 3.43 36.31 1.64 1.47 8.45 1.870.30 3.12 36.30 1.64 1.28 9.10 1.750.32 3.07 36.27 1.68 1.23 9.74 1.710.34 2.76 36.26 1.69 1.04 10.41 1.600.36 2.81 36.24 1.71 1.04 11.08 1.590.39 2.61 36.23 1.72 0.91 11.75 1.510.41 2.40 36.23 1.71 0.78 12.40 1.440.43 2.74 36.20 1.75 0.93 13.07 1.520.45 2.07 36.06 1.88 0.56 13.72 1.290.47 2.35 36.05 1.90 0.68 14.40 1.350.50 2.10 36.04 1.90 0.53 15.09 1.270.52 1.97 36.03 1.91 0.45 15.76 1.230.54 1.97 36.05 1.90 0.42 16.43 1.220.56 1.87 36.03 1.92 0.35 17.10 1.180.59 2.12 36.03 1.91 0.46 17.78 1.230.61 1.99 36.04 1.90 0.37 18.46 1.190.63 1.97 36.03 1.91 0.34 19.14 1.170.65 1.97 36.04 1.91 0.32 19.81 1.160.67 1.87 36.04 1.90 0.25 20.49 1.130.70 2.20 36.04 1.90 0.38 21.17 1.200.72 2.20 36.05 1.89 0.36 21.85 1.190.74 2.07 36.06 1.89 0.28 22.53 1.140.76 2.15 36.06 1.89 0.29 23.22 1.150.79 1.82 36.06 1.88 0.12 23.89 1.060.81 1.94 36.08 1.87 0.16 24.56 1.080.83 2.05 36.10 1.85 0.18 25.20 1.10
Principal Stress Difference (psi)
Axial Strain (%)
Principal Stress Ratio
Displacement (in)
Force (lb)
Pore Pressure (psi)
Effective Confining Stress (psi)
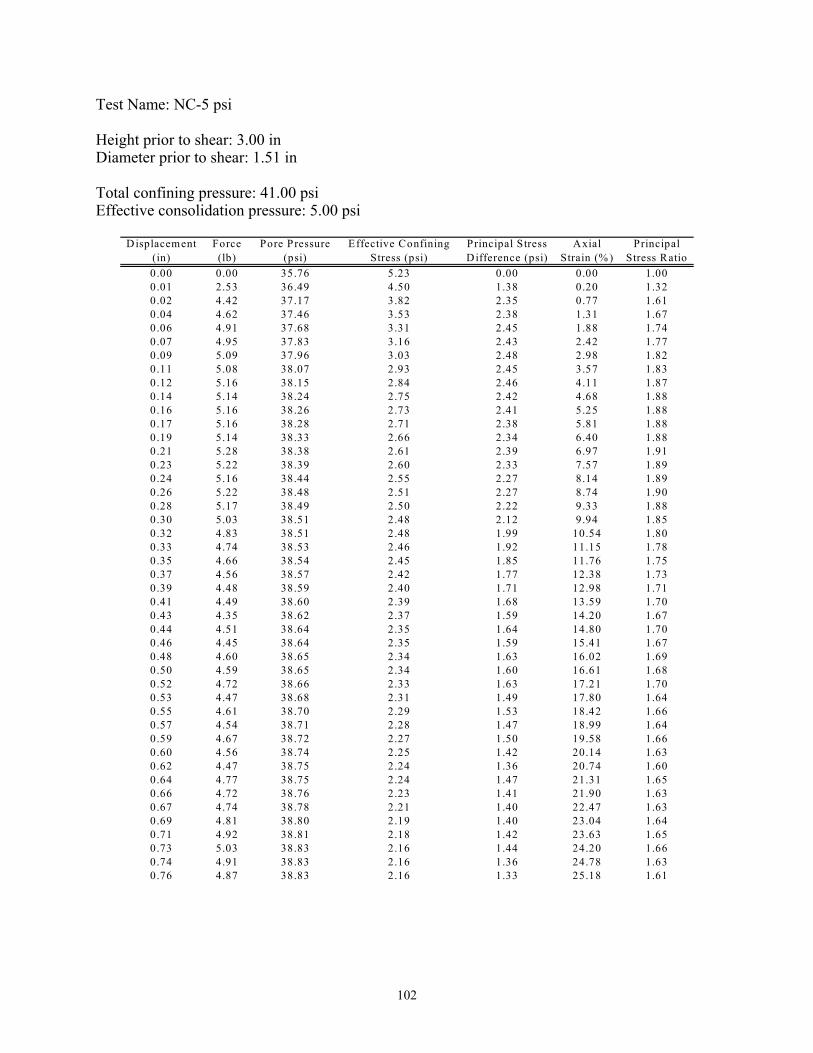
102
Test Name: NC-5 psi Height prior to shear: 3.00 in Diameter prior to shear: 1.51 in Total confining pressure: 41.00 psi Effective consolidation pressure: 5.00 psi
0.00 0.00 35.76 5.23 0.00 0.00 1.000.01 2.53 36.49 4.50 1.38 0.20 1.320.02 4.42 37.17 3.82 2.35 0.77 1.610.04 4.62 37.46 3.53 2.38 1.31 1.670.06 4.91 37.68 3.31 2.45 1.88 1.740.07 4.95 37.83 3.16 2.43 2.42 1.770.09 5.09 37.96 3.03 2.48 2.98 1.820.11 5.08 38.07 2.93 2.45 3.57 1.830.12 5.16 38.15 2.84 2.46 4.11 1.870.14 5.14 38.24 2.75 2.42 4.68 1.880.16 5.16 38.26 2.73 2.41 5.25 1.880.17 5.16 38.28 2.71 2.38 5.81 1.880.19 5.14 38.33 2.66 2.34 6.40 1.880.21 5.28 38.38 2.61 2.39 6.97 1.910.23 5.22 38.39 2.60 2.33 7.57 1.890.24 5.16 38.44 2.55 2.27 8.14 1.890.26 5.22 38.48 2.51 2.27 8.74 1.900.28 5.17 38.49 2.50 2.22 9.33 1.880.30 5.03 38.51 2.48 2.12 9.94 1.850.32 4.83 38.51 2.48 1.99 10.54 1.800.33 4.74 38.53 2.46 1.92 11.15 1.780.35 4.66 38.54 2.45 1.85 11.76 1.750.37 4.56 38.57 2.42 1.77 12.38 1.730.39 4.48 38.59 2.40 1.71 12.98 1.710.41 4.49 38.60 2.39 1.68 13.59 1.700.43 4.35 38.62 2.37 1.59 14.20 1.670.44 4.51 38.64 2.35 1.64 14.80 1.700.46 4.45 38.64 2.35 1.59 15.41 1.670.48 4.60 38.65 2.34 1.63 16.02 1.690.50 4.59 38.65 2.34 1.60 16.61 1.680.52 4.72 38.66 2.33 1.63 17.21 1.700.53 4.47 38.68 2.31 1.49 17.80 1.640.55 4.61 38.70 2.29 1.53 18.42 1.660.57 4.54 38.71 2.28 1.47 18.99 1.640.59 4.67 38.72 2.27 1.50 19.58 1.660.60 4.56 38.74 2.25 1.42 20.14 1.630.62 4.47 38.75 2.24 1.36 20.74 1.600.64 4.77 38.75 2.24 1.47 21.31 1.650.66 4.72 38.76 2.23 1.41 21.90 1.630.67 4.74 38.78 2.21 1.40 22.47 1.630.69 4.81 38.80 2.19 1.40 23.04 1.640.71 4.92 38.81 2.18 1.42 23.63 1.650.73 5.03 38.83 2.16 1.44 24.20 1.660.74 4.91 38.83 2.16 1.36 24.78 1.630.76 4.87 38.83 2.16 1.33 25.18 1.61
Principal Stress Difference (psi)
Axial Strain (% )
Principal Stress Ratio
Displacement (in)
Force (lb)
Pore Pressure (psi)
Effective Confining Stress (psi)

103
Test Name: NC-15 psi Height prior to shear: 3.85 in Diameter prior to shear: 1.39 in Total confining pressure: 48.00 psi Effective consolidation pressure: 15.00 psi
0.23 0.00 35.76 12.09 0.00 0.00 1.000.23 1.63 36.24 11.60 1.06 0.12 1.090.24 3.46 37.13 10.72 2.21 0.52 1.200.26 4.41 37.77 10.08 2.77 0.92 1.270.28 5.29 38.30 9.55 3.27 1.34 1.340.29 5.70 38.74 9.11 3.47 1.73 1.370.31 6.17 39.11 8.74 3.72 2.12 1.420.32 6.51 39.44 8.40 3.92 2.52 1.460.34 6.99 39.73 8.12 4.20 2.90 1.510.35 7.39 39.99 7.86 4.43 3.30 1.550.37 7.73 40.22 7.63 4.62 3.71 1.590.38 8.14 40.43 7.41 4.85 4.09 1.640.40 8.27 40.62 7.22 4.91 4.48 1.670.41 8.27 40.78 7.06 4.88 4.87 1.680.43 8.48 40.94 6.91 4.98 5.25 1.710.44 8.82 41.07 6.78 5.16 5.65 1.740.46 8.82 41.16 6.68 5.13 6.03 1.750.47 8.88 41.26 6.59 5.14 6.42 1.760.49 8.68 41.39 6.46 4.99 6.79 1.750.50 8.54 41.48 6.37 4.87 7.17 1.750.52 8.75 41.58 6.27 4.97 7.56 1.770.53 8.61 41.68 6.17 4.85 7.93 1.770.54 8.21 41.76 6.09 4.58 8.31 1.730.56 8.14 41.79 6.06 4.51 8.67 1.730.57 7.93 41.83 6.02 4.36 9.06 1.710.59 7.46 41.85 6.00 4.04 9.44 1.660.60 7.26 41.86 5.99 3.90 9.82 1.630.62 6.58 41.84 6.01 3.47 10.19 1.560.63 5.83 41.83 6.01 3.00 10.57 1.490.65 5.56 41.86 5.98 2.81 10.97 1.460.66 5.43 41.90 5.94 2.71 11.35 1.440.68 5.36 41.95 5.89 2.65 11.72 1.440.69 5.43 41.99 5.85 2.67 12.10 1.440.70 5.63 42.02 5.82 2.77 12.48 1.460.72 5.56 42.06 5.79 2.71 12.86 1.460.73 5.63 42.08 5.76 2.72 13.24 1.460.75 5.63 42.12 5.72 2.70 13.63 1.460.76 5.63 42.15 5.69 2.68 14.00 1.460.78 5.83 42.19 5.66 2.77 14.39 1.480.79 5.83 42.21 5.63 2.75 14.77 1.470.81 6.10 42.24 5.61 2.88 15.16 1.500.82 5.90 42.26 5.59 2.74 15.54 1.480.84 5.97 42.29 5.56 2.75 15.92 1.480.85 5.97 42.31 5.53 2.73 16.31 1.48
Principal Stress Difference (psi)
Axial Strain (%)
Principal Stress Ratio
Displacement (in)
Force (lb)
Pore Pressure (psi)
Effective Confining Stress (psi)
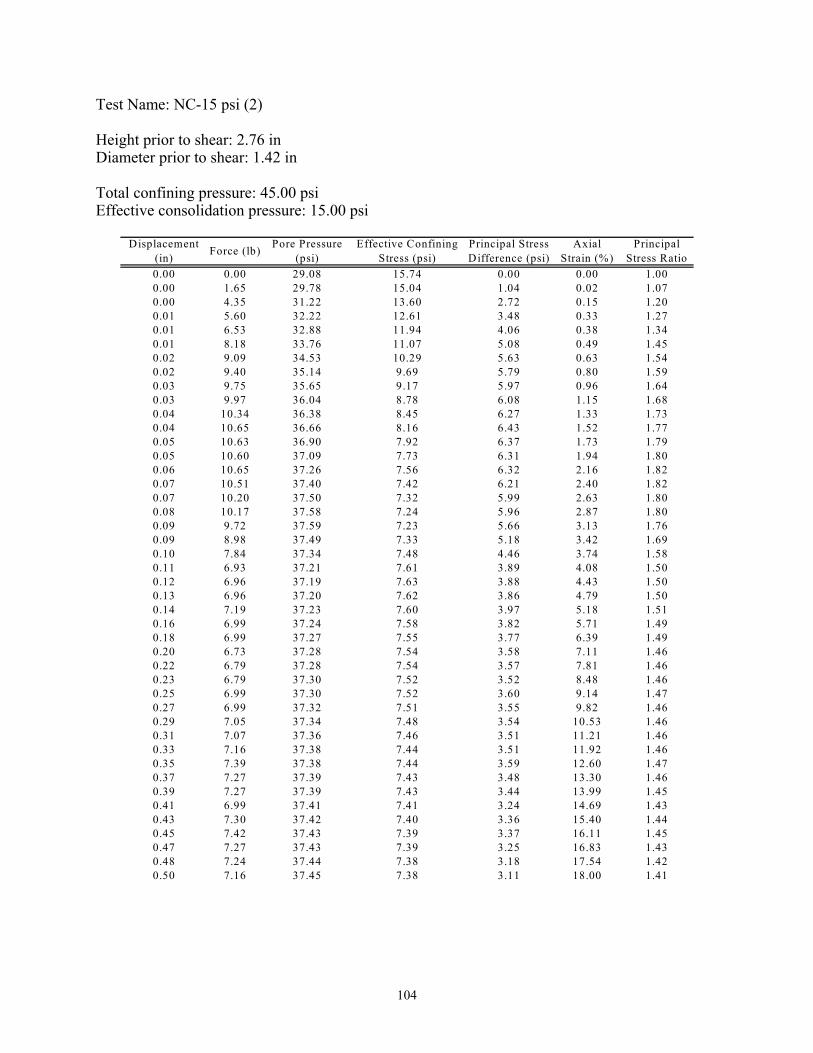
104
Test Name: NC-15 psi (2) Height prior to shear: 2.76 in Diameter prior to shear: 1.42 in Total confining pressure: 45.00 psi Effective consolidation pressure: 15.00 psi
0.00 0.00 29.08 15.74 0.00 0.00 1.000.00 1.65 29.78 15.04 1.04 0.02 1.070.00 4.35 31.22 13.60 2.72 0.15 1.200.01 5.60 32.22 12.61 3.48 0.33 1.270.01 6.53 32.88 11.94 4.06 0.38 1.340.01 8.18 33.76 11.07 5.08 0.49 1.450.02 9.09 34.53 10.29 5.63 0.63 1.540.02 9.40 35.14 9.69 5.79 0.80 1.590.03 9.75 35.65 9.17 5.97 0.96 1.640.03 9.97 36.04 8.78 6.08 1.15 1.680.04 10.34 36.38 8.45 6.27 1.33 1.730.04 10.65 36.66 8.16 6.43 1.52 1.770.05 10.63 36.90 7.92 6.37 1.73 1.790.05 10.60 37.09 7.73 6.31 1.94 1.800.06 10.65 37.26 7.56 6.32 2.16 1.820.07 10.51 37.40 7.42 6.21 2.40 1.820.07 10.20 37.50 7.32 5.99 2.63 1.800.08 10.17 37.58 7.24 5.96 2.87 1.800.09 9.72 37.59 7.23 5.66 3.13 1.760.09 8.98 37.49 7.33 5.18 3.42 1.690.10 7.84 37.34 7.48 4.46 3.74 1.580.11 6.93 37.21 7.61 3.89 4.08 1.500.12 6.96 37.19 7.63 3.88 4.43 1.500.13 6.96 37.20 7.62 3.86 4.79 1.500.14 7.19 37.23 7.60 3.97 5.18 1.510.16 6.99 37.24 7.58 3.82 5.71 1.490.18 6.99 37.27 7.55 3.77 6.39 1.490.20 6.73 37.28 7.54 3.58 7.11 1.460.22 6.79 37.28 7.54 3.57 7.81 1.460.23 6.79 37.30 7.52 3.52 8.48 1.460.25 6.99 37.30 7.52 3.60 9.14 1.470.27 6.99 37.32 7.51 3.55 9.82 1.460.29 7.05 37.34 7.48 3.54 10.53 1.460.31 7.07 37.36 7.46 3.51 11.21 1.460.33 7.16 37.38 7.44 3.51 11.92 1.460.35 7.39 37.38 7.44 3.59 12.60 1.470.37 7.27 37.39 7.43 3.48 13.30 1.460.39 7.27 37.39 7.43 3.44 13.99 1.450.41 6.99 37.41 7.41 3.24 14.69 1.430.43 7.30 37.42 7.40 3.36 15.40 1.440.45 7.42 37.43 7.39 3.37 16.11 1.450.47 7.27 37.43 7.39 3.25 16.83 1.430.48 7.24 37.44 7.38 3.18 17.54 1.420.50 7.16 37.45 7.38 3.11 18.00 1.41
Principal Stress Difference (psi)
Axial Strain (%)
Principal Stress Ratio
Displacement (in) Force (lb) Pore Pressure
(psi)Effective Confining
Stress (psi)

105
Test Name: NC-25 psi Height prior to shear: 2.85 in Diameter prior to shear: 1.47 in Total confining pressure: 60.00 psi Effective consolidation pressure: 25.00 psi
0.00 0.00 36.84 23.00 0.00 0.00 1.000.01 3.02 37.50 22.34 1.75 0.24 1.080.02 8.70 39.54 20.30 5.00 0.73 1.250.03 10.75 40.79 19.05 6.11 1.22 1.320.05 12.02 41.73 18.11 6.75 1.69 1.370.06 12.91 42.51 17.33 7.19 2.17 1.410.08 13.72 43.18 16.66 7.61 2.67 1.450.09 14.27 43.76 16.08 7.87 3.15 1.480.10 14.88 44.30 15.54 8.17 3.63 1.520.12 15.13 44.74 15.10 8.26 4.12 1.540.13 15.41 45.11 14.73 8.36 4.59 1.560.14 15.79 45.45 14.39 8.53 5.06 1.590.16 15.86 45.75 14.09 8.51 5.55 1.600.17 16.07 46.02 13.82 8.57 6.02 1.610.19 16.61 46.27 13.57 8.82 6.49 1.640.20 16.45 46.47 13.37 8.67 6.97 1.640.21 16.70 46.65 13.19 8.75 7.45 1.660.23 16.50 46.78 13.06 8.59 7.91 1.650.24 16.34 46.90 12.94 8.44 8.40 1.640.25 15.86 46.95 12.89 8.13 8.86 1.620.27 15.41 46.99 12.85 7.84 9.33 1.600.28 15.27 47.08 12.76 7.71 9.81 1.600.29 15.27 47.19 12.65 7.66 10.25 1.600.31 15.22 47.26 12.57 7.59 10.72 1.600.32 15.20 47.35 12.49 7.52 11.18 1.590.33 15.25 47.42 12.42 7.50 11.64 1.600.34 15.11 47.46 12.38 7.38 12.09 1.590.36 15.00 47.52 12.32 7.27 12.55 1.580.37 15.04 47.55 12.29 7.24 13.01 1.580.38 14.59 47.55 12.29 6.96 13.47 1.560.40 14.32 47.58 12.26 6.77 13.93 1.550.41 14.22 47.61 12.23 6.68 14.39 1.540.42 14.00 47.62 12.22 6.52 14.84 1.530.44 14.04 47.60 12.24 6.49 15.31 1.520.45 13.68 47.62 12.22 6.27 15.76 1.510.46 13.59 47.64 12.20 6.17 16.24 1.500.48 13.43 47.65 12.19 6.05 16.69 1.490.49 13.59 47.68 12.16 6.08 17.16 1.490.50 13.45 47.71 12.13 5.97 17.63 1.490.52 13.47 47.73 12.11 5.93 18.08 1.480.53 13.63 47.73 12.11 5.96 18.55 1.490.54 13.47 47.78 12.06 5.84 18.99 1.48
Principal Stress Difference (psi)
Axial Strain (%)
Principal Stress Ratio
Displacement (in)
Force (lb)
Pore Pressure (psi)
Effective Confining Stress (psi)
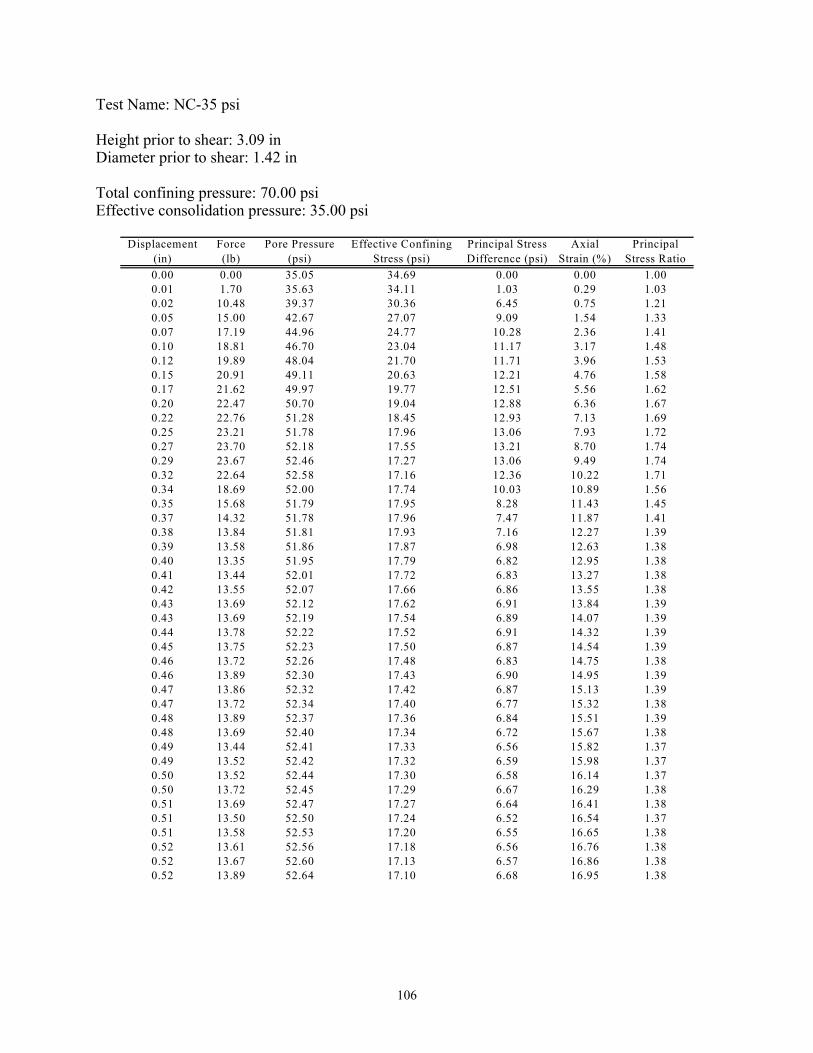
106
Test Name: NC-35 psi Height prior to shear: 3.09 in Diameter prior to shear: 1.42 in Total confining pressure: 70.00 psi Effective consolidation pressure: 35.00 psi
0.00 0.00 35.05 34.69 0.00 0.00 1.000.01 1.70 35.63 34.11 1.03 0.29 1.030.02 10.48 39.37 30.36 6.45 0.75 1.210.05 15.00 42.67 27.07 9.09 1.54 1.330.07 17.19 44.96 24.77 10.28 2.36 1.410.10 18.81 46.70 23.04 11.17 3.17 1.480.12 19.89 48.04 21.70 11.71 3.96 1.530.15 20.91 49.11 20.63 12.21 4.76 1.580.17 21.62 49.97 19.77 12.51 5.56 1.620.20 22.47 50.70 19.04 12.88 6.36 1.670.22 22.76 51.28 18.45 12.93 7.13 1.690.25 23.21 51.78 17.96 13.06 7.93 1.720.27 23.70 52.18 17.55 13.21 8.70 1.740.29 23.67 52.46 17.27 13.06 9.49 1.740.32 22.64 52.58 17.16 12.36 10.22 1.710.34 18.69 52.00 17.74 10.03 10.89 1.560.35 15.68 51.79 17.95 8.28 11.43 1.450.37 14.32 51.78 17.96 7.47 11.87 1.410.38 13.84 51.81 17.93 7.16 12.27 1.390.39 13.58 51.86 17.87 6.98 12.63 1.380.40 13.35 51.95 17.79 6.82 12.95 1.380.41 13.44 52.01 17.72 6.83 13.27 1.380.42 13.55 52.07 17.66 6.86 13.55 1.380.43 13.69 52.12 17.62 6.91 13.84 1.390.43 13.69 52.19 17.54 6.89 14.07 1.390.44 13.78 52.22 17.52 6.91 14.32 1.390.45 13.75 52.23 17.50 6.87 14.54 1.390.46 13.72 52.26 17.48 6.83 14.75 1.380.46 13.89 52.30 17.43 6.90 14.95 1.390.47 13.86 52.32 17.42 6.87 15.13 1.390.47 13.72 52.34 17.40 6.77 15.32 1.380.48 13.89 52.37 17.36 6.84 15.51 1.390.48 13.69 52.40 17.34 6.72 15.67 1.380.49 13.44 52.41 17.33 6.56 15.82 1.370.49 13.52 52.42 17.32 6.59 15.98 1.370.50 13.52 52.44 17.30 6.58 16.14 1.370.50 13.72 52.45 17.29 6.67 16.29 1.380.51 13.69 52.47 17.27 6.64 16.41 1.380.51 13.50 52.50 17.24 6.52 16.54 1.370.51 13.58 52.53 17.20 6.55 16.65 1.380.52 13.61 52.56 17.18 6.56 16.76 1.380.52 13.67 52.60 17.13 6.57 16.86 1.380.52 13.89 52.64 17.10 6.68 16.95 1.38
Principal Stress Difference (psi)
Axial Strain (%)
Principal Stress Ratio
Displacement (in)
Force (lb)
Pore Pressure (psi)
Effective Confining Stress (psi)

107
Test Name: NC-40 psi Height prior to shear: 2.74 in Diameter prior to shear: 1.40 in Total confining pressure: 75.00 psi Effective consolidation pressure: 40.00 psi
0.00 0.00 30.01 44.67 0.00 0.00 1.000.00 3.99 31.34 43.34 2.58 0.13 1.060.02 14.09 36.25 38.43 9.05 0.58 1.230.04 17.98 40.12 34.56 11.37 1.33 1.330.06 20.48 42.75 31.93 12.80 2.08 1.400.08 21.71 44.65 30.03 13.45 2.82 1.440.09 22.14 45.76 28.92 13.65 3.27 1.470.11 24.45 47.11 27.57 14.96 4.06 1.540.13 25.34 48.18 26.50 15.37 4.85 1.570.15 26.29 49.10 25.58 15.81 5.64 1.610.18 27.05 49.85 24.83 16.12 6.44 1.640.20 27.67 50.49 24.19 16.34 7.24 1.670.22 27.95 51.03 23.65 16.34 8.06 1.680.24 28.61 51.50 23.18 16.57 8.87 1.710.27 28.33 51.83 22.85 16.24 9.67 1.700.29 27.57 52.00 22.68 15.63 10.48 1.680.31 25.98 52.13 22.55 14.55 11.28 1.640.33 24.14 52.29 22.39 13.34 12.08 1.590.35 22.73 52.40 22.28 12.40 12.90 1.550.38 21.71 52.42 22.26 11.68 13.72 1.520.40 20.56 52.31 22.37 10.91 14.52 1.480.42 19.54 52.16 22.52 10.22 15.34 1.450.44 19.13 52.23 22.45 9.88 16.14 1.430.47 18.95 52.26 22.42 9.66 16.95 1.420.49 18.72 52.32 22.36 9.42 17.78 1.420.51 18.44 52.35 22.33 9.16 18.60 1.400.53 18.33 52.40 22.28 8.99 19.42 1.400.55 18.18 52.43 22.25 8.80 20.21 1.390.58 18.13 52.47 22.21 8.66 21.01 1.380.60 17.90 52.51 22.17 8.43 21.83 1.370.62 17.98 52.54 22.14 8.35 22.64 1.370.64 17.92 52.55 22.13 8.21 23.46 1.370.67 17.82 52.55 22.13 8.05 24.28 1.360.69 17.82 52.55 22.13 7.94 25.07 1.350.71 17.67 52.56 22.12 7.76 25.86 1.350.73 17.46 52.56 22.12 7.55 26.70 1.340.76 17.59 52.57 22.11 7.50 27.53 1.330.78 17.67 52.61 22.07 7.42 28.35 1.330.80 17.46 52.63 22.05 7.22 29.16 1.320.82 17.80 52.65 22.03 7.26 29.96 1.320.84 17.80 52.67 22.01 7.15 30.76 1.320.87 17.80 52.67 22.01 7.04 31.59 1.320.89 17.90 52.69 21.99 6.98 32.33 1.31
Principal Stress Difference (psi)
Axial Strain (%)
Principal Stress Ratio
Displacement (in)
Force (lb)
Pore Pressure (psi)
Effective Confining Stress (psi)
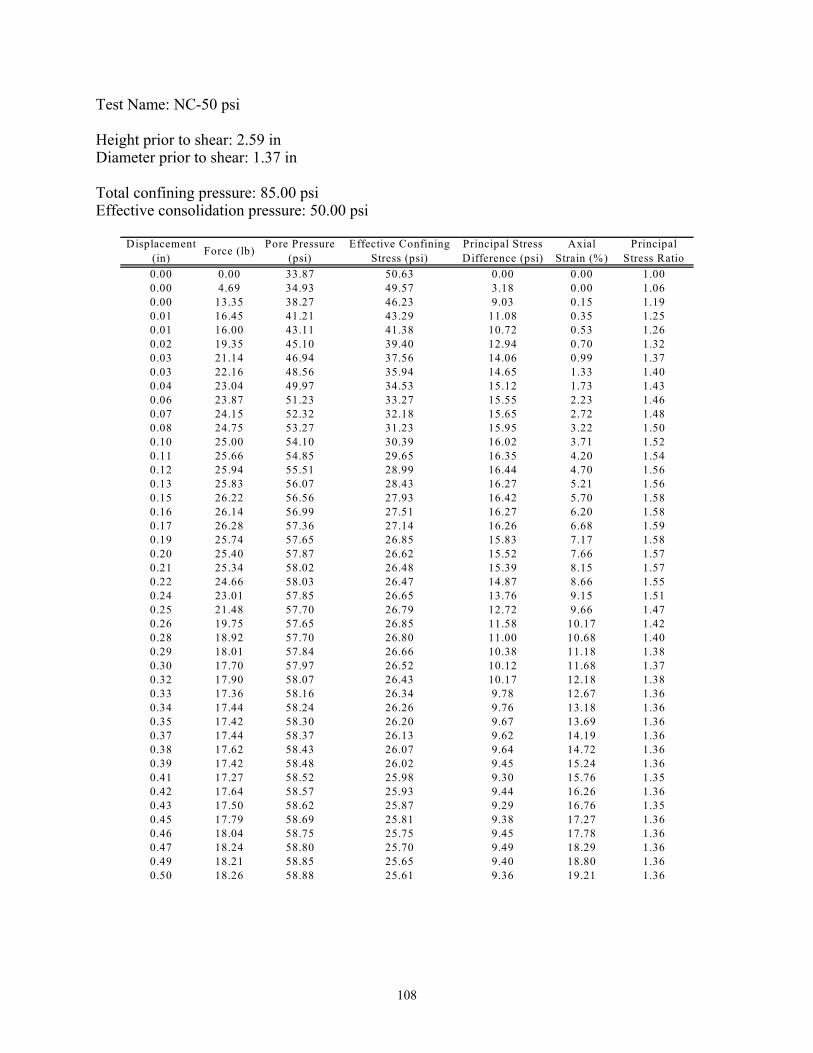
108
Test Name: NC-50 psi Height prior to shear: 2.59 in Diameter prior to shear: 1.37 in Total confining pressure: 85.00 psi Effective consolidation pressure: 50.00 psi
0.00 0.00 33.87 50.63 0.00 0.00 1.000.00 4.69 34.93 49.57 3.18 0.00 1.060.00 13.35 38.27 46.23 9.03 0.15 1.190.01 16.45 41.21 43.29 11.08 0.35 1.250.01 16.00 43.11 41.38 10.72 0.53 1.260.02 19.35 45.10 39.40 12.94 0.70 1.320.03 21.14 46.94 37.56 14.06 0.99 1.370.03 22.16 48.56 35.94 14.65 1.33 1.400.04 23.04 49.97 34.53 15.12 1.73 1.430.06 23.87 51.23 33.27 15.55 2.23 1.460.07 24.15 52.32 32.18 15.65 2.72 1.480.08 24.75 53.27 31.23 15.95 3.22 1.500.10 25.00 54.10 30.39 16.02 3.71 1.520.11 25.66 54.85 29.65 16.35 4.20 1.540.12 25.94 55.51 28.99 16.44 4.70 1.560.13 25.83 56.07 28.43 16.27 5.21 1.560.15 26.22 56.56 27.93 16.42 5.70 1.580.16 26.14 56.99 27.51 16.27 6.20 1.580.17 26.28 57.36 27.14 16.26 6.68 1.590.19 25.74 57.65 26.85 15.83 7.17 1.580.20 25.40 57.87 26.62 15.52 7.66 1.570.21 25.34 58.02 26.48 15.39 8.15 1.570.22 24.66 58.03 26.47 14.87 8.66 1.550.24 23.01 57.85 26.65 13.76 9.15 1.510.25 21.48 57.70 26.79 12.72 9.66 1.470.26 19.75 57.65 26.85 11.58 10.17 1.420.28 18.92 57.70 26.80 11.00 10.68 1.400.29 18.01 57.84 26.66 10.38 11.18 1.380.30 17.70 57.97 26.52 10.12 11.68 1.370.32 17.90 58.07 26.43 10.17 12.18 1.380.33 17.36 58.16 26.34 9.78 12.67 1.360.34 17.44 58.24 26.26 9.76 13.18 1.360.35 17.42 58.30 26.20 9.67 13.69 1.360.37 17.44 58.37 26.13 9.62 14.19 1.360.38 17.62 58.43 26.07 9.64 14.72 1.360.39 17.42 58.48 26.02 9.45 15.24 1.360.41 17.27 58.52 25.98 9.30 15.76 1.350.42 17.64 58.57 25.93 9.44 16.26 1.360.43 17.50 58.62 25.87 9.29 16.76 1.350.45 17.79 58.69 25.81 9.38 17.27 1.360.46 18.04 58.75 25.75 9.45 17.78 1.360.47 18.24 58.80 25.70 9.49 18.29 1.360.49 18.21 58.85 25.65 9.40 18.80 1.360.50 18.26 58.88 25.61 9.36 19.21 1.36
Principal Stress Difference (psi)
Axial Strain (%)
Principal Stress Ratio
Displacement (in) Force (lb) Pore Pressure
(psi)Effective Confining
Stress (psi)
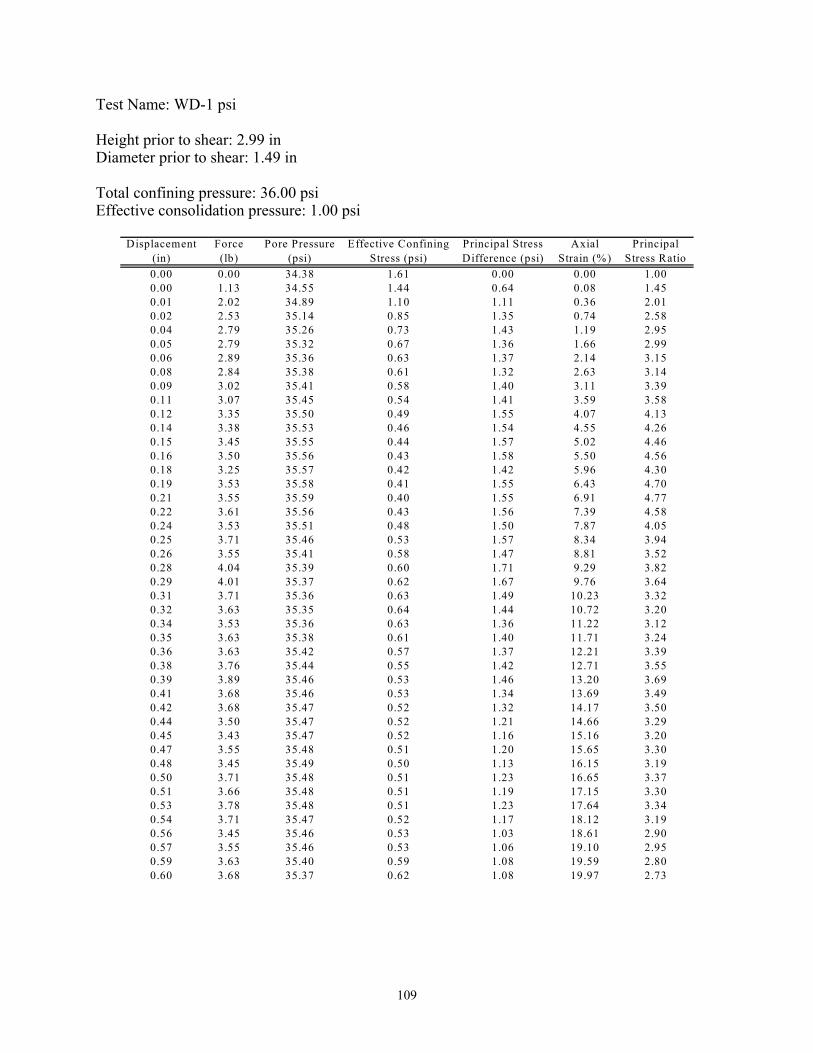
109
Test Name: WD-1 psi Height prior to shear: 2.99 in Diameter prior to shear: 1.49 in Total confining pressure: 36.00 psi Effective consolidation pressure: 1.00 psi
0.00 0.00 34.38 1.61 0.00 0.00 1.000.00 1.13 34.55 1.44 0.64 0.08 1.450.01 2.02 34.89 1.10 1.11 0.36 2.010.02 2.53 35.14 0.85 1.35 0.74 2.580.04 2.79 35.26 0.73 1.43 1.19 2.950.05 2.79 35.32 0.67 1.36 1.66 2.990.06 2.89 35.36 0.63 1.37 2.14 3.150.08 2.84 35.38 0.61 1.32 2.63 3.140.09 3.02 35.41 0.58 1.40 3.11 3.390.11 3.07 35.45 0.54 1.41 3.59 3.580.12 3.35 35.50 0.49 1.55 4.07 4.130.14 3.38 35.53 0.46 1.54 4.55 4.260.15 3.45 35.55 0.44 1.57 5.02 4.460.16 3.50 35.56 0.43 1.58 5.50 4.560.18 3.25 35.57 0.42 1.42 5.96 4.300.19 3.53 35.58 0.41 1.55 6.43 4.700.21 3.55 35.59 0.40 1.55 6.91 4.770.22 3.61 35.56 0.43 1.56 7.39 4.580.24 3.53 35.51 0.48 1.50 7.87 4.050.25 3.71 35.46 0.53 1.57 8.34 3.940.26 3.55 35.41 0.58 1.47 8.81 3.520.28 4.04 35.39 0.60 1.71 9.29 3.820.29 4.01 35.37 0.62 1.67 9.76 3.640.31 3.71 35.36 0.63 1.49 10.23 3.320.32 3.63 35.35 0.64 1.44 10.72 3.200.34 3.53 35.36 0.63 1.36 11.22 3.120.35 3.63 35.38 0.61 1.40 11.71 3.240.36 3.63 35.42 0.57 1.37 12.21 3.390.38 3.76 35.44 0.55 1.42 12.71 3.550.39 3.89 35.46 0.53 1.46 13.20 3.690.41 3.68 35.46 0.53 1.34 13.69 3.490.42 3.68 35.47 0.52 1.32 14.17 3.500.44 3.50 35.47 0.52 1.21 14.66 3.290.45 3.43 35.47 0.52 1.16 15.16 3.200.47 3.55 35.48 0.51 1.20 15.65 3.300.48 3.45 35.49 0.50 1.13 16.15 3.190.50 3.71 35.48 0.51 1.23 16.65 3.370.51 3.66 35.48 0.51 1.19 17.15 3.300.53 3.78 35.48 0.51 1.23 17.64 3.340.54 3.71 35.47 0.52 1.17 18.12 3.190.56 3.45 35.46 0.53 1.03 18.61 2.900.57 3.55 35.46 0.53 1.06 19.10 2.950.59 3.63 35.40 0.59 1.08 19.59 2.800.60 3.68 35.37 0.62 1.08 19.97 2.73
Principal Stress Difference (psi)
Axial Strain (%)
Principal Stress Ratio
Displacement (in)
Force (lb)
Pore Pressure (psi)
Effective Confining Stress (psi)
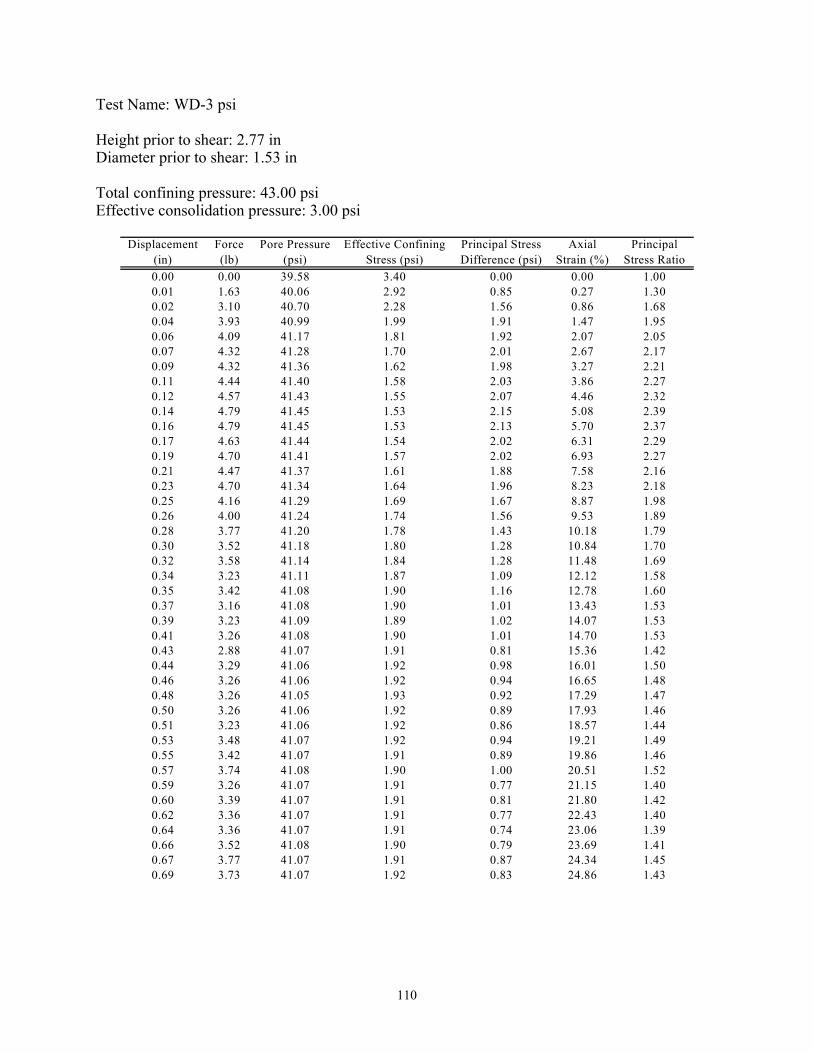
110
Test Name: WD-3 psi Height prior to shear: 2.77 in Diameter prior to shear: 1.53 in Total confining pressure: 43.00 psi Effective consolidation pressure: 3.00 psi
0.00 0.00 39.58 3.40 0.00 0.00 1.000.01 1.63 40.06 2.92 0.85 0.27 1.300.02 3.10 40.70 2.28 1.56 0.86 1.680.04 3.93 40.99 1.99 1.91 1.47 1.950.06 4.09 41.17 1.81 1.92 2.07 2.050.07 4.32 41.28 1.70 2.01 2.67 2.170.09 4.32 41.36 1.62 1.98 3.27 2.210.11 4.44 41.40 1.58 2.03 3.86 2.270.12 4.57 41.43 1.55 2.07 4.46 2.320.14 4.79 41.45 1.53 2.15 5.08 2.390.16 4.79 41.45 1.53 2.13 5.70 2.370.17 4.63 41.44 1.54 2.02 6.31 2.290.19 4.70 41.41 1.57 2.02 6.93 2.270.21 4.47 41.37 1.61 1.88 7.58 2.160.23 4.70 41.34 1.64 1.96 8.23 2.180.25 4.16 41.29 1.69 1.67 8.87 1.980.26 4.00 41.24 1.74 1.56 9.53 1.890.28 3.77 41.20 1.78 1.43 10.18 1.790.30 3.52 41.18 1.80 1.28 10.84 1.700.32 3.58 41.14 1.84 1.28 11.48 1.690.34 3.23 41.11 1.87 1.09 12.12 1.580.35 3.42 41.08 1.90 1.16 12.78 1.600.37 3.16 41.08 1.90 1.01 13.43 1.530.39 3.23 41.09 1.89 1.02 14.07 1.530.41 3.26 41.08 1.90 1.01 14.70 1.530.43 2.88 41.07 1.91 0.81 15.36 1.420.44 3.29 41.06 1.92 0.98 16.01 1.500.46 3.26 41.06 1.92 0.94 16.65 1.480.48 3.26 41.05 1.93 0.92 17.29 1.470.50 3.26 41.06 1.92 0.89 17.93 1.460.51 3.23 41.06 1.92 0.86 18.57 1.440.53 3.48 41.07 1.92 0.94 19.21 1.490.55 3.42 41.07 1.91 0.89 19.86 1.460.57 3.74 41.08 1.90 1.00 20.51 1.520.59 3.26 41.07 1.91 0.77 21.15 1.400.60 3.39 41.07 1.91 0.81 21.80 1.420.62 3.36 41.07 1.91 0.77 22.43 1.400.64 3.36 41.07 1.91 0.74 23.06 1.390.66 3.52 41.08 1.90 0.79 23.69 1.410.67 3.77 41.07 1.91 0.87 24.34 1.450.69 3.73 41.07 1.92 0.83 24.86 1.43
Principal Stress Difference (psi)
Axial Strain (%)
Principal Stress Ratio
Displacement (in)
Force (lb)
Pore Pressure (psi)
Effective Confining Stress (psi)

111
Test Name: WD-5 psi Height prior to shear: 2.73 in Diameter prior to shear: 1.52 in Total confining pressure: 41.00 psi Effective consolidation pressure: 5.00 psi
0.00 0.00 35.54 5.45 0.00 0.00 1.000.01 2.16 36.10 4.89 1.14 0.30 1.250.03 4.69 36.98 4.02 2.42 0.97 1.600.04 5.11 37.40 3.60 2.55 1.64 1.710.06 5.44 37.69 3.30 2.66 2.28 1.800.08 5.66 37.88 3.11 2.74 2.96 1.880.10 5.96 38.01 2.98 2.87 3.63 1.960.12 6.17 38.11 2.89 2.94 4.30 2.020.14 6.14 38.16 2.83 2.89 4.99 2.020.15 6.00 38.19 2.81 2.78 5.64 1.990.17 6.20 38.21 2.78 2.85 6.33 2.020.19 6.08 38.22 2.78 2.76 6.98 1.990.21 6.24 38.21 2.79 2.80 7.65 2.000.23 6.00 38.21 2.78 2.64 8.32 1.950.25 5.93 38.21 2.79 2.57 8.98 1.920.26 5.96 38.17 2.82 2.56 9.63 1.900.28 5.78 38.13 2.87 2.43 10.30 1.850.30 5.27 38.05 2.94 2.15 10.93 1.730.32 4.77 37.98 3.02 1.88 11.58 1.620.33 4.40 37.90 3.09 1.67 12.23 1.540.35 3.90 37.84 3.15 1.40 12.88 1.440.37 3.82 37.79 3.21 1.34 13.52 1.420.39 3.66 37.76 3.24 1.24 14.15 1.380.40 3.60 37.76 3.23 1.18 14.79 1.370.42 3.61 37.76 3.24 1.16 15.42 1.360.44 3.61 37.75 3.25 1.14 16.06 1.350.46 3.51 37.73 3.26 1.07 16.69 1.330.47 3.48 37.72 3.28 1.03 17.33 1.310.49 3.51 37.72 3.27 1.02 17.97 1.310.51 3.46 37.71 3.28 0.97 18.61 1.300.53 3.75 37.71 3.28 1.08 19.25 1.330.54 3.54 37.72 3.28 0.96 19.90 1.290.56 3.68 37.71 3.29 1.00 20.54 1.300.58 3.60 37.71 3.29 0.93 21.18 1.280.60 3.51 37.71 3.28 0.87 21.82 1.270.61 3.82 37.70 3.30 0.98 22.47 1.300.63 3.72 37.70 3.30 0.91 23.12 1.280.65 3.72 37.71 3.29 0.88 23.76 1.270.67 3.89 37.71 3.29 0.93 24.41 1.280.68 3.77 37.69 3.30 0.85 25.06 1.260.70 3.75 37.70 3.29 0.82 25.71 1.250.72 3.85 37.70 3.30 0.84 26.35 1.250.74 3.90 37.68 3.31 0.83 27.00 1.250.75 4.01 37.70 3.29 0.85 27.46 1.26
Principal Stress Difference (psi)
Axial Strain (%)
Principal Stress Ratio
Displacement (in)
Force (lb)
Pore Pressure (psi)
Effective Confining Stress (psi)

112
Test Name: WD-9 psi Height prior to shear: 2.81 in Diameter prior to shear: 1.52 in Total confining pressure: 44.00 psi Effective consolidation pressure: 9.00 psi
0.00 0.00 35.01 8.96 0.00 0.00 1.000.00 3.88 35.70 8.26 2.11 0.09 1.260.01 6.53 36.53 7.43 3.53 0.31 1.470.02 7.93 37.12 6.84 4.25 0.58 1.620.03 8.65 37.65 6.31 4.58 0.89 1.720.04 9.67 38.06 5.90 5.07 1.26 1.860.05 9.93 38.40 5.56 5.14 1.64 1.920.06 10.58 38.74 5.22 5.43 2.05 2.030.07 10.74 38.95 5.02 5.48 2.46 2.080.08 11.07 39.09 4.87 5.62 2.86 2.150.09 11.30 39.26 4.71 5.71 3.27 2.200.10 11.72 39.39 4.57 5.90 3.68 2.280.12 11.69 39.51 4.45 5.85 4.09 2.300.13 11.93 39.61 4.35 5.94 4.51 2.350.14 11.90 39.68 4.29 5.89 4.93 2.360.15 11.95 39.72 4.24 5.88 5.35 2.370.16 11.81 39.73 4.23 5.77 5.75 2.350.17 11.97 39.74 4.23 5.82 6.16 2.370.19 11.76 39.75 4.22 5.68 6.58 2.340.20 11.69 39.75 4.22 5.61 6.99 2.320.21 11.76 39.71 4.25 5.61 7.40 2.310.22 11.51 39.66 4.31 5.45 7.82 2.260.23 11.41 39.63 4.34 5.37 8.22 2.230.24 11.55 39.60 4.36 5.40 8.65 2.230.26 11.20 39.57 4.39 5.20 9.06 2.170.27 10.86 39.53 4.44 4.99 9.48 2.120.28 10.90 39.49 4.47 4.98 9.90 2.100.29 10.76 39.46 4.51 4.88 10.31 2.070.30 10.93 39.43 4.54 4.93 10.72 2.080.31 10.81 39.38 4.58 4.84 11.14 2.050.33 10.79 39.34 4.63 4.79 11.55 2.030.34 10.81 39.32 4.65 4.77 11.97 2.020.35 11.00 39.31 4.65 4.83 12.38 2.030.36 11.07 39.38 4.59 4.83 12.79 2.040.37 11.04 39.38 4.58 4.78 13.21 2.040.38 10.93 39.38 4.59 4.70 13.63 2.020.40 11.23 39.38 4.59 4.80 14.05 2.040.41 11.27 39.37 4.59 4.79 14.46 2.040.42 11.23 39.37 4.60 4.74 14.87 2.020.43 10.95 39.35 4.61 4.58 15.28 1.980.44 11.18 39.35 4.61 4.65 15.70 2.000.45 10.97 39.34 4.63 4.52 16.11 1.970.47 11.02 39.33 4.64 4.51 16.52 1.960.47 11.15 39.29 4.68 4.54 16.83 1.96
Principal Stress Difference (psi)
Axial Strain (%)
Principal Stress Ratio
Displacement (in) Force (lb) Pore Pressure
(psi)Effective Confining
Stress (psi)
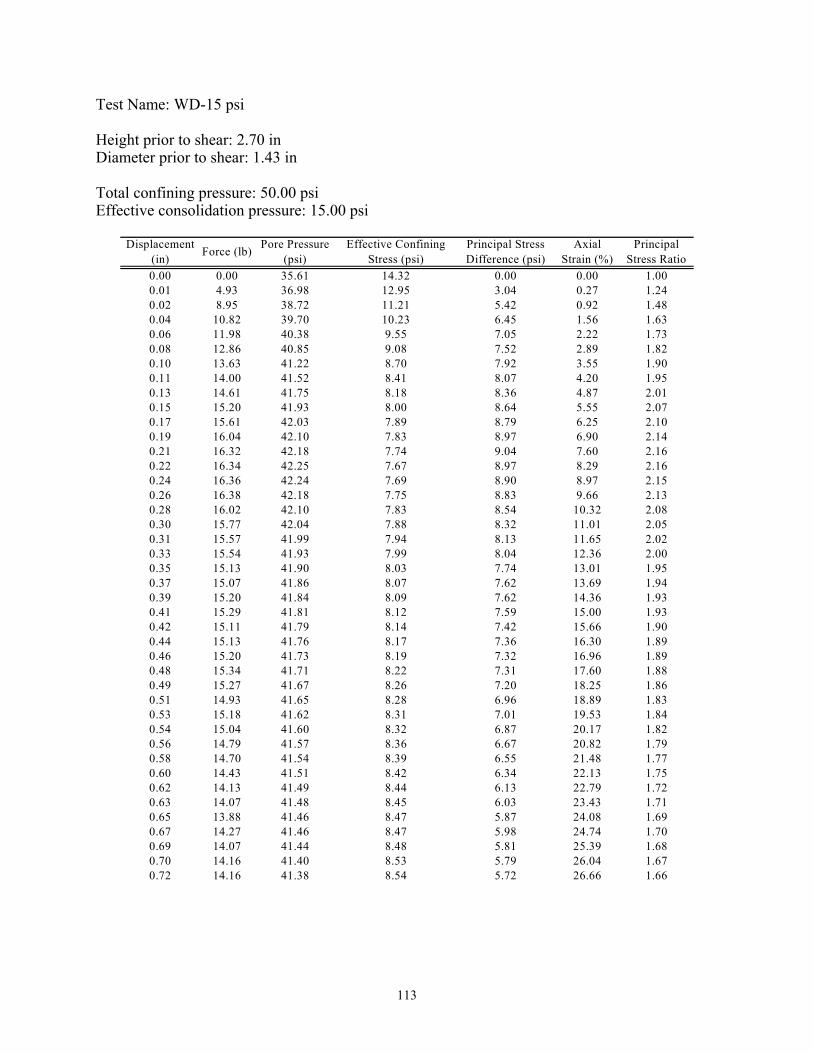
113
Test Name: WD-15 psi Height prior to shear: 2.70 in Diameter prior to shear: 1.43 in Total confining pressure: 50.00 psi Effective consolidation pressure: 15.00 psi
0.00 0.00 35.61 14.32 0.00 0.00 1.000.01 4.93 36.98 12.95 3.04 0.27 1.240.02 8.95 38.72 11.21 5.42 0.92 1.480.04 10.82 39.70 10.23 6.45 1.56 1.630.06 11.98 40.38 9.55 7.05 2.22 1.730.08 12.86 40.85 9.08 7.52 2.89 1.820.10 13.63 41.22 8.70 7.92 3.55 1.900.11 14.00 41.52 8.41 8.07 4.20 1.950.13 14.61 41.75 8.18 8.36 4.87 2.010.15 15.20 41.93 8.00 8.64 5.55 2.070.17 15.61 42.03 7.89 8.79 6.25 2.100.19 16.04 42.10 7.83 8.97 6.90 2.140.21 16.32 42.18 7.74 9.04 7.60 2.160.22 16.34 42.25 7.67 8.97 8.29 2.160.24 16.36 42.24 7.69 8.90 8.97 2.150.26 16.38 42.18 7.75 8.83 9.66 2.130.28 16.02 42.10 7.83 8.54 10.32 2.080.30 15.77 42.04 7.88 8.32 11.01 2.050.31 15.57 41.99 7.94 8.13 11.65 2.020.33 15.54 41.93 7.99 8.04 12.36 2.000.35 15.13 41.90 8.03 7.74 13.01 1.950.37 15.07 41.86 8.07 7.62 13.69 1.940.39 15.20 41.84 8.09 7.62 14.36 1.930.41 15.29 41.81 8.12 7.59 15.00 1.930.42 15.11 41.79 8.14 7.42 15.66 1.900.44 15.13 41.76 8.17 7.36 16.30 1.890.46 15.20 41.73 8.19 7.32 16.96 1.890.48 15.34 41.71 8.22 7.31 17.60 1.880.49 15.27 41.67 8.26 7.20 18.25 1.860.51 14.93 41.65 8.28 6.96 18.89 1.830.53 15.18 41.62 8.31 7.01 19.53 1.840.54 15.04 41.60 8.32 6.87 20.17 1.820.56 14.79 41.57 8.36 6.67 20.82 1.790.58 14.70 41.54 8.39 6.55 21.48 1.770.60 14.43 41.51 8.42 6.34 22.13 1.750.62 14.13 41.49 8.44 6.13 22.79 1.720.63 14.07 41.48 8.45 6.03 23.43 1.710.65 13.88 41.46 8.47 5.87 24.08 1.690.67 14.27 41.46 8.47 5.98 24.74 1.700.69 14.07 41.44 8.48 5.81 25.39 1.680.70 14.16 41.40 8.53 5.79 26.04 1.670.72 14.16 41.38 8.54 5.72 26.66 1.66
Principal Stress Difference (psi)
Axial Strain (%)
Principal Stress Ratio
Displacement (in) Force (lb) Pore Pressure
(psi)Effective Confining
Stress (psi)

114
Test Name: WD-25 psi Height prior to shear: 2.46 in Diameter prior to shear: 1.41 in Total confining pressure: 55.00 psi Effective consolidation pressure: 25.00 psi
0.00 0.00 31.33 23.64 0.00 0.00 1.000.00 5.73 32.60 22.37 3.61 0.16 1.170.01 11.42 34.55 20.42 7.15 0.60 1.350.03 13.85 35.66 19.31 8.58 1.02 1.440.04 15.25 36.56 18.41 9.36 1.48 1.510.05 16.45 37.28 17.69 10.01 1.91 1.570.06 17.76 37.91 17.07 10.76 2.35 1.630.07 18.84 38.42 16.55 11.37 2.78 1.690.08 19.75 38.85 16.12 11.87 3.24 1.730.09 20.63 39.20 15.77 12.34 3.64 1.780.10 21.30 39.51 15.46 12.69 4.09 1.820.11 22.12 39.77 15.20 13.12 4.50 1.860.12 22.79 40.00 14.97 13.46 4.94 1.900.13 23.55 40.19 14.78 13.84 5.38 1.930.14 24.07 40.34 14.63 14.08 5.80 1.960.15 24.66 40.47 14.50 14.36 6.23 1.990.16 25.10 40.53 14.44 14.55 6.64 2.010.17 25.33 40.60 14.37 14.60 7.09 2.010.18 26.06 40.66 14.31 14.96 7.50 2.040.20 26.09 40.70 14.27 14.90 7.93 2.040.21 26.50 40.71 14.26 15.06 8.35 2.050.22 26.79 40.71 14.27 15.14 8.78 2.060.23 27.02 40.68 14.29 15.19 9.22 2.060.24 27.26 40.68 14.30 15.25 9.61 2.060.25 27.43 40.66 14.31 15.27 10.03 2.070.26 27.49 40.61 14.36 15.22 10.46 2.060.27 27.67 40.54 14.43 15.24 10.88 2.050.28 27.40 40.46 14.51 15.01 11.30 2.030.29 27.35 40.38 14.60 14.90 11.69 2.020.30 27.17 40.26 14.71 14.72 12.11 2.000.31 26.24 40.11 14.87 14.12 12.52 1.950.32 24.92 39.81 15.16 13.31 12.94 1.880.33 23.40 39.55 15.42 12.40 13.36 1.800.34 22.58 39.39 15.59 11.88 13.76 1.760.35 22.17 39.33 15.64 11.59 14.18 1.740.36 22.03 39.31 15.66 11.44 14.60 1.730.37 21.74 39.29 15.68 11.22 15.00 1.710.38 21.47 39.26 15.72 11.01 15.42 1.700.39 21.30 39.24 15.74 10.85 15.83 1.690.40 21.21 39.21 15.76 10.74 16.25 1.680.41 21.04 39.20 15.77 10.59 16.65 1.670.42 21.15 39.19 15.78 10.58 17.08 1.670.43 21.21 39.19 15.78 10.55 17.49 1.670.44 21.53 39.21 15.77 10.65 17.93 1.670.45 21.73 39.21 15.76 10.70 18.23 1.68
Principal Stress Difference (psi)
Axial Strain (%)
Principal Stress Ratio
Displacement (in) Force (lb) Pore Pressure
(psi)Effective Confining
Stress (psi)
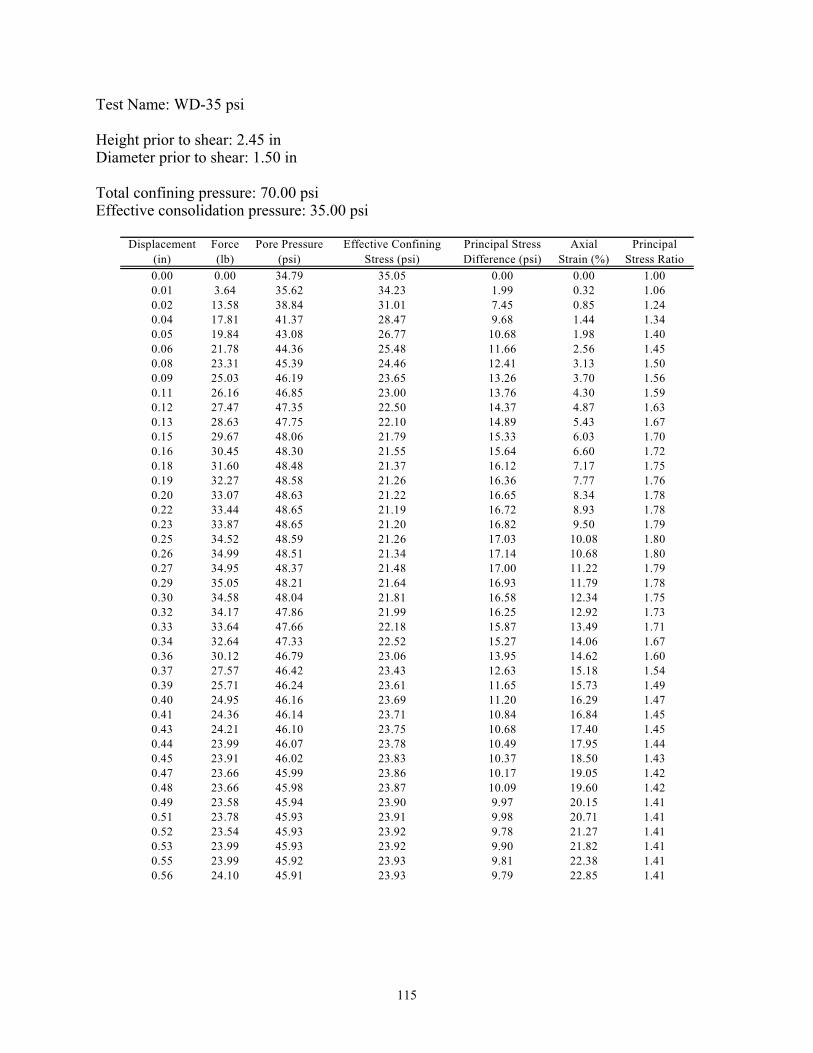
115
Test Name: WD-35 psi Height prior to shear: 2.45 in Diameter prior to shear: 1.50 in Total confining pressure: 70.00 psi Effective consolidation pressure: 35.00 psi
0.00 0.00 34.79 35.05 0.00 0.00 1.000.01 3.64 35.62 34.23 1.99 0.32 1.060.02 13.58 38.84 31.01 7.45 0.85 1.240.04 17.81 41.37 28.47 9.68 1.44 1.340.05 19.84 43.08 26.77 10.68 1.98 1.400.06 21.78 44.36 25.48 11.66 2.56 1.450.08 23.31 45.39 24.46 12.41 3.13 1.500.09 25.03 46.19 23.65 13.26 3.70 1.560.11 26.16 46.85 23.00 13.76 4.30 1.590.12 27.47 47.35 22.50 14.37 4.87 1.630.13 28.63 47.75 22.10 14.89 5.43 1.670.15 29.67 48.06 21.79 15.33 6.03 1.700.16 30.45 48.30 21.55 15.64 6.60 1.720.18 31.60 48.48 21.37 16.12 7.17 1.750.19 32.27 48.58 21.26 16.36 7.77 1.760.20 33.07 48.63 21.22 16.65 8.34 1.780.22 33.44 48.65 21.19 16.72 8.93 1.780.23 33.87 48.65 21.20 16.82 9.50 1.790.25 34.52 48.59 21.26 17.03 10.08 1.800.26 34.99 48.51 21.34 17.14 10.68 1.800.27 34.95 48.37 21.48 17.00 11.22 1.790.29 35.05 48.21 21.64 16.93 11.79 1.780.30 34.58 48.04 21.81 16.58 12.34 1.750.32 34.17 47.86 21.99 16.25 12.92 1.730.33 33.64 47.66 22.18 15.87 13.49 1.710.34 32.64 47.33 22.52 15.27 14.06 1.670.36 30.12 46.79 23.06 13.95 14.62 1.600.37 27.57 46.42 23.43 12.63 15.18 1.540.39 25.71 46.24 23.61 11.65 15.73 1.490.40 24.95 46.16 23.69 11.20 16.29 1.470.41 24.36 46.14 23.71 10.84 16.84 1.450.43 24.21 46.10 23.75 10.68 17.40 1.450.44 23.99 46.07 23.78 10.49 17.95 1.440.45 23.91 46.02 23.83 10.37 18.50 1.430.47 23.66 45.99 23.86 10.17 19.05 1.420.48 23.66 45.98 23.87 10.09 19.60 1.420.49 23.58 45.94 23.90 9.97 20.15 1.410.51 23.78 45.93 23.91 9.98 20.71 1.410.52 23.54 45.93 23.92 9.78 21.27 1.410.53 23.99 45.93 23.92 9.90 21.82 1.410.55 23.99 45.92 23.93 9.81 22.38 1.410.56 24.10 45.91 23.93 9.79 22.85 1.41
Principal Stress Difference (psi)
Axial Strain (%)
Principal Stress Ratio
Displacement (in)
Force (lb)
Pore Pressure (psi)
Effective Confining Stress (psi)
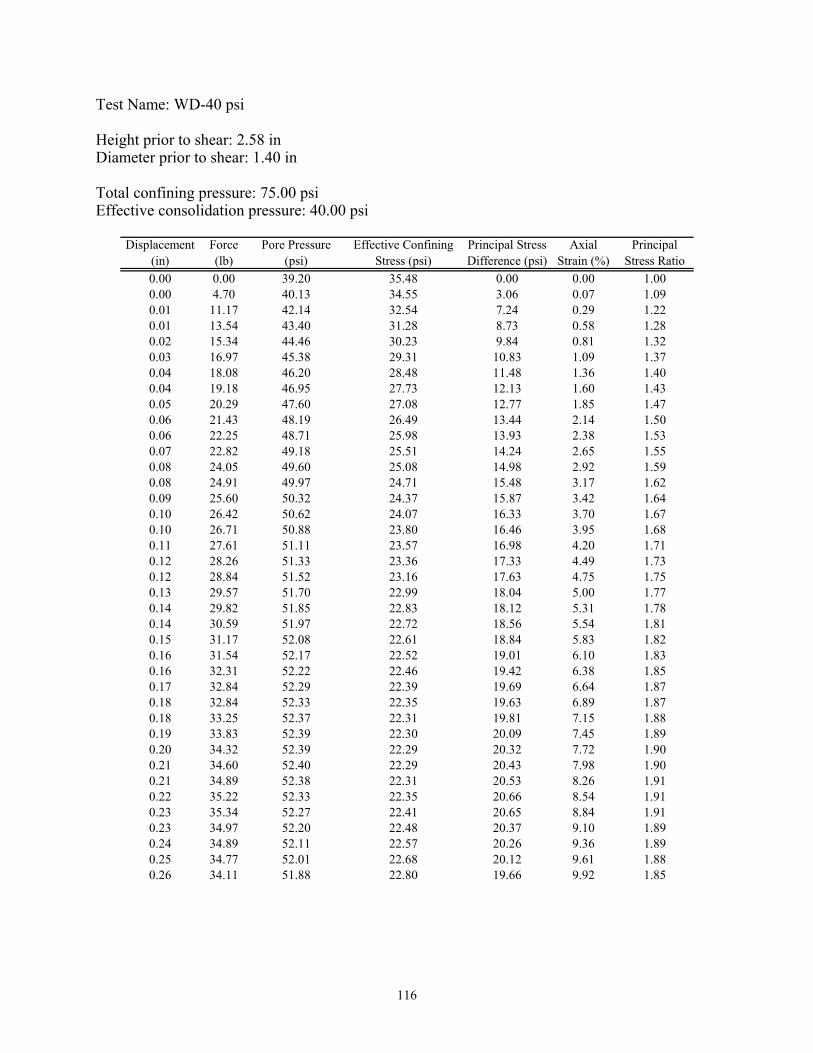
116
Test Name: WD-40 psi Height prior to shear: 2.58 in Diameter prior to shear: 1.40 in Total confining pressure: 75.00 psi Effective consolidation pressure: 40.00 psi
0.00 0.00 39.20 35.48 0.00 0.00 1.000.00 4.70 40.13 34.55 3.06 0.07 1.090.01 11.17 42.14 32.54 7.24 0.29 1.220.01 13.54 43.40 31.28 8.73 0.58 1.280.02 15.34 44.46 30.23 9.84 0.81 1.320.03 16.97 45.38 29.31 10.83 1.09 1.370.04 18.08 46.20 28.48 11.48 1.36 1.400.04 19.18 46.95 27.73 12.13 1.60 1.430.05 20.29 47.60 27.08 12.77 1.85 1.470.06 21.43 48.19 26.49 13.44 2.14 1.500.06 22.25 48.71 25.98 13.93 2.38 1.530.07 22.82 49.18 25.51 14.24 2.65 1.550.08 24.05 49.60 25.08 14.98 2.92 1.590.08 24.91 49.97 24.71 15.48 3.17 1.620.09 25.60 50.32 24.37 15.87 3.42 1.640.10 26.42 50.62 24.07 16.33 3.70 1.670.10 26.71 50.88 23.80 16.46 3.95 1.680.11 27.61 51.11 23.57 16.98 4.20 1.710.12 28.26 51.33 23.36 17.33 4.49 1.730.12 28.84 51.52 23.16 17.63 4.75 1.750.13 29.57 51.70 22.99 18.04 5.00 1.770.14 29.82 51.85 22.83 18.12 5.31 1.780.14 30.59 51.97 22.72 18.56 5.54 1.810.15 31.17 52.08 22.61 18.84 5.83 1.820.16 31.54 52.17 22.52 19.01 6.10 1.830.16 32.31 52.22 22.46 19.42 6.38 1.850.17 32.84 52.29 22.39 19.69 6.64 1.870.18 32.84 52.33 22.35 19.63 6.89 1.870.18 33.25 52.37 22.31 19.81 7.15 1.880.19 33.83 52.39 22.30 20.09 7.45 1.890.20 34.32 52.39 22.29 20.32 7.72 1.900.21 34.60 52.40 22.29 20.43 7.98 1.900.21 34.89 52.38 22.31 20.53 8.26 1.910.22 35.22 52.33 22.35 20.66 8.54 1.910.23 35.34 52.27 22.41 20.65 8.84 1.910.23 34.97 52.20 22.48 20.37 9.10 1.890.24 34.89 52.11 22.57 20.26 9.36 1.890.25 34.77 52.01 22.68 20.12 9.61 1.880.26 34.11 51.88 22.80 19.66 9.92 1.85
Principal Stress Difference (psi)
Axial Strain (%)
Principal Stress Ratio
Displacement (in)
Force (lb)
Pore Pressure (psi)
Effective Confining Stress (psi)
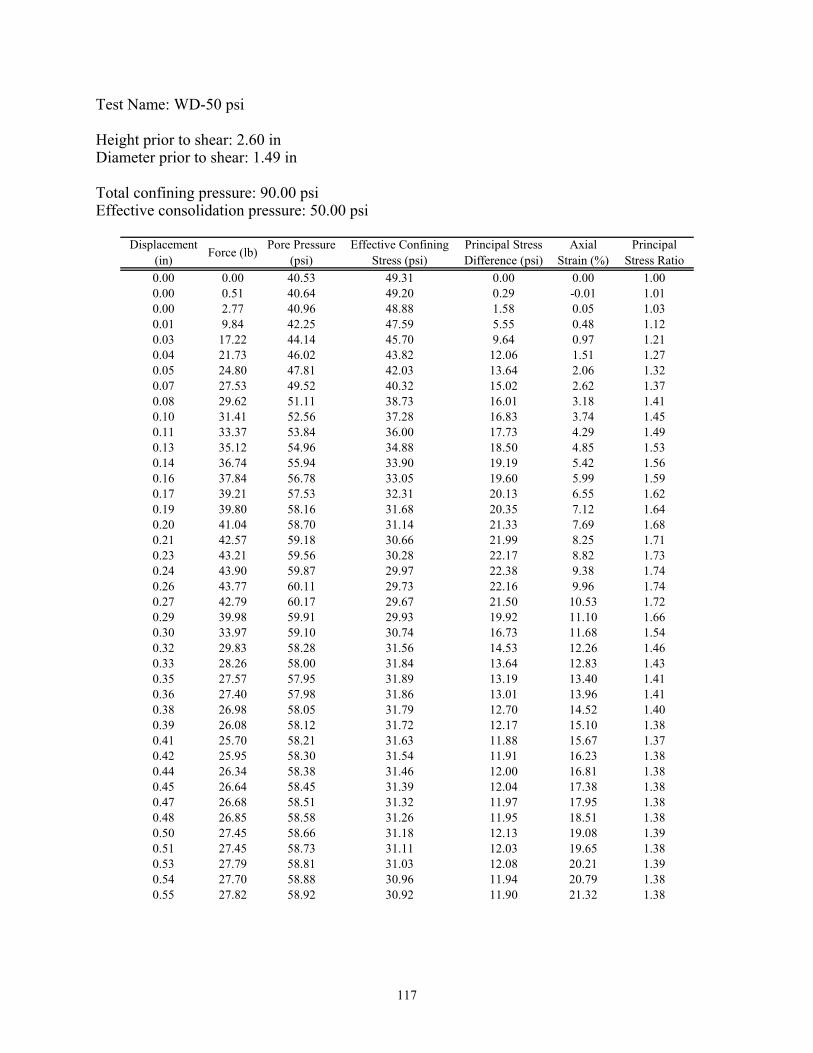
117
Test Name: WD-50 psi Height prior to shear: 2.60 in Diameter prior to shear: 1.49 in Total confining pressure: 90.00 psi Effective consolidation pressure: 50.00 psi
0.00 0.00 40.53 49.31 0.00 0.00 1.000.00 0.51 40.64 49.20 0.29 -0.01 1.010.00 2.77 40.96 48.88 1.58 0.05 1.030.01 9.84 42.25 47.59 5.55 0.48 1.120.03 17.22 44.14 45.70 9.64 0.97 1.210.04 21.73 46.02 43.82 12.06 1.51 1.270.05 24.80 47.81 42.03 13.64 2.06 1.320.07 27.53 49.52 40.32 15.02 2.62 1.370.08 29.62 51.11 38.73 16.01 3.18 1.410.10 31.41 52.56 37.28 16.83 3.74 1.450.11 33.37 53.84 36.00 17.73 4.29 1.490.13 35.12 54.96 34.88 18.50 4.85 1.530.14 36.74 55.94 33.90 19.19 5.42 1.560.16 37.84 56.78 33.05 19.60 5.99 1.590.17 39.21 57.53 32.31 20.13 6.55 1.620.19 39.80 58.16 31.68 20.35 7.12 1.640.20 41.04 58.70 31.14 21.33 7.69 1.680.21 42.57 59.18 30.66 21.99 8.25 1.710.23 43.21 59.56 30.28 22.17 8.82 1.730.24 43.90 59.87 29.97 22.38 9.38 1.740.26 43.77 60.11 29.73 22.16 9.96 1.740.27 42.79 60.17 29.67 21.50 10.53 1.720.29 39.98 59.91 29.93 19.92 11.10 1.660.30 33.97 59.10 30.74 16.73 11.68 1.540.32 29.83 58.28 31.56 14.53 12.26 1.460.33 28.26 58.00 31.84 13.64 12.83 1.430.35 27.57 57.95 31.89 13.19 13.40 1.410.36 27.40 57.98 31.86 13.01 13.96 1.410.38 26.98 58.05 31.79 12.70 14.52 1.400.39 26.08 58.12 31.72 12.17 15.10 1.380.41 25.70 58.21 31.63 11.88 15.67 1.370.42 25.95 58.30 31.54 11.91 16.23 1.380.44 26.34 58.38 31.46 12.00 16.81 1.380.45 26.64 58.45 31.39 12.04 17.38 1.380.47 26.68 58.51 31.32 11.97 17.95 1.380.48 26.85 58.58 31.26 11.95 18.51 1.380.50 27.45 58.66 31.18 12.13 19.08 1.390.51 27.45 58.73 31.11 12.03 19.65 1.380.53 27.79 58.81 31.03 12.08 20.21 1.390.54 27.70 58.88 30.96 11.94 20.79 1.380.55 27.82 58.92 30.92 11.90 21.32 1.38
Principal Stress Difference (psi)
Axial Strain (%)
Principal Stress Ratio
Displacement (in) Force (lb) Pore Pressure
(psi)Effective Confining
Stress (psi)

118