Embed Size (px)
Citation preview
The Friedmann Tongue score can predict the sleep apnea severity
Xavier Barceló, MD 1,
Albert Cobos, MD, PhD 2Christian Domingo, MD, PhD, FCCP 3
Rosa M. Mirapeix, MD, PhD 4,
1, Servei d’Otorrinolaringologia, Hospital de l’Esperit Sant de Santa Coloma.2, Unitat de bioestadística, Departament de Salut Pública, Universitat de Barcelona (UB).3 . Departament de Medicina, Universitat
Autònoma de Barcelona (UAB)4, Departament de Ciències Morfològiques, Universitat Autònoma de Barcelona (UAB)

ABSTRACT• Objectives: To evaluate the usefulness of the examination of the upper airway to confirm the
diagnosis of obstructive sleep apnea syndrome (OSAS) and its severity.• Methods: Prospective, single-centre cross-sectional study performed in a community hospital.
Participants: 301 consecutive patients admitted to the Sleep Unit due to suspicion of OSAS. Assessments: a) Body Mass Index (BMI); b) Neck perimeter; c) Oropharyngeal examination; d) Fiberendoscopy; e) Rhinomanometry; f) Sleep study.
• Results: Mean age: 51(12) years; gender: 71% male (214/301); mean BMI: 29.8 (4.6) Kg/m2; mean cervical perimeter 40.5 (3.7) cm. In 283 patients (94.019%) AHI was ≥ 5 /hour. Patients with scores of 2 and 3 for FTP (Friedman tongue position) accounted for 74.08% of the whole cohort, 14.29% were FTP 1, and only 11.63% FTP 4. Eighteen out of 301 (6%) were considered normal (AHI ≤5), 16 were classified as FTP 1 and only two as FTP 2. Tonsil size (p=0.005), uvula score (p=0.003), BMI (p<0001), cervical perimeter (≤0001), nasal flow at 150 Pascals (p=0.023) and age (p=0.007) were related to OSAS severity. In tonsillectomized patients the AHI was higher than in Tonsillar score one (TS1) and quite similar to the TS2 group. In the multiple regression model, only the FTP score showed a relevant relationship to OSAS severity.
• Conclusions: 1) Since the FTP score is almost the only parameter related to OSAS severity, a simple oropharyngeal examination can provide key information on this issue. 2) Tonsillectomy does not seem to protect against development of OSAS.
• Key words: OSAS; Friedman tongue position score; Mallampati; oropharyngeal examination; uvula score.
INTRODUCTION• INTRODUCTION • The prevalence of Obstructive sleep apnea syndrome (OSAS) has been estimated
to range between 3 and 7% in men and between 2 and 5% in women (1)• The disease is caused by partial or complete obstructions of the upper airway, the
oropharynx being affected at one or more levels• In spite of the most recent advances, between 70 and 80% of cases remain
undiagnosed (2) • The purpose of this study was to validate the clinical usefulness of easy-to-assess
clinical signs such as the Friedman tongue position (FTP),the tonsils and uvula size and certain complementary examinations whose importance has not been clearly established, and to explore their potential value as predictors of the apnea-hypopnoea index (AHI). The oropharyngeal examination was performed by the same physician in all cases by using a frontal light to establish the FTP (Figures 1a-d) and tonsil size score (Figures 2a-e) using Friedman’s criteria (3) with the patient in a sitting position. We added a uvula score pre-designed for this study (table 1)

Friedman Tongue position

Tonsils score

Uvula score
Table 1.
The uvula evaluation was performed according to criteria previously established
by the authors (grades 1 to 4, as follows):
1.- uvula clearly visible without hypertrophy 2.- uvula slightly hypertrophied without touching the tongue
3.- hypertrophic uvula in contact with the tongue base
4.- markedly hypertrophic uvula lying on the tongue base
METHODS AND MATERIAL • Patients
• Patients with snoring history and clinical suspicion of OSAS were referred to the sleep laboratory for diagnosis and treatment.
• Inclusion criteria: 1) adult patients (aged above 18)
• Exclusion criteria: 1) other respiratory diseases; 2) tracheostomy; 3) clinical suspicion of other sleep disorders; 4) other co-morbidities (chronic renal, cardiac or hepatic failure; 5) active neoplasms; 6) patients who refused to follow the study protocol of our sleep unit.
• Methodology.
• Type of study: Single-centre, observational, cross-sectional study.
• Setting: Sleep Unit of a community hospital (Esperit Sant de Santa Coloma, Barcelona, Spain) with a reference area of 150,000 inhabitants.
• Aims : to determine the relationship between AHI values and potential explanatory variables (sex, age, BMI, cervical perimeter, nasal flow measured in dm3 /second at 150 Pascals (FL 150), Friedmann Tongue Position (FTP), tonsils and uvula scores.
• Criteria used to assess OSAS severity: patients were classified as follows: AHI < 5, normal; AHI 5 - 14, mild; AHI 15 - 30, moderate; and AHI > 30, severe, according to the American Academy of Sleep Medicine .
• Statistical analysis
• Data are described as mean (SD). The bivariate relationships between AHI values and potential explanatory variables (sex, age, BMI, cervical perimeter, FL150, and FTP, tonsils and uvula scores) were assessed using the Spearman correlation coefficient or the Wilcoxon rank sum test as appropriate. A multivariate regression analysis was conducted to investigate the predictive role of potential explanatory variables in more depth. To achieve normality and homoscedasticity, a logarithm transformation was used, so that the logarithm of the AHI (logAHI) was modeled rather than the AHI itself. All statistical analyses were performed with SAS version 9.1.
• Informed consent: The study protocol was approved by the hospital’s IRB.
RESULTS• We prospectively studied 301 consecutive patients from January 2006 to
December 2009. The age ranged from 18 to 82 years with mean (SD) 51 (12) years, 71.1% were male and 28.9 females, the mean BMI was 29.8 (4.6) Kg/m2 the cervical perimeter was 40.6 (3.7) cm and the Nasal flow at 150 Pa was 0.80 (0.26)(cm3/s).
• The distribution of FTP, tonsils and uvula scores along with other patients characteristics are displayed in table 2. Note that for these three scores, the two middle categories roughly accounted for about 80% of the sample. The AHI ranged from 0.7 to 89.5 with mean (SD) value of 27.6 (19.4). Ninety four percent had a AHI > 5/ hour.
• The AHI values showed a statitically significant correlation with FTP scores, tonsils scores, uvula scores, BMI, cervical perimeter and age. In all cases the correlation was positive but its intensity varied markedly: while a high correlation was found in the case of the FTP score (Spearman’s r=0.88, see table 3), it was only moderate for the cervical perimeter (r=0.40) and very low for the tonsils scores, uvula scores or age (see table 3). We failed to detect a significant correlation between AHI values and the nasal flow at 150 Pa.
• Males had AHI values that were significantly higher than in females (Wilcoxon rank sum test p= 0.019): the median AHI value was 24.3 for males and 18 for females.
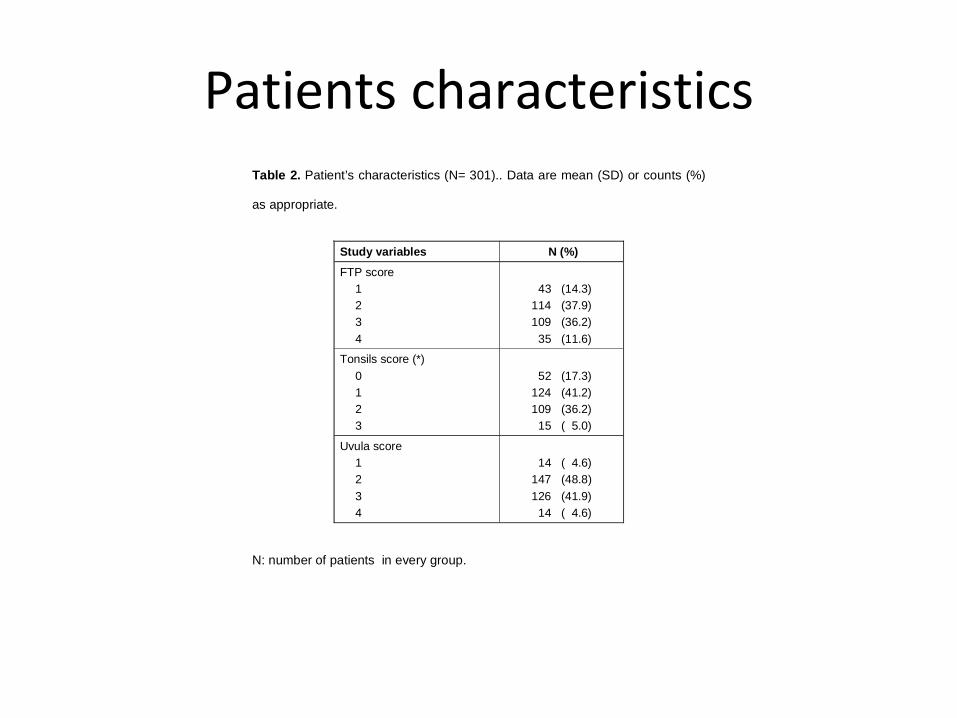
Patients characteristicsTable 2. Patient’s characteristics (N= 301).. Data are mean (SD) or counts (%)
as appropriate.
Study variables N (%)
FTP score 1 2 3 4
43 (14.3) 114 (37.9) 109 (36.2) 35 (11.6)
Tonsils score (*) 0 1 2 3
52 (17.3) 124 (41.2) 109 (36.2) 15 ( 5.0)
Uvula score 1 2 3 4
14 ( 4.6) 147 (48.8) 126 (41.9) 14 ( 4.6)
N: number of patients in every group.
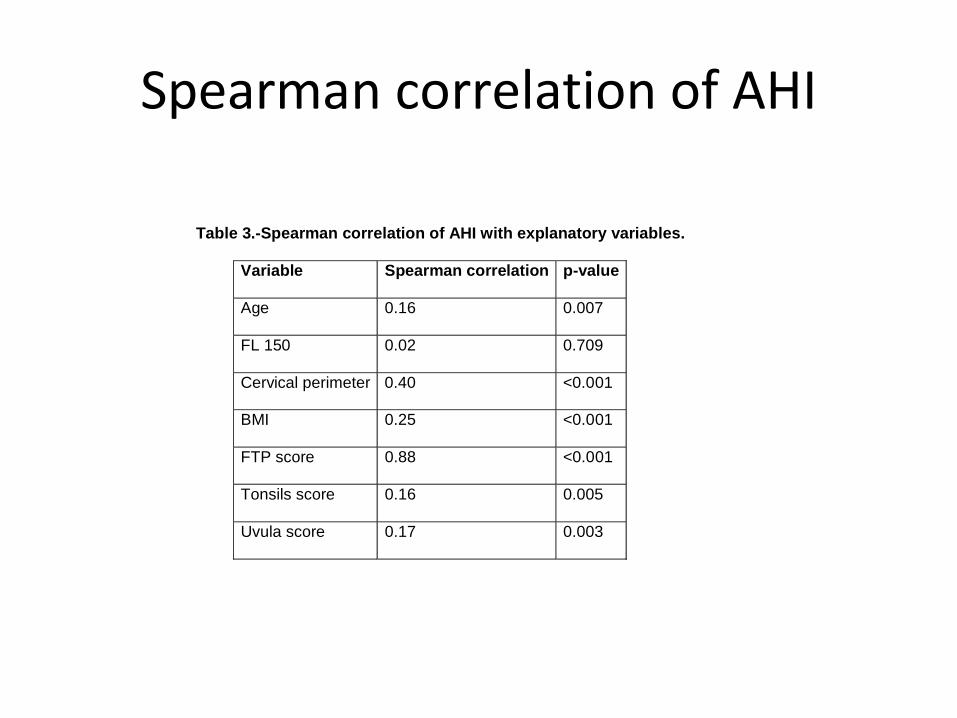
Spearman correlation of AHI
Table 3.-Spearman correlation of AHI with explanatory variables.
Variable Spearman correlation p-value
Age 0.16 0.007
FL 150 0.02 0.709
Cervical perimeter 0.40 <0.001
BMI 0.25 <0.001
FTP score 0.88 <0.001
Tonsils score 0.16 0.005
Uvula score 0.17 0.003

RESULTS • Almost three-quarters of patients (74.1%) were FTP 2 and 3 . Eighteen out of 301 (6%) studies were
considered normal with AHI <5 , 16 being classified as FTP 1 and only two as FTP 2.
• All FTP 1 patients showed an AHI < 16; in most of them (64%) the AHI was between 5 and ≤ 10. Most FTP 2 patients (58,7%) had an AHI ranging ≥ 10 and < 20.
• The AHI score in most FTP 3 patients ranged between 32 and 48, with three patients showing an AHI > 60. All FTP 4 patients showed an AHI > 30, corresponding to severe OSAS.
• the 77.41% off patients had tonsil scores grade 1 and 2 and only 15 had TS grade 3 (4.98%). No patients had TS grade 4. Tonsil scores of 3 and 4 are frequent in the pediatric population but are rare in adult OSAS . Fifty-two of the 301 patients (17.28%) had been previously tonsillectomized
• All patients with TS 2 and 3 had an AHI > 15 %; AHI scores were higher in the TS 3 group. Curiously, AHI scores in tonsillectomized patients were higher than in TS1 subjects, and quite similar to those in the TS2 group. The large majority of these patients were classified as moderate OSAS, Uvula scores of 2 and 3 were found in 90.7% of the population

FRIEDMANN TONGUE POSITION LOG SCALE
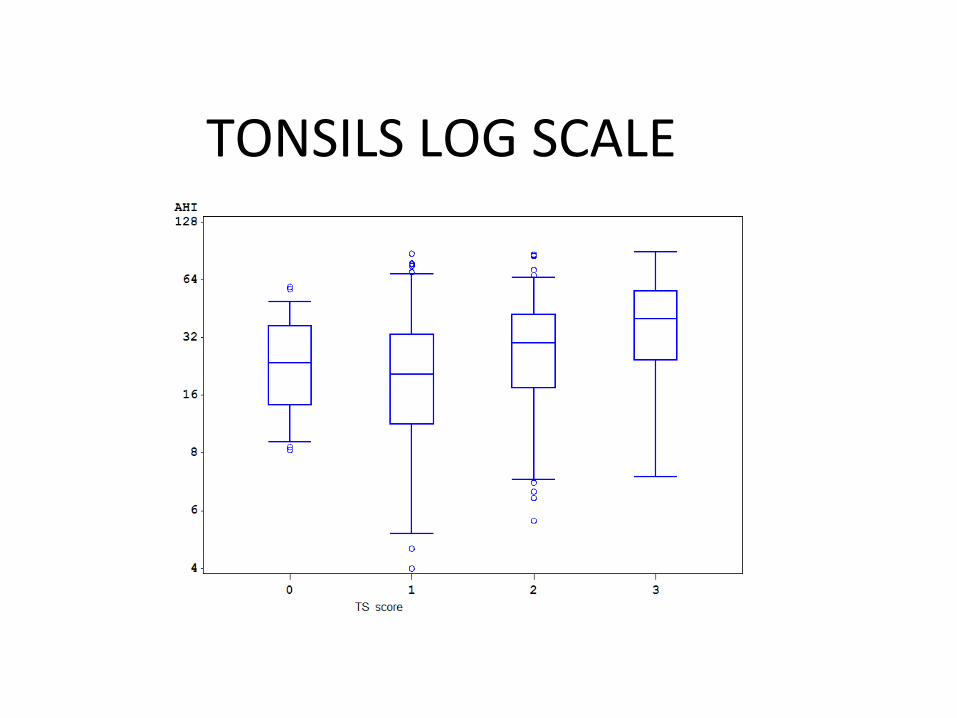
TONSILS LOG SCALE
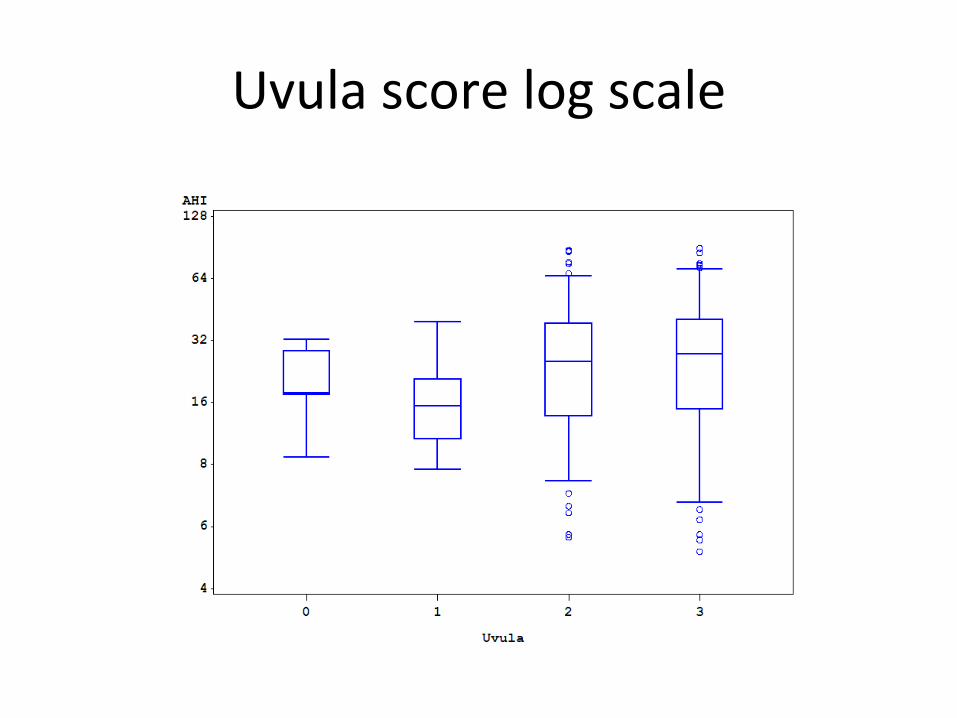
Uvula score log scale

DISCUSSION
• Treatment of OSAS causes a reduction in morbidity, mortality and hospitalization rates, and its cost-effectiveness (4,5). So there is a need to establish optimal procedures to identify patients at risk. •Traditionally, OSAS diagnosis has been performed using in-hospital, overnight polysomnography (PSG). This procedure is costly in terms of both time and money. •In recent decades, several attempts have been made to find predictive models based on clinical examination of the upper airway, combined or not with clinical data such as the Epworth score and/or specific radiological examinations but have proved difficult to implement(6).•Several studies have shown a statistical relationship between certain morphological abnormalities and OSAS severity. Tonsil size and cervical perimeter seem to be related to OSAS severity, although their specific weight in the pathophysiology of the disease is not clear. The Mallampati score seems to be the only parameter to be strongly related to OSAS severity (7,8)
CONCLUSION• Our study corroborated the results in the literature referring to the association of AHI with age,
sex, BMI and cervical perimeter However all these variables had a low weight for predicting OSAS severity according to the results of our multiple regression analysis, where the FTP score stands out as the main predictor.
• The small contribution of the nasal flow to the model suggests that the degree of nasal obstruction has a negligible influence on the pathophysiology of the disease.
• Interestingly, the cervical perimeter shows the second largest R2 value• the tonsil size is irrelevant in adults OSAS. Curiously, tonsillectomy performed during childhood
does not seem to be preventive but in fact seems to favor the development of OSAS• Previous studies have shown a statistical relationship between the FTP (also frequently called the
modified Mallampati score) and sleep disturbances . Our results suggest that a patient with an FTP score of 3 or 4 will hardly have an AHI score within normal ranges. In other words, a correct oropharyngeal physical examination might contradict a sleep study considered to be normal. The FTP=1 patients may be either normal or mild, but very rarely moderate (7%) and hardly severe.
• We advocate repeating the FTP maneuver five times and took the most frequent result. A correct performance of the examination is time-consuming but it is necessary to avoid significant errors in determining the FTP score. These results emphasize the importance of correct performance of the maneuver

REFERENCES• 1.-Punjabi N.M The epidemiology of adult obstructive sleep apnea. Proc Am Thorac Soc. 2008; 15: 136-43.
• 2. Kapur V, Strohl KP, Redline S, Iber C, O’Connor G, Nieto J. Underdiagnosis of sleep apnea syndrome in US communities. Sleep Breath 2002; 6: 49–54.
• 3 .-Friedman M, Tanyeri H, La Rosa M, et al. Clinical predictors of obstructive sleep apnea. Laryngoscope.. 1999; 109: 1901–1907
• 4.-Alghanim N, Comondore VR, Fleetham J , Marra CA, Ayas NT .The economic impact of obstructive sleep apnea. Lung 2008; 186: 7-12.
• 5.- Marshall NS, Wong KKH, Liu PY, Cullen SRJ, Knuiman MW, Grunstein RR. Sleep apnea as an independent risk factor for all-cause mortality: The Busselton Health Study. Sleep. 2008;31:1079–85.
• 6.-Kushida CA, Efron B, Guilleminault C.. A predictive morphometric model for the obstructive sleep apnea syndrome. Ann Intern Med. 1997;127:581-7.
• 7.-Schellenberg JB, Maislin G, Schwab RJ. Physical findings and the risk for obstructive sleep apnea. The importance of oropharyngeal structures. Am J Respir Crit Care Med. 2000; 162:740–8
• 8.-.- Nuckton TJ, Glidden DV, Browner WS, Claman DM .Physical examination: Mallampati score as an independent predictor of obstructive sleep apnea. Sleep 2006; 1: 903-8.