Embed Size (px)
Citation preview

© 2010 Grzegorz Glinka. All rights reserved. 1
The Fracture Mechanics Method (da/dN- K)
June 2nd – 6th, 2014,Aalto University,
Espoo, Finland
Prof. Grzegorz GlinkaUniversity of Waterloo, Canada

Information path for fatigue life estimation based onthe da/dN- K method
LOADING
F
t
GEOMETRY, Kt
PSO
MATERIAL
0
E
Stress-StrainAnalysis
Damage Analysis
Fatigue Life
MATERIAL
n
DKDKth
dadN
© 2008 Grzegorz Glinka. All rights reserved. 2
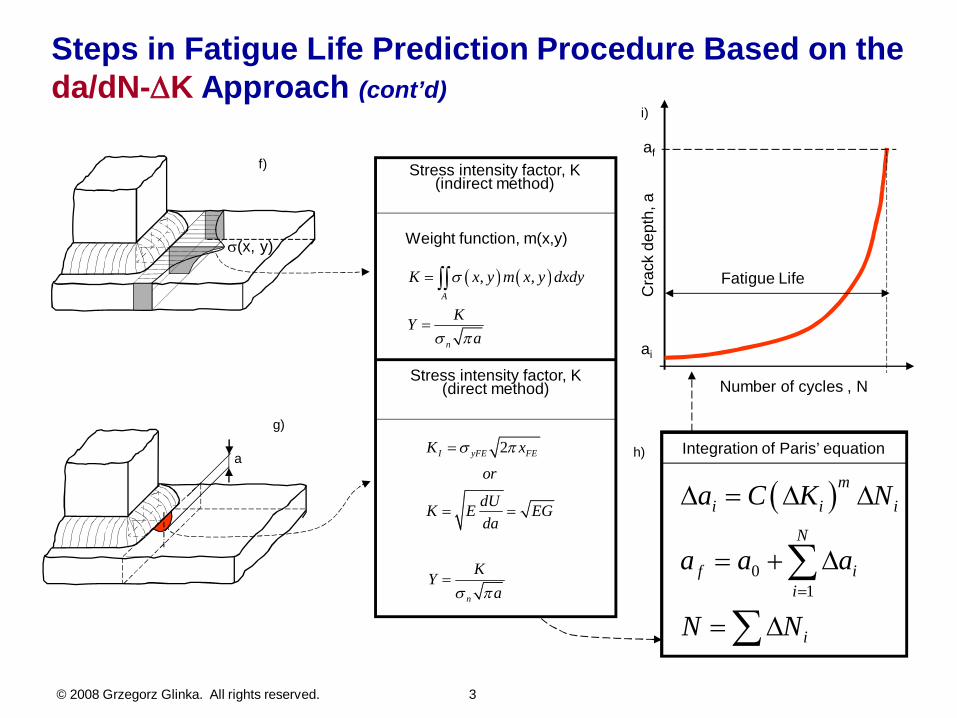
Stress intensity factor, K(indirect method)
Weight function, m(x,y)
, ,A
n
K x y m x y dxdy
KYa
Stress intensity factor, K(direct method)
2I yFE FE
n
K xor
dUK E EGda
KYa
(x, y)
f)
a
g)
01
mi i i
N
f ii
i
a C K N
a a a
N N
Integration of Paris’ equationh)
af
ai
Number of cycles , N
Cra
ckde
pth,
a
Fatigue Life
i)
Steps in Fatigue Life Prediction Procedure Based on theda/dN- K Approach (cont’d)
© 2008 Grzegorz Glinka. All rights reserved. 3

The Similitude Concept states that if the stressintensity K for a crack in the actual componentand in the test specimen are the same, then thefatigue crack growth response in the componentand in the specimen will also be the same andcan be described by the material fatigue crackgrowth curve da/dN - K.
a) Structure
Q
H
F
ab) Weld detail
c) Specimena
P
P
K 10-12
10-11
10-10
10-9
10-8
10-7
10-6
1 10 100
Cra
ckG
row
thR
ate,
m/c
ycle
K MPa m,
The Similitude Concept in the da/dN – K Method
© 2008 Grzegorz Glinka. All rights reserved. 4

© 2010 Grzegorz Glinka. All rights reserved. 5
Crack tip stress dependence on the stress intensity factor K
yS
x
xy
yy
xx
uy
ra
S
SS
3
2yyK
x2
2yyK
x
K1 < K2 < K3
Stress components, ij, at thecrack tip depend on the stressintensity factors KI which isinfluenced by:- the load, S-crack dimensions, a-geometry, Y
The stress field , ij, aroundthe crack tip can be describedby one universal functionvalid for all cracks of Mode I,i.e. for =0
yyK
x2

II
II
S aY KG plane stressE E
S aY KG plane strain
E E
22
22
2 21 1
G. Irwin’s fundamental Fracture Mechanics principles:1. The near crack tip stress field expressions above are universal, i.e. the stressdistributions in the vicinity of the crack tip have the same general mathematicalform regardless of the crack geometry, loading and geometrical shape of the body.
2. The strain energy release rate GI is related to the stress intensity factor KI andtherefore it is justified (and easier) to calculate the strain energy release rate (andthe critical stress) from the purely elastic local (near the crack tip) stressdistribution (i.e. from the Stress Intensity Factor).
© 2010 Grzegorz Glinka. All rights reserved. 6

A crack becomes unstable (fracture) when the stress intensity factor,KI , exceeds the critical, for given material, stress intensity factor KIc!
KI > KIc
Strengthparameterstraditionallyused for thesttrengthanalysis ofengineeringcomponentsand structures:
Y Y
cr ut
I
c
Ics
P KKK
PP
Force [MN] Stress [MPa]Stress IntensityFactor [MPa m]
Leonardo da Vinci17th-century
Euler, Cauchy19th -century
Irwin20th-century
FractureMechanicsparametersused for thestrengthanalysis ofengineeringcomponentsand structures:
© 2010 Grzegorz Glinka. All rights reserved. 7

General Stress Intensity Factor Expressions for Cracks in Mode I
The stress intensity factor is defined as:
in which S is the stress (usually the nominal) away from the crack. The geometryfactor, Y , accounts for the effect of geometry of the crack and the body, theboundary conditions and the type of loading.Determining stress intensity factor means in essence the derivation of the functiondescribing the geometrical factor Y. One of the confusing issues while determiningstress intensity factors is that the remotely applied stress S and the geometry factorY are inter-related. The value of parameter Y depends on the definition of the remote(termed often as nominal) stress S. In cases where the nominal or hot spot stress iswell defined there is no problem in the definition of the remote stress S. However, ifthe stress distribution is non-uniform it may not be clear which stress should beused in the expression for the stress intensity factor. Theoretically, any referencestress S can be chosen for the determination of the geometrical factor Y, as far asthe stress varies proportionally with the applied load. However, the user of givenexpression for K has to use the same definition of the reference stress whilecarrying out fatigue and fracture analyses. Nominal or the maximum stress in thecase of non-uniform stress distributions is most often used in stress intensity factorexpressions. Therefore, it is a good professional practice to define the referencestress S when quoting the geometry factor Y.
IK YS a
© 2010 Grzegorz Glinka. All rights reserved. 8

(Y. Murakami et. al)
Center Crack Plate under Uniform Tension
2a Wt
Reference: C.F. Federsen (1), H. Tada (2)
Method: Empirical formula based on Isida’s results
Accuracy: +0.3% for 2a/W 0.7 and 1.0% for 2a/W=0.8
I I I
I
aK a F FW
Y
F
2( ), , ( )
( ) sec2
Accuracy: Better than 0.2% for any value ofIK a F 2 4( ) 1 0.025 0.06
or
(2)
(1)
© 2010 Grzegorz Glinka. All rights reserved. 9

2a/W 0.000 0.001 0.002 0.003 0.004 0.005 0.006 0.007 0.008 0.009 0.0100.200 1.025 1.026 1.026 1.026 1.026 1.027 1.027 1.027 1.028 1.028 1.0580.210 1.028 1.028 1.029 1.029 1.029 1.029 1.030 1.030 1.030 1.031 1.0310.220 1.031 1.031 1.032 1.032 1.032 1.032 1.033 1.033 1.033 1.034 1.0340.230 1.034 1.034 1.035 1.035 1.035 1.035 1.036 1.036 1.036 1.037 1.0370.240 1.037 1.037 1.038 1.038 1.038 1.039 1.039 1.039 1.040 1.040 1.0400.250 1.040 1.041 1.041 1.041 1.042 1.042 1.042 1.043 1.043 1.043 1.0440.260 1.044 1.044 1.045 1.045 1.045 1.046 1.046 1.046 1.047 1.047 1.0470.270 1.047 1.048 1.048 1.049 1.049 1.049 1.050 1.050 1.051 1.051 1.0510.280 1.051 1.052 1.052 1.052 1.053 1.053 1.054 1.054 1.054 1.055 1.0550.290 1.055 1.056 1.056 1.056 1.057 1.057 1.058 1.058 1.059 1.059 1.0590.300 1.059 1.060 1.060 1.061 1.062 1.062 1.062 1.062 1.063 1.063 1.0640.310 1.064 1.064 1.064 1.067 1.066 1.066 1.066 1.067 1.067 1.068 1.0680.320 1.068 1.069 1.069 1.070 1.070 1.071 1.071 1.072 1.072 1.072 1.0730.330 1.073 1.073 1.073 1.074 1.075 1.075 1.076 1.076 1.077 1.077 1.0780.340 1.078 1.078 1.078 1.079 1.080 1.080 1.081 1.081 1.082 1.082 1.0830.350 1.083 1.083 1.083 1.085 1.085 1.086 1.086 1.087 1.087 1.088 1.0880.360 1.088 1.089 1.089 1.090 1.090 1.091 1.092 1.092 1.093 1.093 1.0940.370 1.094 1.094 1.094 1.096 1.096 1.097 1.097 1.098 1.098 1.099 1.1000.380 1.100 1.100 1.100 1.101 1.102 1.103 1.103 1.104 1.104 1.105 1.1060.390 1.106 1.106 1.107 1.107 1.108 1.109 1.109 1.110 1.111 1.111 1.1120.400 1.112 1.112 1.113 1.114 1.114 1.115 1.116 1.116 1.117 1.118 1.1180.410 1.118 1.119 1.120 1.120 1.121 1.122 1.122 1.123 1.124 1.124 1.1250.420 1.125 1.126 1.126 1.127 1.128 1.128 1.129 1.130 1.131 1.131 1.1320.430 1.132 1.133 1.133 1.134 1.135 1.136 1.136 1.137 1.138 1.138 1.1390.440 1.139 1.140 1.141 1.141 1.142 1.143 1.144 1.144 1.145 1.146 1.1470.450 1.147 1.148 1.148 1.149 1.150 1.151 1.151 1.152 1.153 1.154 1.1550.460 1.155 1.155 1.156 1.157 1.158 1.159 1.159 1.160 1.161 1.162 1.1630.470 1.163 1.164 1.164 1.165 1.166 1.167 1.168 1.169 1.170 1.170 1.1710.480 1.171 1.172 1.173 1.174 1.175 1.176 1.176 1.177 1.178 1.179 1.1800.490 1.180 1.181 1.182 1.183 1.184 1.185 1.186 1.186 1.187 1.188 1.1890.580 1.277 1.279 1.280 1.281 1.283 1.284 1.285 1.287 1.288 1.289 1.2910.590 1.291 1.292 1.293 1.295 1.296 1.297 1.299 1.300 1.302 1.303 1.3040.600 1.304 1.306 1.307 1.309 1.310 1.311 1.313 1.314 1.316 1.317 1.3190.610 1.319 1.200 1.322 1.323 1.325 1.326 1.328 1.329 1.331 1.332 1.3340.620 1.334 1.335 1.337 1.338 1.340 1.342 1.343 1.345 1.346 1.348 1.3500.630 1.350 1.351 1.353 1.354 1.356 1.358 1.359 1.361 1.363 1.364 1.3660.640 1.366 1.368 1.370 1.371 1.373 1.375 1.376 1.378 1.380 1.382 1.3830.650 1.383 1.385 1.387 1.389 1.391 1.392 1.394 1.396 1.398 1.400 1.402
Geometry correction factor, FI( ) = Y
The SIF geometry correction factor Y; KI = S Y; (central crack)
© 2010 Grzegorz Glinka. All rights reserved. 10

Example
A thick center-cracked plate of a high strength aluminum alloy is 200 mm wide and contains a crackof length 80 mm. If it fails at an applied stresses of 100 MPa, what is the fracture toughness of thealloy? What value of applied stress would produce fracture for the same length of crack in:
a) an infinite plate
b) a 120 mm wide plate?
2a
2W
© 2010 Grzegorz Glinka. All rights reserved. 11

) 1202 40 0.6666
60
2 0.6666 1.413
; 39.42 0.04 1.41339.42 78.70.04 1.413
handbook example
c
c Plate mm widea a
W W
aYW
K K
MPa
)2 200 , 2 80 , 100
; ;
:2 2
2
2 40 0.4100
2 0.4 1.1
handbook example example
handbook example
a Finite width plateW mm a mm MPa
aK a Y Y fW
See notation in the Handbooka a a
W W W
a aW W
aYW
12
100 0.04 1.112 39.42
39.42
)
; 1
; 39.42 0.0439.42 111.20
0.04
c
c
K a Y MPa m
K K MPa m
b Ininitely wide plate
K a Y and Y
K K
MPa
© 2010 Grzegorz Glinka. All rights reserved. 12
© 2010 Grzegorz Glinka. All rights reserved. 13
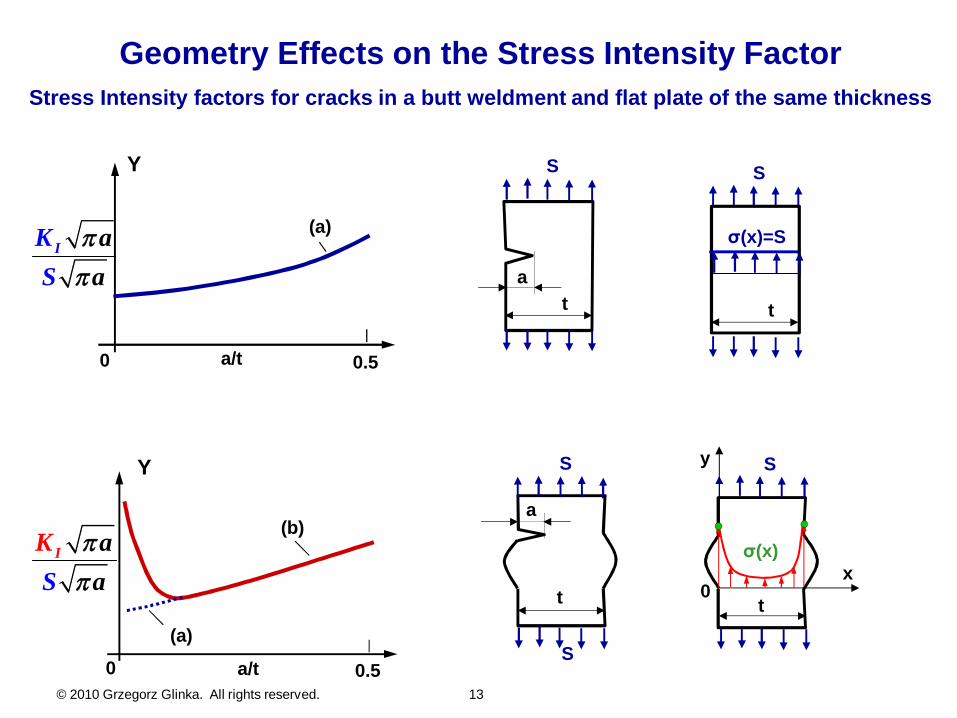
Geometry Effects on the Stress Intensity FactorStress Intensity factors for cracks in a butt weldment and flat plate of the same thickness
S
t
S
a
S
a
t t
S
x
y
0
(x)
t
S
(x)=SIK aaS
0
(a)
a/t 0.5
Y
IK aaS
0
(b)
(a)
a/t 0.5
Y

1
2 2 2
1 1
1 312 2
1 11 1
11 2 3
1 312
2 22 2
2
2
1 2 3
2 1 1 1 12
2, 1 1 1
,
2,
,
1P
A
A
P
P x x xK
a M M Ma a aa
a M M Ma
P x x xK m x Px
m x Px a aa
2121 21 ,, ,,A
PP am xK m xP Pa
0
,A
ax m x a dxK x
y
AP1
x1
x
a
t
x2
P2
(x)
S
S
The Weight Function method for calculating Stress Intensity Factors
© 2010 Grzegorz Glinka. All rights reserved. 14

A
Px
x
a
W
y
1
1 312 2
1 2 32 1 1 1 1
2, ,P
A a M Mx x Ma a
xK m xa x
Pa
A
P xx
2a
2W
y
x
Geometrical parameters and notation for weight functions
© 2010 Grzegorz Glinka. All rights reserved. 15

2 3 4 5 6 7
1
2 3
2
0.06987 0.40117 5.5407 50.0886 200.699 395.552 377.939 140.218
0.09049 2.14886 22.5325 89.6553 210.599
a a a a a a aMw w w w w w w
a a a aMw w w w
4 5 6
2 3 4 5 6 7
3
239.445 111.128
0.427216 2.56001 29.6349 138.40 347.255 457.128 295.882 68.1575
a aw w
a a a a a a aMw w w w w w w
Central through crack in a finite width plate subjected to symmetric loading
2 3 4 5 6 7
1
8 9 10
2
0.0719768 1.51346 61.1001 1554.95 14583.8 71590.7 205384 356469
368270 208233 49544
0.246984 6.47543
a a a a a a aMw w w w w w w
a a aw w w
aMw
2 3 4 5 6 7
8 9 10
2
3
176.457 4058.76 37303.8 181755 520551 904370
936863 531940 127291
0.529659 22.3235 532.074 5479
a a a a a aw w w w w w
a a aw w w
a aMw w
3 4 5 6 7
8
.53 28592.2 81388.6 128746 106246
35780.7
a a a a aw w w w w
aw
Edge crack in a finite width plate
© 2010 Grzegorz Glinka. All rights reserved. 16

(x)
t
S
a
y
x
(x)
S
at
y
x
S
S
at
y
x
a) b) c)
Ka = Kb
The Weight Function method for calculatingStress Intensity Factors
The Stress Intensity Factor for any loading case is equal to the stress intensityfactor obtained by applying to the crack faces the stresses that used to be therewhen there was no crack.
© 2010 Grzegorz Glinka. All rights reserved. 17

Stepwise Procedure for the Stress IntensityCalculation using the Weight Function Method
1. Calculate stress distribution (x) in the prospective crack plane in theabsence of the crack (un-cracked body, linear elastic analysis).
x f x0 ,
2. Apply the stress distribution (x) to the crack surface as tractions.
x x xm x a M M Ma a aa x
1/2 1 3/2
1 2 32( , ) 1 1 1 1
2
4. Integrate the product of the stress distribution (x) and the weight function m(x,a).
a
a
K x m x a dx( , )
3. Choose appropriate weight function, i.e. parameters M1, M2 and M3.
© 2010 Grzegorz Glinka. All rights reserved. 18

The superposition principle for calculation of stressintensity factors using the weight function approach;
r
t
T2
o
SProspective crack plane (y)
a)
x
y
t
T2
(y)
crack
b)
y
x
a
IaK m y y dyt
0
,
a) stress distribution in the prospective crack plane in the un-cracked body;b) the “un-cracked stress field” applied to the crack surfaces of identical
body with a crack;
© 2010 Grzegorz Glinka. All rights reserved. 19

Through the plate thickness stress distributions in a T-butt weldmentobtained for r/t = 1/25, = 45o (in the weld toe cross section)
(y)/
n
y / T
FEM
© 2010 Grzegorz Glinka. All rights reserved. 20

Geometrical Stress Intensity Correction Factor “Y” foran Edge Crack Emanating from the Weld Toe
(Comparison of WF and FEM data)
T-butt welded joint; Tension loading T-butt welded joint; Bending load
© 2010 Grzegorz Glinka. All rights reserved. 21

Calculation of SIF for cracksat notches using the weightfunctions for edge andthrough cracks
(x)
(x)
(x)
(x)
t 2t
d b
b
2aa
b b
(x)
b b
© 2010 Grzegorz Glinka. All rights reserved. 22

Fracture Mechanics Approach to Fatigue CrackGrowth Analysis
•Fatigue crack growth equations
•Integration of fatigue crack growth expressions
•The effect of the initial crack size
•The effect of the weld geometry
•Residual stress effect
•Example
© 2010 Grzegorz Glinka. All rights reserved. 23

A sharp crack in a tension stress field causes a high stressconcentration at the its tip resulting in slip and plastic deformation inthe crack tip vicinity. The material above and below the crack tip mayslip along a favorable slip plane in the direction of maximum shearstress.
(a)
(b)
(c)
(d)
(e)Time
Stre
ss
0
(C. Laird, ASTM,STP 415, 1967)
(R.Pelloux, ASTM,STP 415, 1967)
a
b
c
d
ea
Fatigue Crack Growth Micro-Mechanism
© 2010 Grzegorz Glinka. All rights reserved. 24

The ‘a vs. N’ data is obtained inpractice by periodic measurement ofthe crack length, a, together with thenumber of cycles, N. The raw data isusually given in the form of series ofpoints as shown in the figure.
Stre
ss,S
Time, t0
SNumber of applied cycles, N0
Cra
ckle
ngth
,a
a0
S1 > S2 > S3
S3
S2S1
N
a
af , Nf
da/dN= a/ N
Applied nominal stress history
Experimental data for the determination of the fatigue crack growth curve
Number of applied cycles, N
ai, Ni
da/dN
- Experimental test dataS
S
a
Cra
ckle
ngth
,a
0
a0
© 2010 Grzegorz Glinka. All rights reserved. 25

The Fracture Mechanics approach to fatigue or the da/dN - K method is a technique based on theanalysis of fatigue crack growth. The combination of load/stress and geometry parameters, necessaryfor the quantification of damage due to crack growth, is represented by the stress intensity factor, K,in the case of monotonic load and by the range of the stress intensity factor, K, in the case of cyclicloading.The fatigue material properties are characterized by the threshold stress intensity range, Kth, thefatigue crack growth rate relationship, da/dN vs. K, and the critical stress intensity factor, Kc, to beoften the same as the fracture toughness, KIc. The crack growth rate is then described by anexpression being function of the stress intensity range:
da f KdN ,
The stress intensity range associated with a stress cycle is calculated as:
max min max minK K K S a Y S a Ywhere – a is the crack size, Smax and Smin is the maximum and minimum nominal (or reference) stressrespectively, characterizing a stress cycle, and Y is the geometry correction factor. The aim of thefinal analysis of the da/dN- K data is to determine necessary constants and parameters appearing inexpression f( K).It should be noted that the ‘da/dN - K’ curve in fracture mechanics represents the material fatigueresistance similarly to the S-N curve in the nominal stress approach or the ‘ - N’ relationship in thelocal strain-life methodology.As soon as the crack growth curve for the material of interest is known the fatigue life of the structuralcomponent can be determined as shown in the figure below.
© 2010 Grzegorz Glinka. All rights reserved. 26

The notation for the cyclic stress history parameters and the steps necessary for the determination ofthe da/dN - K relationship are explained later in the following sections of the notes.
The fatigue life in terms of the number of cycles necessary to propagate the crack from its initial size,a0, to the final or critical crack size, af, is determined by integrating the crack growth equation.
ffaa
a a
da daNf K f S a Y
0 0
The determination of the integral above needs a numerical treatment because the geometrycorrection factor, Y, becomes frequently a complex function of the crack size, a.
Subsequent stages of the fatigue life prediction method based on the crack growth analysis areshown graphically in the Figure.
© 2010 Grzegorz Glinka. All rights reserved. 27

Constant Amplitude Cyclic Load - Notation
Smin - minimum stress
Smax - maximum stress
S = Smax- Smin - stress range
Sa = S /2 = (Smax- Smin )/2 - mean stress
R = Smin/ Smax - stress ratio
Smax
Smin
Stre
ss,
S
Sm
Time, t
S
S a
1 cycle
0
© 2010 Grzegorz Glinka. All rights reserved. 28

S
and
K S a Y
K S a Y
Fatigue Crack Growth Rate vs. Stress Intensity Factor
© 2010 Grzegorz Glinka. All rights reserved. 29

Scatter of fatigue crackgrowth data; Low alloy steel
18G2VA
4 mm thick plate 4 mm thick welded plate
© 2010 Grzegorz Glinka. All rights reserved. 30

The Fatigue Crack Growth Expression – The Paris equationThe first mathematical relationship relating fatigue crack growth rate and the stress intensity range wasproposed by Paris and Erdogan. This relationship is up to date the most popular mathematical expression usedif various fatigue/fracture mechanics analyses. It was obtained by fitting power law curve into the experimentaldata.
mda C KdN
Where: da/dN - fatigue crack growth rate [in/cycle or m/cycle]C - Paris’ equation parameter (valid for given R)m - Paris’ equation exponent
K - stress intensity range
max min min
max min
max max
min min
00
K K K for KK K for K
K S a Y
K S a Y
Where:a - crack length/depthSmax - maximum stress in a stress cycleSmin - minimum stress in a stress cycleKmax - maximum stress intensity factorKmin - minimum stress intensity factorY - geometry correction factor in the stress intensity factor expression
© 2010 Grzegorz Glinka. All rights reserved. 31

Complete Fatigue Crack Growth Rate Curve, da/dN - KSoon after the Paris equation gained wide acceptance as a tool for fatigue crack growth analysis, it wasfound that the simple expression proposed by Paris and Erdogan had some limitations. As the Figurebelow illustrates the complete log-log plot of da/dN vs. K is sigmoidal rather then linear and limited by thethreshold stress intensity range, Kth, and the critical stress intensity factor Kc.
At low growth rates, the da/dN vs. K curve becomes steep and appears to approach a vertical asymptotedenoted Kth, which is called the fatigue threshold stress intensity range or fatigue crack growth threshold.This quantity is interpreted as a lower limiting value of the stress intensity factor range K below whichfatigue crack growth does not ordinarily occur. The fatigue crack growth threshold is analogous to thefatigue limit in the S-N approach.
At high growth rates, the da/dN vs. K curve may again become steep. This is due to rapid unstable crackgrowth just prior to final fracture when Kmax Kc. The increase of the fatigue crack rate near the criticalstress intensity factor Kc is due to mixture of static (monotonic -fracture) and fatigue mechanisms drivingthe crack growth.
Also, the fatigue crack growth rate exhibits a dependence on the stress ratio ‘R’. The stress ratio R affectsthe fatigue crack growth rate in a manner analogous to the effects observed in the S-N and -N methods,i.e. for a given K, increasing R-ratio increases the fatigue crack growth rate, and vice-versa.
The effect of the R -ratio (or mean stress) on Fatigue Crack Growth is most often explained using thephenomenon discovered by Elber. By measuring the compliance of specimens with fatigue cracks henoticed that the crack tip got closed during the descending part of the stress cycle in spite of the fact thatthe applied stress/load remained tensile (see Figure). Elber postulated that crack closure decreases thefatigue crack growth rate by reducing the effective stress intensity range.
© 2010 Grzegorz Glinka. All rights reserved. 32

5 10 20 50 100
5 10 20 50 100
210
310
410
510
610
710
310
410
510
610
710
810
Cra
ckG
row
thR
ate,
da/d
N[m
m/c
ycle
]
da/d
N.C
rack
Gro
wth
Rat
e,da
/dN
[inch
es/c
ycle
]
K, Stress Intensity Range, MPa m
K, Stress Intensity Range, [ksi in]
A533B-1 steel,u=627 MPa
R=0.1
mda C KdN
thK
(a)
(b)
(c)
Fatigue crack growthrates for a ductile
pressure vessel steel(the Paris equation)
mda C KdN
Source: N. Dowling, ref(2)
© 2010 Grzegorz Glinka. All rights reserved. 33
The da/dN- K curve is thefatigue material curve
independent of the geometry,i.e. the same curve for allgeometrical crack-body
configurations!

For simplicity reasons thecomplete fatigue crackgrowth rate is usuallyapproximated by three
linear pieces with the twoof them being verticallimiting asymptotes.
© 2010 Grzegorz Glinka. All rights reserved. 34

3.0126.9 10da KdN
2.25101.4 10da KdN
3.25125.6 10da KdN
Ferritic-Pearlitic Steel:
Martensitic Steel:
Austenitic Stainless Steel:
J. Barsom, “Fatigue Crack Propagation in Steels of Various Yield Strengths”Journal of Engineering for Industry, Trans. ASME, Series B, Vol. 93, No. 4, 1971, 1190-1196
5 10 100
10-7
10-6
10-8
Cra
ckG
row
thR
ate,
m/c
ycle
K, MPa m
ys252273392415
for: da/dN in [m/cycle] and K in [MPa m]
Paris’ equation constants for steel materials at R = 0
© 2010 Grzegorz Glinka. All rights reserved. 35

Estimation of the Fatigue Crack Propagation LifeBasic Steps:
1. Estimate the initial crack size and shape, ao;
- non-destructive testing - ao
- proof load - ao
2. Estimate the critical crack size ac based on the fracture toughness KIC, i.e. the crack sizethat the component will tolerate when the applied stress reaches its maximum Smax.
3. Using the same expression for the stress intensity factor calculate the stress intensityrange K.
2
maxmax
1 ICIC c c c
c
KK S a Y aS Y
max
0
0 ( 0!!)r
K S a Y for R
K S a Y for R if
© 2010 Grzegorz Glinka. All rights reserved. 36

4. Substitute K into fatigue crack growth equation (Paris or Forman)
( ) ( )m m mda C K C S a YdN
5. Integrate the equation above from a = ao to a =ac and determine the number ofcycles, N, necessary to grow the crack from the initial crack size of ao to the criticalsize of ac. This is the estimated fatigue crack propagation life of given component!
( )
( ) ( )
cc
o o
m
aa
m
a a
dadNC K
da daNC K C S a Y
Note! In most practical cases the integration requires numerical solution due to thecomplexity of the geometric factor Y.
© 2010 Grzegorz Glinka. All rights reserved. 37

Integrated Paris’ Equation for a Constant GeometricFactor, Y = const.
/ 2 ( 2) / 2 ( 2) / 2
2 2
( )
2
2 1 1 ;( 2) ( )
21 ln ;
m m m mc
m m
o
c
o
da C K C S aY
for m
Nm C SY a a
for ma
NaC S
dN
Y
© 2010 Grzegorz Glinka. All rights reserved. 38

0 0 0 0
1 1 1 1 0 0 1 0 1
2 2 2 2 1 1 2 1 2
3 3 3 3 2 2 3 2 3
4 4 4 4 3 3 4 3 4
0 0 ;
1; 1; ; ;
1; 1; ; ;
1; 1; ; ;
1; 1; ; ;
.........................................
m
m
m
m
N a a a
N N a C S a Y a a a
N N a C S a Y a a a
N N a C S a Y a a a
N N a C S a Y a a a
1 1 1
..................................................
1; 1; ; ;m
i i i i i i i i i
i c
N N a C S a Y a a a
until a a
Calculations have to becarried out for each cycle !!
Numerical Integration of the Paris EquationIf the Y factor is not constant a numerical technique has to be applied. The mostoften used is the cycle by cycle technique based on the calculation of crackincrements ai corresponding to each load cycle. In this case, the infinitesimalincrements da and dN are replaced by finite differences a and N= 1.
1 1 11
( ) ( ) ; ; ( )N
m m mii i i i i o i i i i i i
ii
a C K C S a Y a a a a C S a Y NN
© 2010 Grzegorz Glinka. All rights reserved. 39

Subsequent stages of fatigue life prediction method based on the crackgrowth analysis
Analysis of external forces acting on the structure and the component in question (a), Analysis of internal loads in chosen cross section of a component ( b), Selection of individual welded joints in the structure (c), Identification of appropriate nominal or reference stress history (d), Extraction of stress cycles (rainflow counting) or reversals from the stress history
(Fig.e), Determination of the stress intensity factor (i.e. the factor Y) for postulated or existing
crack,- indirect method (Fig.f):
analyze un-cracked weldment and determine the stress field, (x,y), in theprospective crack plane; normalize the calculated stress distribution with respect tothe nominal or any other reference stress, i.e. (x,y)/ n,
choose appropriate weight function,calculate stress intensity factor
determine the stress or displacement field near the crack, or the strain energyrelease rate,
calculate stress intensity factor using. Determination of crack increments for each stress cycle (Fig. h), Determination of the number of cycles, N, necessary to grow the crack from its initial
size, a0, up to the final size, af.
A summary of necessary input data and procedures used in the, da/dN - K, approachto fatigue life estimation is also presented in the Figure.
© 2010 Grzegorz Glinka. All rights reserved. 40

Example: A very wide SAE 1020 cold-rolled thin plate is subjected to constant amplitude uni-axial cyclicloads that produce nominal stresses varying from Smax=200MPa (29ksi) to Smin=-50 MPa (-7.3ksi). Themonotonic properties for this steel are Y=630 MPa (91 ksi), uts=670 MPa (97 ksi), E=207000 MPa(30000 ksi), Kc =104 MPa m (95 ksi in). What fatigue life would be attained if an initial through-thicknessedge crack existed and was 1 mm (0.04 in) in depth?
a
W >> a
S
S
Smax
Smin
time
Stre
ss
0
The fatigue crack growth data are:Kth(r=0)=6 MPa m, and Paris’ equation
parameters C=6.9 10-12 and m=3.
© 2010 Grzegorz Glinka. All rights reserved. 41

B. Is Linear Elastic Fracture Mechanics
(LEFM) applicable?
max
max max
2 2max
:0.8 0.8 630 504 !
:
200 0.001 1.12 12.6
1 1 12.6 0.0000635 0.06352 630
0.0635 1 0.125 !1 8
Y
yY
y
Nominal stress levelS MPa YES
Plastic zone size
K S a Y MPa m
Kr m mm
rYES
a
A. What is the stress intensity factor expression?
Semi-infinite plate with an edge crack.
max max max 1.12K S a Y S a
© 2010 Grzegorz Glinka. All rights reserved. 42

C. The effective stress range
max min min
max min
max min
max
00
200 50
200
S S S for SS S for S
S MPa and S MPathus
S S MPa
D. Is the Paris equation applicable?
0 0
0 0
0
!0.001 .
200 0.001 1.12 12.6
12.6 6 , !
th
th
Paris equation is valid for K KSmallest K K occurs for a a m
K S a Y MPa m
K K MPa m YES Paris equation is applicable
© 2010 Grzegorz Glinka. All rights reserved. 43

E. What is the critical/final crack size?
max
2 2
max
1 1 104 0.068 68200 1.12
c final c
cc
K K S a Y
Ka m mmS YE. Integration of the Paris equation
Analytical integration is possible because Y= const.
000
2 2
/ 2 ( 2) / 2 ( 2) / 20
3 3 / 2 (3 2) / 2
( )
1( )
2
2 1 1 ;( 2) ( )
2 1 1(3 2) 6.9 10 12 (200 1.12) 0.001 0.06
c c c
m m
a a a
m m m m mm
aaa
m m m mc
da C K C S aYdN
da da daNC S a YC S aYC K
for m and Y const
Nm C S Y a a
N (3 2) / 2
( 2) / 2 ( 2) / 20
8
1 1 1 14631 4631 4631 31.645 3.834 1287920.0316 0.2608m m
c
cyclesa a
© 2010 Grzegorz Glinka. All rights reserved. 44

© 2007 Grzegorz Glinka. All rights reserved. Page 45
Fatigue Crack Growth under Variable Amplitude Loading:the retardation effect
a
m
max
da C KdNda f K ,KdN

46

Evolution of the crack tip plastic zone ahead ofa fatigue crack & crack tip closure
A
B
CD
Time, t Time, t Time, tTime, t0 0 0 0
Stre
ss,
S
Stre
ss,
S
Stre
ss,
S
Stre
ss,
S
Crack tipopen
Crack tipstarts to close
Extended cracktip closure
Crack tipstarts to open
Crack Crack
Crack tipplastic zone
Envelope of plasticallydeformed material in thewake of a growing crack
© 2010 Grzegorz Glinka. All rights reserved. 47

Cyclic plastic zonerc
ys
ys
Crack
Stre
ssSt
ress
rp Monotonic plastic zone
x
xCrack
2
max1p
ys
Kr
21
4cys
Kr
at: A
at: B
Time
K
0
A
B
Kmax
Kmin
K
0
A
B
Strain,
Stre
ss,
The stress-strain evolution and the monotonicand plastic zone ahead of a fatigue crack tip
© 2010 Grzegorz Glinka. All rights reserved. 48

The effect of the crack tip closure
0
Kth
,eff
?
Kef
f
Kth
K
Kmax
Kth
Kopn
Kmin
Stre
ssin
tens
ityfa
ctor
,K
Time, t
min
max
max
11
eff
opn
K
KRKKK
U
or
UR
K
© 2010 Grzegorz Glinka. All rights reserved. 49

Fatigue Growth of Corner Cracks in a Lug Subjected toa VA Loading History
a
d
2W
(x)
r
F
x
a+r
(x)
rx
Experimental data from: Jong-Ho Kim, Soon-Bok Lee, Seong-Gu Hong, Int. Journal of Fatigue, vol. 40, 2003
© 2010 Grzegorz Glinka. All rights reserved. 50

The Lug Loading Histories, Pmax=21 kN
0
2
4
6
8
10
12
14
16
18
20
0 500 1000 1500 2000
No. of Reversals
Load
/For
ce[k
N]
90% Clipping
100% Clipping
80% Clipping
The VA Load/Stress HistoryThe VA Load/Stress History
The Lug Loading Histories, Pmax=21 kN
0
2
4
6
8
10
12
14
16
18
20
0 500 1000 1500 2000
No. of Reversals
Load
/For
ce[k
N]
90% Clipping
100% Clipping
80% Clipping
The Lug Loading Histories, Pmax=21 kN
0
2
4
6
8
10
12
14
16
18
20
0 500 1000 1500 2000
No. of Reversals
Load
/For
ce[k
N]
90% Clipping
100% Clipping
80% Clipping
The VA Load/Stress HistoryThe VA Load/Stress History
© 2010 Grzegorz Glinka. All rights reserved. 51
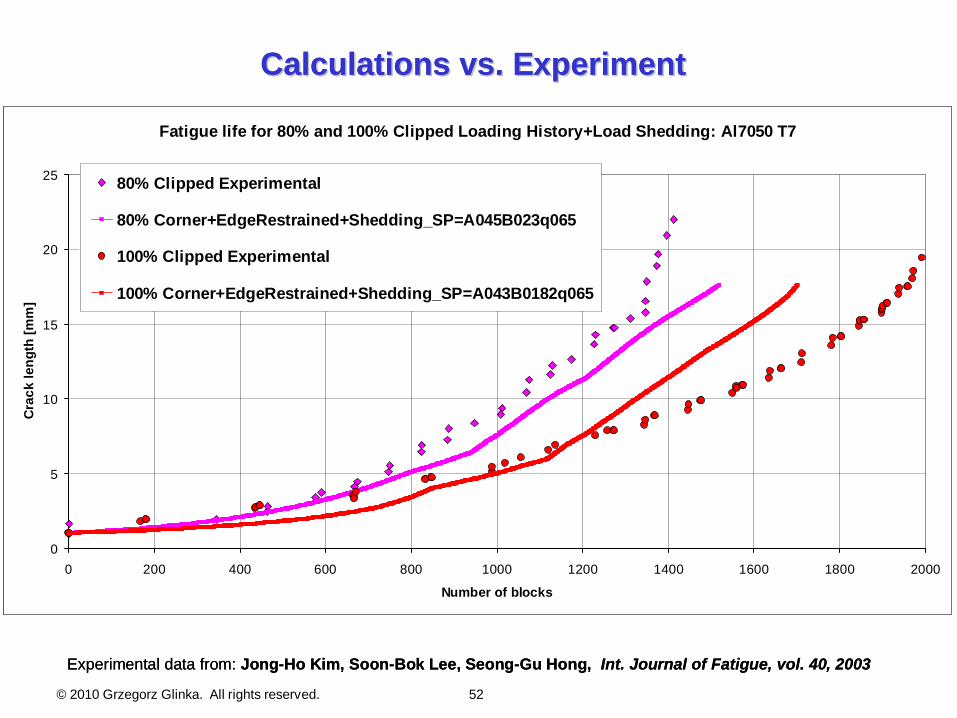
Fatigue life for 80% and 100% Clipped Loading History+Load Shedding: Al7050 T7
0
5
10
15
20
25
0 200 400 600 800 1000 1200 1400 1600 1800 2000
Number of blocks
Cra
ckle
ngth
[mm
]
80% Clipped Experimental
80% Corner+EdgeRestrained+Shedding_SP=A045B023q065
100% Clipped Experimental
100% Corner+EdgeRestrained+Shedding_SP=A043B0182q065
Calculations vs. ExperimentCalculations vs. Experiment
Experimental data from: Jong-Ho Kim, Soon-Bok Lee, Seong-Gu Hong, Int. Journal of Fatigue, vol. 40, 2003
© 2010 Grzegorz Glinka. All rights reserved. 52

Crack Shape Evolution;Crack Shape Evolution; quarter circular initial crackquarter circular initial crack
Predicted vs. Measured Crack Shape Evolution in the Lug,100% Clipping
0
1
2
3
4
5
6
7
8
9
10
0 1 2 3 4 5 6 7 8 9 10
Surface, a [mm]
Dep
th,b
[mm
]
Predicted vs. Mesured Crack Shape Evolution in the Lug,80% Clipping;
0
1
2
3
4
5
6
7
8
9
10
0 1 2 3 4 5 6 7 8 9 10
Surface, a, [mm]
Dep
th,b
,[m
m]
Experimental data from: Jong-Ho Kim, Soon-Bok Lee, Seong-Gu Hong, Int. Journal of Fatigue, vol. 40, 2003
Crack Shape Evolution;Crack Shape Evolution; quarter circular initial crackquarter circular initial crack
Predicted vs. Measured Crack Shape Evolution in the Lug,100% Clipping
0
1
2
3
4
5
6
7
8
9
10
0 1 2 3 4 5 6 7 8 9 10
Surface, a [mm]
Dep
th,b
[mm
]
Predicted vs. Mesured Crack Shape Evolution in the Lug,80% Clipping;
0
1
2
3
4
5
6
7
8
9
10
0 1 2 3 4 5 6 7 8 9 10
Surface, a, [mm]
Dep
th,b
,[m
m]
Predicted vs. Measured Crack Shape Evolution in the Lug,100% Clipping
0
1
2
3
4
5
6
7
8
9
10
0 1 2 3 4 5 6 7 8 9 10
Surface, a [mm]
Dep
th,b
[mm
]
Predicted vs. Mesured Crack Shape Evolution in the Lug,80% Clipping;
0
1
2
3
4
5
6
7
8
9
10
0 1 2 3 4 5 6 7 8 9 10
Surface, a, [mm]
Dep
th,b
,[m
m]
Experimental data from: Jong-Ho Kim, Soon-Bok Lee, Seong-Gu Hong, Int. Journal of Fatigue, vol. 40, 2003
© 2010 Grzegorz Glinka. All rights reserved. 53

2
( , ; )
2i
j i
i
P A
A A
c
c
b
K m x y P
P
Pj(x,y)
ci
3
2
1in
PjAiAi
bi
A1
A2
A3
n
i
1
2
3
Pj(x,y)
Ai
c - inverted contour ofthe crack front;
b - inverted contour ofthe external boundary;
PjAi - distance betweenthe point load P and pointA on the crack front
Weight Function for Arbitrary Planar Cracks
© 2010 Grzegorz Glinka. All rights reserved. 54

Location of maximumshear stress
Fig. 10. Geometry and dimensions of the spring
D=18.5 mm, d=4 mm
© 2010 Grzegorz Glinka. All rights reserved. 55

Relative dimensions of the inclusion (d=20-30 m) and the finalcrack size (2af= 700 m)
© 2010 Grzegorz Glinka. All rights reserved. 56

3 3 3 2
1616 8 82 4.625ref torque
DFT FD Fd d d d
2-D Stress Field in the Spring Critical Cross Section and the Locationof the Initial Crack (non-metallic inclusion)
1.0B ref
0.85A ref
1.55C ref
0 0.14 ref1.0D ref
C
D
0
A
B
ref
0.4 ref
time, t0
© 2010 Grzegorz Glinka. All rights reserved. 57

-0.25
-0.2
-0.15
-0.1
-0.05
0
0.05
0.1
0.15
0.2
0.25
-0.25 -0.2 -0.15 -0.1 -0.05 0 0.05 0.1 0.15 0.2 0.25
BoundaryStart10000002000000300000040000005000000510000052000005250000527000052800005290000529500052960005296900
-4
-3.5
-3
-2.5
-2
-1.5
-1
-0.5
0
0.5
-3 -2 -1 0 1 2 3
Fatigue crack growth; d=0.03x0.02 mm, depth 0.25 mm, C, max= 1030 MPa, C, min= 390 MPa
Nf = 5,296,900 cycles
Edge of thecross section
© 2010 Grzegorz Glinka. All rights reserved. 58

Main steps in fatigue design – flow chart
Data analysis
Collecting data SimulationSelecting criteria
Designing Stress relive!
31 2
3
4
5
Start
TheEnd !
© 2010 Grzegorz Glinka. All rights reserved. 59