Embed Size (px)
Citation preview

THE FOX NEWS EFFECT: MEDIA BIAS AND VOTING*
STEFANO DELLAVIGNA AND ETHAN KAPLAN
Does media bias affect voting? We analyze the entry of Fox News in cablemarkets and its impact on voting. Between October 1996 and November 2000, theconservative Fox News Channel was introduced in the cable programming of 20percent of U. S. towns. Fox News availability in 2000 appears to be largelyidiosyncratic, conditional on a set of controls. Using a data set of voting data for9,256 towns, we investigate if Republicans gained vote share in towns where FoxNews entered the cable market by the year 2000. We find a significant effect of theintroduction of Fox News on the vote share in Presidential elections between 1996and 2000. Republicans gained 0.4 to 0.7 percentage points in the towns thatbroadcast Fox News. Fox News also affected voter turnout and the Republicanvote share in the Senate. Our estimates imply that Fox News convinced 3 to 28percent of its viewers to vote Republican, depending on the audience measure. TheFox News effect could be a temporary learning effect for rational voters, or apermanent effect for nonrational voters subject to persuasion.
I. INTRODUCTION
Does the media affect voting behavior? According to rationalexpectation theories, voters filter out bias in reporting withoutbeing persuaded on average [Bray and Kreps 1987]. Alterna-tively, behavioral theories [De Marzo, Vayanos, and Zwiebel2003] and cognitive linguistics theories [Lakoff 1987] suggestthat voters are subject to media persuasion. Understanding theimpact of the media is of interest not only for politics but also,
* George Akerlof, Stephen Ansolabehere, Lawrence M. Bartels, Robert Calo,Arindrajit Dube, Edward Glaeser, Matthew Gentzkow, Alan Gerber, Jay Hamil-ton, Lawrence Katz, Alan Krueger, Ulrike Malmendier, Marco Manacorda, EnricoMoretti, Suresh Naidu, Torsten Persson, Sam Popkin, Riccardo Puglisi, MatthewRabin, Jesse Shapiro, Uri Simonsohn, Laura Stoker, David Stromberg, DanielSturm, and audiences at Beijing University, Bonn University (IZA), Carnegie-Mellon University, EUI (Florence), Fuqua, Harvard University (Economics De-partment and Business School), IIES (Stockholm), LSE, Princeton University, UCBerkeley, UC Davis, University of Chicago GSB, University of Munich (CES,Germany), University of Rochester, Uppsala University (Sweden), Wharton, andthe NBER 2005 Political Economy and Labor Studies Meetings provided usefulcomments. We also thank the editor (Edward Glaeser) and three referees fordetailed and helpful comments. We especially thank Jim Collins and MatthewGentzkow for providing the Scarborough data. Shawn Bananzadeh, Jessica Chan,Marguerite Converse, Neil Dandavati, Tatyana Deryugina, Monica Deza, DylanFox, Melissa Galicia, Calvin Ho, Sudhamas Khanchanawong, Richard Kim, Mar-tin Kohan, Vipul Kumar, Jonathan Leung, Clarice Li, Tze Yang Lim, Ming Mai,Sameer Parekh, Sharmini Radakrishnan, Rohan Relan, Chanda Singh, MatthewStone, Nan Zhang, Sibo Zhao, and Liya Zhu helped collect the voting and the cabledata. Dan Acland, Scott Baker, Thomas Barrios, Saurabh Bhargava, Avi Eben-stein, Devin Pope, Anitha Sivasankaran, and Justin Sydnor provided excellentresearch assistance.
© 2007 by the President and Fellows of Harvard College and the Massachusetts Institute ofTechnology.The Quarterly Journal of Economics, August 2007
1187
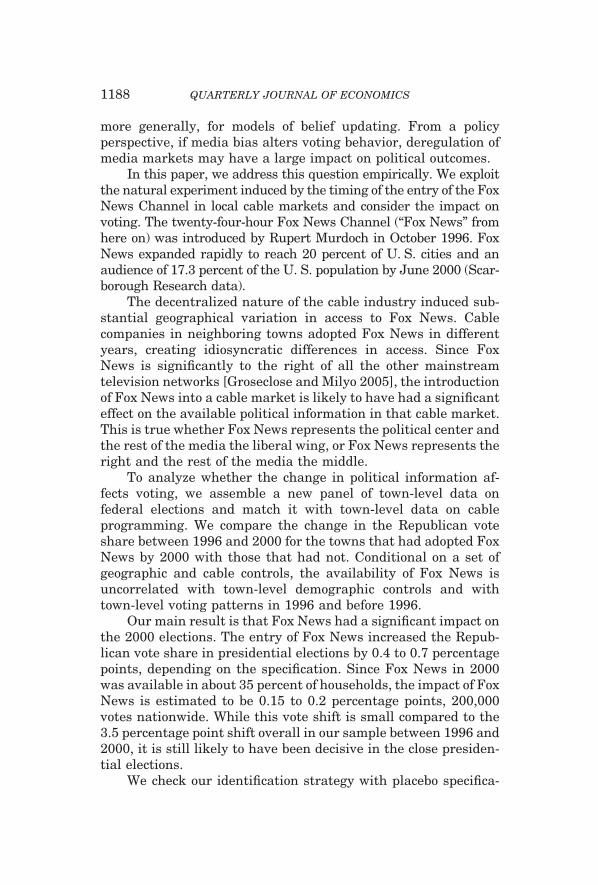
more generally, for models of belief updating. From a policyperspective, if media bias alters voting behavior, deregulation ofmedia markets may have a large impact on political outcomes.
In this paper, we address this question empirically. We exploitthe natural experiment induced by the timing of the entry of the FoxNews Channel in local cable markets and consider the impact onvoting. The twenty-four-hour Fox News Channel (“Fox News” fromhere on) was introduced by Rupert Murdoch in October 1996. FoxNews expanded rapidly to reach 20 percent of U. S. cities and anaudience of 17.3 percent of the U. S. population by June 2000 (Scar-borough Research data).
The decentralized nature of the cable industry induced sub-stantial geographical variation in access to Fox News. Cablecompanies in neighboring towns adopted Fox News in differentyears, creating idiosyncratic differences in access. Since FoxNews is significantly to the right of all the other mainstreamtelevision networks [Groseclose and Milyo 2005], the introductionof Fox News into a cable market is likely to have had a significanteffect on the available political information in that cable market.This is true whether Fox News represents the political center andthe rest of the media the liberal wing, or Fox News represents theright and the rest of the media the middle.
To analyze whether the change in political information af-fects voting, we assemble a new panel of town-level data onfederal elections and match it with town-level data on cableprogramming. We compare the change in the Republican voteshare between 1996 and 2000 for the towns that had adopted FoxNews by 2000 with those that had not. Conditional on a set ofgeographic and cable controls, the availability of Fox News isuncorrelated with town-level demographic controls and withtown-level voting patterns in 1996 and before 1996.
Our main result is that Fox News had a significant impact onthe 2000 elections. The entry of Fox News increased the Repub-lican vote share in presidential elections by 0.4 to 0.7 percentagepoints, depending on the specification. Since Fox News in 2000was available in about 35 percent of households, the impact of FoxNews is estimated to be 0.15 to 0.2 percentage points, 200,000votes nationwide. While this vote shift is small compared to the3.5 percentage point shift overall in our sample between 1996 and2000, it is still likely to have been decisive in the close presiden-tial elections.
We check our identification strategy with placebo specifica-
1188 QUARTERLY JOURNAL OF ECONOMICS
tions; in particular, we show that availability of Fox News in 2000did not affect the vote share between 1992 and 1996 or between1988 and 1992, when Fox News did not yet exist.
We provide evidence that the Fox News effect varies withtown characteristics. The effect was smaller in towns with morecable channels, which is consistent with a moderating effect ofcompetition [Mullainathan and Shleifer 2005]. In addition, FoxNews had a smaller effect in rural areas and in Republicancongressional districts, possibly because in these towns the shareof non-Republicans at risk of being convinced was smaller.
We also analyze whether Fox News affected voting in raceswhere Fox News did not cover the candidates directly, as in mostSenate races. This allows us to estimate whether the influence ofFox News is candidate-specific or whether it extends to generalpolitical beliefs. We find that Fox News significantly increasedthe Republican vote share for the Senate by 0.7 percentagepoints. Additionally, the effect is not significantly larger for theone Senatorial race that Fox News covered heavily, the New YorkState race between Hillary Clinton and Rick Lazio. Fox Newsappears to have induced a generalized ideological shift.
Finally, we consider whether the Fox News effect on presi-dential elections was mainly a result of voters switching partylines or of additional voter turnout to the polls. We find that FoxNews significantly increased voter turnout, particularly in themore Democratic districts. The impact of Fox News on votingappears to be due, at least in part, to the mobilization of votersand particularly conservative voters in Democratic-leaningdistricts.
Overall, we find a sizeable impact of Fox News on the voteshare for Republicans. To quantify the persuasion rate of themedia, we incorporate information on the extent of viewershipand the share of Republicans in the Fox News audience. Usingtwo different audience measures from Scarborough Researchdata, we compute the impact on the Fox News viewership ofavailability of Fox News in local cable programming. The moreinclusive audience estimates imply that Fox News convincedbetween 3 and 8 percent of its non-Republican viewers to voteRepublican, depending on the specification. The more restrictiveaudience measures imply persuasion effects between 11 and 28percent. Exposure to more conservative coverage, therefore, had asizeable, and possibly large, persuasion effect.
We compare the persuasion rates estimated in our study with
1189THE FOX NEWS EFFECT: MEDIA BIAS AND VOTING

the persuasion rates implied by other studies of media effects onpolitical beliefs or voting.1 These studies include field experi-ments on voter turnout [Green and Gerber 2004] and on partychoice [Gerber, Karlan, and Bergan 2006], laboratory experi-ments involving exposure to political advertisements [Ansolabe-here and Iyengar 1995], and poll studies [Kull, Ramsey, andLewis 2003; Gentzkow and Shapiro 2004]. Our estimates of per-suasion rates are in the range of most estimates in the literature.
We consider three explanations of our results. The first ex-planation is that the findings are spurious and are induced byentry of Fox News in towns that were independently becomingmore conservative. Contrary to this explanation, these townswere no more conservative, nor were they becoming more conser-vative before the entry of Fox News. A second explanation isbased on rational learning. To the extent that voters are initiallyuncertain about the bias of Fox News, exposure will have a(temporary) effect on beliefs and voting. Voters attribute thepositive coverage of George W. Bush in 2000 partly to Republicanbias of the media source (Fox News) but partly also to highquality of the Republican candidate (Bush). By the year 2000,however, the conservative slant of Fox News should have beenclear. This explanation also makes the prediction that the mediaeffect should disappear over time, contrary to the evidence thatthe Fox News effect does not decrease between 2000 and 2004. Athird explanation is that viewers do not sufficiently account formedia bias and are subject to nonrational persuasion. In thiscase, exposure to media slant systematically alters beliefs andvoting behavior. In the working paper version [DellaVigna andKaplan 2006] we model the latter two explanations.
The latter interpretation relates to behavioral literature onnonrational persuasion [DeMarzo, Vayanos, and Zwiebel 2003].Cain, Loewenstein, and Moore [2005] show in an experiment thatevaluators of information do not take sufficiently into account the(known) incentives of the advisors and are thus persuaded bytheir advice. Malmendier and Shanthikumar [forthcoming] showthat small investors follow the recommendations of affiliatedanalysts, despite the conflict of interest of the analysts.
Our paper contributes to the evidence on the impact of media
1. Dyck and Zingales [2003] and Huberman and Regev [2001], among others,find that media coverage has a large impact on stock returns, even when arguablyit conveys no new information.
1190 QUARTERLY JOURNAL OF ECONOMICS
market expansions on voter turnout. Expansions of The New YorkTimes in the 1990s [George and Waldfogel 2006], of televisionbetween 1940 and 1972 [Gentzkow 2006], and of cable in the1970s [Prior 2006] decrease turnout, while radio entry between1920 and 1940 increases turnout [Stromberg 2004]. Unlike inthese studies, we examine the introduction of a politically slantedmedia and estimate the effect of media persuasion.
The paper also adds to the empirical literature on media bias[Herman and Chomsky 1998; Hamilton 2004; Puglisi 2004;Groseclose and Milyo 2005] and the theoretical literature on it[Mullainathan and Shleifer 2005; Gentzkow and Shapiro 2006].We provide evidence that exposure to media bias persuades vot-ers, an implicit assumption underlying most of these papers.
The remainder of the paper is structured as follows. In Sec-tion II we provide background information on Fox News and wedescribe the data. In Section III we present the empirical results,including a comparison to results from an earlier draft of thispaper in which we found no effect of Fox News. In Section IV wepresent estimates of persuasion rates and interpretations, and inSection V we conclude.
II. FOX NEWS HISTORY AND DATA
Fox News History and Content. In March of 1996, RupertMurdoch announced the introduction of a twenty-four-hour-a-day cable news channel, Fox News. Prior to the launch of FoxNews, news broadcasts took up a small share of programmingof the Fox Broadcasting Corporation, which included channelslike Fox Entertainment and the Fox Family Channel. Therewas no national news broadcast, and prime time programmingon the Fox channels did not include news.
The political coverage of Fox News is to the right of thecoverage of the other main television news sources, the majornetworks—ABC, CBS, and NCB—and CNN. Groseclose and Mi-lyo [2005], for example, compute an index of political orientationof news programs using citations of think tanks. They estimatethat Fox News Special Report is significantly to the right of theother mainstream television media (ABC, CBS, CNN, and NBC).The news coverage of Fox News is also estimated to be to the rightof the average U. S. elected official.
The distribution of Fox News started on October 7, 1996, in a
1191THE FOX NEWS EFFECT: MEDIA BIAS AND VOTING
limited number of cable markets. The cable industry is a localnatural monopoly due to the fixed cost of laying cables. In oursample, only 10 percent of towns have two or more cable compa-nies. In addition, cable companies face a technological constrainton the number of channels. News channels like Fox News have toconvince local cable companies to be added, often at the expenseof other channels. The timing of the agreement between FoxNews and the cable companies is one factor inducing idiosyncraticdiffusion of Fox News. TCI was one of the first companies to signan agreement. By November 2000, AT&T Broadband, which ac-quired TCI Cable in 1999, offered Fox News in 32.5 percent of the1,955 towns served by its affiliates (in our sample of twenty-eightU. S. states). Adelphia Communications, which had a late agree-ment with Fox News, offered Fox News in only 7.5 percent of the1,592 towns in our sample served by its affiliates.
In addition to the twenty-four-hour cable programming, FoxNews distributes short news segments to local TV stations thatare affiliates of Fox Broadcasting. However, the twenty-four-hourchannel is only available via cable and to twelve million satellitesubscribers (in 2000).2
By the year 2000, Fox News was present in 20 percent oftowns in our sample with cable service. Since the towns reachedby Fox News in 2000 were more than twice as large as theremaining towns, Fox News was available to 34.3 percent of thepopulation of these states.
Fox News Audience. We document the Fox News penetrationand the composition of the Fox News audience using microleveldata from Scarborough Research. Scarborough uses a represen-tative panel of households to collect demographic variables andtwo audience measures for each TV channel surveyed. The firstand more inclusive audience measure, the recall measure, is theshare of respondents who answer yes to the question on whetherthey watched a given channel in the past seven days. The secondand more restrictive measure, the diary measure, is tabulatedfrom a week-long diary of TV watching and is the share of re-spondents who watched a channel for at least one full half-an-hour block according to the seven-day diary.
2. As of June 2000, 14,458,000 U. S. households subscribed to a satelliteservice, but two million of these subscribers did not receive Fox News (SatelliteBroadcasting and Communications Association, from http://www.sbca.com/index.asp).
1192 QUARTERLY JOURNAL OF ECONOMICS
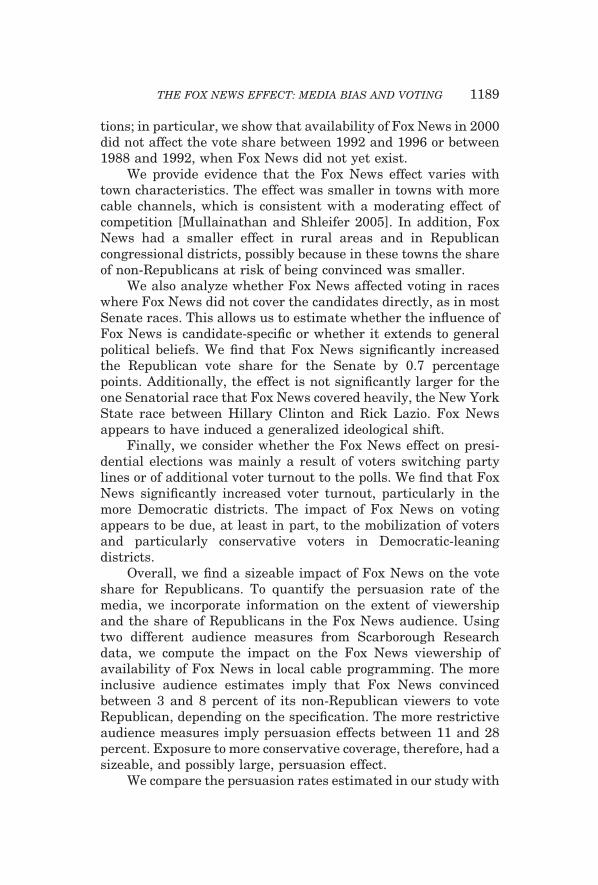
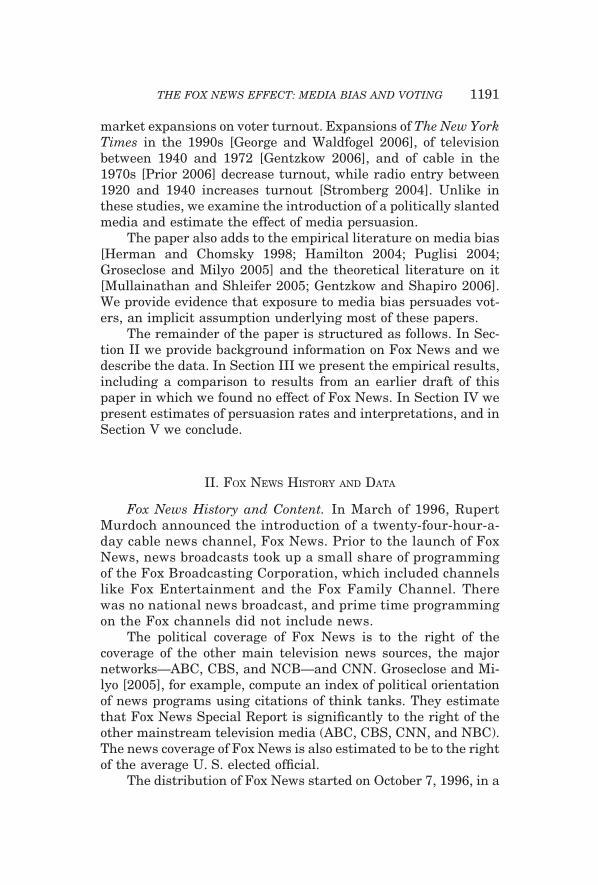
In column (1) of Table I, we report summary statistics for the105,201 respondents to the August 2000–March 2001 survey. Therecall audience for Fox News is 17.3 percent, and 34.1 percent forCNN. According to this measure, by the year 2000, Fox Newsalready had an audience half as large as that of CNN. The diaryaudience is not available for this sample. We also present sum-mary statistics for the Fox News audience (column (2)) and for therest of the sample (column (3)). The education level and unem-ployment rate are comparable across the two samples, AfricanAmericans are somewhat more likely to listen regularly to FoxNews, and Hispanics somewhat less likely. The Fox News audi-ence is older and more likely to be male.
Turning to the political variables, 37.5 percent of the FoxNews recall audience self-identify as Republican, 29.4 percent asDemocrat, and the remainder as Independent. Among the non-Fox News audience, 26.2 percent identify as Republican and 32.4percent as Democrat. Fox News viewers therefore are more likelyto be Republican.3 Since the audience data are from 2000, afterthe entry of Fox News, this difference could be due either tosorting to Republicans into the Fox News audience or to a per-suasion effect of exposure to Fox News. Self-reported turnout toPresidential elections is higher in the Fox News audience.
In columns (4)–(6), we focus on the subsample for which zip codeof residence and the diary audience measure are both available. Thissample was recorded between February 2000 and August 2001 infive geographical areas.4 We further restrict the sample to the11,388 respondents living in one of the 568 towns with availablecable and election data. In Section IV.A, we use this subsample toestimate the impact of Fox News availability via cable on the FoxNews audience. This sample (column (4)) is similar to the wholesample (column (1)) both with respect to the measure of the FoxNews recall audience and with respect to demographics, except for ahigher share of Hispanic viewers. The diary audience is three to fivetimes smaller than the corresponding recall audience: 0.035 for FoxNews (recall audience 0.166) and 0.103 for CNN (recall audience0.353). The diary audience measure is less inclusive than the recall
3. We find a similar pattern for audience measures of CNN and CNBC,suggesting that the selection of Republicans into the Fox News audience maysimply reflect selection of Republicans into news channels.
4. The data include respondents residing in the Designated Market Areas(DMAs) of Chicago (September 2000–August 2001), Los Angeles (February 2000–January 2001), Pittsburgh (September 2000–August 2001), New York (March2000–February 2001), and Washington, D.C. (March 2000–February 2001).
1193THE FOX NEWS EFFECT: MEDIA BIAS AND VOTING

TA
BL
EI
SU
MM
AR
YS
TA
TIS
TIC
SO
NF
OX
NE
WS
AU
DIE
NC
E(S
CA
RB
OR
OU
GH
DA
TA)
Sam
ple
Su
mm
ary
stat
isti
cs
All
surv
eyre
spon
den
tsM
atch
edzi
p-co
ded
subs
ampl
e
All
Fox
New
sre
call
audi
ence
Fox
New
sn
on-a
udi
ence
All
Fox
New
sdi
ary
audi
ence
Fox
New
sn
on-a
udi
ence
(1)
(2)
(3)
(4)
(5)
(6)
Cab
leva
riab
les
Fox
New
s0.
173
10
0.16
6*0.
591*
0.14
6*(r
ecal
lau
dien
ce)
(0.3
79)
(0.3
72)
(0.4
93)
(0.3
53)
Fox
New
s0.
035
10
(dia
ryau
dien
ce)
(0.1
85)
CN
N0.
341
0.61
90.
283
0.35
3*0.
603*
0.34
1*(r
ecal
lau
dien
ce)
(0.4
74)
(0.4
86)
(0.4
51)
(0.4
78)
(0.4
90)
(0.4
74)
CN
N0.
103
0.35
00.
094
(dia
ryau
dien
ce)
(0.3
04)
(0.4
78)
(0.2
92)
Dem
ogra
phic
vari
able
sS
ome
coll
ege
0.21
40.
219
0.21
30.
215
0.20
60.
215
(0.4
10)
(0.4
14)
(0.4
10)
(0.4
11)
(0.4
05)
(0.4
11)
Col
lege
grad
uat
e0.
344
0.35
60.
341
0.38
60.
452
0.38
4(0
.475
)(0
.479
)(0
.474
)(0
.487
)(0
.498
)(0
.486
)A
fric
anA
mer
ican
0.09
70.
111
0.09
40.
084
0.02
00.
086
(0.2
96)
(0.3
14)
(0.2
92)
(0.2
77)
(0.1
40)
(0.2
81)
His
pan
ic0.
107
0.08
10.
112
0.18
00.
094
0.18
3(0
.309
)(0
.273
)(0
.315
)(0
.384
)(0
.293
)(0
.387
)U
nem
ploy
men
t0.
022
0.01
80.
023
0.02
30.
005
0.02
4(0
.147
)(0
.134
)(0
.149
)(0
.151
)(0
.070
)(0
.153
)
1194 QUARTERLY JOURNAL OF ECONOMICS

TA
BL
EI
(CO
NT
INU
ED
)
Sam
ple
Su
mm
ary
stat
isti
cs
All
surv
eyre
spon
den
tsM
atch
edzi
p-co
ded
subs
ampl
e
All
Fox
New
sre
call
audi
ence
Fox
New
sn
on-a
udi
ence
All
Fox
New
sdi
ary
audi
ence
Fox
New
sn
on-a
udi
ence
(1)
(2)
(3)
(4)
(5)
(6)
Age
45.6
7949
.744
44.8
2744
.506
51.7
2744
.241
(16.
633)
(16.
995)
(16.
429)
(16.
443)
(16.
362)
(16.
386)
Mal
e0.
424
0.48
10.
412
0.42
70.
526
0.42
3(0
.494
)(0
.500
)(0
.492
)(0
.495
)(0
.500
)(0
.494
)P
olit
ical
vari
able
sR
epu
blic
an0.
282
0.37
50.
262
0.26
70.
536
0.25
7(0
.450
)(0
.484
)(0
.440
)(0
.442
)(0
.499
)(0
.437
)D
emoc
rat
0.31
90.
294
0.32
40.
335
0.15
90.
342
(0.4
66)
(0.4
55)
(0.4
68)
(0.4
72)
(0.3
66)
(0.4
74)
Vot
ertu
rnou
t0.
693
0.76
90.
677
0.67
70.
819
0.67
2(0
.461
)(0
.421
)(0
.468
)(0
.468
)(0
.386
)(0
.470
)S
ubs
crip
tion
sC
able
0.68
70.
784
0.66
60.
754
0.88
60.
749
(0.4
64)
(0.4
11)
(0.4
71)
(0.4
31)
(0.3
18)
(0.4
34)
Sat
elli
te0.
147
0.13
80.
149
0.10
40.
122
0.10
3(0
.354
)(0
.344
)(0
.356
)(0
.305
)(0
.327
)(0
.304
)
No.
obse
rvat
ion
sN
�10
5,20
1N
�18
,223
N�
86,9
68N
�11
,388
N�
403
N�
10,9
85
Not
es:D
ata
from
Sca
rbor
ough
Res
earc
h.C
olum
ns(1
)thr
ough
(3)s
how
mea
nan
dst
anda
rdde
viat
ion
ofva
riab
les
inth
ew
hole
U.S
.sam
ple
(Aug
ust
2000
–Mar
ch20
01,c
olum
n(1
))an
din
the
subs
ampl
esof
regu
lar
Fox
New
sau
dien
ce(c
olum
n(2
))an
dno
nreg
ular
Fox
New
sau
dien
ce(c
olum
n(3
)).C
olum
ns(4
)th
roug
h(6
)sh
owm
ean
and
stan
dard
devi
atio
nof
vari
able
sin
the
subs
ampl
ew
ith
zip
code
data
that
mat
ches
toa
tow
nin
the
cabl
ean
del
ecti
onsa
mpl
e(F
ebru
ary
2000
–Aug
ust
2001
,col
umn
(4))
and
inth
esu
bsam
ples
ofdi
ary
Fox
New
sau
dien
ce(c
olum
n(5
))an
dno
ndia
ryF
oxN
ews
audi
ence
(col
umn
(6))
.The
reca
llF
oxN
ews
audi
ence
isan
indi
cato
rva
riab
lefo
rre
spon
dent
sw
host
ated
that
they
wat
ched
ach
anne
lin
the
past
seve
nda
ys.T
hedi
ary
Fox
New
sau
dien
ceis
anin
dica
tor
vari
able
for
whe
ther
the
resp
onde
ntw
atch
edat
leas
ta
full
thir
ty-m
inut
ebl
ock
ofF
oxN
ews
inth
esu
rvey
wee
k.*
Th
en
um
ber
ofob
serv
atio
ns
for
Fox
New
s(r
egu
lar
audi
ence
)is
5,07
0in
colu
mn
(4),
237
inco
lum
n(5
),an
d5,
307
inco
lum
n(6
).S
ame
nu
mbe
rof
obse
rvat
ion
sfo
rC
NN
(reg
ula
rau
dien
ce).
1195THE FOX NEWS EFFECT: MEDIA BIAS AND VOTING

measure, since it excludes anyone who, in the previous week,watched a channel for less than a full half hour block (a likelypattern for a news channel). It is also less subject to memory biases,which may lead to over-reporting of the recall audience. Throughoutthe paper, we report the results with both measures.
In columns (5) and (6) we compare the Fox News audienceand the non-Fox News audience according to the diary measure.The differences between these two samples resemble the onesfound according to the recall audience measures (columns (2) and(3)), except that political differences are more accentuated andthat African Americans are less likely to watch Fox News accord-ing to the diary measure.
Data. The data on local cable companies are from a papercopy of the Television and Cable Factbook, 2001 edition [Warren2001]. This edition contains information as of November 2000,that is, right up to the 2000 elections. We did not collect infor-mation for the year 1996 since Fox News became available only inOctober 1996 and just for a limited number of markets. In theAppendix we present details on this data.
The main source of election data was the Election Division ofthe Secretary of State of each state. Other sources are the FederalElection Project [Lublin and Voss 2001] for the year 2000, theRecord of American Democracy (ROAD) Project [King et al. 1997]for the year 1988, and the Atlas Election data [Leip 2004] for the2004 presidential election.
We aggregate the voting information to the town level. A firstgroup of states—California, New Jersey, New York, and the NewEngland States—directly provide voting information at the townlevel, which we employ. A second group of states—Iowa, Minne-sota, Michigan, Montana, Ohio, Pennsylvania, Wisconsin, andWyoming—provide precinct-level voting information with corre-sponding town name, which we use to aggregate to the town level.A third group of states—Alaska, Alabama, Arkansas, Hawaii,Idaho, Missouri, North Dakota, South Carolina, Tennessee, Utah,and Virginia—only have precinct-level voting information, withprecinct names that usually include the name of the town butsometimes do not. Examples of precinct names are “02—ConcordElem School” and “Hot Springs Retirement Hm.” For these states,we recover the town name from the precinct name by eliminationof numbers and commonly used words, such as “School” and
1196 QUARTERLY JOURNAL OF ECONOMICS
“Retirement Hm.” 5 We then aggregate the voting data over pre-cincts with the same town name in a given county and state. Thetwenty-eight U. S. states that have voting information that wecan aggregate to the town level for both years 1996 and 2000 formthe sample used in this paper. The aggregation procedure gener-ates 26,710 distinct localities.
For the twenty-eight U. S. states in our sample, we collectdemographics from the 2000 and the 1990 Census at the level of“Place,” including “Remainders of Place.” We transform the placename and aggregate the Census data using the same code employedfor the election and cable data. This procedure leaves 27,064 townswith information from both the 2000 and the 1990 Census.
We match the cable, the election, and the Census data by thestate, county, and town name, yielding 10,126 localities. We drop289 towns with multiple cable systems, at least one of whichcarries Fox News and at least one of which does not. For thesetowns, we do not know if cable consumers have access to FoxNews. Additionally, we drop 324 towns with cable systems that donot offer CNN as part of the cable package. In these towns, cableofferings are typically limited to the reprogramming of local cablechannels. Their news programming, therefore, is not comparableto the programming of the other towns.6 Finally, we drop 257towns with likely voting data problems: 238 towns for which thenumber of precincts generating the town-level vote count differsby more than 20 percent between 1996 and 2000;7 and nineteentowns for which the total number of votes cast in the presidentialelection differs by more than 100 percent between 1996 and 2000.For these observations, the problems are likely due to imperfectmatching of the precincts aggregated to the town level in 1996and 2000.
The final sample of 9,256 towns has comparable Fox Newsavailability relative to the initial sample and somewhat lowerRepublican vote share in 2000 and 1996 because the unmatchedtowns are more likely to be small and rural. The final sample
5. The Stata ado file that translates precinct names into town names isavailable upon request.
6. The results do not vary if we include these towns.7. We do not apply this criterion for Michigan, New Hampshire, New York,
Ohio, Rhode Island, and Utah since the numbering of precincts is not comparableacross 1996 and 2000.
1197THE FOX NEWS EFFECT: MEDIA BIAS AND VOTING

TA
BL
EII
SU
MM
AR
YS
TA
TIS
TIC
SO
NC
AB
LE
AN
DE
LE
CT
ION
DA
TA
All
sam
ple
Mix
eddi
stri
cts
Mix
edco
un
ties
All
tow
ns
Fox
New
sin
2000
No
Fox
in20
00F
oxN
ews
in20
00N
oF
oxin
2000
Fox
New
sin
2000
No
Fox
in20
00
(1)
(2)
(3)
(4)
(5)
(6)
(7)
Cab
leva
riab
les
Nu
mbe
rof
chan
nel
s28
.60
44.5
224
.73
44.3
924
.41
45.0
026
.05
(14.
64)
(15.
98)
(11.
31)
(16.
14)
(11.
57)
(16.
06)
(11.
81)
Pot
enti
alsu
bscr
iber
s78
,124
163,
622
57,3
8414
0,45
747
,373
167,
006
70,8
32(1
49,0
15)
(246
,661
)(1
03,1
31)
(198
,871
)(9
1,02
5)(2
54,9
26)
(116
,337
)V
otin
gva
riab
les
Rep
.vo
tesh
are
in19
960.
470
0.47
90.
467
0.48
20.
475
0.47
70.
475
(0.1
25)
(0.1
25)
(0.1
25)
(0.1
24)
(0.1
24)
(0.1
25)
(0.1
27)
Rep
.vo
tesh
are
in20
000.
538
0.53
80.
538
0.54
10.
550
0.53
30.
536
(0.1
30)
(0.1
29)
(0.1
30)
(0.1
28)
(0.1
26)
(0.1
29)
(0.1
33)
Log
turn
out
in19
96�
0.58
3�
0.58
3�
0.58
3�
0.58
3�
0.57
8�
0.57
3�
0.56
6(0
.481
)(0
.482
)(0
.480
)(0
.471
)(0
.732
)(0
.434
)(0
.418
)L
ogtu
rnou
tin
2000
�0.
522
�0.
525
�0.
521
�0.
525
�0.
518
�0.
510
�0.
504
(0.4
91)
(0.4
97)
(0.4
90)
(0.4
87)
(0.4
83)
(0.4
49)
(0.4
31)
Cen
sus
vari
able
sfo
r20
00P
opu
lati
on9,
612
11,5
169,
150
10,5
647,
157
11,8
7212
,266
(32,
661)
(32,
427)
(32,
703)
(31,
000)
(23,
261)
(33,
678)
(37,
678)
Som
eco
lleg
e0.
257
0.25
90.
257
0.25
80.
257
0.25
80.
254
(0.0
64)
(0.0
63)
(0.0
64)
(0.0
64)
(0.0
66)
(0.0
63)
(0.0
67)
Col
lege
0.19
50.
220
0.18
90.
216
0.17
80.
224
0.21
0(0
.133
)(0
.147
)(0
.129
)(0
.145
)(0
.118
)(0
.150
)(0
.146
)A
fric
anA
mer
ican
0.03
30.
031
0.03
40.
028
0.02
70.
030
0.02
6(0
.095
)(0
.082
)(0
.098
)(0
.073
)(0
.083
)(0
.084
)(0
.072
)H
ispa
nic
0.03
10.
035
0.03
00.
032
0.02
70.
035
0.04
1(0
.073
)(0
.072
)(0
.073
)(0
.067
)(0
.065
)(0
.074
)(0
.096
)U
nem
ploy
ed0.
051
0.05
10.
052
0.05
10.
052
0.05
00.
053
(0.0
35)
(0.0
35)
(0.0
35)
(0.0
35)
(0.0
35)
(0.0
36)
(0.0
38)
1198 QUARTERLY JOURNAL OF ECONOMICS

TA
BL
EII
(CO
NT
INU
ED
)
All
sam
ple
Mix
eddi
stri
cts
Mix
edco
un
ties
All
tow
ns
Fox
New
sin
2000
No
Fox
in20
00F
oxN
ews
in20
00N
oF
oxin
2000
Fox
New
sin
2000
No
Fox
in20
00
(1)
(2)
(3)
(4)
(5)
(6)
(7)
Urb
an0.
406
0.53
70.
374
0.51
80.
331
0.55
60.
441
(0.4
38)
(0.4
47)
(0.4
29)
(0.4
46)
(0.4
16)
(0.4
46)
(0.4
47)
Cen
sus
vari
able
s,ch
ange
from
1990
to20
00:
Pop
ula
tion
704
772
687
681
584
805
934
(3,4
57)
(3,7
75)
(3,3
75)
(3,4
99)
(2,7
27)
(3,9
74)
(4,4
61)
Som
eco
lleg
e0.
040
0.03
50.
041
0.03
60.
044
0.03
50.
034
(0.0
48)
(0.0
46)
(0.0
49)
(0.0
46)
(0.0
49)
(0.0
46)
(0.0
47)
Col
lege
0.03
70.
041
0.03
60.
041
0.03
50.
042
0.04
1(0
.042
)(0
.044
)(0
.042
)(0
.045
)(0
.041
)(0
.045
)(0
.043
)A
fric
anA
mer
ican
0.00
40.
003
0.00
40.
003
0.00
30.
003
0.00
4(0
.026
)(0
.025
)(0
.026
)(0
.024
)(0
.024
)(0
.024
)(0
.024
)H
ispa
nic
0.01
10.
013
0.01
00.
012
0.01
00.
013
0.01
1(0
.026
)(0
.030
)(0
.025
)(0
.027
)(0
.025
)(0
.029
)(0
.028
)U
nem
ploy
ed�
0.01
2�
0.01
1�
0.01
3�
0.01
1�
0.01
3�
0.01
2�
0.01
2(0
.038
)(0
.037
)(0
.039
)(0
.037
)(0
.040
)(0
.038
)(0
.036
)U
rban
0.08
20.
079
0.08
30.
082
0.08
00.
084
0.08
6(0
.238
)(0
.239
)(0
.238
)(0
.241
)(0
.240
)(0
.247
)(0
.242
)
No.
ofob
serv
atio
ns
N�
9,25
6N
�1,
807
N�
7,44
9N
�1,
734
N�
5,89
7N
�1,
548
N�
2,34
2
Not
es:S
tan
dard
devi
atio
ns
inpa
ren
thes
es.T
he
subs
et“F
oxN
ews
in20
00”
isfo
rmed
byth
eto
wn
sw
ith
avai
labi
lity
ofF
oxN
ews
in20
00in
the
cabl
epa
ckag
e.T
he
subs
et“N
oF
oxin
2000
”is
the
com
plem
enta
rygr
oups
ofto
wn
s.T
own
sw
ith
dist
rict
vari
atio
nar
eto
wn
sin
dist
rict
sin
wh
ich
ther
eis
atle
ast
one
tow
nth
atdo
esn
otge
tF
oxN
ews
and
one
tow
nth
atdo
es.T
own
sw
ith
cou
nty
vari
atio
nar
esi
mil
arly
defi
ned
exce
ptat
the
cou
nty
leve
l.P
oten
tial
subs
crib
ers
isde
fin
edas
the
tota
lvo
tin
g-ag
epo
pula
tion
ofth
eto
wn
sre
ach
edby
aca
ble
prov
ider
.Rep
ubl
ican
two-
part
yvo
tesh
are
isth
evo
tes
rece
ived
byth
eR
epu
blic
anca
ndi
date
inth
epr
esid
enti
alel
ecti
ondi
vide
dby
the
vote
sre
ceiv
edby
both
the
Rep
ubl
ican
and
Dem
ocra
tic
can
dida
tes.
Log
turn
out
ism
easu
red
byth
elo
gof
the
rati
oof
tota
lvo
tes
cast
ina
give
nto
wn
and
year
toth
evo
tin
g-ag
epo
pula
tion
ofth
eto
wn
inth
esa
me
year
.T
he
voti
ng-
age
popu
lati
onda
tafo
r19
96is
inte
rpol
ated
from
the
1990
and
2000
Cen
sus.
Th
efu
llli
stof
Cen
sus
vari
able
sis
pres
ente
din
App
endi
xII
.O
bser
vati
ons
un
wei
ghte
d.
1199THE FOX NEWS EFFECT: MEDIA BIAS AND VOTING
covers 65.9 percent of the population and 68.6 percent of totalvotes cast for the twenty-eight states in the year 2000.8
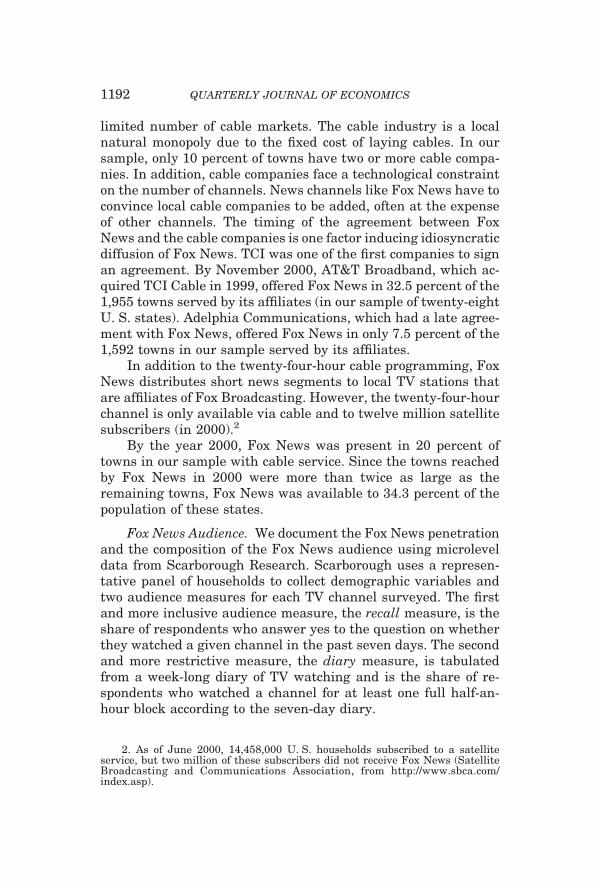
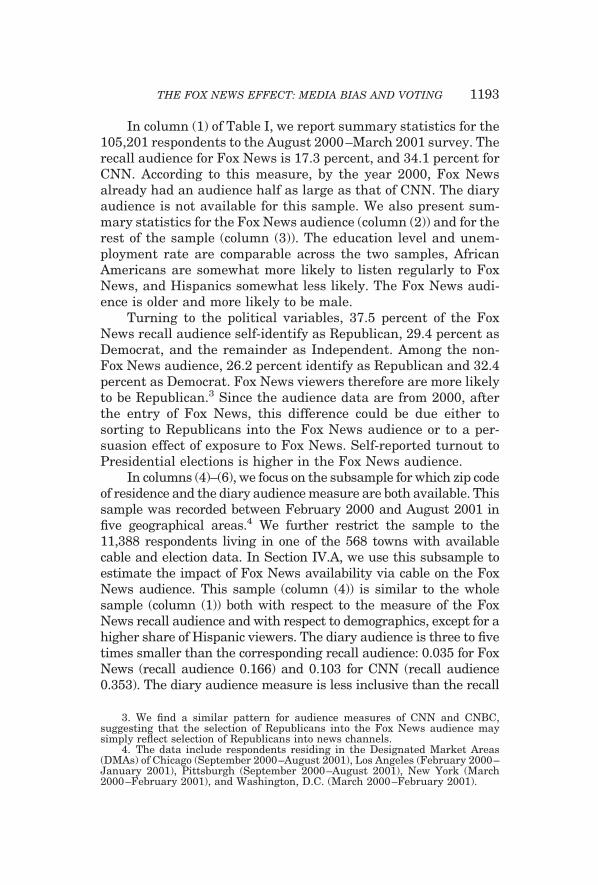
Summary Statistics. Table II presents unweighted summarystatistics on the cable and election data. The average cable sys-tem in the year 2000 included twenty-eight channels in the Basicand Expanded Basic programming and reached a population of78,124. The mean town population was 9,612 with a median of2,766. As Census controls, we include the share of the populationwith some college, the share of college graduates, the share ofAfrican Americans and of Hispanics, the unemployment rate, andthe share of the town that is urban (shown in Table II). We alsoinclude the share of high school graduates, the share of males, themarriage rate, the employment rate, and average income (notshown in Table II).
We compare towns that offered Fox News in their program-ming (column (2)) and towns that did not (column (3)). Towns thatoffer Fox News have a substantially higher number of channelsoffered (44.5 versus 24.7), are 25 percent larger, are served bycable companies that reach three times as many people, and aremore likely to be urban.
More importantly, towns that offered Fox News by 2000increased their Republican vote share by 5.9 percentage points(from 47.9 to 53.8 percent) between 1996 and 2000, while thosethat did not offer Fox News increased theirs by an even larger 7.1percentage points (from 46.7 to 53.8 percent). These figures sug-gest a perverse Fox News effect. This result, however, does notweight towns by size, nor does it take into account differencesbetween Fox and non-Fox towns in voting trends across geo-graphical areas, demographic composition, and cable market.Later, we estimate the Fox News effect, taking into account allthese factors.
The overall sample spans 235 congressional districts, out of435 total. Out of these 235 districts, 152 districts include both
8. The coverage rate is lower than 100 percent for three reasons: (i) we dropsome of the largest cities like New York, which have several cable systems, someof which carry Fox News, and some of which do not; (ii) in states like Missouri,some counties have numeric precinct names that we cannot match to a town; and(iii) in states like Arkansas, complicated precinct names induce a poor matchbetween the election data and the cable and Census data. The exclusion of largecities or certain counties or precincts should not affect the results, as long as FoxNews availability and the election outcomes are measured correctly for the match-ing towns. Details on the state-by-state coverage rate is in Appendix Table I inDellaVigna and Kaplan [2006].
1200 QUARTERLY JOURNAL OF ECONOMICS
towns that offered Fox News and towns that did not. In ourdifference-in-difference specification with district fixed effects,the effect of Fox News is estimated on the 7,631 towns in thissubsample. Towns in this subsample (columns (4) and (5) of TableII) are smaller but otherwise comparable to the overall sample.
We also consider the distribution of Fox News at the finergeographical level of the county. Only 284 counties out of 1,156incorporate both towns with Fox News and towns without (FigureI). In our specification with county fixed effects, the effect of FoxNews is estimated on the 3,890 towns in these counties. Townswith Fox News (column (6) of Table II) and without Fox News(column (7)) in this subsample are close geographical neighborsand, therefore, more closely matched on observables.
III. EMPIRICAL RESULTS
III.A. Selection
In this paper, we compare towns with Fox News in theirprogramming in the year 2000 to towns without Fox News. Sincethe assignment of towns into these two groups is not random, weinvestigate the nature of the selection and estimate which town-level variables predict the availability of Fox News in 2000. Inparticular, we focus on political variables. Fox News may wellhave expanded first in Republican areas since demand for itsservices is likely to be higher in these areas. If Republican areaswere becoming more Republican between 1996 and 2000, theestimated Fox News effect may just be capturing political trends.
The Fox News variable, dk,2000FOX , equals one if all cable sys-
tems in town k in year 2000 include Fox News in either the Basicpackage or one of the Expanded Basic packages, and zero if nocable system includes Fox News. We estimate a linear probabilitymodel9:
(1) dk,2000FOX � � � �vk,1996
R,Pres � �Ttk,1996Pres� � �2000 Xk,2000
� �00–90 Xk,00–90 � �CCk,2000 � εk.
The pre-Fox News political variables from the 1996 presidentialelections are the two-party Republican vote share, vk,1996
R,Pres , andthe voter turnout measured by log of votes cast as share ofpopulation, tk,1996
Pres� . The demographic variables are Xk,2000, the
9. The results are similar with logit and conditional logit specifications.
1201THE FOX NEWS EFFECT: MEDIA BIAS AND VOTING

FIG
UR
EI
Fox
New
sA
vail
abil
ity
byC
oun
ty,
2000
Not
e:P
ropo
rtio
nfo
rea
chco
un
tyis
calc
ula
ted
asth
era
tio
ofn
um
ber
ofto
wn
sw
ith
Fox
New
sav
aila
ble
via
cabl
eto
tota
ln
um
ber
ofto
wn
sin
the
cou
nty
.A
lask
aan
dH
awai
iar
eal
soin
the
data
set
but
are
not
incl
ude
don
the
map
due
tosp
ace
con
stra
ints
.
1202 QUARTERLY JOURNAL OF ECONOMICS

set of controls from the 2000 Census, and Xk,2000–1990, the set ofchanges in controls between the 1990 Census and the 2000 Cen-sus (see Table II). Finally, the controls for features of the cablesystem are Ck,2000, deciles in the number of channels providedand in the number of potential subscribers. To ensure that theresults are representative of the average voter, and since theprecision of the vote share variable vk,1996
R,Pres is increasing in thenumber of votes cast, we weight the observations by votes cast in1996.10 The standard errors are clustered at the level of the 2,992local cable companies.
We first estimate (1) without controls (column (1) of TableIII). Unconditionally, Fox News availability is significantly posi-tively correlated with town turnout, but not with Republican voteshare. As we add demographic controls (column (2)), the latterresult changes. Fox News availability in 2000 is substantiallyhigher in more Republican towns: a 10 percentage point increasein Republican vote share is associated with a 6.36 percentagepoint increase in the likelihood of Fox News availability. SinceFox News is more likely to enter into urban towns, and thesetowns are less likely to be Republican, adding demographicsvariables in column (2) raises the coefficient on Republican voteshare. Next, we add the controls Ck,2000 for cable system features(column (3)), raising the R2 to 0.4093; larger cable systems are muchmore likely to offer Fox News. Controlling for cable system featureslowers the coefficient � on the Republican vote share by half.
In column (4), we add congressional district fixed effects.With these additional geographic controls, specification (1) cap-tures the determinants of within-district Fox News availability,conditional on demographic and cable controls. (The coefficientson the controls are reported in Appendix II). In this specification,there is no evidence that towns with higher Republican voteshare are more likely to offer Fox News; in fact, the estimated � ��.0343 is negative, albeit insignificant. Similarly, the turnoutcoefficient is small and insignificant. Given the precision of theestimates, we can reject substantial effects of pre-existing politi-cal composition on the availability of Fox News, conditional on thecontrol variables. Moreover, we cannot reject the joint test thatthe twenty-four demographic controls are zero (F-test � 1.11).Once we control for geographic heterogeneity and size of the cable
10. The results are similar if we weight by votes cast in 2000 or bypopulation.
1203THE FOX NEWS EFFECT: MEDIA BIAS AND VOTING

TA
BL
EII
ID
ET
ER
MIN
AN
TS
OF
FO
XN
EW
SA
VA
ILA
BIL
ITY,
LIN
EA
RP
RO
BA
BIL
ITY
MO
DE
L
Dep
.va
r.
Ava
ilab
ilit
yof
Fox
New
svi
aca
ble
in20
00
(1)
(2)
(3)
(4)
(5)
(6)
(7)
Pre
s.re
publ
ican
vote
shar
ein
1996
0.14
360.
6363
0.39
02�
0.03
43�
0.04
420.
0902
0.06
27(0
.154
9)(0
.210
1)**
*(0
.156
6)**
(0.0
937)
(0.1
024)
(0.1
321)
(0.1
333)
Pre
s.lo
gtu
rnou
tin
1996
0.11
010.
0909
0.06
560.
0139
�0.
0053
0.02
860.
0257
(0.0
557)
**(0
.034
8)**
*(0
.027
8)**
(0.0
124)
(0.0
173)
(0.0
234)
(0.0
258)
Pre
s.R
ep.
vote
shar
ech
ange
1998
–199
20.
214
�0.
2548
(0.2
481)
(0.2
345)
Con
trol
vari
able
sC
ensu
sco
ntr
ols:
1990
and
2000
—X
XX
XX
XC
able
syst
emco
ntr
ols
——
XX
XX
XU
.S.
Hou
sedi
stri
ctfi
xed
effe
cts
——
—X
—X
—
Cou
nty
fixe
def
fect
s—
——
—X
—X
F-t
est:
Cen
sus
con
trol
s�
0F
�3.
54**
*F
�2.
73**
*F
�1.
11F
�1.
28F
�1.
57**
F�
1.31
F-t
est:
Cab
leco
ntr
ols
�0
F�
18.0
8***
F�
21.0
9***
F�
18.6
1***
F�
8.19
***
F�
8.75
***
R2
0.02
810.
0902
0.40
930.
6698
0.76
830.
6313
0.76
22N
N�
9,25
6N
�9,
256
N�
9,25
6N
�9,
256
N�
9,25
6N
�3,
722
N�
3,72
2
Not
es:A
nob
serv
atio
nin
the
lin
ear
prob
abil
ity
mod
elis
ato
wn
inon
eof
the
twen
ty-e
igh
tU
.S.s
tate
sin
the
sam
ple.
Th
ede
pen
den
tva
riab
leis
abi
nar
yva
riab
leth
ateq
ual
son
eif
Fox
New
sw
aspa
rtof
the
tow
n’s
loca
lcab
lepa
ckag
ein
2000
.Th
elo
gtu
rnou
tm
easu
reis
the
log
ofth
era
tio
ofto
talv
otes
cast
in19
96to
voti
ng-
age
popu
lati
onin
the
tow
nin
1996
.T
he
popu
lati
onda
tafo
r19
96is
inte
rpol
ated
from
the
1990
and
2000
Cen
sus.
Th
ece
nsu
sco
ntr
ols
are
twel
vede
mog
raph
icva
riab
les
from
the
Cen
sus,
pres
ent
both
inth
e20
00va
lues
and
indi
ffer
ence
sbe
twee
n20
00an
d19
90.T
he
Cab
leS
yste
mC
ontr
ols
are
deci
les
inth
en
um
ber
ofch
ann
els
prov
ided
and
inth
en
um
ber
ofpo
ten
tial
subs
crib
ers.
All
con
trol
sar
eli
sted
inA
ppen
dix
II.T
he
F-t
est
isa
join
tte
stof
the
hyp
oth
esis
that
the
Cen
sus
con
trol
sfr
om19
90an
d20
00(r
espe
ctiv
ely,
the
cabl
eco
ntr
ols)
are
join
tly
equ
alto
zero
.Rob
ust
stan
dard
erro
rscl
ust
ered
bylo
cal
cabl
eco
mpa
ny
inpa
ren
thes
es.
Th
eob
serv
atio
ns
are
wei
ghte
dby
tota
lvo
tes
cast
in19
96pr
esid
enti
alel
ecti
on.
*si
gnifi
can
tat
10pe
rcen
t;**
sign
ifica
nt
at5
perc
ent;
***
sign
ifica
nt
at1
perc
ent.
1204 QUARTERLY JOURNAL OF ECONOMICS

system, availability of Fox News in 2000 is therefore uncorrelatedwith both political outcomes and demographics. We obtain similarresults when we introduce county fixed effects instead of congres-sional district fixed effects (column (5)). Our interpretation ofthese results is that, while overall the availability of Fox News ishighly selective—Fox News enters into larger markets and, giventown size, into more Republican areas—conditional on cable mar-ket size, the assignment to towns within an area (county orcongressional district) is essentially random.
In columns (6) and (7), we test whether voting trends be-tween 1988 and 1992 predict the availability of Fox News. Sincetown-level data for 1992 is hard to find, this reduces the sampleto 3,722 towns. The vote share change in presidential electionsbetween 1988 and 1992 is not significant and switches sign be-tween the two specifications.
Overall, Fox News in 2000 selected primarily into cable sys-tem with a large number of channels, as well as into specificcounties and districts. Within counties and districts, however,once we control for features of the cable system, the availability ofFox News in 2000 appears largely idiosyncratic: the towns whichgot Fox News between 1996 and 2000 are no different in thedemographics, the political orientation, or the prior politicaltrends than the towns that did not get Fox News before 2000. Weexploit this conditional random assignment to study the impact ofFox News on voting.
III.B. Presidential Elections
We compare towns where Fox News entered the cable marketby the year 2000 (dk,2000
FOX � 1) with towns where Fox News wasnot available by the year 2000 (dk,2000
FOX � 0). We consider theimpact of the entry of Fox News on the change in the Republicanvote share between 1996 and 2000. This strategy exploits thetiming of the entry of Fox News. By the November 1996 electionsFox News had been launched in only a few markets and, even inthose markets, just one month before the elections. By the No-vember 2000 elections, Fox News had an audience that wassmaller, but nonetheless comparable to that of CNN. Our base-line specification is
(2) vk,2000R,Pres � vk,1996
R,Pres � � � �F dk,2000FOX � �2000 Xk,2000
� �00–90 Xk,00–90 � �CCk,2000 � εk.
1205THE FOX NEWS EFFECT: MEDIA BIAS AND VOTING
As in Table III, we control for town-level demographics in levels(Xk,2000) and changes (Xk,00–90) and for cable variables (Ck,2000).The observation are weighted by the votes cast in 1996, and thestandard errors are clustered at the level of the local cablecompany.
We first implement a simple difference-in-difference estima-tor and estimate (2) without controls (�2000 � �00–90 � 0 and �C �0) (column (1) in Table IV). On average, in our sample the voteshare for Republicans increased by 3.47 percentage points (� �0.0347) between the 1996 and the 2000 elections. Compared tothis overall increase, towns with Fox News became (insignifi-cantly) less Republican by two-tenths of a percentage point (�F ��.0025) relative to towns without Fox News. The standard error(0.0037), however, is sufficiently large that we cannot rule outthat the entry of Fox News increased the Republican vote shareby half a percentage point. In column (2), we add demographiccontrols, raising the R2 of the regression from 0.0007 to 0.5207.The estimate for �F, �F � 0.0027, becomes positive but is stillinsignificant. In column (3), we add controls for cable size Ck,2000,rendering the Fox News coefficient positive and significant (�F �0.008). Introducing control variables increases the point esti-mate of �F, suggesting that the unobservables bias the estimateof the Fox News effect downward.
In the two benchmark specifications we include district fixedeffects (column (4)) and county fixed effects (column (5)) in addi-tion to the full set of controls. (The coefficients on the controls forthe specification in column (4) are reported in Appendix II.) Thesespecifications control for unobserved trends in voting that arecommon to a geographic area, and that may be correlated withFox News availability. The identification of �F depends on thecomparison of neighboring towns with and without Fox News.The key advantage of specifications with cable, demographic, andgeographic controls is that, conditional on these variables, theavailability of Fox News is uncorrelated with political variables(Table III). The estimate of the effect of Fox News is positive andsignificant in both cases, 0.0042 and 0.0069, respectively. Thesepoint estimates are substantially more precise than in column (1).In the specifications that best control for heterogeneity, availabil-ity of Fox News increases the Republican vote share by four- toseven-tenths of a percentage point, a sizeable and precisely esti-mated effect.
In columns (6) and (7), we replicate the benchmark results
1206 QUARTERLY JOURNAL OF ECONOMICS

TA
BL
EIV
TH
EE
FF
EC
TO
FF
OX
NE
WS
ON
TH
E20
00–1
996
PR
ES
IDE
NT
IAL
VO
TE
SH
AR
EC
HA
NG
E
Dep
.va
r.
Rep
ubl
ican
two-
part
yvo
tesh
are
chan
gebe
twee
n20
00an
d19
96pr
es.
elec
tion
s
(1)
(2)
(3)
(4)
(5)
(6)
(7)
Ava
ilab
ilit
yof
Fox
New
svi
aca
ble
in20
00�
0.00
250.
0027
0.00
80.
0042
0.00
690.
0037
0.00
48(0
.003
7)(0
.002
4)(0
.002
6)**
*(0
.001
5)**
*(0
.001
4)**
*(0
.002
1)*
(0.0
019)
**P
res.
Rep
.vo
tesh
are
chan
ge19
88–1
992
0.02
290.
0514
(0.0
216)
(0.0
219)
**C
onst
ant
0.03
47�
0.02
8�
0.02
550.
0116
0.02
53�
0.03
770.
0081
(0.0
017)
***
(0.0
245)
(0.0
236)
(0.0
154)
(0.0
185)
(0.0
258)
(0.0
313)
Con
trol
vari
able
sC
ensu
sco
ntr
ols:
1990
and
2000
—X
XX
XX
XC
able
syst
emco
ntr
ols
——
XX
XX
XU
.S.
Hou
sedi
stri
ctfi
xed
effe
cts
——
—X
—X
—
Cou
nty
fixe
def
fect
s—
——
—X
—X
R2
0.00
070.
5207
0.55
730.
7533
0.81
190.
7528
0.82
44N
N�
9,25
6N
�9,
256
N�
9,25
6N
�9,
256
N�
9,25
6N
�3,
722
N�
3,72
2
Not
es:A
nob
serv
atio
nin
the
OL
Sre
gres
sion
isa
tow
nin
one
ofth
etw
enty
-eig
ht
U.S
.sta
tes
inth
esa
mpl
e.T
he
depe
nde
nt
vari
able
isth
etw
o-pa
rty
Rep
ubl
ican
vote
shar
efo
rth
e20
00pr
esid
enti
alel
ecti
onm
inu
sth
etw
o-pa
rty
repu
blic
anvo
tesh
are
for
the
1996
pres
iden
tial
elec
tion
.T
he
vari
able
“Ava
ilab
ilit
yof
Fox
New
svi
aca
ble
in20
00”
isa
bin
ary
vari
able
that
equ
als
one
ifF
oxN
ews
was
part
ofth
eto
wn
’slo
calc
able
pack
age
in20
00.T
he
cen
sus
con
trol
sar
etw
elve
dem
ogra
phic
vari
able
sfr
omth
eC
ensu
s,pr
esen
tbo
thin
the
2000
valu
esan
din
diff
eren
ces
betw
een
2000
and
1990
.T
he
cabl
esy
stem
con
trol
sar
ede
cile
sin
the
nu
mbe
rof
chan
nel
spr
ovid
edan
din
the
nu
mbe
rof
pote
nti
alsu
bscr
iber
s.A
llco
ntr
ols
are
list
edin
App
endi
xII
.Rob
ust
stan
dard
erro
rscl
ust
ered
bylo
calc
able
com
pan
yin
pare
nth
eses
.Th
eob
serv
atio
ns
are
wei
ghte
dby
tota
lvot
esca
stin
the
1996
pres
iden
tial
elec
tion
.*
Sig
nifi
can
tat
10pe
rcen
t;**
sign
ifica
nt
at5
perc
ent;
***
sign
ifica
nt
at1
perc
ent.
1207THE FOX NEWS EFFECT: MEDIA BIAS AND VOTING

after adding the change in the Republican vote share between1988 and 1992 as an additional control. Over this substantiallysmaller sample (3,722 observations), the effect of Fox News avail-ability is less precisely estimated and somewhat smaller but stillsignificant in the specification with county fixed effects.11 Sinceprevious voting trends are not substantial predictors of currentvoting trends, and since including them would lower the samplesize substantially, we omit them in the remaining regressions.
Robustness. In Table V, we examine the robustness of theresults to alternative ways of coding the dependent variable (thevote share), alternative ways of coding the independent variable(the Fox News indicator), and alternative samples and estimationmethods. A more extensive set of robustness checks is inDellaVigna and Kaplan [2006]. Here and in most of the nexttables we present the results for the specifications with U. S.House District fixed effects; the results are similar for the speci-fications with County fixed effects.
First, the results are robust to controlling for the vote sharein 1996 instead of using the vote share change between 2000 and1996 (column (1)). The results are also robust to using the all-party vote share (column (2)), an alternative measure that con-trols for third-party effects.
Second, we also consider an alternative specification of expo-sure to Fox News, the ratio of the number of Fox News subscrib-ers to population covered. The results (not shown) are similar to,though less precise than, our main specification, which uses asimple dummy variable.
Third, we present results using alternative samples and es-timation methods. In column (3) we show that restricting thesample to the states with a high proportion of correctly matchedelection data12 yields, if anything, a higher effect of Fox Newsentry. We also show (column (4)) that the largest cities are notdriving the estimates: the results are similar to the benchmarkresults when we run an unweighted regression on medium- andlarge-sized towns (that is, towns with average turnout in 2000 of
11. The lower point estimates depend on the difference in the sample ratherthan on the addition of the voting trend controls; we obtain the same result on thissample when we do not control for trends.
12. We exclude states in which the election data in the final sample cover lessthan 50 percent of the total votes cast in the state in either 1996 or 2000. Thiseliminates all states in which the town names are obtained from the precinctnames, possibly generating erroneous matches with the cable data.
1208 QUARTERLY JOURNAL OF ECONOMICS

TA
BL
EV
TH
EF
OX
NE
WS
EF
FE
CT:
RO
BU
ST
NE
SS
AN
DP
ER
SIS
TE
NC
E
Dep
.va
r.
Rob
ust
nes
s
Per
sist
ence
Pre
s.R
ep.
vote
shar
e20
04–2
000
Pre
s.R
ep.
vote
shar
ech
ange
2000
–199
6
Rep
.tw
o-pa
rty
vote
shar
ein
2000
All
-par
tyvo
tesh
are
Tw
o-pa
rty
vote
shar
e
(1)
(2)
(3)
(4)
(5)
(6)
Ava
ilab
ilit
yof
Fox
New
svi
aca
ble
in20
000.
0041
0.00
40.
0048
0.00
410.
0047
0.00
21(0
.001
6)**
*(0
.001
6)**
(0.0
016)
***
(0.0
017)
***
(0.0
016)
***
(0.0
020)
Rep
ubl
ican
vote
shar
ein
1996
0.93
62(0
.007
9)**
*C
ontr
olva
riab
les
Cen
sus
con
trol
s:19
90an
d20
00X
XX
XX
XC
able
syst
emco
ntr
ols
XX
XX
XX
U.S
.H
ouse
dist
rict
fixe
def
fect
sX
XX
XX
XE
lect
ion
data
wit
hh
igh
cove
rage
——
X—
——
Un
wei
ghte
d,tu
rnou
t�
2000
——
—X
——
Nea
rest
-nei
ghbo
rm
atch
ing,
un
wei
ghte
d—
——
—X
—R
20.
9824
0.82
70.
7556
0.73
69—
0.62
81N
N�
9,25
6N
�9,
256
N�
7,75
8N
�3,
241
N�
9,25
6N
�8,
605
Not
es:A
nob
serv
atio
nin
the
OL
Sre
gres
sion
isa
tow
nin
one
ofth
etw
enty
-eig
htU
.S.s
tate
sin
the
sam
ple.
Inco
lum
n(1
),th
ede
pend
entv
aria
ble
isth
etw
o-pa
rty
Rep
ublic
anvo
tesh
are
for
the
2000
pres
iden
tial
elec
tion
.In
colu
mns
(2)–
(5),
the
depe
nden
tva
riab
leis
the
Rep
ublic
anvo
tesh
are
for
the
2000
pres
iden
tial
elec
tion
min
usth
esa
me
vari
able
sfo
rth
e19
96el
ecti
ons.
Inco
lum
n(2
),th
eR
epub
lican
vote
shar
eis
com
pute
dus
ing
the
all-
part
yvo
tesh
are.
Inco
lum
ns(3
)thr
ough
(5)t
hevo
tesh
are
refe
rsto
the
two-
part
yvo
tesh
are.
Inco
lum
n(6
),th
ede
pend
ent
vari
able
isth
etw
o-pa
rty
Rep
ublic
anvo
tesh
are
for
the
2004
pres
iden
tial
elec
tion
min
usth
esa
me
vari
able
sfo
rth
e20
00el
ecti
ons.
The
vari
able
“Ava
ilabi
lity
ofF
oxN
ews
via
cabl
ein
2000
”is
abi
nary
vari
able
that
equa
lson
eif
Fox
New
sw
aspa
rtof
the
tow
n’s
loca
lcab
lepa
ckag
ein
2000
.The
Cen
sus
cont
rols
are
twel
vede
mog
raph
icva
riab
les
from
the
Cen
sus,
pres
ent
both
inth
e20
00va
lues
and
indi
ffer
ence
sbe
twee
n20
00an
d19
90.T
heca
ble
syst
emco
ntro
lsar
ede
cile
sin
the
num
ber
ofch
anne
lspr
ovid
edan
din
the
num
ber
ofpo
tent
ials
ubsc
ribe
rs.A
llco
ntro
lsar
elis
ted
inA
ppen
dix
II.
Th
esa
mpl
e“E
lect
ion
data
wit
hh
igh
cove
rage
”ex
clu
des
stat
esin
wh
ich
the
elec
tion
data
inth
efi
nal
sam
ple
cove
rsle
ssth
an50
perc
ent
ofth
eto
tal
vote
sca
stin
the
stat
ein
eith
er19
96or
2000
.Th
esa
mpl
e“U
nw
eigh
ted,
turn
out
�2,
000”
excl
ude
sto
wn
sw
ith
turn
out
low
erth
an2,
000
peop
lein
the
year
2000
.Th
esp
ecifi
cati
onin
colu
mn
(5)i
sth
ees
tim
ate
ofth
eav
erag
etr
eatm
ent
onth
etr
eate
dfo
rn
eare
st-n
eigh
bor
mat
chin
ges
tim
ator
,bas
edon
mat
chin
gon
the
list
edco
ntr
ols;
the
esti
mat
eav
erag
esth
etr
eatm
ent
for
the
clos
est
fou
rm
atch
esan
dis
bias
-cor
rect
ed(A
badi
eet
al.,
2001
).R
obu
stst
anda
rder
rors
clu
ster
edby
loca
lca
ble
com
pan
yin
pare
nth
eses
(exc
ept
inco
lum
n(5
)).T
he
obse
rvat
ion
sar
ew
eigh
ted
tota
lvo
tes
cast
inth
e19
96pr
esid
enti
alel
ecti
onex
cept
inco
lum
ns
(4)
and
(5).
*si
gnifi
can
tat
10pe
rcen
t;**
sign
ifica
nt
at5
perc
ent;
***
sign
ifica
nt
at1
perc
ent.
1209THE FOX NEWS EFFECT: MEDIA BIAS AND VOTING
at least 2,000 votes). In Section III.C, we show that the estimatedeffects are instead smaller in small, mostly rural towns.
To check the robustness of our OLS results, we present theresults of a simple matching procedure, nearest-neighbor match-ing [Abadie et al. 2001]. Each town with Fox News (treatmenttown) is matched to the four non-Fox News towns (control towns)with the closest values of the controls. The match is based oncable and Census controls and on District indicator variables(column (5)). The (unweighted) average treatment effect of FoxNews (0.0047) is significant and similar to our benchmark find-ings. Finally, the results are also robust to adopting the optimaltrimming approach of Crump et al. [2005], which focuses theanalysis on an optimal subsample in which treatment and controlobservations are more comparable (not shown).
Persistence of Effects. We also find that the introduction ofFox News in 2000 is associated with an (insignificant) 0.2 per-centage point vote share increase between 2000 and 2004. Theeffect of Fox News therefore appears to be persistent, if notincreasing over time. Persistence is consistent with the predic-tions of a model of nonrational persuasion; however, this resultcould also be due to greater audience in Fox News areas over the2000–2004 period.
Comparison with Earlier Results. We now reconcile the find-ings with our earlier findings of a null effect of Fox News, asdiscussed by Krueger [2005]. In an earlier draft, we presentedunweighted regressions, we did not drop a group of observationswith substantial measurement error, and we used a smallersample of twenty-four states. In all three respects, we find thecurrent specification preferable. In Appendix III, we introduce inthree successive steps the earlier specification and show that,while each of the factors mattered, the first two made the mostdifference. The estimates of the Fox News effect are 0.3 percent-age points lower (0.0014 and 0.0040) if we run unweighted re-gressions (columns (1) and (2)). The effect is still significant withcounty fixed effects but not with district fixed effects. The lowerpoint estimates are likely due to smaller treatment effects insmall, more rural towns (see Section III.C) and possibly to highermeasurement error in very small towns. Regressions weighted byturnout better represent the impact of Fox News on the averagevoter.
In columns (3) and (4), in addition to running unweighted
1210 QUARTERLY JOURNAL OF ECONOMICS
regressions, we also include observations that are likely mea-sured with substantial error. We include (as treated) 289 townswhere Fox News is offered in parts but not all of the town, and257 towns with likely voting data problems (see Section II fordetails). Consistent with increased measurement error in the FoxNews variable, the estimates of the Fox News effect are 0.2percentage points lower. Finally, in columns (5) and (6), we ex-clude the data from the states of Hawaii, North Dakota, NewJersey, and Wyoming, which we were unable to collect until afterour initial results. Excluding these states has only a small impacton the estimates. This last specification, which detects no impactof Fox News, is essentially the one that appeared in the earlierdraft.
Magnitudes. Across the different specifications, the entry ofFox News into a cable market by the year 2000 had a significanteffect on the Republican vote share in presidential elections. Theimplied confidence intervals for the benchmark estimates (col-umns (4) and (5) of Table IV) are (0.0012, 0.0072) with districtfixed effects and (0.0041, 0.0097) with county fixed effects. Thefindings, therefore, are consistent with both a small (but positive)effect of Fox News and a fairly large effect, close to 1 percentagepoint.
How large are these effects relative to shifts in vote sharebetween 1996 and 2000? The average weighted change in voteshare between 1996 and 2000 in our sample is 3.47 percentagepoints, with a standard deviation of 4.02. The estimated impact ofFox News is one-tenth of a standard deviation with district fixedeffects, and one-sixth of a standard deviation with county fixedeffects. The impact of Fox News is small but not negligible.
As a second measure, we estimate the number of votes thatFox News is likely to have shifted. We assume a treatment effectof Fox News of 0.55 percentage points, the midpoint of the bench-mark estimates, and a diffusion of Fox News of 34 percent of thepopulation, also for the twenty-two states for which we do nothave data. The estimated impact of Fox News on the Republicanvote share is then 0.34 � (0.0055) � 0.0019, that is, 0.19 percent-age points. Assuming that Fox News did not affect turnout sub-stantially, Fox News shifted approximately 200,000 votes fromthe Democratic candidate to the Republican candidate.
We also predict the number of votes shifted by Fox News inFlorida, the pivotal state in the 2000 U. S. presidential election.
1211THE FOX NEWS EFFECT: MEDIA BIAS AND VOTING

In 2000, Fox News reached 32.8 percent of the Florida population.We assume that the Fox News effect on the 5,963,110 Floridavotes cast is the same as in our sample. Under this assumption,the introduction of Fox News shifted 0.328 � (0.0055) �
5,963,110 � 10,757 votes, a number substantially larger thanBush’s official margin of victory of 537 votes.
Overall, while the entry of Fox News had a relatively smallimpact on the 2000 election, it may still have contributed to theBush victory in the unusually close election. Moreover, this im-pact may become larger over time as the Fox News audience anddiffusion grows.
III.C. Interactions
In Table VI, we examine how the Fox News effect interactswith town characteristics, namely the number of channels, theshare of the population that is urban, and the political orientationof the district. We split congressional districts into thirds by the2000 Republican vote share.
First, we find that the Fox News effect is smaller in townswith more cable channels: an increase of ten cable channels (0.7standard deviations) reduces the effect by 0.19 percentage pointswith district fixed effects (column (1)) and by 0.13 percentagepoints with county fixed effects (column (2)). When the Fox Newsmessage competes with a larger number of channels, its impactappears diminished [Mullainathan and Shleifer 2005]. The lowerFox News impact could reflect exposure to more balanced report-ing (though CNN and the network news are available in all townsin the sample) or merely lower audience rates for Fox News whenmore channels are available.
Second, we find that the impact of Fox News is (marginallysignificantly) larger in urban towns and lower in the Republicandistricts, significantly so with county fixed effects. Both of theseresults may be explained by the fact that in rural towns and inRepublican Districts most people already voted Republican, andtherefore, the share of the population at risk of being convincedwas smaller. In addition, we also find (not reported) that the FoxNews effect is lower in the South, again potentially reflecting asmaller at-risk population.
III.D. Placebos
We exploit the timing of the Fox News entry to constructplacebo treatments. The first placebo treatment (column (3) in
1212 QUARTERLY JOURNAL OF ECONOMICS
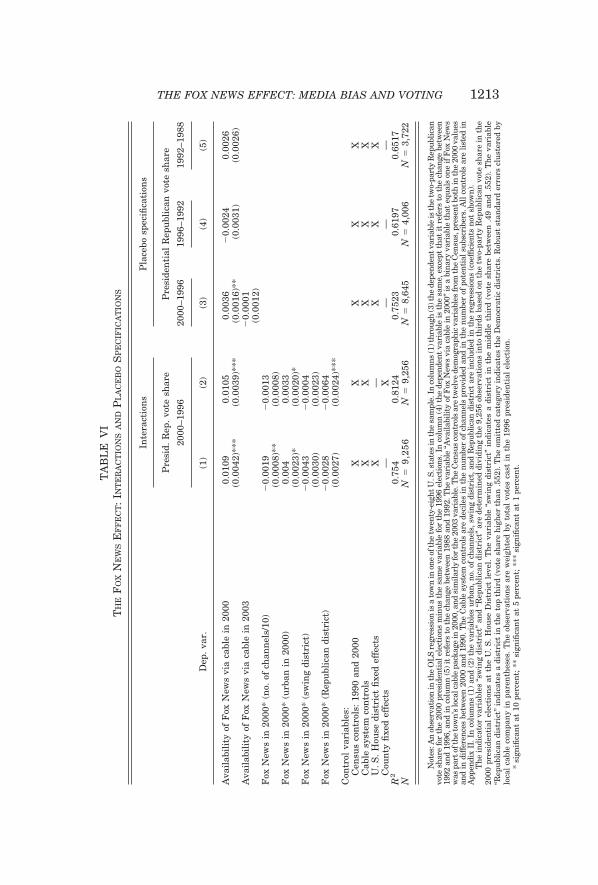
TA
BL
EV
IT
HE
FO
XN
EW
SE
FF
EC
T:
INT
ER
AC
TIO
NS
AN
DP
LA
CE
BO
SP
EC
IFIC
AT
ION
S
Dep
.va
r.
Inte
ract
ion
sP
lace
bosp
ecifi
cati
ons
Pre
sid.
Rep
.vo
tesh
are
Pre
side
nti
alR
epu
blic
anvo
tesh
are
2000
–199
620
00–1
996
1996
–199
219
92–1
988
(1)
(2)
(3)
(4)
(5)
Ava
ilab
ilit
yof
Fox
New
svi
aca
ble
in20
000.
0109
0.01
050.
0036
�0.
0024
0.00
26(0
.004
2)**
*(0
.003
9)**
*(0
.001
6)**
(0.0
031)
(0.0
026)
Ava
ilab
ilit
yof
Fox
New
svi
aca
ble
in20
03�
0.00
01(0
.001
2)F
oxN
ews
in20
00*
(no.
ofch
ann
els/
10)
�0.
0019
�0.
0013
(0.0
008)
**(0
.000
8)F
oxN
ews
in20
00*
(urb
anin
2000
)0.
004
0.00
33(0
.002
3)*
(0.0
020)
*F
oxN
ews
in20
00*
(sw
ing
dist
rict
)�
0.00
43�
0.00
04(0
.003
0)(0
.002
3)F
oxN
ews
in20
00*
(Rep
ubl
ican
dist
rict
)�
0.00
28�
0.00
64(0
.002
7)(0
.002
4)**
*C
ontr
olva
riab
les:
Cen
sus
con
trol
s:19
90an
d20
00X
XX
XX
Cab
lesy
stem
con
trol
sX
XX
XX
U.S
.H
ouse
dist
rict
fixe
def
fect
sX
—X
XX
Cou
nty
fixe
def
fect
s—
X—
——
R2
0.75
40.
8124
0.75
230.
6197
0.65
17N
N�
9,25
6N
�9,
256
N�
8,64
5N
�4,
006
N�
3,72
2
Not
es:A
nob
serv
atio
nin
the
OL
Sre
gres
sion
isa
tow
nin
one
ofth
etw
enty
-eig
htU
.S.s
tate
sin
the
sam
ple.
Inco
lum
ns(1
)thr
ough
(3)t
hede
pend
entv
aria
ble
isth
etw
o-pa
rty
Rep
ublic
anvo
tesh
are
for
the
2000
pres
iden
tial
elec
tion
sm
inus
the
sam
eva
riab
lefo
rth
e19
96el
ecti
ons.
Inco
lum
n(4
)the
depe
nden
tva
riab
leis
the
sam
e,ex
cept
that
itre
fers
toth
ech
ange
betw
een
1992
and
1996
,and
inco
lum
n(5
)it
refe
rsto
the
chan
gebe
twee
n19
88an
d19
92.T
heva
riab
le“A
vaila
bilit
yof
Fox
New
svi
aca
ble
in20
00”
isa
bina
ryva
riab
leth
ateq
uals
one
ifF
oxN
ews
was
part
ofth
eto
wn’
slo
calc
able
pack
age
in20
00,a
ndsi
mila
rly
for
the
2003
vari
able
.The
Cen
sus
cont
rols
are
twel
vede
mog
raph
icva
riab
les
from
the
Cen
sus,
pres
entb
oth
inth
e20
00va
lues
and
indi
ffer
ence
sbe
twee
n20
00an
d19
90.T
heC
able
syst
emco
ntro
lsar
ede
cile
sin
the
num
ber
ofch
anne
lspr
ovid
edan
din
the
num
ber
ofpo
tent
ials
ubsc
ribe
rs.A
llco
ntro
lsar
elis
ted
inA
ppen
dix
II.I
nco
lum
ns(1
)an
d(2
)th
eva
riab
les
urba
n,no
.of
chan
nels
,sw
ing
dist
rict
,and
Rep
ublic
andi
stri
ctar
ein
clud
edin
the
regr
essi
ons
(coe
ffici
ents
not
show
n).
Th
ein
dica
tor
vari
able
s“s
win
gdi
stri
ct”
and
“Rep
ubl
ican
dist
rict
”ar
ede
term
ined
divi
din
gth
e9,
256
obse
rvat
ion
sin
toth
irds
base
don
the
two-
part
yR
epu
blic
anvo
tesh
are
inth
e20
00pr
esid
enti
alel
ecti
ons
atth
eU
.S.
Hou
seD
istr
ict
leve
l.T
he
vari
able
“sw
ing
dist
rict
”in
dica
tes
adi
stri
ctin
the
mid
dle
thir
d(v
ote
shar
ebe
twee
n.4
9an
d.5
52).
Th
eva
riab
le“R
epu
blic
andi
stri
ct”
indi
cate
sa
dist
rict
inth
eto
pth
ird
(vot
esh
are
hig
her
than
.552
).T
he
omit
ted
cate
gory
indi
cate
sth
eD
emoc
rati
cdi
stri
cts.
Rob
ust
stan
dard
erro
rscl
ust
ered
bylo
cal
cabl
eco
mpa
ny
inpa
ren
thes
es.
Th
eob
serv
atio
ns
are
wei
ghte
dby
tota
lvo
tes
cast
inth
e19
96pr
esid
enti
alel
ecti
on.
*si
gnifi
can
tat
10pe
rcen
t;**
sign
ifica
nt
at5
perc
ent;
***
sign
ifica
nt
at1
perc
ent.
1213THE FOX NEWS EFFECT: MEDIA BIAS AND VOTING
Table VI) uses data on Fox News diffusion in 2003. In 2003, FoxNews was available in 4,844 out of 8,645 towns.13 The introduc-tion of Fox News after the year 2000 should not affect the changein vote share between 1996 and 2000. Indeed, controlling for FoxNews availability in 2000, Fox News availability in 2003 has noeffect on voting.
In a second set of placebo treatments, we estimate whetherthe introduction of Fox News in 2000 predicts the vote sharechange between 1992 and 1996 (column (4)) or between 1988 and1992 (column (5)). Obviously, Fox News introduction in 2000should not affect voting between years in which Fox News did notexist. We find no evidence of a significant correlation in eithertime period. Voting trends are unlikely to be responsible for theFox News effect.
III.E. Voter Turnout
The significant impact of Fox News on the Republican voteshare could occur for two reasons. First, Fox News entry con-vinced Democratic voters to vote Republican. Second, Fox Newsattracted new Republican voters. We use measures of turnout totest these hypotheses.
The baseline regression for voter turnout is
(3) tk,2000Pres � tk,1996
Pres � � � �Fdk,2000FOX � �ln Popk,2000�
� ln Popk,1996�� � �2000Xk,2000 � �00–90 Xk,00–90 � �CCk,2000 � εk,
where tk,tPres is the log total votes in town k in year t: tk,t
Pres �ln (Vk,t
TOT,Pres). The change in this measure over time is the per-cent change in total votes cast. This specification controls for thepercentage change in the voting-age town population over time,ln (Popk,2000) � ln (Popk,1996) since increases in populationwould naturally increase the number of votes cast.
Columns (1)–(3) in Table VII show the results. The averagechange in log votes is 0.0869, implying an 8.69 percent higherturnout in the much tighter presidential race of 2000. The esti-mate for �F is positive but insignificant with district fixed effectsand is large and significant with county fixed effects. This secondestimate (�F � 0.0178) suggests that Fox News increased turn-out by 1.78 percent, a large effect. In both specifications, the
13. We exclude 281 towns which offer Fox News in 2003 in one, but not all,of the cable systems in the town. The data are updated up to the end of 2003.
1214 QUARTERLY JOURNAL OF ECONOMICS

TA
BL
EV
IIF
OX
NE
WS
AN
DO
TH
ER
PO
LIT
ICA
LO
UT
CO
ME
S:
TU
RN
OU
TA
ND
SE
NA
TO
RIA
LE
LE
CT
ION
S
Dep
.va
r.
Tu
rnou
t(p
resi
den
tial
elec
tion
s)S
enat
oria
lel
ecti
ons
Ch
ange
inlo
g(t
otal
vote
sca
st)
betw
een
2000
and
1996
pres
.el
ecti
ons
Rep
ubl
ican
vote
shar
ein
2000
sen
ator
ial
elec
tion
s
(1)
(2)
(3)
(4)
(5)
(6)
Ava
ilab
ilit
yof
Fox
New
svi
aca
ble
in20
000.
0046
0.01
780.
0147
0.00
720.
0071
0.01
(0.0
039)
(0.0
051)
***
(0.0
061)
**(0
.002
6)**
*(0
.002
8)**
(0.0
035)
***
Ch
ange
inlo
g(v
otin
g-ag
epo
pula
tion
)bw
.19
96an
d20
000.
3655
0.37
070.
3641
(0.0
427)
***
(0.0
440)
***
(0.0
425)
***
Fox
New
sin
2000
*(N
ewY
ork
race
)0.
0039
�0.
0017
0.00
33(0
.006
7)(0
.006
0)(0
.006
7)R
epu
blic
anvo
tesh
are
in19
96pr
esid
enti
alel
ecti
ons
0.82
950.
8432
0.82
89(0
.011
1)**
*(0
.014
6)**
*(0
.111
1)**
*F
oxN
ews
in20
00*
(sw
ing
dist
rict
)�
0.02
07�
0.00
42(0
.008
7)*
(0.0
047)
Fox
New
sin
2000
*(R
epu
blic
andi
stri
ct)
�0.
0177
�0.
0075
(0.0
090)
**(0
.005
4)C
ontr
olva
riab
les
Cen
sus
con
trol
s:19
90an
d20
00X
XX
XX
XC
able
syst
emco
ntr
ols
XX
XX
XX
U.S
.H
ouse
dist
rict
fixe
def
fect
sX
—X
X—
XC
oun
tyfi
xed
effe
cts
—X
——
X—
R2
0.61
510.
6863
0.65
80.
9768
0.98
290.
9768
NN
�9,
256
N�
9,25
6N
�9,
256
N�
8,19
2N
�8,
192
N�
8,19
2
Not
es:A
nob
serv
atio
nin
the
OL
Sre
gres
sion
isa
tow
nin
one
ofth
etw
enty
-eig
htU
.S.s
tate
sin
the
sam
ple.
Inco
lum
ns(1
)thr
ough
(3),
the
depe
nden
tva
riab
leis
the
log
ofto
talv
otes
cast
inth
e20
00pr
esid
enti
alel
ecti
ons
min
usth
esa
me
vari
able
for
the
1996
elec
tion
san
dth
ech
ange
inth
elo
gof
the
popu
lati
onov
er18
betw
een
1996
and
2000
isa
cont
rolv
aria
ble.
The
popu
lati
onda
tafo
r19
96is
inte
rpol
ated
from
the
1990
and
2000
Cen
sus.
Inco
lum
ns(4
)thr
ough
(6),
the
depe
nden
tva
riab
leis
the
two-
part
yR
epub
lican
vote
shar
efo
rth
e20
00Se
nate
elec
tion
,and
the
vote
shar
ein
the
pres
iden
tial
elec
tion
sin
1996
inth
esa
me
tow
nis
aco
ntro
lvar
iabl
e.T
heva
riab
le“A
vaila
bilit
yof
Fox
New
svi
aca
ble
in20
00”i
sa
bina
ryva
riab
leth
ateq
uals
one
ifF
oxN
ews
was
part
ofth
eto
wn’
slo
calc
able
pack
age
in20
00.T
heC
ensu
sco
ntro
lsar
etw
elve
dem
ogra
phic
vari
able
sfr
omth
eC
ensu
s,pr
esen
tbo
thin
the
2000
valu
esan
din
diffe
renc
esbe
twee
n20
00an
d19
90.T
heC
able
syst
emco
ntro
lsar
ede
cile
sin
the
num
ber
ofch
anne
lspr
ovid
edan
din
the
num
ber
ofpo
tent
ials
ubsc
ribe
rs.A
llco
ntro
lsar
elis
ted
inA
ppen
dix
II.
Th
ein
dica
tor
vari
able
s“s
win
gdi
stri
ct”
and
“Rep
ubl
ican
dist
rict
”ar
ede
term
ined
divi
din
gth
e9,
256
obse
rvat
ion
sin
toth
irds
base
don
the
two-
part
yR
epu
blic
anvo
tesh
are
inth
e20
00pr
esid
enti
alel
ecti
ons
atth
eU
.S.
Hou
seD
istr
ict
leve
l.T
he
vari
able
“sw
ing
dist
rict
”in
dica
tes
adi
stri
ctin
the
mid
dle
thir
d(v
ote
shar
ebe
twee
n.4
9an
d.5
52).
Th
eva
riab
le“R
epu
blic
andi
stri
ct”
indi
cate
sa
dist
rict
inth
eto
pth
ird
(vot
esh
are
hig
her
than
.552
).T
he
omit
ted
cate
gory
indi
cate
sth
eD
emoc
rati
cdi
stri
cts.
Fox
New
sin
2000
*(N
ewY
ork
race
)is
the
inte
ract
ion
ofth
eva
riab
le“A
vail
abil
ity
ofF
oxN
ews
via
cabl
ein
2000
”an
dan
indi
cato
rfo
rN
ewY
ork’
sse
nat
oria
lra
cebe
twee
nH
illa
ryC
lin
ton
and
Ric
kL
azio
,th
eon
lyse
nat
oria
lrac
ein
2000
hig
hly
cove
red
inth
eF
oxN
ews
prog
ram
min
g.R
obu
stst
anda
rder
rors
clu
ster
edby
loca
lcab
leco
mpa
ny
inpa
ren
thes
es.T
he
obse
rvat
ion
sar
ew
eigh
ted
byto
tal
vote
sca
stin
the
1996
pres
iden
tial
elec
tion
.*
sign
ifica
nt
at10
perc
ent;
**si
gnifi
can
tat
5pe
rcen
t;**
*si
gnifi
can
tat
1pe
rcen
t.
1215THE FOX NEWS EFFECT: MEDIA BIAS AND VOTING
elasticity � of the change in votes cast with respect to the changein population is 0.37. The turnout effect is concentrated in themore Democratic districts (column (3)). Together with the findingthat the impact of Fox News on vote share is larger in the moreDemocratic areas, this suggests that the main effect of Fox Newswas to induce nonvoters in Democratic districts to turn out andvote Republican.
Overall, Fox News entry into a market appears to havemobilized new voters, especially in Democratic districts. How-ever, the evidence is not as consistent as for the effect on voteshare.
III.F. Senate Elections
The previous findings suggest that Fox News had a signifi-cant effect on the Republican vote share and on turnout in thepresidential election. In this section, we consider whether theeffect of Fox News extends to local politics not covered by FoxNews. This allows us to test whether the Fox News effect iscandidate-specific or a general ideological shift.
Senate elections are a good test in this respect because alarge majority of Senate races fail to get national coverage. Theseelections are similar to local elections for which, unfortunately, notown-level data set is available. At the same time, one or twoSenate races per year attract substantial national coverage, al-most like presidential races. This allows us to compare the effectof Fox News on races that were not covered, where only ideolog-ical shifts should matter, to the effect on covered races, wherecandidate-specific coverage also could matter. In 2000, the Senaterace that got the most coverage in Fox News by a wide marginwas the Hillary Clinton–Rick Lazio race in New York State.These two candidates had ninety-nine mentions in the O’ReillyFactor and the Hannity & Colmes show in the two months priorto the 2000 elections, with most mentions critical of Hillary Clin-ton.14 All the other Senate candidates running in the 2000 cam-paign combined got a total of seventy-three mentions, with JoeLieberman, who was typically mentioned because of his vice-presidential race, getting the lion’s share of these mentions.
We examine whether Fox News impacted the vote share in
14. From the O’Reilly Factor of October 31, 2000: “Mr. Gore does have somehonesty issues about campaign finance, but they pale beside the deceit factory theClintons have set up.”
1216 QUARTERLY JOURNAL OF ECONOMICS

Senate elections and whether it had a differential effect for theClinton–Lazio race. We denote by dNY the indicator variable forthe New York Senate races. We estimate the specification
(4) vk,2000R,Sen � � � �Pvk,1996
R,Pres � �Fdk,2000FOX � Fdk,2000
FOX � dNY
� �2000 Xk,2000 � �00–90 Xk,00–90 � �CCk,2000 � εk,
where �F indicates the effect of Fox News on Senate races otherthan New York and F indicates the differential effect for thefeatured New York race. This specification controls for the 1996presidential vote share.15
Columns (4)–(6) in Table VII report the results. The effect ofFox News on nonfeatured Senate races is large and significant,0.0072 with district (column (4)) and 0.0071 with county fixedeffects (column (5)). Compared to this effect, the impact on theNew York race is not significantly different, although the stan-dard errors on the coefficient F are relatively large. We then testfor heterogeneity by political areas (column (6)). Consistent withthe findings for presidential elections, Fox News had the largestimpact in Democratic districts.
Fox News affected voting also in nonfeatured Senate races,especially in Democratic districts. We fail to find a stronger effectfor highly emphasized races. These results suggest that Fox Newsexposure induced a generalized ideological shift, as opposed to acandidate-specific effect.
IV. INTERPRETATIONS
The introduction of a (comparatively speaking) conservativenews channel increased the vote share of Republican candidates.We now evaluate the magnitude of this effect by estimating theshare of the audience that was convinced by Fox News to voteRepublican. We compare this persuasion rate to other mediaeffects in the literature and put forward interpretations.
IV.A. Persuasion Rates
Model. To compute persuasion rates, we compare treatmenttowns T, where Fox News is available via cable, and controltowns C, where Fox News is not available via cable. We denote by
15. The results are similar if we control for the 1994 Senatorial vote shareinstead [see DellaVigna and Kaplan 2006]. The disadvantage of this specificationis that it restricts the sample to 2,037 towns in five states.
1217THE FOX NEWS EFFECT: MEDIA BIAS AND VOTING
r the share of Republican voters and by d the share of Democraticvoters, before the introduction of Fox News. For simplicity, weneglect third parties. Consequently, (1 � r � d) denotes theshare of nonvoters. Since the two types of towns have similarpolitical outcomes in the pre-Fox News period conditional on a setof controls (Tables II and III), we assume that r and d are thesame in towns T and C.
A fraction e of the town population is exposed to Fox News,after the nationwide introduction. Exposure e is higher in treat-ment towns; that is, eT � eC � 0. We allow nonzero exposure eCin control towns because, for example, of the availability of sat-ellite which broadcasts Fox News to subscribers in both towns.For simplicity, we also assume that the exposure ej to Fox Newsin town j is independent of political affiliation. That is, we assumethat Republicans are as likely as Democrats or nonvoters towatch Fox News when available. While Republicans are morelikely to watch Fox News (Table I), we cannot rule out that thiscaptures the causal convincing effect of Fox News, rather thandifferential exposure ej by party.
The key parameter is f, the fraction of the audience that isconvinced by Fox News to vote Republican. This persuasion rate,f, applies equally to Democratic voters and to nonvoters, that is,to a fraction (1 � r) of the Fox News audience ej, where j � T, C.Therefore, the introduction of Fox News increases the fractionvoting Republican by (1 � r)ejf. The two-party vote share vj intown j, with j � T, C, equals
(5) vj �r � 1 � r�ej f
r � d � 1 � r � d�ej f.
(Turnout increases since Fox News induces a fraction f of thenonvoters to vote Republican.) Using expression (5), we solve forthe difference in vote share between treatment and control towns,vT � vC, the equivalent of �F in the data. We obtain vT � vC �(eT � eC) fd/tCtT, where tj � (r � d � (1 � r � d)ejf) is theturnout in town j. The implied persuasion rate f is
(6) f �vT � vC
eT � eC�1 � r�
1 � r�tCtT
d .
The first term in expression (6) is the influence rate pertreated population, and the second term is a factor correcting forturnout effects. The numerator of the first term, vT � vC, is the
1218 QUARTERLY JOURNAL OF ECONOMICS
shift in Republican vote share due to the availability of Fox Newsvia cable. The denominator, (eT � eC)(1 � r), normalizes thisvote shift by the share of population at risk of treatment, that is,by the differential exposure to Fox News, times the share ofnon-Republicans.
The second term, which disappears if turnout is perfect (r �d � 1), captures the differential convincing effect of Fox News ona Democrat and a nonvoter. In both cases, Republicans gain avote but only in the first case does the Democratic party lose avote. The larger the ratio of non-Republicans (1 � r) to Demo-crats d, hence, the bigger is the convincing impact for a given voteshare change. In addition, the term tCtT corrects for the fact thata higher turnout tj increases the denominator of expression (5),and, therefore, decreases the impact of f on vj.
Audience Data. We estimate the differential exposure (eT �eC) in expression (6) using the microlevel Scarborough data ontelevision audiences described in Section II. We use the sub-sample of 11,388 respondents for whom we observe the zip code ofresidence and for whom we can match by zip code to the cabledata on availability of Fox News (Table I, columns (4)–(6)). Weuse the “diary audience” measure since the “recall audience”measure is not available for most of this sample. We aggregatethe data at the town level to maximize comparability to thespecifications in the rest of the paper. For each town k of the 568towns in this sample, ek
FOX is the fraction of town residents in theFox News audience. We estimate
(7) ekFOX � � � �F dk,2000
FOX � �2000 Xk,2000
� �00–90 Xk,00–90 � �CCk,2000 � εk.
The regression is weighted by the number of respondents in atown, and the standard errors are clustered at the level of thelocal cable company. The coefficient �F is the differential FoxNews diary audience due to Fox News availability via cable in thetown.
Table VIII shows the results. In the specification withoutcontrols (column (1)), the availability of Fox News induces 2.7percent (�F � 0.0270) additional town residents to watch FoxNews for at least a full half hour per week. The estimate issignificant and sizeable. In towns where Fox News is not avail-able via cable, 2.62 percent (� � 0.262) of the residents still watch
1219THE FOX NEWS EFFECT: MEDIA BIAS AND VOTING

TA
BL
EV
III
TH
EE
FF
EC
TO
FF
OX
NE
WS
EX
PO
SU
RE
ON
FO
XN
EW
SA
UD
IEN
CE:
PE
RS
UA
SIO
NR
AT
ES
(SC
AR
BO
RO
UG
HD
AT
A)
Dep
.va
r.
Sh
are
ofto
wn
resp
onde
nts
that
wat
ched
atle
ast
thir
tym
inu
tes
ofa
chan
nel
inpa
stw
eek
Wat
ched
Fox
New
sW
atch
edC
NN
(1)
(2)
(3)
(4)
(5)
(6)
(7)
Ava
ilab
ilit
yof
Fox
New
svi
aca
ble
in20
000.
027
0.03
710.
0251
0.03
460.
0251
0.00
420.
0045
(0.0
058)
***
(0.0
105)
***
(0.0
082)
***
(0.0
116)
***
(0.0
121)
**(0
.011
4)(0
.010
4)A
vail
abil
ity
ofF
oxN
ews
via
cabl
ein
2003
0.00
16(0
.009
0)C
onst
ant
0.02
620.
0928
�0.
0531
0.13
170.
0947
0.72
130.
0917
(0.0
036)
***
(0.1
046)
(0.1
316)
(0.1
102)
(0.0
054)
***
(0.1
674)
***
(0.2
119)
Con
trol
vari
able
sC
ensu
sco
ntr
ols:
1990
and
2000
—X
XX
—X
XC
able
syst
emco
ntr
ols
—X
XX
—X
XU
.S.
Hou
sedi
stri
ctfi
xed
effe
cts
—X
—X
—X
—C
oun
tyfi
xed
effe
cts
——
X—
——
X2S
LS
esti
mat
esof
pers
uas
ion
rate
sE
stim
ates
usi
ng
(pre
dict
ed)
reca
llau
dien
cem
easu
re0.
0339
0.08
27(0
.015
1)**
(0.0
298)
***
Est
imat
esu
sin
gdi
ary
audi
ence
mea
sure
0.11
620.
2829
(0.0
518)
**(0
.102
0)**
*R
20.
0655
0.31
050.
3507
0.31
480.
0217
0.38
720.
4262
NN
�56
8N
�56
8N
�56
8N
�54
5N
�56
8N
�56
8N
�56
8
Not
es:
An
obse
rvat
ion
inth
eO
LS
regr
essi
onis
ato
wn
for
wh
ich
both
Sca
rbor
ough
data
ondi
ary
audi
ence
asw
ell
asca
ble
and
elec
tion
data
are
avai
labl
e.T
he
vari
able
“Ava
ilab
ilit
yof
Fox
New
svi
aca
ble
in20
00”
isa
bin
ary
vari
able
that
equ
als
one
ifF
oxN
ews
was
part
ofth
eto
wn
’slo
cal
cabl
epa
ckag
ein
2000
and
sim
ilar
lyfo
rth
eva
riab
le“A
vail
abil
ity
inF
oxN
ews
via
cabl
ein
2003
.”T
he
pers
uas
ion
rate
isth
esh
are
ofpo
pula
tion
expo
sed
toF
oxN
ews
that
ispe
rsu
aded
tovo
teR
epu
blic
anan
dis
com
pute
dat
the
rati
oof
the
impa
ctof
Fox
New
son
voti
ng
(Tab
leIV
)to
the
impa
ctof
Fox
New
son
audi
ence
(th
ista
ble)
,cor
rect
edfo
rpo
liti
calc
ompo
siti
onof
the
audi
ence
.Th
eC
ensu
sco
ntr
ols
are
twel
vede
mog
raph
icva
riab
les
from
the
Cen
sus,
pres
ent
both
inth
e20
00va
lues
and
indi
ffer
ence
sbe
twee
n20
00an
d19
90.
Th
eco
ntr
ols
for
cabl
efe
atu
res
are
deci
les
inth
en
um
ber
ofch
ann
els
prov
ided
and
inth
en
um
ber
ofpo
ten
tial
subs
crib
ers.
All
con
trol
sar
eli
sted
inT
able
X.T
he
stan
dard
erro
rsfo
rth
epe
rsu
asio
nra
tes
are
com
pute
du
sin
gth
eD
elta
Met
hod
.T
he
Fox
New
sau
dien
ceac
cord
ing
toth
ere
call
audi
ence
mea
sure
isan
indi
cato
rva
riab
lefo
rre
spon
den
tsw
ho
stat
edth
atth
eyw
atch
eda
chan
nel
inth
epa
stse
ven
days
.Th
eF
oxN
ews
audi
ence
acco
rdin
gto
the
diar
yau
dien
cem
easu
reis
anin
dica
tor
vari
able
for
wh
eth
erth
ere
spon
den
tw
atch
edat
leas
ta
full
thir
ty-m
inu
tebl
ock
ofF
oxN
ews
inth
esu
rvey
wee
k.A
ddit
ion
alde
tail
son
pers
uas
ion
rate
sar
ein
the
text
.R
obu
stst
anda
rder
rors
clu
ster
edby
loca
lca
ble
com
pan
yin
pare
nth
eses
.T
he
obse
rvat
ion
sar
ew
eigh
ted
byth
eto
tal
nu
mbe
rof
surv
eyre
spon
den
tsin
the
tow
n.
*si
gnifi
can
tat
10pe
rcen
t;**
sign
ifica
nt
at5
perc
ent;
***
sign
ifica
nt
at1
perc
ent.
1220 QUARTERLY JOURNAL OF ECONOMICS

Fox News for at least a full half hour per week. About half of theFox News audience, therefore, watches Fox News in ways otherthan via cable, possibly via satellite. This finding could also bedue to measurement error in our measure of availability viacable. In either case, the estimates in Section III are likely tounderstate the impact of Fox News on voting, since they captureonly the impact of Fox News availability via cable.
In columns (2) and (3), we add the Census, cable, and geo-graphic controls used in the body of the paper. The estimateddifferential exposure rates are �F � 0.0371 with congressionaldistrict fixed effects and �F � 0.0251 with county fixed effects.Interestingly, introducing control variables and district fixed ef-fects increases the estimated �F.
As a first placebo test, we show that availability of Fox Newsvia cable in 2003 does not increase audience rates in 2000 (col-umn (4)). As a second placebo test, we show that, once we addcontrols (columns (6) and (7)) availability of Fox News in 2000does not increase the audience for CNN (CNN is available in alltowns in our sample).
Persuasion Rates. We estimate the persuasion rate f usingexpression (6). We obtain the differential exposure rate eT � eCas the coefficient �F of columns (2) and (3) in Table VIII. We firstuse the more inclusive recall audience measure. Since we cannotdirectly estimate the model (7) for the recall audience variable,we multiply the estimates of �F by a conversion rate, the ratiobetween the aggregate recall audience and diary audience forCNN, that is, 35.3/10.3 � 3.43 (Table I, column (4)). (The ratiowould be somewhat higher if we used the audience measures forFox News.) The implied estimates for the differential exposurerate eT � eC are 0.1271 with district fixed effects and 0.0860 withcounty fixed effects.
We evaluate the political variables tT, tC, r, and d using thesample averages of the 2000 elections. We weight the averages bytotal votes cast in 2000 to better approximate the individual-levelexpressions (5) and (6). The average weighted turnout in 2000 asa share of the voting-age population is 0.560, and it is very similarin Fox News and non-Fox News towns, hence tT � tC � 0.560.16
The percentage of Democratic voters d is the product of the
16. The average self-reported turnout in the Scarborough survey is 69.3percent, but self-reported turnout is known to overstate the actual figure.
1221THE FOX NEWS EFFECT: MEDIA BIAS AND VOTING

turnout rate t and the average weighted Democratic two-partyvote share in 2000 in our sample, that is, 0.560 � (1 � 0.453) �0.306. This implies that f � 1.024 � (vT � vC)/(eT � eC).
Combining the estimates of these variables (eT � eC, tT, tC,d) with the estimates of the voting impact (vT � vC) from TableIV, we compute persuasion rates f using the (predicted) recallaudience measure. The standard errors for f take into account theuncertainty in both the audience regressions (Table IV) and thevote share regressions (Table VIII).17 With congressional districtfixed effects we get f � 1.024 � (0.0042/0.1271) � 0.0339; thatis, Fox News convinced 3.39 percent of its viewers that were notalready voting Republican to do so. With county fixed effects, wederive f � 1.024 � (0.0069/0.0860) � 0.0827; that is, Fox Newsconvinced 8.27 percent of its audience. Both estimates are signif-icantly different from zero, but are fairly imprecisely estimateddue to the small sample of the audience regressions.
In Table VIII we also report the persuasion rates f computedwith respect to the diary audience measure. The persuasion ratesare 3.42 times larger if eF � eN is measured using the diary dataas the measure of audience. The resulting estimates f � 0.1162(district fixed effects) and f � 0.2829 (county fixed effects) implylarge persuasion effects of the media. We summarize these re-sults in Table VIII and in the first two rows of Table IX.
Robustness. The estimates of the persuasion rate are robustto different estimates of the political parameters. If, instead ofusing weighted means, we use the unweighted means (t � 0.583and d � 0.583 � (1 � 0.538)), we obtain f � 0.0417 with districtfixed effects and f � 0.1012 with county fixed effects. Theseeffects are in the ballpark of the benchmark estimates.
The persuasion rate estimates are more sensitive to assump-tions about the exposure rate. A factor that leads to higher per-suasion rates is the self-selection of Republicans in the Fox Newsaudience. In Table VIII, we estimate the selective exposure eT �eC in (7) using the whole population rather than just Democraticvoters and nonvoters. To the extent that Republicans self-select
17. The standard errors are computed using the Delta method, taking intoaccount also the covariance between the estimated �F in the vote share in theaudience regressions (in the sample of towns for which both are available). Thestandard errors do not take into account the (limited) uncertainty in the estimateof tT, tC, d, and of the conversion rate.
1222 QUARTERLY JOURNAL OF ECONOMICS

in the Fox News audience, this downward biases the estimateof f.18
Conclusion. The estimates using the recall audience implythat Fox News convinced 3 to 8 percent of its audience to shift itsvoting behavior toward the Republican party, a sizeable mediapersuasion effect. Alternative estimates using the more restric-tive diary audience measure lead to estimates of the persuasionrate between 0.11 and 0.28, corresponding to large media effects.
IV.B. Persuasion Rates in the Literature
We estimate persuasion rates f for other studies in the liter-ature summarized in Table IX. We discuss field experiments,laboratory experiments, and surveys.
Field Experiments. In a series of field experiments [Greenand Gerber 2004], households within a precinct are randomlyselected to receive turn-out-the-vote treatments (canvassing,phone calls, or leaflets) right before an election. Turnout is mea-sured using official individual voting records. In other experi-ments, the randomization is done at the precinct level, and pre-cinct-level turnout is compared across precincts. Using the samenotation as in Section IV.A and denoting by t the turn-out rate,we assume that the treatment convinces a fraction f of the peoplethat do not usually turn out and are exposed, that is, (1 � t)ej, forj � T, C. It follows that tj � t � f(1 � t)ej and tT � tC � (1 �t)(eT � eC) f. This implies
(8) f �tT � tC
eT � eC
11 � t� .
In these experiments, eC � 0 since no one in the control group istreated, hence t � tC. In Table IX, we summarize the treatment,election type, year, location, and sample size of five such experi-ments. Using the turnout rates in the control (tC) and treatment(tT) groups and the exposure rate eT � eC, we compute thepersuasion rate f using expression (8). Canvassing and phonecalls convinced between 4 and 26 percent of nonvoters to turn outto the polls.
More recently, Gerber, Karlan, and Bergan [2006] randomly
18. Unfortunately, we cannot restrict the estimation of (7) to non-Republi-cans, since the party identification variable is measured in 2000 and it capturesthe causal effect of Fox News, as well as sorting.
1223THE FOX NEWS EFFECT: MEDIA BIAS AND VOTING

TA
BL
EIX
CO
MP
AR
ISO
NW
ITH
PE
RS
UA
SIO
NR
AT
ES
INO
TH
ER
ME
DIA
ST
UD
IES
Pap
er
Var
iabl
e:pe
rsu
asio
nra
tef
(sh
are
ofli
sten
ers
con
vin
ced
bym
edia
)
Tre
atm
ent
Ele
ctio
nty
peor
ques
tion
Var
iabl
et
Yea
rP
lace
Sam
ple
size
Con
trol
grou
pt T
Tre
atm
ent
grou
pt C
Exp
osu
rera
tee T
�e C
Per
suas
ion
rate
(1)
(2)
(3)
(4)
(5)
(6)
(7)
(8)
(9)
(10)
Fox
New
sS
tudy
Del
laV
ign
aan
dK
apla
n[2
006]
Fox
New
sex
posu
re,
dist
rict
f.e.
Pre
side
nti
alel
ecti
onR
epu
blic
anvo
tesh
are
2000
28U
.S.
stat
es
N� 66
,372
,804
0.55
60.
560
0.12
70.
034/
0.11
6
Fox
New
sex
posu
re,
cou
nty
f.e.
0.55
60.
563
0.08
60.
083/
0.28
3
Fie
ldE
xper
imen
tsG
erbe
ran
dG
reen
[200
0]D
oor-
to-d
oor
can
vass
ing
Fed
eral
elec
t.T
urn
out
1998
New
Hav
enN
�14
,473
0.42
20.
463
0.27
00.
263
Can
vass
ing
�m
ail
�ca
lls
Fed
eral
elec
t.T
urn
out
1998
New
Hav
enN
�14
,850
0.42
20.
448
0.27
00.
167
Gre
en,
Ger
ber,
and
Nic
kers
on[2
003]
Doo
r-to
-doo
rca
nva
ssin
gL
ocal
elec
t.T
urn
out
2001
6ci
ties
N�
18,9
330.
286
0.31
00.
293
0.11
8
Gre
enan
dG
erbe
r[2
001]
Ph
one
call
sby
you
thvo
teG
ener
alel
ect.
Tu
rnou
t20
004
citi
esN
�4,
377
0.66
00.
711
0.73
70.
205
Ph
one
call
s18
–30
-yea
r-ol
dsG
ener
alel
ect.
Tu
rnou
t20
002
citi
esN
�4,
377
0.40
50.
416
0.41
40.
045
Ger
ber,
Kar
lan
,an
dB
erga
n[2
006]
Fre
esu
bscr
ipti
onto
Was
hin
gton
Pos
t
Gov
ern
orel
ect.
Dem
.sh
are
ofvo
tes
2005
Was
hin
gton
N�
1,01
10.
291
0.36
30.
940
0.10
9
1224 QUARTERLY JOURNAL OF ECONOMICS

TA
BL
EIX
(CO
NT
INU
ED
)
Pap
er
Var
iabl
e:pe
rsu
asio
nra
tef
(sh
are
ofli
sten
ers
con
vin
ced
bym
edia
)
Tre
atm
ent
Ele
ctio
nty
peor
ques
tion
Var
iabl
et
Yea
rP
lace
Sam
ple
size
Con
trol
grou
pt T
Tre
atm
ent
grou
pt C
Exp
osu
rera
tee T
�e C
Per
suas
ion
rate
(1)
(2)
(3)
(4)
(5)
(6)
(7)
(8)
(9)
(10)
Lab
orat
ory
Exp
erim
ents
An
sola
beh
ere
and
Iyen
gar
[199
5]L
abor
ator
yex
posu
reto
30-s
econ
dpo
liti
cal
ad
Gov
ern
orel
ect.
Vot
esh
are
for
part
ysp
onso
rin
gad
1990
Sou
ther
nC
alif
orn
iaN
�1,
716
0.53
00.
568
1.00
00.
082
Sen
ate
elec
t.19
92
May
orel
ect.
1993
Su
rvey
sK
ull
,R
amsa
y,an
dL
ewis
[200
3]R
espo
nde
nt
wat
ches
Fox
New
s
Did
U.S
.fi
nd
WM
Din
Iraq
?
Sh
are
ofye
san
swer
s20
03U
SA
N�
8,63
40.
220
0.33
01.
000
0.14
1
Gen
tzko
wan
dS
hap
iro
[200
4]R
espo
nde
nt
wat
ches
CN
ND
idA
rabs
do9/
11at
tack
?
Sh
are
ofye
san
swer
s20
02A
rab
cou
ntr
ies
N�
2,45
70.
215
0.28
01.
000
0.08
3
Res
pon
den
tw
atch
esA
lJa
zeer
a
2002
N�
2,45
70.
215
0.13
31.
000
0.10
5
Not
es:C
alcu
lati
ons
ofm
edia
effe
ctby
the
auth
ors
base
don
data
from
the
pape
rsci
ted.
Col
um
ns
(7)
and
(8)
repo
rtth
esh
are
ofR
epu
blic
anvo
ters
inth
eco
ntr
olan
dtr
eatm
ent
grou
p.C
olu
mn
(9)r
epor
tsth
eex
posu
rera
te,t
hat
is,t
he
diff
eren
cebe
twee
nth
etr
eatm
ent
and
the
con
trol
grou
pin
the
shar
eof
peop
leex
pose
dto
the
trea
tmen
t.C
olu
mn
(10)
com
pute
sth
ees
tim
ated
pers
uas
ion
rate
fas
(tT
�tC
)/((
eT�
eC)*
(1�
tC))
,ex
cept
inth
efi
rst
row
(see
text
).T
he
pers
uas
ion
rate
den
otes
the
shar
eof
the
audi
ence
that
was
not
prev
iou
sly
con
vin
ced
and
that
isco
nvi
nce
dby
the
mes
sage
.Th
eda
tafo
rth
ispa
per
refe
rto
the
esti
mat
esob
tain
edu
sin
gth
e(p
redi
cted
)rec
alla
udi
ence
mea
sure
and
the
diar
yau
dien
cem
easu
re,
resp
ecti
vely
.Th
eda
tafo
rth
eG
erbe
r,K
arla
n,a
nd
Ber
gan
[200
6]st
udy
isco
urt
esy
ofth
eau
thor
s.F
orth
eA
nso
labe
her
ean
dIy
enga
r[1
995]
stu
dy,w
eu
seth
eda
tain
Tab
les
B1.
1an
dB
2.4,
neg
lect
ing
vote
rsth
atst
ate
the
inte
nti
onn
otto
vote
.We
obta
inth
eba
seli
ne
shar
eof
vect
ors
t �{C
}fr
omT
able
B1.
1as
the
wei
ghte
dav
erag
esh
are
ofth
esu
bjec
tsw
ith
the
sam
epa
rty
affi
liat
ion
asth
esp
onso
rin
gpa
rty:
(50/
(50
�38
))�
48/(
46�
18)
�(3
8/(5
0�
38))
�18
/(46
�18
).
1225THE FOX NEWS EFFECT: MEDIA BIAS AND VOTING

assign subscriptions to a right-wing newspaper (WashingtonTimes) or a left-wing newspaper (Washington Post), and considerthe effect on stated voting behavior in a post-election survey.They find a substantial increase in the share of (stated) Demo-cratic voters for exposure to the left-wing newspaper, correspond-ing to a persuasion rate f of 0.109. (We use expression (8) wheret is the share of Democratic votes out of all survey respondents,including nonvoters, and where we assume that all recipients ofa subscription read the newspaper.) However, they also find thatthe share of Democratic voters increases after exposure to theright-wing paper, albeit insignificantly.
Laboratory Experiments. Ansolabehere and Iyengar (1995]expose experimental subjects to thirty-second political advertise-ments supporting a candidate (or criticizing the opposite candi-date). They then elicit beliefs and voting intentions at the end ofthe experiment. In Table IX we summarize the findings for threesets of experiments with 1,716 total subjects. On average, expo-sure to one advertisement yields a sizeable persuasion rate f of0.08 on the stated vote share for the sponsoring party. Otherexperiments by the authors (results not reported) lead to persua-sion rates of similar or larger magnitudes.
Surveys. Following Lazarsfeld, Berelson, and Gaudet [1944],political scientists have widely used surveys to assess the impactof the media. A survey in this tradition [Kull, Ramsay, and Lewis2003] finds that 33 percent of Fox News watchers believe (erro-neously) that weapons of mass destruction were found in Iraq byOctober 2003, compared to 22 percent for the overall sample. Thisimplies a persuasion rate f of 0.141 (Table IX). Gentzkow andShapiro [2004] examine the effect of media exposure in the Is-lamic world. The CNN audience was 30 percent more likely tobelieve, and the Al Jazeera audience was 40 percent less likely tobelieve that Arabs carried out the 9/11 attacks, compared torespondents who watched neither. The estimates imply persua-sion rates between 0.08 and 0.10. While the survey estimatescould be due to sorting rather than causal effects, the impliedpersuasion rates are quite close to the experimental estimates.
IV.C. Explanations
Our estimates imply that Fox News convinced a significantportion of its audience to vote Republican. We consider threeexplanations for this finding: one statistical, one rational, and one
1226 QUARTERLY JOURNAL OF ECONOMICS

nonrational. In DellaVigna and Kaplan [2006], we present amodel of the last two explanations.
1. Endogeneity Bias. The findings may be spurious andinduced by entry of Fox News in towns that were indepen-dently becoming more conservative. Contrary to this in-terpretation, conditional on the controls, vote shares in1996 and voting trends in 1988–1992 do not predict theintroduction of Fox News (Table III). Moreover, the intro-duction of Fox News does not predict political votingtrends between 1992 and 1996 (before the introduction)(Table VII). Fox News only affects vote share changesbetween 1996 and 2000. Endogeneity of Fox News intro-duction is unlikely to explain the results.
2. Rational Learning. To the extent that voters are initiallyuncertain about the bias of Fox News, exposure will havea (temporary) effect on beliefs and voting. Voters attributethe positive coverage of George W. Bush in 2000 partly toRepublican bias of the media source (Fox News) but partlyalso to high quality of the Republican candidate (Bush). Afirst issue with this interpretation is that, arguably, by theyear 2000 the conservative slant of Fox News should havebeen clear. Second, this explanation makes the predictionthat the media effect should disappear over time as votersbecome aware of Fox News’ political slant. Contrary tothis prediction, the Fox News effect over the 2000–2004period gets, if anything, larger (Table V).19
3. Nonrational Persuasion. A behavioral interpretation isthat viewers do not discount media bias strongly enough[Cain, Loewenstein, and Moore 2005] and therefore are sub-ject to nonrational persuasion upon exposure. This interpre-tation can explain the persistence of the Fox News effect.
The two most plausible explanations, learning and persua-sion, have very different long-run implications. Rational learningpredicts that Fox News’ impact is temporary. Nonrational per-suasion predicts that Fox News permanently altered voting pat-terns in the United States.
Whether the effect is rational or not, it would be interestingto know the exact mechanism by which Fox News affected voting.The Senate results suggest that the effect is not due only to
19. The increase in the effect over time may also be explained by increasingaudience rates.
1227THE FOX NEWS EFFECT: MEDIA BIAS AND VOTING
candidate-specific coverage, but rather to a general ideologicalshift. Beyond this, we cannot tell if the effect is due to conserva-tive slant of the news or to the choice of topics like NationalSecurity that favor Republicans, as implied by the agenda settingtheory [Cohen 1963].
V. CONCLUSION
This paper studies the impact of media bias upon voting. Weconsider one of the most dramatic changes in the U. S. media inrecent years, the sudden introduction and expansion of the FoxNews cable channel from 1996 to 2000. We exploit the naturalexperiment induced by the timing of the entry of the Fox Newschannel in local cable markets.
We find a significant effect of exposure to Fox News on voting.Towns with Fox News have a 0.4 to 0.7 percentage point higherRepublican vote share in the 2000 presidential elections, com-pared to the 1996 elections. A vote shift of this magnitude is likelyto have been decisive in the 2000 elections. We also find an effecton vote share in Senate elections, which Fox News did not cover,suggesting that the Fox News impact extends to general politicalbeliefs. Finally, we find evidence that Fox News increased turn-out to the polls.
Based on this evidence and on microlevel audience data, weestimate that exposure to Fox News induced a substantial per-centage of the non-Republican viewers to vote for the Republicanparty, 3 to 8 percent according to the more inclusive audiencemeasure, and 11 to 28 percent according to the more restrictivemeasure. These estimates are consistent with field, laboratory,and survey evidence of media effects on political beliefs andvoting. We interpret the persuasion effect as a temporary learn-ing effect for rational voters or a permanent effect for voterssubject to nonrational persuasion. These results suggest that themedia can have a sizeable political impact.
This paper leaves a number of open questions. First, while weanalyze the extensive margin of voting, we do not consider theeffect on the intensity of political convictions of Republican vot-ers. In ongoing research, we study the impact on the intensivemargin of campaign contributions. Second, we have not directlyexamined the impact on policy-making. While a vote shift towardRepublicans is likely to induce a change in policy [Lee, Moretti,and Butler 2004], direct evidence documenting this effect would
1228 QUARTERLY JOURNAL OF ECONOMICS

be interesting. Finally, we hope that more evidence on the effectof other sources of media bias, such as local papers and radio talkshows, will complement the evidence in this paper.UC BERKELEY AND NBERIIES, STOCKHOLM UNIVERSITY
APPENDIX I: DATA
A. Cable Data
The source for the cable data is the Television and CableFactbook 2001 (referring to year 2000). A typical entry from thePennsylvania State section is
“KING OF PRUSSIA (Pa)—Comcast Cable. Counties: Dela-ware and Montgomery. Also serves: Collegeville, Grater-ford, Graterford Prison, Gulph Mills, [. . .] Upper Provi-dence Twp. (Delaware County), Wayne. Account No:PA0050. [. . .]
Basic Service Subscribers 17,692. [. . .] Programming (re-ceived off-air): WFMZ-TV (I); WLVT-TV (P) Allentown;WGTW (I) Burlington; KYW-TV (C) [. . .]. Programming(via satellite): C-SPAN, EWTN; Fox Family Channel;MSNBC [. . .] Fee: [. . .] $21.95 monthly. [. . .]
Expanded Basic Service Subscribers 17,138. Program-ming (via satellite): A&E; AMC; Bravo; CNBC; CNN; Com-edy Central; [. . .]. Fee: N.A.
Pay Service 1 Pay units: 845. Programming (via satellite):Cinemax. Fee: [. . .] $8.95 monthly. [. . .]
Ownership: Comcast Cable Communications Inc.”Each entry is listed by state under the principal community,
which is the town where the local cable company’s business officeis located. The additional communities reached by the local cablecompany are listed in alphabetical order, typically without indi-cation of the county, which is listed separately (the number ofcounties is rarely more than three). In the example above, thecommunities listed belong to one of two counties (Delaware andMontgomery) in Pennsylvania. Since we do not know which be-longs to which, we generate all combinations of town and county,except in cases where the county is explicitly listed as in “UpperProvidence Twp. (Delaware County).” When we match the cabledata with the Census and election data, the fictitious town–county combinations drop out. The only possibility of match erroris if there are two towns with the same name in the multiple
1229THE FOX NEWS EFFECT: MEDIA BIAS AND VOTING

counties listed, but in this case we expect the county to be explic-itly listed next to the town name. In a few cases, the communitiesreached are indicated only as fractions of a county, such as“Alameda County (Western borders).” We exclude these commu-nities, since we cannot match them to voting data. As long asthese communities do not include other separately listed towns inthe cable data, their deletion will not bias the measure of cableofferings for the other towns. As a robustness check, we recom-pute the results in the paper excluding the 149 counties whichinclude one such community where Fox News is available. All theresults hold in this smaller sample of 8,262 towns.
The Basic Service description lists all the local televisionstations that the cable company rebroadcasts under the heading“Programming (received off-air).” We disregard these stations.We estimate instead the number of cable channels broadcast inthe “Programming (via satellite)” section. To save coding time,the total number of channels is estimated counting the number oflines listing cable channels in the Basic and Expanded Basic 1, 2,and 3 Services. The estimated number of channels follows bymultiplying this number by 2.5, a conversion rate estimated on asubsample of forty cable companies. Over this subsample, a re-gression of actual number of channels on forecasted number ofchannels yields an R2 of 0.95 and a coefficient of 1.
Finally, it is worth noting that sometimes the number ofsubscribers or (as in this case) the price of the subscription ismissing or refers to previous years.
B. Election Data
In the aggregation of voting information to the town level, wedrop precincts such as “Precinct 1” where the transformationalgorithm leads to an empty name. In States like Alabama, Ar-kansas, and Tennessee, the aggregation procedure generates avery large number of localities because precinct names are oftenincorrectly identified as a locality by our code. (These fictitioustowns drop out from the final sample, since they do not match toCensus and cable data.) The New England States, instead, havea small number of exactly identified towns because the electiondata is reported at the town level.
For the towns that are in multiple districts, we code the townas belonging to the district where the largest fraction of thetown’s population is represented.
1230 QUARTERLY JOURNAL OF ECONOMICS

APPENDIX II: List of Controls for Tables III and IV
Regression of Fox Newson determinants
(Table III)
Regression of vote shareon Fox News
(Table IV)
Coefficient Std. error Coefficient Std. error
(1) (2) (3) (4)
Census controls 2000Population �0.0004 (0.0013) �0.0003 (0.0001)***High school 0.0334 (0.2233) 0.0252 (0.0160)Some college �0.0218 (0.1964) �0.0664 (0.0141)***College graduate 0.0672 (0.1599) �0.097 (0.0103)***Male 0.2285 (0.2859) 0.1146 (0.0208)***African American �0.013 (0.1086) �0.0547 (0.0061)***Hispanic �0.1155 (0.1973) �0.0571 (0.0130)***Employment 0.0759 (0.1225) 0.0367 (0.0089)***Unemployment 0.3511 (0.3768) 0.1212 (0.0265)***Married �0.1057 (0.1419) 0.0033 (0.0078)Income �0.0124 (0.0072)* �0.0012 (0.0004)***Urban �0.0293 (0.0251) �0.0073 (0.0014)***
Census controls 2000–1990Population �0.0189 (0.0106)* 0.0018 (0.0005)***High school 0.0132 (0.1997) 0.0136 (0.0136)Some college �0.1716 (0.1931) 0.0596 (0.0154)***College graduate 0.0351 (0.2097) 0.0841 (0.0127)***Male �0.218 (0.3099) �0.0311 (0.0238)African American �0.3921 (0.2173)* 0.0687 (0.0181)***Hispanic �0.0138 (0.3556) �0.054 (0.0206)***Employment �0.0367 (0.1453) �0.0209 (0.0109)*Unemployment �0.3466 (0.2663) �0.0594 (0.0229)***Married �0.0786 (0.1238) �0.0105 (0.0111)Income 0.0157 (0.0118) 0.0011 (0.0010)Urban �0.0039 (0.0280) 0.0029 (0.0018)
Decile in potential subscribersDecile 2 �0.006 (0.0188) �0.0007 (0.0032)Decile 3 0.0534 (0.0249)** �0.0006 (0.0031)Decile 4 0.0499 (0.0295)* �0.0022 (0.0031)Decile 5 0.0388 (0.0334) �0.0053 (0.0033)Decile 6 0.0563 (0.0369) �0.006 (0.0033)*Decile 7 0.0259 (0.0410) �0.011 (0.0034)***Decile 8 0.022 (0.0387) �0.0105 (0.0035)***Decile 9 �0.0056 (0.0432) �0.0124 (0.0035)***Decile 10 0.1786 (0.0481)*** �0.0127 (0.0035)***
Decile in number of channelsDecile 2 0.0355 (0.0221) 0.0024 (0.0019)Decile 3 0.0778 (0.0267)*** 0.002 (0.0021)Decile 4 0.051 (0.0287)* �0.0005 (0.0023)Decile 5 0.0394 (0.0344) �0.0011 (0.0021)Decile 6 0.1122 (0.0278)*** 0.0001 (0.0019)Decile 7 0.3347 (0.0464)*** 0.0015 (0.0022)Decile 8 0.4292 (0.0526)*** �0.0017 (0.0023)Decile 9 0.4113 (0.0541)*** �0.0025 (0.0023)Decile 10 0.6475 (0.0500)*** �0.0014 (0.0025)
U. S. House district fixed effects X X X X
Notes: An observation in the OLS regression is a town. List of controls for the specifications with districtfixed effects from Table III (column (4)) and Table IV (column (4)). The number of potential subscribers is thetotal population covered by a cable system.
*significant at 10 percent; ** significant at 5 percent; ***significant at 1 percent.
1231THE FOX NEWS EFFECT: MEDIA BIAS AND VOTING
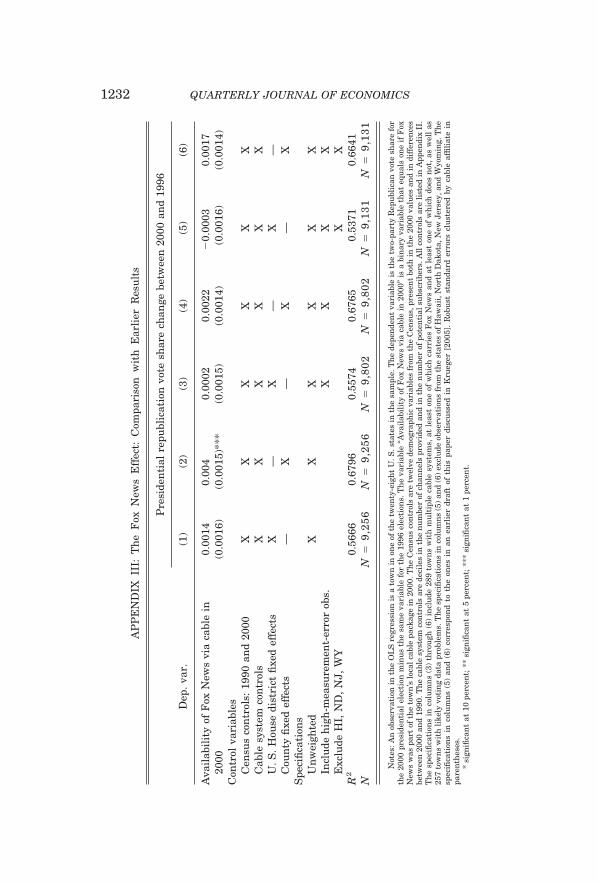
AP
PE
ND
IXII
I:T
he
Fox
New
sE
ffec
t:C
ompa
riso
nw
ith
Ear
lier
Res
ult
s
Dep
.va
r.
Pre
side
nti
alre
publ
icat
ion
vote
shar
ech
ange
betw
een
2000
and
1996
(1)
(2)
(3)
(4)
(5)
(6)
Ava
ilab
ilit
yof
Fox
New
svi
aca
ble
in20
000.
0014
0.00
40.
0002
0.00
22�
0.00
030.
0017
(0.0
016)
(0.0
015)
***
(0.0
015)
(0.0
014)
(0.0
016)
(0.0
014)
Con
trol
vari
able
sC
ensu
sco
ntr
ols:
1990
and
2000
XX
XX
XX
Cab
lesy
stem
con
trol
sX
XX
XX
XU
.S.
Hou
sedi
stri
ctfi
xed
effe
cts
X—
X—
X—
Cou
nty
fixe
def
fect
s—
X—
X—
XS
peci
fica
tion
sU
nw
eigh
ted
XX
XX
XX
Incl
ude
hig
h-m
easu
rem
ent-
erro
rob
s.X
XX
XE
xclu
deH
I,N
D,
NJ,
WY
XX
R2
0.56
660.
6796
0.55
740.
6765
0.53
710.
6641
NN
�9,
256
N�
9,25
6N
�9,
802
N�
9,80
2N
�9,
131
N�
9,13
1
Not
es:A
nob
serv
atio
nin
the
OL
Sre
gres
sion
isa
tow
nin
one
ofth
etw
enty
-eig
ht
U.S
.sta
tes
inth
esa
mpl
e.T
he
depe
nde
nt
vari
able
isth
etw
o-pa
rty
Rep
ubl
ican
vote
shar
efo
rth
e20
00pr
esid
enti
alel
ecti
onm
inu
sth
esa
me
vari
able
for
the
1996
elec
tion
s.T
he
vari
able
“Ava
ilab
ilit
yof
Fox
New
svi
aca
ble
in20
00”
isa
bin
ary
vari
able
that
equ
als
one
ifF
oxN
ews
was
part
ofth
eto
wn
’slo
calc
able
pack
age
in20
00.T
he
Cen
sus
con
trol
sar
etw
elve
dem
ogra
phic
vari
able
sfr
omth
eC
ensu
s,pr
esen
tbo
thin
the
2000
valu
esan
din
diff
eren
ces
betw
een
2000
and
1990
.Th
eca
ble
syst
emco
ntr
ols
are
deci
les
inth
en
um
ber
ofch
ann
els
prov
ided
and
inth
en
um
ber
ofpo
ten
tial
subs
crib
ers.
All
con
trol
sar
eli
sted
inA
ppen
dix
II.
Th
esp
ecifi
cati
ons
inco
lum
ns
(3)
thro
ugh
(6)
incl
ude
289
tow
ns
wit
hm
ult
iple
cabl
esy
stem
s,at
leas
ton
eof
wh
ich
carr
ies
Fox
New
san
dat
leas
ton
eof
wh
ich
does
not
,as
wel
las
257
tow
ns
wit
hli
kely
voti
ng
data
prob
lem
s.T
he
spec
ifica
tion
sin
colu
mn
s(5
)an
d(6
)ex
clu
deob
serv
atio
ns
from
the
stat
esof
Haw
aii,
Nor
thD
akot
a,N
ewJe
rsey
,an
dW
yom
ing.
Th
esp
ecifi
cati
ons
inco
lum
ns
(5)
and
(6)
corr
espo
nd
toth
eon
esin
anea
rlie
rdr
aft
ofth
ispa
per
disc
uss
edin
Kru
eger
[200
5].
Rob
ust
stan
dard
erro
rscl
ust
ered
byca
ble
affi
liat
ein
pare
nth
eses
.*
sign
ifica
nt
at10
perc
ent;
**si
gnifi
can
tat
5pe
rcen
t;**
*si
gnifi
can
tat
1pe
rcen
t.
1232 QUARTERLY JOURNAL OF ECONOMICS

REFERENCES
Abadie, Alberto, David Drukker, Jane Leber Herr, and Guido Imbens, “Imple-menting Matching Estimators for Average Treatment Effects in STATA,”Stata Journal, I (2001), 1–18.
Ansolabehere, Stephen, and Shanto Iyengar, Going Negative: How Attack AdsShrinks and Polarize the Electorate (New York: Free Press, 1995).
Bray, Margaret, and David Kreps, “Rational Learning and Rational Expecta-tions,” in Arrow and the Ascent of Modern Economic Theory, G. Feiwel, ed.(London: Macmillan, 1987, pp. 597–625).
Cain, Daylain, George Loewenstein, and Don Moore, “The Dirt on Coming Clean:Perverse Effects of Disclosing Conflicts of Interest,” Journal of Legal Studies,XXXIV (2005), 1–25.
Cohen, Bernard C., The Press and Foreign Policy (Princeton: Princeton UniversityPress, 1963).
Crump, Richard K., V. Joseph Hotz, Guido W. Imbens, and Oscar Mitnik, “Movingthe Goalposts: Addressing Limited Overlap in Estimation of the AverageTreatment Effects by Changing the Estimand,” Mimeograph, UC Berkeley,2005.
DellaVigna, Stefano, and Ethan Kaplan, “The Fox News Effect: Media Bias andVoting,” NBER Working Paper No. W12169, 2006.
DeMarzo, Peter, Dimitri Vayanos, and Jeffrey Zwiebel, “Persuasion Bias, SocialInfluence, and Uni-Dimensional Opinions,” Quarterly Journal of Economics,CXVIII (2003), 909–968.
Dyck, Alexander, and Luigi Zingales, “The Media and Asset Prices,” WorkingPaper, Harvard Business School, 2003.
Gentzkow, Matthew, “Television and Voter Turnout,” Quarterly Journal of Eco-nomics, CXXI (2006), 931–972.
——, and Jesse Shapiro, “Media, Education, and Anti-Americanism in the MuslimWorld,” Journal of Economic Perspectives, XVIII (2004), 117–133.
Gentzkow, Matthew, “Media Bias and Reputation,” Journal of Political Economy(2006), vol. CXIV, 280–316.
George, Lisa, and Joel Waldfogel, “The New York Times and the Market for LocalNewspapers,” American Economic Review, XCVI (2006), 435–447.
Gerber, Alan S., and Donald P. Green, “The Effects of Canvassing, TelephoneCalls and Direct Mail on Voter Turnout: A Field Experiment,” AmericanPolitical Science Review, XCIV (2000), 653–663.
Gerber, Alan S., Dean Karlan, and Daniel Bergan, “Does The Media Matter? AField Experiment Measuring the Effect of Newspapers on Voting Behaviorand Political Opinions,” Mimeograph, Yale University, 2006.
Green, Donald P., and Alan S. Gerber, “Getting Out the Youth Vote: Results fromRandomized Field Experiments,” Yale University, New Haven, CT, 2001.
——, Get Out the Vote! (Washington, D.C.: Brookings Institution Press, 2004).Green, Donald P, David W. Nickerson, “Getting Out the Vote in Local Elections:
Results from Six Door-To-Door Canvassing Experiments,” Journal of Politics,LXV (2003), 1083–1096.
Groseclose, Timothy, and Jeff Milyo, “A Measure of Media Bias,” Quarterly Jour-nal of Economics, CXX (2005), 1191–1237.
Hamilton, James T., All the News That’s Fit to Sell (Princeton: Princeton Univer-sity Press, 2004).
Herman, Edward, and Noam Chomsky, Manufacturing Consent: The PoliticalEconomy of the Mass Media (Pantheon Books, 1998).
Huberman, Gur, and Tomer Regev, “Contagious Speculation and a Cure forCancer: A Nonevent that Made Stock Prices Soar,” Journal of Finance, LVI(2001), 387–396.
King, Gary, Bradley Palmquist, Greg Adams, Micah Altman, Kenneth Benoit,Claudine Gay, Jeffrey B. Lewis, Russ Mayer, and Eric Reinhardt, “The Recordof American Democracy, 1984–1990,” Harvard University, Cambridge, MA;1997. ICPSR, Ann Arbor, MI.
Krueger, Alan, “Fair? Balanced? A Study Finds It Does Not Matter,” New YorkTimes, August 18, 2005.
1233THE FOX NEWS EFFECT: MEDIA BIAS AND VOTING

Kull, Steven, Clay Ramsay, and Evan Lewis, “Misperceptions, the Media, and theIraq War,” Political Science Quarterly, CXVIII (2003), 569–598.
Lakoff, George, Women, Fire and Dangerous Things (Chicago, IL: University ofChicago Press, 1987).
Lazarsfeld, Paul, Bernard Berelson, and Hazel Gaudet, The People’s Choice (NewYork: Duell, Sloan and Pearce, 1944).
Lee, David S., Enrico Moretti, and Matthew J. Butler, “Do Voters Affect or ElectPolicies? Evidence from the U. S. House,” Quarterly Journal of Economics,CXIX (2004), 807–860.
Leip, David, Dave Leip’s Atlas of U. S. Presidential Elections (http://www.uselectionatlas.org, 2004).
Lublin, David, and D. Stephen Voss, “Federal Elections Project,” American Uni-versity, Washington, D.C., and the University of Kentucky, Lexington, KY,2001.
Malmendier, Ulrike, and Devin Shanthikumar, “Are Small Investors Naive aboutIncentives?,” Journal of Financial Economics, forthcoming.
Mullainathan, Sendhil, and Andrei Shleifer, “The Market for News,” AmericanEconomic Review, XCV (2005), 1031–1053.
Prior, Markus, Post-Broadcast Democracy: How Media Choice Increases Inequal-ity in Political Involvement and Polarizes Elections (Cambridge: CambridgeUniversity Press, 2006).
Puglisi, Riccardo, “Being the New York Times: The Political Behavior of a News-paper,” Mimeograph, 2004.
Stromberg, David, “Radio Impact on Public Spending,” Quarterly Journal ofEconomics, CXIX (2004), 189–221.
Warren, Albert, Television and Cable Factbook 2001 (Washington, DC: WarrenCommunication News, 2001).
1234 QUARTERLY JOURNAL OF ECONOMICS