Embed Size (px)
Citation preview
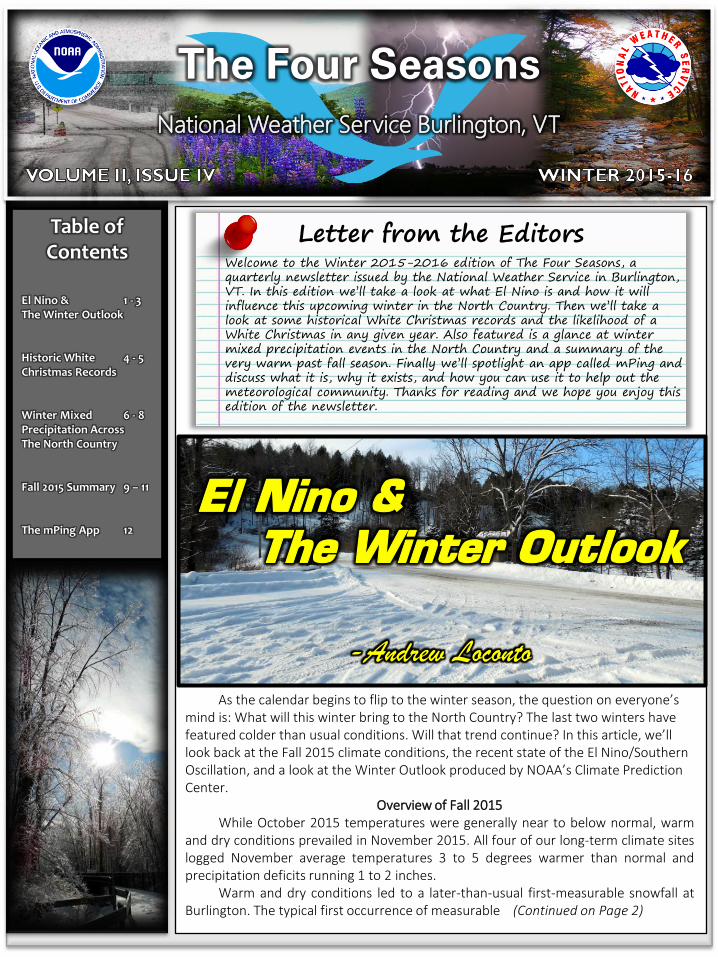
Table of Contents
El Nino & 1 - 3 The Winter Outlook Historic White 4 - 5 Christmas Records Winter Mixed 6 - 8 Precipitation Across The North Country Fall 2015 Summary 9 – 11 The mPing App 12
National Weather Service Burlington, VT
The Four Seasons
Letter from the Editors Welcome to the Winter 2015-2016 edition of The Four Seasons, a quarterly newsletter issued by the National Weather Service in Burlington, VT. In this edition we’ll take a look at what El Nino is and how it will influence this upcoming winter in the North Country. Then we’ll take a look at some historical White Christmas records and the likelihood of a White Christmas in any given year. Also featured is a glance at winter mixed precipitation events in the North Country and a summary of the very warm past fall season. Finally we’ll spotlight an app called mPing and discuss what it is, why it exists, and how you can use it to help out the meteorological community. Thanks for reading and we hope you enjoy this edition of the newsletter.
El Nino & The Winter Outlook
-Andrew Loconto
As the calendar begins to flip to the winter season, the question on everyone’s mind is: What will this winter bring to the North Country? The last two winters have featured colder than usual conditions. Will that trend continue? In this article, we’ll look back at the Fall 2015 climate conditions, the recent state of the El Nino/Southern Oscillation, and a look at the Winter Outlook produced by NOAA’s Climate Prediction Center.
Overview of Fall 2015 While October 2015 temperatures were generally near to below normal, warm and dry conditions prevailed in November 2015. All four of our long-term climate sites logged November average temperatures 3 to 5 degrees warmer than normal and precipitation deficits running 1 to 2 inches. Warm and dry conditions led to a later-than-usual first-measurable snowfall at Burlington. The typical first occurrence of measurable (Continued on Page 2)
VOLUME II, ISSUE IV PAGE 2
…Continued from Page 1
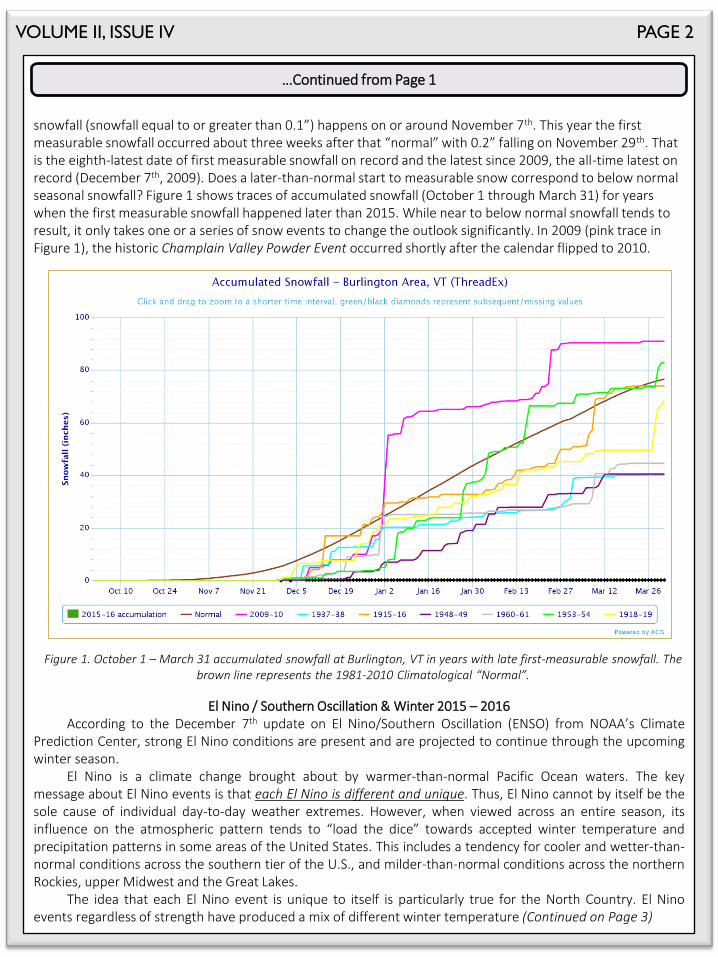
snowfall (snowfall equal to or greater than 0.1”) happens on or around November 7th. This year the first measurable snowfall occurred about three weeks after that “normal” with 0.2” falling on November 29th. That is the eighth-latest date of first measurable snowfall on record and the latest since 2009, the all-time latest on record (December 7th, 2009). Does a later-than-normal start to measurable snow correspond to below normal seasonal snowfall? Figure 1 shows traces of accumulated snowfall (October 1 through March 31) for years when the first measurable snowfall happened later than 2015. While near to below normal snowfall tends to result, it only takes one or a series of snow events to change the outlook significantly. In 2009 (pink trace in Figure 1), the historic Champlain Valley Powder Event occurred shortly after the calendar flipped to 2010.
Figure 1. October 1 – March 31 accumulated snowfall at Burlington, VT in years with late first-measurable snowfall. The brown line represents the 1981-2010 Climatological “Normal”.
El Nino / Southern Oscillation & Winter 2015 – 2016 According to the December 7th update on El Nino/Southern Oscillation (ENSO) from NOAA’s Climate Prediction Center, strong El Nino conditions are present and are projected to continue through the upcoming winter season. El Nino is a climate change brought about by warmer-than-normal Pacific Ocean waters. The key message about El Nino events is that each El Nino is different and unique. Thus, El Nino cannot by itself be the sole cause of individual day-to-day weather extremes. However, when viewed across an entire season, its influence on the atmospheric pattern tends to “load the dice” towards accepted winter temperature and precipitation patterns in some areas of the United States. This includes a tendency for cooler and wetter-than-normal conditions across the southern tier of the U.S., and milder-than-normal conditions across the northern Rockies, upper Midwest and the Great Lakes. The idea that each El Nino event is unique to itself is particularly true for the North Country. El Nino events regardless of strength have produced a mix of different winter temperature (Continued on Page 3)
VOLUME II, ISSUE IV PAGE 3
…Continued from Page 2
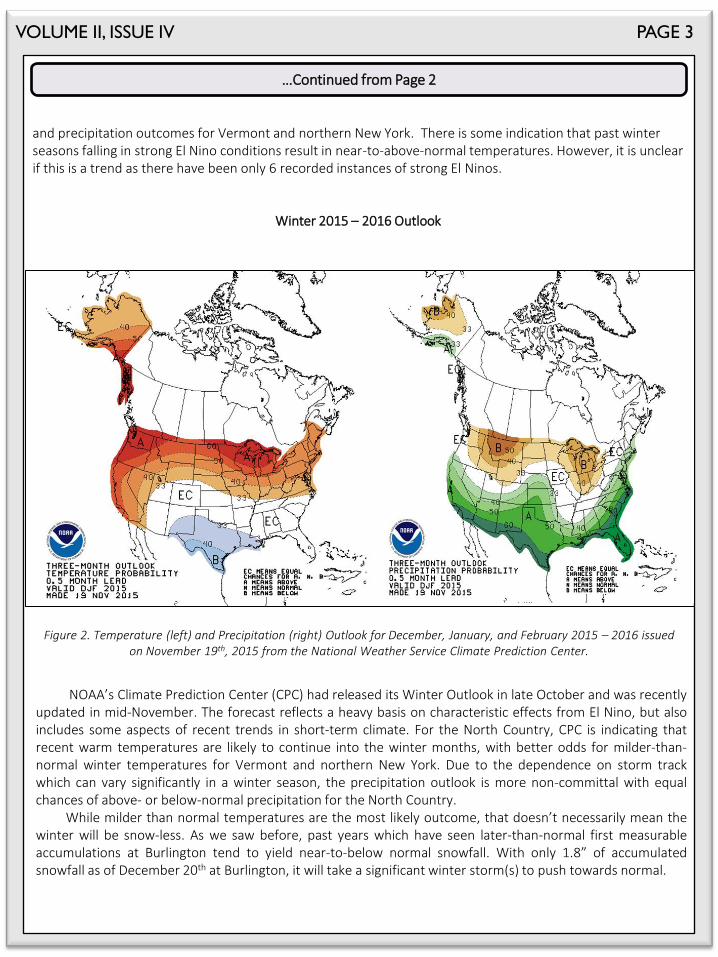
and precipitation outcomes for Vermont and northern New York. There is some indication that past winter seasons falling in strong El Nino conditions result in near-to-above-normal temperatures. However, it is unclear if this is a trend as there have been only 6 recorded instances of strong El Ninos.
Winter 2015 – 2016 Outlook
Figure 2. Temperature (left) and Precipitation (right) Outlook for December, January, and February 2015 – 2016 issued on November 19th, 2015 from the National Weather Service Climate Prediction Center.
NOAA’s Climate Prediction Center (CPC) had released its Winter Outlook in late October and was recently updated in mid-November. The forecast reflects a heavy basis on characteristic effects from El Nino, but also includes some aspects of recent trends in short-term climate. For the North Country, CPC is indicating that recent warm temperatures are likely to continue into the winter months, with better odds for milder-than-normal winter temperatures for Vermont and northern New York. Due to the dependence on storm track which can vary significantly in a winter season, the precipitation outlook is more non-committal with equal chances of above- or below-normal precipitation for the North Country. While milder than normal temperatures are the most likely outcome, that doesn’t necessarily mean the winter will be snow-less. As we saw before, past years which have seen later-than-normal first measurable accumulations at Burlington tend to yield near-to-below normal snowfall. With only 1.8” of accumulated snowfall as of December 20th at Burlington, it will take a significant winter storm(s) to push towards normal.
VOLUME II, ISSUE IV PAGE 4
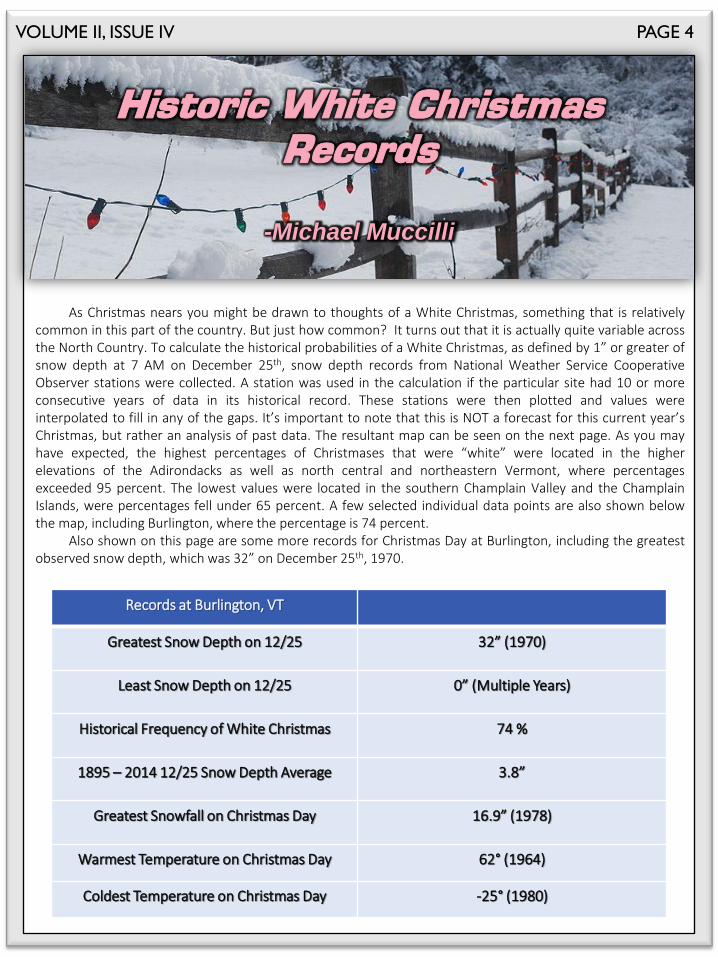
Historic White Christmas Records
-Michael Muccilli
Records at Burlington, VT
Greatest Snow Depth on 12/25 32” (1970)
Least Snow Depth on 12/25 0” (Multiple Years)
Historical Frequency of White Christmas 74 %
1895 – 2014 12/25 Snow Depth Average 3.8”
Greatest Snowfall on Christmas Day 16.9” (1978)
Warmest Temperature on Christmas Day 62° (1964)
Coldest Temperature on Christmas Day -25° (1980)
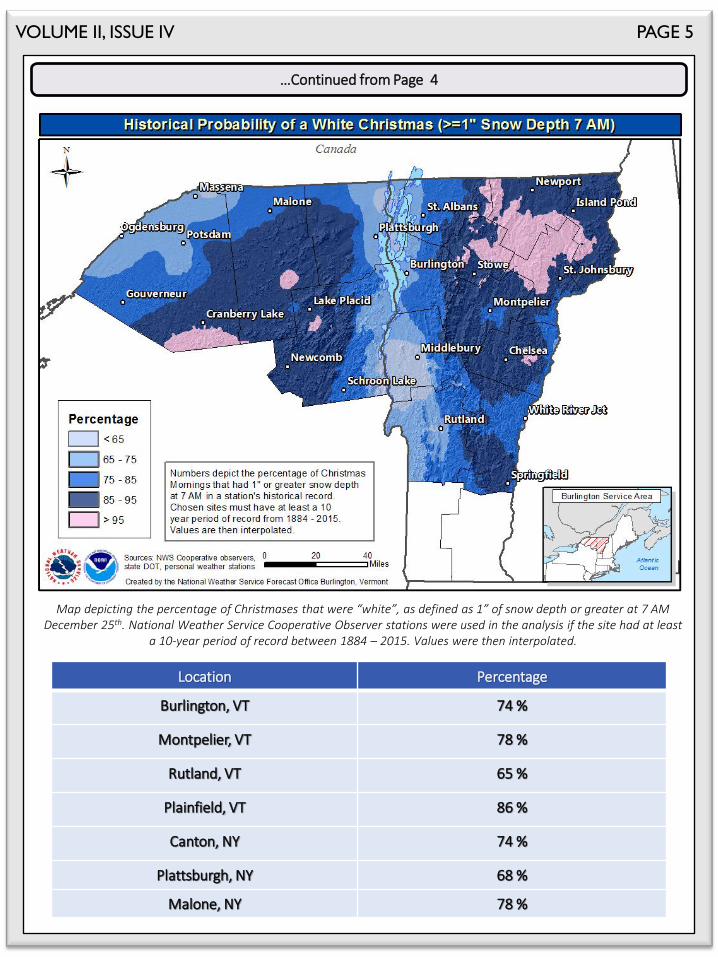
As Christmas nears you might be drawn to thoughts of a White Christmas, something that is relatively common in this part of the country. But just how common? It turns out that it is actually quite variable across the North Country. To calculate the historical probabilities of a White Christmas, as defined by 1” or greater of snow depth at 7 AM on December 25th, snow depth records from National Weather Service Cooperative Observer stations were collected. A station was used in the calculation if the particular site had 10 or more consecutive years of data in its historical record. These stations were then plotted and values were interpolated to fill in any of the gaps. It’s important to note that this is NOT a forecast for this current year’s Christmas, but rather an analysis of past data. The resultant map can be seen on the next page. As you may have expected, the highest percentages of Christmases that were “white” were located in the higher elevations of the Adirondacks as well as north central and northeastern Vermont, where percentages exceeded 95 percent. The lowest values were located in the southern Champlain Valley and the Champlain Islands, were percentages fell under 65 percent. A few selected individual data points are also shown below the map, including Burlington, where the percentage is 74 percent. Also shown on this page are some more records for Christmas Day at Burlington, including the greatest observed snow depth, which was 32” on December 25th, 1970.
VOLUME II, ISSUE IV PAGE 5
…Continued from Page 4
Map depicting the percentage of Christmases that were “white”, as defined as 1” of snow depth or greater at 7 AM December 25th. National Weather Service Cooperative Observer stations were used in the analysis if the site had at least
a 10-year period of record between 1884 – 2015. Values were then interpolated.
Location Percentage
Burlington, VT 74 %
Montpelier, VT 78 %
Rutland, VT 65 %
Plainfield, VT 86 %
Canton, NY 74 %
Plattsburgh, NY 68 %
Malone, NY 78 %
http://www.erh.noaa.gov/iln/research/dec2011clouds/uidaho_lifting-orographic.jpg
VOLUME II, ISSUE IV PAGE 6
Winter Mixed Precipitation Across the North Country
-Kimberly McMahon & Michael Muccilli
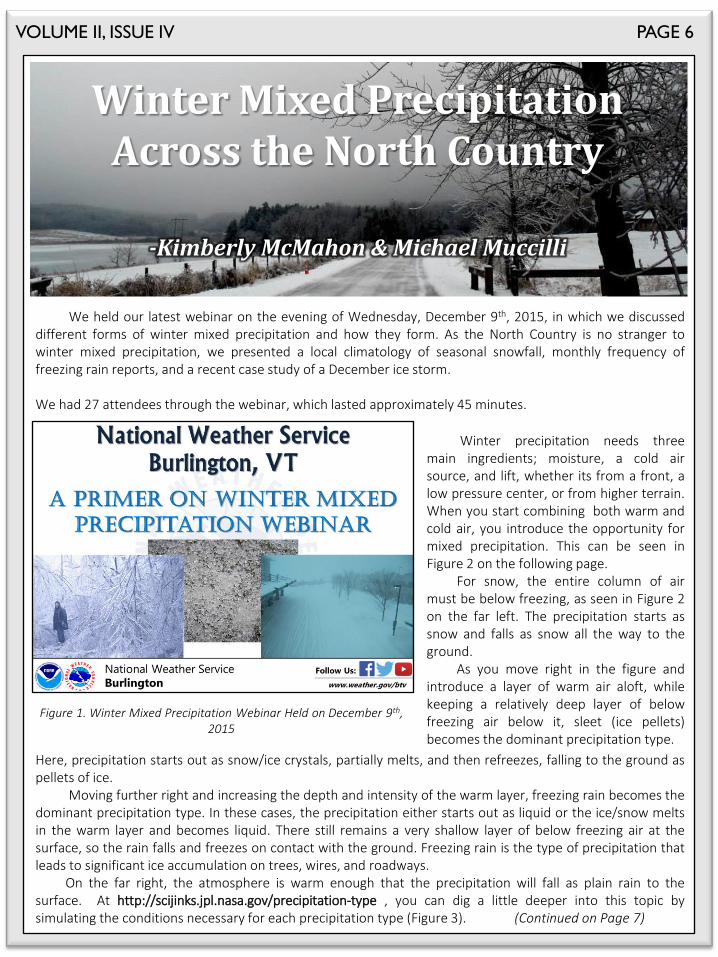
We held our latest webinar on the evening of Wednesday, December 9th, 2015, in which we discussed different forms of winter mixed precipitation and how they form. As the North Country is no stranger to winter mixed precipitation, we presented a local climatology of seasonal snowfall, monthly frequency of freezing rain reports, and a recent case study of a December ice storm. We had 27 attendees through the webinar, which lasted approximately 45 minutes.
Figure 1. Winter Mixed Precipitation Webinar Held on December 9th, 2015
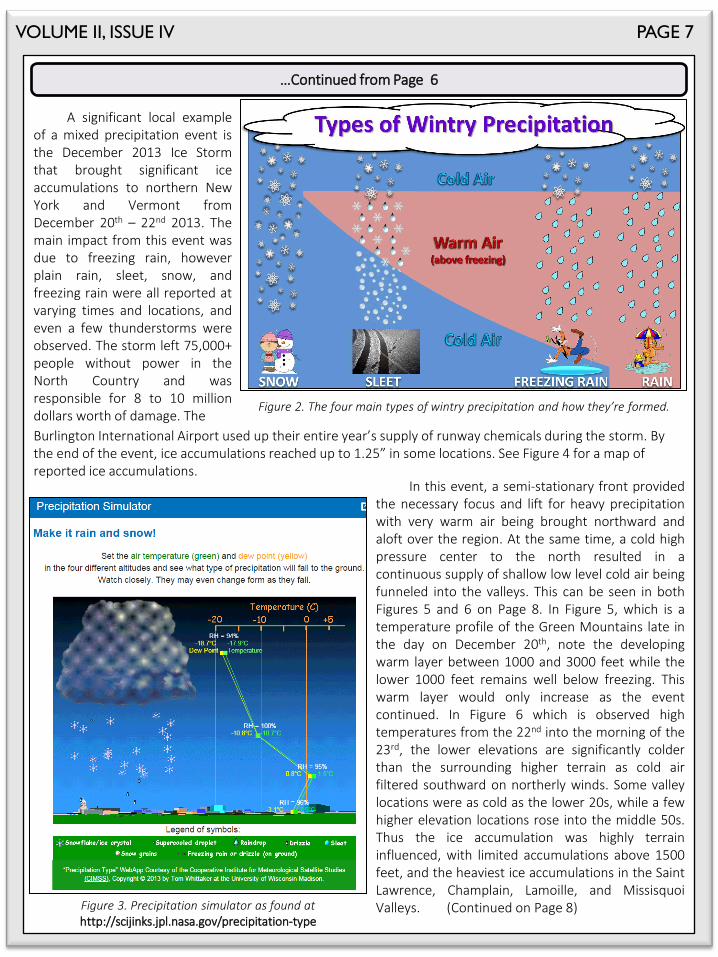
Winter precipitation needs three main ingredients; moisture, a cold air source, and lift, whether its from a front, a low pressure center, or from higher terrain. When you start combining both warm and cold air, you introduce the opportunity for mixed precipitation. This can be seen in Figure 2 on the following page. For snow, the entire column of air must be below freezing, as seen in Figure 2 on the far left. The precipitation starts as snow and falls as snow all the way to the ground. As you move right in the figure and introduce a layer of warm air aloft, while keeping a relatively deep layer of below freezing air below it, sleet (ice pellets) becomes the dominant precipitation type. Here, precipitation starts out as snow/ice crystals, partially melts, and then refreezes, falling to the ground as
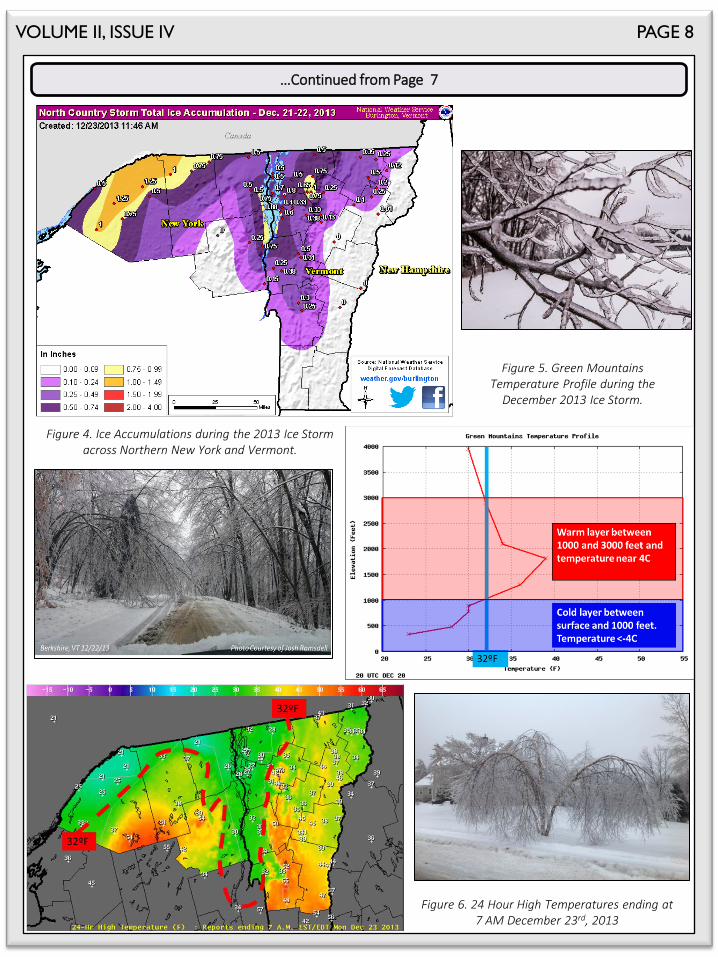
pellets of ice. Moving further right and increasing the depth and intensity of the warm layer, freezing rain becomes the dominant precipitation type. In these cases, the precipitation either starts out as liquid or the ice/snow melts in the warm layer and becomes liquid. There still remains a very shallow layer of below freezing air at the surface, so the rain falls and freezes on contact with the ground. Freezing rain is the type of precipitation that leads to significant ice accumulation on trees, wires, and roadways. On the far right, the atmosphere is warm enough that the precipitation will fall as plain rain to the surface. At http://scijinks.jpl.nasa.gov/precipitation-type , you can dig a little deeper into this topic by simulating the conditions necessary for each precipitation type (Figure 3). (Continued on Page 7)
http://scijinks.jpl.nasa.gov/precipitation-type
VOLUME II, ISSUE IV PAGE 7
…Continued from Page 6
Figure 2. The four main types of wintry precipitation and how they’re formed.
Figure 3. Precipitation simulator as found at http://scijinks.jpl.nasa.gov/precipitation-type
A significant local example of a mixed precipitation event is the December 2013 Ice Storm that brought significant ice accumulations to northern New York and Vermont from December 20th – 22nd 2013. The main impact from this event was due to freezing rain, however plain rain, sleet, snow, and freezing rain were all reported at varying times and locations, and even a few thunderstorms were observed. The storm left 75,000+ people without power in the North Country and was responsible for 8 to 10 million dollars worth of damage. The
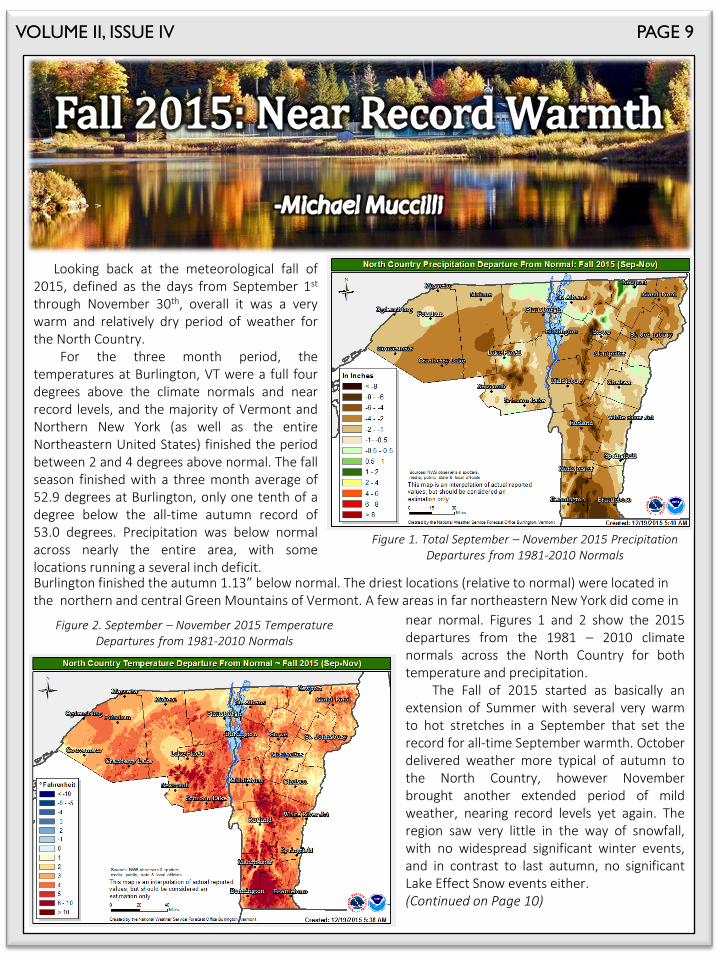
Burlington International Airport used up their entire year’s supply of runway chemicals during the storm. By the end of the event, ice accumulations reached up to 1.25” in some locations. See Figure 4 for a map of reported ice accumulations.
In this event, a semi-stationary front provided the necessary focus and lift for heavy precipitation with very warm air being brought northward and aloft over the region. At the same time, a cold high pressure center to the north resulted in a continuous supply of shallow low level cold air being funneled into the valleys. This can be seen in both Figures 5 and 6 on Page 8. In Figure 5, which is a temperature profile of the Green Mountains late in the day on December 20th, note the developing warm layer between 1000 and 3000 feet while the lower 1000 feet remains well below freezing. This warm layer would only increase as the event continued. In Figure 6 which is observed high temperatures from the 22nd into the morning of the 23rd, the lower elevations are significantly colder than the surrounding higher terrain as cold air filtered southward on northerly winds. Some valley locations were as cold as the lower 20s, while a few higher elevation locations rose into the middle 50s. Thus the ice accumulation was highly terrain influenced, with limited accumulations above 1500 feet, and the heaviest ice accumulations in the Saint Lawrence, Champlain, Lamoille, and Missisquoi Valleys. (Continued on Page 8)
http://www.erh.noaa.gov/iln/research/dec2011clouds/uidaho_lifting-orographic.jpg
VOLUME II, ISSUE IV PAGE 8
…Continued from Page 7
Figure 5. Green Mountains Temperature Profile during the
December 2013 Ice Storm.
Figure 4. Ice Accumulations during the 2013 Ice Storm across Northern New York and Vermont.
Figure 6. 24 Hour High Temperatures ending at 7 AM December 23rd, 2013
VOLUME II, ISSUE IV PAGE 9
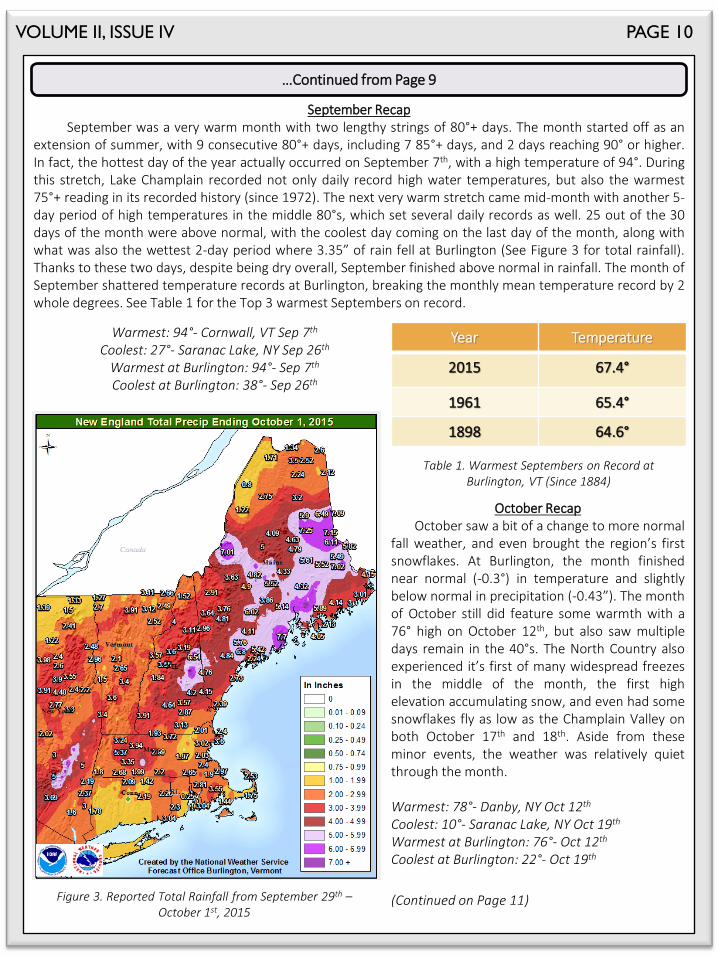
Figure 1. Total September – November 2015 Precipitation Departures from 1981-2010 Normals
Figure 2. September – November 2015 Temperature Departures from 1981-2010 Normals
Looking back at the meteorological fall of 2015, defined as the days from September 1st through November 30th, overall it was a very warm and relatively dry period of weather for the North Country. For the three month period, the temperatures at Burlington, VT were a full four degrees above the climate normals and near record levels, and the majority of Vermont and Northern New York (as well as the entire Northeastern United States) finished the period between 2 and 4 degrees above normal. The fall season finished with a three month average of 52.9 degrees at Burlington, only one tenth of a degree below the all-time autumn record of 53.0 degrees. Precipitation was below normal across nearly the entire area, with some locations running a several inch deficit.
near normal. Figures 1 and 2 show the 2015 departures from the 1981 – 2010 climate normals across the North Country for both temperature and precipitation. The Fall of 2015 started as basically an extension of Summer with several very warm to hot stretches in a September that set the record for all-time September warmth. October delivered weather more typical of autumn to the North Country, however November brought another extended period of mild weather, nearing record levels yet again. The region saw very little in the way of snowfall, with no widespread significant winter events, and in contrast to last autumn, no significant Lake Effect Snow events either. (Continued on Page 10)
Burlington finished the autumn 1.13” below normal. The driest locations (relative to normal) were located in the northern and central Green Mountains of Vermont. A few areas in far northeastern New York did come in
VOLUME II, ISSUE IV PAGE 10
…Continued from Page 9
Table 1. Warmest Septembers on Record at Burlington, VT (Since 1884)
Figure 3. Reported Total Rainfall from September 29th – October 1st, 2015
September Recap September was a very warm month with two lengthy strings of 80°+ days. The month started off as an extension of summer, with 9 consecutive 80°+ days, including 7 85°+ days, and 2 days reaching 90° or higher. In fact, the hottest day of the year actually occurred on September 7th, with a high temperature of 94°. During this stretch, Lake Champlain recorded not only daily record high water temperatures, but also the warmest 75°+ reading in its recorded history (since 1972). The next very warm stretch came mid-month with another 5-day period of high temperatures in the middle 80°s, which set several daily records as well. 25 out of the 30 days of the month were above normal, with the coolest day coming on the last day of the month, along with what was also the wettest 2-day period where 3.35” of rain fell at Burlington (See Figure 3 for total rainfall). Thanks to these two days, despite being dry overall, September finished above normal in rainfall. The month of September shattered temperature records at Burlington, breaking the monthly mean temperature record by 2 whole degrees. See Table 1 for the Top 3 warmest Septembers on record.
October Recap October saw a bit of a change to more normal fall weather, and even brought the region’s first snowflakes. At Burlington, the month finished near normal (-0.3°) in temperature and slightly below normal in precipitation (-0.43”). The month of October still did feature some warmth with a 76° high on October 12th, but also saw multiple days remain in the 40°s. The North Country also experienced it’s first of many widespread freezes in the middle of the month, the first high elevation accumulating snow, and even had some snowflakes fly as low as the Champlain Valley on both October 17th and 18th. Aside from these minor events, the weather was relatively quiet through the month. Warmest: 78°- Danby, NY Oct 12th Coolest: 10°- Saranac Lake, NY Oct 19th Warmest at Burlington: 76°- Oct 12th Coolest at Burlington: 22°- Oct 19th
(Continued on Page 11)
Year Temperature
2015 67.4°
1961 65.4°
1898 64.6°
Warmest: 94°- Cornwall, VT Sep 7th Coolest: 27°- Saranac Lake, NY Sep 26th
Warmest at Burlington: 94°- Sep 7th Coolest at Burlington: 38°- Sep 26th
https://scontent-a-ord.xx.fbcdn.net/hphotos-xaf1/v/t1.0-9/1601016_10204022102285305_9119415558140813544_n.jpg?
oh=096d26ea582b3d125e6510e02d3ee7d3&oe=5511F472
VOLUME II, ISSUE IV PAGE 11
…Continued from Page 10
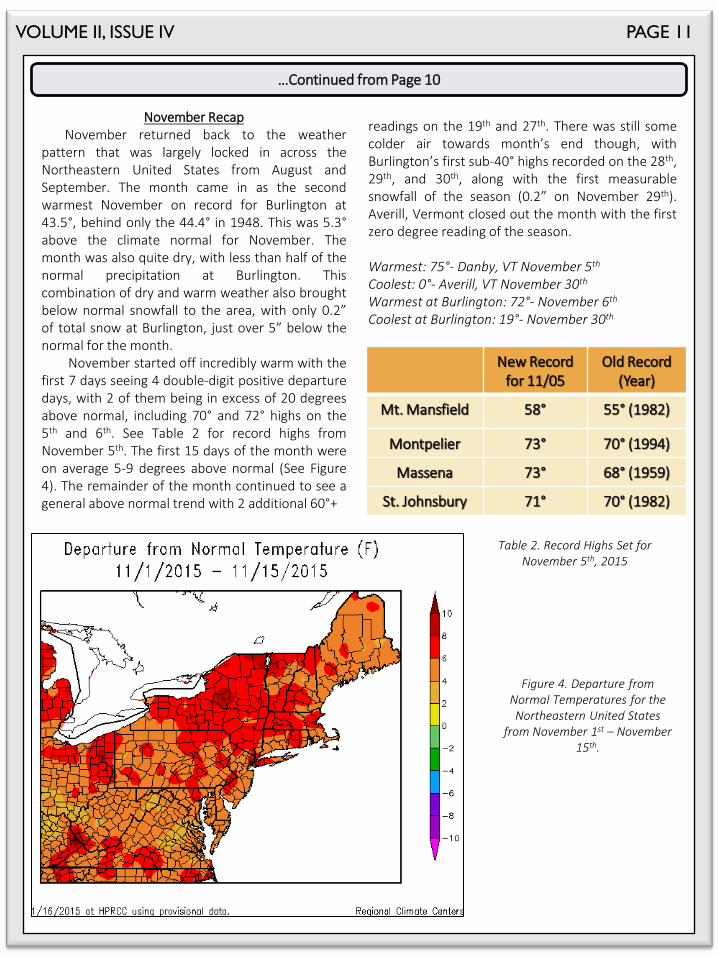
November Recap November returned back to the weather pattern that was largely locked in across the Northeastern United States from August and September. The month came in as the second warmest November on record for Burlington at 43.5°, behind only the 44.4° in 1948. This was 5.3° above the climate normal for November. The month was also quite dry, with less than half of the normal precipitation at Burlington. This combination of dry and warm weather also brought below normal snowfall to the area, with only 0.2” of total snow at Burlington, just over 5” below the normal for the month. November started off incredibly warm with the first 7 days seeing 4 double-digit positive departure days, with 2 of them being in excess of 20 degrees above normal, including 70° and 72° highs on the 5th and 6th. See Table 2 for record highs from November 5th. The first 15 days of the month were on average 5-9 degrees above normal (See Figure 4). The remainder of the month continued to see a general above normal trend with 2 additional 60°+
New Record for 11/05
Old Record (Year)
Mt. Mansfield 58° 55° (1982)
Montpelier 73° 70° (1994)
Massena 73° 68° (1959)
St. Johnsbury 71° 70° (1982)
Table 2. Record Highs Set for November 5th, 2015
readings on the 19th and 27th. There was still some colder air towards month’s end though, with Burlington’s first sub-40° highs recorded on the 28th, 29th, and 30th, along with the first measurable snowfall of the season (0.2” on November 29th). Averill, Vermont closed out the month with the first zero degree reading of the season. Warmest: 75°- Danby, VT November 5th Coolest: 0°- Averill, VT November 30th Warmest at Burlington: 72°- November 6th Coolest at Burlington: 19°- November 30th
Figure 4. Departure from Normal Temperatures for the Northeastern United States
from November 1st – November 15th.
VOLUME II, ISSUE IV PAGE 12
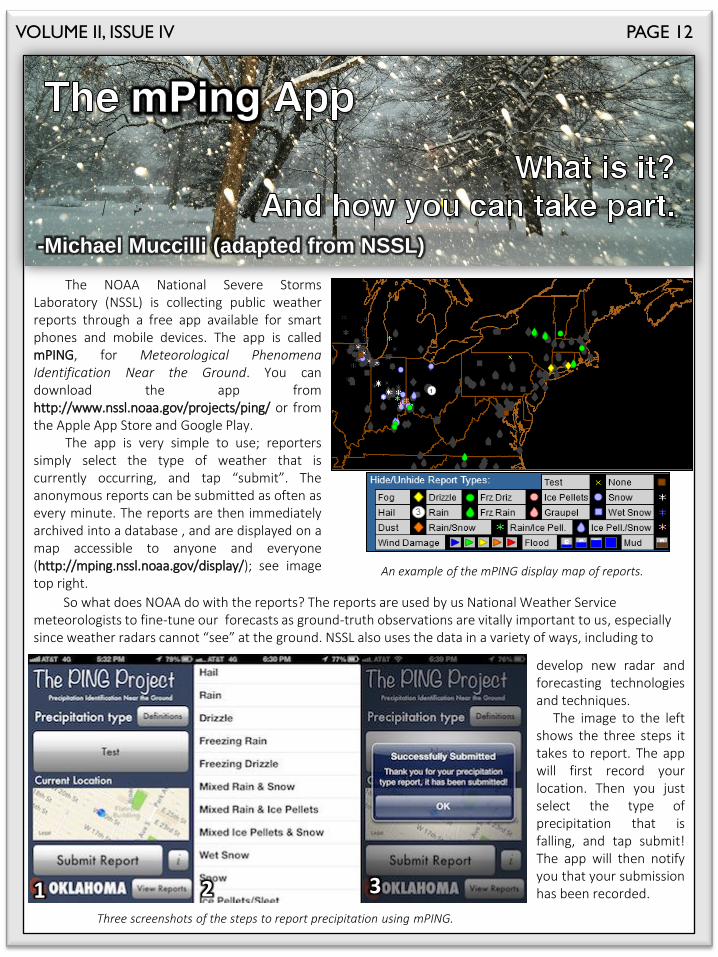
-Michael Muccilli (adapted from NSSL)
An example of the mPING display map of reports.
The NOAA National Severe Storms Laboratory (NSSL) is collecting public weather reports through a free app available for smart phones and mobile devices. The app is called mPING, for Meteorological Phenomena Identification Near the Ground. You can download the app from http://www.nssl.noaa.gov/projects/ping/ or from the Apple App Store and Google Play. The app is very simple to use; reporters simply select the type of weather that is currently occurring, and tap “submit”. The anonymous reports can be submitted as often as every minute. The reports are then immediately archived into a database , and are displayed on a map accessible to anyone and everyone (http://mping.nssl.noaa.gov/display/); see image top right.
develop new radar and forecasting technologies and techniques. The image to the left shows the three steps it takes to report. The app will first record your location. Then you just select the type of precipitation that is falling, and tap submit! The app will then notify you that your submission has been recorded.
Three screenshots of the steps to report precipitation using mPING.
So what does NOAA do with the reports? The reports are used by us National Weather Service meteorologists to fine-tune our forecasts as ground-truth observations are vitally important to us, especially since weather radars cannot “see” at the ground. NSSL also uses the data in a variety of ways, including to
1 2 3
National Weather Service Burlington, VT Burlington International Airport
1200 Airport Drive South Burlington, VT 05403
Phone: (802) 862 2475 www.weather.gov/btv
Email: [email protected]
The Four Seasons Volume II, Issue IV
Contributors:
Andrew Loconto, Meteorologist Kimberly McMahon, Meteorologist
Michael Muccilli, Meteorologist
Editors: Kimberly McMahon, Meteorologist
Michael Muccilli, Meteorologist
Follow us on Facebook and Twitter!
US National Weather Service Burlington, VT
@NWSBurlington
Please report snowfall, flooding, damaging winds, hail, and tornadoes. When doing so, please try, to the best of your ability, to measure snowfall, estimate hail size, and be specific as to what damage occurred and when. We
also love pictures!
For reports, please call: (802) 863-4279
Or visit: http://www.weather.gov/btv/stormreport