Embed Size (px)
Citation preview

doi.org/10.26434/chemrxiv.11734740.v1
The Formation of the Solid-/Liquid Electrolyte Interphase (SLEI) onNASICON-Type Glass Ceramics and LiPONMartin R. Busche, Thomas Leichtweiss, Carsten Fiedler, Thomas Drossel, Matthias Geiss, Manuel Weiß,Achim Kronenberger, Dominik A. Weber, Jürgen Janek
Submitted date: 27/01/2020 • Posted date: 28/01/2020Licence: CC BY-NC-ND 4.0Citation information: Busche, Martin R.; Leichtweiss, Thomas; Fiedler, Carsten; Drossel, Thomas; Geiss,Matthias; Weiß, Manuel; et al. (2020): The Formation of the Solid-/Liquid Electrolyte Interphase (SLEI) onNASICON-Type Glass Ceramics and LiPON. ChemRxiv. Preprint.https://doi.org/10.26434/chemrxiv.11734740.v1
Most electrochemical energy storages (battery cells) consist of solid electrodes separated by a liquidelectrolyte (LE). If electrode materials are – at least partially – soluble in the electrolyte, detrimental masstransport between both electrodes (electrode cross-talk) occurs. The shuttle mechanism in lithium-sulfurbatteries or leaching of Mn in high voltage cathode materials are important examples. Implementing a solidelectrolyte (SE) membrane between the electrodes is a comprehensible approach to suppress undesiredmass transport but additional resistances arise due to charge transport across the SE and charge transferthrough the solid/liquid electrolyte interfaces. The latter contribution is often overlooked as its determination ischallenging, however, these interface properties are crucial for practical application. In previous work aresistive solid-/liquid-electrolyte interphase “SLEI” was found at the interface between the SE lithiumaluminum germanium phosphate (LAGP) in contact with a liquid ether-based electrolyte. Here we aim fordeeper insight into this interphase formation, referring to a lithium ion conducting glass ceramic(NASICON-type) and the commonly used thin film ion conductor “LiPON” (lithium phosphorous oxide nitride).The growth of the SLEI is monitored by a combination of electrochemical characterization, XPS (x-rayphotoelectron spectroscopy) and time-of flight secondary ion mass spectrometry (ToF-SIMS).
File list (2)
download fileview on ChemRxivBusche_et_al_Formation.pdf (2.11 MiB)
download fileview on ChemRxivBusche_et_al_Formation_Supplementary.pdf (6.52 MiB)

The formation of the solid-/liquid electrolyte interphase (SLEI)
on NASICON-type glass ceramics and LiPON
Martin R. Buschea, Thomas Leichtweissb, Carsten Fiedlera, Thomas Drossela, Matthias Geissa,b,
Manuel Weissa,b, Achim Kronenbergera, Dominik A. Webera, Jürgen Janeka,b*
a) Institute of Physical Chemistry, Justus-Liebig-University Giessen, Heinrich-Buff-Ring
17, D-35392 Giessen, Germany.
b) Center for Materials Research (LaMa), Justus-Liebig-University Giessen, Heinrich-
Buff-Ring 16, D-35392 Giessen, Germany.
* Corresponding author: [email protected]
Abstract
Most electrochemical energy storages (battery cells) consist of solid electrodes separated by a liquid
electrolyte (LE). If electrode materials are – at least partially – soluble in the electrolyte, detrimental
mass transport between both electrodes (electrode cross-talk) occurs. The shuttle mechanism in
lithium-sulfur batteries or leaching of Mn in high voltage cathode materials are important examples.
Implementing a solid electrolyte (SE) membrane between the electrodes is a comprehensible
approach to suppress undesired mass transport but additional resistances arise due to charge
transport across the SE and charge transfer through the solid/liquid electrolyte interfaces. The latter
contribution is often overlooked as its determination is challenging, however, these interface
properties are crucial for practical application. In previous work a resistive solid-/liquid-electrolyte
interphase “SLEI” was found at the interface between the SE lithium aluminum germanium
phosphate (LAGP) in contact with a liquid ether-based electrolyte. Here we aim for deeper insight
into this interphase formation, referring to a lithium ion conducting glass ceramic (NASICON-type)
and the commonly used thin film ion conductor “LiPON” (lithium phosphorous oxide nitride). The
growth of the SLEI is monitored by a combination of electrochemical characterization, XPS (x-ray
photoelectron spectroscopy) and time-of flight secondary ion mass spectrometry (ToF-SIMS).
1. Introduction
The vast majority of currently commercially available lithium ion batteries (LIBs) and next generation
systems such as Li-S8 and Li-O2 are based on liquid electrolytes (LE) due to the high bulk conductivity
and because LE easily wet and fill the porous electrodes. These features enable fast bulk and interface
kinetics of Li-ion exchange required for high rate capability. Otherwise, in any LE-based battery system,
secondary reactions are taking place apart from the desired Li+-ion exchange that can be detrimental
for cycle life and rate capability. This is especially the case if active material dissolves and diffuses from
the cathode to the anode, creating a chemical short circuit or cross-talk, most particularly known as
the polysulfide shuttle effect taking place in LE-based lithium-sulfur secondary batteries (LSSB) 1–7.
Shuttle and active mass migration effects occur as well in LIBs8 and redox catalyzed Li-O2-cells9. Recent
investigations prove that the migration of electrolyte decomposition products in high voltage lithium-

ion-batteries leads to strong capacity fading8. Main approaches to cure the parasitic shuttle shown for
- but not limited to - LLSB are: (1) In situ established SE interphase (SEI) formed via reaction of lithium
and electrolyte compounds or additives (e.g. LiNO3) 10 or (2) ex situ formed passivation layer (artificial
SEI), using purely ion-conducting polymers11 or inorganic coatings12,13 are applied for anode protection.
(3) The polysulfide diffusion out of the cathode is delayed by a cathode nanoscale architecture or
sealing measures.2,14–18 (4) “Solidification” of the Li-S8 cell exclusively using polymers19–22 or solid
electrolytes23,24 (SE) circumvents the dissolution of polysulfides but suffers from slow transport kinetics
of Li-ions inside solid lithium ion conductors and across the interfaces. Especially the low rate capability
of such systems limit their practical application as it is – beyond the energy density – the second crucial
LIB property to enable energy storage for the electrification.
Most recent approaches refer to hybrid cells (anode/LEa/SE/LEc/cathode), comprising a LE in contact
to the electrodes and a SE as a lithium ion-selective barrier. The SE is separating anolyte (LEa) and
catholyte (LEc) to suppress the chemical short-circuit as well as to reduce the danger of dendrite growth
and electronic short-circuit25–38. Hybrid cells can be tailored to (1) allow fast kinetics of the LE/porous
electrode interfaces as well as (2) apply thin solid electrolyte membranes to limit the Li-ion path length
through the solid phase with lower conductivity. As a unique advantage, both LEs can be optimized
separately for the anode and the cathode. Few approaches on hybrid next generation cells have been
published: Films of Lithium-ion exchanged Nafion25 (a sulfonated tetrafluoroethylene-
based fluoropolymer-copolymer) or Nafion-coated polymeric separators39 were used as Li-ion
selective membranes. Recently, Zhang et al. reported on an Al2O3-coated polymeric separator32 and Li
et al. used V2O5 as a polysulfide barrier33. Vizintin et al. showed promising cycle life of a hybrid LSSB
with an inorganic ceramic membrane35. The application of glass ceramics of the NASICON type as
membranes is increasingly studied over the last three years27,29,34–38,40. Most recently, our group
presented a novel approach to improve redox mediated Li-O2 cells with an ion-selective membrane41.
Regardless of the active material in the electrodes, an ion-selective membrane for any hybrid cell has
to meet the following demands, addressing its contribution to cell resistance, lifetime and weight. (1)
A fast conduction of the mobile ions with a transference number t+ approaching unity, an adequate
electrochemical stability window (2) and a high chemical stability in the LE environment (3) are
imperatives. This includes the solvents, the conducting salts and additives as well as the soluble
reduction species of the active material or secondary products. Linked to the fact that the conductivity
of solid electrolytes is only rarely reaching the conductivity of LEs24,42,43 and that the membrane should
add only minimum weight to the cell system to keep its energy density40, the SE must not exceed
thicknesses in the order of a few µm (4). The membrane has to be dense and mechanically rigid to
obtain a functional ion-selective barrier (5). To sum up, the ideal system will comprise a fast
conducting, thin and dense (electro-) chemically stable membrane.
In the hybrid cell setup, the implementation of a membrane obviously leads to two additional
interfaces between the SE and the LE40. Across these interfaces, the ion-conduction-mechanism
changes from the diffusion of solvated ions in the LE to the hopping ion transport mechanism present
in the solid40,41. For each of these transport processes, a contribution to the cell impedance and the
respective activation energy can be assigned and measured44–49. Beyond this, at the very interface,
desolvation of the ions takes place and the ions have to penetrate the SE, moving through the phase
boundary as schematically depicted in Figure 1. Recently, we revealed the formation of a solid-liquid
electrolyte interphase (SLEI) that arises when a solid ion conductor (LAGP, Li1.3Al0.3Ge1.7(PO4)3, Lithium
Aluminum Germanium Phosphate) is in contact to the most commonly used LE for LSSB, LiTFSI (lithium
(bis)trifluorosulfonylimide, LiN(SO2CF3)2) in a binary solvent mixture of 1,3-dioxolane (DOL) and 1,2-
dimethoxyethane (DME)40. The SLEI grows within the first 100 h of contact and adds a resistance
contribution of ~ 100 Ω·cm2 when reaching steady state40. Water impurities in the LE aggravate the
effect by a factor of 1.5. The phenomenon was extensively studied by means of DC polarization
technique by Schleutker et al.50. The authors identified analogous growth of an SLEI in carbonate-based
LE (EC:DMC) with LiPF6 as a conducting salt when combined with LLZTO garnet-type SE. Unfortunately
but obviously, the resistance of the solid-/liquid-electrolyte (SE/LE) interface or interphase (“SLEI”)
does not diminish with the reduction of the SE thickness but may sensitively depend on the effective
area and chemical properties of the interface40. Therefore, beyond the chemical composition of SE and
LE, the morphological properties of the membrane as well as the wetting ability, conductivity and
viscosity of the LE have to be focused and optimized to find an ideal SE/LE-combination to circumvent
a possible showstopper for hybrid cell setups.
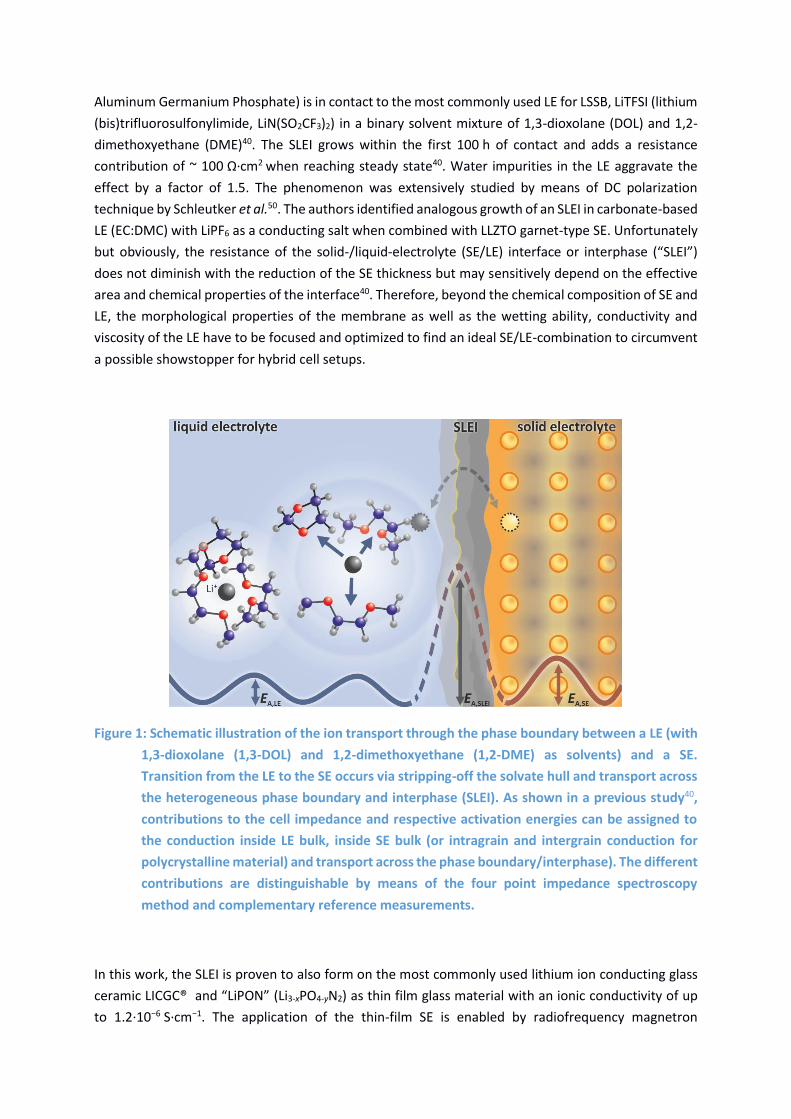
Figure 1: Schematic illustration of the ion transport through the phase boundary between a LE (with
1,3-dioxolane (1,3-DOL) and 1,2-dimethoxyethane (1,2-DME) as solvents) and a SE.
Transition from the LE to the SE occurs via stripping-off the solvate hull and transport across
the heterogeneous phase boundary and interphase (SLEI). As shown in a previous study40,
contributions to the cell impedance and respective activation energies can be assigned to
the conduction inside LE bulk, inside SE bulk (or intragrain and intergrain conduction for
polycrystalline material) and transport across the phase boundary/interphase). The different
contributions are distinguishable by means of the four point impedance spectroscopy
method and complementary reference measurements.
In this work, the SLEI is proven to also form on the most commonly used lithium ion conducting glass
ceramic LICGC® and “LiPON” (Li3-xPO4-yN2) as thin film glass material with an ionic conductivity of up
to 1.2·10−6 S·cm−1. The application of the thin-film SE is enabled by radiofrequency magnetron
sputtering on porous alumina substrates as supporting spine enabling contact of SE thin-film and LE
from both sides. The four-point measurement method introduced in [40] is used to separately analyze
the resistance contribution of the SLEI with special focus on the influence of the electrolyte solvents
(single solvents DOL and DME and binary combination DOL/DME). As the surface properties of these
electrolytes are better controlled than for the LAGP samples, we aim at better-resolved depth profiling
to unravel the structure of the SLEI by means of X-ray photoelectron spectrometry (XPS) and time-of-
flight secondary ion mass spectrometry (ToF-SIMS). Furthermore, the impact of interface topology is
investigated by complementary atomic force microscopy (AFM) measurements. As a result, the impact
of solvents, conducting salt as well as SE composition and morphology are evaluated and a schematic
layer model of the SLEI composition is presented.
2. Experimental
a) Solid electrolyte preparation and basic analysis
LiPON thin films were sputtered on sapphire glass substrates for reference measurements and on
porous alumina anodic oxidized (AAO) discs (13 mm diameter, 100 µm pores, Anodisc inorganic filter,
Whatman plc, UK) for SLEI analysis. Radiofrequency magnetron sputtering (RF-MS) was carried out
inside two different homemade reaction chambers, each under pure N2 atmosphere. Chamber one
(C1) was developed by SURFACE systems + technology, Germany with a RF-MS system from Gencoa
Ltd. placed below the samples and connected to a glovebox with Ar-atmosphere (O2 and H2O below
the detection limit of 1 ppm). Using transfer modules, all samples created in this chamber could be
post-processed without any contact to laboratory atmosphere. For morphology comparison and
increased output, additional samples were created in a homemade Chamber two (C2) with a RF-MS
system Gencoa Ltd. above the samples. As C2 was equipped with a loadlock system without glovebox,
a short contact with Lab Atmosphere could not be omitted. In order to mitigate that influence, these
samples were purged with Ar and sealed under Ar atmosphere immediately after deposition. Both
systems made use of Li3PO4 targets (diameter 4 inch (C1), 3 inch (C2), Kurt J. Lesker Comp., USA) and a
radio frequency of 13,56 Mhz. The LiPON samples presented in this work were produced using the
following parameter-sets: (C1) RF power 200 W, bias: 50 V, N2 partial pressure: 5·10−3 mbar (C2) RF
power: 100 W, bias: 0V, N2 partial pressure: 1.5·10−3 mbar. A sputter time of 450 min (120 min) in C1
(C2) led to a LiPON thickness of 4.5 µm (2.5 µm).
Lithium Ion Conducting Glass Ceramic (LICGC®) was purchased from Ohara GmbH, Germany as square
plates with a thickness of 150 µm. These were cut into circular discs with a diameter of 12 mm, rinsed
with methylene chloride and dried in a glass vacuum oven for 12 h at 170 °C (B.Ü.C.H.I., Switzerland)
before post processing in gloveboxes (MBraun, Germany) under Ar atmosphere (O2 and H2O below the
detection limit of 1 ppm).
Structural characterization of the glass-ceramic samples was performed by X-ray diffraction (XRD),
using an Empyrean powder diffractometer (PANalytical, Netherlands) with Cu Kα radiation (λ1 =
154.056 pm, λ2 = 154.539 pm, I(λ2 / λ1 = 0.5) in Bragg-Brentano θ-θ geometry and a PIXcel3D area
detector with 255 measuring channels. Samples were pulverized, dispersed in ethanol and placed on
(911)-oriented Silicon zero background holders. The program package FULLPROF SUITE (version

September 2018)51 was used for structural refinements. Reflection profiles were fitted with a pseudo
Voigt function describing the background by linear interpolation. LiPON thermal stability was
investigated up to a temperature of 500 °C inside a XRK 900 reaction chamber (Anton Paar, Austria) in
a flowing He atmosphere.
Topology information on the sample surface was obtained by means of AFM with a Nanosurf LensAFM
and Easyscan 2 controller (Nanosurf AG, Switzerland) on a Halcyonics vibration isolating table
(Accurion GmbH, Germany). LiPON samples were analyzed without further treatment and LICGC®
sample was rinsed with isopropyl alcohol and cleaned with a lint-free cloth. Data processing was
performed with the Gwyddion software suite (version 2.51).
The impedance behavior of the sole SEs was investigated by EIS, using different blocking electrode
setups deposited via physical vapor deposition inside a home-made reaction chamber: For the LiPON
thin-films, two complementary electrode geometries were chosen: For lateral measurements, two
rectangular electrodes were placed on top of the LiPON thin film as shown in Fig. SI 6. For axial
measurements, a line of Au electrodes was deposited on top of the substrate before LiPON deposition.
After sputter deposition, a second line of Au was placed perpendicularly to the first one (Fig. SI 8). For
the LICGC® SE, Au films with a diameter of 10 mm were deposited on opposite sites. All EIS
measurements were carried out using an Alpha A high-performance frequency analyzer with a four-
wire impedance test interface (Novocontrol, Germany). A perturbation amplitude of 10 mV and a
frequency range of 20 MHz to 100 mHz was chosen. Impedance measurements with temperature
variation were carried out in a thermostat/cryostat (Novocontrol, Germany) between -40 °C and 100 °C
with a temperature accuracy of ± 0.3 °C. In order to identify the electronic partial resistance, D.C.
polarization measurements were performed using a homemade four-point set-up with a Keithley sub-
femto-Ampère source-meter with pre-amplifier as voltage source and current-meter and a Keithley
6517a high-resistance-meter for potential probing. A climatic chamber (Binder) and an additional
faraday cage (Fig. SI 10) were used to suppress environmental effects. Herein, current was recorded
for 24 h to 72 h while applying D.C. potentials of 0.5 V to 3.0 V.
b) 4 point impedance spectroscopy setup and analysis (4P EIS)
Proper identification and analysis of the resistance contribution of the solid-liquid electrolyte
interphase (SLEI) was carried out with a homemade cell setup (Figure SI 15) comprising two cylindrical
compartments for the LE separated by the SE membrane. To ensure tightness of the setup, the cell
body components were produced out of polyether ether ketone (PEEK) sealed with ethylene propylene
diene rubber (EPDM) gaskets. Prior to build-up, the brittle SE membranes were hot-sealed with
polyethylene rings in a homemade hot press (Figure SI 16) to inhibit LE by-pass. The electrode setup
comprised 2 circular polished working electrodes and 2 point-like reference electrodes, all made of
lithium metal (Chemetall GmbH, Germany) pressed into voids of the cell body. Lithium electrode
contacting was performed via stainless steel feedthroughs, also sealed with EPDM gaskets. LE solutions
of different concentrations of lithium bis(trifluoromethanesulfonyl)imide (LiTFSI, LiN(SO2CF3)2, Ionic
Liquid Technologies, Germany) were prepared: LiTFSI was dried at 170 °C for 24h under vacuum inside
a glass oven (B.Ü.C.H.I., Switzerland) and stored under Ar atmosphere. The solvents 1,3-dioxolane
(DOL, C3H6O2) and 1,2-dimethoxyethane (DME, C4H10O2, both Sigma-Aldrich) were dried under reflux
in Ar atmosphere inside a homemade Schlenk-line and stored over molecular sieve. By distillation
process, the 75 ppm butylated hydroxytoluene (BHT) redox inhibitor was removed from DOL. Water

content of all LEs used was below 5 ppm (by weight) determined by Karl-Fischer titration (831 KF
coulometer, Metrohm, Germany). LiTFSI was weighed and dissolved into either the pure solvents or a
1:1 (v/v) mixture of the solvents by stirring longer than 48 h. LE solutions were simultaneously filled
bubble-free into the two compartments (0.7 mL) to keep the geometry of the cylindrical cell setup with
a cross-section of 1.13 cm2 of every interface and avoid any mechanical strain on the membranes.
Environmental conditions of the long-term measurements (up to 170 h) were stabilized using a Binder
climatic chamber. For evaluation of the tightness and electrical correctness of the setup by means of
complementary UV-Vis and EIS analysis the authors refer to the respective section in the SI and Figures
SI 17-20. All impedance data was analyzed using the RelaxIS 3 software (rhd instruments, Germany) on
the basis of a least-squares approximation. Additionally, the distribution of relaxation times (DRT)
technique was used to obtain a deeper insight into the frequency evolution of the spectra. Using a
homemade code based on the Python environment, impedance data was processed according to the
assumptions and routines given in the SI.
c) Ex-situ analysis
The SE samples analyzed in the four point cell were rinsed three times with 100 μl of the respective
solvent DOL, DME or DOL/DME in the glovebox. One half was transferred into the XPS chamber, the
other one into the ToF-SIMS chamber without any contact to Lab atmosphere, using specially designed
transfer modules. XPS analysis was carried out with a Versaprobe II Scanning ESCA Microprobe device
(Physical Electronics PHI, USA) using a monochromatized Al Kα X-ray source (1486.6 eV) with a spot size
of 200 µm and an X-ray emission power of 50 W. Chamber pressure was in the range of 10−8 mbar and
the electron energy analyzer was operated at a constant pass energy of 23.50 eV for XPS detail spectra,
93.9 eV for spectral acquisition during depth profiling and 187.8 eV for survey spectra, respectively. In
order to neutralize charging effects, the samples were flooded with low kinetic energy electrons and
Ar+-ions during data acquisition. Data analysis was performed using CasaXPS software package (Fairley,
N. Casa XPS Version 2.3.17dev6.3a). Binding energies were referenced to the C 1s line with a binding
energy of 284.8 eV. Detail spectra were modelled with mixed Gaussian-Lorentzian functions using a
fixed FWHM for each element and a fixed area ratio of 2:1 for 2p3/2 and 2p1/2 lines. Depth profiles were
obtained by Ar+-ion sputtering on an area of 2 x 2 mm2 with an acceleration voltage of 500 V and a
current of 0.7 µA. Subsequent elemental quantification was done based on the RSFs provided by the
instrument manufacturer.
ToF-SIMS sample analysis was performed with a ToF-SIMS5 (ionToF, Germany) device equipped with a
bismuth primary ion source (25 keV, (0.3 ± 0.06) pA) and a cesium sputter gun (500 eV, (40.7 ± 0.9) nA).
In order to obtain profiles with high depth resolution and negligible crater wall effects, the analysis
area of 91.1 μm² was centered in the sputter crater (450 μm²). The device was operated in negative
ion mode to omit an incorrect representation of the signal intensity by detector saturation with Li+.
Data analysis was performed with SurfaceLab 6.5 software package (IonToF), normalizing the data by
the total ion current in order to get rid of instrumental fluctuations and allow for comparison between
the different samples. For comparability of the depth profiles, sputter times were referenced to the
sputter current.
3. Results and discussion
a) Basic properties of the solid electrolytes
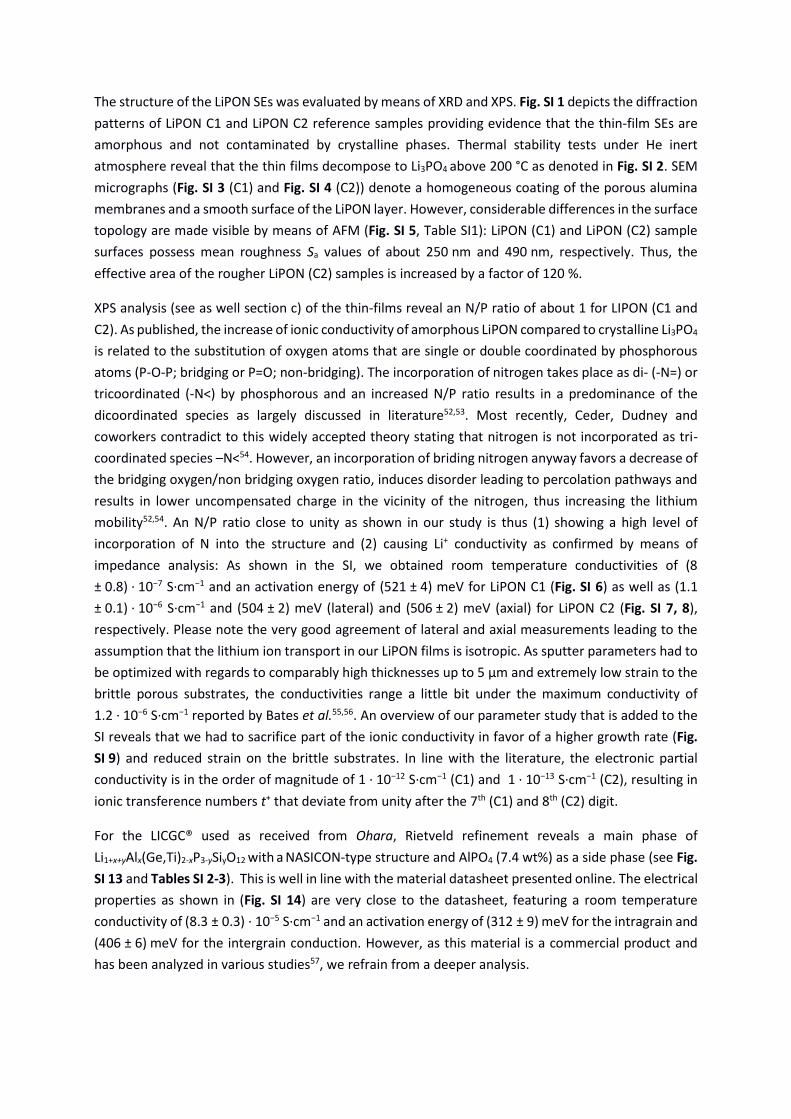
The structure of the LiPON SEs was evaluated by means of XRD and XPS. Fig. SI 1 depicts the diffraction
patterns of LiPON C1 and LiPON C2 reference samples providing evidence that the thin-film SEs are
amorphous and not contaminated by crystalline phases. Thermal stability tests under He inert
atmosphere reveal that the thin films decompose to Li3PO4 above 200 °C as denoted in Fig. SI 2. SEM
micrographs (Fig. SI 3 (C1) and Fig. SI 4 (C2)) denote a homogeneous coating of the porous alumina
membranes and a smooth surface of the LiPON layer. However, considerable differences in the surface
topology are made visible by means of AFM (Fig. SI 5, Table SI1): LiPON (C1) and LiPON (C2) sample
surfaces possess mean roughness Sa values of about 250 nm and 490 nm, respectively. Thus, the
effective area of the rougher LiPON (C2) samples is increased by a factor of 120 %.
XPS analysis (see as well section c) of the thin-films reveal an N/P ratio of about 1 for LIPON (C1 and
C2). As published, the increase of ionic conductivity of amorphous LiPON compared to crystalline Li3PO4
is related to the substitution of oxygen atoms that are single or double coordinated by phosphorous
atoms (P-O-P; bridging or P=O; non-bridging). The incorporation of nitrogen takes place as di- (-N=) or
tricoordinated (-N<) by phosphorous and an increased N/P ratio results in a predominance of the
dicoordinated species as largely discussed in literature52,53. Most recently, Ceder, Dudney and
coworkers contradict to this widely accepted theory stating that nitrogen is not incorporated as tri-
coordinated species –N<54. However, an incorporation of briding nitrogen anyway favors a decrease of
the bridging oxygen/non bridging oxygen ratio, induces disorder leading to percolation pathways and
results in lower uncompensated charge in the vicinity of the nitrogen, thus increasing the lithium
mobility52,54. An N/P ratio close to unity as shown in our study is thus (1) showing a high level of
incorporation of N into the structure and (2) causing Li+ conductivity as confirmed by means of
impedance analysis: As shown in the SI, we obtained room temperature conductivities of (8
± 0.8) · 10−7 S·cm−1 and an activation energy of (521 ± 4) meV for LiPON C1 (Fig. SI 6) as well as (1.1
± 0.1) · 10−6 S·cm−1 and (504 ± 2) meV (lateral) and (506 ± 2) meV (axial) for LiPON C2 (Fig. SI 7, 8),
respectively. Please note the very good agreement of lateral and axial measurements leading to the
assumption that the lithium ion transport in our LiPON films is isotropic. As sputter parameters had to
be optimized with regards to comparably high thicknesses up to 5 µm and extremely low strain to the
brittle porous substrates, the conductivities range a little bit under the maximum conductivity of
1.2 · 10−6 S·cm−1 reported by Bates et al.55,56. An overview of our parameter study that is added to the
SI reveals that we had to sacrifice part of the ionic conductivity in favor of a higher growth rate (Fig.
SI 9) and reduced strain on the brittle substrates. In line with the literature, the electronic partial
conductivity is in the order of magnitude of 1 · 10−12 S·cm−1 (C1) and 1 · 10−13 S·cm−1 (C2), resulting in
ionic transference numbers t+ that deviate from unity after the 7th (C1) and 8th (C2) digit.
For the LICGC® used as received from Ohara, Rietveld refinement reveals a main phase of
Li1+x+yAlx(Ge,Ti)2-xP3-ySiyO12 with a NASICON-type structure and AlPO4 (7.4 wt%) as a side phase (see Fig.
SI 13 and Tables SI 2-3). This is well in line with the material datasheet presented online. The electrical
properties as shown in (Fig. SI 14) are very close to the datasheet, featuring a room temperature
conductivity of (8.3 ± 0.3) · 10−5 S·cm−1 and an activation energy of (312 ± 9) meV for the intragrain and
(406 ± 6) meV for the intergrain conduction. However, as this material is a commercial product and
has been analyzed in various studies57, we refrain from a deeper analysis.

Figure 2: Impedance spectra of symmetrical four-point cells comprising LiPON (C1, a-c) and LCGC®
(d-f) and the LEs 1 M LiTFSI in DOL (a,d), DME (b,e) and DOL/DME (c,f). The Nyquist diagrams
denote the temporal evolution of the solid-liquid electrolyte interphase (SLEI) after 1 h
(black), 24 h (green), 48 h (blue), 72 h (yellow), 96 h (red), 120 h (purple) and 144 h (dark
grey). The SLEI contribution is small for DOL, high for DME and moderate for the binary
mixture 1/1 (v/v) of DOL and DME. The raw data was fitted using the model circuits as shown
in the insets.

b) 4 point impedance results and temporal evolution of the SLEI
Figure 2 denotes the impedance spectra obtained at room temperature after 1 h (black), 24 h (green),
48 h (blue), 72 h (yellow), 96 h (red), 120 h (purple) and 144 h (dark grey) after assembly of the four
point cells for six different SE/LE combinations featuring LiPON (C1) and LICGC® in combination with
DOL, DME and the binary mixture of DOL and DME. The equivalent circuits used for the fit routines are
given as insets in Figure 2 c and f. Beyond an ohmic resistance in the high frequency domain, we
identify two suppressed semicircles as further contributions to the overall spectra for LiPON based
cells. The Nyquist representation of the impedance spectra allows for an unambiguous identification
of the SLEI resistance contribution due to the special 4 point setup: The lithium reference electrodes
suppress the impedance answer of the liquid-electrolyte/working-electrode-interface as further
explained in the SI and the fraction of the LE and SE can be identified by the reference measurements.
Thus, it is possible to assign the components of the impedance spectra as given in Table 1. As expected,
the solvent has a strong impact on the bulk Li+-ion conductivity of the LEs and the respective resistance
contribution RLE (1), ranging at (3.0 ± 0.1) mS·cm−1 for DOL, (7.2 ± 0.1) mS·cm−1 for the binary mixture
and (7.7 ± 0.3) mS·cm−1 for DME, respectively. This is shown in all experiments presented herein with
high reproducibility visible by the standard deviation given. The suppressed semicircle (2) occurs from
the ion conduction through the amorphous SE thin film, modeled by the equivalent circuit
(RSE,bulkQSE,bulk). Please note both the excellent reproducibility of RSE,bulk with a relative standard
deviation of just 2 % and the good agreement with the reference measurement (Fig.SI 6), giving a value
of (536 ± 10) Ω·cm2 when normalizing the lateral thin film measurement by the ratio of the cell
constants. This is also valid for the LICGC® SE: Here, we can deconvolve the impedance spectra of the
SE by 2 suppressed semi-circles, represented by the intragrain (RSE,bulk, 2) and intergrain (RSE,gb, 3) ion
conduction within the polycrystalline SE. Unless the datapoints in the high-frequency domain are very
scarce, not allowing for a correct deconvolution of the LE and the intragrain contributions, the
reference measurement (Fig. SI 14) allows a clear identification of the SE in the 4 point spectra,
featuring an overall resistance of (180 ± 3) Ω·cm2 and a high congruency of the frequency ranges.
Table 1: EIS fit results for the LIPON (C1)-based system. In order to ease comparison to the reference
measurements, all resistance values are normalized to areal resistances. The values attributed
to the SE are given as average values throughout the longterm measurements, the values
assigned to the SLEI are given after 24 h and after 144 h (italic), respectively. For details on the
error propagation as well as on the calculation of capacities on the basis of the Q and α we
refer to the supplementary information.
Component / unit Representation DOL DME DOL/DME
RLE,bulk / Ω·cm2 Ohmic resistance of the
LE
165.5±0.3 59.5±0.9 68.5±0.3
RSE,bulk / Ω·cm2 Conduction in the
amorphous SE
558.8±1.8 546.0±4.2 557±2.1
QSE,bulk / S s−α (5.4±0.1)·10−
8 (5.7±0.5)·10−
8
(5.3±0.1)·10−8
αSE,bulk 0.825±0.001 0.799±0.005 0.831±0.002
CSE,bulk / nF·cm−2 5.1±0.2 3.6±0.7 5.5±0.2

RSLEI / Ω·cm2 Transfer across the SLEI
after 24 h / after 144 h
67.7±1.9
129.2±1.5
539 ± 3.8
1511.7 ± 5.6
261±2.5
621.8 ±2.7
QSLEI / S s−α (5.9±0.5)·10−
6
(6.4±0.3)·10−
6
(3.9±0.1)·10−
6
(3.3±0.1)·10−
6
(5.4±0.2)·10−6
(6.5±0.1)·10−6
αSLEI 0.842±0.014
0.808±0.007
0.788±0.005
0.736±0.007
0.754±0.006
0.690±0.003
CSLEI / µF·cm−2 1.18±0.29
1.02±0.13
0.65±0.06
0.41±0.04
0.55±0.06
0.46±0.03
Based on this discussion, the suppressed semicircle in the lowest frequency domain (3. for LiPON and
4. for LICGC®) is attributed to the solid-liquid-electrolyte-interphase SLEI RSLEI, showing extensive
growth whereas the other two contributions remain relatively constant throughout the long term
measurements of up to 165 h. Thus, as already published for LAGP40, the evolution of the SLEI is as well
shown for the SEs LiPON and LICGC®. The resistance evolution can be divided into three periods: (1)
immediately after contact of SE and LE (6 h to 12 h), the resistance is slightly reduced for most of the
LiPON samples. As all contributions are affected, we assume that a wetting or equilibration of the
surface takes place. This is much more visible for the LICGC® where all measurements show a
significant reduction of RSLEI within the first 24 h. We assume dissolution of surface residuals,
comprising aliphatic carbons and Li2CO3 revealed by XPS reference spectra of the pristine samples (see
Fig. SI28). Subsequently (2), the resistance monotonously rises, at least tending to a stabilization phase
(3). Beyond this and as one major finding of this work, we point out that both the nominal value RSLEI
and its growth rate depend significantly on the solvent used as visible in the spectra (Figure 2) and the
temporal evolutions of all resistance contributions of LE, SE and SLEI (Figure 3).
This tendency is reproduced for all three SEs, but most clearly visible for LiPON (C1), presumably due
to the very smooth surface and exclusion of any contamination by Lab atmosphere. The measurement
with DOL (Figure 2a and 3a) denotes a low RSLEI of 68 Ω·cm2 after 24 h, growing by a factor of 190 % in
144 h. The analogue experiment using DME as solvent results in a dramatically increased effect with
RSLEI growing from 539 Ω·cm2 after 24 h to 1511 Ω·cm2 at 144 h (Figure 2b and 3b). This represents an
aggravation of RSLEI by 1200 % compared to DOL. The binary mixture shows a medium effect starting
from 260 Ω·cm2 and stabilizing at 620 Ω·cm2 which is ~2.4 times higher than after 24 h and 480 %
higher compared to the result with DOL, respectively. Based on that finding, we assume that – beyond
the fact that in all cases presented herein an SLEI forms - DOL and DME contribute differently to the
surface layer. The first is showing a smooth and rather slow resistance evolution, the latter leads to a
comparably fast resistance increase, not reaching a limit after 165 h. The binary mixture shows
intermediate behavior with a finite resistance contribution.
As the impedance spectra for LiPON (C1) allowed for more accurate fits than for polycrystalline samples
like LICGC® and LAGP, we could as well analyze the capacities of the different SLEI’s, derived as denoted
in the SI (Fig. SI21): While the SLEI grown in DOL shows a significant higher capacity in the range of CSLEI,
DOL = 1.1 µF·cm−2, those evidenced in DME and the binary mixture have lower capacities of CSLEI,
DME = 0.4 µF·cm−2 and CSLEI, DOLDME = 0.5 µF·cm−2. Furthermore, we notice a temporal evolution of the

capacities: 1 hour after start of the measurement, all capacities are in a range of 0.4 µF·cm−2 (mixture)
to 0.65 µF·cm−2 (pure solvents). After 24 h, the value for DOL is significantly increased to
(1.2 ± 0.3) µF·cm−2. While CSLEI, DOLDME grows as well during the first 24 h, CSLEI, DME remains stable in this
period. After that, all SLEI capacities show a tendency to decrease to a stable value around 1.0 µF·cm−2
for DOL and 0.4 µF·cm−2 and 0.45 µF·cm−2 for DME and the binary mixture, respectively.
In order to shed more light on these phenomena, we performed further analysis on the impedance
data for LiPON C1 using the distribution of relaxation times (DRT) method as presented in Figure SI22.
For all three experiments, we identify one process at ω = 340 kHz with stable relaxation time during
the long term measurement which can be attributed to the charge transport through the LiPON thin
film. We assign a second process with increasing relaxation time (decreasing frequency) to the charge
transfer through the SLEI. Here, we face a slight frequency reduction from ω = 10 kHz after 1 h to
7.8 kHz after 144 h for DOL. The relaxation time for the charge transfer process through the SLEI, τ =
RC = 2π / ω, thus increases from 0.6 ms to 0.8 ms. For the analogue experiment with DME, the
relaxation time is significantly higher: After 1 h, the relaxation time is 2.7 ms (2.3 kHz) and grows to
6.0 ms (1.1 kHz). Again, the binary mixture shows an intermediate behavior, ranging from 0.5 ms
(13.9 kHz, 1 h) to 2.5 ms (2.5 kHz, 144 h).
Figure 3: Comparison of the time dependence of the resistance contributions to the 4P spectra for
LiPON C1 (a-c) and LiPON C2 (d-f) and Ohara LiCGC® for all LE systems 1 M LiTFSI in DOL (1st
column), in DME (2nd column and in DOLDME (3rd column): The LE (bulk, blue) and the SE
contributions (LiPON bulk / LiCGC® intragrain; red and LICGC® intergrain; yellow) remain
relatively constant whereas the SLEI shows significant time dependent growth. As further
explained in the text, the SLEI contribution is significantly dependent on the LE-solvent. For
each dataset, the resistances and respective errors were derived from data-fitting, based on

the R(RQ)(RQ)-equivalent circuit for LiPON samples and the R(RQ)(RQ)(RQ)-equivalent
circuit for the LICGC® samples.
We can conclude that the EIS analysis of the different SE and LE combinations indeed shows that DOL
and DME contribute differently to the SLEI formation: Obviously, 1,3-dioxolane leads to a relatively
low resistance contribution of the SLEI with a substantially higher capacity and thus a low relaxation
time of the charge transfer. Meanwhile, 1,2-dimethoxyethane supports the formation of a SLEI with a
12 times higher ohmic resistance, low capacity and very high relaxation time. The binary mixture
always shows an intermediate behavior which we assign to a superposition of the two different effects.
We may link the capacity and relaxation behavior to spatial properties of the SLEI: In a very simplistic
model of a capacitive layer, the capacity is inversely proportional to the layer thickness. In that case,
the SLEI formed in DOL may possess much lower thickness as those found for DME and the binary
mixture which may range in the same order of magnitude. Thus, the extremely sluggish transport
through the SLEI formed in DME cannot be explained by the bare layer thickness. This will be addressed
in the following section.
Figure 4: XPS detail spectra of carbon (C1 s), sulfur (S 2p) and fluorine (F1s) for a LiPON (C1) sample
treated for ~160 h in 1 M LiTFSI in DOL (a-c), DME (d-f) and DOLDME (g-h). For attributions
of species to the binding energies refer to Table 2.

4. Surface and depth analysis – discussion of the SLEI’s layer structure
The ex situ analyses by means of XPS and ToF-SIMS focus on the results obtained with the LiPON (C1)
samples which have never been exposed to lab atmosphere. All survey spectra and detail spectra
acquired for this study are presented in the supplementary information (Fig. SI 23-31) including results
for LiPON C2 and LICGC® samples. XPS detail spectra of carbon (C 1s), sulfur (S 2p) and fluorine (F 1s)
of the LiPON (C1) samples treated for 8 days in 4 point cells in DOL (a-c), DME (d-f) and the binary
mixture (g-i) are depicted in Figure 4. The binding energies attributed to species based on literature
screening as well as their assumed origin are summed up in Table 2.
The C 1s signal can be deconvolved into five lines which are attributed to the following species: The
strongest intensity in the C 1s signal for the sample treated in DOL/DME refers to a binding energy of
286.5 eV, assignable to R3CO-R63,64, and 284.8 eV, attributed to alcoholates R3COLi63,65,66, both
degradation products of DOL and DME. Based on the findings of Fiedler et al., alkoxide salts or
carboxylate salts of lithium are formed by solvent decomposition59 and are also attributable to these
lines. Due to the multitude of surface components, a clear differentiation of these organic lithium salts
is not possible by XPS. Furthermore, the line at 284.8 eV is also visible in the reference samples and it
might be as well related to aliphatic carbon –(CH2)– to some extent. The component present at
287.9 eV is not visible in the DME-sample and is assigned to carbonyl or polymeric species
(CH2CH2OCH2)n originating from DOL decomposition59,62,63. We find carbonates and/or semicarbonates
(CO32−, 289.4 eV) as inorganic salt components on all samples. All these components are well known
to build up the SEI on metallic lithium anodes10,59,63,67.
Table 2: Attribution of species to the binding energies
Detail
spectra
Binding
energy /eV
Color Attributed
species
Ref. Assumed origin
C 1s 292.8 grey -CF3 58,59 LiTFSI conducting salt
289.4 red CO32− 59–61 Carbonates, eg. Li2CO3 or
semicarbonates
(solvent decomposition products)
287.9 blue -(CO2)-
(CH2CH2OCH2O)
n
62,63 59
carbonyl or polymeric species
poly-DOL
(DOL solvent decomposition
products)
286.5 green R3CO-R
C-O bond in
RCH2OLi or
RCOOLi
63,64 59
DOL/DME solvent residuals or
decomposition products, alkoxides
or carboxylates
284.8 orange R3COLi
-(CH2)-
C-C bond in
RCH2OLi or
RCOOLi
63,65,66
59
DOL/DME solvent residuals or
decomposition products
(Alcoholates) aliphatic carbons,
alkoxides or carboxylates

F 1s 688.6 orange -CF3 58 LiTFSI conducting salt or
LiTFSI decomposition product
684.9 green LiF 58,63 LiTFSI decomposition product
S 2p 169.0 red -SO2CF3 58 LiTFSI conducting salt or
LiTFSI decomposition product
167.1 green -SO2CF2+ or
LixSOy
58,61 63
LiTFSI decomposition product
N 1s 399.5 Not
shown
imide groups 58 LiTFSI conducting salt or
LiTFSI decomposition product
P 2p 133.6 orange PO4 - SE (LICGC®)
132.6 orange PON - SE (LiPON)
The additional line at 289.4 eV represents the (-CF3)-group in LiTFSI58 and is visible on all samples,
presumably originating either from conducting salt residuals or LiTFSI-decomposition. For all SEs
analyzed in this study, the highest contribution of organic lithium salts is found in the binary mixture
while it is rather low for the single solvents. The signal assigned to poly DOL or carbonyl is also more
intense for DOL/DME compared to sole DOL. Thus, we assume cross-effects between the solvents,
leading to the “fingerprint” of the SLEI in DOL/DME similar for LiPON, LICGC® and LAGP. The latter has
been reported in our previous work40 and confirmed by Manthiram et al. for the similar system30. Two
different species can be identified in the S 2p spectra which are attributed to sulfonyl groups –SO2CF3
from the conducting salt58 or its decomposition products: Referring to the signals at 167.1 eV, we
assume that LiTFSI is decomposed as these are assigned to as sulfonyl residuals with stripped fluorine
–SO2CF2+ or LixSOy 58,63. This is as well supported by the F 1s spectra, confirming LiTFSI decomposition
by identification of two representations of fluorine. One in LiF at 684.9 eV and one in CF3 at 688.6 eV.
On the pristine reference samples (Figures SI 26-28), no or only small fluorine and sulfur
contaminations are detected. However, we denote a significant contamination by hydrocarbons and
other carbon specimen for all samples and it is unclear if these residuals are fully removed during
electrochemical treatment. Considering these limitations, we give the elemental quantification of the
surface analysis as denoted in Table 3 and (Tables SI 5-6).
Table 3: Elemental quantification of a pristine LiPON sample and the SLEI on LiPON (C1) obtained
by means of x-ray photoelectron spectroscopy and derived with relative sensitivity factors
(RSF) provided by the instrument manufacturer.
O 1s Li 1s C 1s P 2p N 1s S 2p F 1s
at.%
Reference 33.4 33.6 13.6 9.5 9.3 0.3 0.3
DOL 36.5 28.1 20.0 6.4 6.7 0.8 1.5
DME 32.0 22.2 34.1 4.3 4.1 2.4 0.9
DOL/DME 32.5 8.3 49.8 1.6 2.0 1.6 4.3

For all three SEs, treatment in the binary mixture leads to the highest amount of carbonaceous species
on the sample surface, whereas the lithium content is the lowest. Furthermore, the phosphorous signal
of the LiPON thin-films as well as phosphorous, titanium and germanium from the LICGC® SE are
suppressed most by the DOL/DME SLEI and the least by the DOL SLEI. At least from the XPS surface
analysis, we cannot state that the SLEI with the strongest resistance impact, produced by the treatment
in DME, shows a significantly higher thickness or compactness. From the masking of the SE signals, we
assume that the SLEI formed in DOL/DME is the thickest or most compact one which is confirmed by
XPS depth profiles denoted in Figure SI32: A sputter time of approximately 1500 s is required to reach
constant values for P 2p and very low values for C 1s. For those samples treated in the single solvent
electrolytes, the SE is reached after max. ~ 1000 s. Furthermore, the profiles hint that fluorine species
accumulate inside the surface film, whereas carbonaceous and sulfuric species are more located close
to the surface, especially for DME and DOL/DME. Due to the low depth resolution, the results obtained
by XPS depth profiling are rather scarce. ToF-SIMS is used as a complementary method to the XPS
measurements to (i) support the differentiation of the SLEI components and (ii) obtain more detailed
information on the inner structure of the interphase. Depth profiles of LiPON samples treated for 8
days in the four point cell obtained by ToF-SIMS and sputtering are denoted in Figure 5, comparing the
results for electrolyte based on DOL (a), DME (b) and the binary mixture (c). For better legibility, we
clustered the secondary ion signals into ions assigned to the SE (i) and the inorganic (ii) and organic (iii)
components of the SLEI. We chose a square root-like scaling of the x-axis in order to focus on the SLEI
composition. The respective relative atomic masses of ion fragments denoted in the depth profiles are
summarized in Table SI7. Along with consecutive sputtering, the secondary ion signals change non-
simultaneously, hinting at an inhomogeneous film and allowing for the definition of different regions
which are color coded for easy reference.
It is confirmed by the ToF-SIMS depth profiles that indeed the SLEI thickness or compactness rises in
the order DOL < DME < DOL/DME: Constant values for the PO− and P− signals are achieved after ~70 s
for DOL, ~ 130 s for DME and ~200 s for DOL/DME (Figure 5) pointing out that the solid electrolyte is
reached. For the single solvent electrolytes, a first region (I, blue) is identified where high amounts of
LiTFSI fragments (NS2O4C2F6−, CF3
− and SO2−) are detected as secondary ions, hinting at conducting salt
residuals. This is not surprising as the SLEI surface was in direct contact to the liquid electrolyte before
disassembly and washing. Interpreting the secondary ion signal assigned to CHO2−, we assume that
carboxyle salts RCO2Li (e.g. formate) are moderately enriched in this first region for DME and highly
accumulated for DOL. A second region (II, red) is reached for both DOL and DME after approximately
4 s of sputter time. Beginning with SO2- (in region I), SO− and S− (in region II) are reached one after
another with increasing sputter times. As all of these fragments originate from LiTFSI, we assume
prudently that a high fragmentation of LiTFSI by the sputter beam may occur easier in deeper regions
of the SLEI. This hints at a stronger degradation of the conducting salt inside the SLEI. For DME, the
degradation of LiTFSI seems to be more prominent (see comparison in Figure SI33). The decomposition
of LiN(SO2CF3), involving the precipitation of LiF, Li2S, Li3N has already been published68,69. It has also
been suggested that traces of acidic compounds present in the electrolyte (e.g. HF) react with Li2CO3,
forming LiF and semicarbonates -CO3 which then decompose70–72. In all solvents, we find carbonate
-CO3−-fragments originating from the second region, however, the signal of -CO3
−-fragments is
significantly lower for the DME and DOL/DME sample. Therefore, we assume that the carbonate
formation is more pronounced in DOL.
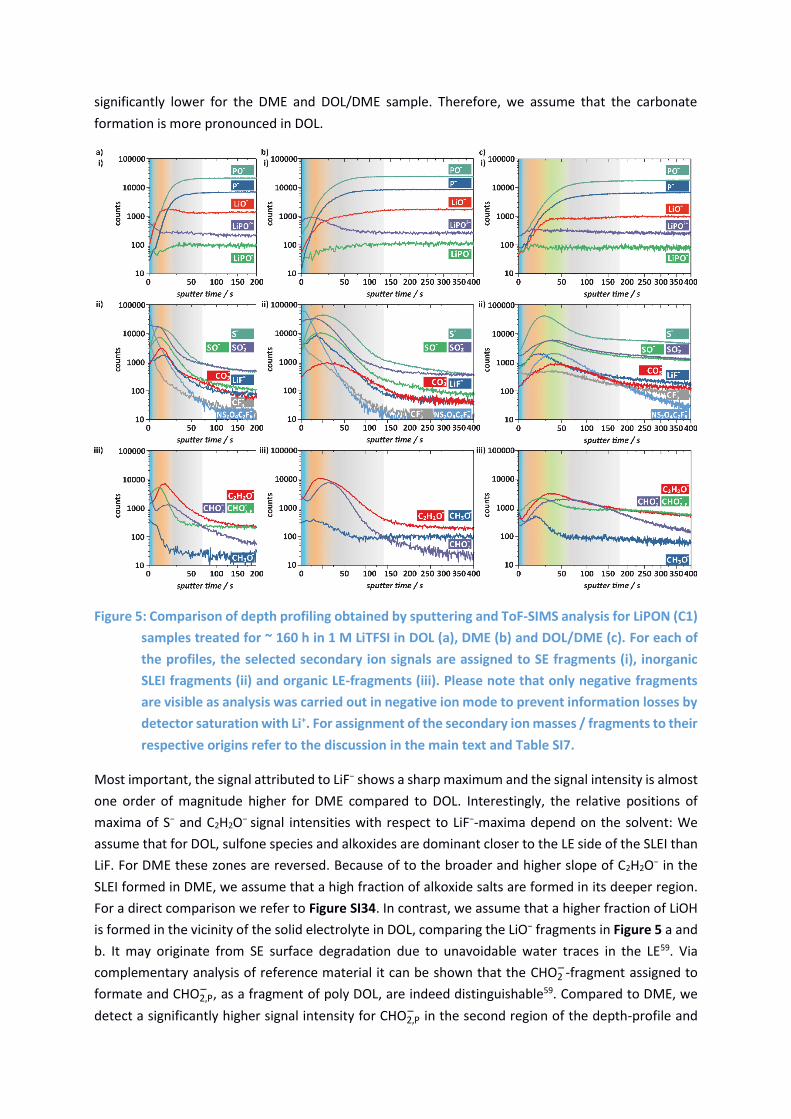
Figure 5: Comparison of depth profiling obtained by sputtering and ToF-SIMS analysis for LiPON (C1)
samples treated for ~ 160 h in 1 M LiTFSI in DOL (a), DME (b) and DOL/DME (c). For each of
the profiles, the selected secondary ion signals are assigned to SE fragments (i), inorganic
SLEI fragments (ii) and organic LE-fragments (iii). Please note that only negative fragments
are visible as analysis was carried out in negative ion mode to prevent information losses by
detector saturation with Li+. For assignment of the secondary ion masses / fragments to their
respective origins refer to the discussion in the main text and Table SI7.
Most important, the signal attributed to LiF− shows a sharp maximum and the signal intensity is almost
one order of magnitude higher for DME compared to DOL. Interestingly, the relative positions of
maxima of S− and C2H2O− signal intensities with respect to LiF−-maxima depend on the solvent: We
assume that for DOL, sulfone species and alkoxides are dominant closer to the LE side of the SLEI than
LiF. For DME these zones are reversed. Because of to the broader and higher slope of C2H2O− in the
SLEI formed in DME, we assume that a high fraction of alkoxide salts are formed in its deeper region.
For a direct comparison we refer to Figure SI34. In contrast, we assume that a higher fraction of LiOH
is formed in the vicinity of the solid electrolyte in DOL, comparing the LiO− fragments in Figure 5 a and
b. It may originate from SE surface degradation due to unavoidable water traces in the LE59. Via
complementary analysis of reference material it can be shown that the CHO2−-fragment assigned to
formate and CHO2,P− , as a fragment of poly DOL, are indeed distinguishable59. Compared to DME, we
detect a significantly higher signal intensity for CHO2,P− in the second region of the depth-profile and

assume that poly-DOL is a major constituent of the SLEI in DOL. DOL tends to decompose in a cationic
process to polymeric species (CH2CH2OCH2O)n catalyzed by Lewis acids73,74 as denoted in Figure 6.
Based on these results, we propose an analogous solvent dependency of the SLEI composition as found
for the SEI on lithium surfaces59: While DOL initially creates a LiOH layer that is then covered by alkoxide
salts, LiTFSI components and LiF, DME forms a R-CH2OLi-framework with embedded LiTFSI. The
conducting salt decomposes subsequently, leading to massive LiF formation. As the SLEI in DME
features significantly higher amounts of organic components like C2H2O− and CHO2−, we assume that
DME has a higher tendency to decompose as DOL. A deprotonation of dimethoxyethane by Li+ as
depicted in Figure 6 may lead to its decomposition and ease additionally the formation of LiF out of
protonated TFSI. For DOL, Aurbach et al. explained that the polymerization products which are soluble
ethers interact with alkoxides, hydroxides or oxides and partly dissolve them75. LiOH is not stable due
to reaction with DOL and participates in the formation of soluble products75. Therefore, DOL has a
lower tendency to form a stable matrix favoring a highly resistive SLEI. In DME, a more rigid framework
of alkoxides is able to incorporate LiTFSI which successively decompose to LiF that agglomerates to a
dense film. Assuming that LiF is indeed a very poor ion conductor, which we extrapolate from the
scarce literature values (10−9 S·cm−1 at 50 °C)76 to a range of 10−10 to 10−11 S·cm−1, we explain the
significant increase of the SLEI resistance in DME compared to DOL, as – exemplarily – a 1 nm thick
layer will add at least 1000 Ω·cm2. Based on these discussions, we illustrate the local structures of the
SLEI’s formed in DOL- and DME-based electrolytes in Figure 6.
Figure 6: Schematic illustration of SLEIs formed in liquid electrolytes based on pure solvents and the
binary mixture, based on the depth profiles denoted in Figure 5 and the discussion in the main
text. Assumed exemplary decomposition reactions of the pure solvents DOL and DME are
given as insets: Partial de-composition of DOL may lead to the formation of poly DOL
(CH2CH2OCH2)n, whereas the linear ether DME decomposes via deprotonation reaction to
ethers and lithum alkoxydes. Please note that the schematics are neither exhaustive nor true
to scale.
Finally, the depth profiles obtained for the binary electrolyte resemble a superposition of those found
for the single solvents. We assume that both SLEI formation processes compete, leading to a more
complex structure of the SLEI, as schematically denoted in Figure 6c. In the depth profiles, we define
four different regions due to the intensity variations of the secondary ion signals. The profile for lithium
fluoride fragment LiF− in the second region (red) is wider and more pronounced as for the DOL sample
but substantially lower as for DME. Analogously to the SLEI in DOL, LiOH may form in the vicinity of the

solid electrolyte hint by the “bump” in the signal intensity of LiO− in the third region (yellow).
Alcoholate-, carboxyle salt- and carbonate fragments present maxima in region 3 (yellow), whereas
the signal intensity for CHO2,P− assigned to (CH2CH2OCH2)n (poly-DOL) are more pronounced at the
beginning of sputtering (region 1, blue and 2, red). In contrast to the single solvent electrolytes, the
signal intensity assigned to the LiTFSI fragment NS2O4C2F6− increases for longer sputter times (region 3,
yellow). By that, we assume that LiTFSI is covered by poly DOL to some extent, which is supported by
the XPS analysis presented above, showing comparably high intensities for the line attributed to poly
DOL and low intensities for the –CF3 group assigned to LiTFSI. We propose that the accumulation of
poly DOL in the upper region of the SLEI may suppress the formation of a dense LiF layer – which may
explain the lower resistance compared to the SLEI formed in pure DME unless it is thicker or more
compact.
5. Conclusions
Within this study, we provide further evidence for the formation of solid-liquid electrolyte interphases
(SLEI) via in situ tracking of the resistance contributions. The complementary analysis by means of EIS,
XPS and ToF-SIMS combined with depth profiling give rise to the following assumptions: (i) In ethereal
solvents DOL and DME the SLEI grows on solid ion conductors LICGC® (RSLEI ~ 70 Ω·cm2) and LiPON (RSLEI
~ 600 Ω·cm2 (C1) and ~ 250 Ω·cm2 (C2)) in an analogous way as previously presented for a model Li+
solid electrolyte LAGP (RSLEI ~ 100 Ω·cm2)30,40,77. Similar findings for a combination of carbonaceous
solvents and garnet-type solid electrolyte LLZTO (RSLEI ~ 300 Ω·cm2) give rise to the assumption that the
phenomenon of the SLEI growth is indeed a general effect. (ii) Comparing the RSLEI magnitude with the
topologies of the LiPON samples with comparable chemical composition, a higher effective surface
indeed may reduce the resistance contribution of the cell. Thus, as already assumed in our previous
study40, tailoring the surface morphology to higher effective areas will reduce the SLEI resistance.
However, considering that the very flat surface of LICGC® does only lead to a mediocre RSLEI, the
chemical composition of the solid electrolyte surface is the more important factor to minimize
polarization effects. (iii) Finally, the liquid electrolyte solvents and the decomposition of LiTFSI govern
the SLEI growth rate, composition and resistance. This has been shown by comparing the SLEI effect in
liquid electrolytes comprising DOL, DME and the binary mixture DOL/DME. DME favors a fast increase
in SLEI resistance which seems to proceed even after 165 h and surpasses 1000 Ω·cm2. A dense LiF
layer inside a stable carboxylate salt matrix is formed via decomposition of LiTFSI and DME. Meanwhile,
DOL generates a SLEI mainly consisting of polymeric species which is slowly and finitely growing
providing a lower resistance contribution < 100 Ω·cm2. In the binary mixture of DOL and DME, both
SLEI formation processes compete and the polymeric species tends to suppress LiF formation leading
to a limited growth behavior. Based on this study, we propose the following next steps to gain further
understanding on the SLEI phenomenon: Sputter depth profiling may present a powerful tool to reveal
the chemical composition of the interphase with adequate resolution but thickness and density
information is very scarce and hardly interpretable. Therefore, we propose other methods like in situ
neutron reflectometry and quartz-crystal microbalance measurements in order to elucidate spatial
dimensions of the SLEI. The vital role of transport across heterogeneous phase boundaries between
solid and liquid ion conductors is not limited to protective coatings, hybrid cells and hybrid
electrolytes77 but of core importance for all battery systems. We hope to motivate complementary

experimental and theoretical studies to obtain further knowledge on the SLEI structure, its formation
mechanisms and its impact on ionic transport.
Acknowledgements
The research presented herein was supported by the BASF Scientific Network for Electrochemistry and
Batteries. The authors thank P. Hartmann and K. Leitner (BASF SE), B. Luerßen, B. Mogwitz, J. Sann, M.
Elm, K. Michel, Raika Oppermann, J. Neumeier, C. Barth, H. Weigand (Justus-Liebig-University Giessen),
P. Adelhelm (University Jena), M. Falk (rhd Instruments) and H.W. Behm (Bosch Battery Systems
Germany) for helpful discussions and scientific support. We appreciate fruitful discussions within the
BASF SE Network for Electrochemistry and Batteries.
Author Contributions
J.J. and M.R.B. conceived the experiments; M.R.B. designed the measurement set-ups and performed
the electrochemical experiments with the assistance of T.D.; M.R.B., A.K. and M.G. performed the
LiPON synthesis and analysis thereof with assistance of M.W.; K.O.H. developed the DRT algorithm and
performed the DRT- analysis; T.L., C.F. and M.R.B. carried out the XPS and ToF-SIMS experiments and
evaluated the data; XRD measurements and Rietveld refinements were performed by D.A.W. and
M.R.B.. The manuscript was written by M.R.B.; all the authors discussed the test results and
commented on the manuscript.
Literature
1. Liu, Z., Fu, W. & Liang, C. Lithium-Sulfur Batteries. in Handbook of Battery Materials (eds. Daniel, C. & Besenhard, J. O.) 811–836 (Wiley-VCH Verlag GmbH & Co. KGaA, 2012).
2. Ji, X. & Nazar, L. F. Advances in Li-S batteries. J. Mater. Chem. 20, 9821 (2010).
3. Mikhaylik, Y. V. & Akridge, J. R. Polysulfide Shuttle Study in the Li/S Battery System. J. Electrochem. Soc. 151, A1969–A1976 (2004).
4. Ellis, B. L., Lee, K. T. & Nazar, L. F. Positive Electrode Materials for Li-Ion and Li-Batteries. Chem. Mater. 22, 691–714 (2010).
5. Busche, M. R. et al. Systematical electrochemical study on the parasitic shuttle-effect in lithium-sulfur-cells at different temperatures and different rates. J. Power Sources 259, 289–299 (2014).
6. Cheon, S.-E. et al. Rechargeable lithium sulfur battery I. Structural change of sulfur cathode during discharge and charge. J. Electrochem. Soc. 150, A796–A799 (2003).
7. Rauh, R. D., Abraham, K. M., Pearson, G. F., Surprenant, J. K. & Brummer, S. B. A lithium/dissolved sulfur battery with an organic electrolyte. J. Electrochem. Soc. 126, 523–527 (1979).
8. Leitner, K. W., Wolf, H., Garsuch, a., Chesneau, F. & Schulz-Dobrick, M. Electroactive separator for high voltage graphite/LiNi0.5Mn1.5O4 lithium ion batteries. J. Power Sources 244, 548–551 (2013).
9. Bergner, B. J., Schürmann, A., Peppler, K. & Janek, J. TEMPO: A Mobile Catalyst for

Rechargeable Li-O2 Batteries. J. Am. Chem. Soc. 136, 15054–15064 (2014).
10. Xiong, S., Xie, K., Diao, Y. & Hong, X. Characterization of the solid electrolyte interphase on lithium anode for preventing the shuttle mechanism in lithium–sulfur batteries. J. Power Sources 246, 840–845 (2014).
11. Lee, Y. M., Choi, N.-S., Park, J. H. & Park, J.-K. Electrochemical performance of lithium/sulfur batteries with protected Li anodes. J. Power Sources 119–121, 964–972 (2003).
12. Kozen, A. C. et al. Next-Generation Lithium Metal Anode Engineering via Atomic Layer Deposition. ACS Nano 9, 5884–5892 (2015).
13. Ma, G. et al. A lithium anode protection guided highly-stable lithium-sulfur battery. Chem. Commun. 50, 14209–14212 (2014).
14. Manthiram, A., Fu, Y., Chung, S.-H., Zu, C. & Su, Y.-S. Rechargeable Lithium-Sulfur Batteries. Chem. Rev. 114, 11751–11787 (2014).
15. Barghamadi, M., Kapoor, A. & Wen, C. A Review on Li-S Batteries as a High Efficiency Rechargeable Lithium Battery. J. Electrochem. Soc. 160, A1256–A1263 (2013).
16. Yin, Y.-X., Xin, S., Guo, Y.-G. & Wan, L.-J. Lithium-sulfur batteries: electrochemistry, materials, and prospects. Angew. Chem. Int. Ed. Engl. 52, 13186–200 (2013).
17. Chen, L. & Shaw, L. L. Recent advances in lithium–sulfur batteries. J. Power Sources 267, 770–783 (2014).
18. Zhang, S. S. Liquid electrolyte lithium/sulfur battery: Fundamental chemistry, problems, and solutions. J. Power Sources 231, 153–162 (2013).
19. Hassoun, J. & Scrosati, B. A High-Performance Polymer Tin Sulfur Lithium Ion Battery. Angew. Chem. Int. Ed. Engl. 49, 2371–2374 (2010).
20. Liang, X. et al. Highly dispersed sulfur in ordered mesoporous carbon sphere as a composite cathode for rechargeable polymer Li/S battery. J. Power Sources 196, 3655–3658 (2011).
21. Marmorstein, D. et al. Electrochemical performance of lithium/sulfur cells with three different polymer electrolytes. J. Power Sources 89, 219–226 (2000).
22. Hassoun, J. & Scrosati, B. Moving to a Solid-State Configuration:A Valid Approach to Making Lithium-Sulfur Batteries Viable for Practical Applications. Adv. Mater. 22, 5198–5201 (2010).
23. Hayashi, A., Ohtomo, T., Mizuno, F., Tadanaga, K. & Tatsumisago, M. All-solid-state Li/S batteries with highly conductive glass–ceramic electrolytes. Electrochem. commun. 5, 701–705 (2003).
24. Busche, M. R. et al. In Situ Monitoring of Fast Li-Ion Conductor Li7P3S11Crystallization Inside a Hot-Press Setup. Chem. Mater. 28, 6152–6165 (2016).
25. Jin, Z., Xie, K., Hong, X., Hu, Z. & Liu, X. Application of lithiated Nafion ionomer film as functional separator for lithium sulfur cells. J. Power Sources 218, 163–167 (2012).
26. Bauer, I., Thieme, S., Brückner, J., Althues, H. & Kaskel, S. Reduced polysulfide shuttle in lithium-sulfur batteries using Nafion-based separators. J. Power Sources 251, 417–422 (2014).
27. Wang, Q. et al. A gel-ceramic multi-layer electrolyte for long-life lithium sulfur batteries. Chem. Commun. 52, 1637–1640 (2016).

28. Song, R. et al. A trilayer separator with dual function for high performance lithium-sulfur batteries. J. Power Sources 301, 179–186 (2016).
29. Wang, Q. et al. Improved performance of Li-S battery with hybrid electrolyte by interface modification. Solid State Ionics 300, 67–72 (2017).
30. Xu, H., Wang, S. & Manthiram, A. Hybrid Lithium-Sulfur Batteries with an Advanced Gel Cathode and Stabilized Lithium-Metal Anode. Adv. Energy Mater. 8, 1–6 (2018).
31. Huang, J. Q. et al. Ionic shield for polysulfides towards highly-stable lithium-sulfur batteries. Energy Environ. Sci. 7, 347–353 (2014).
32. Zhang, Z., Lai, Y., Zhang, Z., Zhang, K. & Li, J. Al2O3-coated porous separator for enhanced electrochemical performance of lithium sulfur batteries. Electrochim. Acta 129, 55–61 (2014).
33. Li, W. et al. A V2O5 Polysulfide Anion Barrier for Long-Lived Li-S Batteries. Chem. Mater. 26, 3403–3410 (2014).
34. Wang, Q. et al. A shuttle effect free lithium sulfur battery based on a hybrid electrolyte. Phys. Chem. Chem. Phys. 16, 21225–21229 (2014).
35. Vizintin, A., Patel, M. U. M., Genorio, B. & Dominko, R. Effective Separation of Lithium Anode and Sulfur Cathode in Lithium-Sulfur Batteries. ChemElectroChem 1, 1040–1045 (2014).
36. Wang, L., Wang, Y. & Xia, Y. A high performance lithium-ion sulfur battery based on a Li2S cathode using a dual-phase electrolyte. Energy Environ. Sci. 8, 1551–1558 (2015).
37. Yu, X., Bi, Z., Zhao, F. & Manthiram, A. Hybrid Lithium-Sulfur Batteries with a Solid Electrolyte Membrane and Lithium Polysulfide Catholyte. ACS Appl. Mater. Interfaces 7, 16625–16631 (2015).
38. Yu, X., Bi, Z., Zhao, F. & Manthiram, A. Polysulfide-Shuttle Control in Lithium-Sulfur Batteries with a Chemically/Electrochemically Compatible NaSICON-Type Solid Electrolyte. Adv. Energy Mater. 6, (2016).
39. Huang, J.-Q. et al. Ionic shield for polysulfides towards highly-stable lithium–sulfur batteries. Energy Environ. Sci. 7, 347–353 (2014).
40. Busche, M. R. et al. Dynamic formation of a solid-liquid electrolyte interphase and its consequences for hybrid-battery concepts. Nat. Chem. 8, 426–434 (2016).
41. Bergner, B. J. et al. How to Improve Capacity and Cycling stability for Next Generation Li-O2 Batteries: Novel Approach with a Solid Electrolyte and Elevated Redox Mediator Concentrations. ACS Appl. Mater. Interfaces 8, 7756–7765 (2016).
42. Seino, Y., Ota, T., Takada, K., Hayashi, A. & Tatsumisago, M. A sulphide lithium super ion conductor is superior to liquid ion conductors for use in rechargeable batteries. Energy Environ. Sci. 7, 627 (2014).
43. Wenzel, S. et al. Interphase formation and degradation of charge transfer kinetics between a lithium metal anode and highly crystalline Li7P3S11 solid electrolyte. Solid State Ionics 286, 24–33(2016).
44. Sagane, F., Abe, T., Iriyama, Y. & Ogumi, Z. Li+ and Na+ transfer through interfaces between inorganic solid electrolytes and polymer or liquid electrolytes. J. Power Sources 146, 749–752 (2005).

45. Abe, T., Ohtsuka, M., Sagane, F., Iriyama, Y. & Ogumi, Z. Lithium Ion Transfer at the Interface between Lithium-Ion-Conductive Solid Crystalline Electrolyte and Polymer Electrolyte. J. Electrochem. Soc. 151, A1950 (2004).
46. Sagane, F., Abe, T. & Ogumi, Z. Li+-Ion Transfer through the Interface between Li+-Ion Conductive Ceramic Electrolyte and Li+-Ion-Concentrated Propylene Carbonate Solution. J. Phys. Chem. C 113, 20135–20138 (2009).
47. Yamada, I., Abe, T., Iriyama, Y. & Ogumi, Z. Lithium-ion transfer at LiMn2O4 thin film electrode prepared by pulsed laser deposition. Electrochem. commun. 5, 502–505 (2003).
48. Abe, T., Fukuda, H., Iriyama, Y. & Ogumi, Z. Solvated Li-Ion Transfer at Interface Between Graphite and Electrolyte. J. Electrochem. Soc. 151, A1120–A1123 (2004).
49. Yamada, Y., Sagane, F., Iriyama, Y., Abe, T. & Ogumi, Z. Kinetics of Lithium-Ion Transfer at the Interface between Li0.35La0.55TiO3 and Binary Electrolytes. J. Phys. Chem. C 113, 14528–14532 (2009).
50. Schleutker, M., Bahner, J., Tsai, C.-L., Stolten, D. & Korte, C. On the interfacial charge transfer between solid and liquid Li+ electrolytes. Phys. Chem. Chem. Phys. 26596–26605 (2017). doi:10.1039/C7CP05213H
51. Juan Rodríguez-Carvajal. Recent advances in magnetic structure determination by neutron powder diffraction. Phys. B 192, 55–69 (1993).
52. Fleutot, B., Pecquenard, B., Martinez, H., Letellier, M. & Levasseur, a. Investigation of the local structure of LiPON thin films to better understand the role of nitrogen on their performance. Solid State Ionics 186, 29–36 (2011).
53. Marchand, R., Agliz, D., Boukbir, L. & Quemerais, A. Characterization of nitrogen containing phosphate glasses by X-ray photoelectron spectroscopy. J. Non. Cryst. Solids 103, 35–44 (1988).
54. Lacivita, V. et al. Resolving the amorphous structure of lithium phosphorus oxynitride (Lipon). J. Am. Chem. Soc. 140, 11029–11038 (2018).
55. Bates, J. B. et al. Electrical properties of amorphous lithium electrolyte thin films. Solid State Ionics 53–56, 647–654 (1992).
56. Su, Y. et al. LiPON thin films with high nitrogen content for application in lithium batteries and electrochromic devices prepared by RF magnetron sputtering. Solid State Ionics 282, 63–69 (2015).
57. Hartmann, P., Leichtweiss, T., Busche, M. R. & Schneider, M. Degradation of NASICON-type materials in contact with lithium metal : SEI formation on solid electrolytes J. Phys. Chem. C. 117, 21064–21074 (2013).
58. Dedryvère, R. et al. XPS Valence Characterization of Lithium Salts as a Tool to Study Electrode/Electrolyte Interfaces of Li-Ion Batteries. J. Phys. Chem. B 110, 12986–12992 (2006).
59. Fiedler, C., Luerssen, B., Rohnke, M., Sann, J. & Janek, J. XPS and SIMS Analysis of Solid Electrolyte Interphases on Lithium Formed by Ether-Based Electrolytes. J. Electrochem. Soc. 164, A3742–A3749 (2017).
60. Xiong, S., Xie, K., Diao, Y. & Hong, X. On the role of polysulfides for a stable solid electrolyte interphase on the lithium anode cycled in lithium–sulfur batteries. J. Power Sources 236, 181–187 (2013).

61. Ensling, D., Stjerndahl, M., Nytén, A., Gustafsson, T. & Thomas, J. O. A comparative XPS surface study of Li2FeSiO4/C cycled with LiTFSI- and LiPF6-based electrolytes. J. Mater. Chem. 19, 82–88 (2009).
62. Ota, H. et al. Structural and Functional Analysis of Surface Film on Li Anode in Vinylene Carbonate-Containing Electrolyte. J. Electrochem. Soc. 151, A1778–A1788 (2004).
63. Aurbach, D. et al. On the Surface Chemical Aspects of Very High Energy Density, Rechargeable Li–Sulfur Batteries. J. Electrochem. Soc. 156, 694–702 (2009).
64. Hu, Y., Kong, W., Li, H., Huang, X. & Chen, L. Experimental and theoretical studies on reduction mechanism of vinyl ethylene carbonate on graphite anode for lithium ion batteries. Electrochem. commun. 6, 126–131 (2004).
65. Schechter, A., Aurbach, D. & Cohen, H. X-ray Photoelectron Spectroscopy Study of Surface Films Formed on Li Electrodes Freshly Prepared in Alkyl Carbonate Solutions. Langmuir 15, 3334–3342 (1999).
66. Bar-Tow, D., Peled, E. & Burstein, L. A Study of Highly Oriented Pyrolytic Graphite as a Model for the Graphite Anode in Li-Ion Batteries. J. Electrochem. Soc. 146, 824–832 (1999).
67. Peled, E. The Electrochemical Behavior of Alkali and Alkaline Earth Metals in Nonaqueous Battery Systems—The Solid Electrolyte Interphase Model. J. Electrochem. Soc. 126, 2047–2051 (1979).
68. Aurbach, D. et al. Recent studies on the correlation between surface chemistry, morphology, three-dimensional structures and performance of Li and Li-C intercalation anodes in several important electrolyte systems. J. Power Sources 68, 91–98 (1997).
69. Laik, B., Chaussé, A., Messina, R. & Barthes-labrousse, M. G. Analysis of the surface layer on a petroleum coke electrode in tetraglyme solutions of lithium salts. Electrochim. Acta 46, 691–700 (2000).
70. Kanamura, K., Tamura, H. & Takehara, Z. ichiro. XPS analysis of a lithium surface immersed in propylene carbonate solution containing various salts. J. Electroanal. Chem. 333, 127–142 (1992).
71. Vetter, J. et al. Ageing mechanisms in lithium-ion batteries. J. Power Sources 147, 269–281 (2005).
72. Andersson, A. M., Herstedt, M., Bishop, A. G. & Edström, K. The influence of lithium salt on the interfacial reactions controlling the thermal stability of graphite anodes. Electrochim. Acta 47, 1885–1898 (2002).
73. Newman, G. H., Francis, R. W., Gaines, L. H. & Rao, B. M. Hazard Investigations of LiClO4 / Dioxolane Electrolyte. J. Electrochem. Soc. 127, 2025 (1980).
74. Glugla, P. G. Inefficiency mechanisms in plating and stripping lithium from a LiAsF6/dioxolane electrolyte. in Proc.-Electrochem. Soc.;(United States) 80, (GE, Schenectady, NY, USA, 1980).
75. Aurbach, D., Youngman, O. & Pnina, D. The electrochemical behaviour of 1,3-dioxolane—LiClO4 solutions—II. contaminated solutions. Electrochim. Acta 35, 639–655 (1990).
76. Li, C., Gu, L. & Maier, J. Enhancement of the Li conductivity in LiF by introducing glass/crystal interfaces. Adv. Funct. Mater. 22, 1145–1149 (2012).
77. Keller, M., Varzi, A. & Passerini, S. Hybrid electrolytes for lithium metal batteries. J. Power

Sources 392, 206–225 (2018).

download fileview on ChemRxivBusche_et_al_Formation.pdf (2.11 MiB)

The formation of the solid-/liquid electrolyte interphase (SLEI) on NASICON-type glass ceramics and LiPON
Martin R. Buschea, Thomas Leichtweissb, Carsten Fiedlera, Thomas Drossela, Matthias Geißa,b,
Manuel Weissa,b, Achim Kronenbergera, Dominik A. Webera, Jürgen Janeka,b*
a) Institute of Physical Chemistry, Justus-Liebig-University Giessen, Heinrich-Buff-Ring
17, D-35392 Giessen, Germany.
b) Center for Materials Research (LaMa), Justus-Liebig-University Giessen, Heinrich-
Buff-Ring 16, D-35392 Giessen, Germany.
* Corresponding author: [email protected]
Basic analysis of the “LiPON” thin films by means of XRD, SEM and electrochemical impedance
spectroscopy
Figure SI 1: X-ray diffraction pattern of pristine “LiPON” samples (C1, dark blue) and LiPON (C2, light blue) in comparison to the Li3PO4 reference 01-074-0358, revealing an amorphous thin-film without any reflexes with respect to the setup accuracy. Long term storage of both thin films under lab atmosphere reveal the (002) reflection of lithium carbonate at a 2ϑ -angle of 31.4 °, whereas storage under lithium did not show any degradation after two weeks.

Figure SI 2: Investigation on the thermal stability of a “LiPON“-thin film deposited on a glass substrate. In order to obtain high intensities with the XRM-chamber, deposition time was increased to 16 h. Temperature was increased up to 525 °C with a rate of 10 K/min. Up to 200 °C, no change of the amorphous film could be noticed. At 300 °C, a reflex at 31.4 / 2ϑ evolved indicating the formation of Li2CO3 that reached a maximum at 450 °C and vanished when reaching 500 °C where the film partially transformed to Li3PO4.

Figure SI 3: SEM micrographs of LiPON (C1) on porous anodized alumina substrate ((Whatman® Anodisc Inorganic Membrane) with a pore size of 100 nm. The illustration shows the different positions of the micrographs, featuring a surface view (top left), an edge view (top right), a cross section (bottom left) and a non-covered bottom side of the substrate. The cross section reveals a dense and homogeneous coating with a film thickness of 4.5 µm. Due to the “upside-down” setup of the reaction chamber with the LiPO4 target placed under the substrate, a very smooth film is produced with only very few “droplets”.

Figure SI 4: SEM micrographs of LiPON (C2) on porous anodized alumina substrate ((Whatman® Anodisc Inorganic Membrane) with a pore size of 100 nm. The illustration shows the different positions of the micrographs, featuring a surface view (top left), an edge view (top right), a cross section (bottom left) and a non-covered bottom side of the substrate. The cross section reveals a dense and homogeneous coating with a film thickness of 2.5 µm. Both from top view and cross section, we assume a less homogeneous film due to the sputter target being placed on top of the substrate and the higher deposition rates.

Figure SI 5: Atomic force microscopy (AFM) results of the samples LiPON C1 (a,b), LiPON C2 (c,d) and LICGC (e,f).
LiPON samples were analysed without further treatment. LICGC sample was rinsed with isopropyl
alcohol and cleaned with a lint-free cloth. AFM results were obtained with a Nanosurf LensAFM and
Easyscan 2 controller (Nanosurf AG, Switzerland) on a Halcyonics vibration isolating table (Accurion
GmbH, Germany). Data processing was performed with the Gwyddion software suite (version 2.51).
Topology information is denoted by colour in the micrographs on the left pane (see colour bars) and
isometric views on the right column. Please note that the z-axis is magnified by a factor of three for
the LiPON samples and thirty for the LICGC sample, respectively.

Table SI 1: Results roughness analysis
LiPON C1 LiPON C2 LICGC
Average value / µm 1.428 1.600 0.02
RMS roughness (Sq) / nm 318.2 605.9 6.20
Mean roughness (Sa) / nm 252.9 489.2 3.50
Skew Ssk 0.1610 0.1809 3.78
Kurtosis 13.37e-3 -0.3270 25.62
Maximum peak height Sp / µm 1.002 1.813 0.11
Maximum pit depth Sv / µm 1.082 1.600 0.00
Maximum height Sz / µm 2.083 3.413 0.13
Projected area Ap / µm2 625 625 625
Surface area Aeff / µm2 808 982 627.30
Aeff / Ap 1.2928 1.5712 1.00368

Figure SI 6: Arrhenius plot (top) and room temperature Nyquist plot (bottom) of a LiPON (C1) sample on glass substrate with blocking Au electrodes in lateral position. The electrode geometry featuring 2 Au electrodes deposited by physical vapour deposition technique under vacuum is given in the inset. Room temperature conductivity of the sample is (8 ± 0.8) · 10−7 S·cm−1, derived by the ohmic resistance as real component of Z. Please note that both the imaginary as well as the real axis were normalized to the areal resistance. Furthermore, the results were re-calculated to the thickness of the thin film (4.5 µm) in axial direction to allow for maximum comparability to the 4 p results. As expected for an amorphous sample, only one semi-circle is visible, assigned to transport of the mobile charge carriers through the thin film. As the gold electrodes can be considered as blocking for the Li ions, charge transport changes from majority charge carriers (Li ions) to the minority charge carriers (electrons) when frequencies tend to zero leading to high impedances and hence a slope in –Im( Z ). Temperature dependency of the conductivity reveals an activation energy of (521 ± 4) meV. X-error-bars represent maximum temperature deviations caused by the measurement setup (± 0.3 °C), y-error-bars are derived by law of error propagation based on the temperature deviations and fit uncertainties given by the fit routine (for details see description below).

Figure SI 7: Arrhenius plot (top) and room temperature Nyquist plot (bottom) of a LiPON (C2) sample on glass substrate with blocking Au electrodes in lateral position. The electrode geometry featuring 2 Au electrodes deposited by physical vapour deposition technique under vacuum is given in the inset. Room temperature of the samples is (1.1 ± 0.1) · 10−6 S·cm−1, derived by the ohmic resistance as real component of Z. Please note that both the imaginary as well as the real axis were normalized to the areal resistance. Furthermore, the results were re-calculated to the thickness of the thin film (2.5 µm) in axial direction to allow for maximum comparability to the 4 p results. As expected for an amorphous sample, only one semi-circle is visible, assigned to transport of the mobile charge carriers through the thin film. As the gold electrodes can be considered as blocking for the Li ions, charge transport changes from majority charge carriers (Li ions) to the minority charge carriers (electrons) when frequencies tend to zero leading to high impedances and hence a slope in –Im( Z ). Temperature dependency of the conductivity reveals an activation energy of (506 ± 2) meV. X-error-bars represent maximum temperature deviations caused by the measurement setup (± 0.3 °C), y-error-bars are derived by law of error propagation based on the temperature deviations and fit uncertainties given by the fit routine (for details see description below).

Figure SI 8: Arrhenius plot (top) and room temperature Nyquist plot (bottom) of a LiPON (C2) sample on glass substrate with blocking Au electrodes in axial position. The electrode geometry featuring 2 Au electrodes deposited by physical vapour deposition technique under vacuum first on the glass substrate and then – after sputter deposition – on the LiPON thin film perpendicular to each other is given in the inset. Room temperature of the samples is (1.3 ± 0.1) · 10−6 S·cm−1, derived by the ohmic resistance as real component of Z. Please note that both the imaginary as well as the real axis were normalized to the areal resistance. We assume a slight overestimation of the conductivity as not only the thin film between the overlapping areas of the Au electrodes may contribute to the Li ion transport. As expected for an amorphous sample, only one semi-circle is visible, assigned to transport of the mobile charge carriers through the thin film. As the gold electrodes can be considered as blocking for the Li ions, charge transport changes from majority charge carriers (Li ions) to the minority charge carriers (electrons) when frequencies tend to zero leading to high impedances and hence a slope in –Im( Z ). Temperature dependency of the conductivity reveals an activation energy of (504 ± 2) meV. X-error-bars represent maximum temperature deviations caused by the measurement setup (± 0.3 °C), y-error-bars are derived by law of error propagation based on the temperature deviations and fit uncertainties given by the fit routine (for details see description below). Especially due to the very high reproducibility of the activation energy in axial and lateral direction we assume an isotropic conductance throughout the thin-film.

Notes on the electrochemical impedance spectroscopy data fitting,
determination of activation energies and error analysis
Taking into account that all semi-circles in the impedance spectra were slightly suppressed,
these were fitted using a (RQ)-element according to the equivalent circuit comprising an
ohmic resistor and a constant phase element (CPE) in parallel. Considering the deviations from
an ideal capacitor-behavior in an (RC)-circuit, thus, the parallel circuit of an ohmic resistor and
a capacitor, the complex impedance ZCPE(ω) is derived by:
𝑍CPE(𝜔) = 1
𝑄 ∙ (𝑖𝜔)𝛼
The effective, non-complex capacity associated with the (RQ)-circuit is than determined to be:
𝐶 =(𝑅 ∙ 𝑄)
1𝛼
𝑅
By law of error propagation, the associated error equals:
∆𝐶 = |(𝑅 ∙ 𝑄)
1𝛼
𝛼 ∙ 𝑅 ∙ 𝑄| ∙ ∆𝑄 + |
(𝛼 − 1)(𝑅 ∙ 𝑄)1𝛼
𝛼 ∙ 𝑅2| ∙ ∆𝑅 + |
(𝑅 ∙ 𝑄)1𝛼 ∙ ln (R ∙ Q)
𝛼2 ∙ 𝑅| ∙ ∆𝛼
All Arrhenius diagrams presented in this study provide (1) error bars for the data points of
(1/T; ln(σ∙T)) and (1/T; ln(σ)), respectively, as well as (2) a given error for the activation energy.
Point 1 was carried out as well for the temporal evolution of resistances. Data fitting was
carried out using ZSimpWin 3.21 (EChem Software) and RelaxIS 2.4.1.12 (RHD Instruments) by
least squares method. For each resistance and capacity value, a relative error was provided by
the software algorithm, both counting as a systematic error. The error bars are derived by law
of error propagation based on the temperature deviations and fit uncertainties as given by:
∆ ln (𝑇
𝑅) = |
𝜕 ln (𝑇𝑅)
𝜕𝑅| 𝛥𝑅 + |
𝜕 ln (𝑇𝑅)
𝜕𝑇| 𝛥𝑇 =
Δ𝑅
𝑅+
Δ𝑇
𝑇
∆ ln (1
𝑅) = |
𝜕 ln (1𝑅)
𝜕𝑅| 𝛥𝑅 =
Δ𝑅
𝑅
Δ (1
𝑇) = |
∂ (1𝑇)
𝜕𝑇| ∙ Δ𝑇 =
Δ𝑇
𝑇2
For determination of activation energies, linear fitting cannot be carried out by the usually
conducted approximation via a least squares method (linear regression) as both the ordinate
and abscissae are containing errors. Instead, data-fitting was carried out using the York1,2

method taking into account the weighted errors and error correlation to derive the correct
slope and deviation of the slope. The errors are correlated by a proportionality factor of 1:
ln (𝑇
𝑅) ∼ Δ𝑇 ∼ Δ (
1
𝑇)
Parameter study of “LiPON” (C1) with respect to growth rates and room temperature conductivity
Figure SI 9: Contour plot visualizing the influence of the injected RF-power and the nitrogen partial pressure on the deposition rate (top) and ionic conductivity (bottom) of the “LiPON” thin films prepared by RF magnetron sputtering.

Figure SI 10: Wiring diagram of the DC-polarisation setup for determination of partial electronic conductivity of
the solid electrolyte pellet. The Keithley 6430 sub-femtoamp sourcemeter with preamp is used as voltage source and highly sensitive current-meter. The Keithley 6517a high resistance meter is used as additional potential probing to exclude steering effects of the sourcemeter. A faraday cage was used to exclude environmental effects. A precise determination of electronic and ionic transference numbers as function of the Li chemical potential by a Wagner-Hebb-polarization-experiment3–6 was not possible due to the instability of our samples against metallic lithium. Instead, we used two blocking gold electrodes, considering the experimental limitations: (1) The chemical potential of Li in the solid electrolyte was not fixed. (2) Therefore, being a function of the chemical potential of Li7, the electronic partial conductivity of both active materials changes with the polarization voltage applied.
Figure SI 11: Results of the DC Polarization experiments on LiPON C1 featuring a polarization curve obtained at 3 V (a) and the electronic conductivity determined by the remanent current after 24 h of polarization (b). Setup and assumptions see Fig. SI 10.
Figure SI 12: Results of the DC Polarization experiments on LiPON C2 featuring a polarization curve obtained at 3 V (a) and the electronic conductivity determined by the remanent current after 24 h of polarization (b). Setup and assumptions see Fig. SI 10.

X-ray analysis of the LICGC solid electrolyte
The composition of the crystalline fraction of the Ohara LICGC® sample was determined by X-
ray diffraction. As a starting point for the refinement, the nominal stoichiometry Li1+x+yAlxTi2-
xSiyP3-yO12, as mentioned on the supplier’s specification sheet, was used to create the
structural model for the NASICON-type material in the space group 𝑅3𝑐. The occupations for
the Al- and Ti- as well as for the P- and Si-position were varied during the refinement along
with the occupation of the Li2-position in order to determine the actual stoichiometry of the
crystalline phase. As a second phase, β-cristobalite type AlPO4 (space group 𝐹43𝑚) was
identified and included into the model, leading to a decent Goodness-of-fit of S = 1.98. As a
third possible phase with a very low fraction, GeO2 (space group 𝑃3121) was added but did
not lead to further improvement of the refinement. Instead, the quality of the refinement
suffered from the inclusion of this very diminutive – if even present – side phase. Given the
reported stoichiometry of the sample, there is also a chance for the presence of β-cristobalite
type SiO2 in the sample. Including this material into the structural model – may it be in addition
to or as a substitute for AlPO4, the reflection-based R factors RBragg and Rf, which give an
additional indication for the adequate reproduction of crystallographic observations by the
structural model, became higher than 5 %. Therefore, SiO2 was excluded from the final
refinement. Graphical and numerical results of the refinement are presented in Figure SI 13
and Tables SI 2 and 3.
Figure SI 13: X-Ray diffraction diagram (PANalytical Empyrean diffractometer, CuKα-radiation, Bragg-Brentano geometry, PIXcel3D area detector) of a LICGC® sample (pellet) with graphical results of the Rietveld refinement. Besides the main NASICON-type phase, 7.4 wt.-% of AlPO4 (β-cristobalite type) were found.

Table SI 2: Numerical results of the Rietveld refinement of a LICGC sample (pellet).
diffractometer PANalytical Empyrean MPD
wavelength Cu Kα (λ1 = 154.056 pm; λ2 = 154.539 pm; I(λ1/ λ2 = 2)
profile points 8841
2θ range 5–120°
phase LICGC (NASICON-type) AlPO4 (β-cristobalite type)
determined stoichiometry Li2.46Al0.21Ti3.79Si1.25P1.75O12 AlPO4 (not refined)
space group R3c F43m
lattice parameters a = 837.86(1) pm a = 716.37(8) pm
c = 2073.68(5) pm
unit cell volume 1260.70(4) ∙ 106 pm3 367.63(7) ∙ 106 pm3
calculated density 3.16 g ∙ cm−3 2.20 g ∙ cm−3
RBragg 0.0277 0.0293
Rwp 0.0261
Rexp 0.0132
S 1.98
determined mass fraction 92.6(4) wt.% 7.4(2) wt.%
Table SI 3: Structural parameters for the LICGC sample (pellet) with AlPO4 fraction. Isotropic Debye-Waller factors for Lithium atoms were fixed to Biso = 2.000 Ų, for AlPO4, Al and P were fixed to Biso = 1.000 Ų and O was fixed to Biso = 2.000 Ų. For LICGC, the occupation of the Li2 position was constrained to vary with the occupation of the Al1 and the Si1 position.
Phase Atom Site x y z Biso/Ų Occ.
LICGC Li1 6b 0.00000 0.00000 0.00000 2 0.167
Li2 18e 0.63300 0.00000 0.25000 2 0.081(3)
Ti1 12c 0.00000 0.00000 0.14114(3) 1.44(3) 0.367(3)
Al1 12c 0.00000 0.00000 0.14114(3) 1.44(3) 0.020(3)
P1 18e 0.2880(1) 0.00000 0.25000 2.21(4) 0.292(6)
Si1 18e 0.2880(1) 0.00000 0.25000 2.21(4) 0.208(6)
O1 36f 0.1830(2) -0.0184(3) 0.18815(9) 3.11(6) 1.000
O2 36f 0.1864(2) 0.1620(2) 0.07995(9) 1.99(5) 1.000
AlPO4 Al1 4a 0.00000 0.00000 0.00000 1 0.042
P1 4c 0.25000 0.25000 0.25000 1 0.042
O1 48h 0.10730 0.10730 0.18830 2 0.167

Figure SI 14: Arrhenius plot (top) and room temperature Nyquist plot (bottom) of a LICGC sample (150 µm thickness). Blocking Au electrodes have been deposited via physical vapour deposition on exact opposite sides of the glass ceramic. The Room temperature of the sample is (8.3 ± 0.3) · 10−4 S·cm−1, derived by the ohmic resistance as real component of Z. Please note that both the imaginary as well as the real axis were normalized to the areal resistance. Two RQ-elements, denoted as flat semi-circles in the Nyquist plot have been used to fit the high- and medium frequency data. The high frequency semi-circle which is rarely visible at room temperature is assigned to the intragrain / bulk conduction, the medium frequency semi-circle denotes the intergrain / grain-boundary conduction. As the gold electrodes can be considered as blocking for the Li ions, charge transport changes from majority charge carriers (Li ions) to the minority charge carriers (electrons) when frequencies tend to zero leading to high impedances and hence a slope in –Im( Z ). Temperature dependency of the conductivity reveals activation energies of (406 ± 6) meV for the grain boundary conduction and (312 ± 9) meV for bulk conduction, respectively. X-error-bars represent maximum temperature deviations caused by the measurement setup (± 0.3 °C), y-error-bars are derived by law of error propagation based on the temperature deviations and fit uncertainties given by the fit routine (for details see description below).

Figure SI 15: Technical drawing of the Giessen 4-point EIS measurement cell built for both macroscopic solid electrolytes and supported thin films and schematic overview of the measurement chamber: Two LE compartments are separated by the laterally sealed SE. The electrochemically active compartment (see blue area in the inset cross-section) is a cylinder of 12 mm height and 12 mm diameter. The reference electrodes are placed with a distance of 8 mm in between. For comparison between EIS spectra it is important to distinguish the cell constants of two independent experiments: With only the counter electrodes contacted (2-point mode), the cell constant comprises the whole void volume of the cell with 12 mm electrode distance (large cell constant). In 4-point mode, with the potential probes contacted, the cell constant refers only to the fraction of the void volume between the reference electrodes with 8 mm distance (small cell constant), respectively.
Figure SI 16: Laterally sealing the solid electrolyte pellet in three steps: (a) Positioning of pre-formed PE-rings and solid electrolyte. (b) Applying pressure and heat (130 °C) inside a circular brass mold. After cooling down and removing the outer mold and some burr, the laterally sealed solid electrolyte can be removed (c, d). For better contrast, black PE-rings were used for these pictures instead of transparent ones that were used for the experiments.
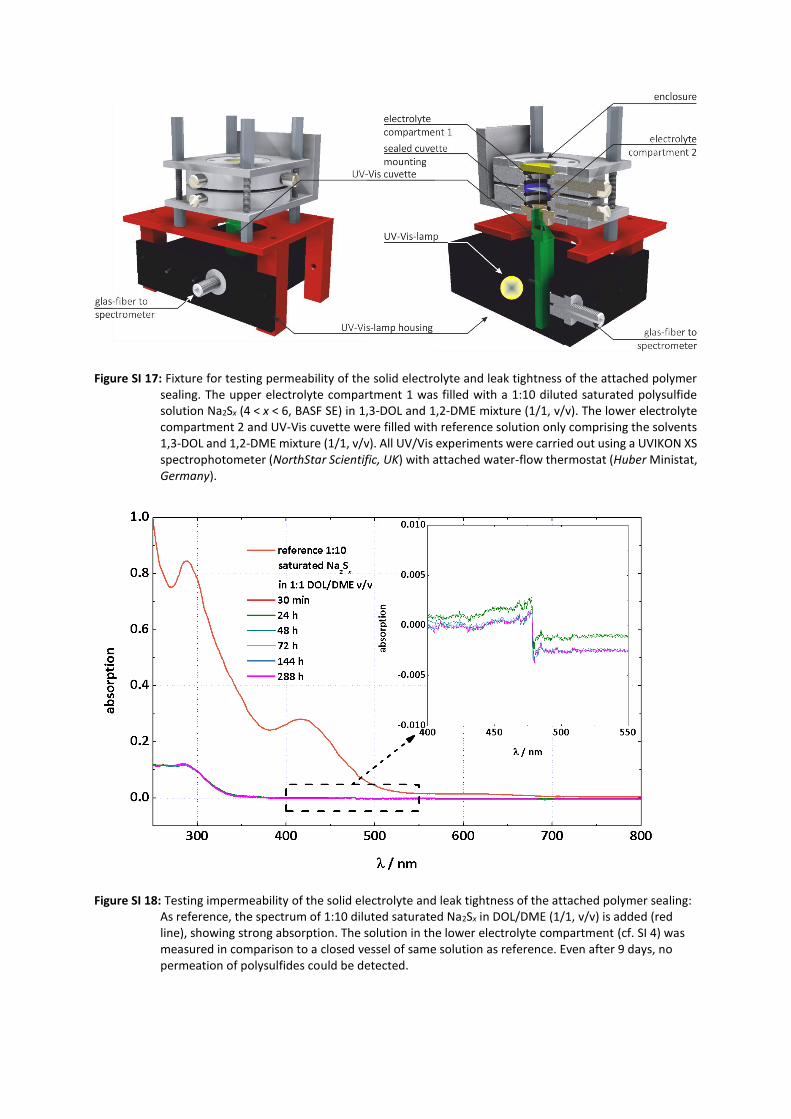
Figure SI 17: Fixture for testing permeability of the solid electrolyte and leak tightness of the attached polymer sealing. The upper electrolyte compartment 1 was filled with a 1:10 diluted saturated polysulfide solution Na2Sx (4 < x < 6, BASF SE) in 1,3-DOL and 1,2-DME mixture (1/1, v/v). The lower electrolyte compartment 2 and UV-Vis cuvette were filled with reference solution only comprising the solvents 1,3-DOL and 1,2-DME mixture (1/1, v/v). All UV/Vis experiments were carried out using a UVIKON XS spectrophotometer (NorthStar Scientific, UK) with attached water-flow thermostat (Huber Ministat, Germany).
Figure SI 18: Testing impermeability of the solid electrolyte and leak tightness of the attached polymer sealing: As reference, the spectrum of 1:10 diluted saturated Na2Sx in DOL/DME (1/1, v/v) is added (red line), showing strong absorption. The solution in the lower electrolyte compartment (cf. SI 4) was measured in comparison to a closed vessel of same solution as reference. Even after 9 days, no permeation of polysulfides could be detected.

Experimental challenges and evaluation of the 4-point-measurement setup
Extensive work has been carried out on thoroughly testing the setup from cell to impedance
analysis and to reveal and eliminate possible pitfalls: (1) incomplete exclusion of the CE/LE-
interface through an erroneous 4P-setup, (2) incomplete blocking of SE or lateral sealing or (3)
electrolyte loss through leakage of the cell setup. We therefore made additional reference
experiments and add some information on our testing procedure comprising time dependent
2-point and 4-point measurements (a) with only LE and (b) with SE and LE. Especially point (a)
is crucial, as a 100 % functional elimination of the CE/LE-interface in the spectrum has to be
proven. Otherwise, a fraction of this very interface resistance contributes to the spectrum and
results in an overestimation of RSE/LE and misleading interpretation of attributed activation
energies EA,SE/LE.
Figure SI 19: (a) Comparison of 2-point and 4-point contacting of the cell without a SE directly after assembly and after a shelf time of 72 h, see text. The pictograms are used to distinguish between 4-point and 2-point contacting of the cell. (b) Magnified Nyquist plot of the 4-point EIS measurement of the cell without a solid electrolyte. Small deviations from the purely ohmic behavior of the LE are visible, see text.
a) Figure SI19a shows a comparison of 2P- and 4P-measurements without a SE. The cell was filled
with 1 M LiTFSI in DOL/DME (1/1, v/v) and measured over a time-span of 72 h beginning
directly after assembly. In 2P-mode with only the CE contacted, a flat and slightly asymmetric
semi-circle of the LE/CE-interface appears that more than doubles from 375 Ω (apex frequency
of 300 Hz) during the first 24 h and then becomes stable at 810 Ω (apex frequency of 150 Hz).
This is well expected as a result of SEI formation on the lithium electrode and hence RCE,LE
increases. The slight suppressed asymmetrical semi-circles are in very good agreement to
former studies on the Li/LE interface8–11. However, a systematical investigation on that
phenomenon is beyond the scope of this work. The impedance spectrum completely changes
when using the RE as potential probes (4P-mode): In the first quadrant of the Nyquist plot,
only one point – attributed to the ohmic resistance of the LE – appears. The value Re( Z ) is
smaller than the high-frequency intercept of the semi-circle obtained at 2P-mode because of
the cell constant changing from the large value to the small value (see Fig. SI19b). At highest
frequencies (20 MHz to 10 MHz), small deviations from the purely ohmic behavior are evident
and are attributed to the four-point-setup since the used coaxial cables provide large
capacitance coupling to ground12. The effect is only mitigated but not eliminated by the used

active shielding (cable shielding potential equal to central conductor) but does not affect the
relevant frequency interval of 10 MHz to 1 Hz. The minute growth of RLE,bulk by 2 Ω may be due
to a small change in the LE properties due to its reaction with the Li-electrodes. These results
clearly proof the principle of eliminating the CE/LE-contribution through the 4P-setup.
b) Additionally, we compare the impedance spectra of the four-point setup in 2-point- and 4-
point mode with a SE pellet and LE (1 M LiTFSI in DOL/DME, water content below 5 ppm) as
denoted in Fig. SI20. Due to the superposed contribution of the CE/LE-interface, two
modifications hinder a determination of the SE/LE-interface: (1) As the asymmetric semi-circle
of the CE/LE-interface ranges from 1 Mhz to 1 Hz (cf. Fig. SI19a), a significant stretching of the
whole spectrum takes place as the high frequency fraction of the CE/LE-interface-impedance
mixes with RLE,bulk, RSE,bulk and RSE,gb. (2) The interfacial resistance between Li-electrodes and
liquid electrolyte show apex frequencies between 300 Hz (0h) and 150 Hz (72 h), see Fig. SI19a.
Thus, predominantly the third low-frequency semi-circle is overestimated. The solid lines
represent simulated spectra on the basis of parameters obtained by fitting of the experimental
data (open circles). As model, the R(RQ)(RQ)(RQ)(RQ)-equivalent circuit (see Fig. SI20) is used:
The additional resistance of the LE is compensated by an ohmic series resistor (1). The parallel
circuits of ohmic resistors R and CPE Q represent the intragrain (2) and intergrain (3) transport
in the solid electrolyte, the SE/LE interface (4) and the superposed CE/LE-interface (5). As the
CE/LE-interface increases from 0 h to 72 h, the modification of the spectrum becomes
aggravated. Especially for the 72 h spectrum, it was not possible to obtain satisfying decent
residual between simulated and experimental data without the fourth (RQ)-circuit due to the
superposition of the CE/LE and SE/LE-interface. Only the four-point-mode EIS measurement
allows the distinction of 3 semi-circles and hence the identification of the SE/LE interfacial
resistance by the complementary measurement of RSE,bulk and RSE,gb as denoted in the main
text.
Figure SI 20: Impedance spectra obtained by 2P contacting of the 4P-cell comprising LAGP pellet and liquid electrolyte (1 M LiTFSI in DOL/DME, water content below 5 ppm) directly after assembly (green, 0h) and after 72 h (blue). The parameters of the given equivalent circuit are fitted to the experimental data (open circles). Simulated spectra on the basis of the estimated parameters are denoted as solid lines. Especially the low frequency semi-circle after 72 h shows the superposition of the interfaces SE/LE and CE/LE with two different apex-frequencies of 1.5 kHz and 300 Hz.

Table SI 4: Components of the impedance spectra for the LICGC-based system.
Component/ unit
Representation 1,3DOL 1,2DME 1,3DOL/1,2DME
RLE,bulk / Ω∙cm2
Ohmic resistance of the liquid electrolyte
160±5 60±5 70±5
RSE,bulk / Ω∙cm2
Intragrain conduction in the solid electrolyte
40±5 35±5 35±5
QSE,bulk / S s−α
(1.0±0.6)·10−9 (1.6±0.6)·10−9 (1.3±0.6)·10−9
αSE,bulk 1.0±0.05 0.9±0.1 1.0±0.05
CSE,bulk / nF· cm−2
0.9±1.0 0.5±1.9 1.5±2.7
RSE,gb / Ω∙cm2 Intergrain conduction in the solid electrolyte
146.2±2.5 Ω∙cm2 140.4±1.8 Ω∙cm2 147.1±1.5 Ω∙cm2
QSE,gb / S s−α
(13.5±0.7)·10−9 S s−α (17.3±0.9)·10−9 S s−α (15.4±0.9)·10−9 S s−α
αSE,gb 0.92±0.01 0.89±0.01 0.91±0.01
CSE,gb / nF· cm−2
3.6±0.5 3.2±0.5 3.5±0.6 nF
RSLEI / Ω∙cm2 Transfer across through the SLEI after 24 h / after 144 h
20.8±0.4 Ω∙cm2
24.3±0.5 Ω∙cm2 99.0±0.1 Ω∙cm2
175.5±0.5 Ω∙cm2 43.8±0.3 Ω∙cm2
66.6±0.9 Ω∙cm2
QSLEI / S s−α
(4.0±0.6)·10−6 S s−α
(3.6±0.6)·10−6 S s−α (3.1±0.03)·10−6 S s−α
(3.9±0.07)·10−6 S s−α (4.3±0.2)·10−6 S s−α
(1.2±0.09)·10−6 S s−α
αSLEI 0.99±0.02 1.00±0.02
0.943±0.001 0.906±0.003
0.932±0.005 0.907±0.01
CSLEI / µF· cm−2
3.2±0.1 3.5±1.1
1.7±0.04 1.6±0.08
2.0±0.17 1.9±0.38
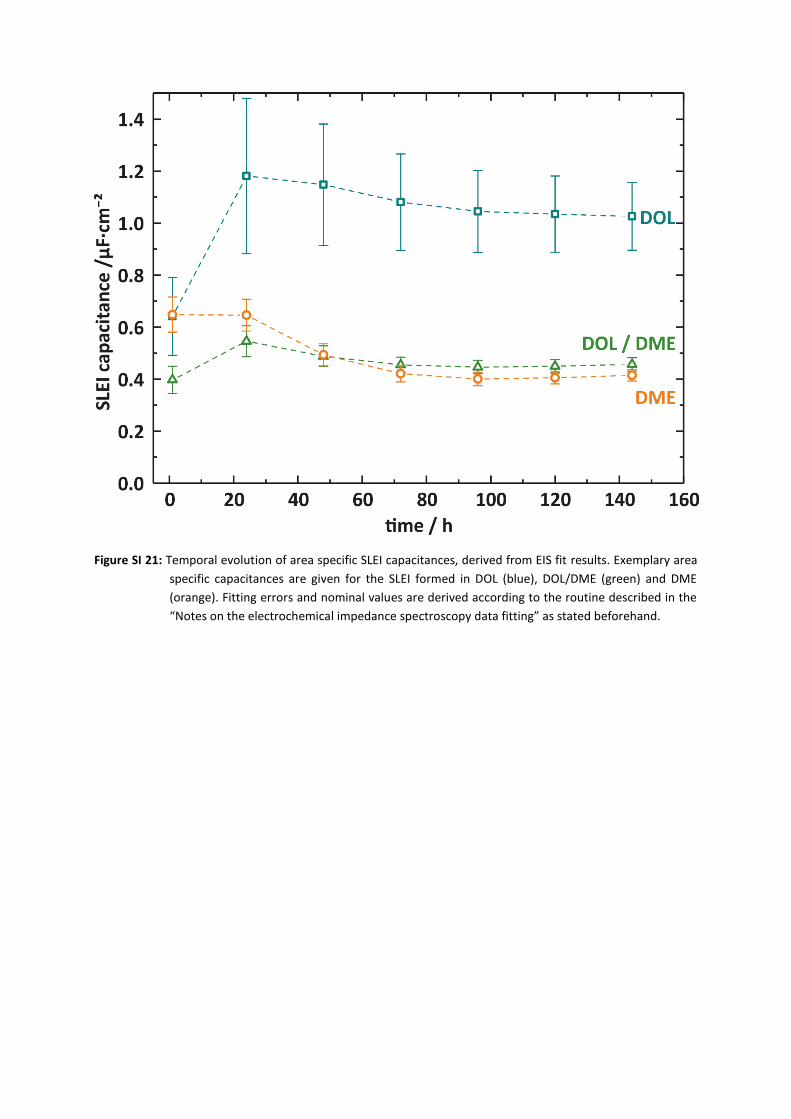
Figure SI 21: Temporal evolution of area specific SLEI capacitances, derived from EIS fit results. Exemplary area
specific capacitances are given for the SLEI formed in DOL (blue), DOL/DME (green) and DME
(orange). Fitting errors and nominal values are derived according to the routine described in the
“Notes on the electrochemical impedance spectroscopy data fitting” as stated beforehand.

Distribution of Relaxation Times (DRT)
Typically the impedance of the system under test can vary over ranges of magnitudes by
influence e.g. of cell geometry, different electrolytes with ranging conductivity, time by
decomposition of compounds or temperature. In this case the comparison of impedance
spectra is neither helpful in a Bode plot nor in a Nyquist plot, because small impedances are
covered by higher impedances.
For the interpretation of impedance data data sets with obvious and especially non obvious
overlapping processes, each modeled by RC equivalent circuits with nearly the same
relaxation time 𝜏 = 𝑅𝐶, are an another problem. The Distribution of Relaxation Times
Method of representing impedance data can deconvolute these overlapping processes by
identification of the physically motivated process specific relaxation time.
The idea of the Distribution of Relaxation Times has been already described by Macdonald in
195413. Starting from a discrete circuit consisting of a finite series of RC elements you can write
for the total impedance of the circuit 𝑍(𝜔) = ∑𝑅
𝑚
1+𝑖𝜔𝜏𝑚
𝑁
𝑚=1. The continuum transition
with infinite RC elements derives for the total impedance 𝑍(𝜔) = 𝑅 ∫𝛾(𝜏)
1+𝑖𝜔𝜏ⅆ𝜏
∞
0 with the
normalized distribution of relaxation times () with normalization functional ∫ 𝛾(𝜏) ⅆ𝜏 = 1∞
0.
The inverse problem is now to reconstruct the distribution of relaxation times with the
impedance data as input13. A discrete Fourier Transformation is a possible solution of this
integral equation. Under assumption of the validity of the Kramers-Kroning relation (causal,
stable and linear responding system) the real part of the impedance can be neglected and all
calculations can be done with only the imaginary part of the impedance13. By variable
substitution a convolution of the wanted distribution of relaxation times with an analytical
function is obtained. Transforming the integral equation into the Fourier space allows a simple
deconvolution of the distribution of relaxation times and subsequently inverse transformation
gives the distribution of relaxation times in the real space.
For numerical reasons an extrapolation of the impedance data has to be done and in Fourier
space a filter function has to be applied to reduce noise13. The extrapolation is done by a linear
fit in log-log representation of the imaginary part of the impedance over the frequency. The
validity of the extrapolation assumes that no active process takes place in the extrapolated
frequency ranges. An approved filter function is the Hanning filter as a reasonable
compromise between resolution and signal amplitude.

Figure SI 22: Distribution of relaxation times analysis of LiPON C1 treated for ~160 h in 1 M LiTFSI in DOL (a), DME
(b) and DOLDME (c). The component assigned to bulk transport in LiPON remains stable in both
height and relaxation time whereas the component assigned to the SLEI grows in height and
relaxation time as visible by reduction of the frequency ω.

XPS Survey Spectra
Figure SI 23: XPS survey spectra of LiPON (C1) samples comparing a pristine reference reference sample (orange, bottom); a sample that has been treated for ~160 h in 1 M LiTFSI in DOLDME (black, bottom middle); 1 M LiTFSI in DOL (blue, top middle) and 1 M LiTFSI in DME (green, top), respectively.
Figure SI 24: XPS survey spectra of LiPON (C2) samples comparing a pristine reference reference sample (orange, bottom); a sample that has been treated for ~160 h in 1 M LiTFSI in DOLDME (black, bottom middle); 1 M LiTFSI in DOL (blue, top middle) and 1 M LiTFSI in DME (green, top), respectively.

Figure SI 25: XPS survey spectra of Ohara LICGC® samples comparing a pristine reference reference sample (orange, bottom); a sample that has been treated for ~160 h in 1 M LiTFSI in DOLDME (black, bottom middle); 1 M LiTFSI in DOL (blue, top middle) and 1 M LiTFSI in DME (green, top), respectively.

XPS Detail Spectra of untreated samples
Figure SI 26: XPS detail spectra of an untreated LiPON (C1) sample, showing a carbon contamination mainly
assigned to aliphatic carbon species, but negligible amount of fluorine and no sulphur
contamination. Please note that the sample has never been exposed to Lab atmosphere, thus, we
assume that the carbon contamination is due to the glovebox atmosphere.
Figure SI 27: XPS detail spectra of an untreated LiPON (C2) sample, showing a carbon contamination mainly
assigned to aliphatic carbon species, but negligible amount of fluorine and no sulphur
contamination. Please note that the sample has never been exposed to Lab atmosphere, thus, we
assume that the carbon contamination is due to the glovebox atmosphere.

Figure SI 28: XPS detail spectra of an untreated LICGC sample, showing a carbon contamination mainly assigned to aliphatic carbon species, but negligible amount of fluorine and no sulphur contamination. Please note that the sample has never been exposed to Lab atmosphere, thus, we assume that the carbon contamination is due to the glovebox atmosphere.

XPS Detail spectra of treated samples
Figure SI 29: Full set of XPS detail spectra of a LiPON (C1) sample treated for ~160 h in 1 M LiTFSI in DOL (1st column, a, d, g, j); DME (2nd column, b, e, h, k) and DOLDME (3rd column, c, f, i, l).

Figure SI 30: Full set of XPS detail spectra of a LiPON (C2) sample treated for ~160 h in 1 M LiTFSI in DOL (1st column, a, d, g, j); DME (2nd column, b, e, h, k) and DOLDME (3rd column, c, f, i, l).
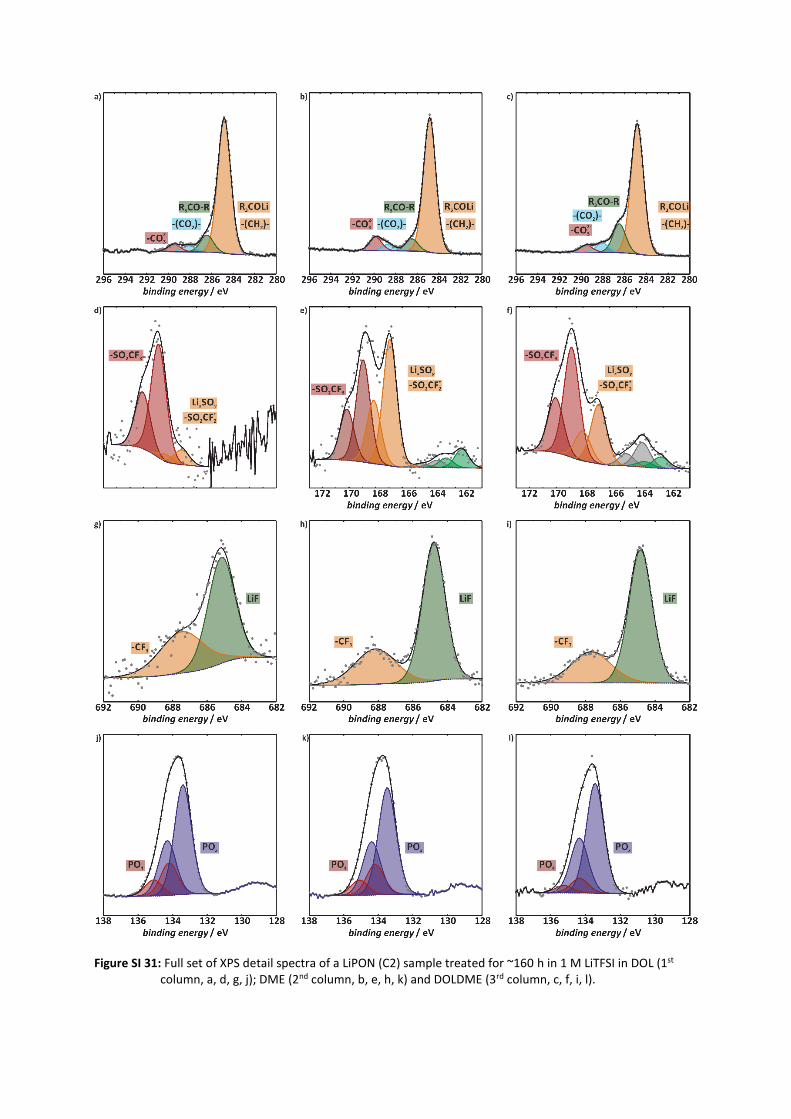
Figure SI 31: Full set of XPS detail spectra of a LiPON (C2) sample treated for ~160 h in 1 M LiTFSI in DOL (1st column, a, d, g, j); DME (2nd column, b, e, h, k) and DOLDME (3rd column, c, f, i, l).

Figure SI 32: XPS depth profiles for LiPON C1 treated for ~ 160 h in 1 M LiTFSI in DOL (a), DME (b) and DOLDME
(c). For attributions of species to the binding energies refer to Table 2 in the main text.

Table SI 5: Elemental quantification of LiPON IPI samples derived by XPS data.
O 1s Li 1s C 1s P 2p N 1s S 2p F 1s
at.%
Reference 28.9 25.1 13.2 16.2 16.5 0 0
DOL 24.3 17.7 29.6 8 10.2 3 7.1
DME 24.2 12.3 34 3.9 7 5.3 13.3
DOL/DME 28.5 5.6 56.9 2.3 3 1.2 2.5
Table SI 6: Elemental quantification of LiCGC samples derived by XPS data.
O 1s Li 1s C 1s P 2p N 1s S 2p F 1s Ti 2p Ge 3d
at.%
Ref 54,7 6,2 17,1 14,6 0,4 0 0,1 2,5 4,4
DOL 55,3 6,4 19,3 12,1 0,3 0,3 0,8 2,1 3,5
DME 40,2 12,5 37 4,8 0,4 1,2 1,9 0,8 1,3
DOLDME 32,9 9,5 50 1,8 0,6 1,7 2,9 0,2 0,4
Table SI 7: Relative atomic masses of selected secondary ion species observed via ToF-SIMS.
Depth profile
Secondary ion Mass / amu
Assumed origin
i P− 30.97 fragments of LiPON
PO− 46.97
Li3P− 52.02
LiPO− 53.98
LiPO2− 69.98
ii S− 31.97 fragments of (TFSI) SO− 47.97
SO2− 63.96
LiF− 26.01 conducting salt decomposition product
CF3− 69.00 fragment of TFSI
NS2O4C2F6− 279.90 TFSI
iii CH3O− 31.02 DME fragment alkoxide salt
C2H2O− 42.00 DOL/DME decomposition product alkoxide salt
CHO2− 45.00 DOL/DME decomposition product carboxylate salt14
CHO2−,P 45.00 DOL/DME decomposition product polymeric
species14
CO3− 59.98 DOL/DME decomposition product
(carbonates / semicarbonates )

Figure SI 33: Comparison of depth profiles for SO2- (violet), SO− (green) and S− (cyan) obtained by ToF-SIMS and
sputtering. LiPON (C1) samples have been treated in the four point cell for 165 h in DOL (full lines)
and DME (dotted lines). Along with consecutive sputtering, maxima are reached in the order SO2- ->
SO− -> S− for both samples. The maximum heights are substantially higher for the sample treated in
DME.
Figure SI 34: Comparison of depth profiles for C2H2O− (red), LiF− (blue) and S− (cyan) obtained by ToF-SIMS and
sputtering. LiPON (C1) samples have been treated in the four point cell for 165 h in DOL (full lines)
and DME (dotted lines). The signal obtained for LiF− is almost one order of magnitude higher for the
sample treated in DME compared to the respective signal for the sample treated in DOL. Whereas
maxima for C2H2O− and S− are reached at earlier sputter times as the LiF−-maximum for the DOL
sample, the sequence is switched for the DME sample.

1. York, D. Least squares fitting of a straight line with correlated errors. Earth Planet. Sci. Lett. 5, 320–324 (1968).
2. York, D., Evensen, N., Martínez, M. & Delgado, J. Unified equations for the slope, intercept, and standard errors of the best straight line. Am. J. 72, 367–375 (2004).
3. Hebb, M. H. Electrical Conductivity of Silver Sulfide. J. Chem. Phys. 20, 185–190 (1952).
4. Wagner, C. Investigations on Silver Sulfide. J. Chem. Phys. 21, 1819–1827 (1953).
5. Riess, I. Review of the limitation of the Hebb-Wagner polarization method for measuring partial conductivities in mixed ionic electronic conductors. Solid State Ionics 91, 221–232 (1996).
6. Hartmann, P. et al. Degradation of NASICON-Type Materials in Contact with Lithium Metal: Formation of Mixed Conducting Interphases (MCI) on Solid Electrolytes. J. Phys. Chem. C 117, 21064–21074 (2013).
7. Rosenkranz, C. & Janek, J. Determination of local potentials in mixed conductors - two examples. Solid State Ionics 82, 95–106 (1995).
8. Aurbach, D. et al. Recent studies of the lithium-liquid electrolyte interface Electrochemical, morphological and spectral studies of a few important systems. J. Power Sources 54, 76–84 (1995).
9. Aurbach, D. Review of selected electrode–solution interactions which determine the performance of Li and Li ion batteries. J. Power Sources 89, 206–218 (2000).
10. Aurbach, D. et al. On the Surface Chemical Aspects of Very High Energy Density, Rechargeable Li–Sulfur Batteries. J. Electrochem. Soc. 156, 694–702 (2009).
11. Xiong, S., Xie, K., Diao, Y. & Hong, X. Characterization of the solid electrolyte interphase on lithium anode for preventing the shuttle mechanism in lithium-sulfur batteries. J. Power Sources 246, 840–845 (2014).
12. Veal, B. W., Baldo, P. M., Paulikas, a. P. & Eastman, J. A. Understanding Artifacts in Impedance Spectroscopy. J. Electrochem. Soc. 162, H47–H57 (2014).
13. Schichlein, H., Müller, A., Voigts, M., Krügel, A. & Ivers-Tiffée, E. Deconvolution of electrochemical impedance spectra for the identification of electrode reaction mechanisms in solid oxide fuel cells. J. Appl. Electrochem. 32, 875–882 (2002).
14. Fiedler, C., Luerssen, B., Rohnke, M., Sann, J. & Janek, J. XPS and SIMS Analysis of Solid Electrolyte Interphases on Lithium Formed by Ether-Based Electrolytes. J. Electrochem. Soc. 164, A3742–A3749 (2017).

download fileview on ChemRxivBusche_et_al_Formation_Supplementary.pdf (6.52 MiB)