Embed Size (px)
Citation preview
University of Southern Queensland
Faculty of Engineering and Surveying
The Formation of Nitrogen Oxides
in a Pulverised Coal Boiler
A dissertation submitted by
Anthony Maldon Goodger
in fulfilment of the requirements of
Courses ENG4111 and 4112 Research Project
towards the degree of
Bachelor of Mechanical Engineering
Submitted: October, 2004
i
The Formation of Nitrogen Oxides in a Pulverised Coal Boiler
Abstract
The oxides of nitrogen (NOx) are airborne pollutants that result from the combustion
of pulverised coal. The aim of this project is to identify operational methods that
reduce the NOx emissions from a coal fired boiler whilst maintaining satisfactory
performance.
This project describes important combustion properties and the processes occurring
during the combustion of pulverised coal. Detail is provided on the pulverisation
plant, draught plant and steam system of a large utility boiler. The dominant NOx
formation mechanisms in coal fired boilers are discussed and NOx reduction
strategies applicable to these boilers are described. Engineering models are
developed to describe initial flame temperature, furnace residence times, furnace
heat pickup and thermal NOx formation.
A series of tests were designed and undertaken to measure and assess the effect on
NOx formation and boiler performance to variations in:-
• The distribution of secondary air to each windbox, and
• The level of excess oxygen measure at the boiler exit.
During each test the following was undertaken:-
• Detailed temperature survey of the furnace region
• Coal sampling for laboratory analysis
• Fly Ash sampling to determine loss of ignition
• Logs of relevant data to determine plant performance
Difficulties and shortcomings regarding the predictive models are discussed and the
performance of the boiler under each test is compared.
ii
The Formation of Nitrogen Oxides in a Pulverised Coal Boiler
Disclaimer
University of Southern Queensland
Faculty of Engineering and Surveying
ENG4111 & ENG4112 Research Project
Limitations of Use The Council of the University of Southern Queensland, its Faculty of Engineering and Surveying, and the staff of the University of Southern Queensland, do not accept any responsibility for the truth, accuracy or completeness of material contained within or associated with this dissertation. Persons using all or any part of this material do so at their own risk, and not at the risk of the Council of the University of Southern Queensland, its Faculty of Engineering and Surveying or the staff of the University of Southern Queensland. This dissertation reports an educational exercise and has no purpose or validity beyond this exercise. The sole purpose of the course pair entitled "Research Project" is to contribute to the overall education within the student’s chosen degree program. This document, the associated hardware, software, drawings, and other material set out in the associated appendices should not be used for any other purpose: if they are so used, it is entirely at the risk of the user. Prof G Baker Dean Faculty of Engineering and Surveying
iii
The Formation of Nitrogen Oxides in a Pulverised Coal Boiler
Certification
I certify that the ideas, designs and experimental work, results, analyses and conclusions set out in this dissertation are entirely my own effort, except where otherwise indicated and acknowledged. I further certify that the work is original and has not been previously submitted for assessment in any other course or institution, except where specifically stated. Anthony Maldon Goodger Student Number: 0039841349 Signature 22 October 2004 Date
iv
The Formation of Nitrogen Oxides in a Pulverised Coal Boiler
Acknowledgements
The author would like to sincerely thank the following people for their help and
support during the project:-
My wife Corin, daughter Joeli and other family members for their patience and
understanding over the duration of this project. I am looking forward to spending
some quality time with them after a very busy year.
The Operations and Maintenance staff at Stanwell Power Station who assisted me
with the testing component of the project.
Dr David Buttsworth, Dr Ahmad Sharifian and Dr Ruth Mossad for their assistance
and guidance throughout the completion of this project.
v
The Formation of Nitrogen Oxides in a Pulverised Coal Boiler
Table of Contents
Page
ABSTRACT i
DISCLAIMER ii
CERTIFICATION iii
ACKNOWLEDGEMENTS iv
TABLE OF CONTENTS v
LIST OF FIGURES xi
LIST OF TABLES xiii
GLOSSARY xiv
CHAPTER
1 INTRODUCTION
1.1 Introduction 2
1.2 Statement of the Problem 2
1.3 Aim 3
1.4 Objectives 3
1.5 Overview 4
1.5.1 Chapter 2 - Environmental and Economic Considerations
4
1.5.2 Chapter 3 – Coal Analysis and Boiler Plant 4
1.5.3 Chapter 4 – Coal Combustion Principles 4
1.5.4 Chapter 5 – NOx Creation Mechanisms and Control
4
Table of Contents vi
The Formation of Nitrogen Oxides in a Pulverised Coal Boiler
1.5.5 Chapter 6 – Engineering Models 5
1.5.6 Chapter 7 – Testing 5
1.5.7 Chapter 8 – Results 5
1.5.8 Chapter 9 - Conclusion 5
1.6 Risk Assessment 6
2 ENVIRONMENTAL & ECONOMIC CONSIDERATIONS
2.1 Environmental Impacts 8
2.1.1 Acid Pollution 8
2.1.2 NOx and the Environment 8
2.2 Economic Considerations 9
3 COAL ANALYSIS AND BOILER PLANT
3.1 Coal Analysis 12
3.1.1 Rank 12
3.1.2 Proximate Analysis 13
3.1.3 Ultimate Analysis 13
3.1.4 Specific Energy 14
3.2 Boiler Plant Description 15
3.2.1 Introduction 15
3.2.2 Water and Steam Plant 17
3.2.3 Draught Plant 21
3.2.4 Fuel and Combustion Plant 23
4 COAL COMBUSTION PRINCIPLES
4.1 Introduction 28
Table of Contents vii
The Formation of Nitrogen Oxides in a Pulverised Coal Boiler
4.2 Pulverised Coal Combustion within a Furnace 28
4.3 Mole and Mass Fractions 29
4.4 Stoichiometry Requirements 32
4.5 Simple Atom Balance 33
4.6 Equivalence Ratio 34
5 NOX CREATION MECHANISMS AND CONTROL
5.1 Introduction 38
5.2 NOx Creation Mechanisms 39
5.2.1 Fuel NOx 39
5.2.2 Thermal NOx 40
5.3 NOx Control 42
5.3.1 Combustion Optimisation 42
5.3.2 Overfire Air (OFA) 43
5.3.3 Advanced Low NOx Burners (ALNB) 44
5.3.4 Flue Gas Recirculation 45
5.3.5 Reburning 45
5.3.6 Selective Non Catalytic Reduction 46
5.3.7 Selective Catalytic Reduction 47
6 ENGINEERING MODELS
6.1 Introduction 49
6.2 An Engineering Model for Furnace Residence Times 49
6.2.1 Plug Flow 49
6.2.2 Residence Time Estimate for Stanwell Furnace 51
Table of Contents viii
The Formation of Nitrogen Oxides in a Pulverised Coal Boiler
6.3 An Engineering Model for Flame Temperature 53
6.4 An Engineering Model for Furnace Heat Pickup 54
6.5 An Engineering Model for Thermal NOx Production 57
7 TESTING
7.1 Introduction 66
7.2 Variables of Interest 66
7.2.1 Nox Production 66
7.2.2 Flame Temperature 67
7.2.3 Coal Sampling 69
7.2.4 Loss of Ignition 69
7.2.5 Furnace Heat Pickup 70
7.2.6 Economiser Excess Oxygen 71
7.3 Secondary Air Redistribution 72
7.3.1 Aim 72
7.3.2 Testing Method 72
7.3.3 Testing Assumptions 73
7.3.4 Specific Requirements 73
7.3.5 Boiler Conditioning 73
7.4 Test 1 74
7.5 Test 2 77
7.6 Test 3 79
7.7 Test 4 81
7.7.1 Aim 81
7.8 Variation in Excess Air 83
Table of Contents ix
The Formation of Nitrogen Oxides in a Pulverised Coal Boiler
7.8.1 Aim 83
7.8.2 Assumptions 83
7.8.3 Specific Requirements 83
7.9 Test 5 83
7.10 Test 6 86
7.11 Test 7 88
7.12 Testing Difficulties 90
8 RESULTS
8.1 Introduction 92
8.2 Flame Temperature Comparison 92
8.3 Loss of Ignition 93
8.4 Furnace Heat Pickup 94
8.5 Thermal NO Prediction 97
8.6 Measured NO Levels During Testing 98
8.6.1 Secondary Air Redistribution 98
8.6.2 Excess Air Variation 100
9 CONCLUSION
9.1 Introduction 102
9.2 Achievement of Objectives 102
9.3 Further Work 103
Table of Contents x
The Formation of Nitrogen Oxides in a Pulverised Coal Boiler
LIST OF REFERENCES 104
APPENDIX
A Project Specification 106
B Calculation of Flame Temperature 107
C Periodic Table 113
D Coal Analysis and Test Data 114
xi
The Formation of Nitrogen Oxides in a Pulverised Coal Boiler
List of Figures
Figure Page
3.1 General Boiler Arrangement 16
3.2 Cross Section of Steam Drum 18
3.3 Natural and Forced Circulation Systems 19
3.4 Membrane Water Wall Construction showing Pulverised Fuel Burner Openings
20
3.5 Water Wall Tubes 20
3.6 Rosin-Rammler Chart for Pulverised Coal 23
3.7 Typical Flame Speeds for Sub-Bituminous Pulverised Coals and Air
24
3.8 Swirl Burner 25
3.9 Aerodynamic Flow Pattern in a Swirl Burner 26
4.1 Processes Occurring During Combustion 29
5.1 Relative Contribution of Fuel NO and Thermal NO to Total NOx Emissions
38
5.2 Conceptual Diagram of Fuel Bound Nitrogen to NOx 39
5.3 NOx Reduction by Overfire Air 43
5.4 Low NOx Burner 44
5.5 NOx Reduction by Reburning 46
6.1 Plug Flow 50
6.2 Plug Flow with a Degree of Mixing 51
6.3 Residence Time Estimate for Stanwell Furnace 52
6.4 Furnace Heat Pickup System 55
List of Figures xii
The Formation of Nitrogen Oxides in a Pulverised Coal Boiler
6.5 Furnace Zones for Initial Thermal NO Prediction 61
6.6 Thermal NO Formation 64
7.1 Measuring Principle of GM 31 67
7.2 Location of Temperature Measurement Points 68
7.3 Cegrit Sampler 70
7.4 Excess Oxygen Control Logic 71
7.5 Opposed Wall Fired Boiler 72
8.1 Comparison of Predicted and Measured Temperatures for Top Row
Burners 92
8.2 Comparison of Predicted and Measured Temperatures for Bottom
Row Burners 93
8.3 Loss of Ignition and Ash Content of Coal 94
8.4 Furnace Heat Ratio and Specific Energy of Coal 96
8.5 Predicted NO for Test 1 97
8.6 NO Produced for Secondary Air Redistribution Tests 99
8.7 Comparison of NO Produced with Furnace Heat Ratio for Tests 1-4 99
8.8 Comparison of NO Produced with Furnace Heat Ratio for Tests 4-6 100
xiii
The Formation of Nitrogen Oxides in a Pulverised Coal Boiler
List of Tables
Table Page
1.1 Risk Assessment and Control Measures 6
3.1 ASTM Classification of Coal by Rank 12
3.2 Analysis of a Typical Australian Coal 15
4.1 Coal Analysis 31
7.1 Test 1 Windbox Damper Positions 75
7.2 Test 1 Data 76
7.3 Test 2 Windbox Damper Positions 77
7.4 Test 2 Data 78
7.5 Test 3 Windbox Damper Positions 79
7.6 Test 3 Data 80
7.7 Test 4 Windbox Damper Positions 81
7.8 Test 4 Data 82
7.9 Test 5 Data 85
7.10 Test 6 Data 87
7.11 Test 7 Data 89
8.1 Enthalpy Change from Economiser Outlet to Boiler Drum Steam
Outlet
95
8.2 Furnace Heat Ratio 96
xiv
The Formation of Nitrogen Oxides in a Pulverised Coal Boiler
Glossary
adb Air Dried Basis
AGC Automatic governor control
ALNB Advanced low NOx burners
ASTM American Society for Testing and Materials
BLSP Boiler load set point
CO Carbon Monoxide
CO2 Carbon Dioxide
CV Calorific value
CxHy Miscellaneous Hydrocarbons
daf Dry ash free
EPRI Electric Power Research Institute
H2 Hydrogen
H2O Water (Liquid or Vapour)
LOI Loss of Ignition
N2 Diatomic Nitrogen
NO Nitric Oxide
NO2 Nitrogen Dioxide
NOx Oxides of Nitrogen
O Monatomic Oxygen
O2 Diatomic Oxygen
OFA Over Fire Air
PF Pulverised Fuel
RPM Revolutions per minute
SCR Selective catalytic reduction
SE Specific Energy
SNCR Selective non catalytic reduction

The Formation of Nitrogen Oxides in a Pulverised Coal Boiler
Introduction 1
Chapter 1 - Introduction 2
The Formation of Nitrogen Oxides in a Pulverised Coal Boiler
1.1 Introduction
Australia is highly dependent on fossil fuels for the production of electricity with the
Australian Bureau of Statistics (1999) reporting 89% of electricity is generated from
the burning of coal. There are numerous pollutants created from the combustion of
coal which include carbon dioxide (CO2), sulphur dioxide (SO2) as well as nitric
oxide (NO) and nitrogen dioxide (NO2) which are collectively known as NOx.
This project concentrates on gaining an understanding of the factors contributing to
NOx emissions and investigates how variations in operational parameters affect the
emissions. The testing component of the project was undertaken on a 350 megawatt
(MW) coal fired boiler at Stanwell Power Station in Central Queensland.
Even though there is an emergence of environmentally friendly power generation
methods, namely geothermal and tidal as well as the existing “green” methods of
hydro, solar and wind, Australians will continue to rely on coal for power generation
well into the foreseeable future. Therefore this project has particular relevance in
today’s environmentally conscious society.
1.2 Statement of Problem
The formation of NOx is an inevitable result of burning pulverised coal due to
inherent nitrogen in both the fuel and in the air used to support combustion. There
are numerous techniques available to reduce NOx emissions, with many of these
techniques involving substantial capital investment. This project investigates
operational methods, that is, those that do not involve capital investment or
modification to plant, to reduce NOx emissions.
The reduction of NOx emissions often results in a decline in plant efficiency. This
project aims to identify and test the effect on emissions and performance as the
boiler is operated under various operational configurations.
Chapter 1 - Introduction 3
The Formation of Nitrogen Oxides in a Pulverised Coal Boiler
1.3 Aim
The aim of this project is to identify and implement different boiler operational
configurations and test whether these techniques are effective in the minimisation of
NOx emissions, whilst still satisfying boiler operational requirements.
1.4 Objectives
The objectives to achieve this aim include:-
• Describe coal characteristics and the sequence of processes a coal particle
undergoes during combustion in a pulverised fuel (PF) boiler.
• Describe boiler plant operation and limitations including fuel delivery and
pulverisation, air, gas and steam plant.
• Determine various combustion properties including stoichiometric air
requirements, initial flame temperature, residence time/s and equilibrium
combustion products.
• Describe the mechanisms responsible for the formation of NOx during
combustion and use the combustion properties to build a model to predict
thermal NOx production.
• Identify and describe the present methods used in the reduction of NOx in PF
boilers.
• Design and undertake baseline testing of the NOx produced under present
operation. Implement different operational factors and assess any effect on
the NOx produced.
Chapter 1 - Introduction 4
The Formation of Nitrogen Oxides in a Pulverised Coal Boiler
1.5 Overview
1.5.1 Chapter 2 – Environmental and Economic Considerations
Chapter 2 discusses acid pollution and its effect on the environment. It also looks at
the Kyoto Agreement and Australia’s refusal to ratify the requirements of the
Agreement. This Chapter also discusses the economic considerations of enforcing
pollution control measures.
1.5.2 Chapter 3 – Coal Analysis and Boiler Plant
Chapter 3 provides details on the ranking of coal by the American Society for
Testing and Materials and the various analyses of coal including Proximate Analysis,
Ultimate Analysis and Specific Energy. This Chapter also looks at the machinery
utilised in boiler plant operations including the water and steam plant, draught plant
as well as fuel and combustion plant.
1.5.3 Chapter 4 – Coal Combustion Principles
Chapter 4 details the processes as pulverised coal enters the combustion zone of the
furnace. Information is also provided on principles useful when dealing with
combustion problems including mole and mass fractions, atom balances and
equivalence ratios.
1.5.4 Chapter 5 - NOX Creation Mechanisms and Control
Chapter 5 discusses the mechanisms responsible for NOx formation in a pulverised
coal boiler specifically fuel NOx and thermal NOx. Technology available to limit
NOx emissions from boiler plant are described in detail.
Chapter 1 - Introduction 5
The Formation of Nitrogen Oxides in a Pulverised Coal Boiler
1.5.5 Chapter 6 – Engineering Models
In Chapter 6 a number of engineering models are developed to describe factors
influential to NOx formation and plant performance. These include furnace residence
times, flame temperature, furnace heat pickup and thermal NOx formation.
1.5.6 Chapter 7 – Testing
Chapter 7 describes the variables of interest that were monitored during testing. The
apparatus used to measure NOx emissions, flame temperature and flue gas loss of
ignition are described in detail. Other test information including method for
determination of excess oxygen, the data used to determine furnace heat pickup and
the location of test points throughout the furnace region are described. The set up,
specific requirements, assumptions and boiler conditioning requirements for each
test are detailed.
1.5.7 Chapter 8 – Results
Chapter 8 compares the results obtained for each of the tests. A series of graphs are
created to allow quick comparison of some of the variables of interest. Explanations
for discrepancies between predicted and actual values are offered and the positive
results coming from the tests are mentioned.
1.5.8 Chapter 9 – Conclusion
Chapter 9 provides a summary of what the project has achieved.
Chapter 1 - Introduction 6
The Formation of Nitrogen Oxides in a Pulverised Coal Boiler
1.6 Risk Assessment
This project involved both field work and office work and there were risks
associated with both of these. All testing was carried out at Stanwell Power Station
whilst the research and reporting was carried out both in a work and home
environment.
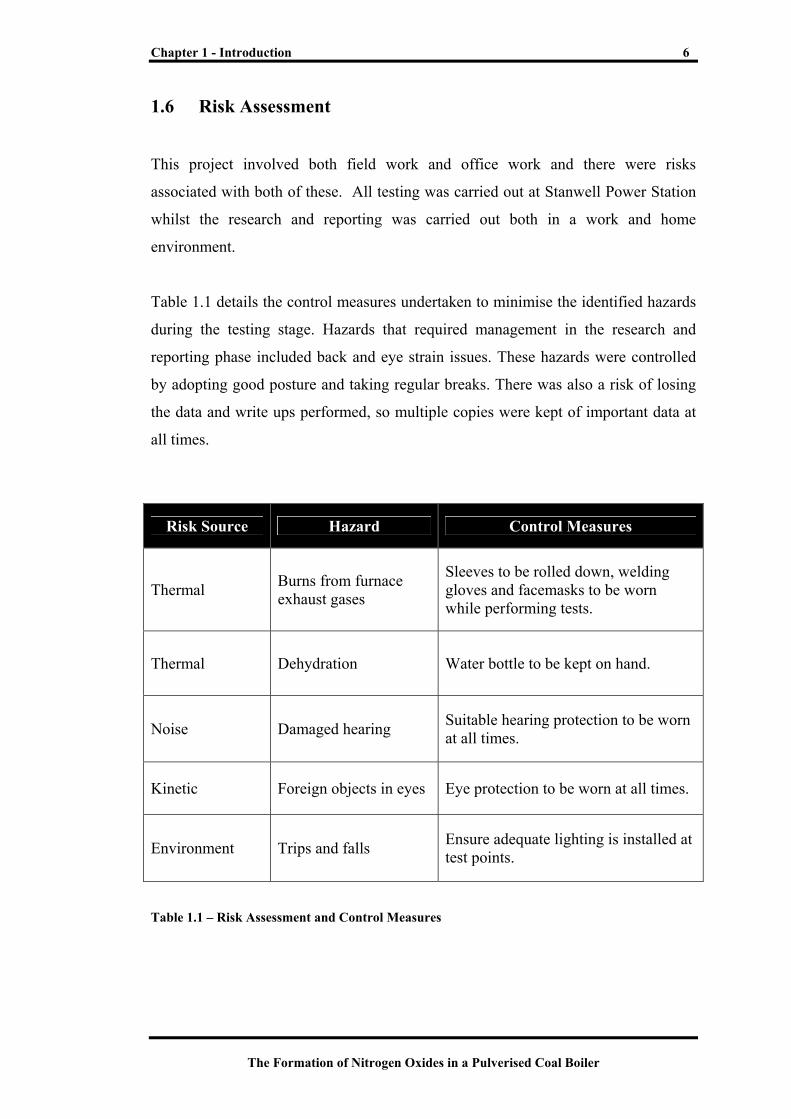
Table 1.1 details the control measures undertaken to minimise the identified hazards
during the testing stage. Hazards that required management in the research and
reporting phase included back and eye strain issues. These hazards were controlled
by adopting good posture and taking regular breaks. There was also a risk of losing
the data and write ups performed, so multiple copies were kept of important data at
all times.
Risk Source Hazard Control Measures
Thermal Burns from furnace exhaust gases
Sleeves to be rolled down, welding gloves and facemasks to be worn while performing tests.
Thermal Dehydration Water bottle to be kept on hand.
Noise Damaged hearing Suitable hearing protection to be worn at all times.
Kinetic Foreign objects in eyes Eye protection to be worn at all times.
Environment Trips and falls Ensure adequate lighting is installed at test points.
Table 1.1 – Risk Assessment and Control Measures

The Formation of Nitrogen Oxides in a Pulverised Coal Boiler
Environmental and Economic Considerations
2
Chapter 2 – Environmental and Economic Considerations 8
The Formation of Nitrogen Oxides in a Pulverised Coal Boiler
2.1 Environmental Impacts
2.1.1 Acid Pollution
Acid pollution is a side effect of our heavy reliance on fossil fuels. Whenever coal,
oil or natural gas is burned, sulphur dioxide and nitrogen oxides are released into the
atmosphere where they undergo a series of chemical processes that turn them into
acids. All rainfall is slightly acidic as a result of sulphur, nitrogen and carbon dioxide
occurring naturally in the air, however acidification has become much worse ever
since the advent of the industrial revolution (McCormick, 1997).
As McCormick (1997) states, acid pollutants have numerous environmental effects
including damaging trees, plants and crops, contributing to the decline in freshwater
animal and plant life, acidifying soils, rivers and lakes and not to mention the threat
to human health. However the problem exists that “while the general process of acid
damage is well established and proven, the mechanisms by which the damage
occurs, and the relative contribution of the different components of acid pollution
and other natural or man-made factors, are still debated” (McCormick, 1997, p21).
This presents a problem for not only scientists but also policymakers as without a
clear understanding of how and why the damage occurs, it is difficult to agree on
workable policies. As a result, the government and industries are reluctant to finance
pollution control measures when there is often no certainty about which pollutants
are causing what kind of damage (McCormick, 1997). Through national and
international research programmes, more certain answers are being provided to these
questions, however few programmes have been operating for more than 10 to 15
years making it difficult to establish long term trends (McCormick, 1997).
2.1.2 NOx and the Environment
As mentioned above, NOX is generated in complex mechanisms during the high
temperature combustion of coal, oil and gas fuels. Motor vehicle emissions are the
primary producer of NOX whilst power generation, petrol refining, food
Chapter 2 – Environmental and Economic Considerations 9
The Formation of Nitrogen Oxides in a Pulverised Coal Boiler
manufacturing, gas and wood heaters, cigarette smoke, lightning storms and
bushfires also contribute to the problem. Although not the primary producer of
NOX, the contribution made by electricity generators still accounts for a significant
proportion of total NOX and its overall contribution to global pollution cannot be
ignored.
In a coal fired boiler the quantity and composition of the nitrogen oxides depends on
how the combustion of the fuel takes place. In general, by lowering the combustion
temperature and reducing the time the combustion products reside in the combustion
chamber can reduce NOX formation. By doing so however generally affects the
efficiency of the plant. The level of NOX emissions that power generators can
produce are dictated to them by the Environmental Protection Authority under the
Environmental Protection Act 1994. Power generators have the task of balancing
environmental factors versus plant efficiency and economic considerations.
2.2 Economic Considerations
The Kyoto Agreement, signed in the Japanese city of Kyoto in 1997, is aimed at
reducing the emissions from carbon based fuels into the atmosphere. It is believed
that these emissions as well as the release of other gases is a source of global
warming and other changes in the climate worldwide (Hot Enough For You?, 2002).
The United States has withdrawn entirely from the Kyoto process even though it is
the world’s leading contributor of greenhouse gases. Recently, Australian Prime
Minister John Howard also refused to ratify the requirements of the Agreement
(Howard Stands Firm Against Kyoto, 2004) on the grounds that abiding by the terms
of the Agreement would cost jobs and damage the economy through the loss of
important markets to non-signatory countries such as Indonesia. Dodson & Gordon
(2002, p1) suggest that “ratifying the Kyoto Protocol is seen by the government as
imposing the risk of economic penalties on resource exporters, which would not be
faced by other countries signing it, such as China and India”. This in turn would
mean the loss of industries from Australia to countries like China and India that do
not have the same restrictions under Kyoto as Australia would have.
Chapter 2 – Environmental and Economic Considerations 10
The Formation of Nitrogen Oxides in a Pulverised Coal Boiler
It is also reported that the emissions target for Australia under Kyoto is demonstrably
tougher than that for most countries. This is due to the increasing prevalence of
emissions intensive industries in the Australian economy and because of our
relatively fast rate of population growth (Daley, 2000). Much of the industrial plant
in Australia was designed with little thought given to emission control as at the time
there were no legislative requirements to abide by. Achieving compliance may
require implementation of expensive retrofit technology and/or reductions in the
capacity of existing plant. These measures effectively increase the price of
Australian manufactured goods and services and places Australian based companies,
both locally and foreign owned, at an economic disadvantage. This is especially the
case given Australia’s main competitors do not have any commitments under Kyoto
(Daley, 2000).
In reality, pollution control measures equate to additional costs in the production of
goods and services and puts Australia at a competitive disadvantage compared to
countries refusing to abide by any pollution standards.
The Formation of Nitrogen Oxides in a Pulverised Coal Boiler
Coal Analysis and Boiler Plant
3
Chapter 3 – Coal Analysis and Boiler Plant 12
The Formation of Nitrogen Oxides in a Pulverised Coal Boiler
3.1 Coal Analysis 3.1.1 Rank
Coal can be divided into two major groups of constituents:-
1. The parts that when combusted liberate substantial energy in an exothermic
reaction; and
2. Those that do not contribute to the combustion process.
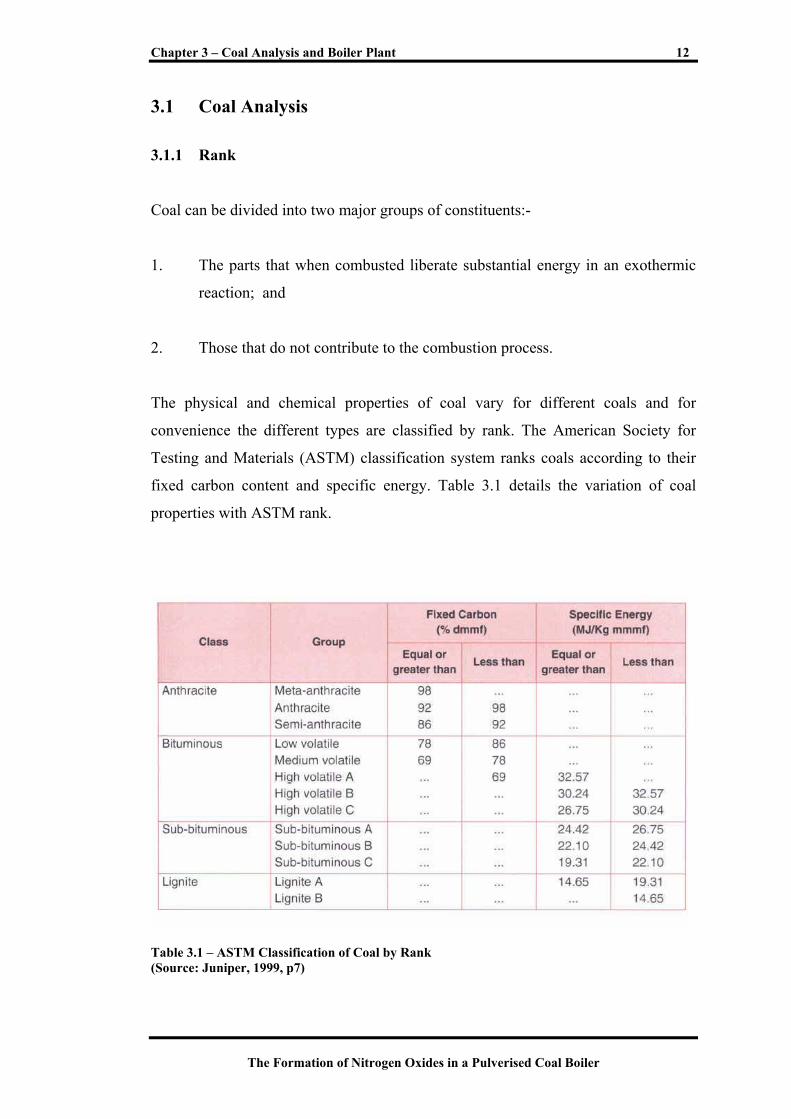
The physical and chemical properties of coal vary for different coals and for
convenience the different types are classified by rank. The American Society for
Testing and Materials (ASTM) classification system ranks coals according to their
fixed carbon content and specific energy. Table 3.1 details the variation of coal
properties with ASTM rank.
Table 3.1 – ASTM Classification of Coal by Rank (Source: Juniper, 1999, p7)
Chapter 3 – Coal Analysis and Boiler Plant 13
The Formation of Nitrogen Oxides in a Pulverised Coal Boiler
3.1.2 Proximate Analysis
The proximate analysis of coal determines the quantity of moisture, ash, volatile
matter and fixed carbon in a coal sample. These quantities are determined
gravimetrically and involve the following steps:-
1. The air dried moisture content is determined by spreading out the sample
and allowing it to dry in the lab atmosphere. A moisture determination is
then carried out by heating the sample to between 105°C and 110°C in an
atmosphere of nitrogen.
2. The ash content is the inorganic residue of the sample after it is incinerated
at 815°C in an atmosphere containing excess oxygen.
3. The volatile matter is determined as the loss in mass, corrected for moisture,
which occurs when the sample is heated in an inert atmosphere to a
temperature of 900°C for seven minutes.
4. The fixed carbon content is calculated by subtracting the total of the
percentages of the air dried moisture, ash and volatile matter.
3.1.3 Ultimate Analysis
The ultimate analysis is performed to determine the main organic constituents in the
coal and is reported on a mass basis. Various standard laboratory procedures are used
to obtain quantities of carbon, hydrogen, nitrogen and sulphur with the oxygen
content taken as the balance of the elements.
Chapter 3 – Coal Analysis and Boiler Plant 14
The Formation of Nitrogen Oxides in a Pulverised Coal Boiler
3.1.4 Specific Energy
The specific energy (SE) refers to the amount of energy that is liberated during
combustion per unit mass of coal. There are two ways to express the specific energy,
the Gross SE and the Net SE, the difference being the amount of heat required to
evaporate the water already present in the coal as well as the water formed from the
combustion of hydrogen. Laboratories normally report the Gross SE of the coal. The
Net SE can be calculated using the following formula:-
+−=
1009
10042.2 22 HOHSESE grossnet (MJ/kg) ( 3.1 )
where: SE = Specific Energy (MJ/kg) as received) H2O = Moisture Content (% as received) H2 = Hydrogen Content (% as received)
The Gross SE can be calculated from the ultimate analysis of the coal using the
Dulong formula. The results from this calculation are usually within 1.5% of the
measured value for bituminous and anthracitic coals. The formula is:-
SOHCSE 42.98
25.14483.33 +
−+= (MJ/kg) ( 3.2 )
where C, H, O and S = fractions of carbon, hydrogen, oxygen and sulphur.
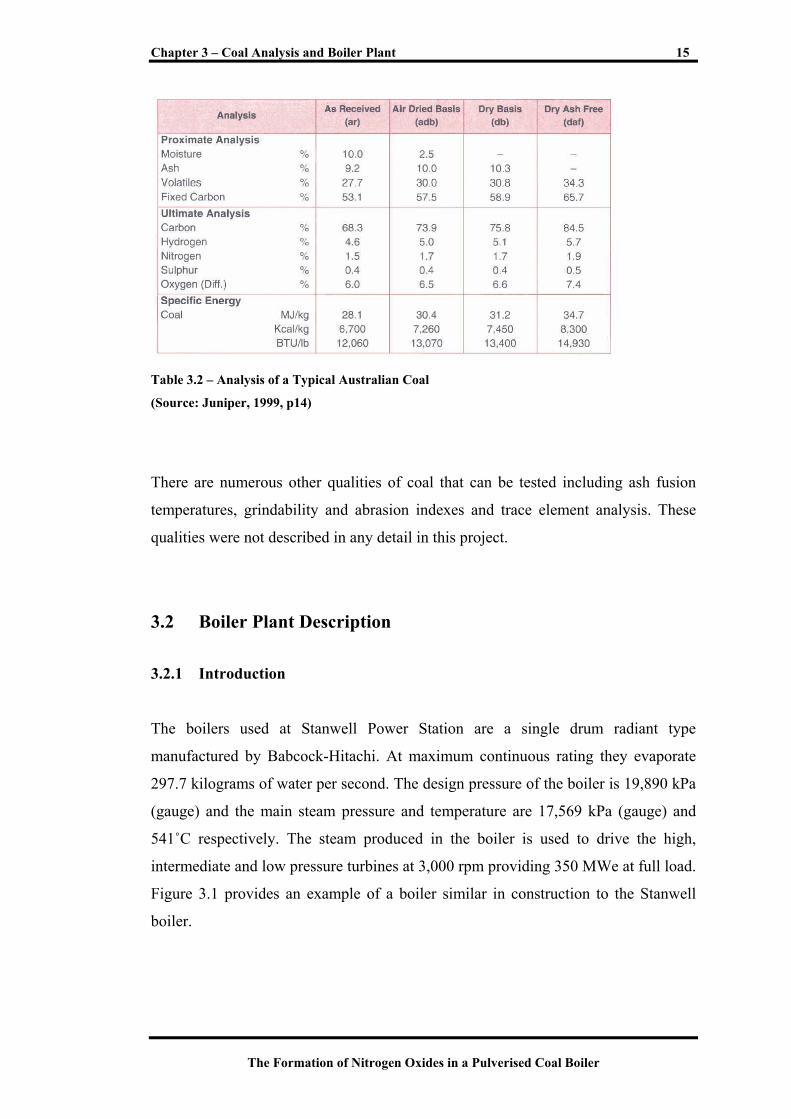
Table 3.2 details a typical coal analysis for a bituminous coal.
Chapter 3 – Coal Analysis and Boiler Plant 15
The Formation of Nitrogen Oxides in a Pulverised Coal Boiler
Table 3.2 – Analysis of a Typical Australian Coal
(Source: Juniper, 1999, p14)
There are numerous other qualities of coal that can be tested including ash fusion
temperatures, grindability and abrasion indexes and trace element analysis. These
qualities were not described in any detail in this project.
3.2 Boiler Plant Description
3.2.1 Introduction
The boilers used at Stanwell Power Station are a single drum radiant type
manufactured by Babcock-Hitachi. At maximum continuous rating they evaporate
297.7 kilograms of water per second. The design pressure of the boiler is 19,890 kPa
(gauge) and the main steam pressure and temperature are 17,569 kPa (gauge) and
541˚C respectively. The steam produced in the boiler is used to drive the high,
intermediate and low pressure turbines at 3,000 rpm providing 350 MWe at full load.
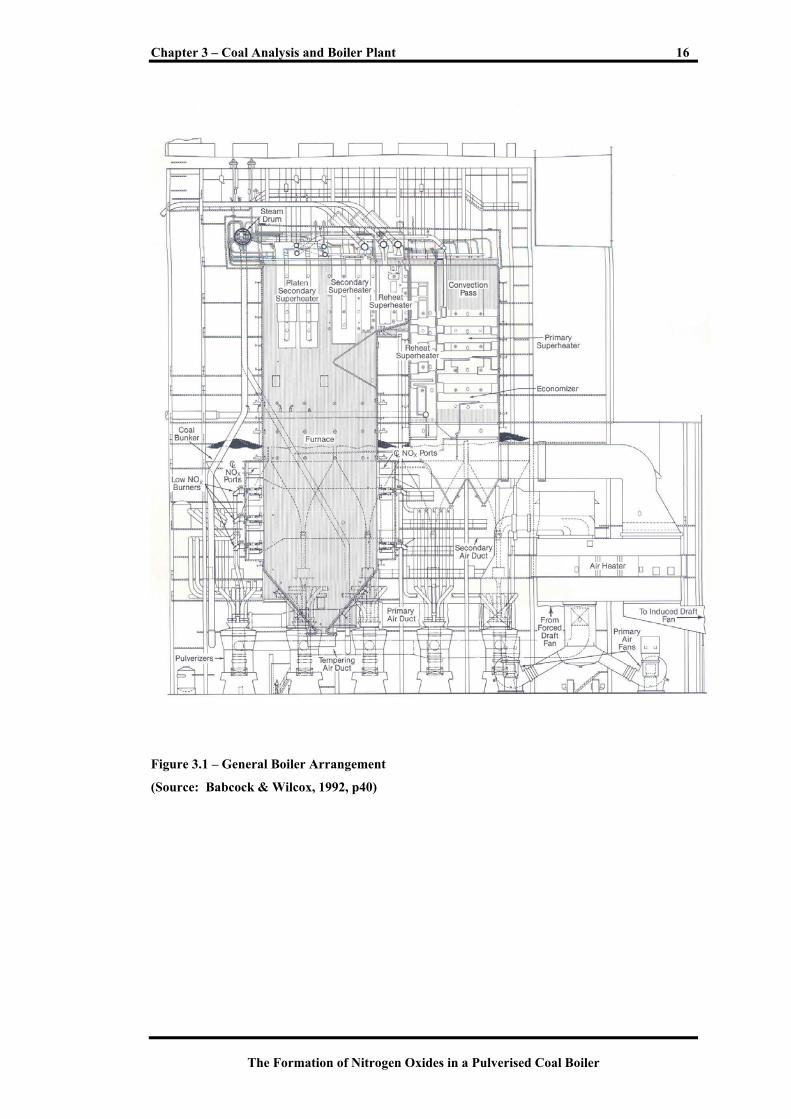
Figure 3.1 provides an example of a boiler similar in construction to the Stanwell
boiler.
Chapter 3 – Coal Analysis and Boiler Plant 16
The Formation of Nitrogen Oxides in a Pulverised Coal Boiler
Figure 3.1 – General Boiler Arrangement
(Source: Babcock & Wilcox, 1992, p40)
Chapter 3 – Coal Analysis and Boiler Plant 17
The Formation of Nitrogen Oxides in a Pulverised Coal Boiler
3.2.2 Water and Steam Plant
The water/steam circuit comprises the following major items of plant:-
Economiser
The economiser section of the boiler comprises banks of horizontal finned tubes
located in the rear pass of the boiler. Heat from the flue gases is transferred by
convection to the feedwater passing through the tubes. The economiser is the last
element of the boiler that extracts heat from the flue gas prior to the gas passing out
of the boiler and through the air heaters. Feedwater is delivered to the economiser
section by boiler feed pumps via a series of high pressure heaters. The economiser
serves the purpose of heating the feedwater prior to delivery to the drum and as such
results in less energy required to transform the feedwater to steam resulting in
improved thermal efficiency.
Boiler Drum
The boiler drum is a large cylindrical vessel located at the top of the boiler. The
major connections to the drum allow for:-
Incoming feedwater from the economiser
Incoming water-steam mixture from the boiler water walls and screen wall
Incoming chemical dosing lines
Outgoing downcomers which deliver water to headers located at the bottom
of the boiler prior to entering the water walls
Outgoing saturated steam to the superheaters
Figure 3.2 details a typical cross section of a boiler steam drum.
Chapter 3 – Coal Analysis and Boiler Plant 18
The Formation of Nitrogen Oxides in a Pulverised Coal Boiler
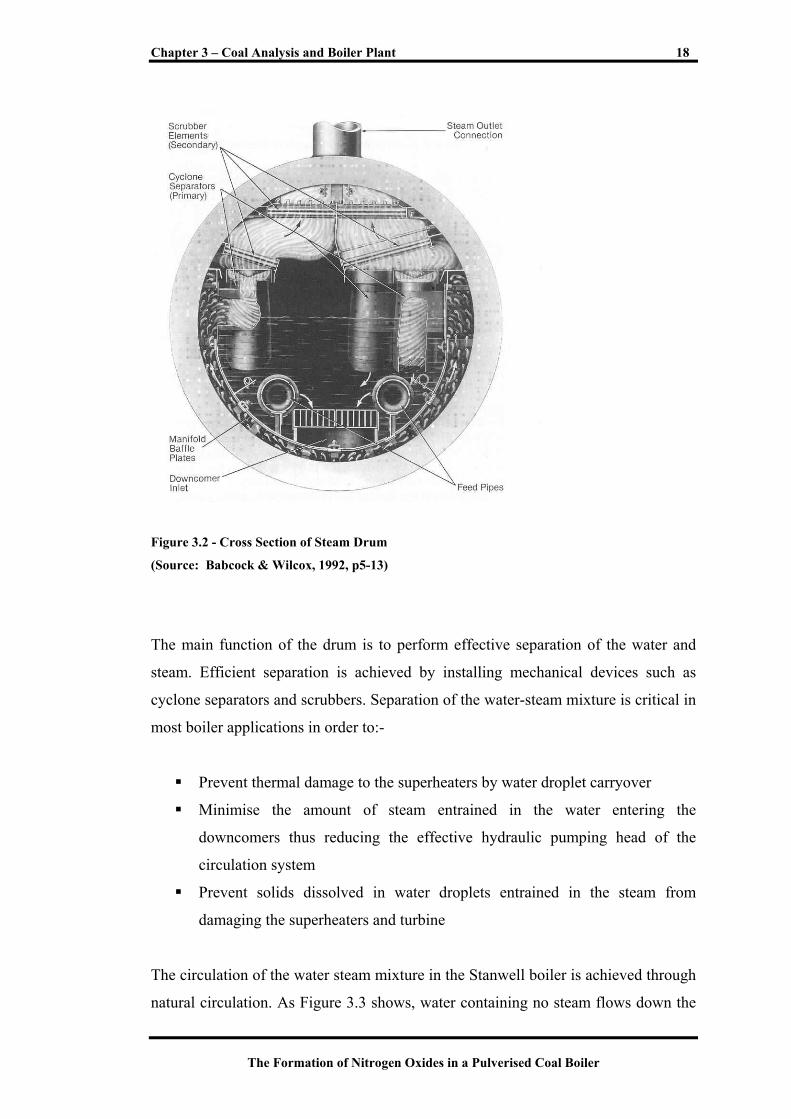
Figure 3.2 - Cross Section of Steam Drum
(Source: Babcock & Wilcox, 1992, p5-13)
The main function of the drum is to perform effective separation of the water and
steam. Efficient separation is achieved by installing mechanical devices such as
cyclone separators and scrubbers. Separation of the water-steam mixture is critical in
most boiler applications in order to:-
Prevent thermal damage to the superheaters by water droplet carryover
Minimise the amount of steam entrained in the water entering the
downcomers thus reducing the effective hydraulic pumping head of the
circulation system
Prevent solids dissolved in water droplets entrained in the steam from
damaging the superheaters and turbine
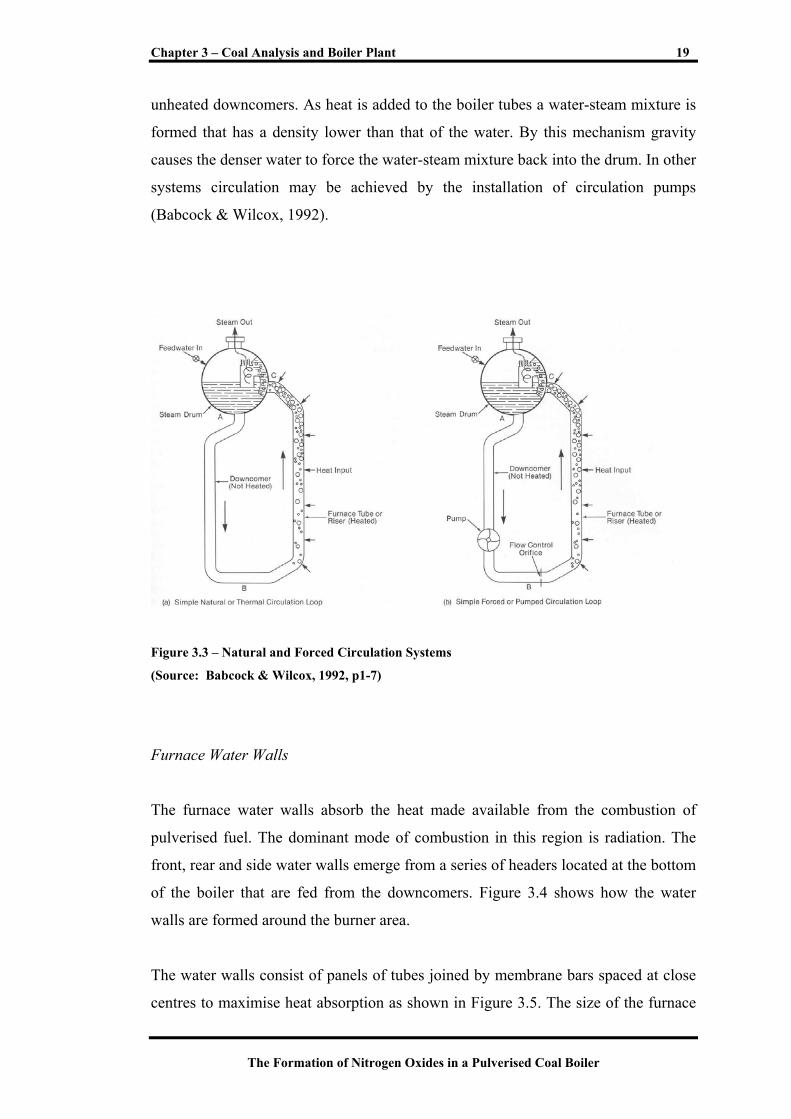
The circulation of the water steam mixture in the Stanwell boiler is achieved through
natural circulation. As Figure 3.3 shows, water containing no steam flows down the
Chapter 3 – Coal Analysis and Boiler Plant 19
The Formation of Nitrogen Oxides in a Pulverised Coal Boiler
unheated downcomers. As heat is added to the boiler tubes a water-steam mixture is
formed that has a density lower than that of the water. By this mechanism gravity
causes the denser water to force the water-steam mixture back into the drum. In other
systems circulation may be achieved by the installation of circulation pumps
(Babcock & Wilcox, 1992).
Figure 3.3 – Natural and Forced Circulation Systems
(Source: Babcock & Wilcox, 1992, p1-7)
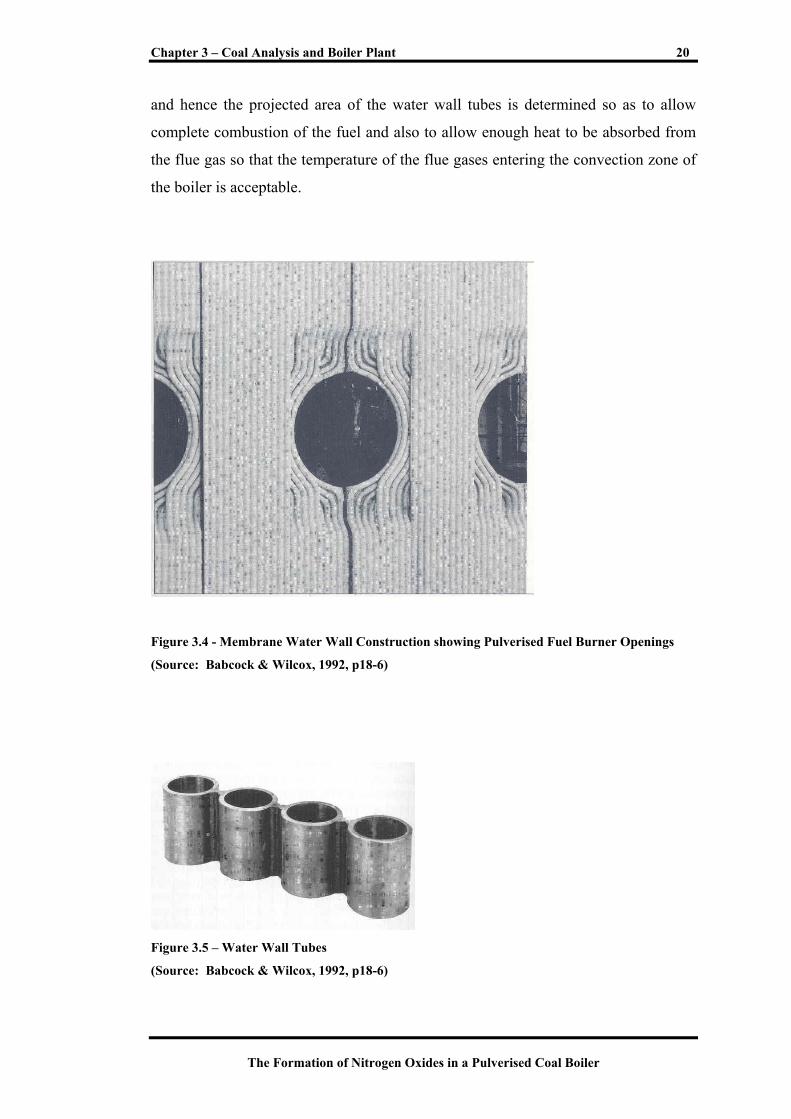
Furnace Water Walls
The furnace water walls absorb the heat made available from the combustion of
pulverised fuel. The dominant mode of combustion in this region is radiation. The
front, rear and side water walls emerge from a series of headers located at the bottom
of the boiler that are fed from the downcomers. Figure 3.4 shows how the water
walls are formed around the burner area.
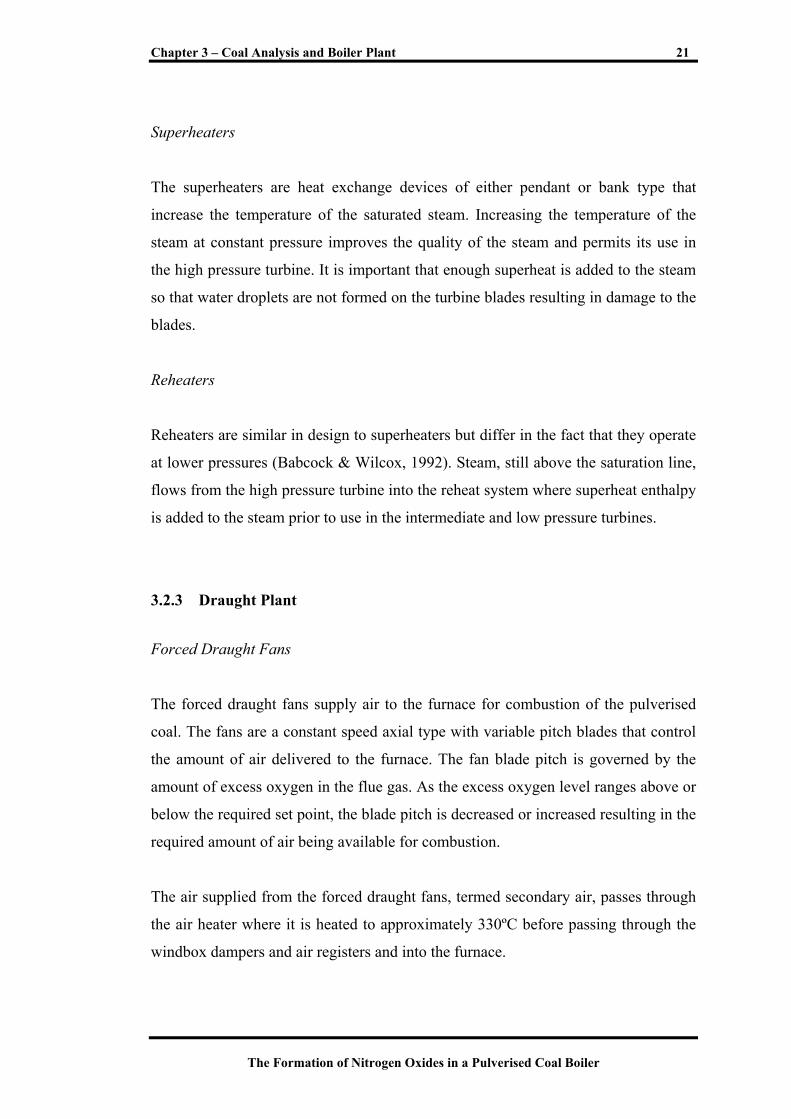
The water walls consist of panels of tubes joined by membrane bars spaced at close
centres to maximise heat absorption as shown in Figure 3.5. The size of the furnace
Chapter 3 – Coal Analysis and Boiler Plant 20
The Formation of Nitrogen Oxides in a Pulverised Coal Boiler
and hence the projected area of the water wall tubes is determined so as to allow
complete combustion of the fuel and also to allow enough heat to be absorbed from
the flue gas so that the temperature of the flue gases entering the convection zone of
the boiler is acceptable.
Figure 3.4 - Membrane Water Wall Construction showing Pulverised Fuel Burner Openings
(Source: Babcock & Wilcox, 1992, p18-6)
Figure 3.5 – Water Wall Tubes
(Source: Babcock & Wilcox, 1992, p18-6)
Chapter 3 – Coal Analysis and Boiler Plant 21
The Formation of Nitrogen Oxides in a Pulverised Coal Boiler
Superheaters
The superheaters are heat exchange devices of either pendant or bank type that
increase the temperature of the saturated steam. Increasing the temperature of the
steam at constant pressure improves the quality of the steam and permits its use in
the high pressure turbine. It is important that enough superheat is added to the steam
so that water droplets are not formed on the turbine blades resulting in damage to the
blades.
Reheaters
Reheaters are similar in design to superheaters but differ in the fact that they operate
at lower pressures (Babcock & Wilcox, 1992). Steam, still above the saturation line,
flows from the high pressure turbine into the reheat system where superheat enthalpy
is added to the steam prior to use in the intermediate and low pressure turbines.
3.2.3 Draught Plant
Forced Draught Fans
The forced draught fans supply air to the furnace for combustion of the pulverised
coal. The fans are a constant speed axial type with variable pitch blades that control
the amount of air delivered to the furnace. The fan blade pitch is governed by the
amount of excess oxygen in the flue gas. As the excess oxygen level ranges above or
below the required set point, the blade pitch is decreased or increased resulting in the
required amount of air being available for combustion.
The air supplied from the forced draught fans, termed secondary air, passes through
the air heater where it is heated to approximately 330ºC before passing through the
windbox dampers and air registers and into the furnace.
Chapter 3 – Coal Analysis and Boiler Plant 22
The Formation of Nitrogen Oxides in a Pulverised Coal Boiler
Primary Air Fans
The primary air fans are centrifugal type fans that take air from the outlet of the
forced draught fans and are used to supply air to the mills. After passing through the
air heater the primary air is combined with unheated tempering air to dry the coal in
the mills and transport the pulverised fuel to the furnace. The mixing of the hot
primary air and the unheated tempering air is performed using dampers prior to entry
to the mill. The position of these dampers is controlled to maintain a mill outlet
temperature of 90ºC. The primary air carrying the pulverised fuel to the furnace
generally accounts for 20% of the required combustion air.
Induced Draught Fans
The induced draught fans are a centrifugal style of fan that remove the combustion
gases from the furnace. A variable inlet vane on the fan is used to control the furnace
pressure to –0.2 kPa (gauge). This slight vacuum is maintained to prevent hot gases,
unburnt fuel or ash escaping from the furnace. At full load the two (2) induced
draught fans are capable of removing over 450 kg/s of waste gas.
Air Heaters
Rotary regenerative air heaters are used to heat the primary and secondary air before
the air passes into the mills or furnace. Heat is extracted from the flue gases as they
pass out from the boiler over banks of finned elements contained within the air
heater. As the hood arrangement rotates, heat is transferred to the air passing over the
heated fins. The gas inlet temperature to the air heaters is approximately 380°C. The
heat transfer to the elements drops the temperature by around 244°C to 136ºC.
Excess heat transfer needs to be avoided as damage to downstream equipment will
result if the dew point is reached resulting in the formation of sulphuric acid.
Chapter 3 – Coal Analysis and Boiler Plant 23
The Formation of Nitrogen Oxides in a Pulverised Coal Boiler
3.2.4 Fuel and Combustion Plant
Feeders and Mills
Coal feeders deliver “As Received” coal from the coal bunkers to the pulverisers
using a gravimetric weighing process. The mass of the coal on the coal feeder belt is
determined using load cells. This measurement is multiplied by the belt speed to give
a coal flow in kilograms per second. A 350 MW unit operating at full load typically
operates with four mills in service, each mill grinding approximately 8.5 kilograms
per second of coal.
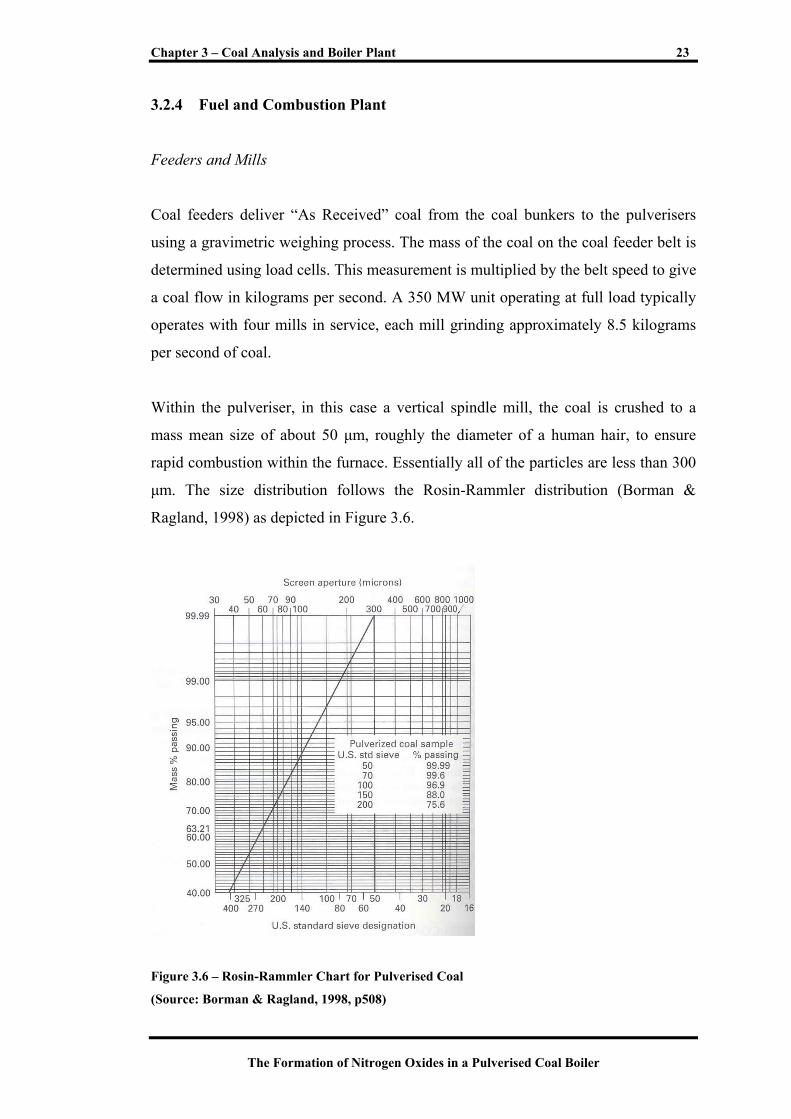
Within the pulveriser, in this case a vertical spindle mill, the coal is crushed to a
mass mean size of about 50 µm, roughly the diameter of a human hair, to ensure
rapid combustion within the furnace. Essentially all of the particles are less than 300
µm. The size distribution follows the Rosin-Rammler distribution (Borman &
Ragland, 1998) as depicted in Figure 3.6.
Figure 3.6 – Rosin-Rammler Chart for Pulverised Coal
(Source: Borman & Ragland, 1998, p508)
Chapter 3 – Coal Analysis and Boiler Plant 24
The Formation of Nitrogen Oxides in a Pulverised Coal Boiler
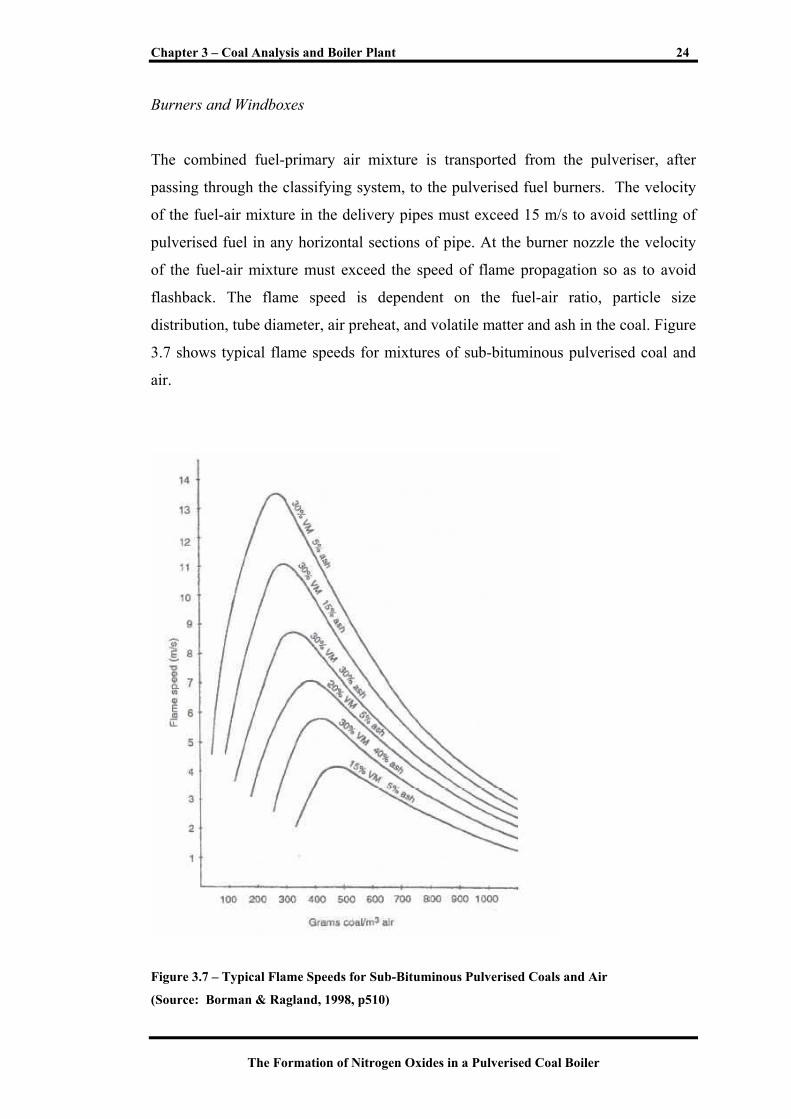
Burners and Windboxes
The combined fuel-primary air mixture is transported from the pulveriser, after
passing through the classifying system, to the pulverised fuel burners. The velocity
of the fuel-air mixture in the delivery pipes must exceed 15 m/s to avoid settling of
pulverised fuel in any horizontal sections of pipe. At the burner nozzle the velocity
of the fuel-air mixture must exceed the speed of flame propagation so as to avoid
flashback. The flame speed is dependent on the fuel-air ratio, particle size
distribution, tube diameter, air preheat, and volatile matter and ash in the coal. Figure
3.7 shows typical flame speeds for mixtures of sub-bituminous pulverised coal and
air.
Figure 3.7 – Typical Flame Speeds for Sub-Bituminous Pulverised Coals and Air
(Source: Borman & Ragland, 1998, p510)
Chapter 3 – Coal Analysis and Boiler Plant 25
The Formation of Nitrogen Oxides in a Pulverised Coal Boiler
The burner also contains an oil gun which burns fuel oil and is used for first light in
the furnace after an extended period out of service and also to assist in the ignition of
the coal particles if the coal flame becomes unstable.
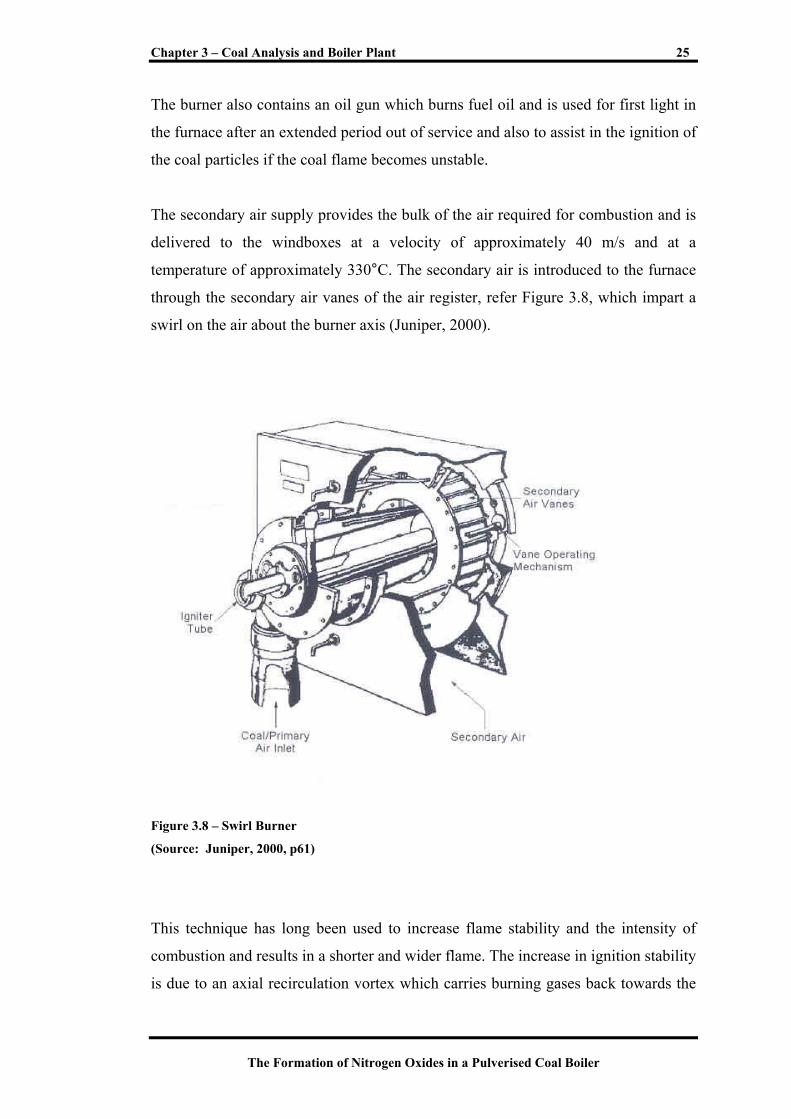
The secondary air supply provides the bulk of the air required for combustion and is
delivered to the windboxes at a velocity of approximately 40 m/s and at a
temperature of approximately 330°C. The secondary air is introduced to the furnace
through the secondary air vanes of the air register, refer Figure 3.8, which impart a
swirl on the air about the burner axis (Juniper, 2000).
Figure 3.8 – Swirl Burner
(Source: Juniper, 2000, p61)
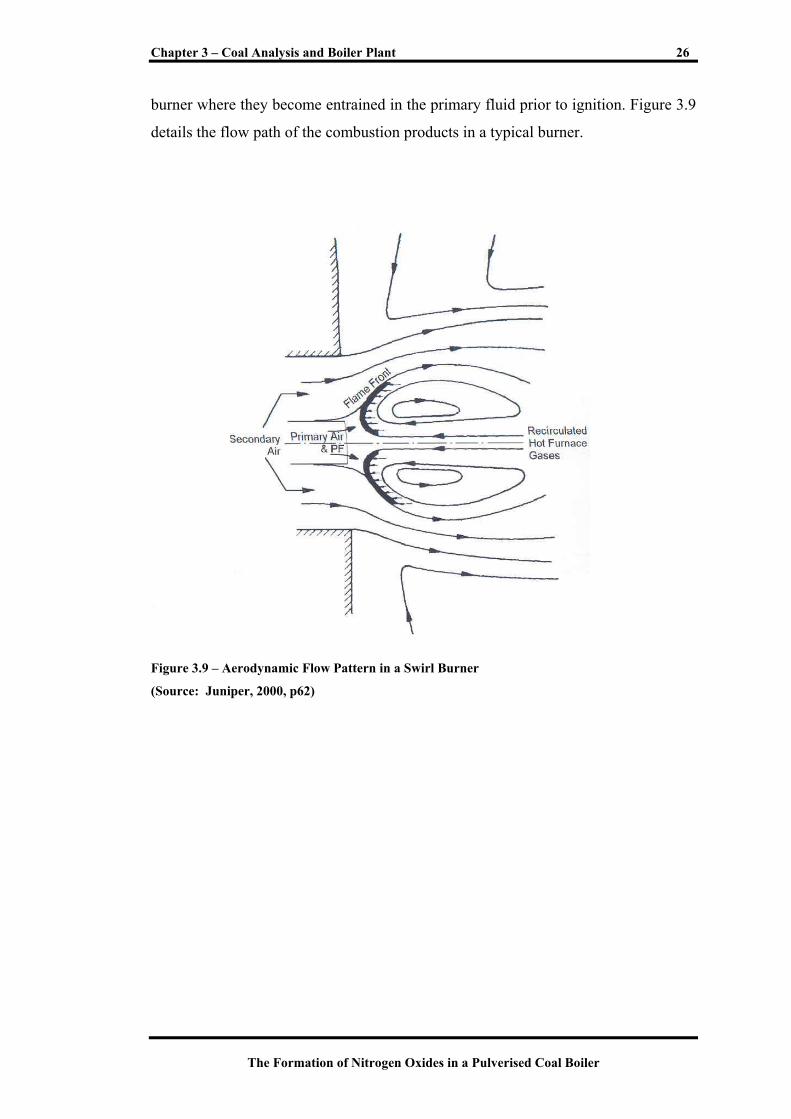
This technique has long been used to increase flame stability and the intensity of
combustion and results in a shorter and wider flame. The increase in ignition stability
is due to an axial recirculation vortex which carries burning gases back towards the
Chapter 3 – Coal Analysis and Boiler Plant 26
The Formation of Nitrogen Oxides in a Pulverised Coal Boiler
burner where they become entrained in the primary fluid prior to ignition. Figure 3.9
details the flow path of the combustion products in a typical burner.
Figure 3.9 – Aerodynamic Flow Pattern in a Swirl Burner
(Source: Juniper, 2000, p62)
The Formation of Nitrogen Oxides in a Pulverised Coal Boiler
Coal Combustion Principles
4
Chapter 4 – Coal Combustion Principles 28
The Formation of Nitrogen Oxides in a Pulverised Coal Boiler
4.1 Introduction
Borman and Ragland (1998) describe combustion as the rapid conversion of
chemical energy to sensible energy. This process involves a transformation of
reactants (fuels and oxidizers) to the products of combustion. During the
transformation there is no alteration of the nuclei of the reactants, however the
creation or destruction of bonds involving the electrons of the molecules takes place.
This process may cause heat to be liberated or heat may be required to form the
bonds. When a chemical reaction liberates heat it is termed an exothermic reaction
whereas where energy is absorbed, it is termed endothermic.
In the case of a pulverised fuel boiler, the energy derived from an exothermic
reaction can be exploited and used in the generation of steam.
4.2 Pulverised Coal Combustion within a Furnace
Juniper (2000) describes the processes that occur when a coal particle is combusted
in a pulverised fuel (PF) boiler as follows:-
• Release and combustion of volatile matter
• Combustion of the residual char
• Release of the mineral matter
When a 100µm coal particle passes through a burner nozzle into a 1,400°C flame
zone the particle reaches 400°C in around one (1) ms and 1,000°C after
approximately ten (10) ms.
At 100°C the moisture is drawn off and at 400°C devolatilisation begins. The
gaseous volatiles contain various gases including CO2, H2O, N2 and small
proportions of CO, H2, HCN and a variety of hydrocarbons (CxHy). These volatiles
are mixed with the surrounding air and are rapidly burnt (Borman & Ragland, 1998).
Chapter 4 – Coal Combustion Principles 29
The Formation of Nitrogen Oxides in a Pulverised Coal Boiler
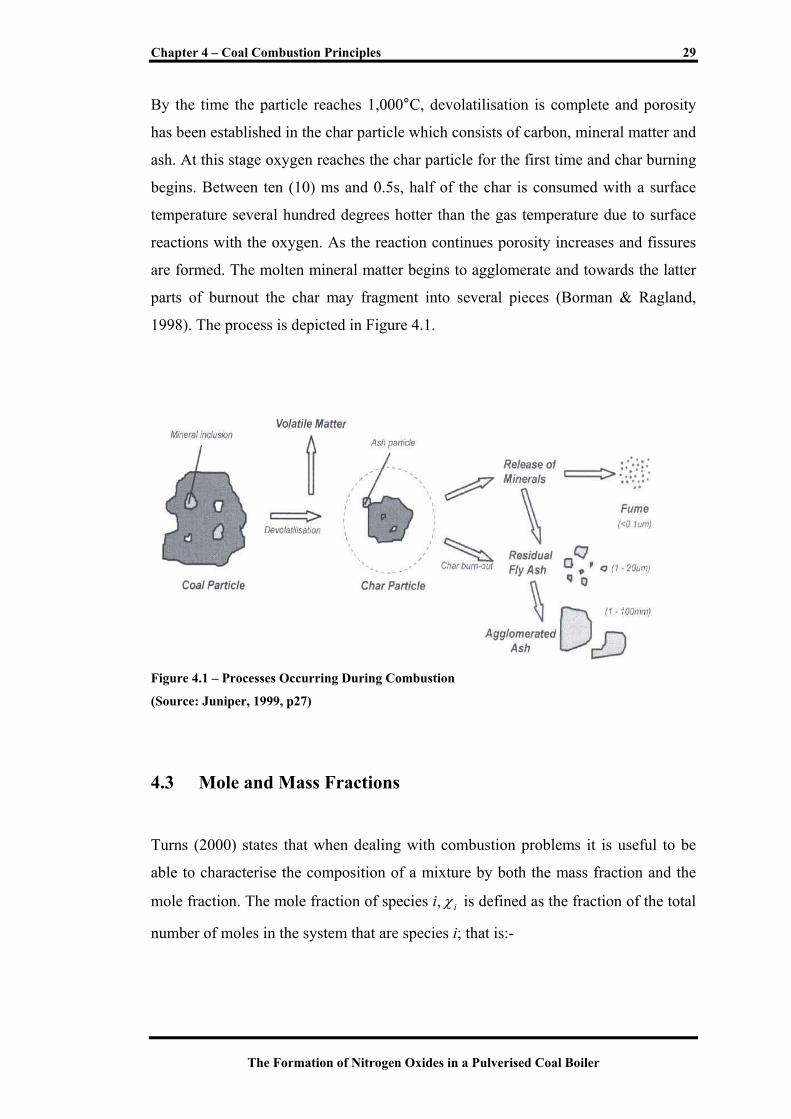
By the time the particle reaches 1,000°C, devolatilisation is complete and porosity
has been established in the char particle which consists of carbon, mineral matter and
ash. At this stage oxygen reaches the char particle for the first time and char burning
begins. Between ten (10) ms and 0.5s, half of the char is consumed with a surface
temperature several hundred degrees hotter than the gas temperature due to surface
reactions with the oxygen. As the reaction continues porosity increases and fissures
are formed. The molten mineral matter begins to agglomerate and towards the latter
parts of burnout the char may fragment into several pieces (Borman & Ragland,
1998). The process is depicted in Figure 4.1.
Figure 4.1 – Processes Occurring During Combustion
(Source: Juniper, 1999, p27)
4.3 Mole and Mass Fractions
Turns (2000) states that when dealing with combustion problems it is useful to be
able to characterise the composition of a mixture by both the mass fraction and the
mole fraction. The mole fraction of species i, iχ is defined as the fraction of the total
number of moles in the system that are species i; that is:-
Chapter 4 – Coal Combustion Principles 30
The Formation of Nitrogen Oxides in a Pulverised Coal Boiler
total
i
i
ii N
NNNN
N=
++++≡
......21χ ( 4.1 )
where Ni is the number of moles of species i
The mass fraction of species i, Yi, is the amount of mass of species i compared to the
total mixture mass:-
total
i
i
ii m
mmmm
mY =
++++≡
......21 ( 4.2 )
where mi is the mass of the individual species i
The mole and mass fractions are easily converted from one to another using the
molecular weights of the mixture and of the species of interest:-
mix
iii MW
MWY
χ= ( 4.3 )
i
mixii MW
MWY=χ ( 4.4 )
The mixture molecular weight, MWmix can be calculated from knowledge of either
the species mass or mole fractions:-
iiimix MWMW χΣ= ( 4.5 )
i
ii
mix
MWY
MWΣ
=1 ( 4.6 )
Chapter 4 – Coal Combustion Principles 31
The Formation of Nitrogen Oxides in a Pulverised Coal Boiler
Analysis Air Dried Basis
(adb)
Proximate Analysis
Moisture % 1.1
Ash % 18.1
Volatiles % 27.7
Fixed Carbon % 53.1
Ultimate Analysis
Carbon % 71.3
Hydrogen % 3.71
Nitrogen % 1.4
Sulphur % 0.54
Oxygen (Diff.) % 3.85
Specific Energy
Coal MJ/kg 28.83
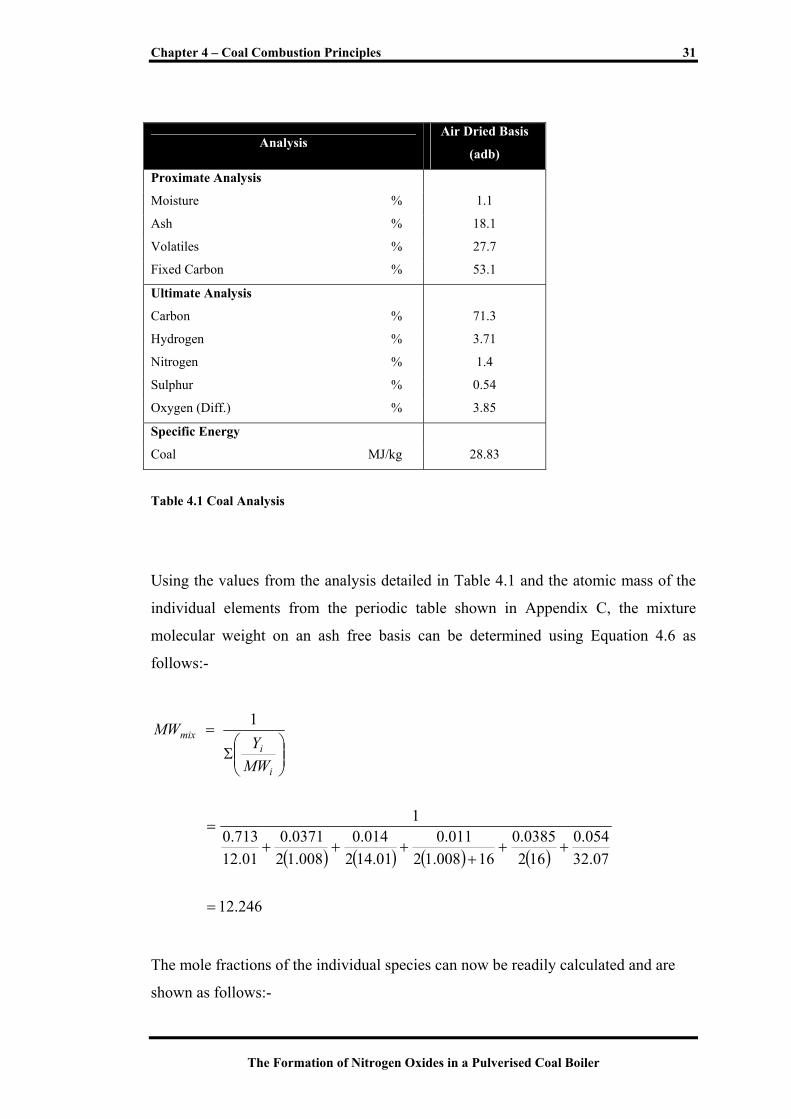
Table 4.1 Coal Analysis
Using the values from the analysis detailed in Table 4.1 and the atomic mass of the
individual elements from the periodic table shown in Appendix C, the mixture
molecular weight on an ash free basis can be determined using Equation 4.6 as
follows:-
( ) ( ) ( ) ( )
246.12
07.32054.0
1620385.0
16008.12011.0
01.142014.0
008.120371.0
01.12713.0
1
1
=
+++
+++=
Σ
=
i
imix
MWY
MW
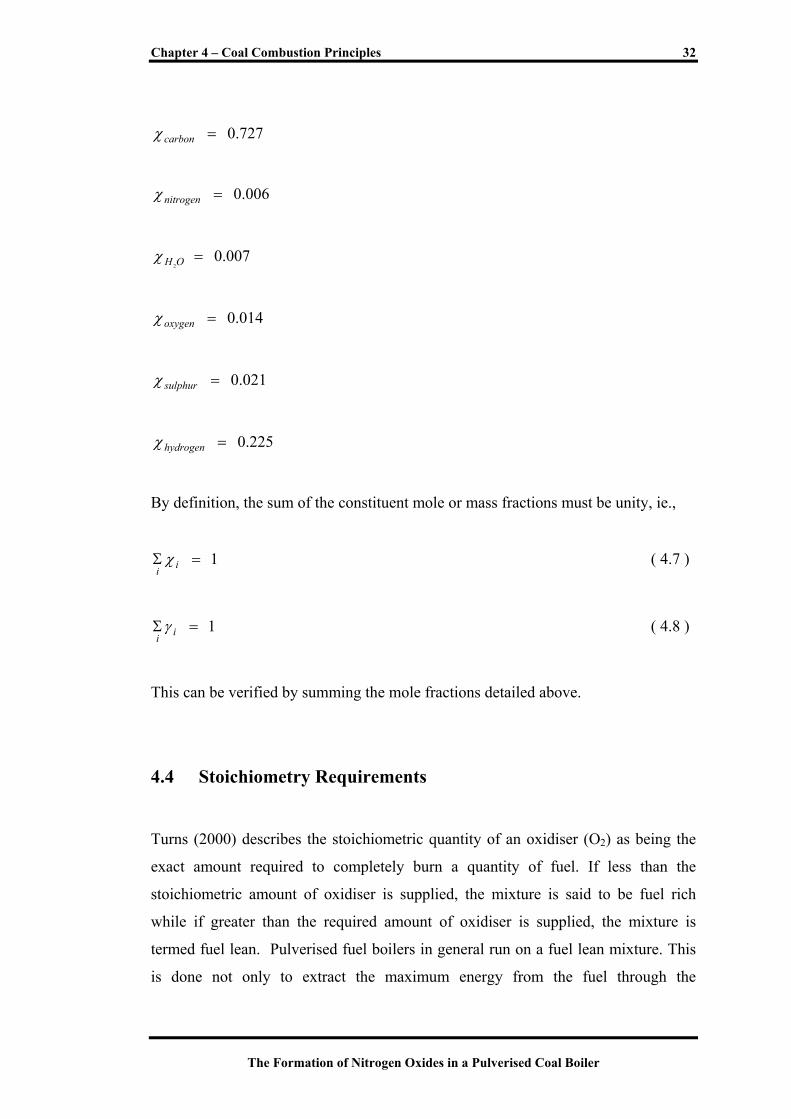
The mole fractions of the individual species can now be readily calculated and are
shown as follows:-
Chapter 4 – Coal Combustion Principles 32
The Formation of Nitrogen Oxides in a Pulverised Coal Boiler
727.0=carbonχ
006.0=nitrogenχ
007.02
=OHχ
014.0=oxygenχ
021.0=sulphurχ
225.0=hydrogenχ
By definition, the sum of the constituent mole or mass fractions must be unity, ie.,
1=Σ iiχ ( 4.7 )
1=Σ iiγ ( 4.8 )
This can be verified by summing the mole fractions detailed above.
4.4 Stoichiometry Requirements
Turns (2000) describes the stoichiometric quantity of an oxidiser (O2) as being the
exact amount required to completely burn a quantity of fuel. If less than the
stoichiometric amount of oxidiser is supplied, the mixture is said to be fuel rich
while if greater than the required amount of oxidiser is supplied, the mixture is
termed fuel lean. Pulverised fuel boilers in general run on a fuel lean mixture. This
is done not only to extract the maximum energy from the fuel through the
Chapter 4 – Coal Combustion Principles 33
The Formation of Nitrogen Oxides in a Pulverised Coal Boiler
minimisation of carbon losses but also combustibles passing out of the furnace create
an increased risk of fire and explosion risks in the rear pass of the boiler.
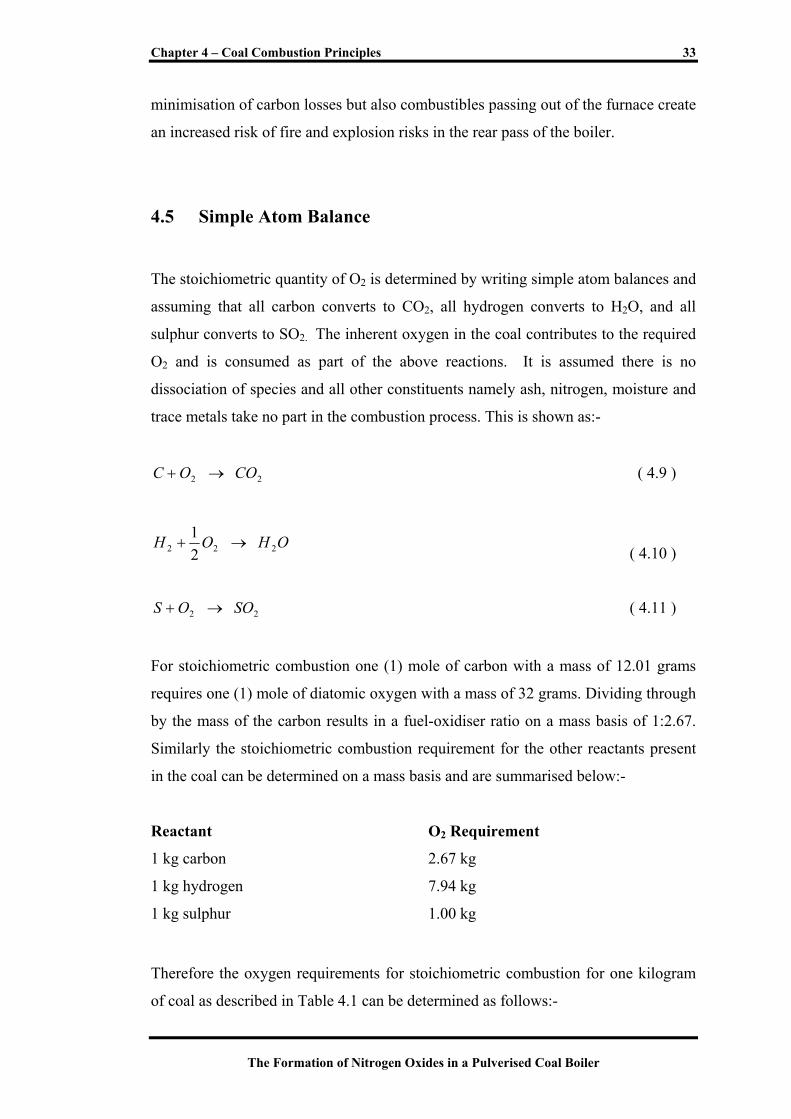
4.5 Simple Atom Balance
The stoichiometric quantity of O2 is determined by writing simple atom balances and
assuming that all carbon converts to CO2, all hydrogen converts to H2O, and all
sulphur converts to SO2. The inherent oxygen in the coal contributes to the required
O2 and is consumed as part of the above reactions. It is assumed there is no
dissociation of species and all other constituents namely ash, nitrogen, moisture and
trace metals take no part in the combustion process. This is shown as:-
22 COOC →+ ( 4.9 )
OHOH 222 21
→+ ( 4.10 )
22 SOOS →+ ( 4.11 )
For stoichiometric combustion one (1) mole of carbon with a mass of 12.01 grams
requires one (1) mole of diatomic oxygen with a mass of 32 grams. Dividing through
by the mass of the carbon results in a fuel-oxidiser ratio on a mass basis of 1:2.67.
Similarly the stoichiometric combustion requirement for the other reactants present
in the coal can be determined on a mass basis and are summarised below:-
Reactant O2 Requirement
1 kg carbon 2.67 kg
1 kg hydrogen 7.94 kg
1 kg sulphur 1.00 kg
Therefore the oxygen requirements for stoichiometric combustion for one kilogram
of coal as described in Table 4.1 can be determined as follows:-
Chapter 4 – Coal Combustion Principles 34
The Formation of Nitrogen Oxides in a Pulverised Coal Boiler
0.7130 kg carbon requires 1.9040 kg of oxygen
0.0371 kg hydrogen requires 0.2950 kg of oxygen
0.0054 kg sulphur requires 0.0054 kg of oxygen
0.0385 kg oxygen consumed in process
- 0.0385 kg of oxygen
TOTAL 2.1660 kg of oxygen
Summing the required amount of oxygen and subtracting the inherent oxygen results
in a requirement of 2.166 kg of oxygen for every kilogram of coal. The atmospheric
air used in the combustion process is 23.2% by mass oxygen, the majority of the
remainder of this mixture being inert nitrogen. Therefore the stoichiometric air
requirement is determined as:-
kg
AirtricStoichiome
33.9
232.0166.2
=
=
4.6 Equivalence Ratio
The equivalence ratio,Φ , is used to indicate quantitatively whether a fuel-oxidiser
mixture is lean, rich, or stoichiometric. It is defined as:-
stoic
stoic
AFAF
FAFA
)/()/(
)/()/(
==Φ ( 4.12 )
where A/F is the mass air-fuel ratio (kg/kg) The definition is such that for stoichiometric mixtures, Φ = 1, for fuel rich mixtures,
Φ > 1, and for fuel lean mixtures, Φ < 1.
The mass flow rate of coal with the boiler operating at 270 MW is approximately
Chapter 4 – Coal Combustion Principles 35
The Formation of Nitrogen Oxides in a Pulverised Coal Boiler
26 kg/s. The bulk of the combustion air is provided to the furnace by the forced
draught fans with a small amount of air provided via the Sealing Air System on the
mills and coal feeders. For the given fuel rate the required combustion air is
26 (2.166) = 242.6 kg/s. Due to an imperfect sealing arrangement in the rotating
regeneratitive air heaters, combustion air is lost from the higher pressure air side to
the lower pressure gas side of the air heater before reaching the furnace. Recent
testing indicated this efficiency loss to be approximately 5% resulting in a
requirement of 1.05 (242.6) = 254.7 kg/s of combustion air.
Using air flow values taken from the boiler control system for the forced draught
system and values from the performance curve for the seal air fan show mass flow
rates of air of 298 kg/s and 3.87 kg/s respectively. The equivalence ratio,Φ , for this
particular configuration is determined as follows:-
skgmcoal 26=
•
( )
skg
m oxygeninherent
1
0385.026
=
=•
skgm draughtforced 298=
•
skgm airseal 87.3=
•
( )
skg
m lossheaterair
9.14
29805.0
=
=•
Chapter 4 – Coal Combustion Principles 36
The Formation of Nitrogen Oxides in a Pulverised Coal Boiler
skg
m aircombustion
286
9.14187.3298
=
−−+=•
Using Equation 4.12 the equivalence ratio is determined as:-
85.0
26286133.9
=
=Φ
With the equivalence ratio now determined the percentage value of excess air can
easily be evaluated using the following:-
%5.20
%1001%
=
ΦΦ−
=AirExcess
(4.13)
This amount of excess air will contain approximately 4.8% oxygen. This relates
closely to the amount of excess oxygen measured by the O2 analysers located at the
boiler exit under normal operation.

The Formation of Nitrogen Oxides in a Pulverised Coal Boiler
Nox Creation Mechanisms and Control
5
Chapter 5 –Nox Creation Mechanisms and Control 38
The Formation of Nitrogen Oxides in a Pulverised Coal Boiler
5.1 Introduction
Nitrogen oxide (NO) and nitrogen dioxide (NO2) known collectively as NOx are
atmospheric pollutants that contribute to the production of photochemical smog and
acid rain. NOx formation occurs during combustion in utility boilers regardless of
the fuel being used. However, of the three major fuels (coal, oil and gas), coal is the
most significant producer of NOx due to the nitrogen contained in the fuel itself.
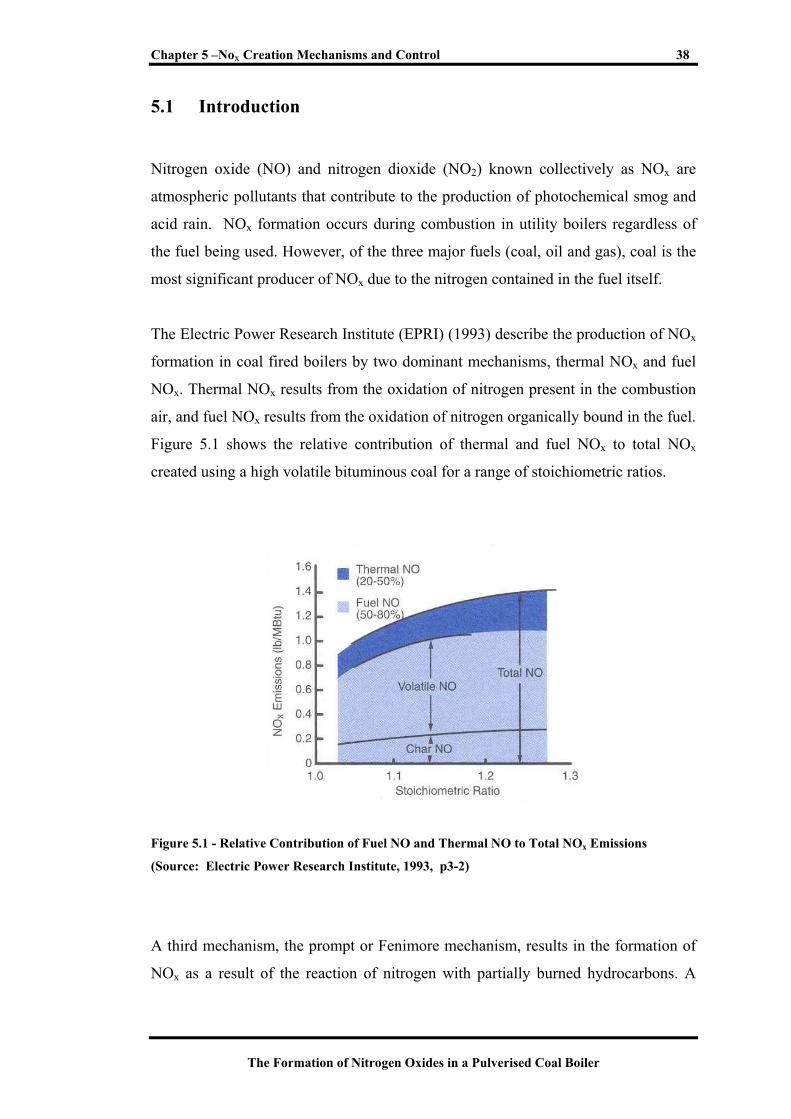
The Electric Power Research Institute (EPRI) (1993) describe the production of NOx
formation in coal fired boilers by two dominant mechanisms, thermal NOx and fuel
NOx. Thermal NOx results from the oxidation of nitrogen present in the combustion
air, and fuel NOx results from the oxidation of nitrogen organically bound in the fuel.
Figure 5.1 shows the relative contribution of thermal and fuel NOx to total NOx
created using a high volatile bituminous coal for a range of stoichiometric ratios.
Figure 5.1 - Relative Contribution of Fuel NO and Thermal NO to Total NOx Emissions
(Source: Electric Power Research Institute, 1993, p3-2)
A third mechanism, the prompt or Fenimore mechanism, results in the formation of
NOx as a result of the reaction of nitrogen with partially burned hydrocarbons. A
Chapter 5 –Nox Creation Mechanisms and Control 39
The Formation of Nitrogen Oxides in a Pulverised Coal Boiler
significant fraction of the NOx produced in this way is converted to diatomic
nitrogen in the boiler and as such was not considered further.
5.2 NOx Creation Mechanisms
5.2.1 Fuel NOx
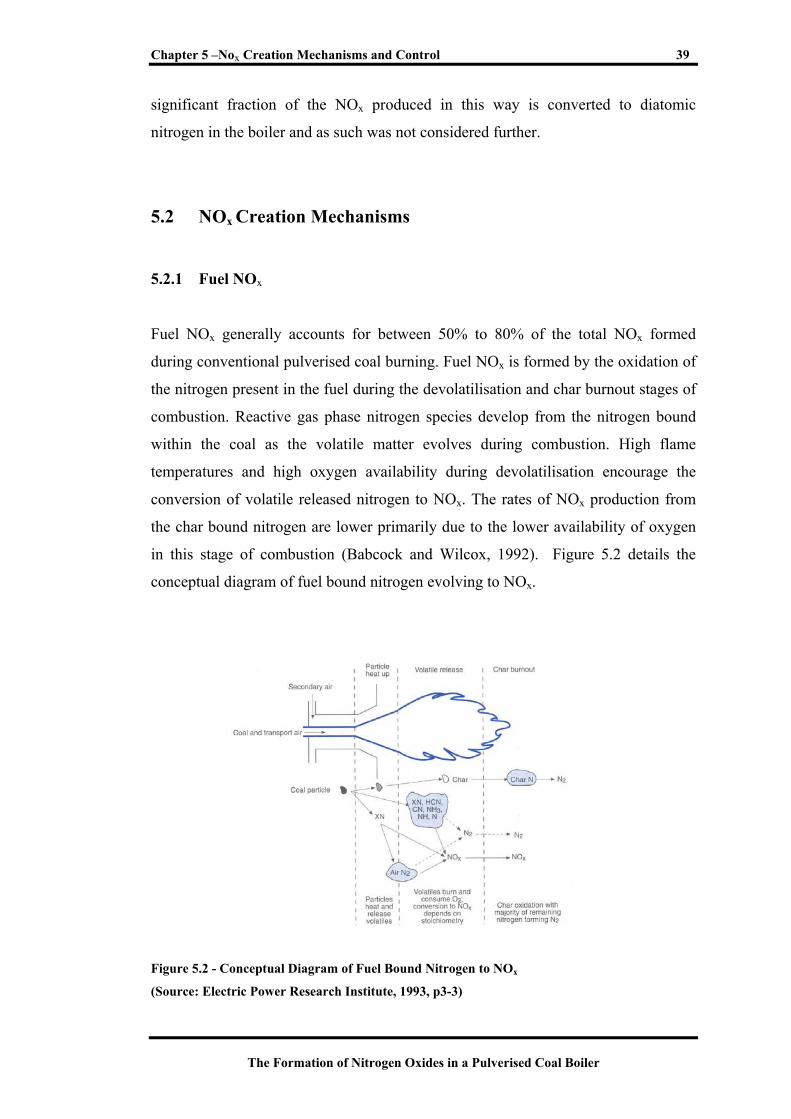
Fuel NOx generally accounts for between 50% to 80% of the total NOx formed
during conventional pulverised coal burning. Fuel NOx is formed by the oxidation of
the nitrogen present in the fuel during the devolatilisation and char burnout stages of
combustion. Reactive gas phase nitrogen species develop from the nitrogen bound
within the coal as the volatile matter evolves during combustion. High flame
temperatures and high oxygen availability during devolatilisation encourage the
conversion of volatile released nitrogen to NOx. The rates of NOx production from
the char bound nitrogen are lower primarily due to the lower availability of oxygen
in this stage of combustion (Babcock and Wilcox, 1992). Figure 5.2 details the
conceptual diagram of fuel bound nitrogen evolving to NOx.
Figure 5.2 - Conceptual Diagram of Fuel Bound Nitrogen to NOx
(Source: Electric Power Research Institute, 1993, p3-3)
Chapter 5 –Nox Creation Mechanisms and Control 40
The Formation of Nitrogen Oxides in a Pulverised Coal Boiler
The most effective method of reducing the amount of fuel NOx during combustion is
to limit the amount of oxygen available as the volatiles are released. Air required to
complete the char reaction process can be introduced later in the process to ensure
sufficient burnout of the char particle and maintain combustion efficiency.
The availability of oxygen during devolatilisation can be reduced by two methods.
One method is to introduce combustion air elsewhere in the furnace and the second
method is the modification or replacement of existing burners so that the rate at
which air is introduced to the flame is reduced. Both of these staging techniques are
described in greater detail later in this chapter.
5.2.2 Thermal NOx
The products of high temperature combustion are not as simple as those described by
the simple atom balances used to determine stoichiometry. Rather the major species
dissociate which results in the production of a host of minor species including O, N,
OH, H, CH, HCN, N2O and NO. Thermal NOx is formed from the dissociation and
oxidation of the nitrogen admitted to the furnace with the combustion air (Turns,
2000).
The rate at which thermal NOx can be formed is dependent upon the availability of
oxygen in the flame and post flame zone and is exponentially dependent upon the
temperature resulting from combustion. The reactions for thermal NOx formation
occur rapidly as combustion temperatures exceed 1,538ºC. Thermal NO generally
accounts for 20% - 50% of total NOx.
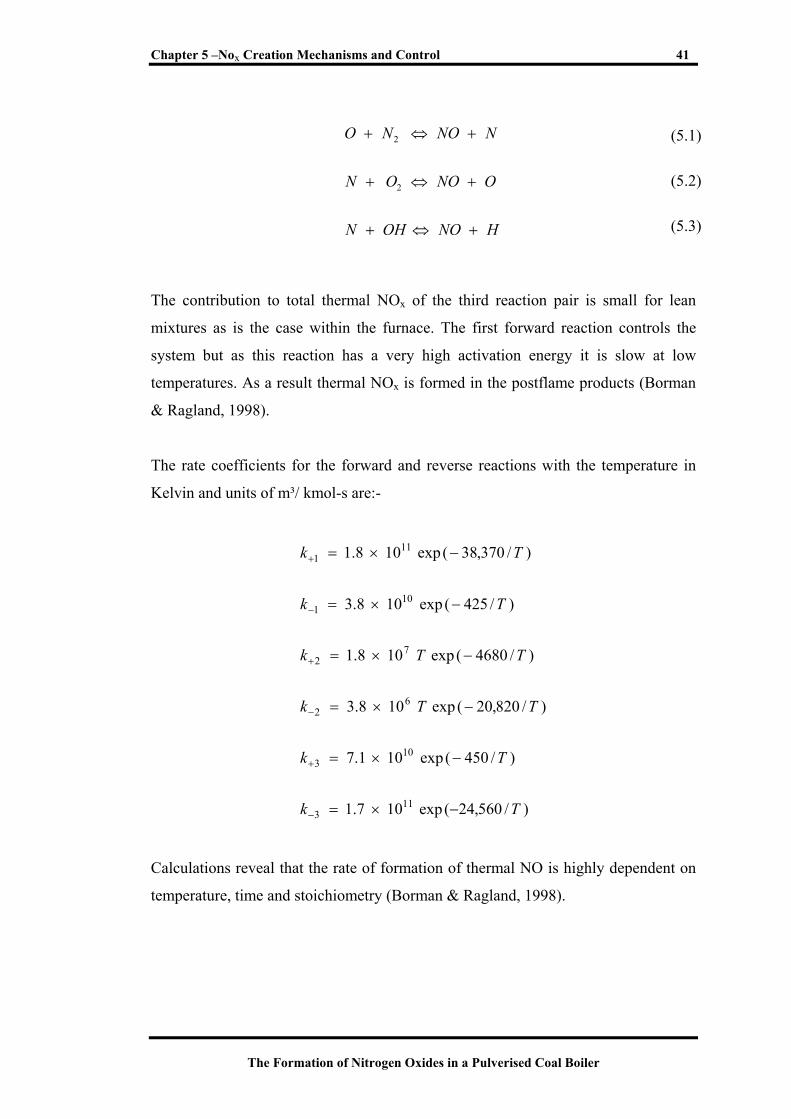
The mechanism through which thermal NOx is produced is well described by the six
(6) reactions of the extended Zeldovich mechanism as shown in Equations 5.1, 5.2
and 5.3:-
Chapter 5 –Nox Creation Mechanisms and Control 41
The Formation of Nitrogen Oxides in a Pulverised Coal Boiler
(5.1) (5.2) (5.3)
The contribution to total thermal NOx of the third reaction pair is small for lean
mixtures as is the case within the furnace. The first forward reaction controls the
system but as this reaction has a very high activation energy it is slow at low
temperatures. As a result thermal NOx is formed in the postflame products (Borman
& Ragland, 1998).
The rate coefficients for the forward and reverse reactions with the temperature in
Kelvin and units of m³/ kmol-s are:-
)/560,24(exp107.1
)/450(exp101.7
)/820,20(exp108.3
)/4680(exp108.1
)/425(exp108.3
)/370,38(exp108.1
113
103
62
72
101
111
Tk
Tk
TTk
TTk
Tk
Tk
−×=
−×=
−×=
−×=
−×=
−×=
−
+
−
+
−
+
Calculations reveal that the rate of formation of thermal NO is highly dependent on
temperature, time and stoichiometry (Borman & Ragland, 1998).
HNOOHN
ONOON
NNONO
+⇔+
+⇔+
+⇔+
2
2
Chapter 5 –Nox Creation Mechanisms and Control 42
The Formation of Nitrogen Oxides in a Pulverised Coal Boiler
5.3 NOx Control
There are numerous technologies available to reduce the NOx emissions produced in
large coal fired boilers. These methods range significantly in cost, effectiveness,
complexity and extent of modifications required to achieve the reduction. As greater
than half of the total NOx produced will be fuel NOx the most effective measures
concentrate on limiting the formation of fuel NOx.
NOx control techniques presently available for use in utility boilers include:-
• Combustion optimisation
• Overfire air (OFA)
• Advanced low NOx burners
• Flue gas recirculation
• Reburning (natural gas, coal, fuel oil)
• Selective non catalytic reduction (SNCR), and
• Selective catalytic reduction (SCR)
Each of these methods is discussed in detail below.
5.3.1 Combustion Optimisation
The optimisation of existing combustion systems is a low cost technique to reduce
NOx emissions at minimal cost. Where a unit is only slightly exceeding acceptable
levels of emissions, the tuning of the boiler may reduce these levels enough to
eliminate the need for any retrofit controls. Under certain circumstances reductions
in NOx of up to 25% are achievable with correct combustion tuning however the
typical value of reductions is less than 10%, with this figure likely to be inconsistent
with load variations.
Chapter 5 –Nox Creation Mechanisms and Control 43
The Formation of Nitrogen Oxides in a Pulverised Coal Boiler
The implementation of advanced process control systems based on neural networks
can be configured to reduce NOx emissions whilst maintaining efficiency over
changing plant conditions and time.
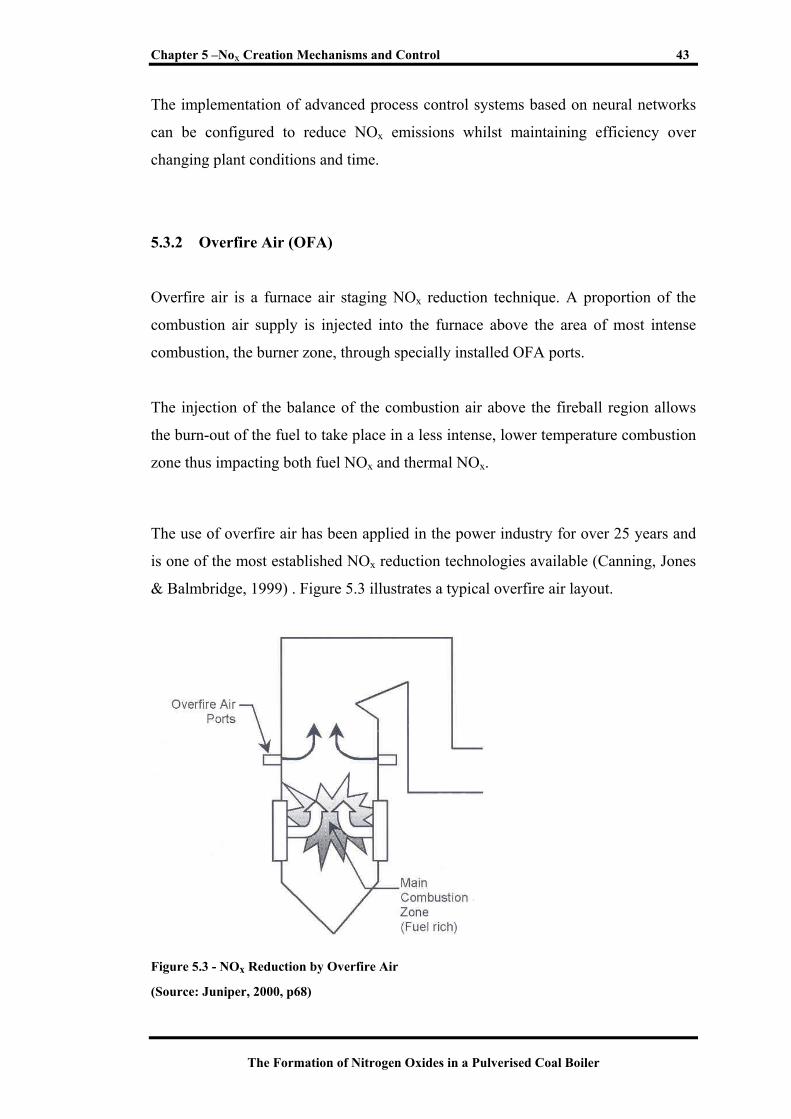
5.3.2 Overfire Air (OFA)
Overfire air is a furnace air staging NOx reduction technique. A proportion of the
combustion air supply is injected into the furnace above the area of most intense
combustion, the burner zone, through specially installed OFA ports.
The injection of the balance of the combustion air above the fireball region allows
the burn-out of the fuel to take place in a less intense, lower temperature combustion
zone thus impacting both fuel NOx and thermal NOx.
The use of overfire air has been applied in the power industry for over 25 years and
is one of the most established NOx reduction technologies available (Canning, Jones
& Balmbridge, 1999) . Figure 5.3 illustrates a typical overfire air layout.
Figure 5.3 - NOx Reduction by Overfire Air
(Source: Juniper, 2000, p68)
Chapter 5 –Nox Creation Mechanisms and Control 44
The Formation of Nitrogen Oxides in a Pulverised Coal Boiler
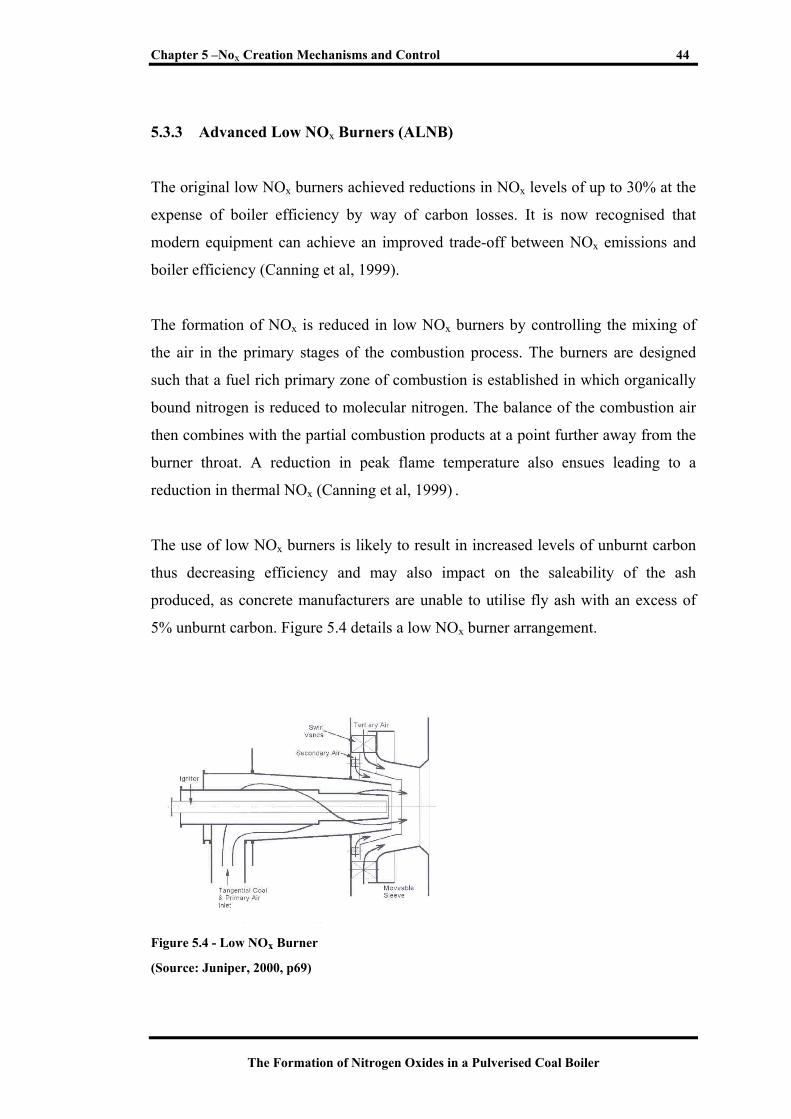
5.3.3 Advanced Low NOx Burners (ALNB)
The original low NOx burners achieved reductions in NOx levels of up to 30% at the
expense of boiler efficiency by way of carbon losses. It is now recognised that
modern equipment can achieve an improved trade-off between NOx emissions and
boiler efficiency (Canning et al, 1999).
The formation of NOx is reduced in low NOx burners by controlling the mixing of
the air in the primary stages of the combustion process. The burners are designed
such that a fuel rich primary zone of combustion is established in which organically
bound nitrogen is reduced to molecular nitrogen. The balance of the combustion air
then combines with the partial combustion products at a point further away from the
burner throat. A reduction in peak flame temperature also ensues leading to a
reduction in thermal NOx (Canning et al, 1999) .
The use of low NOx burners is likely to result in increased levels of unburnt carbon
thus decreasing efficiency and may also impact on the saleability of the ash
produced, as concrete manufacturers are unable to utilise fly ash with an excess of
5% unburnt carbon. Figure 5.4 details a low NOx burner arrangement.
Figure 5.4 - Low NOx Burner
(Source: Juniper, 2000, p69)
Chapter 5 –Nox Creation Mechanisms and Control 45
The Formation of Nitrogen Oxides in a Pulverised Coal Boiler
5.3.4 Flue Gas Recirculation
Flue gas recirculation has been used to control the formation of NOx in gas and oil
fired boilers. Combustion products may be taken from an area in the rear pass of the
boiler, for example near the economiser and injected into the combustion air supply
to the burners. It is believed that the primary NOx reduction mechanism is the
reduction of peak flame temperature and gas residence times. Because the main
effect of flue gas recirculation is on thermal NOx with minimal impact on fuel NOx,
it is rarely considered as an option for NOx reduction in large coal fired boilers
(Canning et al, 1999).
5.3.5 Reburning
Reburning technology is based on the principle that in regions of high temperature
and low oxygen, hydrocarbon based radicals strip oxygen from NO molecules, with
the remaining nitrogen ions combining to form molecular nitrogen.
Reburning is achieved by injecting a hydrocarbon based fuel above the main burners
and combustion area. This fuel contributes to the thermal output from the boiler and
produces a low stoichiometry NOx reduction zone. The balance of the combustion air
to the furnace is injected via overfire air ports located above the reburn fuel injectors
providing the oxygen required to burn out the reburn products and achieve the
desired excess oxygen level for the system (Electric Power Research Institute, 1993).
A reburn system requires a sufficient separation between the main burner zone and
the reburn zone to allow a satisfactory level of combustion of the main combustion
products. Any unburnt char entering the reburn zone will not have yet released all of
its nitrogen resulting in the likelihood of the nitrogen being oxidised to NOx in the
reburn zone. The residence time in the burnout zone needs to be sufficient to ensure
NOx destruction levels are achieved as well as the satisfactory burnout of the
reburned fuel and carbon char from the main burner zone.
Chapter 5 –Nox Creation Mechanisms and Control 46
The Formation of Nitrogen Oxides in a Pulverised Coal Boiler
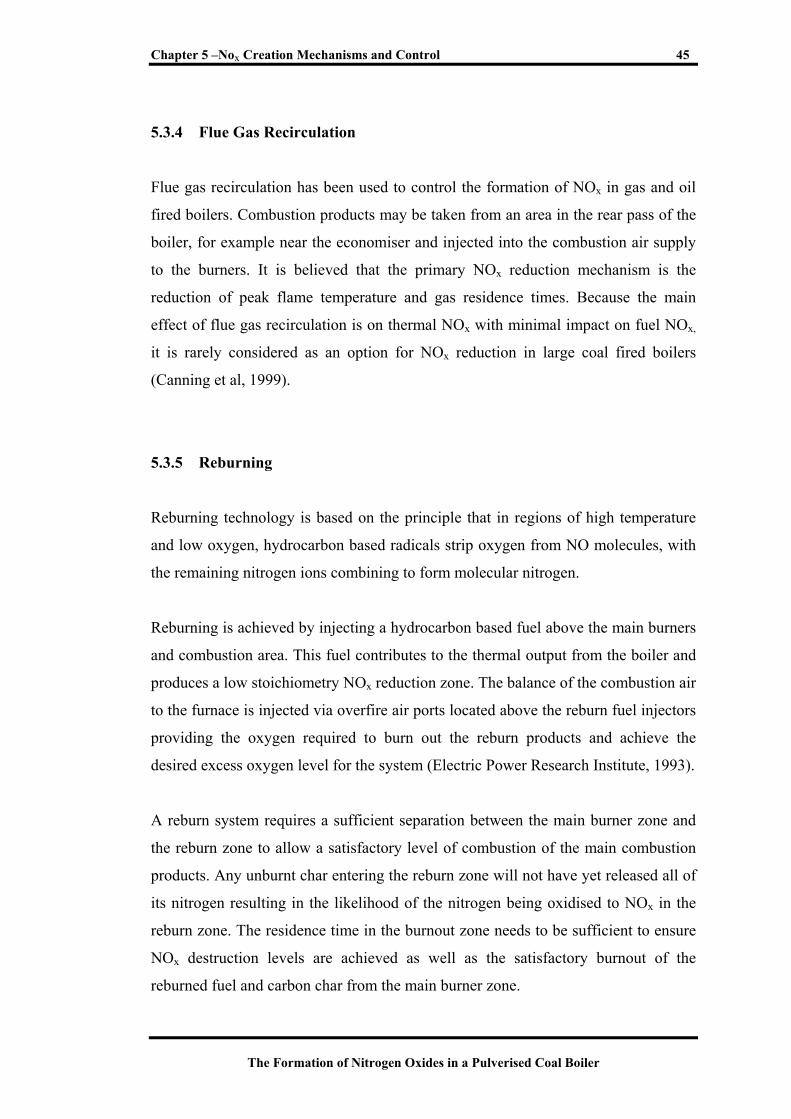
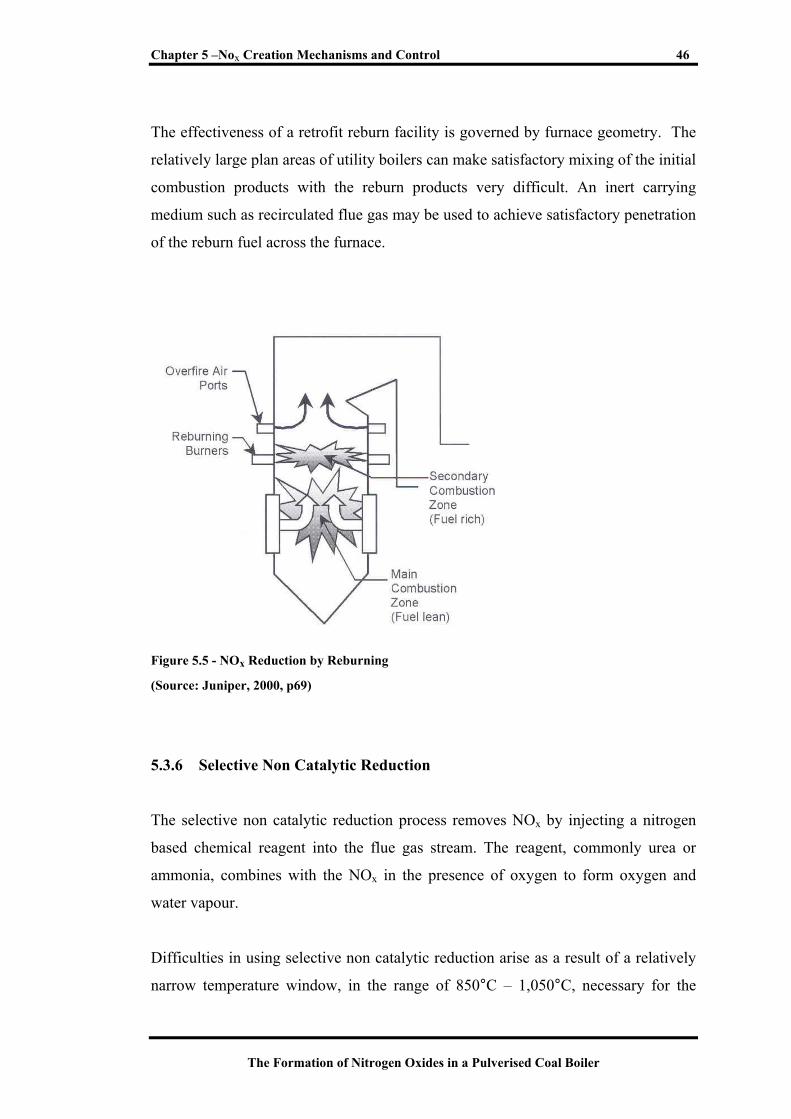
The effectiveness of a retrofit reburn facility is governed by furnace geometry. The
relatively large plan areas of utility boilers can make satisfactory mixing of the initial
combustion products with the reburn products very difficult. An inert carrying
medium such as recirculated flue gas may be used to achieve satisfactory penetration
of the reburn fuel across the furnace.
Figure 5.5 - NOx Reduction by Reburning
(Source: Juniper, 2000, p69)
5.3.6 Selective Non Catalytic Reduction
The selective non catalytic reduction process removes NOx by injecting a nitrogen
based chemical reagent into the flue gas stream. The reagent, commonly urea or
ammonia, combines with the NOx in the presence of oxygen to form oxygen and
water vapour.
Difficulties in using selective non catalytic reduction arise as a result of a relatively
narrow temperature window, in the range of 850°C – 1,050°C, necessary for the
Chapter 5 –Nox Creation Mechanisms and Control 47
The Formation of Nitrogen Oxides in a Pulverised Coal Boiler
desired chemical reactions to occur. If the reagent is injected into a region where the
temperature is too low the process reduction rates decrease, resulting in increased
amounts of ammonia (slip) passing out in the flue gas stream. If the reagent is
injected into a zone where the temperature is too high the reagent begins to react
with O2 to actually form NOx rather than reacting with the NOx already present
(Electric Power Research Institute, 1993).
The application of selective non catalytic reduction has proven to be difficult in large
boilers as there are often high levels of gas stratification and uneven temperature
distributions. There may also be problems with the contamination of saleable ash, the
blockage of air heater baskets and environmental trade offs between NOx emissions
and process by-product emissions associated with ammonia slip (Canning et al,
1999).
5.3.7 Selective Catalytic Reduction
The selective catalytic reduction system removes NOx from the flue gas stream by
combining ammonia with the flue gas NOx in approximately equimolar quantities.
This mixture is then passed over a suitable catalyst material producing primarily
nitrogen, water vapour and trace concentrations of ammonia and sulphur trioxide
(Canning et al, 1999). The temperature under which the NOx reducing reactions can
occur is lowered to around 300°C - 400°C, typically the range of temperatures
encountered in the economiser cross-over area prior to entry into the air heaters.
The installation of a selective catalytic reduction system typically involves the re-
routing of the flue gas from the bottom of the economiser through the catalytic
reactors before returning to the top of the air heaters. Problems that may arise due to
the installation of selective catalytic reduction systems include contamination of
saleable ash, air heater basket blockage and increased corrosion of downstream
equipment due to high SO3 concentrations and sulphuric acid mists. There are also
the environmental considerations including the emissions of SO3 and ammonia as
well as the disposal of the potentially hazardous spent catalyst (Electric Power
Research Institute, 1993).

The Formation of Nitrogen Oxides in a Pulverised Coal Boiler
Engineering Models 6
Chapter 6 –Engineering Models 49
The Formation of Nitrogen Oxides in a Pulverised Coal Boiler
6.1 Introduction
A number of engineering models were developed to describe in sufficient detail the
processes occurring within the boiler that are of interest to this project. Models were
developed to estimate the residence time of the furnace, the initial flame temperature,
the furnace heat pickup and the amount of thermal NOx created.
6.2 An Engineering Model for Furnace Residence Times
6.2.1 Plug Flow
The time taken for an element to pass through the furnace is dependent on the
particle path and flow patterns within the furnace. Only under perfect plug flow
conditions where there is no mixing in the longitudinal direction can the residence
time be known with certainty. In the case of plug flow, the residence time is the same
for all material (Field, Gill, Morgan & Hawksley, 1967).
If f(t)dt expresses the probability that material entering a combustor will reside there
for a period t to t + dt, the fraction of feed residing for a period less than t may be
written F(t) where
∫=t
dttftF0
)()( ( 6.1 )
and the mean period of residence _t may be determined as,
∫∞
=0
_)( dtttft ( 6.2 )
Chapter 6 –Engineering Models 50
The Formation of Nitrogen Oxides in a Pulverised Coal Boiler
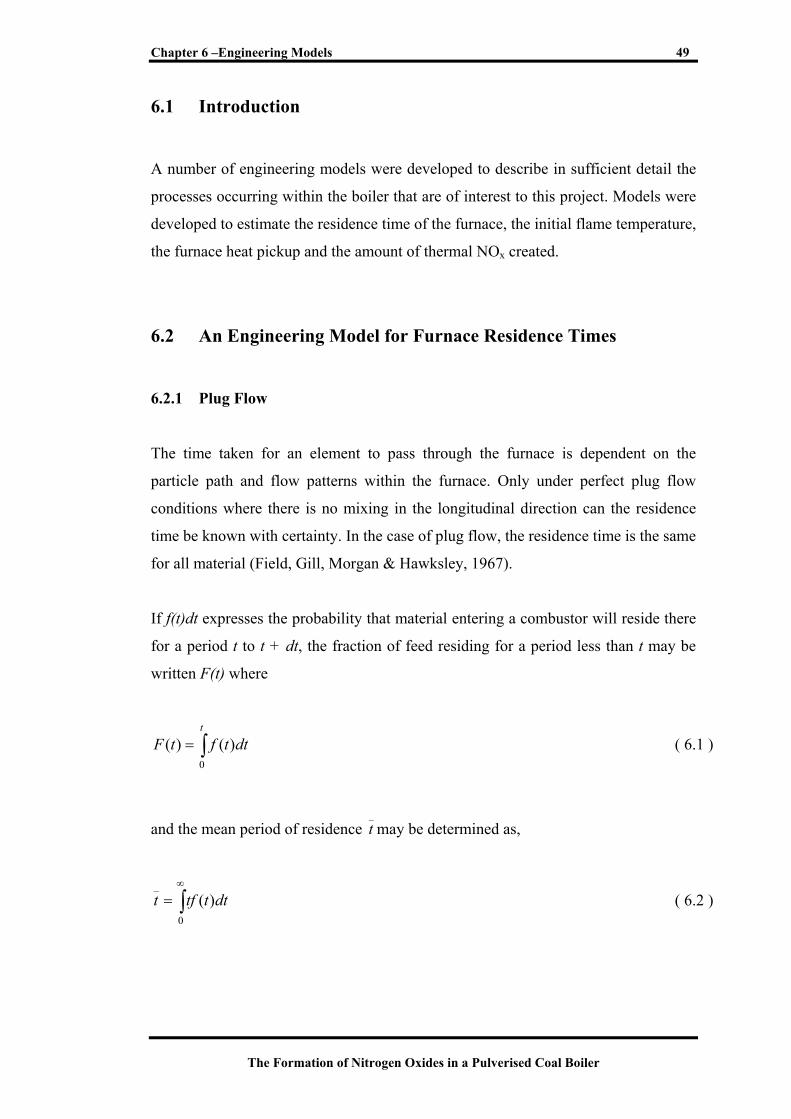
It is usual to express a residence time distribution in a plot of F(t) against t/_t where
t/_t is the ratio of time spent within the combustor to the average residence time. The
case for plug flow is illustrated in Figure 6.1.
0
0.2
0.4
0.6
0.8
1
1.2
0 1 2 3 4 5
Residence Time / Mean Residence Time
F(t)
Figure 6.1 – Plug Flow
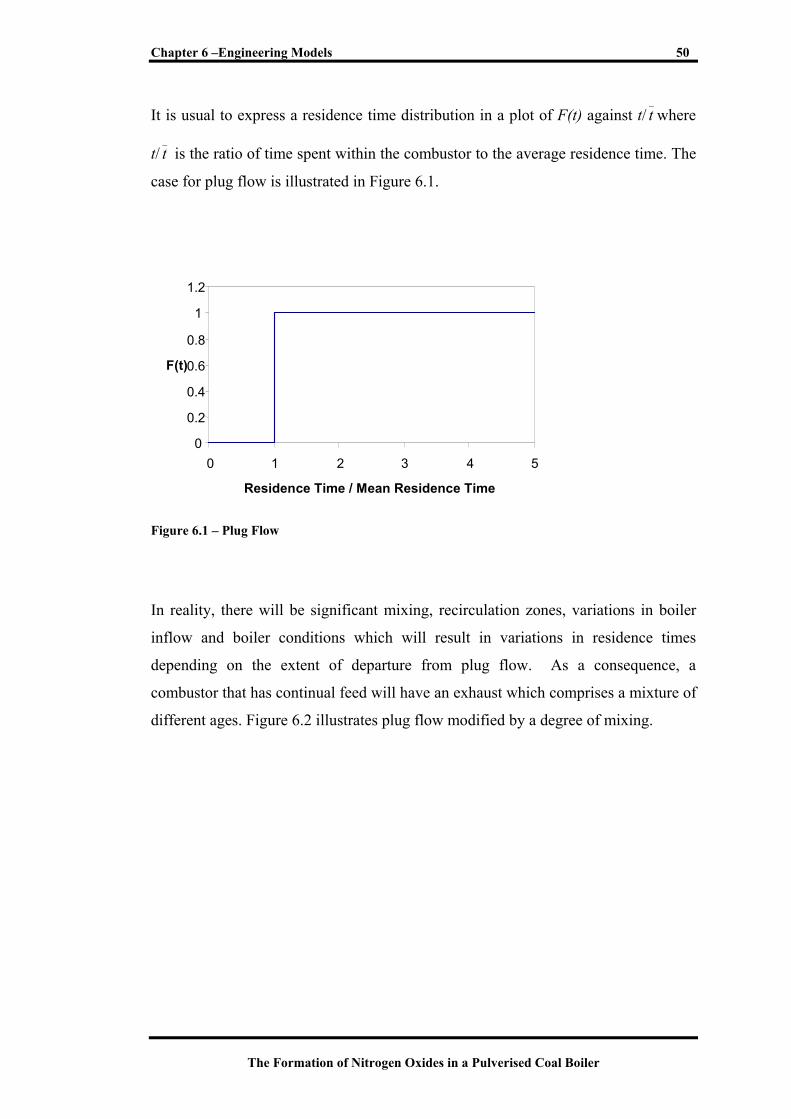
In reality, there will be significant mixing, recirculation zones, variations in boiler
inflow and boiler conditions which will result in variations in residence times
depending on the extent of departure from plug flow. As a consequence, a
combustor that has continual feed will have an exhaust which comprises a mixture of
different ages. Figure 6.2 illustrates plug flow modified by a degree of mixing.
Chapter 6 –Engineering Models 51
The Formation of Nitrogen Oxides in a Pulverised Coal Boiler
0
0.2
0.4
0.6
0.8
1
1.2
0 1 2 3 4 5
Residence Time / Mean Residence Time
F(t)
Figure 6.2 – Plug Flow with a Degree of Mixing
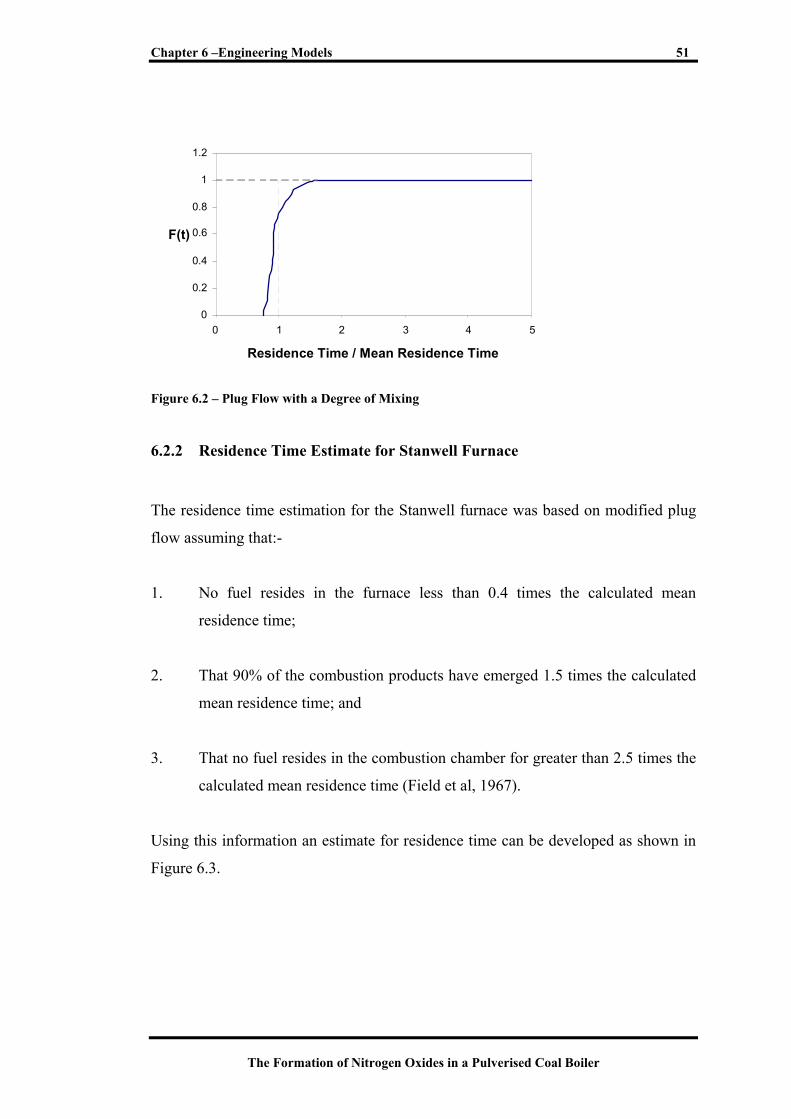
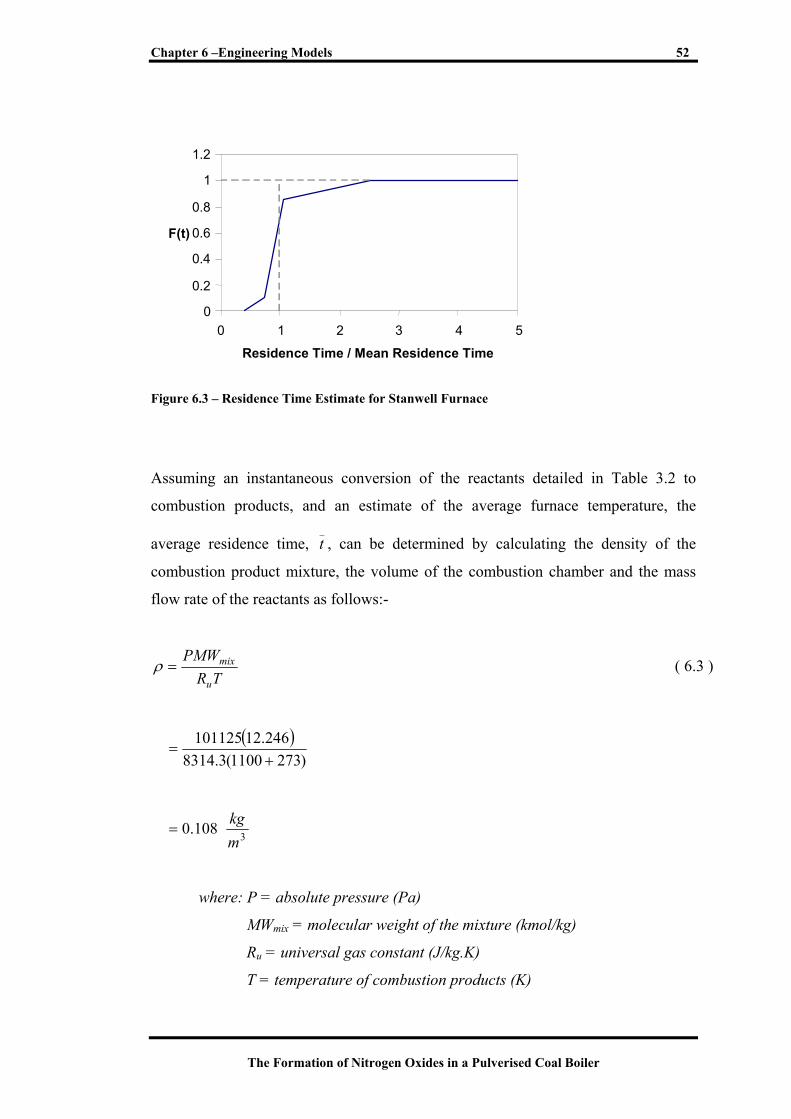
6.2.2 Residence Time Estimate for Stanwell Furnace
The residence time estimation for the Stanwell furnace was based on modified plug
flow assuming that:-
1. No fuel resides in the furnace less than 0.4 times the calculated mean
residence time;
2. That 90% of the combustion products have emerged 1.5 times the calculated
mean residence time; and
3. That no fuel resides in the combustion chamber for greater than 2.5 times the
calculated mean residence time (Field et al, 1967).
Using this information an estimate for residence time can be developed as shown in
Figure 6.3.
Chapter 6 –Engineering Models 52
The Formation of Nitrogen Oxides in a Pulverised Coal Boiler
0
0.2
0.4
0.6
0.8
1
1.2
0 1 2 3 4 5
Residence Time / Mean Residence Time
F(t)
Figure 6.3 – Residence Time Estimate for Stanwell Furnace
Assuming an instantaneous conversion of the reactants detailed in Table 3.2 to
combustion products, and an estimate of the average furnace temperature, the
average residence time, _t , can be determined by calculating the density of the
combustion product mixture, the volume of the combustion chamber and the mass
flow rate of the reactants as follows:-
TRPMW
u
mix=ρ ( 6.3 )
( ))2731100(3.8314
246.12101125+
=
108.0= 3mkg
where: P = absolute pressure (Pa)
MWmix = molecular weight of the mixture (kmol/kg)
Ru = universal gas constant (J/kg.K)
T = temperature of combustion products (K)
Chapter 6 –Engineering Models 53
The Formation of Nitrogen Oxides in a Pulverised Coal Boiler
Knowing the chamber volume and taking the mass flow rate of air and fuel from
boiler control system data the residence time is determined as:-
•=
m
Vt ρ_ ( 6.4 )
( )
ondssec63.1
3274945108.0
=
=
where •m = mass flow rat (kg/s)
V = volume of combustion chamber (m^3)
Applying the average residence time to the residence time estimate described above
results in a minimum residence time of 0.65 seconds and a maximum residence time
of 4.08 seconds.
6.3 An Engineering Model for Flame Temperature
The theoretical flame temperature is determined using a method described in Field et
al (1967). The method is applicable to bituminous coal with moisture contents up to
20%, equivalence ratios of 0.8 to 1.5, and pressures of one (1), three (3), or ten (10)
atmosphere. This satisfies the coal type and moisture content of the coals used at
Stanwell and the furnace with a steady pressure of -0.2 kPa (gauge) can be assumed
to be at one (1) atmosphere.
The method involves calculating the enthalpy of the products by combining the
enthalpy of formation of the coal and the enthalpy of preheat and subtracting the heat
losses from the flame. The amount of heat loss cannot be easily determined and for
the purpose of this project will be assumed to be 15%. The value of the flame
temperature is then calculated using the carbon/oxygen ratio, the nitrogen/oxygen
Chapter 6 –Engineering Models 54
The Formation of Nitrogen Oxides in a Pulverised Coal Boiler
ratio and the calculated enthalpy with a correction made for the amount of nitrogen
present in the flame zone.
The Matlab functions Flame_Temp.m and Flame_Splines.m have been developed to
calculate the flame temperatures under varying conditions. Inputs to the function
include percentages of carbon, hydrogen, oxygen, nitrogen and sulphur of dry ash
free coal, the moisture content of air dried coal, total fuel and air flow. Linear and
spline interpolation was used in the program to determine the values from a series of
given graphs. The Matlab functions Flame_Temp.m and Flame_Splines.m are
presented in Appendix B.
6.4 An Engineering Model for Furnace Heat Pickup
The processes that occur as heat is transferred from the combustion products within
the furnace to the water walls enclosing the furnace is governed by the conservation
of energy which states that there is a balance between the energy, work and heat
quantities entering and leaving the system. The conservation of energy may be
written:-
Initial energy
of the system +
Energy entering
the system =
Final energy
of the system +
Energy leaving
the system
A system boundary can be applied such that the heat transfer to the water walls is a
two flow open system. As there is an equal mass of fluid entering and leaving the
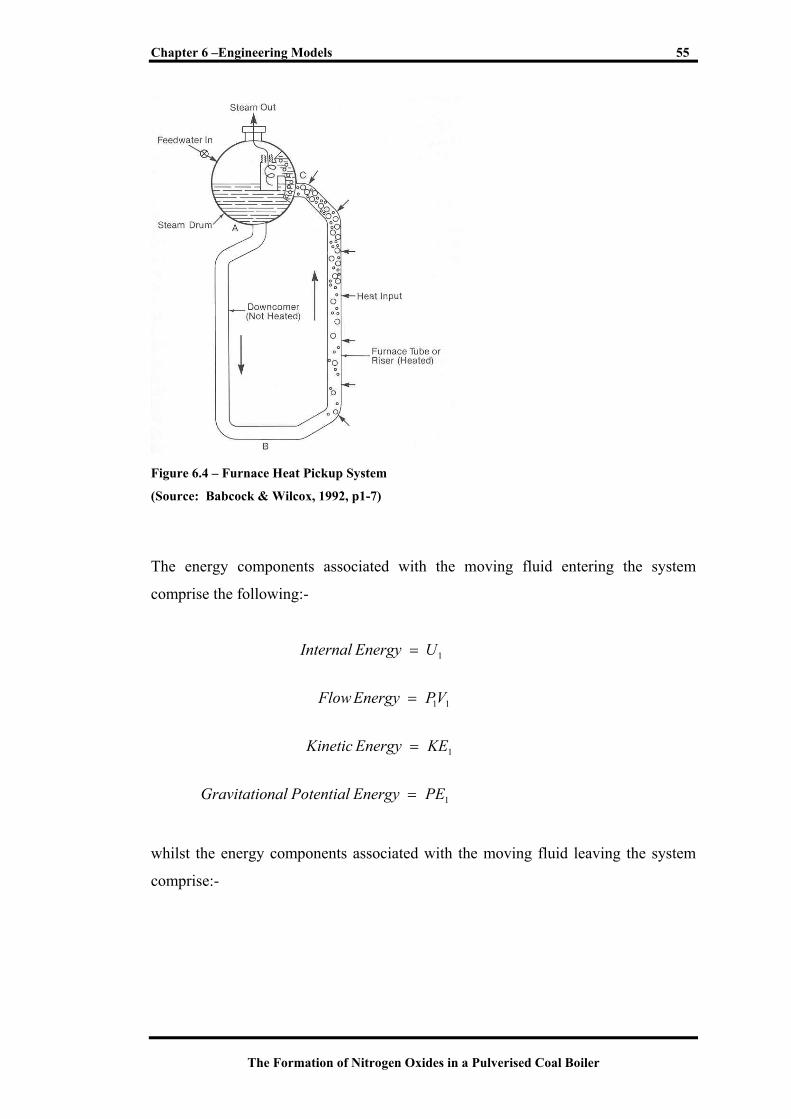
system at any one time the system can be considered steady state. Figure 6.4 portrays
such a system with the inlet boundary being the feedwater in and the outlet boundary
being the steam out. These system boundaries can be used to determine the majority
of the heat transferred to the water walls in the furnace region.
Chapter 6 –Engineering Models 55
The Formation of Nitrogen Oxides in a Pulverised Coal Boiler
Figure 6.4 – Furnace Heat Pickup System
(Source: Babcock & Wilcox, 1992, p1-7)
The energy components associated with the moving fluid entering the system
comprise the following:-
1
1
11
1
PEEnergyPotentialnalGravitatio
KEEnergyKinetic
VPEnergyFlow
UEnergyInternal
=
=
=
=
whilst the energy components associated with the moving fluid leaving the system
comprise:-
Chapter 6 –Engineering Models 56
The Formation of Nitrogen Oxides in a Pulverised Coal Boiler
2
2
22
2
PEEnergyPotentialnalGravitatio
KEEnergyKinetic
VPEnergyFlow
UEnergyInternal
=
=
=
=
By convention the heat, Q, is positive if received by the system and negative if
rejected by the system. External work, W, done by the system is positive and
negative if work is done on the fluid. Both the values of Q and W may be zero if heat
is neither received nor rejected by the system or no work is done on or by the fluid.
The conservation of energy for the system may now be written;
WPEKEVPUEQPEKEVPUE SS +++++=+++++ 222222111111 (6.5)
Recognising the combination of terms U + PV as the enthalpy and also that for a
steady flow system the total energy of the fluid mass within the system, Es remains
constant, Equation 6.5 can be simplified to:-
( ) ( ) ( )121212 PEPEKEKEHHWQ −+−+−=− (6.6)
Incorporating specific fluid properties and system geometry into Equation 6.6
yields:-
wZg
ChqZ
gC
h +++=+++ 2
22
21
21
1 22 (6.7)
Chapter 6 –Engineering Models 57
The Formation of Nitrogen Oxides in a Pulverised Coal Boiler
where: h = enthalpy (kJ/kg)
C = velocity (m/s)
g = gravity constant (m/s2)
Z = height above datum (m)
q = heat (kJ/kg)
w = work (kJ/kg)
As there is no work performed on or by the furnace w = 0 and it can also be safely
assumed that Z∆ , and
∆
2
2C from the feedwater inlet to the drum steam outlet are
negligible compared to the change in enthalpy. Therefore Equation 6.7 can be
simplified to:-
12 hhq −= (6.8)
Equation 6.8 is to be used in conjunction with Equation 3.2, the Dulong formula, to
form a ratio between the enthalpy change multiplied by the feedwater flow and the
specific energy of the coal multiplied by the coal flow to give an estimate of the heat
pick up and allow comparison between different boiler configurations. The furnace
heat ratio formula is shown as Equation 6.9
FlowCoalSEFlowFeedwaterh
RatioHeatFurnacecoal
furnace
×
×∆= (6.9)
6.5 An Engineering Model for Thermal NOx Production
As stated in Chapter 5, the Zeldovich Mechanism can be used to describe the
formation of thermal NOx. With the fuel NOx already produced during the
combustion process, thermal NOx becomes the main source of NOx emissions where
there is an excess of oxygen in the post-flame zone (Borman & Ragland, 1998).
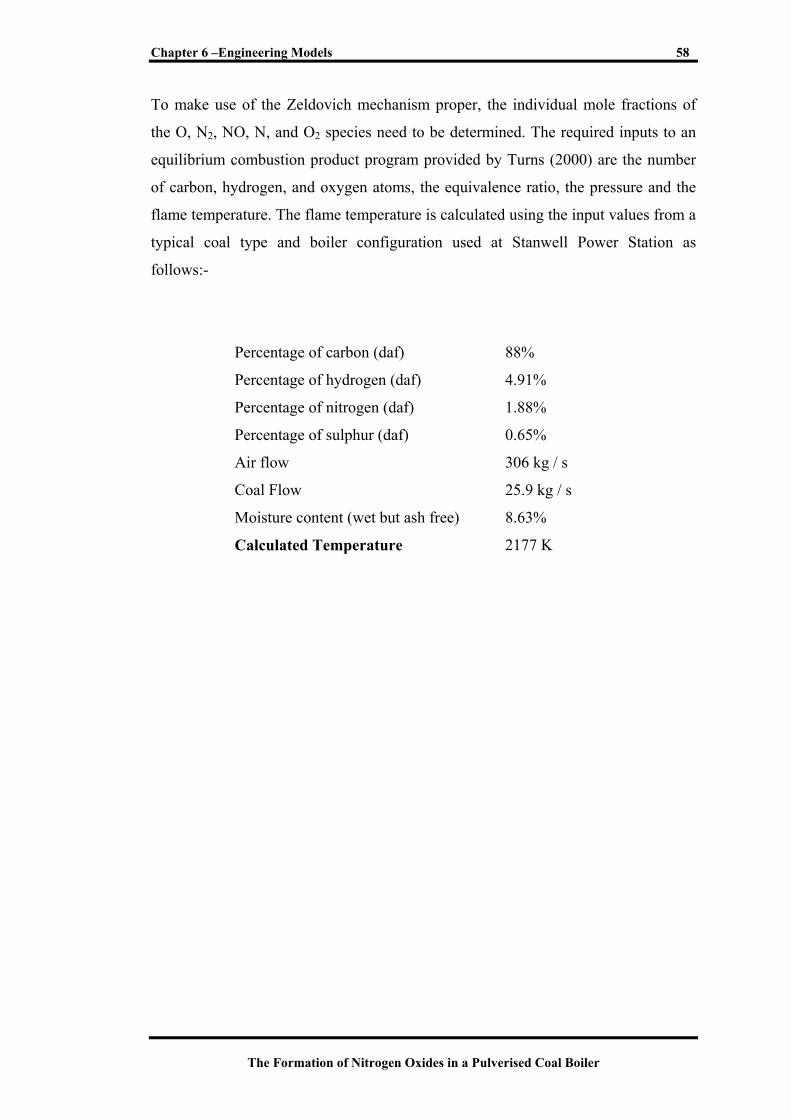
Chapter 6 –Engineering Models 58
The Formation of Nitrogen Oxides in a Pulverised Coal Boiler
To make use of the Zeldovich mechanism proper, the individual mole fractions of
the O, N2, NO, N, and O2 species need to be determined. The required inputs to an
equilibrium combustion product program provided by Turns (2000) are the number
of carbon, hydrogen, and oxygen atoms, the equivalence ratio, the pressure and the
flame temperature. The flame temperature is calculated using the input values from a
typical coal type and boiler configuration used at Stanwell Power Station as
follows:-
Percentage of carbon (daf) 88%
Percentage of hydrogen (daf) 4.91%
Percentage of nitrogen (daf) 1.88%
Percentage of sulphur (daf) 0.65%
Air flow 306 kg / s
Coal Flow 25.9 kg / s
Moisture content (wet but ash free) 8.63%
Calculated Temperature 2177 K
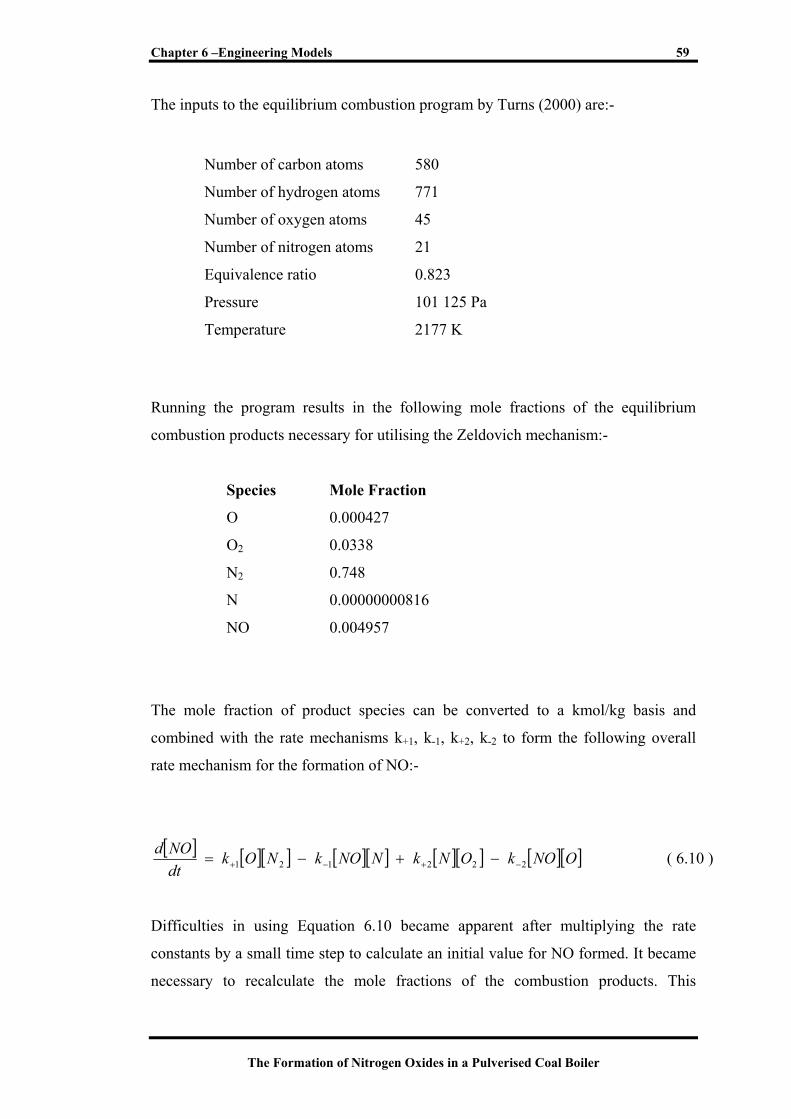
Chapter 6 –Engineering Models 59
The Formation of Nitrogen Oxides in a Pulverised Coal Boiler
The inputs to the equilibrium combustion program by Turns (2000) are:-
Running the program results in the following mole fractions of the equilibrium
combustion products necessary for utilising the Zeldovich mechanism:-
Species Mole Fraction
O 0.000427
O2 0.0338
N2 0.748
N 0.00000000816
NO 0.004957
The mole fraction of product species can be converted to a kmol/kg basis and
combined with the rate mechanisms k+1, k-1, k+2, k-2 to form the following overall
rate mechanism for the formation of NO:-
[ ] [ ][ ] [ ][ ] [ ][ ] [ ][ ]ONOkONkNNOkNOkdtNOd
222121 −+−+ −+−= ( 6.10 )
Difficulties in using Equation 6.10 became apparent after multiplying the rate
constants by a small time step to calculate an initial value for NO formed. It became
necessary to recalculate the mole fractions of the combustion products. This
Number of carbon atoms 580
Number of hydrogen atoms 771
Number of oxygen atoms 45
Number of nitrogen atoms 21
Equivalence ratio 0.823
Pressure 101 125 Pa
Temperature 2177 K
Chapter 6 –Engineering Models 60
The Formation of Nitrogen Oxides in a Pulverised Coal Boiler
recalculation is the subject of complex chemical equilibrium (Turns, 2000) and as
such is well beyond the scope of this project.
It is therefore necessary to simplify Equation 6.10 into a more convenient form. As
the value of the N2 and O2 are much greater than the NO concentration, it can be
safely assumed that these remain constant (Borman & Ragland, 1998). Also in
processes where the combustion of the fuel is complete before NO production
becomes significant, as is the case with the formation of thermal NOx in the post-
flame zone, the processes can be uncoupled. With sufficiently long time scales it is
safe to assume that the N2, O2, and O concentrations are at equilibrium values and
the N atoms are at steady state values. If the further assumption is made that the NO
concentrations are much less than equilibrium values, that is, at the beginning of the
post-flame zone the amount of NO formed by the thermal mechanism is zero, the
reverse reactions can be ignored. This results in the following simple rate equation
(Turns, 2000):-
[ ] [ ] [ ]eqeq NOkdtNOd
212 += ( 6.11 )
Although this rate mechanism greatly simplifies the system and makes very broad
and questionable simplifications, especially disregarding the presence of any NO in
the immediate post-flame zone, for the purposes of this project it is considered
sufficient. This simplified rate mechanism negates the complexities involved in the
recalculation of the equilibrium combustion products.
An initial estimate of the rate of thermal NOx formation can be made by dividing the
furnace into a system of four separate zones of equal residence times as shown in
Figure 6.5. The system inlet boundary is a horizontal plane extended across the
furnace directly above the top windbox row as indicated by the horizontal line at the
bottom of Zone 1. The outlet boundary of the system is a horizontal plane extending
across the top of the furnace in line with the point of the furnace nose as indicated by
the horizontal line at the top of Zone 4. Each zone will have an average combustion
product temperature and initial O concentration. The species concentration of O will
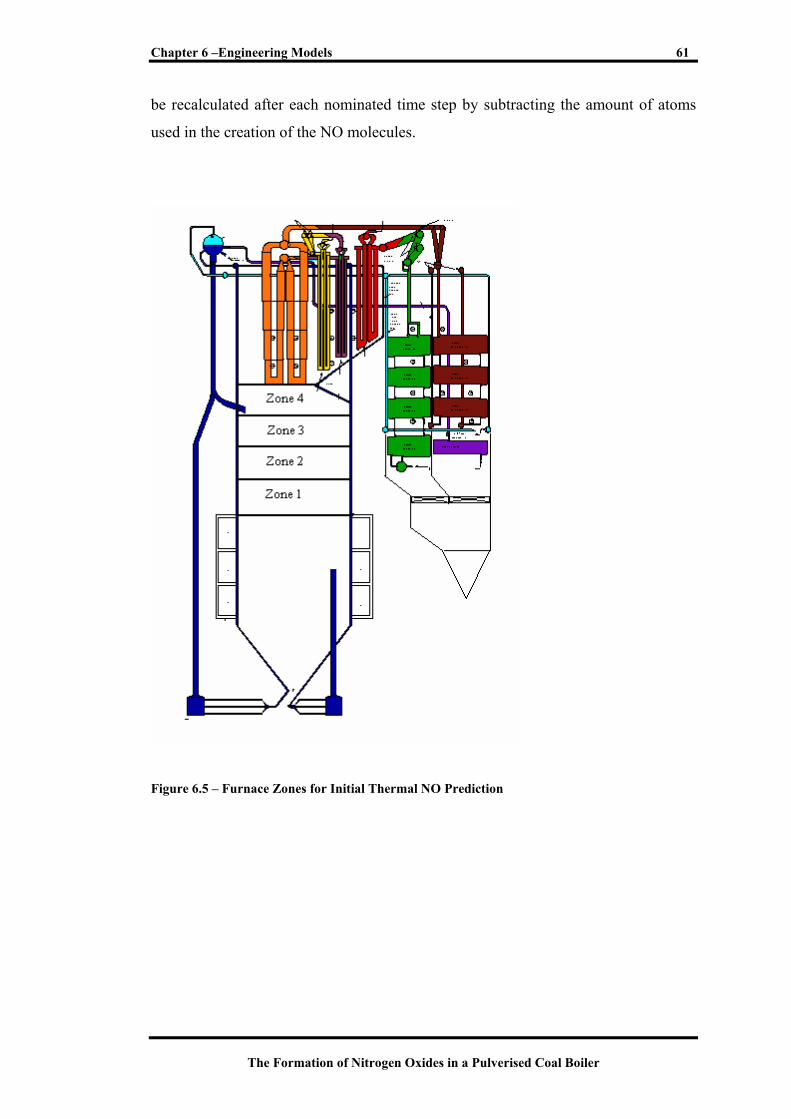
Chapter 6 –Engineering Models 61
The Formation of Nitrogen Oxides in a Pulverised Coal Boiler
be recalculated after each nominated time step by subtracting the amount of atoms
used in the creation of the NO molecules.
Figure 6.5 – Furnace Zones for Initial Thermal NO Prediction
Chapter 6 –Engineering Models 62
The Formation of Nitrogen Oxides in a Pulverised Coal Boiler
As stated previously, to apply the rate mechanism, the mole fractions of the species
of interest are converted to an average kmol/kg basis using the ideal gas law at an
average furnace temperature as follows:-
( 6.12 )
where P = system pressure (Pa)
v = specific volume (m^3)
R = universal gas constant (kJ / kmol-k)
T = Zone temperature (K)
The molar concentration can now be expressed on a kmol / m3 basis by multiplying
the mole fraction of the species of interest by the number of moles occupying one (1)
m3 as determined by Equation 6.12.
The variables of interest for Zone 1 are as follows:-
Temperature (K) 2065
Residence Time (s) 0.82
Initial molar concentration of O
(kmol/kg)
0.00000290
Molar concentration of N2 (kmol/kg) 0.00507
Rate coefficient 1533
Time step (s) 0.05
( )( )
378.6
1729314.81125,101
mmole
TRvPn
=
=
=
Chapter 6 –Engineering Models 63
The Formation of Nitrogen Oxides in a Pulverised Coal Boiler
Applying rate Equation 6.11 in the following form for a time step of 0.05 seconds
results in the following:-
[ ] [ ]
( ) ( ) ( ) ( )
36
36
21
/1025.2
05.01007.51090.215332
2
mkmol
tNOkNO eqeq
−
−−
+
×=
××=
∆=∆
As the quantity of NO has increased, it is assumed that the amount of O remaining in
the system has decreased by a similar amount resulting in:-
[ ]
kmol
Omaining
6
66
1014.0
1025.21039.2Re
−
−−
×=
×−×=
This quantity of O is free to participate in NO formation during the second time step
as follows:-
[ ] [ ]
( ) ( ) ( ) ( )
37
36
21
/10088.1
05.01007.51014.015332
2
mkmol
tNOkNO eqeq
−
−−
+
×=
××=
∆=∆
Similarly the third and fourth rates of formation for each time step can be determined
resulting in:-
81042.2 −×=∆NO
91040.5 −×=∆ NO
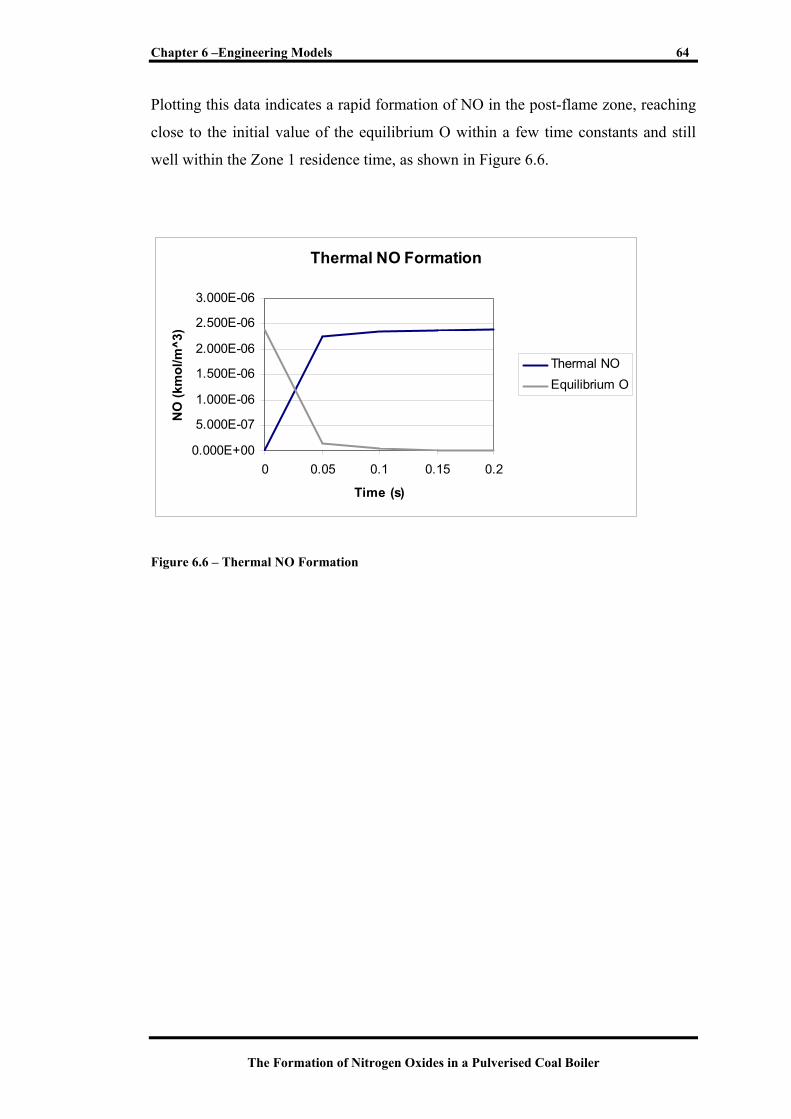
Chapter 6 –Engineering Models 64
The Formation of Nitrogen Oxides in a Pulverised Coal Boiler
Plotting this data indicates a rapid formation of NO in the post-flame zone, reaching
close to the initial value of the equilibrium O within a few time constants and still
well within the Zone 1 residence time, as shown in Figure 6.6.
Thermal NO Formation
0.000E+00
5.000E-07
1.000E-06
1.500E-06
2.000E-06
2.500E-06
3.000E-06
0 0.05 0.1 0.15 0.2
Time (s)
NO
(km
ol/m
^3)
Thermal NOEquilibrium O
Figure 6.6 – Thermal NO Formation

The Formation of Nitrogen Oxides in a Pulverised Coal Boiler
Testing 7
Chapter 7 –Testing 66
The Formation of Nitrogen Oxides in a Pulverised Coal Boiler
7.1 Introduction
The purpose of the testing is to determine the sensitivity of NOx
emissions to
variations of the usual operational configuration. Variations were made to the
distribution of secondary air to the burner levels and also the amount of excess
oxygen available within the furnace. Some of the data collected from the tests was
compared to the predicted theoretical values from the models. Due to confidentiality
issues, the values of NO emissions from Stanwell Power Station do not carry units
and have been modified.
7.2 Variables of Interest
7.2.1 NOx Production
As nitrogen oxide (NO) generally accounts for greater than 95% of the total NOx
emitted from coal-fired boilers (Electric Power Research Institute, 1993), the levels
of raw NO were measured using the Sick GM 31 Emissions Monitoring System.
This in-situ system allows gas to flow through the aperture of a probe installed into
the flue duct. As the flue gases pass through the aperture, a deuterium lamp transmits
pulses of ultraviolet light through the gas. The light then strikes a reflector which
reflects the light back through the gas into the measuring unit. The GM 31 measures
the attenuation of the light as a result of the absorption and dispersion in the mixture
of gas and dust particles using the principle that gas molecules absorb light energy at
wavelengths that are specific to the type of gas (GM 31 Operating Procedure, 1999).
This allows the determination of the individual gas concentrations with a high degree
of precision. The GM 31 measures the raw value of NO in the flue gas whereas the
value for NOx is calculated using the unit control and monitoring system using raw
data including NO, NO2, H2O and O2. Figure 7.1 shows the measuring principle of
the GM 31 optical system.
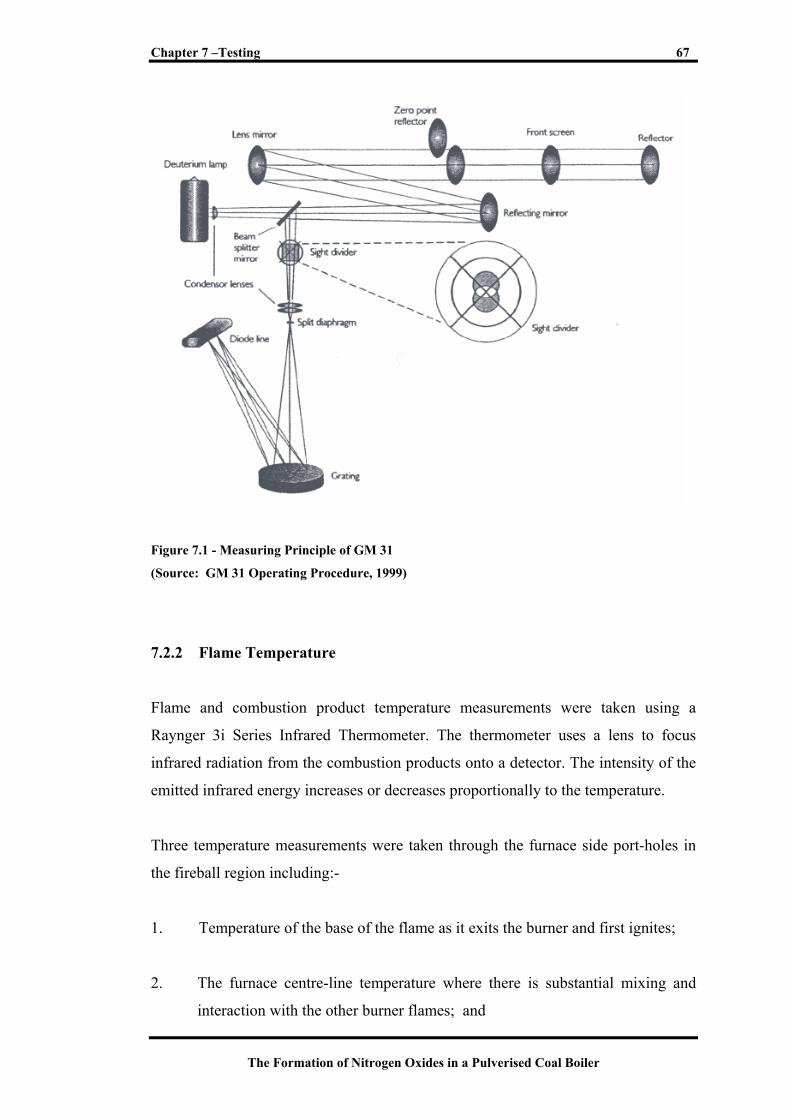
Chapter 7 –Testing 67
The Formation of Nitrogen Oxides in a Pulverised Coal Boiler
Figure 7.1 - Measuring Principle of GM 31
(Source: GM 31 Operating Procedure, 1999)
7.2.2 Flame Temperature
Flame and combustion product temperature measurements were taken using a
Raynger 3i Series Infrared Thermometer. The thermometer uses a lens to focus
infrared radiation from the combustion products onto a detector. The intensity of the
emitted infrared energy increases or decreases proportionally to the temperature.
Three temperature measurements were taken through the furnace side port-holes in
the fireball region including:-
1. Temperature of the base of the flame as it exits the burner and first ignites;
2. The furnace centre-line temperature where there is substantial mixing and
interaction with the other burner flames; and
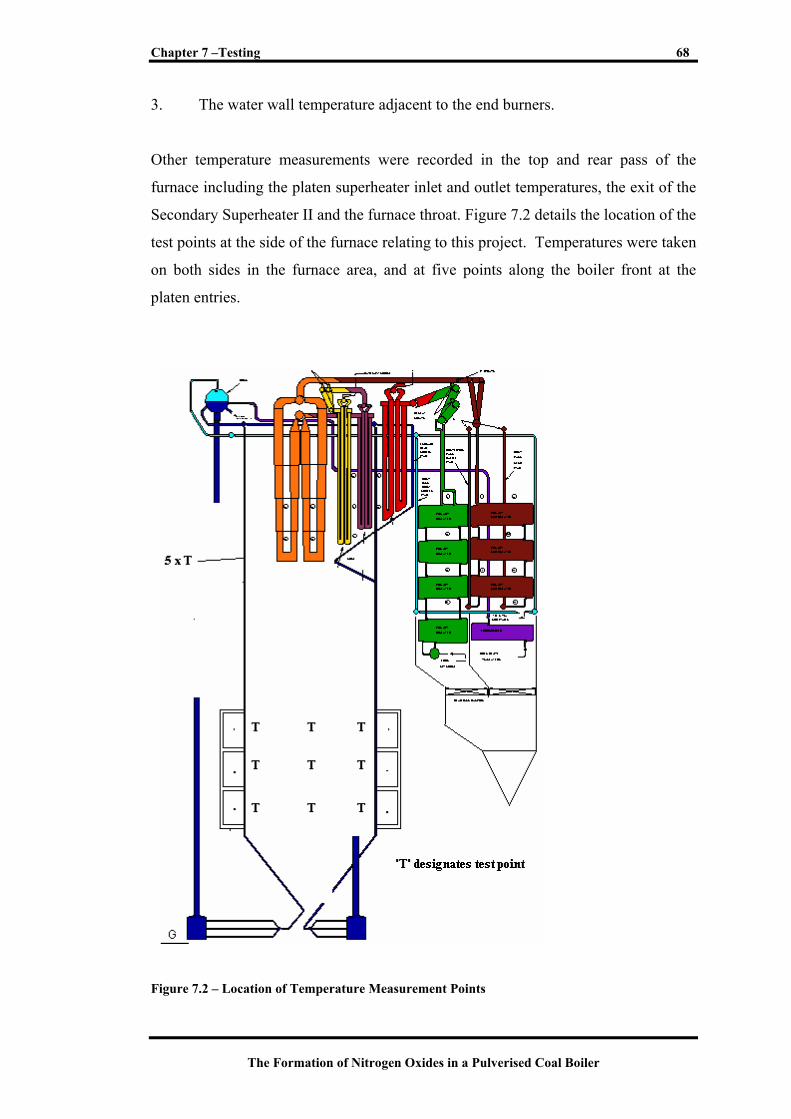
Chapter 7 –Testing 68
The Formation of Nitrogen Oxides in a Pulverised Coal Boiler
3. The water wall temperature adjacent to the end burners.
Other temperature measurements were recorded in the top and rear pass of the
furnace including the platen superheater inlet and outlet temperatures, the exit of the
Secondary Superheater II and the furnace throat. Figure 7.2 details the location of the
test points at the side of the furnace relating to this project. Temperatures were taken
on both sides in the furnace area, and at five points along the boiler front at the
platen entries.
Figure 7.2 – Location of Temperature Measurement Points
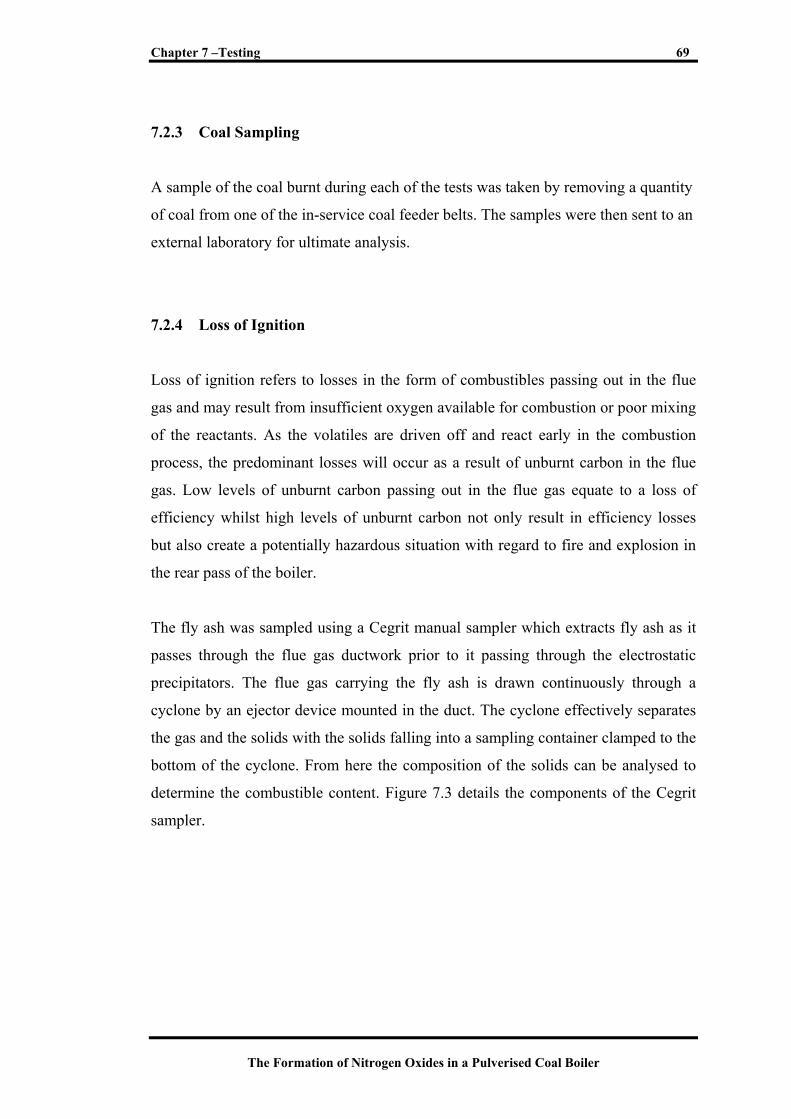
Chapter 7 –Testing 69
The Formation of Nitrogen Oxides in a Pulverised Coal Boiler
7.2.3 Coal Sampling
A sample of the coal burnt during each of the tests was taken by removing a quantity
of coal from one of the in-service coal feeder belts. The samples were then sent to an
external laboratory for ultimate analysis.
7.2.4 Loss of Ignition
Loss of ignition refers to losses in the form of combustibles passing out in the flue
gas and may result from insufficient oxygen available for combustion or poor mixing
of the reactants. As the volatiles are driven off and react early in the combustion
process, the predominant losses will occur as a result of unburnt carbon in the flue
gas. Low levels of unburnt carbon passing out in the flue gas equate to a loss of
efficiency whilst high levels of unburnt carbon not only result in efficiency losses
but also create a potentially hazardous situation with regard to fire and explosion in
the rear pass of the boiler.
The fly ash was sampled using a Cegrit manual sampler which extracts fly ash as it
passes through the flue gas ductwork prior to it passing through the electrostatic
precipitators. The flue gas carrying the fly ash is drawn continuously through a
cyclone by an ejector device mounted in the duct. The cyclone effectively separates
the gas and the solids with the solids falling into a sampling container clamped to the
bottom of the cyclone. From here the composition of the solids can be analysed to
determine the combustible content. Figure 7.3 details the components of the Cegrit
sampler.
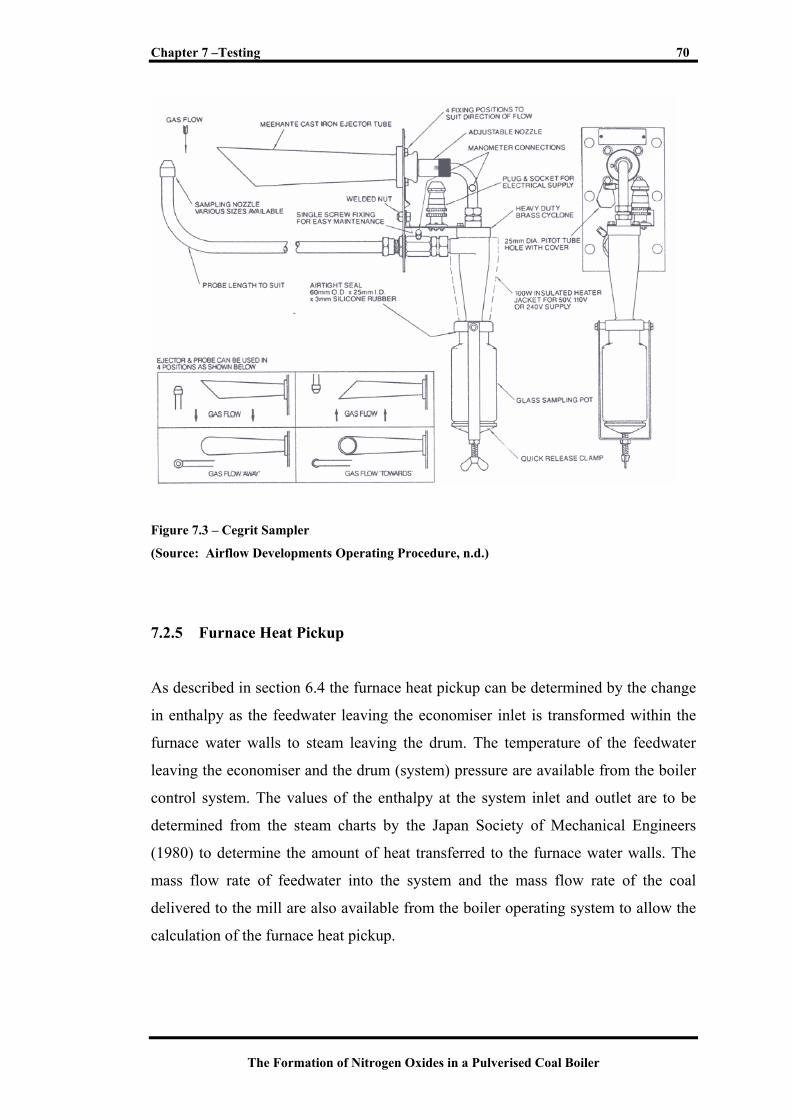
Chapter 7 –Testing 70
The Formation of Nitrogen Oxides in a Pulverised Coal Boiler
Figure 7.3 – Cegrit Sampler
(Source: Airflow Developments Operating Procedure, n.d.)
7.2.5 Furnace Heat Pickup
As described in section 6.4 the furnace heat pickup can be determined by the change
in enthalpy as the feedwater leaving the economiser inlet is transformed within the
furnace water walls to steam leaving the drum. The temperature of the feedwater
leaving the economiser and the drum (system) pressure are available from the boiler
control system. The values of the enthalpy at the system inlet and outlet are to be
determined from the steam charts by the Japan Society of Mechanical Engineers
(1980) to determine the amount of heat transferred to the furnace water walls. The
mass flow rate of feedwater into the system and the mass flow rate of the coal
delivered to the mill are also available from the boiler operating system to allow the
calculation of the furnace heat pickup.
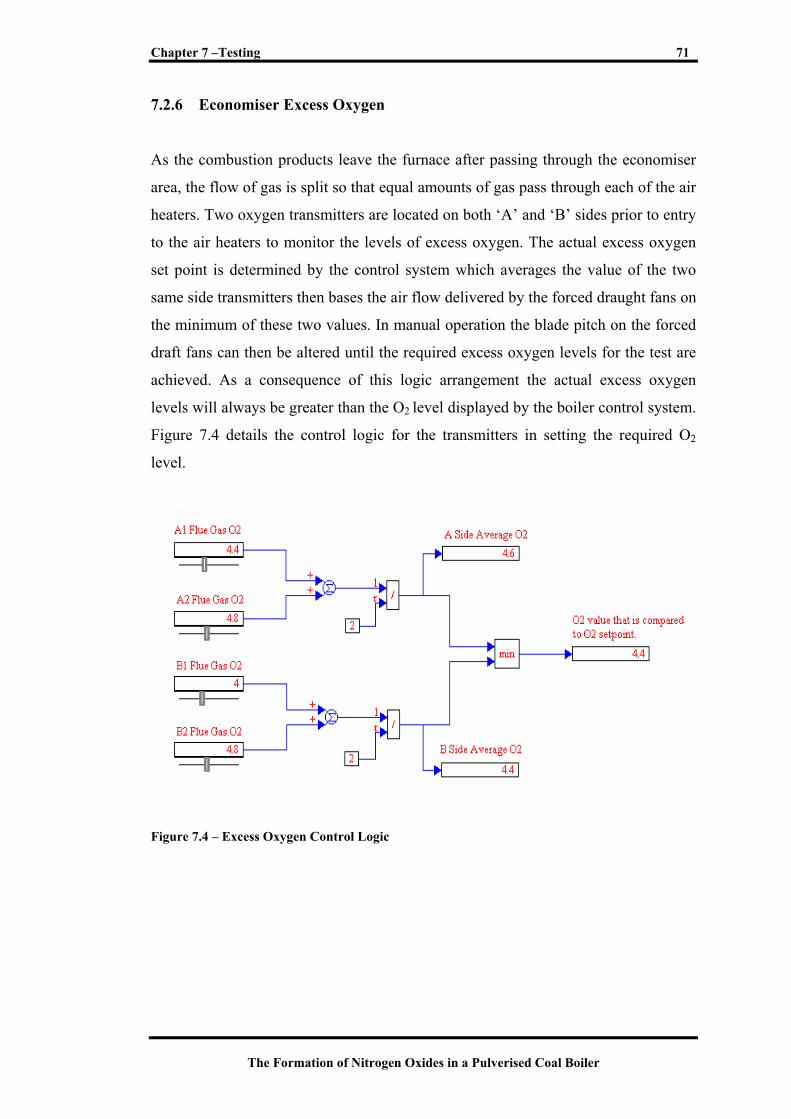
Chapter 7 –Testing 71
The Formation of Nitrogen Oxides in a Pulverised Coal Boiler
7.2.6 Economiser Excess Oxygen
As the combustion products leave the furnace after passing through the economiser
area, the flow of gas is split so that equal amounts of gas pass through each of the air
heaters. Two oxygen transmitters are located on both ‘A’ and ‘B’ sides prior to entry
to the air heaters to monitor the levels of excess oxygen. The actual excess oxygen
set point is determined by the control system which averages the value of the two
same side transmitters then bases the air flow delivered by the forced draught fans on
the minimum of these two values. In manual operation the blade pitch on the forced
draft fans can then be altered until the required excess oxygen levels for the test are
achieved. As a consequence of this logic arrangement the actual excess oxygen
levels will always be greater than the O2 level displayed by the boiler control system.
Figure 7.4 details the control logic for the transmitters in setting the required O2
level.
Figure 7.4 – Excess Oxygen Control Logic
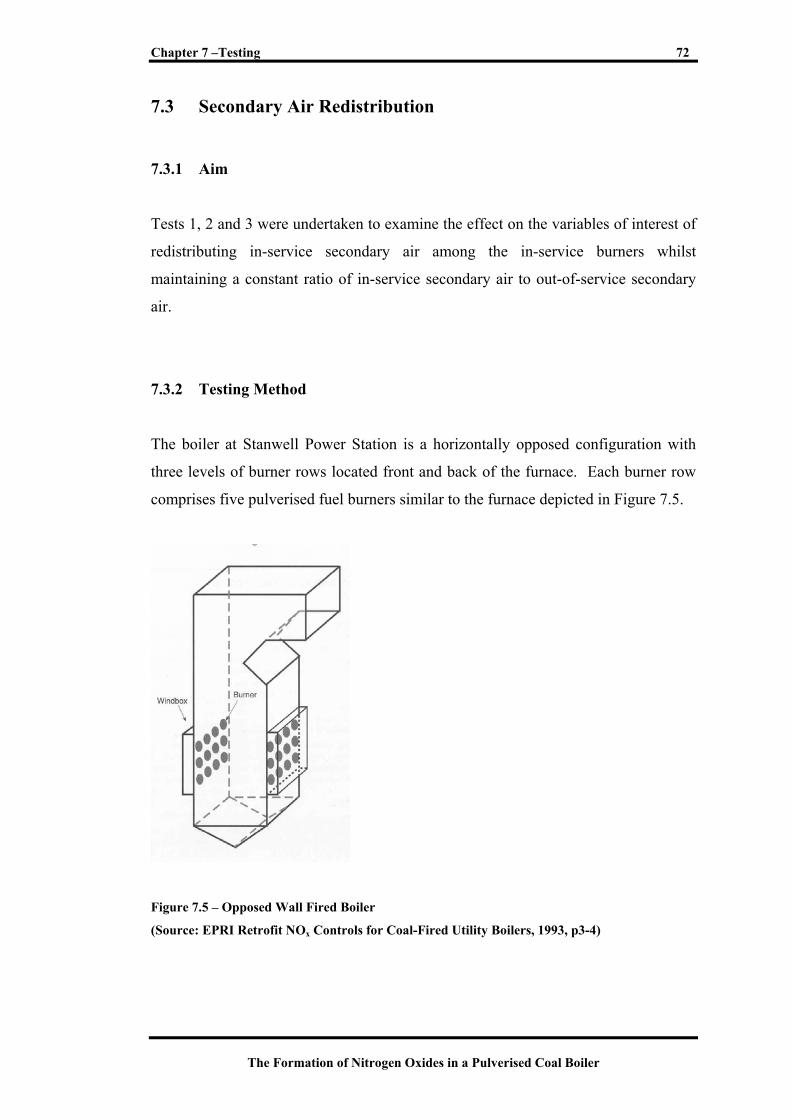
Chapter 7 –Testing 72
The Formation of Nitrogen Oxides in a Pulverised Coal Boiler
7.3 Secondary Air Redistribution
7.3.1 Aim
Tests 1, 2 and 3 were undertaken to examine the effect on the variables of interest of
redistributing in-service secondary air among the in-service burners whilst
maintaining a constant ratio of in-service secondary air to out-of-service secondary
air.
7.3.2 Testing Method
The boiler at Stanwell Power Station is a horizontally opposed configuration with
three levels of burner rows located front and back of the furnace. Each burner row
comprises five pulverised fuel burners similar to the furnace depicted in Figure 7.5.
Figure 7.5 – Opposed Wall Fired Boiler
(Source: EPRI Retrofit NOx Controls for Coal-Fired Utility Boilers, 1993, p3-4)
Chapter 7 –Testing 73
The Formation of Nitrogen Oxides in a Pulverised Coal Boiler
Located at the ends of each row of five burners are a pair of windbox dampers that
control the amount of secondary air flow to each of the burner windboxes. These six
sets of windbox dampers have a range of operation between 40% and 100% and can
be adjusted to achieve the desired test position.
7.3.3 Testing Assumptions
The following assumptions were made for these series of tests:-
1. Uniform secondary air duct static pressure and therefore a constant position
to flow relationship irrespective of burner level.
2. To maintain a constant ratio of in-service to out-of-service secondary air,
assume a linear damper position to flow relationship. For example, the
opening of one in-service windbox damper pair 15% to be compensated by
closing the three remaining in-service windbox damper pairs by 5% each.
7.3.4 Specific Requirements
1. Test duration to be 1.5 hours minimum.
2. Allow 30 minutes after dampers are adjusted to allow boiler to stabilise
before commencing testing.
3. Coal samples to be taken at commencement and conclusion of each test to
check for variations in quality during test.
7.3.5 Boiler Conditioning
The following plant conditioning was required:-
Chapter 7 –Testing 74
The Formation of Nitrogen Oxides in a Pulverised Coal Boiler
• 270 MW – a steady load is required to allow comparable results to be obtained.
• Automatic Governor Control (AGC) de-selected – this step is required to stop
the market traders altering the output from the unit in response to changes in the
national electricity market.
• Boiler Load Set Point (BLSP) – the generator output is governed by the steam
flow from the boiler.
• Calorific Value (CV) trim to manual – this step will result in a steady mass flow
of coal being delivered to each of the four in-service mills.
• O2 trim to manual – this step fixes the position of the forced draft fans and
results in a steady mass flow of air to the boiler.
• No soot blowing to be performed during testing – soot blowing uses steam
produced in the boiler resulting in reduced steam flow to the turbines and
increased heat pick up from the areas that have been cleaned. Water vapour will
also be present in the flue gas and affect the fly ash samples.
7.4 Test 1
A baseline test was performed to determine the value of the variables of interest
under normal operating conditions. These windbox damper positions are those that
were identified and incorporated into the control system during unit commissioning
as detailed in Table 7.1.
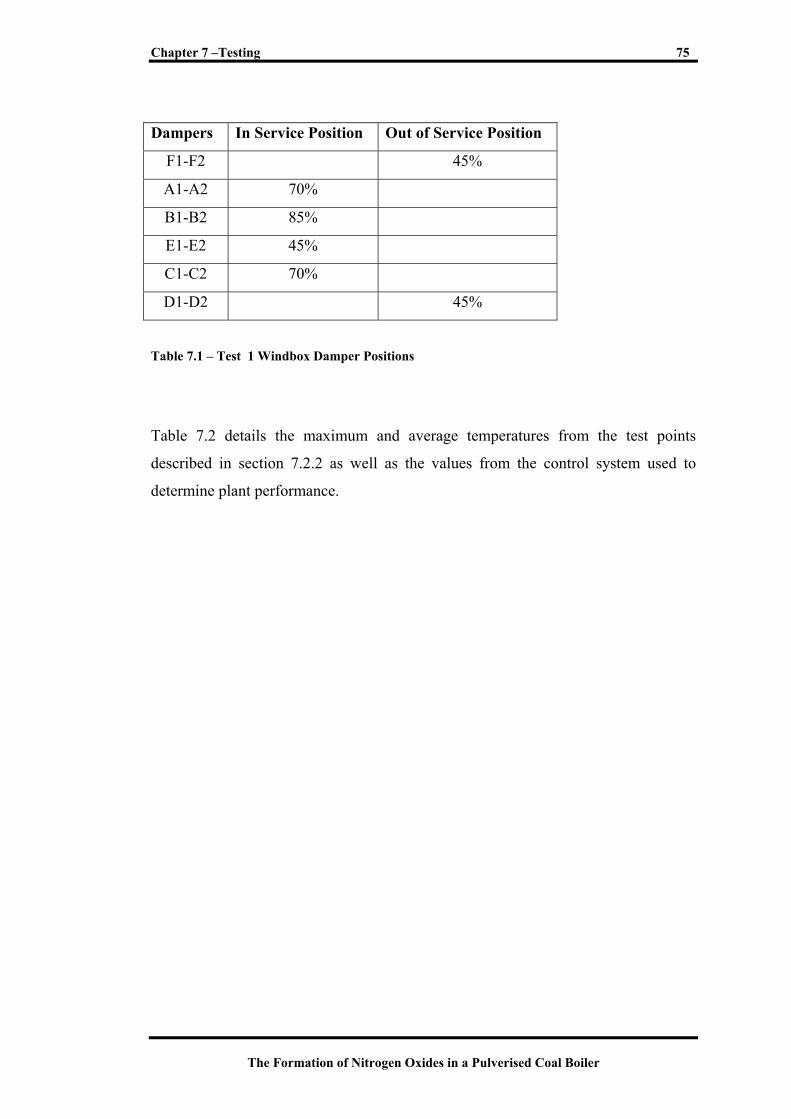
Chapter 7 –Testing 75
The Formation of Nitrogen Oxides in a Pulverised Coal Boiler
Dampers In Service Position Out of Service Position
F1-F2 45%
A1-A2 70%
B1-B2 85%
E1-E2 45%
C1-C2 70%
D1-D2 45%
Table 7.1 – Test 1 Windbox Damper Positions
Table 7.2 details the maximum and average temperatures from the test points
described in section 7.2.2 as well as the values from the control system used to
determine plant performance.
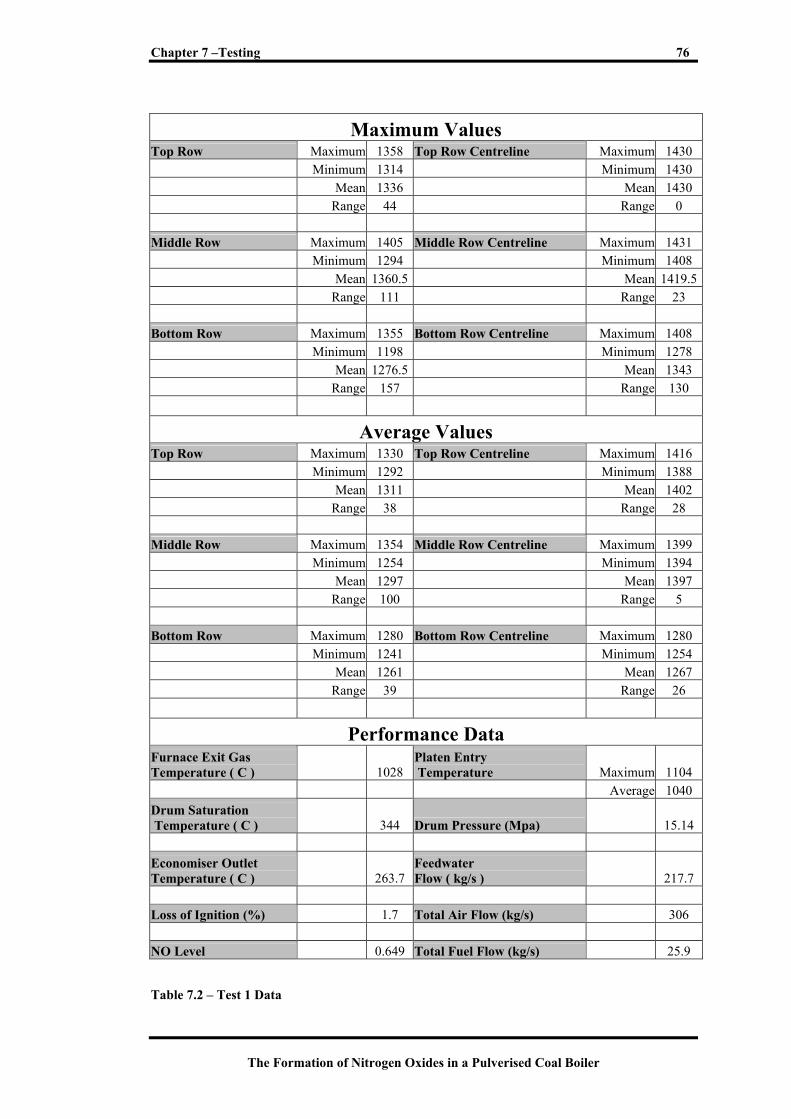
Chapter 7 –Testing 76
The Formation of Nitrogen Oxides in a Pulverised Coal Boiler
Maximum Values Top Row Maximum 1358 Top Row Centreline Maximum 1430 Minimum 1314 Minimum 1430 Mean 1336 Mean 1430 Range 44 Range 0 Middle Row Maximum 1405 Middle Row Centreline Maximum 1431 Minimum 1294 Minimum 1408 Mean 1360.5 Mean 1419.5 Range 111 Range 23 Bottom Row Maximum 1355 Bottom Row Centreline Maximum 1408 Minimum 1198 Minimum 1278 Mean 1276.5 Mean 1343 Range 157 Range 130
Average Values Top Row Maximum 1330 Top Row Centreline Maximum 1416 Minimum 1292 Minimum 1388 Mean 1311 Mean 1402 Range 38 Range 28 Middle Row Maximum 1354 Middle Row Centreline Maximum 1399 Minimum 1254 Minimum 1394 Mean 1297 Mean 1397 Range 100 Range 5 Bottom Row Maximum 1280 Bottom Row Centreline Maximum 1280 Minimum 1241 Minimum 1254 Mean 1261 Mean 1267 Range 39 Range 26
Performance Data Furnace Exit Gas Temperature ( C )
1028
Platen Entry Temperature Maximum 1104
Average 1040 Drum Saturation Temperature ( C ) 344 Drum Pressure (Mpa)
15.14
Economiser Outlet Temperature ( C ) 263.7
Feedwater Flow ( kg/s ) 217.7
Loss of Ignition (%) 1.7 Total Air Flow (kg/s) 306 NO Level 0.649 Total Fuel Flow (kg/s) 25.9 Table 7.2 – Test 1 Data
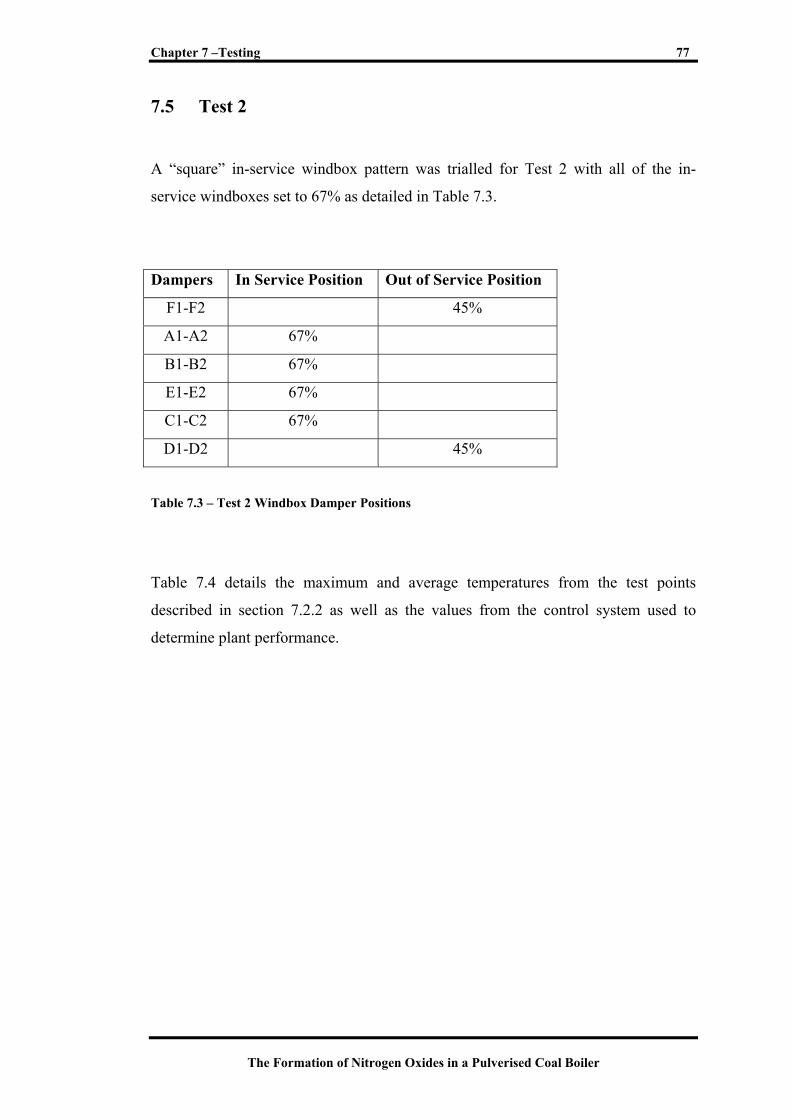
Chapter 7 –Testing 77
The Formation of Nitrogen Oxides in a Pulverised Coal Boiler
7.5 Test 2
A “square” in-service windbox pattern was trialled for Test 2 with all of the in-
service windboxes set to 67% as detailed in Table 7.3.
Dampers In Service Position Out of Service Position
F1-F2 45%
A1-A2 67%
B1-B2 67%
E1-E2 67%
C1-C2 67%
D1-D2 45%
Table 7.3 – Test 2 Windbox Damper Positions
Table 7.4 details the maximum and average temperatures from the test points
described in section 7.2.2 as well as the values from the control system used to
determine plant performance.
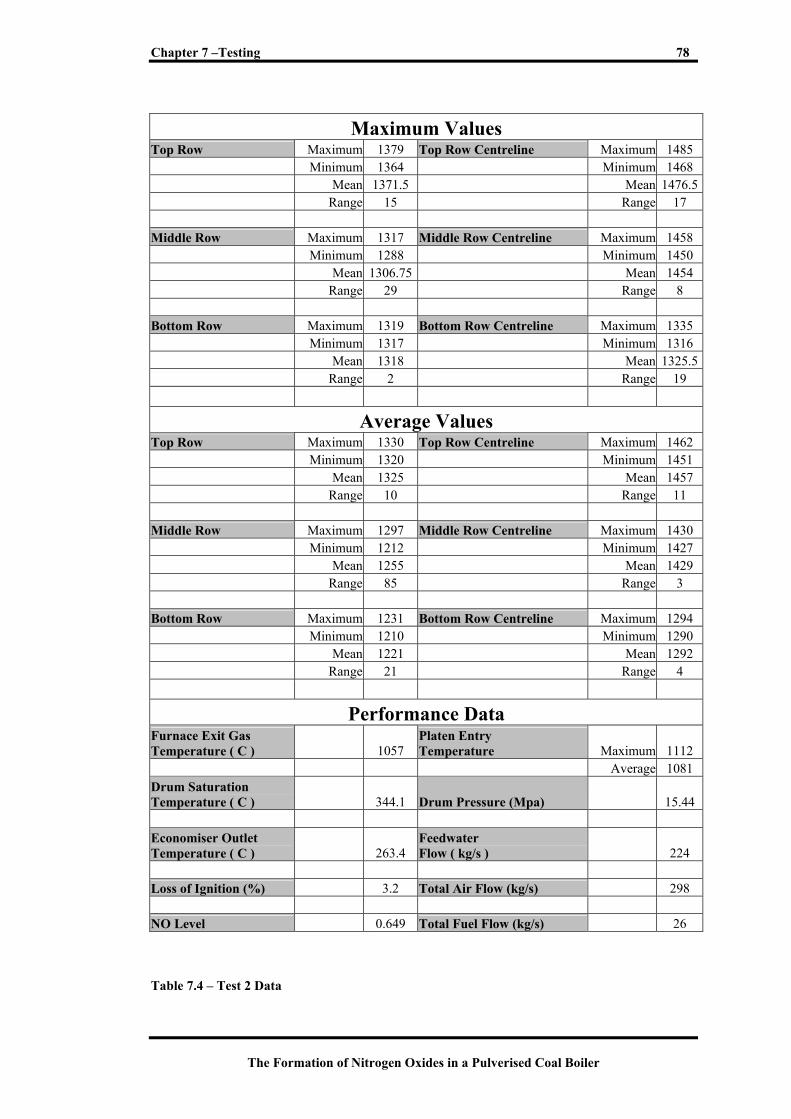
Chapter 7 –Testing 78
The Formation of Nitrogen Oxides in a Pulverised Coal Boiler
Maximum Values
Top Row Maximum 1379 Top Row Centreline Maximum 1485 Minimum 1364 Minimum 1468 Mean 1371.5 Mean 1476.5 Range 15 Range 17 Middle Row Maximum 1317 Middle Row Centreline Maximum 1458 Minimum 1288 Minimum 1450 Mean 1306.75 Mean 1454 Range 29 Range 8 Bottom Row Maximum 1319 Bottom Row Centreline Maximum 1335 Minimum 1317 Minimum 1316 Mean 1318 Mean 1325.5 Range 2 Range 19
Average Values Top Row Maximum 1330 Top Row Centreline Maximum 1462 Minimum 1320 Minimum 1451 Mean 1325 Mean 1457 Range 10 Range 11 Middle Row Maximum 1297 Middle Row Centreline Maximum 1430 Minimum 1212 Minimum 1427 Mean 1255 Mean 1429 Range 85 Range 3 Bottom Row Maximum 1231 Bottom Row Centreline Maximum 1294 Minimum 1210 Minimum 1290 Mean 1221 Mean 1292 Range 21 Range 4
Performance Data Furnace Exit Gas Temperature ( C ) 1057
Platen Entry Temperature Maximum 1112
Average 1081 Drum Saturation Temperature ( C ) 344.1 Drum Pressure (Mpa) 15.44 Economiser Outlet Temperature ( C ) 263.4
Feedwater Flow ( kg/s ) 224
Loss of Ignition (%) 3.2 Total Air Flow (kg/s) 298 NO Level 0.649 Total Fuel Flow (kg/s) 26
Table 7.4 – Test 2 Data
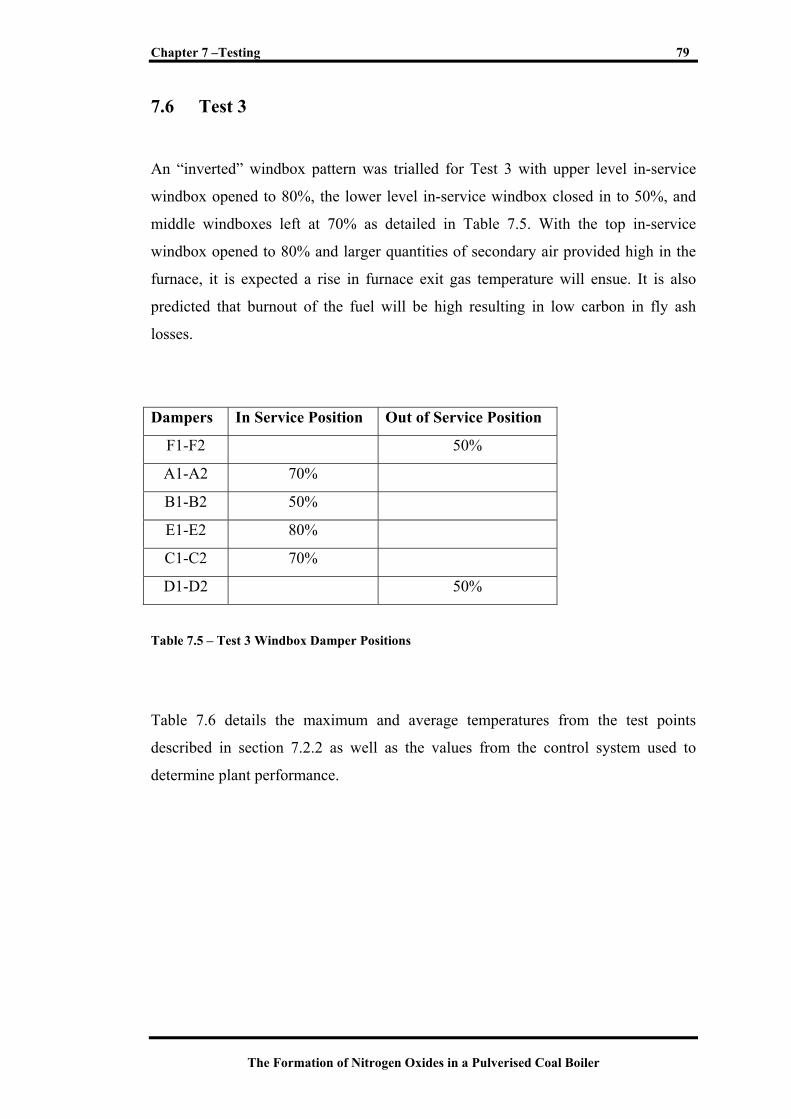
Chapter 7 –Testing 79
The Formation of Nitrogen Oxides in a Pulverised Coal Boiler
7.6 Test 3
An “inverted” windbox pattern was trialled for Test 3 with upper level in-service
windbox opened to 80%, the lower level in-service windbox closed in to 50%, and
middle windboxes left at 70% as detailed in Table 7.5. With the top in-service
windbox opened to 80% and larger quantities of secondary air provided high in the
furnace, it is expected a rise in furnace exit gas temperature will ensue. It is also
predicted that burnout of the fuel will be high resulting in low carbon in fly ash
losses.
Dampers In Service Position Out of Service Position
F1-F2 50%
A1-A2 70%
B1-B2 50%
E1-E2 80%
C1-C2 70%
D1-D2 50%
Table 7.5 – Test 3 Windbox Damper Positions
Table 7.6 details the maximum and average temperatures from the test points
described in section 7.2.2 as well as the values from the control system used to
determine plant performance.
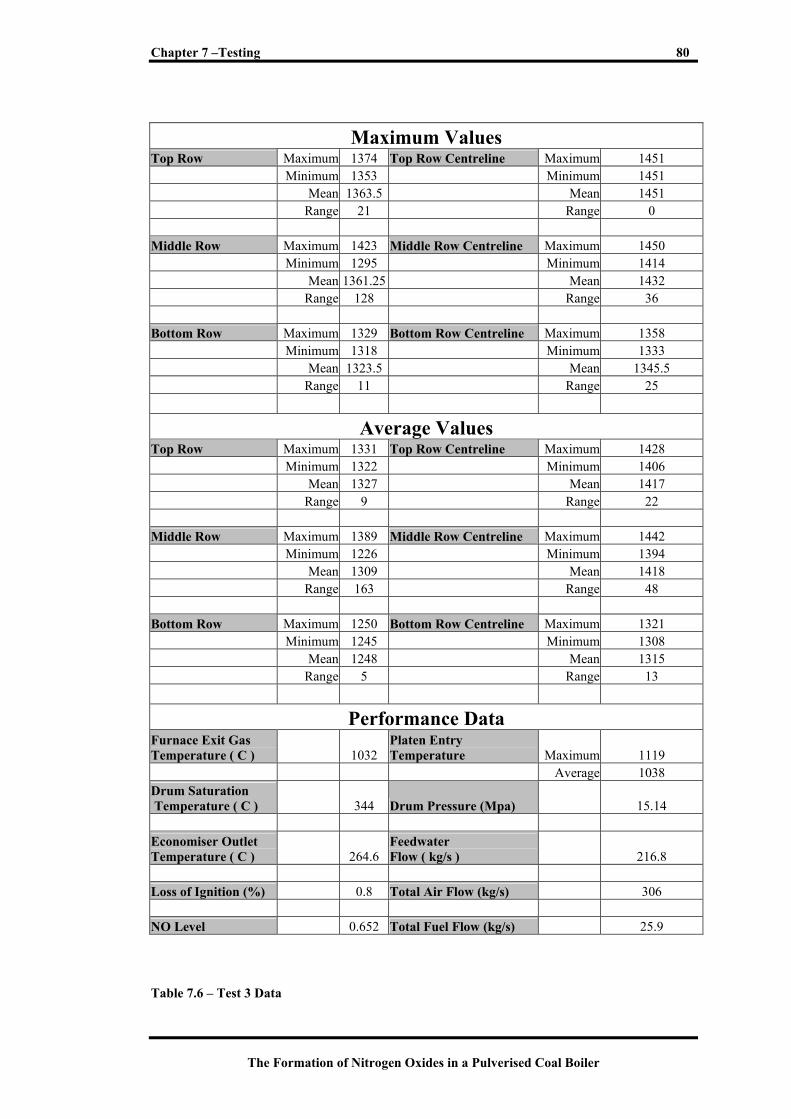
Chapter 7 –Testing 80
The Formation of Nitrogen Oxides in a Pulverised Coal Boiler
Maximum Values Top Row Maximum 1374 Top Row Centreline Maximum 1451 Minimum 1353 Minimum 1451 Mean 1363.5 Mean 1451 Range 21 Range 0 Middle Row Maximum 1423 Middle Row Centreline Maximum 1450 Minimum 1295 Minimum 1414 Mean 1361.25 Mean 1432 Range 128 Range 36 Bottom Row Maximum 1329 Bottom Row Centreline Maximum 1358 Minimum 1318 Minimum 1333 Mean 1323.5 Mean 1345.5 Range 11 Range 25
Average Values Top Row Maximum 1331 Top Row Centreline Maximum 1428 Minimum 1322 Minimum 1406 Mean 1327 Mean 1417 Range 9 Range 22 Middle Row Maximum 1389 Middle Row Centreline Maximum 1442 Minimum 1226 Minimum 1394 Mean 1309 Mean 1418 Range 163 Range 48 Bottom Row Maximum 1250 Bottom Row Centreline Maximum 1321 Minimum 1245 Minimum 1308 Mean 1248 Mean 1315 Range 5 Range 13
Performance Data Furnace Exit Gas Temperature ( C ) 1032
Platen Entry Temperature Maximum 1119
Average 1038 Drum Saturation Temperature ( C ) 344 Drum Pressure (Mpa) 15.14 Economiser Outlet Temperature ( C ) 264.6
Feedwater Flow ( kg/s ) 216.8
Loss of Ignition (%) 0.8 Total Air Flow (kg/s) 306 NO Level 0.652 Total Fuel Flow (kg/s) 25.9
Table 7.6 – Test 3 Data
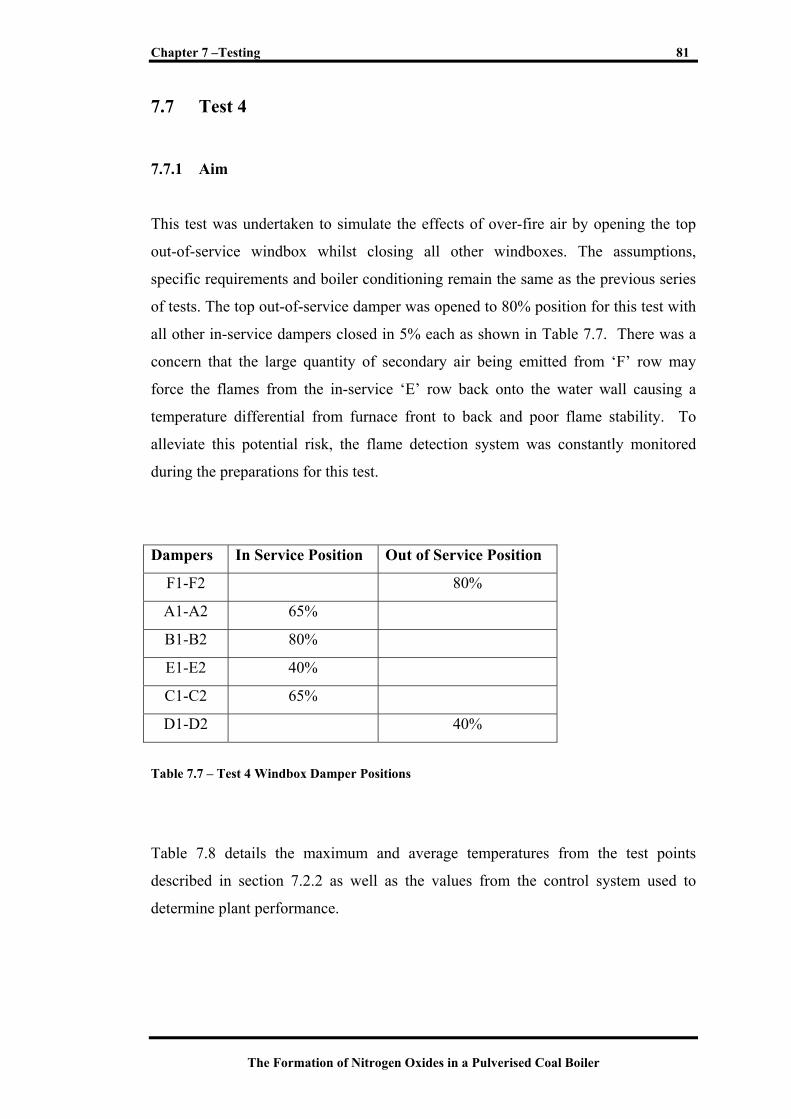
Chapter 7 –Testing 81
The Formation of Nitrogen Oxides in a Pulverised Coal Boiler
7.7 Test 4
7.7.1 Aim
This test was undertaken to simulate the effects of over-fire air by opening the top
out-of-service windbox whilst closing all other windboxes. The assumptions,
specific requirements and boiler conditioning remain the same as the previous series
of tests. The top out-of-service damper was opened to 80% position for this test with
all other in-service dampers closed in 5% each as shown in Table 7.7. There was a
concern that the large quantity of secondary air being emitted from ‘F’ row may
force the flames from the in-service ‘E’ row back onto the water wall causing a
temperature differential from furnace front to back and poor flame stability. To
alleviate this potential risk, the flame detection system was constantly monitored
during the preparations for this test.
Dampers In Service Position Out of Service Position
F1-F2 80%
A1-A2 65%
B1-B2 80%
E1-E2 40%
C1-C2 65%
D1-D2 40%
Table 7.7 – Test 4 Windbox Damper Positions
Table 7.8 details the maximum and average temperatures from the test points
described in section 7.2.2 as well as the values from the control system used to
determine plant performance.
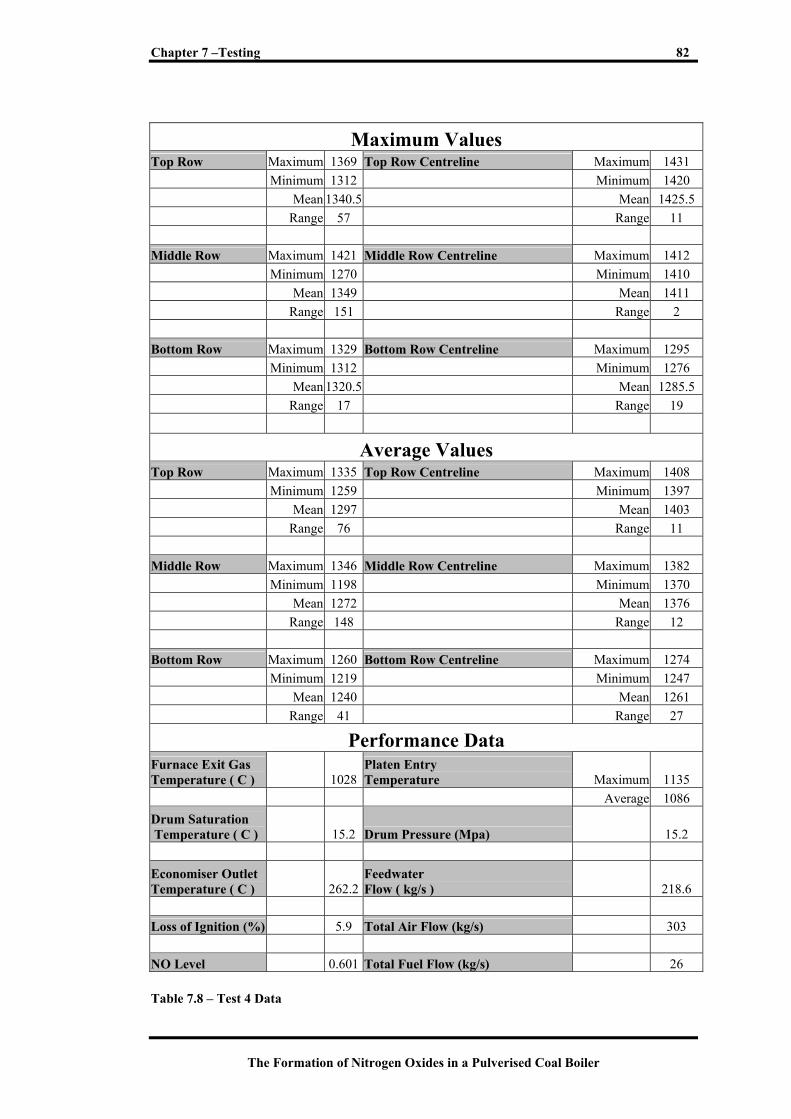
Chapter 7 –Testing 82
The Formation of Nitrogen Oxides in a Pulverised Coal Boiler
Maximum Values Top Row Maximum 1369 Top Row Centreline Maximum 1431 Minimum 1312 Minimum 1420 Mean 1340.5 Mean 1425.5 Range 57 Range 11 Middle Row Maximum 1421 Middle Row Centreline Maximum 1412 Minimum 1270 Minimum 1410 Mean 1349 Mean 1411 Range 151 Range 2 Bottom Row Maximum 1329 Bottom Row Centreline Maximum 1295 Minimum 1312 Minimum 1276 Mean 1320.5 Mean 1285.5 Range 17 Range 19
Average Values Top Row Maximum 1335 Top Row Centreline Maximum 1408 Minimum 1259 Minimum 1397 Mean 1297 Mean 1403 Range 76 Range 11 Middle Row Maximum 1346 Middle Row Centreline Maximum 1382 Minimum 1198 Minimum 1370 Mean 1272 Mean 1376 Range 148 Range 12 Bottom Row Maximum 1260 Bottom Row Centreline Maximum 1274 Minimum 1219 Minimum 1247 Mean 1240 Mean 1261 Range 41 Range 27
Performance Data Furnace Exit Gas Temperature ( C )
1028
Platen Entry Temperature Maximum 1135
Average 1086 Drum Saturation Temperature ( C ) 15.2 Drum Pressure (Mpa)
15.2
Economiser Outlet Temperature ( C ) 262.2
Feedwater Flow ( kg/s ) 218.6
Loss of Ignition (%) 5.9 Total Air Flow (kg/s) 303 NO Level 0.601 Total Fuel Flow (kg/s) 26 Table 7.8 – Test 4 Data
Chapter 7 –Testing 83
The Formation of Nitrogen Oxides in a Pulverised Coal Boiler
7.8 Variation in Excess Air
7.8.1 Aim
Tests 5, 6 and 7 examine the effect on the variables of interest of the levels of excess
oxygen. The amount of combustion air provided to the furnace can be varied by
altering the pitch on the forced draught fans until the desired excess oxygen levels
are achieved at the economiser cross over.
7.8.2 Assumptions
1. The excess oxygen set point was determined from the values given by the
control logic as described in section 7.2.6.
7.8.3 Specific Requirements
1. Test duration to be 1.5 hours minimum.
2. Allow 30 minutes after required excess oxygen level has been achieved to
allow boiler to stabilise before commencing testing.
3. Coal samples to be taken at commencement and conclusion of each test to
check for variations in quality during test.
7.9 Test 5
The amount of secondary air provided to the furnace was altered until an excess
oxygen level of three percent was achieved.

Chapter 7 –Testing 84
The Formation of Nitrogen Oxides in a Pulverised Coal Boiler
Table 7.9 details the maximum and average temperatures from the test points
described in section 7.2.2 as well as the values from the control system used to
determine plant performance.
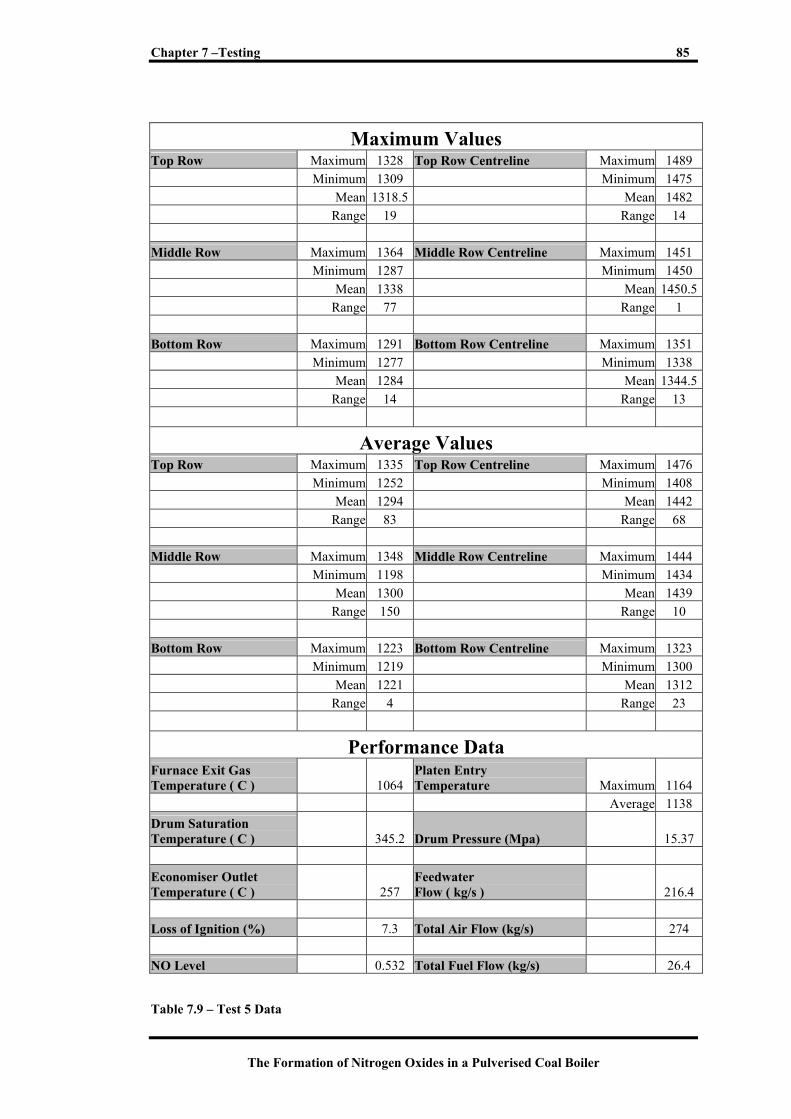
Chapter 7 –Testing 85
The Formation of Nitrogen Oxides in a Pulverised Coal Boiler
Maximum Values Top Row Maximum 1328 Top Row Centreline Maximum 1489 Minimum 1309 Minimum 1475 Mean 1318.5 Mean 1482 Range 19 Range 14 Middle Row Maximum 1364 Middle Row Centreline Maximum 1451 Minimum 1287 Minimum 1450 Mean 1338 Mean 1450.5 Range 77 Range 1 Bottom Row Maximum 1291 Bottom Row Centreline Maximum 1351 Minimum 1277 Minimum 1338 Mean 1284 Mean 1344.5 Range 14 Range 13
Average Values Top Row Maximum 1335 Top Row Centreline Maximum 1476 Minimum 1252 Minimum 1408 Mean 1294 Mean 1442 Range 83 Range 68 Middle Row Maximum 1348 Middle Row Centreline Maximum 1444 Minimum 1198 Minimum 1434 Mean 1300 Mean 1439 Range 150 Range 10 Bottom Row Maximum 1223 Bottom Row Centreline Maximum 1323 Minimum 1219 Minimum 1300 Mean 1221 Mean 1312 Range 4 Range 23
Performance Data Furnace Exit Gas Temperature ( C )
1064
Platen Entry Temperature Maximum 1164
Average 1138 Drum Saturation Temperature ( C ) 345.2 Drum Pressure (Mpa)
15.37
Economiser Outlet Temperature ( C ) 257
Feedwater Flow ( kg/s ) 216.4
Loss of Ignition (%) 7.3 Total Air Flow (kg/s) 274 NO Level 0.532 Total Fuel Flow (kg/s) 26.4 Table 7.9 – Test 5 Data
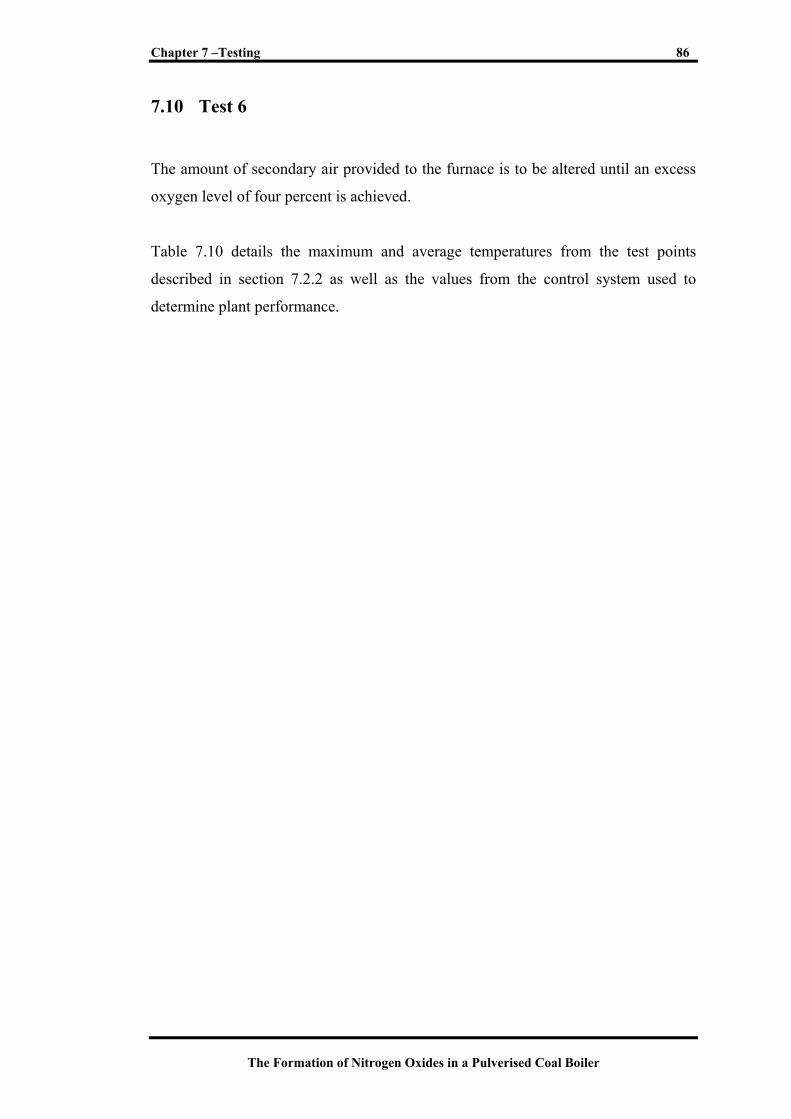
Chapter 7 –Testing 86
The Formation of Nitrogen Oxides in a Pulverised Coal Boiler
7.10 Test 6
The amount of secondary air provided to the furnace is to be altered until an excess
oxygen level of four percent is achieved.
Table 7.10 details the maximum and average temperatures from the test points
described in section 7.2.2 as well as the values from the control system used to
determine plant performance.
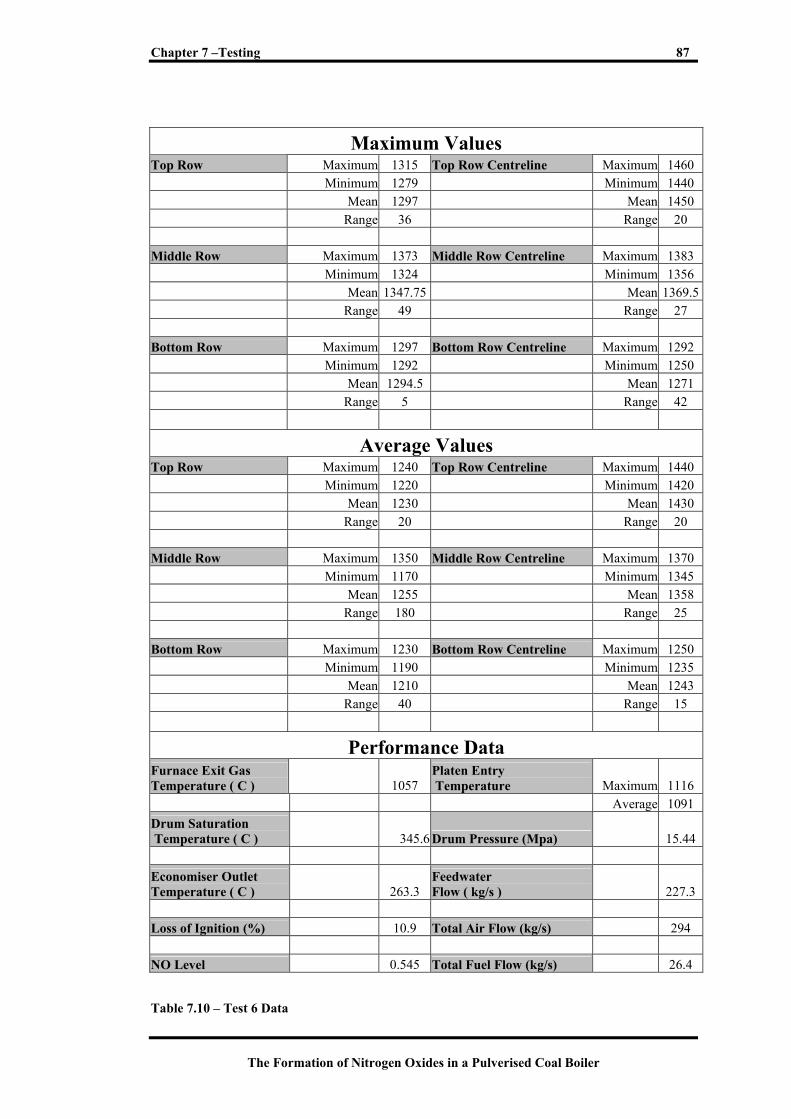
Chapter 7 –Testing 87
The Formation of Nitrogen Oxides in a Pulverised Coal Boiler
Maximum Values Top Row Maximum 1315 Top Row Centreline Maximum 1460 Minimum 1279 Minimum 1440 Mean 1297 Mean 1450 Range 36 Range 20 Middle Row Maximum 1373 Middle Row Centreline Maximum 1383 Minimum 1324 Minimum 1356 Mean 1347.75 Mean 1369.5 Range 49 Range 27 Bottom Row Maximum 1297 Bottom Row Centreline Maximum 1292 Minimum 1292 Minimum 1250 Mean 1294.5 Mean 1271 Range 5 Range 42
Average Values Top Row Maximum 1240 Top Row Centreline Maximum 1440 Minimum 1220 Minimum 1420 Mean 1230 Mean 1430 Range 20 Range 20 Middle Row Maximum 1350 Middle Row Centreline Maximum 1370 Minimum 1170 Minimum 1345 Mean 1255 Mean 1358 Range 180 Range 25 Bottom Row Maximum 1230 Bottom Row Centreline Maximum 1250 Minimum 1190 Minimum 1235 Mean 1210 Mean 1243 Range 40 Range 15
Performance Data Furnace Exit Gas Temperature ( C )
1057
Platen Entry Temperature Maximum 1116
Average 1091 Drum Saturation Temperature ( C ) 345.6 Drum Pressure (Mpa)
15.44
Economiser Outlet Temperature ( C ) 263.3
Feedwater Flow ( kg/s ) 227.3
Loss of Ignition (%) 10.9 Total Air Flow (kg/s) 294 NO Level 0.545 Total Fuel Flow (kg/s) 26.4 Table 7.10 – Test 6 Data

Chapter 7 –Testing 88
The Formation of Nitrogen Oxides in a Pulverised Coal Boiler
7.11 Test 7
The amount of secondary air provided to the furnace is to be altered until an excess
oxygen level of 5½ per cent is achieved.
Table 7.11 details the maximum and average temperatures from the test points
described in section 7.2.2 as well as the values from the control system used to
determine plant performance.
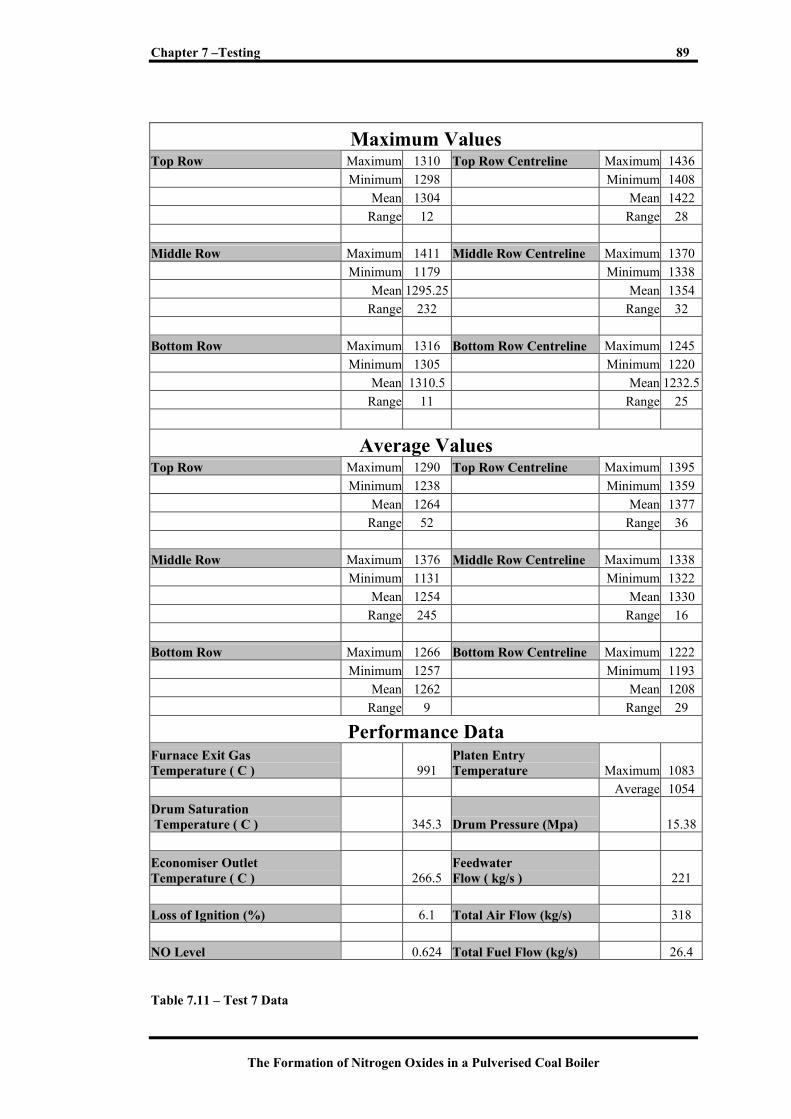
Chapter 7 –Testing 89
The Formation of Nitrogen Oxides in a Pulverised Coal Boiler
Maximum Values Top Row Maximum 1310 Top Row Centreline Maximum 1436 Minimum 1298 Minimum 1408 Mean 1304 Mean 1422 Range 12 Range 28 Middle Row Maximum 1411 Middle Row Centreline Maximum 1370 Minimum 1179 Minimum 1338 Mean 1295.25 Mean 1354 Range 232 Range 32 Bottom Row Maximum 1316 Bottom Row Centreline Maximum 1245 Minimum 1305 Minimum 1220 Mean 1310.5 Mean 1232.5 Range 11 Range 25
Average Values Top Row Maximum 1290 Top Row Centreline Maximum 1395 Minimum 1238 Minimum 1359 Mean 1264 Mean 1377 Range 52 Range 36 Middle Row Maximum 1376 Middle Row Centreline Maximum 1338 Minimum 1131 Minimum 1322 Mean 1254 Mean 1330 Range 245 Range 16 Bottom Row Maximum 1266 Bottom Row Centreline Maximum 1222 Minimum 1257 Minimum 1193 Mean 1262 Mean 1208 Range 9 Range 29
Performance Data Furnace Exit Gas Temperature ( C )
991
Platen Entry Temperature Maximum 1083
Average 1054 Drum Saturation Temperature ( C ) 345.3 Drum Pressure (Mpa)
15.38
Economiser Outlet Temperature ( C ) 266.5
Feedwater Flow ( kg/s ) 221
Loss of Ignition (%) 6.1 Total Air Flow (kg/s) 318 NO Level 0.624 Total Fuel Flow (kg/s) 26.4 Table 7.11 – Test 7 Data
Chapter 7 –Testing 90
The Formation of Nitrogen Oxides in a Pulverised Coal Boiler
7.12 Testing Difficulties
Ten (10) tests were actually undertaken however problems including failure of the
test equipment, sootblowing during testing and major changes in coal quality
rendered the results from some tests invalid and as such these tests had to be
repeated.
Planning and undertaking each of the tests required a significant amount of time and
resources due to the following reasons:-
• Ensuring all test equipment was functional
• Ensuring operational staff were aware of boiler set up
• Market trading staff were aware of testing
• Time taken to adjust boiler to the required test position and allowing boiler to
stabilise
• Time taken to perform temperature survey and collect samples

The Formation of Nitrogen Oxides in a Pulverised Coal Boiler
Results 8
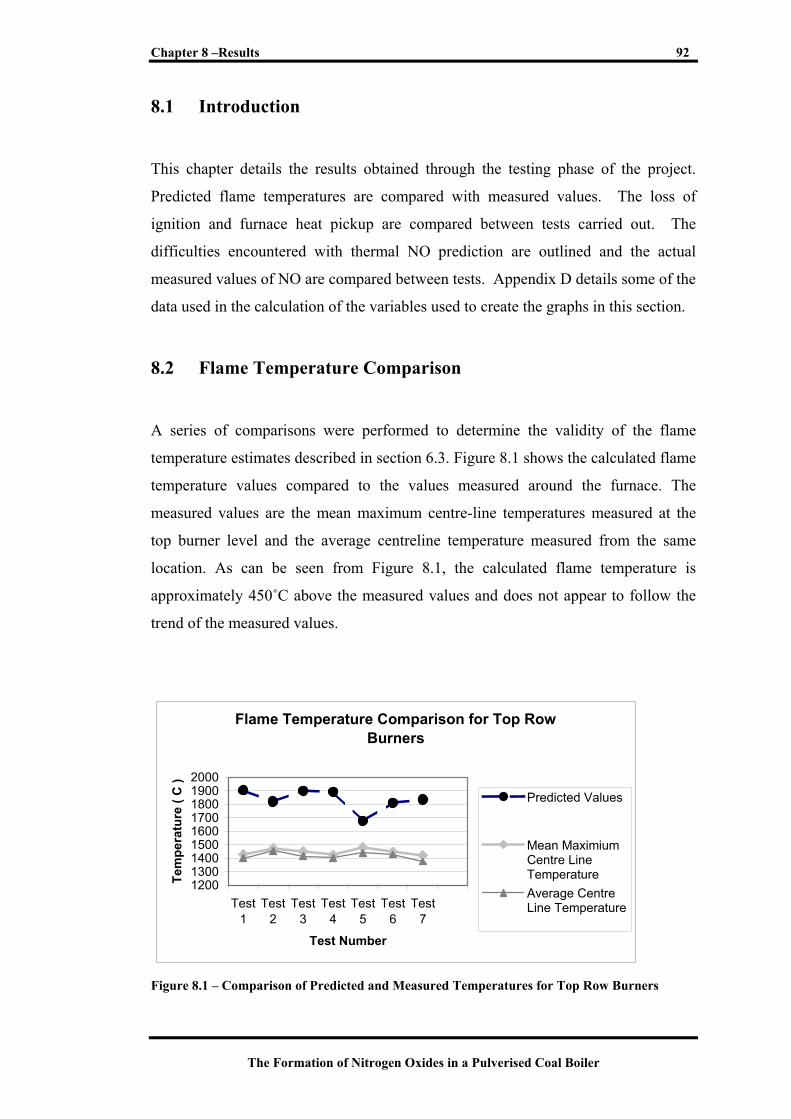
Chapter 8 –Results 92
The Formation of Nitrogen Oxides in a Pulverised Coal Boiler
8.1 Introduction
This chapter details the results obtained through the testing phase of the project.
Predicted flame temperatures are compared with measured values. The loss of
ignition and furnace heat pickup are compared between tests carried out. The
difficulties encountered with thermal NO prediction are outlined and the actual
measured values of NO are compared between tests. Appendix D details some of the
data used in the calculation of the variables used to create the graphs in this section.
8.2 Flame Temperature Comparison
A series of comparisons were performed to determine the validity of the flame
temperature estimates described in section 6.3. Figure 8.1 shows the calculated flame
temperature values compared to the values measured around the furnace. The
measured values are the mean maximum centre-line temperatures measured at the
top burner level and the average centreline temperature measured from the same
location. As can be seen from Figure 8.1, the calculated flame temperature is
approximately 450˚C above the measured values and does not appear to follow the
trend of the measured values.
Flame Temperature Comparison for Top Row Burners
120013001400150016001700180019002000
Test1
Test2
Test3
Test4
Test5
Test6
Test7
Test Number
Tem
pera
ture
( C
)
Predicted Values
Mean MaximiumCentre LineTemperatureAverage CentreLine Temperature
Figure 8.1 – Comparison of Predicted and Measured Temperatures for Top Row Burners
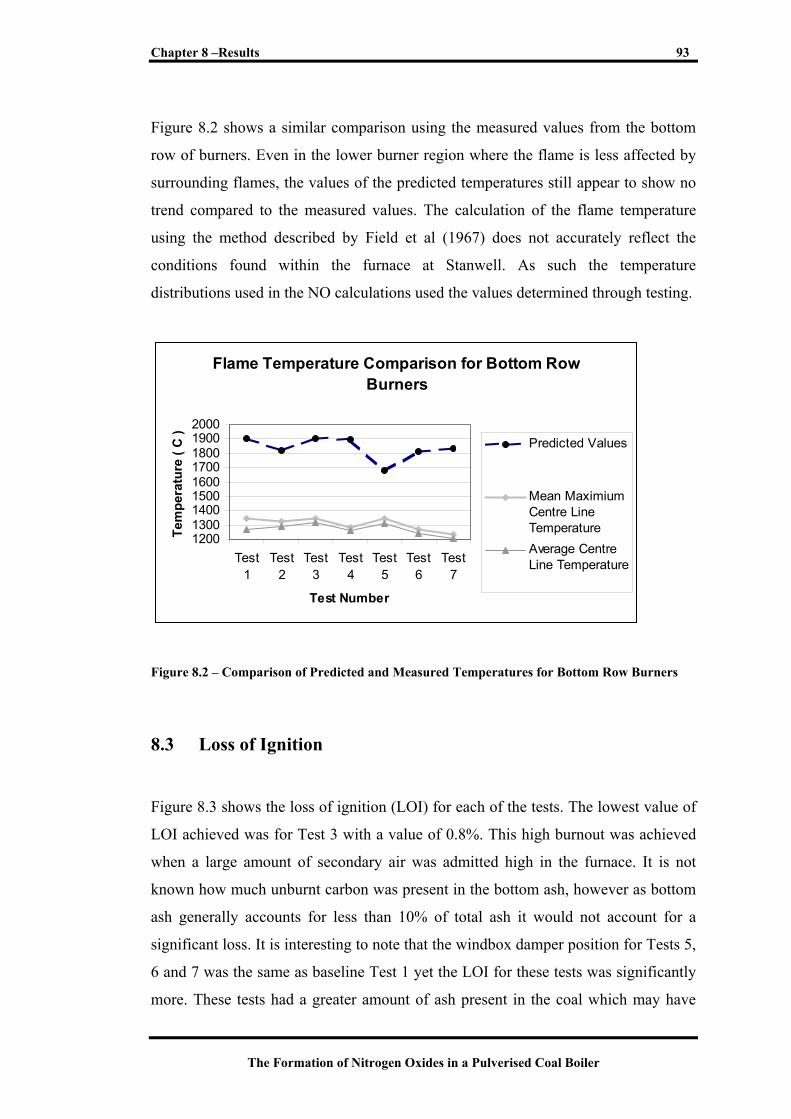
Chapter 8 –Results 93
The Formation of Nitrogen Oxides in a Pulverised Coal Boiler
Figure 8.2 shows a similar comparison using the measured values from the bottom
row of burners. Even in the lower burner region where the flame is less affected by
surrounding flames, the values of the predicted temperatures still appear to show no
trend compared to the measured values. The calculation of the flame temperature
using the method described by Field et al (1967) does not accurately reflect the
conditions found within the furnace at Stanwell. As such the temperature
distributions used in the NO calculations used the values determined through testing.
Flame Temperature Comparison for Bottom Row Burners
120013001400150016001700180019002000
Test1
Test2
Test3
Test4
Test5
Test6
Test7
Test Number
Tem
pera
ture
( C
)
Predicted Values
Mean MaximiumCentre LineTemperatureAverage CentreLine Temperature
Figure 8.2 – Comparison of Predicted and Measured Temperatures for Bottom Row Burners
8.3 Loss of Ignition
Figure 8.3 shows the loss of ignition (LOI) for each of the tests. The lowest value of
LOI achieved was for Test 3 with a value of 0.8%. This high burnout was achieved
when a large amount of secondary air was admitted high in the furnace. It is not
known how much unburnt carbon was present in the bottom ash, however as bottom
ash generally accounts for less than 10% of total ash it would not account for a
significant loss. It is interesting to note that the windbox damper position for Tests 5,
6 and 7 was the same as baseline Test 1 yet the LOI for these tests was significantly
more. These tests had a greater amount of ash present in the coal which may have
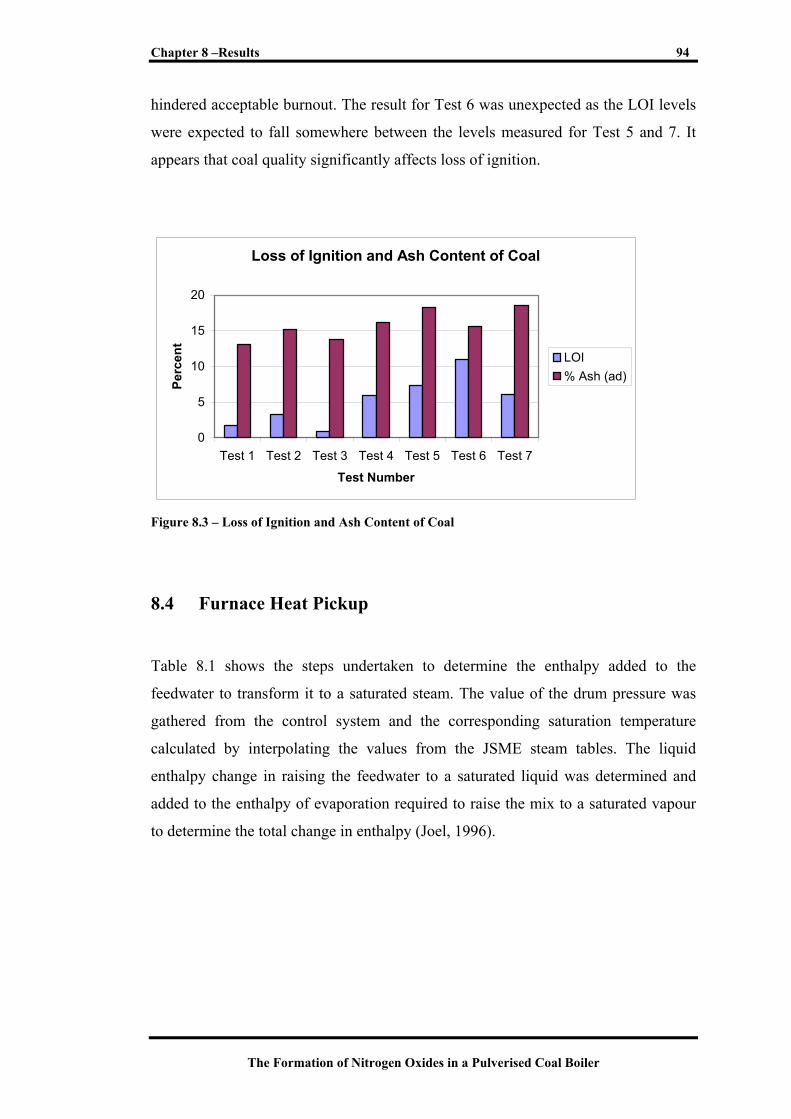
Chapter 8 –Results 94
The Formation of Nitrogen Oxides in a Pulverised Coal Boiler
hindered acceptable burnout. The result for Test 6 was unexpected as the LOI levels
were expected to fall somewhere between the levels measured for Test 5 and 7. It
appears that coal quality significantly affects loss of ignition.
Loss of Ignition and Ash Content of Coal
0
5
10
15
20
Test 1 Test 2 Test 3 Test 4 Test 5 Test 6 Test 7
Test Number
Perc
ent
LOI% Ash (ad)
Figure 8.3 – Loss of Ignition and Ash Content of Coal
8.4 Furnace Heat Pickup
Table 8.1 shows the steps undertaken to determine the enthalpy added to the
feedwater to transform it to a saturated steam. The value of the drum pressure was
gathered from the control system and the corresponding saturation temperature
calculated by interpolating the values from the JSME steam tables. The liquid
enthalpy change in raising the feedwater to a saturated liquid was determined and
added to the enthalpy of evaporation required to raise the mix to a saturated vapour
to determine the total change in enthalpy (Joel, 1996).
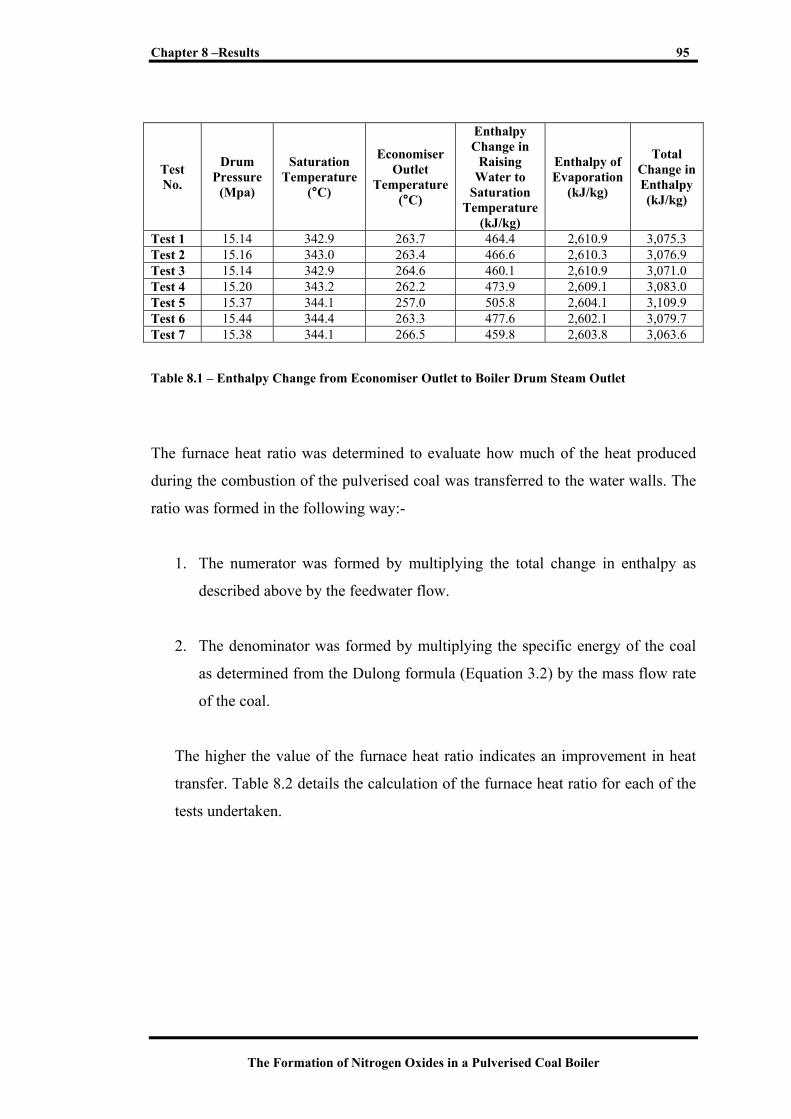
Chapter 8 –Results 95
The Formation of Nitrogen Oxides in a Pulverised Coal Boiler
Test No.
Drum Pressure
(Mpa)
Saturation Temperature
(°C)
Economiser Outlet
Temperature(°C)
Enthalpy Change in
Raising Water to
Saturation Temperature
(kJ/kg)
Enthalpy of Evaporation
(kJ/kg)
Total Change in Enthalpy (kJ/kg)
Test 1 15.14 342.9 263.7 464.4 2,610.9 3,075.3 Test 2 15.16 343.0 263.4 466.6 2,610.3 3,076.9 Test 3 15.14 342.9 264.6 460.1 2,610.9 3,071.0 Test 4 15.20 343.2 262.2 473.9 2,609.1 3,083.0 Test 5 15.37 344.1 257.0 505.8 2,604.1 3,109.9 Test 6 15.44 344.4 263.3 477.6 2,602.1 3,079.7 Test 7 15.38 344.1 266.5 459.8 2,603.8 3,063.6 Table 8.1 – Enthalpy Change from Economiser Outlet to Boiler Drum Steam Outlet
The furnace heat ratio was determined to evaluate how much of the heat produced
during the combustion of the pulverised coal was transferred to the water walls. The
ratio was formed in the following way:-
1. The numerator was formed by multiplying the total change in enthalpy as
described above by the feedwater flow.
2. The denominator was formed by multiplying the specific energy of the coal
as determined from the Dulong formula (Equation 3.2) by the mass flow rate
of the coal.
The higher the value of the furnace heat ratio indicates an improvement in heat
transfer. Table 8.2 details the calculation of the furnace heat ratio for each of the
tests undertaken.
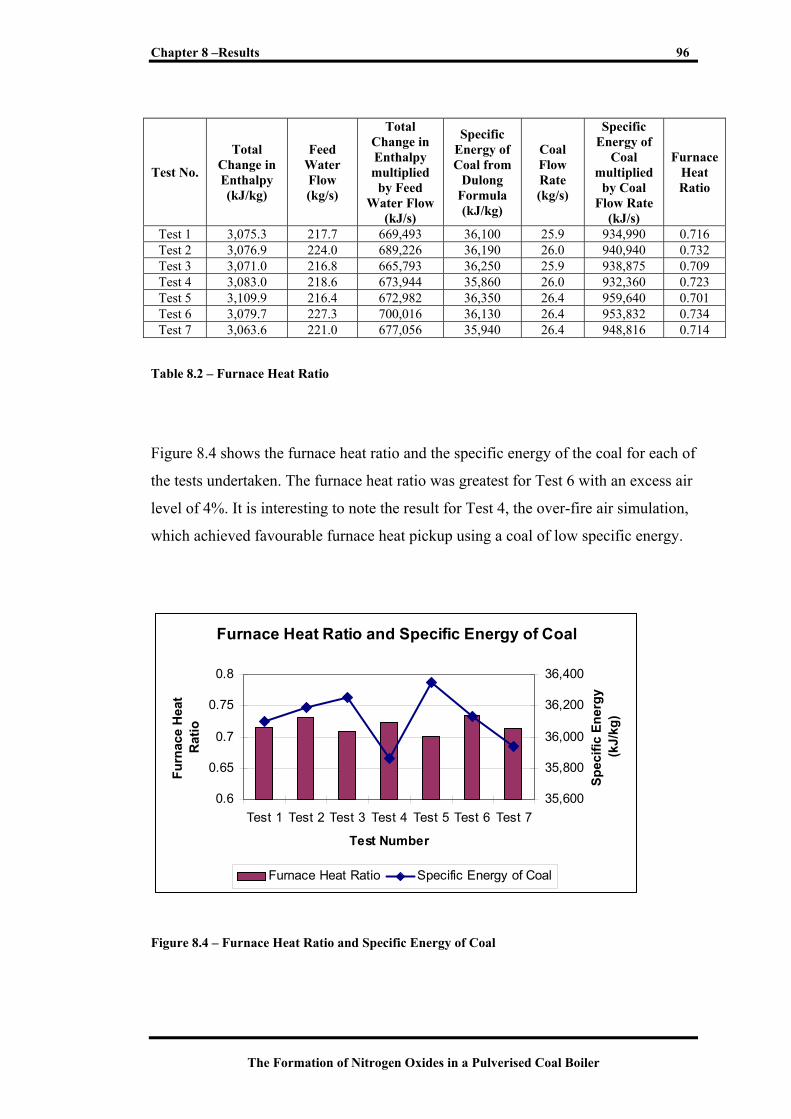
Chapter 8 –Results 96
The Formation of Nitrogen Oxides in a Pulverised Coal Boiler
Test No.
Total Change in Enthalpy (kJ/kg)
Feed Water Flow (kg/s)
Total Change in Enthalpy multiplied
by Feed Water Flow
(kJ/s)
Specific Energy of Coal from
Dulong Formula (kJ/kg)
Coal Flow Rate (kg/s)
Specific Energy of
Coal multiplied
by Coal Flow Rate
(kJ/s)
Furnace Heat Ratio
Test 1 3,075.3 217.7 669,493 36,100 25.9 934,990 0.716 Test 2 3,076.9 224.0 689,226 36,190 26.0 940,940 0.732 Test 3 3,071.0 216.8 665,793 36,250 25.9 938,875 0.709 Test 4 3,083.0 218.6 673,944 35,860 26.0 932,360 0.723 Test 5 3,109.9 216.4 672,982 36,350 26.4 959,640 0.701 Test 6 3,079.7 227.3 700,016 36,130 26.4 953,832 0.734 Test 7 3,063.6 221.0 677,056 35,940 26.4 948,816 0.714
Table 8.2 – Furnace Heat Ratio
Figure 8.4 shows the furnace heat ratio and the specific energy of the coal for each of
the tests undertaken. The furnace heat ratio was greatest for Test 6 with an excess air
level of 4%. It is interesting to note the result for Test 4, the over-fire air simulation,
which achieved favourable furnace heat pickup using a coal of low specific energy.
Furnace Heat Ratio and Specific Energy of Coal
0.6
0.65
0.7
0.75
0.8
Test 1 Test 2 Test 3 Test 4 Test 5 Test 6 Test 7
Test Number
Furn
ace
Hea
t R
atio
35,600
35,800
36,000
36,200
36,400
Spec
ific
Ener
gy
(kJ/
kg)
Furnace Heat Ratio Specific Energy of Coal
Figure 8.4 – Furnace Heat Ratio and Specific Energy of Coal
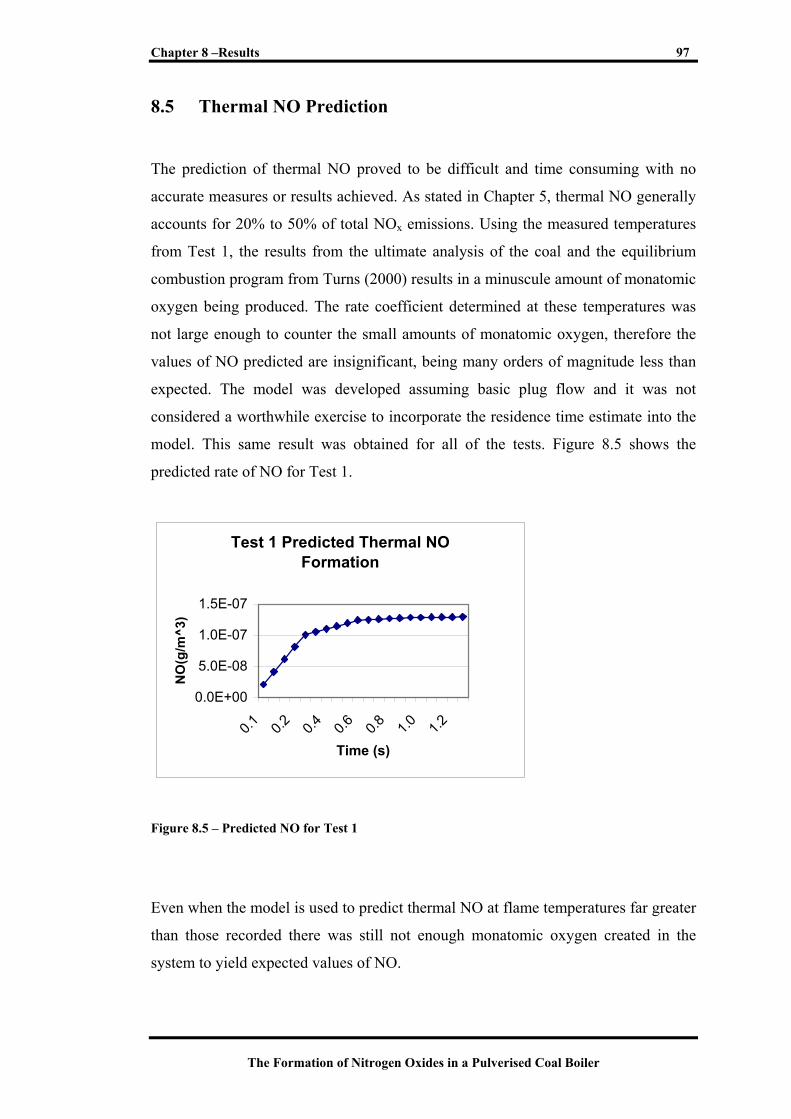
Chapter 8 –Results 97
The Formation of Nitrogen Oxides in a Pulverised Coal Boiler
8.5 Thermal NO Prediction
The prediction of thermal NO proved to be difficult and time consuming with no
accurate measures or results achieved. As stated in Chapter 5, thermal NO generally
accounts for 20% to 50% of total NOx emissions. Using the measured temperatures
from Test 1, the results from the ultimate analysis of the coal and the equilibrium
combustion program from Turns (2000) results in a minuscule amount of monatomic
oxygen being produced. The rate coefficient determined at these temperatures was
not large enough to counter the small amounts of monatomic oxygen, therefore the
values of NO predicted are insignificant, being many orders of magnitude less than
expected. The model was developed assuming basic plug flow and it was not
considered a worthwhile exercise to incorporate the residence time estimate into the
model. This same result was obtained for all of the tests. Figure 8.5 shows the
predicted rate of NO for Test 1.
Test 1 Predicted Thermal NO Formation
0.0E+00
5.0E-08
1.0E-07
1.5E-07
0.1 0.2 0.4 0.6 0.8 1.0 1.2
Time (s)
NO
(g/m
^3)
Figure 8.5 – Predicted NO for Test 1
Even when the model is used to predict thermal NO at flame temperatures far greater
than those recorded there was still not enough monatomic oxygen created in the
system to yield expected values of NO.
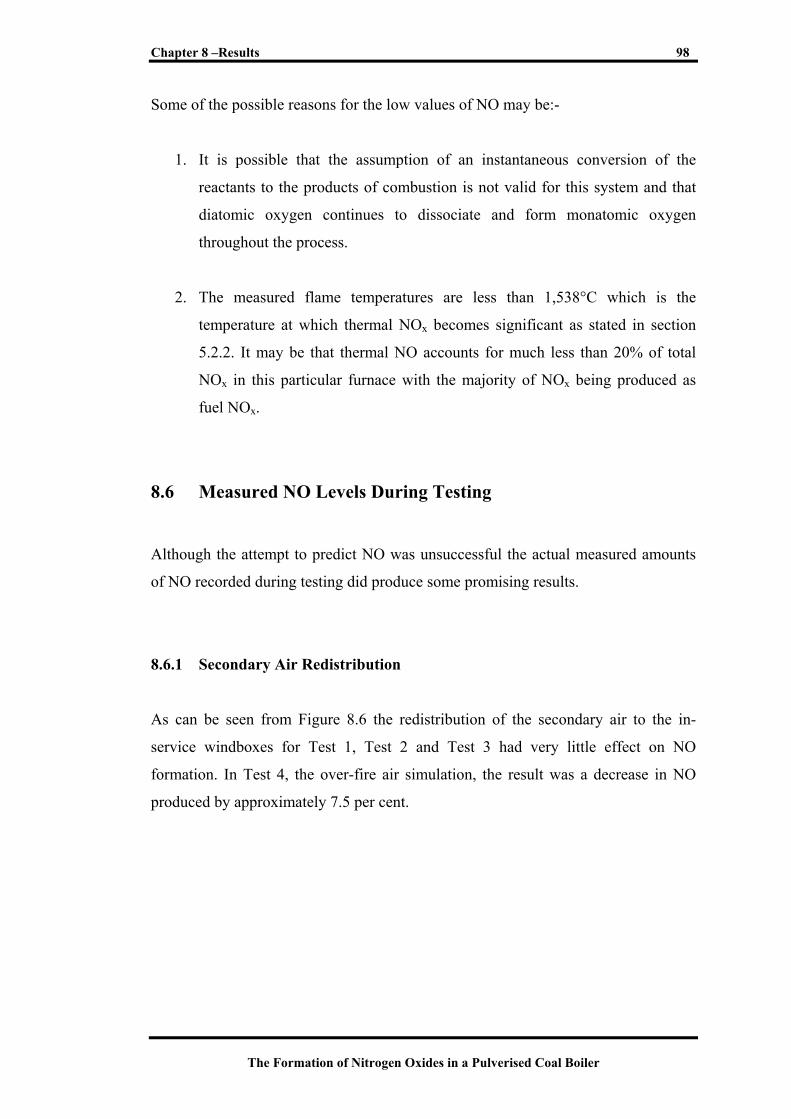
Chapter 8 –Results 98
The Formation of Nitrogen Oxides in a Pulverised Coal Boiler
Some of the possible reasons for the low values of NO may be:-
1. It is possible that the assumption of an instantaneous conversion of the
reactants to the products of combustion is not valid for this system and that
diatomic oxygen continues to dissociate and form monatomic oxygen
throughout the process.
2. The measured flame temperatures are less than 1,538°C which is the
temperature at which thermal NOx becomes significant as stated in section
5.2.2. It may be that thermal NO accounts for much less than 20% of total
NOx in this particular furnace with the majority of NOx being produced as
fuel NOx.
8.6 Measured NO Levels During Testing
Although the attempt to predict NO was unsuccessful the actual measured amounts
of NO recorded during testing did produce some promising results.
8.6.1 Secondary Air Redistribution
As can be seen from Figure 8.6 the redistribution of the secondary air to the in-
service windboxes for Test 1, Test 2 and Test 3 had very little effect on NO
formation. In Test 4, the over-fire air simulation, the result was a decrease in NO
produced by approximately 7.5 per cent.
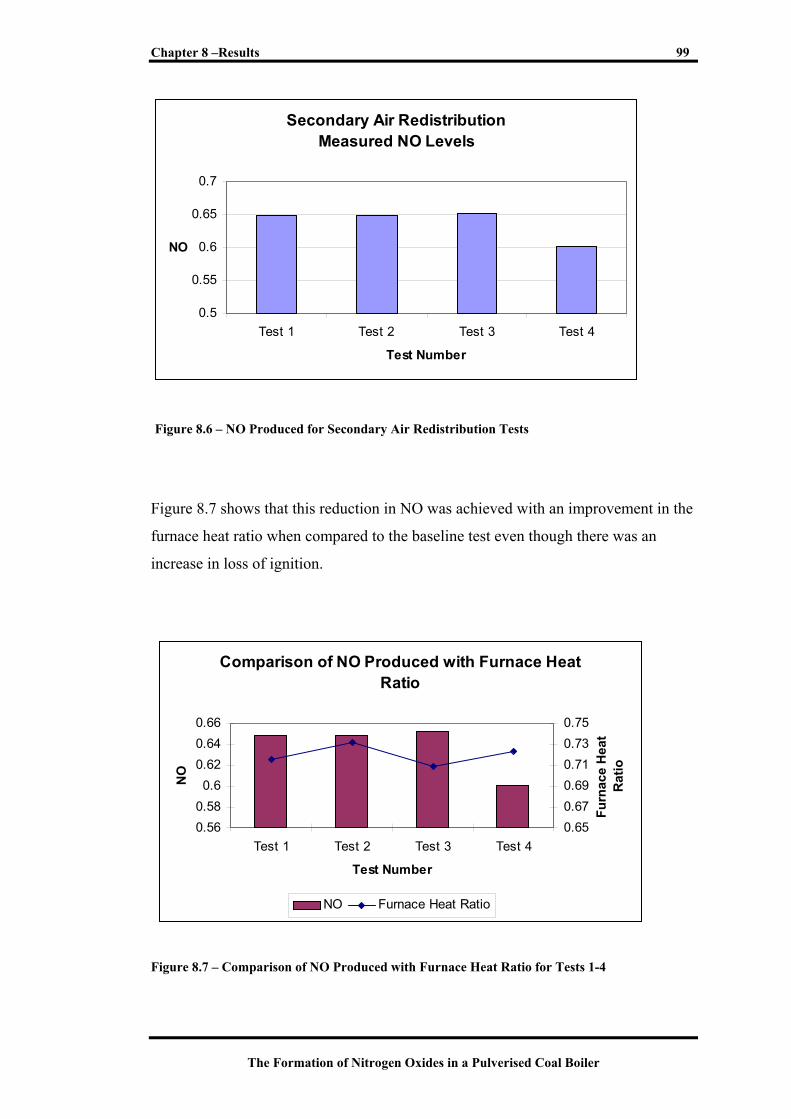
Chapter 8 –Results 99
The Formation of Nitrogen Oxides in a Pulverised Coal Boiler
Secondary Air Redistribution Measured NO Levels
0.5
0.55
0.6
0.65
0.7
Test 1 Test 2 Test 3 Test 4
Test Number
NO
Figure 8.6 – NO Produced for Secondary Air Redistribution Tests
Figure 8.7 shows that this reduction in NO was achieved with an improvement in the
furnace heat ratio when compared to the baseline test even though there was an
increase in loss of ignition.
Comparison of NO Produced with Furnace Heat Ratio
0.560.580.6
0.620.640.66
Test 1 Test 2 Test 3 Test 4
Test Number
NO
0.650.670.690.710.730.75
Furn
ace
Hea
t R
atio
NO Furnace Heat Ratio
Figure 8.7 – Comparison of NO Produced with Furnace Heat Ratio for Tests 1-4
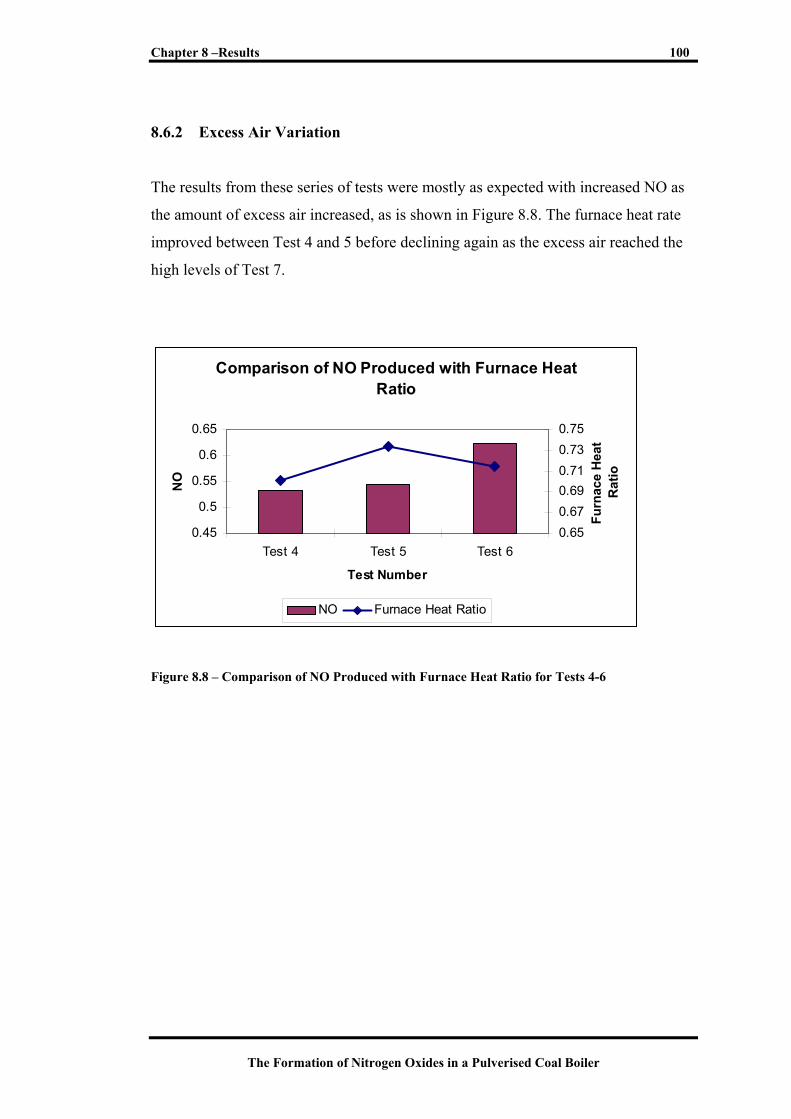
Chapter 8 –Results 100
The Formation of Nitrogen Oxides in a Pulverised Coal Boiler
8.6.2 Excess Air Variation
The results from these series of tests were mostly as expected with increased NO as
the amount of excess air increased, as is shown in Figure 8.8. The furnace heat rate
improved between Test 4 and 5 before declining again as the excess air reached the
high levels of Test 7.
Comparison of NO Produced with Furnace Heat Ratio
0.45
0.5
0.55
0.6
0.65
Test 4 Test 5 Test 6
Test Number
NO
0.650.670.690.710.730.75
Furn
ace
Hea
t R
atio
NO Furnace Heat Ratio
Figure 8.8 – Comparison of NO Produced with Furnace Heat Ratio for Tests 4-6

The Formation of Nitrogen Oxides in a Pulverised Coal Boiler
Conclusion 9
Chapter 9 – Conclusion 102
The Formation of Nitrogen Oxides in a Pulverised Coal Boiler
9.1 Introduction
The oxides of nitrogen (NOx) are airborne pollutants that result from the combustion
of pulverised coal. NOx emissions contribute to acid rain and have been linked to
climate change. This project was undertaken to identify operational methods that
reduce the NOx emissions whilst maintaining satisfactory plant performance.
Testing was performed on a 350 MW coal fired boiler at Stanwell Power Station in
Central Queensland.
9.2 Achievement of Objectives
Coal characteristics important in the combustion of pulverised coal include rank,
ultimate analysis and specific energy. The sequence of processes coal particles
undergo during combustion including the release of the volatile matter, the
combustion of residual char and release of mineral matter were discussed.
The function of each of the boiler plant areas relevant to the project including
pulverisation plant, draught plant and steam plant were discussed in detail.
Limitations of the plant that affect the coal combustion process include flame
stability, excess air requirements and minimum coal air mixture velocity.
The dominant NOx formation mechanisms within the furnace are fuel NOx and
thermal NOx. The Zeldovich mechanism and its associated rate constants describe
the formation of thermal NOx. Currently there are no theoretical methods to describe
fuel NOx formation within a coal fired furnace. The technology available to control
NOx emissions from thermal power stations include over-fire air, flue gas
recirculation, combustion optimisation, advanced low NOx burners as well as
selective catalytic and selective non-catalytic reduction.
Combustion properties including equivalence ratios, initial flame temperature
approximations, residence time approximations and mole and mass fractions were
developed to describe the combustion process within the furnace. These properties
Chapter 9 – Conclusion 103
The Formation of Nitrogen Oxides in a Pulverised Coal Boiler
were to be used in the development of a thermal NOx prediction model. However,
the model for thermal NOx did not adequately describe what was occurring in the
furnace and it was considered futile to pursue a suitable model in a complex and
uncontrollable plant by theoretical means. This is reiterated by the fact that it is
impossible to distinguish the proportion of NOx produced by either of the two
dominant mechanisms.
A series of tests were undertaken to examine the effect on NOx formation and boiler
performance by varying operational parameters such as secondary air distribution
and excess oxygen levels. The secondary air redistribution tests did not produce any
positive results with regard to NOx reduction whilst the excess air tests produced the
expected result of NOx emissions increasing as excess air increased. The simulated
over-fire air test (Test 4) produced positive results with NOx emissions reduced by
approximately 7.5% of baseline levels whilst achieving excellent furnace heat
pickup.
9.3 Further Work
There is still a great deal of testing that would need to be undertaken before the
optimum operational positions of the windbox dampers controlling the distribution
of secondary air can be implemented. It would be a worthwhile exercise to traverse
test the windbox ducts on each burner level with the dampers at different positions to
determine the exact amount of secondary air being delivered to each of the burner
rows. Although the simulated over-fire air test did achieve promising results there
are other variables including clinker build up, flame stability and temperature
distribution issues that would require investigation before any permanent changes to
operational philosophy would be considered.
104
The Formation of Nitrogen Oxides in a Pulverised Coal Boiler
List of References
Airflow Developments Operating Procedure (n.d.), Airflow Developments Limited,
Buckinghamshire, England
Australian Bureau of Statistics 1999 [Online], Available: www.abs.gov.au/Austats,
[Accessed 25 April 2004]
Babcock and Wilcox – A McDermott Co.,1992 Steam –Its Generation and Use, 40th
Edition, Edited by Stultz, S. C. & Kitto J. B., Barberton, Ohio, USA
Borman, Dr. G. L & Ragland, Dr. K. W. 1998, Combustion Engineering,
WCB/McGraw-Hill, USA
Canning P., Jones A., & Balmbridge P. 1999, NOx Control for Large Coal-fired
Utility Boilers, The Australian Coal Review, CSIRO Energy Technology, Australia
Daley, John 2000, National Observer, Issue 43, [Online], Available: EBSCOHost
http://ezproxy.usq.edu.au [Accessed 11 February 2004]
Dodson L. & Gordon J. 2002, Howard Defiant on Kyoto Rejection, [Online],
Available: http://www.theage.com.au/articles [Accessed 30 September 2004]
Electric Power Research Institute, 1993, Retrofit NOX Controls for Coal Fired Utility
Boilers – A Technology Assessment Guide for Meeting Requirements of the 1990
Clean Air Act Amendments, EPRI, Palo Alto, California, USA
Field, M. A., Gill, D. W., Morgan, B. B., Hawksley, P. G. W. 1967, Combustion of
Pulverised Coal, The British Coal Utilisation Research Association, Leatherhead,
Surrey, England
List of References 105
The Formation of Nitrogen Oxides in a Pulverised Coal Boiler
GM 31 Operating Procedure 1999, Erwin Sick Ltd, St Albans, Hertfordshire
Hot Enough For You? 2002, Canada & the World Backgrounder, Vol. 68 Issue 1,
[Online], Available: EBSCOHost http://ezproxy.usq.edu.au [Accessed 11 February
2004]
Howard Stands Firm Against Kyoto, 2004 [Online], Available:
http://au.news/yahoo.com [Accessed 30 September 2004]
Joel, R. 1996, Basic Engineering Thermodynamics, Fifth Edition, Pearson Education
Limited, Essex, England
Juniper, L. 2000, Thermal Coal Technology A Manual for Australian Coal,
QTHERM Program Department of Mines and Energy, Queensland Government
McCormick, John 1997, Acid Earth The Politics of Acid Pollution, Third Edition,
Earthscan Publications Ltd, London, UK
SI Steam Tables 1980, Japan Society of Mechanical Engineers
Turns, Stephen R. 2000, An Introduction to Combustion – Concepts and
Applications 2nd Edition, McGraw Hill Book Co, Singapore
106
The Formation of Nitrogen Oxides in a Pulverised Coal Boiler
Appendix A
University of Southern Queensland
FACULTY OF ENGINEERING AND SURVEYING
ENG 4111/4112 Research Project PROJECT SPECIFICATION
FOR: ANTHONY GOODGER TOPIC: THE FORMATION OF NITROGEN OXIDES IN A
PULVERISED COAL BOILER SUPERVISORS: Dr Dr Ruth Mossad and Dr David Buttsworth PROJECT AIM: This project seeks to identify, understand and control the
mechanisms responsible for the development of nitrogen oxides (NOx) in a pulverised coal fired boiler.
PROGRAMME: Issue B, 26 October 2004
1. Research the mechanisms responsible for NOx production. 2. Research the environmental effects of NOx production and Australia’s current
position with respect to the Kyoto agreement.
3. Develop engineering models to describe important combustion properties in a pulverised coal fired boiler.
4. Develop understanding of boiler plant operation, fluid mechanics and heat transfer.
5. Establish testing regime under varying operational conditions to monitor NOx
production, thermal efficiency and the parameters that affect them.
6. Compare test results with theoretical values. As time permits:
7. Suggest operational changes to reduce NOx production whilst still maintaining acceptable efficiency.
AGREED: ___________________ (Student) _____________________ (Supervisor) 27 / 10 / 2004 ___ / ___ / ___
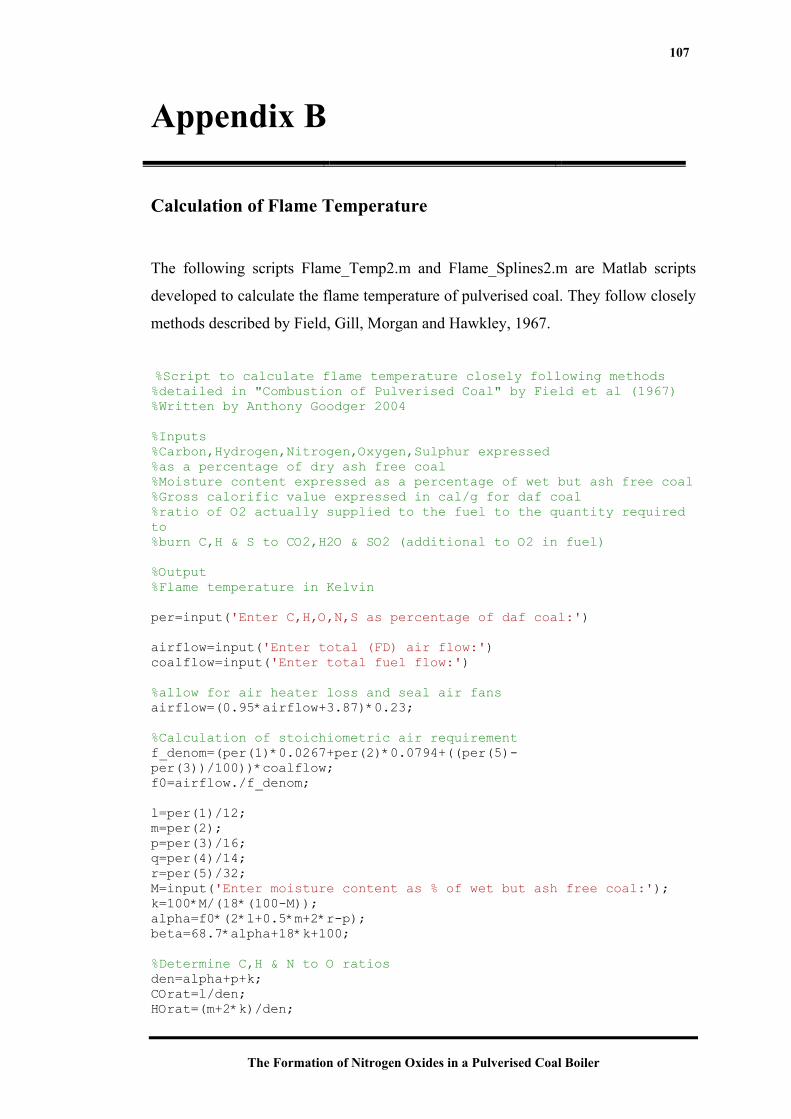
107
The Formation of Nitrogen Oxides in a Pulverised Coal Boiler
Appendix B
Calculation of Flame Temperature
The following scripts Flame_Temp2.m and Flame_Splines2.m are Matlab scripts
developed to calculate the flame temperature of pulverised coal. They follow closely
methods described by Field, Gill, Morgan and Hawkley, 1967.
%Script to calculate flame temperature closely following methods %detailed in "Combustion of Pulverised Coal" by Field et al (1967) %Written by Anthony Goodger 2004 %Inputs %Carbon,Hydrogen,Nitrogen,Oxygen,Sulphur expressed %as a percentage of dry ash free coal %Moisture content expressed as a percentage of wet but ash free coal %Gross calorific value expressed in cal/g for daf coal %ratio of O2 actually supplied to the fuel to the quantity required to %burn C,H & S to CO2,H2O & SO2 (additional to O2 in fuel) %Output %Flame temperature in Kelvin per=input('Enter C,H,O,N,S as percentage of daf coal:') airflow=input('Enter total (FD) air flow:') coalflow=input('Enter total fuel flow:') %allow for air heater loss and seal air fans airflow=(0.95*airflow+3.87)*0.23; %Calculation of stoichiometric air requirement f_denom=(per(1)*0.0267+per(2)*0.0794+((per(5)-per(3))/100))*coalflow; f0=airflow./f_denom; l=per(1)/12; m=per(2); p=per(3)/16; q=per(4)/14; r=per(5)/32; M=input('Enter moisture content as % of wet but ash free coal:'); k=100*M/(18*(100-M)); alpha=f0*(2*l+0.5*m+2*r-p); beta=68.7*alpha+18*k+100; %Determine C,H & N to O ratios den=alpha+p+k; COrat=l/den; HOrat=(m+2*k)/den;
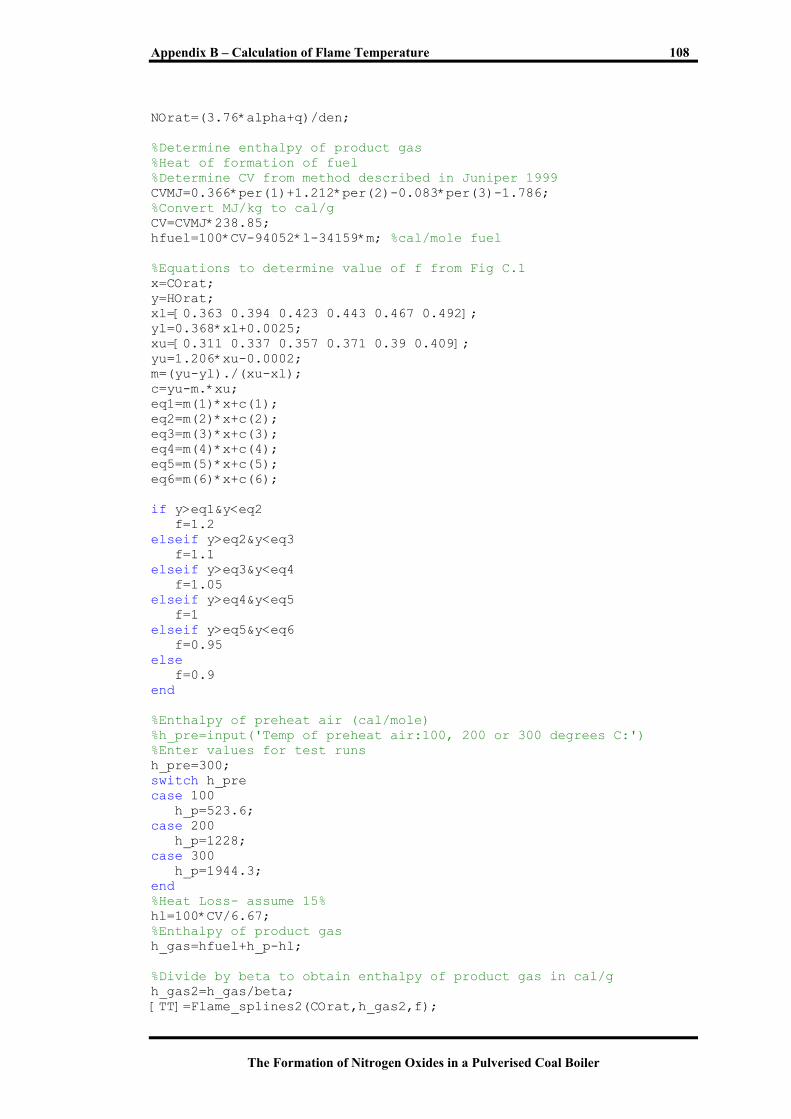
Appendix B – Calculation of Flame Temperature 108
The Formation of Nitrogen Oxides in a Pulverised Coal Boiler
NOrat=(3.76*alpha+q)/den; %Determine enthalpy of product gas %Heat of formation of fuel %Determine CV from method described in Juniper 1999 CVMJ=0.366*per(1)+1.212*per(2)-0.083*per(3)-1.786; %Convert MJ/kg to cal/g CV=CVMJ*238.85; hfuel=100*CV-94052*l-34159*m; %cal/mole fuel %Equations to determine value of f from Fig C.1 x=COrat; y=HOrat; xl=[0.363 0.394 0.423 0.443 0.467 0.492]; yl=0.368*xl+0.0025; xu=[0.311 0.337 0.357 0.371 0.39 0.409]; yu=1.206*xu-0.0002; m=(yu-yl)./(xu-xl); c=yu-m.*xu; eq1=m(1)*x+c(1); eq2=m(2)*x+c(2); eq3=m(3)*x+c(3); eq4=m(4)*x+c(4); eq5=m(5)*x+c(5); eq6=m(6)*x+c(6); if y>eq1&y<eq2 f=1.2 elseif y>eq2&y<eq3 f=1.1 elseif y>eq3&y<eq4 f=1.05 elseif y>eq4&y<eq5 f=1 elseif y>eq5&y<eq6 f=0.95 else f=0.9 end %Enthalpy of preheat air (cal/mole) %h_pre=input('Temp of preheat air:100, 200 or 300 degrees C:') %Enter values for test runs h_pre=300; switch h_pre case 100 h_p=523.6; case 200 h_p=1228; case 300 h_p=1944.3; end %Heat Loss- assume 15% hl=100*CV/6.67; %Enthalpy of product gas h_gas=hfuel+h_p-hl; %Divide by beta to obtain enthalpy of product gas in cal/g h_gas2=h_gas/beta; [TT]=Flame_splines2(COrat,h_gas2,f);
Appendix B – Calculation of Flame Temperature 109
The Formation of Nitrogen Oxides in a Pulverised Coal Boiler
Temperature=round(TT) %Apparent NO correction from Fig C.2 x_low=[0.322 0.347 0.361 0.377 0.395]; y_low=-1.096.*x_low+3.73; x_up=[0.356 0.389 0.409 0.428 0.449]; y_up=-0.086.*x_up+3.77; m=(y_up-y_low)./(x_up-x_low); c=y_low-m.*x_low; switch f case 1.2 if COrat<x_up(1) NO_app=m(1).*COrat+c(1); else NO_app=-0.086.*COrat+3.77; end case 1.1 if COrat<x_up(2) NO_app=m(2).*COrat+c(2); else NO_app=-0.086.*COrat+3.77; end case 1.05 if COrat<x_up(3) NO_app=m(3).*COrat+c(3); else NO_app=-0.086.*COrat+3.77; end case 1 if COrat<x_up(4) NO_app=m(4).*COrat+c(4); else NO_app=-0.086.*COrat+3.77; end case 0.95 if COrat<x_up(5) NO_app=m(5).*COrat+c(5); else NO_app=-0.086.*COrat+3.77; end end %determine deltaNO deltaNO=NOrat-NO_app; %figure C.3 splines T_2=1400:200:3000; switch f case 0.95 delE_delNO=[129 128 127 126 125 120 110 92 73]; val=spline(T_2,delE_delNO,TT); case 1 delE_delNO=[132 131 130 128 125 119 108 90 70]; val=spline(T_2,delE_delNO,TT); case 1.05 delE_delNO=[127 126 125 124 121 117 105 88 69]; val=spline(T_2,delE_delNO,TT); case 1.1 delE_delNO=[122 121 120.5 119 117 113 102 84 67]; val=spline(T_2,delE_delNO,TT);

Appendix B – Calculation of Flame Temperature 110
The Formation of Nitrogen Oxides in a Pulverised Coal Boiler
case 1.2 T_2=1400:200:2600; delE_delNO=[112 111 109 108 106 103 95]; val=spline(T_2,delE_delNO,TT); end %correct enthalpy value enth_corr=deltaNO*val+h_gas2; h_gas2=enth_corr; [TT]=Flame_splines2(COrat,h_gas2,f); Corrected_Temperature=round(TT)
Appendix B – Calculation of Flame Temperature 111
The Formation of Nitrogen Oxides in a Pulverised Coal Boiler
%Cubic spline script to calculate flame temperature from graphs %detailed in "Combustion of Pulverised Coal" by Field et al (1967) %Written by Anthony Goodger 2004 %Cubic splines to solve for temperature function[TT]=Flame_splines2(COrat,h_gas2,f) T=[1400:200:2800]; switch f case 0.9; if COrat>0.401&COrat<0.4300 H=[-381 -317 -250 -85 -111 -11 129 296]; TT=spline(H,T,h_gas2); elseif COrat>0.4301&COrat<0.4500 H=[-355 -288 -225 -159 -87 7 148 318]; TT=spline(H,T,h_gas2); elseif COrat>0.4501&COrat<0.4700 H=[-329 -267 -205 -137 -63 30 163 326]; TT=spline(H,T,h_gas2); elseif COrat>0.4701&COrat<0.5200 H=[-307 -244 -181 -115 -44 48 178 333]; TT=spline(H,T,h_gas2); end case 0.95; if COrat>0.3901&COrat<0.4100 H=[-390 -330 -265 -197 -115 -7 140 317]; TT=spline(H,T,h_gas2); elseif COrat>0.4101&COrat<0.4300 H=[-362 -307 -241 -172 -86 17 155 322]; TT=spline(H,T,h_gas2); elseif COrat>0.4301&COrat<0.4500 H=[-338 -282 -218 -149 -69 35 172 328]; TT=spline(H,T,h_gas2); elseif COrat>0.4501&COrat<0.4700 H=[-320 -262 -200 -135 -55 48 179 345]; TT=spline(H,T,h_gas2); end case 1; if COrat>0.3701&COrat<0.3900 H=[-413 -343 -273 -200 -110 0 143 316]; TT=spline(H,T,h_gas2); elseif COrat>0.3901&COrat<0.4100 H=[-380 -317 -250 -173 -87 23 163 330]; TT=spline(H,T,h_gas2); elseif COrat>0.4101&COrat<0.4300 H=[-357 -290 -223 -150 -67 43 180 350]; TT=spline(H,T,h_gas2); elseif COrat>0.4301&COrat<0.4500 H=[-333 -273 -206 -133 -46 63 197 350]; TT=spline(H,T,h_gas2); end case 1.05; if COrat>0.3501&COrat<0.3700 H=[-383 -323 -257 -180 -93 13 157 333]; TT=spline(H,T,h_gas2); elseif COrat>0.3701&COrat<0.3900
Appendix B – Calculation of Flame Temperature 112
The Formation of Nitrogen Oxides in a Pulverised Coal Boiler
H=[-353 -293 -230 -157 -70 37 180 343]; TT=spline(H,T,h_gas2); elseif COrat>0.3901&COrat<0.4100 H=[-327 -270 -207 -133 -43 63 200 353]; TT=spline(H,T,h_gas2); elseif COrat>0.4101&COrat<0.4300 H=[-310 -250 -190 -120 -30 77 213 363]; TT=spline(H,T,h_gas2); end case 1.1; if COrat>0.3401&COrat<0.3550 H=[-348 -290 -219 -148 -68 35 174 345]; TT=spline(H,T,h_gas2); elseif COrat>0.3561&COrat<0.3700 H=[-329 -270 -203 -132 -52 55 187 358]; TT=spline(H,T,h_gas2); elseif COrat>0.3701&COrat<0.3900 H=[-303 -248 -177 -106 -29 74 206 371]; TT=spline(H,T,h_gas2); elseif COrat>0.3901&COrat<0.4300 H=[-281 -225 -158 -90 -13 87 223 380]; TT=spline(H,T,h_gas2); end case 1.2; T=[1400:200:2600] if COrat>0.2901&COrat<0.3100 H=[-306 -243 -176 -106 -23 73 203]; TT=spline(H,T,h_gas2) elseif COrat>0.3101&COrat<0.3300 H=[-273 -210 -146 -77 3 100 227]; TT=spline(H,T,h_gas2) elseif COrat>0.3301&COrat<0.3600 H=[-240 -177 -113 -47 33 120 257]; TT=spline(H,T,h_gas2) end end
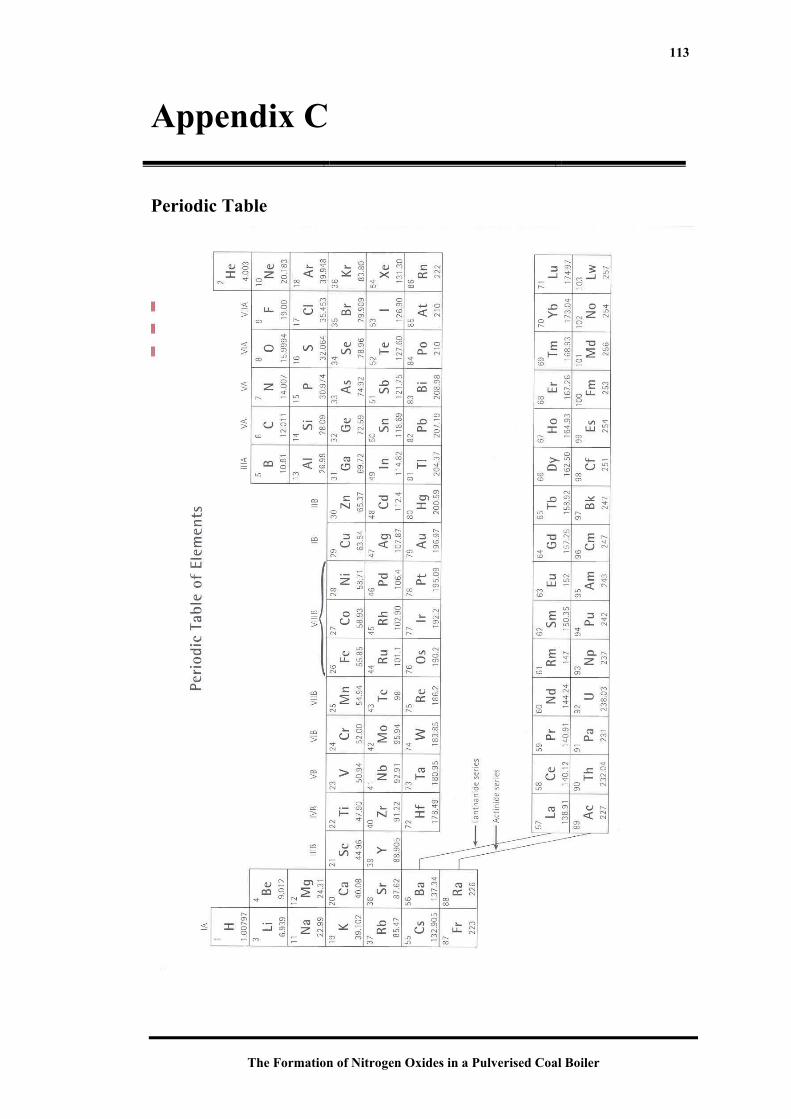
113
The Formation of Nitrogen Oxides in a Pulverised Coal Boiler
Appendix C
Periodic Table
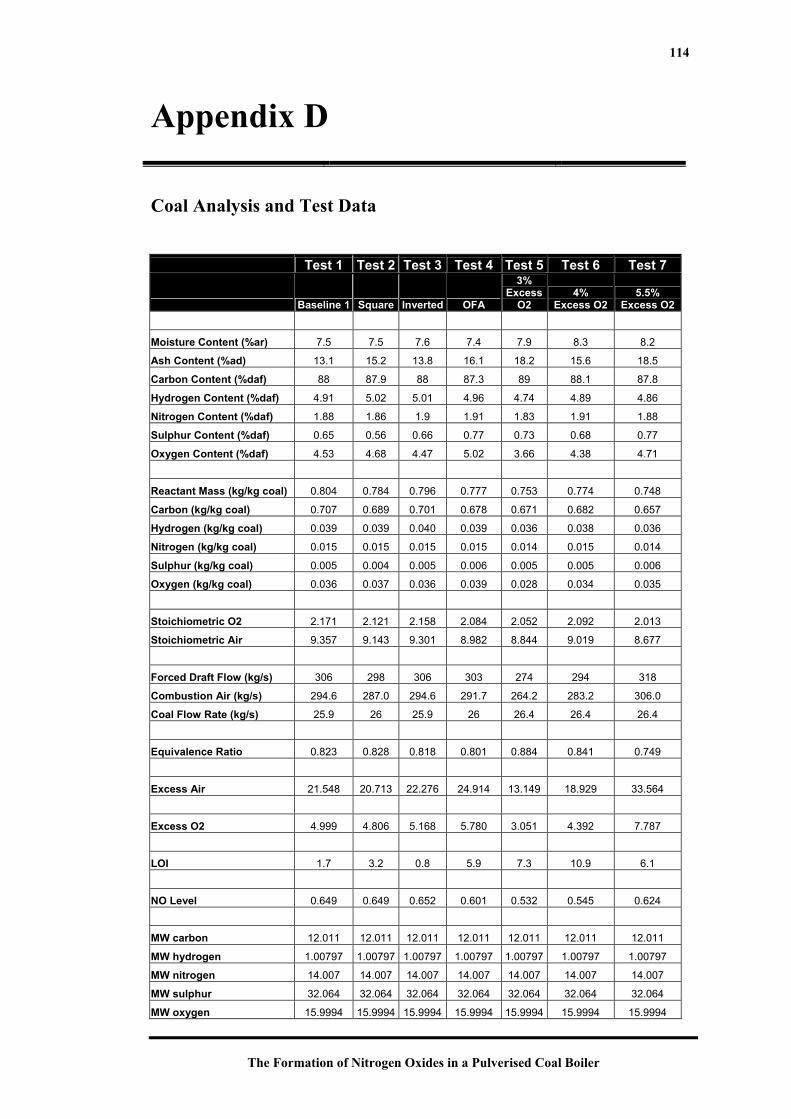
114
The Formation of Nitrogen Oxides in a Pulverised Coal Boiler
Appendix D
Coal Analysis and Test Data
Test 1 Test 2 Test 3 Test 4 Test 5 Test 6 Test 7
Baseline 1 Square Inverted OFA
3% Excess
O2 4%
Excess O2 5.5%
Excess O2
Moisture Content (%ar) 7.5 7.5 7.6 7.4 7.9 8.3 8.2
Ash Content (%ad) 13.1 15.2 13.8 16.1 18.2 15.6 18.5
Carbon Content (%daf) 88 87.9 88 87.3 89 88.1 87.8
Hydrogen Content (%daf) 4.91 5.02 5.01 4.96 4.74 4.89 4.86
Nitrogen Content (%daf) 1.88 1.86 1.9 1.91 1.83 1.91 1.88
Sulphur Content (%daf) 0.65 0.56 0.66 0.77 0.73 0.68 0.77
Oxygen Content (%daf) 4.53 4.68 4.47 5.02 3.66 4.38 4.71
Reactant Mass (kg/kg coal) 0.804 0.784 0.796 0.777 0.753 0.774 0.748
Carbon (kg/kg coal) 0.707 0.689 0.701 0.678 0.671 0.682 0.657
Hydrogen (kg/kg coal) 0.039 0.039 0.040 0.039 0.036 0.038 0.036
Nitrogen (kg/kg coal) 0.015 0.015 0.015 0.015 0.014 0.015 0.014
Sulphur (kg/kg coal) 0.005 0.004 0.005 0.006 0.005 0.005 0.006
Oxygen (kg/kg coal) 0.036 0.037 0.036 0.039 0.028 0.034 0.035
Stoichiometric O2 2.171 2.121 2.158 2.084 2.052 2.092 2.013
Stoichiometric Air 9.357 9.143 9.301 8.982 8.844 9.019 8.677
Forced Draft Flow (kg/s) 306 298 306 303 274 294 318
Combustion Air (kg/s) 294.6 287.0 294.6 291.7 264.2 283.2 306.0
Coal Flow Rate (kg/s) 25.9 26 25.9 26 26.4 26.4 26.4
Equivalence Ratio 0.823 0.828 0.818 0.801 0.884 0.841 0.749
Excess Air 21.548 20.713 22.276 24.914 13.149 18.929 33.564
Excess O2 4.999 4.806 5.168 5.780 3.051 4.392 7.787
LOI 1.7 3.2 0.8 5.9 7.3 10.9 6.1
NO Level 0.649 0.649 0.652 0.601 0.532 0.545 0.624
MW carbon 12.011 12.011 12.011 12.011 12.011 12.011 12.011
MW hydrogen 1.00797 1.00797 1.00797 1.00797 1.00797 1.00797 1.00797
MW nitrogen 14.007 14.007 14.007 14.007 14.007 14.007 14.007
MW sulphur 32.064 32.064 32.064 32.064 32.064 32.064 32.064
MW oxygen 15.9994 15.9994 15.9994 15.9994 15.9994 15.9994 15.9994
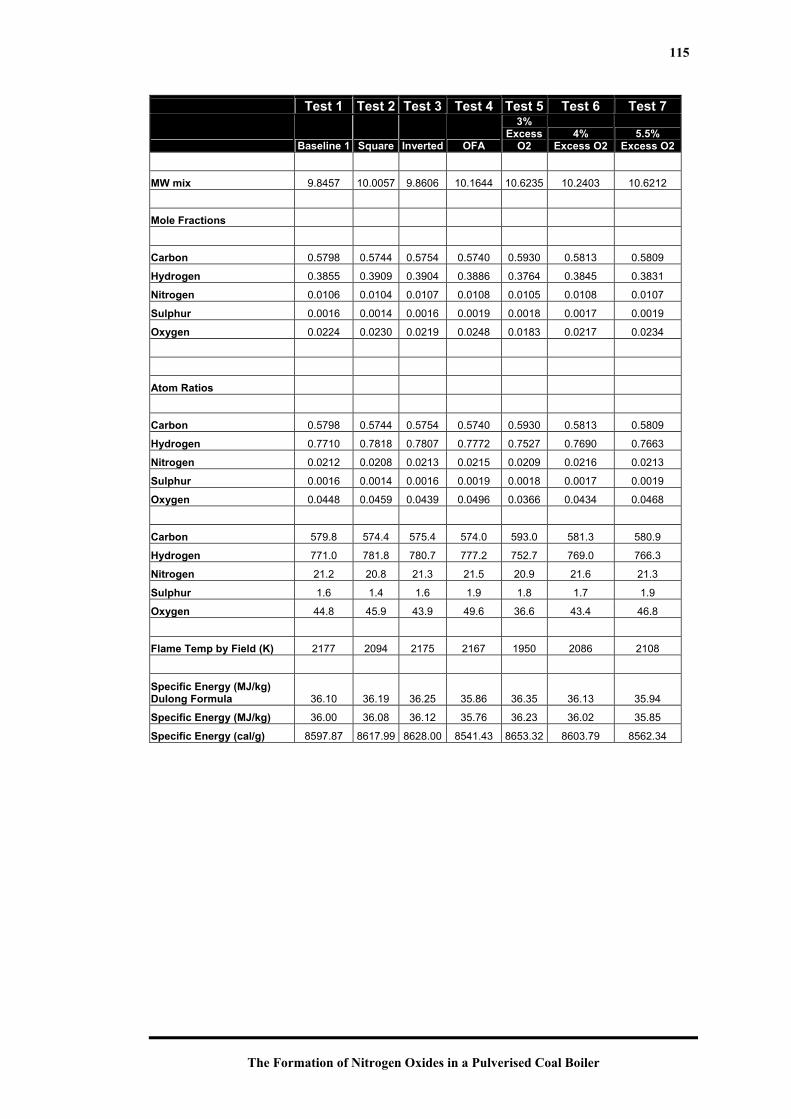
115
The Formation of Nitrogen Oxides in a Pulverised Coal Boiler
Test 1 Test 2 Test 3 Test 4 Test 5 Test 6 Test 7
Baseline 1 Square Inverted OFA
3% Excess
O2 4%
Excess O2 5.5%
Excess O2
MW mix 9.8457 10.0057 9.8606 10.1644 10.6235 10.2403 10.6212
Mole Fractions
Carbon 0.5798 0.5744 0.5754 0.5740 0.5930 0.5813 0.5809
Hydrogen 0.3855 0.3909 0.3904 0.3886 0.3764 0.3845 0.3831
Nitrogen 0.0106 0.0104 0.0107 0.0108 0.0105 0.0108 0.0107
Sulphur 0.0016 0.0014 0.0016 0.0019 0.0018 0.0017 0.0019
Oxygen 0.0224 0.0230 0.0219 0.0248 0.0183 0.0217 0.0234
Atom Ratios
Carbon 0.5798 0.5744 0.5754 0.5740 0.5930 0.5813 0.5809
Hydrogen 0.7710 0.7818 0.7807 0.7772 0.7527 0.7690 0.7663
Nitrogen 0.0212 0.0208 0.0213 0.0215 0.0209 0.0216 0.0213
Sulphur 0.0016 0.0014 0.0016 0.0019 0.0018 0.0017 0.0019
Oxygen 0.0448 0.0459 0.0439 0.0496 0.0366 0.0434 0.0468
Carbon 579.8 574.4 575.4 574.0 593.0 581.3 580.9
Hydrogen 771.0 781.8 780.7 777.2 752.7 769.0 766.3
Nitrogen 21.2 20.8 21.3 21.5 20.9 21.6 21.3
Sulphur 1.6 1.4 1.6 1.9 1.8 1.7 1.9
Oxygen 44.8 45.9 43.9 49.6 36.6 43.4 46.8
Flame Temp by Field (K) 2177 2094 2175 2167 1950 2086 2108
Specific Energy (MJ/kg) Dulong Formula 36.10 36.19 36.25 35.86 36.35 36.13 35.94
Specific Energy (MJ/kg) 36.00 36.08 36.12 35.76 36.23 36.02 35.85
Specific Energy (cal/g) 8597.87 8617.99 8628.00 8541.43 8653.32 8603.79 8562.34