Embed Size (px)
Citation preview

u n i ve r s i t y o f co pe n h ag e n
The Forgotten Property Rights
Evidence on Land Use Rights in Vietnam
Markussen, Thomas; Tarp, Finn; Van Den Broeck, Katleen
Published in:World Development
Publication date:2011
Citation for published version (APA):Markussen, T., Tarp, F., & Van Den Broeck, K. (2011). The Forgotten Property Rights: Evidence on Land UseRights in Vietnam. World Development, 39(5).
Download date: 21. Mar. 2022

1
The Forgotten Property Rights:
Evidence on Land Use Rights in Vietnam
THOMAS MARKUSSEN*
University of Copenhagen, Denmark
FINN TARP
University of Copenhagen, Denmark and UNU-WIDER, Helsinki
KATLEEN VAN DEN BROECK
University of Copenhagen, Denmark
Summary — Studies of land property rights usually focus on tenure security and transfer rights.
Rights to determine how to use the land are regularly ignored. However, user rights are often
limited. Relying on a unique Vietnamese panel data set at both household and plot level, we show
that crop choice restrictions are widespread and prevent crop diversification. Restrictions do not
decrease household income, but restricted households work harder, and there are indications that
they are supplied with higher quality inputs. Our findings are consistent with the view that it is
possible to intervene effectively in agricultural production to promote output and food security.
Nevertheless, potential benefits of a more diversified crop pattern must be carefully considered in a
period where global food markets are in turmoil.
Keywords — property rights, land use, restrictions, Vietnam
*We have benefited greatly from most pertinent editorial advice and two careful anonymous reviews. Thanks for
valuable observations are also due to Jean-Philippe Platteau, Jean-Marie Baland, Klaus Deininger, Phil Abbott, Luc
Christiaensen, Anne Christensen, Oliver Coomes, Carol Newman, Luu Duc Khai, Nguyen Le Hoa, and Dang Thu Hoai.
We acknowledge as well productive and stimulating collaboration with the survey teams from the Vietnamese Institute
of Labor Science and Social Affairs (ILSSA) and staff at the Central Institute for Economic Management (CIEM) and
the Institute of Policy and Strategy for Agricultural and Rural Development (IPSARD). Financial support from Danida
is appreciated, but the usual caveats apply.

2
1. INTRODUCTION
The global economy is passing through a period of profound challenges, and the “triple crisis”
of finance, food and climate change (Addison et al. 2010) has motivated the development
profession to start re-examining existing development strategies and policies and their effectiveness
in achieving broad-based progress. The food dimension of the triple crisis, including the dramatic
food price fluctuations during the period 2007-09 triggered a wide variety of responses by national
governments and international institutions. They vividly brought home the need for reforms in the
international food system and the critical role of effective food policies and institutional
arrangements at global, regional, national and local levels. The institutional setting involves a wide
array of issues, including the role of the state, the market and the private sector in economic
development; but the way in which property rights and land use arrangements are structured and
managed are widely accepted as being of the utmost importance.
There is a large and well-established literature on the effects of land rights in economic
development and transformation.1 However, analytical studies have so far focused on tenure
security and transfer rights, such as the right to sell, rent, mortgage, and bequeath land, rather than
rights concerning use (e.g. Feder and Onchan 1987; Place and Hazell 1993; Besley 1995; Hayes et
al. 1997; Braselle et al. 2002; Goldstein and Udry 2008). One reason for this is that use rights are
often implied by transfer rights. For example, Braselle et al. (2004) study a region in Burkina Faso
and report that 91.2 per cent of farmers surveyed have a permanent right to choose what to grow on
their plots, while only about 25 per cent have the right to rent or give away the plot. Sales are never
allowed, and it is virtually never the case that a farmer has the right to transfer a plot, but not the
right to choose what to grow.
On the other hand, in for example Vietnam and other transition economies the situation is very
different. Brandt et al. (2002) report that in 25 per cent of the villages they surveyed in rural China,
villagers cannot freely determine what to grow. In addition, 80 to 90 per cent of all plots are held as
“responsibility land”. This implies that households are obliged to deliver set quotas of grain or other
specified crops to the commune. Hence, farmers are forced to grow these crops on at least some of
their land. In Myanmar, the government formally applies non-binding or “indicative” planning, but
Kurosaki (2008) finds that in practice local authorities often put significant pressure on farmers to
produce according to official plans. Most commonly, farmers are coerced into growing rice.
Another illustration is that in the Central Asian republics of Tajikistan, Turkmenistan and
Uzbekistan, governments impose severe crop choice restrictions on farmers, mainly to facilitate the

3
production of cotton (International Crisis Group 2005; Trevisani 2007; Halimova 2007). In sum,
while the global crisis has drawn attention to the critical importance of institutional arrangements in
the food sector, and while the right to choose which crops to grow would appear to be an important
aspect of farmer property rights to land, no up-to-date empirical evidence is available.
We therefore pursue this topic, making use of an unusually rich rural household data set from
Vietnam with plot level information.2 Our results suggest that restrictions are indeed binding in an
economic sense. If they were lifted, many farmers would shift to other crops. A simple argument
from microeconomic theory suggests that binding crop choice restrictions should decrease either
household income, leisure or both. We test these hypotheses and find that restrictions do indeed
have a significant effect on household labor supply, but no effect on income from cultivation. We
also find some evidence that restricted households are supplied with higher quality inputs than other
households. A final result is that land titles have significant effects on crop choice and household
labor supply in line with existing literature.
Overall we conclude that while it is indeed possible to intervene reasonably effectively in crop
choices as evidenced by the Vietnamese case, this does come at a cost. Such costs should be
carefully considered, especially when policy choices are made in the context of continued turmoil in
food markets. Arguably, this finding is relevant across a range of different countries where
governments intervene into crop choice decisions, including for example Vietnam, China,
Myanmar, and countries in Central Asia.
Section 2 provides further background and discusses the nature of restrictions on crop choice in
Vietnam. In Section 3 a simple microeconomic model of the effect of crop choice restrictions is
formulated, and Section 4 presents data and descriptive statistics. Sections 5 and 6 investigate the
effects of restrictions on crop choice and labor supply, while Section 7 brings out the impact on
agricultural income. Section 8 concludes.
2. BACKGROUND AND NATURE OF STATE INTERVENTION IN LAND USE
MANAGEMENT
Twenty four years after the introduction of the Doi Moi reform process, market institutions are
firmly established in rural Vietnam.3 Households sell their production output to private buyers, trade
land and sell labor on the private market. At the same time the state (including national, provincial,
district, and commune authorities) retains a hugely important role in economic life. The state
intervenes actively in the land market, supplies many inputs in agricultural production, strongly

4
dominates formal markets for financial services, and plays a key role in a large number of local
organizational activities. More specifically, authorities intervene heavily in farmers’ choice of
crops, and while the land law gives households the right to sell, rent, exchange, mortgage, and
bequeath their land, many farmers do not have the right to decide how to use their plots. In our
sample, around 50 per cent of plots have restricted crop choice, although at the same time around 74
per cent of plots owned and operated by households are held with a title, a so-called Land Use
Certificate (LUC).4
A range of insightful studies have analyzed the effects of the Vietnamese move towards
privatization of agricultural land management (Do and Iyer 2008; Deininger and Jin 2008; Pingali
and Xuan 1992; Ravallion and van de Walle 2004, 2005, 2006). Yet, these studies have focused
squarely on tenure security and transfer rights with no attention to the importance of user rights.
This may in part be due to the fact that econometric analysis of the effects of crop choice
restrictions faces difficult identification challenges. The most important crop choice restriction in
Vietnam is to compel farmers to grow rice. This is done to achieve production quotas so as to
secure food supplies and meet export targets. It follows that authorities have strong incentives to
impose restrictions on the most productive land and most productive households. This means that
crop choice restrictions are likely to be correlated with unobserved land and household
characteristics, which are, in turn, correlated with crop choice and land productivity. To deal
convincingly with these problems is not easy. However, we are fortunate in having panel data at
both household and plot level.
By way of background, we also note that the important Resolution No.10 in 1988 and the 1993
Land Law nominally granted farmers the right to decide what to grow. As the land law was
implemented, however, it was hotly debated whether farmers in rice growing areas should be
allowed to shift to other crops; and the 1998 and 2001 revisions to the land law clarify that changes
in land use purpose are only allowed “within the existing physical planning framework adopted by
central and local governments” (Vasavakul 2006, p. 226). The formal justification for state
intervention is now found in the 2003 Land Law (for example article 11, §1 and article 36).
Restrictions are administered by commune authorities, according to the commune land use plan.
The plan is produced by commune authorities, subject to approval at district level. Formally,
households can apply for a change in land use purpose at the district level but in practice it is very
difficult for farmers to change or remove restrictions on their plots.5 At each administrative level,
land use plans must be consistent with plans at higher levels (from the commune to the district, the

5
province and national plan). Hence, flexibility is limited.
Table 1 presents administrative, national level data on the extent of land use restrictions in
different regions of Vietnam.
[Table 1 about here]
The table shows that farmers are obliged to grow rice on 35 per cent of the total land area used
for crop agriculture. Restrictions are concentrated in the two deltas of the Mekong and Red River.
Since land in the deltas is considerably more productive than in the uplands and population
densities are much higher, the importance of restrictions in terms of the number of farmers affected
is much higher than 35 per cent.
Why does the state impose restrictions on land use? In a sense, it is not surprising that the
government of Vietnam makes use of centralized planning. Still, we may ask why an administration
which has liberalized in many other fields has chosen to maintain restrictions on land use.
Originally, the overriding concern was food security. In the early 1980s, Vietnam experienced
severe food shortages, and these events continued to affect agricultural policies after the initiation
of the Doi Moi reforms in 1986. Food security remains a major motive behind restrictions, but
export targets are playing an increasing role. For example, the Ministry of Planning and
Investment’s Five Year Socioeconomic Development Plan (SDP) (p. 64) states that Vietnam should
export 3 to 4 million tons of food crop products per year over the period 2006-10. One method for
reaching this goal has been to restrict farmers to growing rice, the most important food export.
The fact that one of the reasons for imposing restrictions is to meet certain production targets
means that the government (national and local) has an incentive to impose restrictions on the
highest quality land, and the most effective producers, in order to maximize the probability that
targets are met. Other reasons for restricting land use mentioned by Vietnamese officials include
“the fact that local violations [of land use restrictions] may environmentally damage the areas
developed for rice growing; that in some areas farmers are not equipped to grow anything other than
rice; and that the state has already invested heavily in irrigating rice land” (Vasavakul 2006, p. 227).
Finally, anecdotal evidence exists on disputes over land use between farmers and authorities. In
the south, conflicts have occurred because farmers were prevented from converting rice fields into
shrimp raising farms. In the Red River delta, conflicts are reported to have taken place because
farmers were not allowed to grow fruit trees instead of rice (Vasavakul 2006, p. 227). Violations of

6
land use restrictions may result in severe sanctions. For example, the Hanoi People’s Committee in
2002 confiscated 50 hectares of “illegally used” land (Marsh and Macauley 2006).
Formally, crop choice restrictions are as already noted mainly motivated by concerns about food
security and export targets. Nevertheless, it may be asked whether government-imposed restrictions
are in fact merely a response to demands from local communities. The rice production process is
characterized by important communal elements, mainly due to the need to manage irrigation
facilities, and the production decisions of one farmer may therefore be of considerable interest to
other farmers in the area. If government restrictions were lifted, perhaps similar restrictions would
be imposed by informal community institutions? While there may be merit in this line of thinking,
several factors lead us to believe that the restrictions imposed by authorities do in fact go well
beyond what farmers would themselves prefer.
First, if restrictions are necessary to solve local, collective action problems, then it is surprising
that this reason is not mentioned in the accounts of official motivations for imposing restrictions
(described above). Doing so would seem to be a straightforward way to strengthen the legitimacy of
restrictions.
Second, restrictions typically force farmers to grow one particular crop, rice. If the main
motivation for restrictions were to keep irrigation systems functioning, a softer system of
restrictions would be sufficient. For example, it might be necessary to prohibit cropping patterns
that prevent irrigation water from running through a field to reach the neighbors field, but this
would generally be consistent with allowing several different crops other than rice.
Third, results presented below show that farmers subject to restrictions tend to use higher
quality inputs in crop agriculture than other farmers. This is consistent with the view that
restrictions are a means to ensure high levels of production, and that restricted farmers are therefore
subsidized by the government. The correlation is more difficult to understand if the real purpose of
restrictions is to solve community level coordination problems.
Fourth, the regional variation in the incidence of restrictions does not track the importance of
communal irrigation systems very closely. For example, one can try to focus on the two main, rice
growing areas in Vietnam, the Red River and Mekong River deltas. While communal, canal-based
irrigation systems are overwhelmingly dominant in the Red River Delta (RRD), private pumps are
much more prevalent in the Mekong River Delta (MRD) (Barket et al. 2004, pp. 25-26). If the real
motivation behind restrictions were the need to manage shared irrigation systems, we would expect
restrictions to be much more common in the RRD than in the MRD. In fact, Table 1 shows that

7
restrictions are only slightly more prevalent in the RRD (75 percent) than in the MRD, where more
than two thirds of the land for crop agriculture (68 percent) is also subject to restrictions.
Fifth, the different social traditions of northern and southern Vietnam also suggest that
restrictions should be much more common in the North than in the South, if they did in fact
originate with local communities. During colonial times, northern and central Vietnam was
dominated by so-called “corporate” villages. These were villages with high barriers to migration
and with high levels of internal social control. In contrast, southern Vietnam (“Cochinchina” in the
colonial terminology) was characterized by “open” villages, with low barriers to migration, and
relatively low levels of social control (Popkin 1979, e.g. pp. 173-174). Pierre Gourou documented
that more than a fifth of the cultivated area in the Red River delta was communally owned and that
each village had detailed, written sets of rules governing many aspects of village life.6 Such
institutions were generally much less important in the south of the country (Gourou 1936/1965, pp.
268-272, 365; Gourou 1940, pp. 229, 276). Hence, the historical precedent for community
intervention into household activities is stronger in the North than in the South. The fact that
restrictions are almost as common in the MRD as in the RRD does not fit well with the view that
restrictions originate with local communities. In contrast, since rice productivity is very high in the
MRD, it fits very well with the view that restrictions are, as the government says, a means to ensure
high, aggregate levels of rice production.
3. THEORY
We now go on to sketch a simple microeconomic model to illustrate how restrictions on crop
choice may affect household behavior. Consider a farm household who maximizes the following
utility function:
U C X (1)
where C is consumption, and X leisure. Assume that the household commands time resources
normalized to 1 and operates an agricultural land area of size Q . The household grows two
different crops, denoted 1 and 2. The prices received by the household for the crops are denoted p1
and p2, respectively. The income of the household is given by:
1 1 1 1 2 2 2 2( , ) ( , )I p f L Q p f L Q (2)

8
where f1 and f2 are the production functions for crop 1 and crop 2, respectively, and L denotes labor
input. Assume that both production functions exhibit decreasing returns to scale. Also, assume that
consumption simply equals income. Exploiting the fact that X = 1 – L1 – L2, the household then
maximizes:
1 1 1 1 2 2 2 1 1 2( , ) ( , ) 1U p f L Q p f L Q Q L L
(3)
Denote the solution to this problem by ( * * *
1 2 1, ,L L Q ), and assume that the government imposes the
restriction that the household must grow crop 1 on an area equal to at least 1
rQ . If 1
rQ is higher than
the desired area for crop 1, *
1Q , we say that the restriction is binding. The effect of imposing a
binding restriction can be illustrated in a diagram such as Figure 1.
[Figure 1 about here]
The figure shows income as a function of leisure (or equivalently, of labor supply). The schedule
PP is the income function in the case without restrictions, and the schedule PPr is the income
function after a binding restriction has been imposed.7 U and Ur are simple, linear indifference
curves.
The optimal solution for the household is point A before the restriction is imposed, and point B
after. The restriction in this case increases both labor supply and income. For other parameter
values, income might drop as a result of restrictions. The only outcome which is entirely ruled out is
a simultaneous increase in both leisure and income. This argument motivates our analysis of the
impact of crop choice restrictions on income and labor supply in Sections 6 and 7.
4. DATA AND DESCRIPTIVE STATISTICS
We make use of a unique household and plot level panel data set collected in the Vietnam
Access to Resources Household Survey (VARHS). The surveys were implemented in 12 provinces
in Vietnam between July and September 2006 and July and September 2008. It reinterviewed
households sampled for the income and expenditure modules of the 2002 and 2004 Vietnam
Household Living Standards Survey (VHLSS) in the 12 provinces.8 Provinces were selected to
facilitate the use of the survey as an evaluation tool for Danida supported programs in Vietnam.
Seven of the 12 provinces are covered by the Danida business sector support program (BSPS), and

9
five provinces are covered by the agricultural and rural development (ARD) program. The
provinces supported by the agricultural support program are located in the North West and Central
Highlands, so these relatively poor and sparsely populated regions are over-sampled. Our sample is
statistically representative at the provincial but not at the national level.
The 2006 round of the VARHS survey covered 2,324 households in 466 communes. Out of
these households, 2,271 were identified and resurveyed in 2008 (implying an attrition rate of seven
percent). We analyze the 2,049 of these households, who operate a farm, grow crops, and have data
on key variables. The household survey collected detailed plot-level information on property rights
(including restrictions on use), land use, irrigation, mode and time of acquisition, and other plot
characteristics. It also provides detailed information at the household level on agricultural inputs,
outputs and investment in addition to general information about individuals and households.
While household-level panel data has become relatively common, it is unusual that economic
surveys collect panel data at the plot level. In the 2006 round of the survey, enumerators sketched a
“map of plots” for each household. It indicates the approximate location of each household plot in
relation to the family home, and also includes information on the size of the plot, the distance from
the family home, and the code assigned to the plot, according to the coding system detailed in the
questionnaire and enumerators’ manual. These maps were stored, and copies were taken back to
households in 2008 and used to identify plots. A total of 12,511 plots were included in the 2006
survey for the households who were reinterviewed in 2008, and 9,432 of these plots were identified
again in 2008. Households stated that they parted with a total of 861 plots, and if plots had been
split up, or merged with other plots, they were regarded as “new” plots. Some 1,865 plots were
classified to have changed in these two ways. An additional 353 plots (three per cent of the original
sample) were not re-surveyed for a variety of reasons.
Table 2 presents descriptive statistics for the plots and households analyzed. The first line shows
that restrictions on crop choice are common, and a drop occurred between 2006 and 2008. This
stems partly from the general trend towards increased influence of market forces, and partly from
the fact that high rice prices in 2008 rendered restrictions less necessary in some areas, in the sense
that the high prices meant that rice became a more attractive crop. Next, the table documents that by
far the most common restriction is that farmers must grow rice. The table also shows that most plots
are titled and that the share of plots titled remained stable between 2006 and 2008. The share of
plots planted with rice has decreased slightly, while the share irrigated and the share which is rented
is the same in the two survey years.

10
[Table 2 about here]
At the household level, household size and the share of household heads that are female are
unchanged, while household heads, not surprisingly, are older in 2006 than in 2008. The household
head’s average years of schooling is slightly higher in 2008 than in 2006, reflecting both additional
schooling received by some heads and the changed identity of the household head in some
households. Real income from crop agriculture increased very substantially. This is mostly a
reflection of the very large increases in world market prices of crops over the period. Farm sizes
decrease moderately over the period, reflecting continuous subdivision of farms, as parents hand
over land to their children. Household labor supply increased marginally, especially in crop
agriculture, in line with increased monetary returns. The table also shows the expected, sharp
increase in the real price of rice received by farmers.
5. CROP CHOICE
In our econometric analysis, we first investigate whether restrictions do in fact impose binding
constraints on farmers. Would they grow something else if they were not subject to restrictions?
Most restrictions compel farmers to grow rice, but obviously many would plant rice even in the
absence of restrictions. Natural conditions in most areas of Vietnam are very well suited to rice
cultivation. On the other hand, anecdotal evidence suggests that the shift from growing rice to fruits,
vegetables, flowers or other crops may in many cases by quite profitable, even in the delta areas
(Vietnam News 2005, 2006, 2008) If restrictions are binding in an economic sense, there should be
a significant, partial correlation between restriction status and the decision to grow rice, even when
household and plot characteristics, and developments in prices, are controlled for.
We proceed by assuming that the determination of crop choice can be described by the
following model:
'pht pht pht h ph phtC R x u v e , (4)
where phtC is crop choice on plot p in household h in year t. The variable takes the value one if the
plot is planted with rice in at least one season in year t, and zero otherwise. phtR is a dummy
indicating whether there is a restriction on the plot specifying that rice must be grown; phtx is a
vector of potentially time-varying variables that may affect crop choice, such as property rights,

11
access to irrigation, and prices; hu is an unobserved, household specific effect and phv
is an
unobserved, plot-specific effect; and phte is an idiosyncratic, time varying error term, which is
assumed to be independent across different communes, but potentially auto-correlated within
communes. Conditional on the unobserved, fixed effects, phte is assumed to be uncorrelated with
the explanatory variables, while α, β and γ are parameters to be estimated.
In this model, the introduction of household fixed effects in a regression would remove the bias
stemming from hu , but not the bias from phv . It is eminently plausible that unobserved plot
characteristics, such as the quality and nature of the soil, play a significant role for the choice of
crop. At the same time, these characteristics are correlated with the imposition of restrictions.
Authorities have, as already alluded to, a significant incentive to choose restrictions so as to
maximize rice production. Introducing fixed effects at the plot level removes the bias from
unobserved plot characteristics which are fixed over time. Since this is likely to be correct for
variables such as the type and quality of soil, the possibility to include plot fixed effects is a
significant benefit. One potentially important factor not taken into account by fixed effects is the
development of the price received by farmers for rice. Variations in prices may potentially affect
both household decisions to grow rice, and the authorities’ decision to impose restrictions. We
introduce controls for the price of rice, calculated as the commune average of prices received by
farmers in the sample. Other crops are not sufficiently widely grown and traded to calculate prices
for all the sampled areas. Another factor that needs to be controlled for is managerial quality (e.g.
Mundlak 1961). The manager’s ability is to a large extent taken into account by the fixed effects,
but the variable cannot be assumed to be entirely fixed over time. Farmers may receive additional
training, and the identity of the household head may change. We therefore introduce the household
head’s total years of schooling as an additional control variable, based on the hypothesis that more
educated farmers may be more willing than others to experiment with other crops than rice.
Results are shown in Table 3, and the first column shows a strong, and highly statistically
significant, partial correlation between restrictions and crop choice. The probability of growing rice
is predicted to increase by 14 percentage points when a restriction is imposed. Column two shows
that this effect is only slightly lower (12 percentage points) when controls for potentially time-
varying factors are included. Column three shows the results from a regression without plot fixed
effects (a “pooled” regression). The estimated effect of restrictions in this model is much higher
than in the fixed effects models, underlining the importance of controlling for plot characteristics.

12
[Table 3 about here]
Unsurprisingly, the availability of irrigation has a strong positive effect on the probability of
growing rice. This variable might be endogenous in the sense that the decision to invest in irrigation
may follow the decision to grow rice, rather than the other way around. Note, however, that
investment in irrigation facilities in Vietnam is generally undertaken by the authorities, rather than
by households. We therefore believe it is reasonable to assume that the availability of irrigation is
exogenous.
The probability of growing rice increases when the household receives a title for a plot. This
may appear to be at variance with Do and Iyer (2008) who found that land titles increase investment
in perennial crops. Yet, the apparent contradiction disappears when it is recalled that initiating rice
production also entails investment costs.9 Years of schooling has the expected negative sign but is
completely insignificant in the fixed effects model. The price variable is not significant.
In sum, changes in restriction status are very strongly correlated with changes in crop choice,
even when observed and unobserved plot characteristics are controlled for. This indicates that
formal restrictions do in fact affect household behavior. To some extent, it is also conceivable that
causality runs in the other direction, from behavior to restrictions. To the extent feasible, authorities
may impose restrictions where it “hurts the least”. That is, additional restrictions may be imposed
first on farmers who planned to expand rice production in any case. However, since aggregate rice
production targets are rigid, as described above, there is a clear limit to how far farmers’ wishes can
be accommodated. Still, the possibility that restrictions may in some cases follow from a farmer’s
desire to grow rice rather than the other way around, means that it is interesting to learn which
subjective reasons farmers state for their choice of crops. Table 4 provides such evidence. In
VARHS 2008, respondents were asked for each plot they had planted, why they had chosen the
crop they grew in the most recent season.
[Table 4 about here]
The results show that for 37 per cent of all plots, farmers state that the main reason for growing
the crop is that they are “obliged by authorities”. Some 41 per cent say that the crop has high
productivity or high efficiency, and 17 per cent say that the plot is not suitable for other crops. On

13
plots where an objective, formal crop choice restriction is present (column two), respondents on 80
per cent of the plots say that the obligation toward the authorities is the most important reason for
their choice of crop. This does not imply that farmers would shift to another crop if restrictions were
lifted in 80 per cent of the cases, and subjective data of the type presented in Table 4 should always
be interpreted with great care and some skepticism. Nevertheless, the fact that a large share of
respondents answer that the obligation is the most important reason for their crop choice is
consistent with the findings in Table 3 and does strengthen the interpretation that restrictions affect
behavior, rather than the other way around. If restrictions were simply a nominal tag attached to
plots where rice would be grown anyway, it is likely that farmers would have cited productivity or
plot suitability as the main reasons for crop choice.10 In sum, the qualitative evidence presented in
Section 2, the results from crop choice regressions and the answers to questions about subjective
reasons for crop choice together present a consistent picture of a restrictions regime, which is
widespread and has real effects on crop choice decisions.
6. HOUSEHOLD LABOUR SUPPLY
The simple microeconomic argument illustrated in Figure 1 suggests that if crop choice
restrictions are binding, they are likely to have an effect on household income and labor supply. We
therefore turn to an investigation hereof. Since data on labor input and income from crop agriculture
are not available at the plot level, these analyses are conducted at the household level.
We first consider labor supply. Table 5 presents the results of estimating household fixed effects
regressions for household labor supply per working household member. The first two columns
explain labor input in crop agriculture (including annual as well as perennial crops) and the last two
total household labor supply (in logs). The measure of crop choice restrictions used is the share of
agricultural land subject to a restriction. A year dummy is included in all regressions. In columns
two and four, a number of other control variables are also included. First, the share of land with a
red book is introduced. If land titles increase investment, they may also affect labor supply,
depending on whether these investments are labor-saving or labor-using (see Do and Iyer 2008).
The size of operated agricultural area (“farm size”) is also included, since land and labor are
complementary inputs in agricultural production. Finally, total household size in logs, the price of
rice and the household head’s years of schooling are included, and the first, second, fourth and fifth
models account for household fixed effects. These play an important role by helping remove the
effect of unobserved household preferences for leisure. Local authorities in Vietnam may be able to

14
observe at least some of these preferences, and since they have an incentive to impose restrictions
on the most hard-working households, this strengthens our analysis. On the other hand, since most
of the variation in labor supply is between rather than within households (reflected in low R-
squared values in the fixed effects models), we also include the pooled regression estimator, which
exploits between as well as within household variation.
[Table 5 about here]
Results show a significant, positive effect of restrictions on labor supply, both for crop
agriculture and for all activities. The estimated effect is similar in fixed effects- and pooled
regressions. Such an effect appears plausible. Rice cultivation requires higher labor inputs per
hectare than most other crops. For example, in 2008 households who grew only rice put in a total of
717 days of labor per hectare per year in crop agriculture, whereas households growing no rice
supplied 494 days per hectare per year. As we have seen, restrictions increase the probability of
growing rice.
It is somewhat surprising that the effect on labor input in agriculture is not significantly stronger
than on total labor supply. One would expect the effect of restrictions to work mainly through crop
agriculture. One possible explanation is that attenuation bias is stronger for labor input in crop
agriculture than for total labor supply. First, total labor supply is likely to be measured with less
error than labor supply in any particular sector (since errors for different sectors to some extent
cancel out in the aggregate). Second, labor input in agriculture is particularly difficult to measure,
inter alia because the number of hours worked per day often varies strongly over the year.
The results also show that the share of land held with a title has an insignificant, negative effect
on labor input in crop agriculture, but a positive effect on total labor supply. This is consistent with
the results reported in Do and Iyer (2008), who found that land titles in Vietnam increase labor
input in non-farm activities. Increases in total household size are estimated to decrease labor input
per worker in crop agriculture. This indicates that total household labor input in agriculture does not
increase proportionally with household size. As the household size increases, members share the
workload in agriculture, and each works less. On the other hand, household size has no effect on
total labor supply per worker. The rice price variable is not significant in the fixed effect
regressions, but has a strong, positive effect in the pooled regression for labor supply in crop
agriculture. Years of schooling is also insignificant in the fixed effects models, but has a significant,
positive effect in the pooled regression for total labor supply.

15
In sum, crop choice restrictions increase labor input per worker, both in crop agriculture and on
aggregate. This is consistent with the observation that rice cultivation requires relatively high labor
inputs.
7. INCOME FROM CROP AGRICULTURE
We now turn to the econometric analysis of restrictions and household income from crop
agriculture. Table 6 presents regressions for income from crop agriculture, in logs. Income is
defined as the value of output minus the value of all purchased, variable inputs, and all inputs are
assumed to be purchased, except for “self-provided fertilizers”. The measure of restrictions used is,
again, the share of operated area with restrictions. The first three specifications include a household
fixed effect and a year-dummy. The last column shows the results from a pooled regression.
Column two includes land, household and commune characteristics that may plausibly vary over
time. These are the share of land with a title, farm size, household labor input in crop agriculture,
the share of irrigated land, the share of rented land, the price of rice and the household head’s years
of schooling. In addition, column three introduces land characteristics which are, by and large, time-
invariant at the plot level. Since the household might acquire or part with land, however, these
characteristics may in principle change at the household level, and these changes may be correlated
with restrictions and with income. We include the share of land with slight, medium, and steep
slope (leaving out the share with a flat slope as the residual category), and have an additional
measure of land quality. This is the share of land that falls in each of four tax brackets.11
[Table 6 about here]
Results show that restrictions have a statistically insignificant, positive effect on income from
crop agriculture. Hence, restrictions do not seem to make households poorer, although, as illustrated
in Figure 1, the increased labor efforts they induce might still mean that restrictions reduce welfare.
The estimated coefficient on land titles is positive, but falls just short of being statistically
significant (p = .13 in column 3). As already alluded to, land rights are often viewed as endogenous.
However, since a major, potential source of endogeneity is unobserved household and land
characteristics, this is much less of a concern in household fixed effects models than in cross-
section analyses. As we would expect from Table 2, there is a large positive year effect. In column
1, income from crop agriculture is more than 30 per cent higher in 2008 than in 2006. However,
when the price variable is introduced (along with other variables) in columns 2 and 3, the year

16
effect drops significantly, and the price of rice enters with a large positive coefficient. This is
consistent with the view that the year effect mainly operates through the increase in output prices.
Farm size and labor input have the expected signs and are highly significant. The share of land
irrigated does not have a significant effect on income. This might indicate that Vietnamese
irrigation systems are ineffective, but it is more likely a result of the fact that this variable does not
vary much over time. Education is positive and weakly significant in the second regression,
insignificant in the third regression and significant at the one per cent level in the pooled regression
four.
Estimated coefficients on the slope and land class variables are all insignificantly different from
zero. We take this as an indication that the household fixed effects do a good job of controlling for
land characteristics.
The fact that the restrictions variable remains positive even after controls for labor input have
been introduced (in columns 2 and 3) is not what one would have expected from Figure 1. It implies
that for a given level of labor supply, restrictions should lead to a decrease in income. One might
argue that since the estimated coefficients on restrictions are not significantly different from zero,
the theoretical prediction and our findings are reconcilable; but the fact that the coefficient is
positive does suggest that it is relevant to dig further into the full story behind the data.
There are at least two possible explanations for the absent, negative effect of restrictions on
income. First, restrictions may be beneficial if they solve coordination problems. As discussed in
Section 2, most villages depend critically on a well-functioning irrigation network. If some crops
disrupt the irrigation system, for example because water is prevented from running through a field,
then it may make sense to ban them. Even though it was argued in Section 2 that this line of
reasoning is probably not the main motivation behind the restrictions, restrictions may still
sometimes have the effect of solving such problems. Cross-pollination between different varieties of
crops could also present collective action problems. If restrictions do solve such problems, it
implies that they have positive externalities. If they do, a household should in theory experience a
positive effect of restrictions on other farms in their neighborhood.
We tested this hypothesis by calculating the average share of land with restrictions among all
sampled households in a commune and included this variable in regression 3 in the model in Table
6. This did not change the sign on the variable measuring the household’s own restrictions.
Furthermore, the commune-average variable entered with the wrong sign (negative), although
insignificantly different from zero.

17
Second, restrictions tend to come with certain benefits from the authorities, such as increased
access to extension services, irrigation water or price subsidies (World Bank 1998, p. 13). We
therefore investigate the importance of such effects. Since some key variables used in these
analyses (in particular, fertilizer prices and plot level information about the use of high-quality rice
seed) were only measured in 2006, we rely here on the sample from that year only.
Consider prices first. The vast majority of households sell their output to private traders, so it is
implausible that households with restrictions are given subsidies on their output prices. How about
input prices?
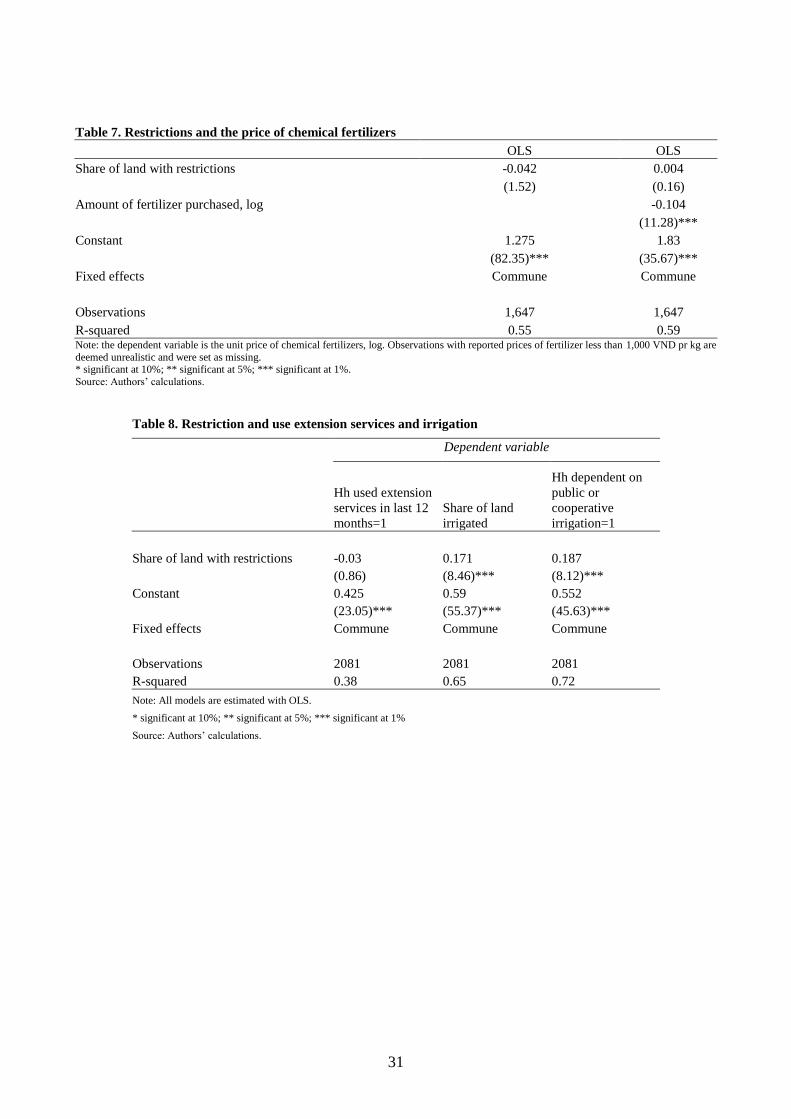
Table 7 presents results of regression models explaining the unit price paid by each household
for chemical fertilizers, which is an important, purchased input.12 A number of area-specific
characteristics, such as remoteness and total demand for fertilizer, may affect prices. Therefore,
regressions include commune fixed effects.
[Table 7 about here]
The first column in Table 7 shows that, controlling for commune characteristics, restrictions are
indeed associated with a lower unit price of fertilizer. However, once the amount of fertilizer
purchased is controlled for (in column 2) this effect disappears. It seems that households simply get
a quantity discount (prices drop by 10 per cent when the purchased amount doubles), and that
households under restrictions use more fertilizer than others. Hence, the results do not support the
hypothesis that restricted households are subsidized.
Table 8 shows the effect of restrictions on access to extension services and irrigation in OLS
regressions. Again these variables may be strongly affected by community level factors such as
remoteness and hydrological conditions (in the case of irrigation). Commune fixed effects are
therefore included. The share of land with restricted crop choice is not positively related to the
probability of using extension services. In contrast, restricted farms are more likely to have access
to irrigation. In particular, they are more likely to use public or cooperative irrigation infrastructure.
This might be the result of either (i) a higher tendency for irrigated plots to be put under restrictions,
or (ii) a higher willingness on part of authorities to supply irrigation water to restricted plots. Note,
though, that access to irrigation is already controlled for in the income regressions.
[Table 8 about here]

18
Finally, an important determinant of rice yields is the type of seeds used. In particular, the
introduction of hybrid seeds is a key important factor behind the improvement of rice yields
experienced in Vietnam over recent decades. Substantial investments and government effort have
gone into promoting breeding, multiplication and extension of good quality seed of high-yielding
varieties.
Table 9 shows the effects of restrictions on the probability that a plot is sown with hybrid seeds
in at least one season in the last 12 months, using OLS regressions at the plot level with household
fixed effects. The regressions only include plots sown with rice in at least some seasons. The
measure of restrictions used is an indicator for the restriction that the plot must be sown with rice in
at least some seasons. Results show that restricted plots are more likely to be sown with hybrid
seeds than other plots. This indicates that better seeds are supplied to restricted plots than to other
plots, either because authorities favor these plots or because restricted plots are more likely to be
endowed with characteristics necessary for successful use of hybrid seeds, such as irrigation.
[Table 9 about here]
In sum, the evidence indicates that restricted households do not obtain better prices of fertilizer
or better access to extension services. However, restricted plots are more likely to be irrigated and
to be sown with hybrid seeds than other plots. Hence, results are consistent with the view that
restricted plots are supplied with better inputs than other plots, in line with officially declared
government policy.
8. CONCLUSION
This paper took as starting point that the global economic crises have re-invigorated the
international debate about the optimal development strategies and policies to achieve growth,
structural transformation and poverty reduction. Development thinking and practice is under
scrutiny and it is becoming increasingly evident that there are many paths to development due to
differing country contexts and circumstances. It is also becoming evident that locating and
remaining on a successful development path is difficult, and that policy mistakes are unavoidable.
The key to success includes the willingness and ability to learn from such mistakes and change
course in more productive directions. At the same time, it is widely agreed that the way in which

19
property rights and land use arrangements are structured and managed are of the utmost importance
to economic progress.
It is, on this background, somewhat surprising that existing studies of land property rights have
so far ignored the importance and economic implications of the rights to determine how to use the
land. This motivated the present paper, which is the first analysis of the effects of restrictions on
crop choice in Vietnam. In fact, in spite of the importance of crop restrictions in a variety of settings
we are unaware of any analytical up-to-date studies focusing on this issue in transition economies.
Vietnam is an intriguing case of economic development. Wide-ranging market oriented reforms
have been coupled with robust economic growth and poverty reduction over the past two decades.
At the same time, the state has retained a strong and interventionist stance in many aspects of
economic and social life and organization. Vietnam defies simplistic categorization, but it does
provide a window of insight into the issues we have identified above.
From our analysis it emerged that restrictions on crop choice are indeed common and
widespread and both the quantitative and qualitative evidence indicates that restrictions impose real
constraints on the behavior of farmers. When restrictions are lifted, farmers in many cases change
their choice of crop. Restrictions have also had a significant effect on household labor supply, but
no effect on income from cultivation was found. The evidence presented is therefore consistent with
the view that restricted households are effectively supplied (compensated) by the authorities with
higher quality inputs than other households in accordance with officially declared policy. Another
result, in line with previous literature, is that land titles have significant effects on crop choice and
household labor supply.
Our results suggest that land use restrictions should not be ignored in analyses of land policies
in Vietnam and other transition economies, such as China and countries in Central Asia, where
restrictions on crop choice are common. In these economies, the tendency in the literature to focus
on transfer rights instead of use rights should be reconsidered. From a methodological perspective
we have demonstrated that using panel data at both household and plot level in studies of land
property rights are associated with significant advantages.
Turning to policy implications, our study illustrates that there are indeed many paths to
development as alluded to above. The Vietnamese government has managed to combine market
reforms with strong and effective intervention in agricultural production for food security and
export promotion purposes. Thus, we find no basis for recommending dismantling of state
intervention in the agriculture sector. On the other hand, our results demonstrate that high,

20
mandated rice production comes with significant costs in terms of labor allocation. This does
suggest that the potential benefits of a more diversified crop pattern should be carefully assessed at
a point in time where global food markets are under pressure. This is highlighted by the fact that as
Vietnam produces a large surplus of rice and transport infrastructure is becoming increasingly
developed, concerns about food security ought to become less of a challenge than in the past.
Restrictions that compel farmers to growing rice tie up significant labor resources in low-value
added agriculture. As Vietnam continues to develop at a rapid pace, human resources may well be
put to better use in the production of higher-value added agricultural crops and work in non-farm
activities. There are important lessons in this evidence for other countries, which may be tempted to
refrain from engaging in global food markets in light of recent experiences.
NOTES
1 For general surveys of the literature on land rights and other policies related to land, see Feder and Nishio (1999),
Deininger and Feder (2001), Deininger (2003), and Pande and Udry (2005).
2 We know of only one other study which uses a plot-level panel to study land rights. Goldstein and Udry (2008)
analyze the relationship between political power, tenure security and investment in seven villages/hamlets in the
Akwapim region of Ghana. In contrast with their work we include plot fixed effects in our regressions.
3 For in-depth descriptions of land policies in Vietnam, see Kerkvliet (2006) and Marsh et al. (2006).
4 Somewhat ironically for a document that assigns private property rights in a communist country, LUCs are also known
as “red books”. LUCs grant 20 year tenure security for annual crops land (50 years for perennial crops land) and a wide
range of transfer rights, but not the right to determine use. The descriptive report by Brandt et al. (2005), based on the
2004 VHLSS, also contains statistics on the prevalence of LUCs.
5 This is based on extensive information of a qualitative nature (including in-depth discussion with officials at national
level in CIEM, ILSSA, IPSARD and MONRE, and observations made during repeated field trips by the authors over
the past seven years). The summary is also consistent with Vasavakul (2006), who writes: “Within the Vietnamese
physical planning framework, rules and regulations governing rice land seem the most rigid. The central government
insists on the need to maintain a certain amount of rice growing area for food security purposes, and each province has
local plans for rice growing. Currently, the adopted plan is to retain a total of about 4.2 million ha of rice land until the
year 2010. Farmers living in rice growing areas will not be allowed to grow other crops.” (p. 227). Similarly, Marsh and
Macauley (2006) state: “In some districts control over production in still exerted by the State, particularly with regard to
rice production (….) Production targets are set at a local level in response to government directives and individual
households may have to grow crops as directed.”
6 Interestingly, we have found no documentation that communities forced members to grow rice in the pre-Communist
era, either in the south or in the north, although of course rice was by far the most important crop also then.
7 In the figure, the income schedule under restrictions (PPr) is always strictly below the income schedule without
restrictions (PP). In general, the two schedules may run on top each other over some ranges of X (those ranges where
the crop mix is identical with- and without restrictions). Since the household can never, in this simple setting, be strictly
better off with a restriction than without it, PPr is never above PP. The assumption that the restriction is binding implies
that the optimal point under the restriction, B, is strictly inside the area delimited by PP and the axes (i.e. that it is on a
lower indifference curve than the optimal point without restrictions, A).

21
8 See CIEM et al. (2007, 2009) for further background information and details. The sampled provinces are, by region:
Red River Delta: Ha Tay. North East: Lao Cai, Phu Tho. North West: Lai Chau, Dien Bien. North Central Coast: Nghe
Anh. South Central Coast: Quang Nam, Khanh Hoa. Central Highlands: Dak Lak, Dak Nong, Lam Dong. Mekong
River Delta: Long An.
9 Land titles, and transfer rights in general, are typically regarded as endogenous in the literature (e.g. Besley 1995;
Braselle et al. 2004; Markussen 2008). However, since a main source of endogeneity is unobserved household and land
characteristics (such as entrepreneurship and soil quality), it is plausible that land titles are exogenous in the plot fixed
effects model, where these factors are controlled, in contrast with the cross-section models typically estimated
(including an earlier draft of this paper based on the 2006 data only).
10 Due to the authoritarian and rather intrusive nature of the Vietnamese state, readers may wonder whether respondents
are likely to answer truthfully to questions about subjective motivations for household behavior. First, based on
personal observations from the data collection process, it is our clear impression that respondents generally answer all
types of questions frankly. In the vast majority of cases, commune personnel did not attend interviews. Second, if the
purpose of an answer is to please the authorities, it seems that stating “high productivity” as the main reason for crop
choice would be a better choice than “obliged by commune authorities”. The ideal subject would, presumably, follow
the commune plan out of conviction, rather than mere obligation.
11 Following the 1993 Land Law, most plots in Vietnam were, as described by Le (undated), classified for tax purposes.
For annual crops land, six categories were defined. For perennial crops land there were five categories. Classification
depended on five objective plot characteristics, soil quality, location (i.e. distance from residence), terrain (e.g. slope),
climate, and irrigation conditions. Higher taxes were due for land in a better category (category one is best). Based on
the tax-classification information, we created a unified measure of land quality applying to both annual and perennial
crops land. The classification schemes for annual and perennial land are unified based on the tax rates for each category
of land. Hence, in each of the four land quality “classes” we define, approximately the same amount of tax was due for
all plots. The four classes on the land quality variable relate to the tax classification scheme in the following way:
Class 1: Category 1 of annual land and category 1 and 2 of perennial land. Tax rates: 550-650 kg rice/ha/year
Class 2: Category 2 and 3 of annual land and category 3 of perennial land. Tax rates: 370-460 kg rice/ha/year
Class 3: Category 4 and 5 of annual land and category 4 of perennial land. Tax rates: 180-280 kg rice/ha/year
Class 4: Category 6 of annual land and category 5 of perennial land. Tax rates: 50-80 kg rice/ha/year.
Since the tax-related land-classifications have not been updated since the 1990s, as a result of the land tax being
abandoned in 2003, the variable is in our analysis fixed at the plot level from 2006 to 2008.
12 651 households did not report fertilizer prices. 21 households were excluded because they reported prices below 1000
VND per kg., which was deemed unrealistically low. The results do not change substantially if they are included.
REFERENCES
Addison, T., Arndt, C., Tarp, F., 2010. The Triple Crisis and the Global Aid Architecture. WIDER
Working Paper No. 2010/01.
Barker, R., Ringler, C., Nguyen, M.T., Rosegrant, M., 2004. Macro Policies and Investment
Priorities for Irrigated Agriculture in Vietnam. International Water Management
Institute, Colombo, Sri Lanka.
Benjamin, D., Brandt, L., 2004. Agriculture and income distribution in rural Vietnam under
economic reforms: A tale of two regions. Chap. 5 in P. Glewwe and D. Dollar (eds.)

22
Economic growth, poverty and household welfare in Vietnam. The World Bank,
Washington DC.
Besley, T., 1995. Property rights and investment incentives: Theory and evidence from
Ghana”. Journal of Political Economy 103(5), 903-937.
Brandt, L., Huang, J., Li, G., Rozelle, S., 2002. Land rights in rural China: Facts, fictions and
issues. The China Journal 47, 67-97.
Brandt, L., 2005. Land access, land markets and their distributional implications in rural
Vietnam. Preliminary draft report, University of Toronto.
Braselle, A.S., Gaspart, F., Platteau, J.P., 2002. Land tenure security and investment incentives:
puzzling evidence from Burkina Faso. Journal of Development Economics 67, 373-
418.
CIEM, DOE, ILSSA, IPSARD, 2007. Vietnam Access to Resources Household Survey.
Characteristics of the Vietnamese Rural Economy: Evidence from a 2006 Rural
Household Survey in 12 Provinces of Vietnam. Statistical Publishing House, Hanoi.
CIEM, DOE, ILSSA, IPSARD, 2009. Vietnam Access to Resources Household Survey:
Characteristics of the Vietnamese Rural Economy (2008 Survey). Statistical
Publishing House, Hanoi.
Deininger, K., Feder, G., 2001. Land institutions and land markets. Chap. 6 in B. Gardner and G.
Rausser (eds.). Handbook of Agricultural Economics. Elsevier, Amsterdam.
Deininger, K., 2003. Land policies for growth and poverty reduction. World Bank, Washington
D.C.
Deininger, K., Jin, S., 2008. Land sales and rental markets in transition. Evidence from rural
Vietnam. Oxford Bulletin of Economics and Statistics 70(1), 67-101.
Deininger, K., Castagnini, R., 2004. Incidence and impact of land conflict in Uganda. Policy
Research Working Paper 3248, World Bank, Washington DC.
Do, Q.T., Iyer, L., 2008. Land titling and rural transition in Vietnam. Economic Development
and Cultural Change 56(3), 531-579.
Feder, G., Onchan, T., 1987. Land ownership security and farm investment in Thailand. American
Journal of Agricultural Economics 69, 311-320.
Feder, G., Nishio, A., 1999. The benefits of land registration and titling: economic and social
Perspectives. Land Use Policy 15(1), 25-43.
Goldstein, M., Udry, C., 2008. The Profits of Power. Land Rights and Agricultural Investment
in Ghana. Journal of Political Economy 116(6), 981-1022.

23
Gourou, P., 1936/1965. Les Paysans du Delta Tonkinois. Mouton & Co, and Maison Des Science
de L’Homme, Paris.
Gourou, P., 1940. L’Utilisation du Sol en Indochine Francaise. Centre d’Études de Politique
Étrangère, Paris.
Halimova, N., 2007. The cotton sector in Tajikistan: From macroeconomic impact to social and
environmental consequences. . Chap. 13 in Kandiyoti, D. (ed.): The Cotton Sector in
Central Asia. Economic Policy and Development Challenges. The School of Oriental
and African Studies, London.
Hayes, J., Roth, M., Zepeda, L., 1997. Tenure security, investment and productivity in Gambian
agriculture: A generalized probit analysis. American Journal of Agricultural
Economics 79(2), 369-382.
International Crisis Group, 2005. The curse of cotton: Central Asia’s destructive monoculture. Asia
Report No. 93, Brussels.
Kerkvliet, B.T., 2006. Agricultural land in Vietnam: Markets tempered by family, community and
socialist practices. Journal of Agrarian Change 6(3), 285-305.
Kurosaki, T., 2008. Crop choice, farm income and political control in Myanmar. Journal of the Asia
Pacific Economy 13(2), 180-203.
Le Huu Anh (undated). Tax and credit policies and agricultural land use. Mimeo, Hanoi
Agricultural University, Hanoi.
Markussen, T., 2008. Property rights, productivity and common property resources. Insights from
rural Cambodia. World Development 36(11), 2277–2296.
Marsh, S.P., MacAuley, G., 2006. Land reform and the development of commercial agriculture in
Vietnam: policy and issues. Mimeo, The University of Sydney, Sydney.
Marsh, S.P., MacAuley, G., Hung, P.V. (eds.), 2006. Agricultural Development and Land Policy in
Vietnam. Australian Centre for International Agricultural Research, Sydney.
Ministry of Planning and Investment (MPI), 2006. The five-year socio-economic development plan
2006-2010. Hanoi.
Mundlak, Y., 1961.Empirical production functions free of management bias. Journal of Farm
Economics 43(1), 44–56.
Pande, R., Udry, C., 2005. Institutions and development: A view from below. Mimeo, Yale
University.
Pingali, P., Xuan, V.T., 1992. Vietnam: Decollectivization and rice productivity growth. Economic
Development and Cultural Change 40(4), 697-718.

24
Place, F., Hazell, P., 1993. Productivity effects of indigenous land tenure systems in Sub-
Saharan Africa. American Journal of Agricultural Economics 75(1), 10-19.
Popkin, S.L., 1979. The Rational Peasant. The Political Economy of Rural Society in Vietnam.
University of California Press, Berkeley, CA.
Ravallion, M., van de Walle, D., 2004. Breaking up the collective farms. Welfare outcomes of
Vietnams massive land privatization. Economics of Transition 12, 201-236.
Ravallion, M., van de Walle, D., 2005. Does rising landlessness signal success or failure for
Vietnams agrarian transition? World Bank working paper, Washington D.C.
Ravallion, M., van de Walle, D., 2006. Land reallocation in an agrarian transition. Economic
Journal 116, 924-942.
Tien, T.D., Le, N.P., Marsh, S., 2006. Agricultural land use flexibility in Vietnam. Chap. 2 in
Marsh, S.P., G. MacAuley and P.V. Hung (eds.) Agricultural Development and Land
Policy in Vietnam. Australian Centre for International Agricultural Research, Sydney.
Trevisani, T., 2007. The emerging actor of decollectivization in Uzbekistan. Chap. 10 in Kandiyoti,
D. (ed.): The Cotton Sector in Central Asia. Economic Policy and Development
Challenges. The School of Oriental and African Studies, London.
Vasavakul, T., 2006. Agricultural land Management under Doi Moi: Policy makers’ views. Chap.
11 in Marsh, S.P., G. MacAuley and P.V. Hung (eds.) Agricultural Development and
Land Policy in Vietnam. Australian Centre for International Agricultural Research,
Sydney.
Vietnam News, 2005. HCM City looks to diversify cultivation, August 6th
Vietnam News, 20006. Red River farmers make the switch to higher yielding crops, October 16th.
Vietnam News, 2008. Tomatoes yield fortunes for Nam Dinh, August 8th.
Vietnam News, 2009. Rice farming to fit with industry, May 9th.
World Bank, 1998. Vietnam. Advancing Rural Development from Vision to Action. The World
Bank, Washington D.C.

25
TABLES AND FIGURE 1

26
Table 1. Land restricted for rice production, regional and
national level (2006)
(percent of all land for crop agriculture)
North East and North West 17.9
Red river delta 74.9
North Central Coast 40.0
South Central Coast 23.4
Central Highlands 4.9
South East 9.6
Mekong river delta 68.3
Vietnam 35.3 Source: data compiled by the Ministry of Natural Resources and Environment
(MONRE) based on the detailed 2006 National Land Use Plan.
Figure 1. The effect of a crop choice restriction on leisure and income
Source: Authors’ illustration.
PP
A
Leisure (X)
Income (I)
U
Ur PPr
B

27
Table 2. Descriptive statistics
(means, unless otherwise specified)
Variable 2006 2008
Observations
(total)
Plot level1
Crop choice restricted 0.52 0.45* 16,520
Must grow rice 0.48 0.41* 16,520
Has red book (title) 0.74 0.73 16,698
Planted with rice 0.65 0.62 15,879
Irrigated 0.68 0.68 16,698
Rented 0.05 0.05 16,698
Household level
Household size 4.7 4.6 4,029
Age of household head 50.1 51.5* 4,028
Female household head 0.19 0.20* 4,029
Years of schooling, hh
head 5.8 6.2* 4,028
Income from crop
agriculture, '000 VND
(2006 RRD prices,
median)2
3,900 5,819* 3,894
Operated ag. area, sqm.
(median) 3,500 3,309 4,030
Labor supply per working
hh member, days in last
12 months
175 177 4,009
Labor input in crop
agriculture per working
hh member, days in last
12 months
57 61* 4,009
Real farm gate rice price
('000 VND/kg)3 2.6 3.9* 466
1Only plots where crops are grown are included. 2 Income and prices are adjusted for regional differences in price levels, and for region specific
inflation. The base is prices in rural areas of the Red River Delta in 2006 (the 2006 baseline is
calculated from VHLSS 2006, and region-specific inflation from July 2006 to July 2008 is calculated on the basis of data provided by the General Statistics Office (GSO). The income- and
farm size variables are quite strongly skewed to the right, so medians are more informative than
means. 3 Rice- and maize prices are calculated as the average price received by the sampled households
in a commune. The number of observations refers to the number of communes. For communes
where a crop was not traded, the district average is used.
* Denotes that the difference between 2006 and 2008 is significant at the 5 per cent level. Source: Authors’ calculations.

28
Table 3. Crop choice regressions with plot FE, 2006-08
Dep. Variable: Plot planted with rice
Must grow rice 0.144 0.124 0.385
(8.08)*** (7.22)*** (15.33)***
Red book
0.041 0.039
(2.33)** (2.20)**
Irrigated
0.212 0.357
(10.88)*** (14.89)***
Real farm gate rice price, log 0.034 -0.033
(0.72) (0.45)
Years of schooling, hh head -0.001 -0.006
(0.36) (2.94)***
Year = 2008
0.002 0.033
(0.09) (1.06)
Constant 0.569 0.365 0.258
(71.29)*** (8.00)*** (3.59)***
Fixed effects Plot Plot None
R-sq, within 0.05 0.12
R-sq, between 0.41 0.45
R-sq, overall 0.30 0.38 0.40
No. Plots 7,325 7,325 7,325 Absolute value of t statistics in parentheses. Standard errors are adjusted
for clustering at the commune level. * significant at 10%; ** significant at
5%; *** significant at 1%. Source: Authors’ calculations.
Table 4. Stated reasons for crop choice, 2008 (%)
Reason All plots
Plots with restricted crop
choice
Obliged by commune authorities 37.3 80.4
High productivity/high efficiency 40.5 12.0
Plot not suitable for other crops 16.7 6.5
Other 5.5 1.2
N=7,672
Source: Authors’ calculations.

29
Table 5. Restrictions and labor supply, household fixed effects
Dependent variable:
Hh labor supply in crop agriculture
per working household member, log
Total hh labor supply per working
household member, log
Share of land with restrictions 0.098 0.115 0.139 0.100 0.106 0.095
(1.55) (1.85)* (2.82)*** (2.68)*** (2.77)*** (2.91)***
Share of land with red book
-0.071 -0.09
0.102 0.079
(0.96) (1.74)*
(2.32)** (2.19)**
Farmsize in sqm, log
0.249 0.411
0.074 0.033
(5.54)*** (17.69)***
(2.58)** (2.47)**
HH size, log
-0.513 -0.315
0.004 0.103
(5.97)*** (8.08)***
(0.07) (2.97)***
Real farm gate rice price, log
0.08 0.717
0.056 -0.065
(0.40) (4.29)***
(0.48) (0.59)
Years of schooling, hh head
-0.001 0.003
-0.001 0.031
(0.12) -0.65
(0.21) (10.51)***
year_2008 0.068 0.035 -0.207 -0.008 -0.024 0.002
(1.97)** (0.40) (2.63)*** (0.43) (0.49) -0.05
Constant 3.707 2.374 0.107 5.01 4.272 4.412
(110.77)*** (5.46)*** (0.41) (287.22)*** (14.44)*** (23.89)***
Fixed effects Household Household None Household Household None
R-sq, within 0.01 0.05
0.01 0.01
R-sq, between 0.01 0.24
0.01 0.01
R-sq, overall 0.005 0.19 0.25 0.01 0.01 0.06
Observations 3,907 3,906 3,906 4,004 4,004 4,003
Number of household 2,103 2,103 2,103 2,138 2,138 2,138
Absolute value of t statistics in parentheses. Standard errors are adjusted for clustering at the commune level.
* significant at 10%; ** significant at 5%; *** significant at 1%
Source: Authors’ calculations.

30
Table 6. Restrictions and income, household fixed effects
Dependent var: Income from crop production, log
Share of land with restrictions 0.018 0.044 0.054 0.027
(0.31) (0.76) (0.94) (0.61)
Share of land with red book
0.102 0.108 0.099
(1.45) (1.54) (2.31)**
Farmsize in sqm, log
0.478 0.472 0.609
(6.81)*** (6.87)*** (25.76)***
Household labor input in crop production, log 0.175 0.175 0.36
(5.61)*** (5.76)*** (13.81)***
Share of land irrigated
0.045 0.036 0.406
(0.61) (0.50) (7.21)***
Share of land rented in
0.108 0.123 0.255
(0.75) (0.87) (3.13)***
Real farm gate rice price, log
0.546 0.573 0.71
(3.53)*** (3.72)*** (4.85)***
Years of schooling, hh head
0.014 0.012 0.013
(1.78)* (1.47) (3.13)***
Year = 2008 0.348 0.129 0.095 0.036
(12.09)*** (1.97)** (1.42) (0.57)
Share of land with slight slope
-0.061 -0.077
(1.08) (1.58)
Share of land with medium slope
0.004 -0.134
(0.05) (1.90)*
Share of land with steep slope
-0.031 -0.199
(0.16) (1.44)
Share of land class 2
-0.004 -0.042
(0.06) (0.80)
Share of land class 3
-0.12 -0.297
(1.45) (4.44)***
Share of land class 4
-0.054 -0.263
(0.38) (1.88)*
Share of land with unknown category/class
0.09 -0.073
(1.43) (1.26)
Age of head
-0.001 -0.002
(0.24) (2.37)**
Female hh head
0.027 -0.054
(0.21) (1.46)
Constant 8.289 2.813 2.834 0.645
(293.84)*** (4.88)*** (4.92)*** (2.68)***
Fixed effects Household Household Household None
R-sq, within 0.13 0.26 0.26
R-sq, between 0.003 0.65 0.65
R-sq, overall 0.02 0.58 0.58 0.61
Observations 3768 3768 3765 3765
Number of household 2049 2049 2049 2049
Absolute value of t statistics in parentheses. Standard errors adjusted for clustering at the commune level.
* significant at 10%; ** significant at 5%; *** significant at 1%
Source: Authors’ calculations.
31
Table 7. Restrictions and the price of chemical fertilizers
OLS OLS
Share of land with restrictions -0.042 0.004
(1.52) (0.16)
Amount of fertilizer purchased, log -0.104
(11.28)***
Constant 1.275 1.83
(82.35)*** (35.67)***
Fixed effects Commune Commune
Observations 1,647 1,647
R-squared 0.55 0.59 Note: the dependent variable is the unit price of chemical fertilizers, log. Observations with reported prices of fertilizer less than 1,000 VND pr kg are
deemed unrealistic and were set as missing. * significant at 10%; ** significant at 5%; *** significant at 1%.
Source: Authors’ calculations.
Table 8. Restriction and use extension services and irrigation
Dependent variable
Hh used extension
services in last 12
months=1
Share of land
irrigated
Hh dependent on
public or
cooperative
irrigation=1
Share of land with restrictions -0.03 0.171 0.187
(0.86) (8.46)*** (8.12)***
Constant 0.425 0.59 0.552
(23.05)*** (55.37)*** (45.63)***
Fixed effects Commune Commune Commune
Observations 2081 2081 2081
R-squared 0.38 0.65 0.72
Note: All models are estimated with OLS.
* significant at 10%; ** significant at 5%; *** significant at 1%
Source: Authors’ calculations.

32
Table 9. Restrictions, hybrid seeds and the number of cropping seasons
Must grow rice in at least some seasons 0.077 0.076
(5.15)*** (5.18)***
Number of rice harvests in last 12 months 0.085
(9.15)***
Constant 0.297 0.144
(45.58)*** (8.07)***
Fixed effects Household Household
Observations 6,205 6,205
R-squared 0.92 0.92 Note: The dependent variable is whether the household used hybrid seeds in at least one season in the last
12 months All models are estimated with OLS. Only plots planted with rice in at least some seasons are
included.
* significant at 10%; ** significant at 5%; *** significant at 1%
Source: Authors’ calculations.