Embed Size (px)
Citation preview

The Food Price Increase of 2010–2011: Causes and Impacts
Publication No. 2013-02-E 16 January 2013
Aïcha L. Coulibaly
Industry, Infrastructure and Resources Division Parliamentary Information and Research Service

The Food Price Increase of 2010–2011: Causes and Impacts (Background Paper)
Library of Parliament Background Papers provide in-depth studies of policy issues. They feature historical background, current information and references, and many anticipate the emergence of the issues they examine. They are prepared by the Parliamentary Information and Research Service, which carries out research for and provides information and analysis to parliamentarians and Senate and House of Commons committees and parliamentary associations in an objective, impartial manner. Publication No. 2013-02-E Ottawa, Canada, Library of Parliament (2013)
HTML and PDF versions of this publication are available on IntraParl (the parliamentary intranet) and on the Parliament of Canada website.
In the electronic versions, a number of the endnote entries contain
hyperlinks to referenced resources.
Ce document est également publié en français.

LIBRARY OF PARLIAMENT i PUBLICATION NO. 2013-02-E
CONTENTS
1 INTRODUCTION ............................................................................................... 1
2 ANALYSIS OF CHANGES IN FOOD PRICES ..................................................... 1
2.1 Reasons for Referring to the FAO Food Price Index .......................................... 1
2.2 Changes in Food Prices from 1990 to 2011 ...................................................... 2
3 CAUSES OF THE 2010–2011 RISE IN CEREAL PRICES.................................... 3
3.1 Imbalance in Cereal Supply and Demand ......................................................... 3 3.1.1 Factors Affecting Demand ......................................................................... 4
3.1.1.1 Dietary Changes .................................................................................. 4 3.1.1.2 Increased Ethanol Production ............................................................... 4
3.1.2 Factors Affecting Supply ........................................................................... 5 3.1.2.1 Extent of Agricultural Land .................................................................... 5 3.1.2.2 Weather Conditions .............................................................................. 5
3.2 The Effect of Macroeconomic Variables ........................................................... 6 3.2.1 Exchange Rates ....................................................................................... 6 3.2.2 Oil Prices ................................................................................................. 6
3.3 Speculation .................................................................................................... 6
4 IMPACTS OF FOOD PRICE INCREASES ON CERTAIN POPULATIONS ........................................................................... 7
4.1 Increased Poverty and Food Insecurity............................................................. 7
4.2 Riots .............................................................................................................. 7
4.3 Increased Income for Net Exporter Countries ................................................... 8
5 CONCLUSION .................................................................................................. 9

LIBRARY OF PARLIAMENT 1 PUBLICATION NO. 2013-02-E
THE FOOD PRICE INCREASE OF 2010–2011: CAUSES AND IMPACTS
1 INTRODUCTION
In February 2011, the Food and Agriculture Organization of the United Nations (FAO) reported a 6.5% increase in its Food Price Index relative to December 2010.1 The Index had reached a level not seen in nearly 20 years and had surpassed the peak attained in June 2008 that explained that year’s food crisis.2
Despite this marked increase in the Food Price Index in 2011, the FAO did not allude to a food crisis.3 Yet, according to some analysts, the increase in the price of foodstuffs and the difficulty people had in obtaining food caused the popular uprisings of the “Arab Spring”4
and led to riots in some developing countries.5 It is not surprising, then, that the G20 heads of state placed great importance on agricultural commodity prices in 2011.6
The goal of this paper is to describe the factors that likely sparked the increase in food prices as well as the effect of that increase on the food security of some of the world’s population.
The paper begins with an analysis of the changes in food prices since 1990, then it demonstrates that the food price increase on world markets in 2010–2011 stemmed from structural and macroeconomic factors and from speculation. Finally, the paper shows that price increases can have a negative impact on people in some developing countries, while benefitting exporters.
2 ANALYSIS OF CHANGES IN FOOD PRICES
The FAO Food Price Index shows that, over the last decade, food prices have followed a generally upward trend despite some fluctuations caused by price volatility.
2.1 REASONS FOR REFERRING TO THE FAO FOOD PRICE INDEX
Used by the FAO since 1990 to track the prices of foodstuffs, the FAO Food Price Index is a composite index that records monthly changes in international prices for a given basket of goods. It consists of the average of the price indices for five product categories: cereals, oils and fats, dairy products, meat, and sugar. Weighted according to the average export shares of each of these categories between 2002 and 2004, the indices for the categories are calculated using the average of various world prices (55 quotations). The indices are selected according to product category and main market participants.7
Other intergovernmental organizations have established their own indices to measure foodstuff prices; the most cited indices in the media are those of the International Monetary Fund (IMF) and the World Bank. While the IMF index primarily tracks products traded by advanced economies, the World Bank index concentrates

THE FOOD PRICE INCREASE OF 2010–2011: CAUSES AND IMPACTS
LIBRARY OF PARLIAMENT 2 PUBLICATION NO. 2013-02-E
on those traded by developing countries. The FAO Food Price Index, on the other hand, takes into account the various prices of products bought and sold worldwide, in both developed and less developed economies.8 It is for this reason that the FAO Food Price Index is the reference index in this publication.
2.2 CHANGES IN FOOD PRICES FROM 1990 TO 2011
The value of the FAO Food Price Index was relatively low from 1990 to 2003 (see Figure 1). During that time, the Index varied between 85.2 points (May 2002) and 137.3 points (May 1996). It began to rise gradually in early 2004, reaching 224.4 points in June 2008. The Index subsequently plunged to 141.3 points in February 2009 before rising again from June 2010 to February 2011, when it reached 237.9 points, or 6% above the previous peak of June 2008.
Figure 1 – Change in the FAO Food Price Index, 1990–2011
Source: Figure prepared by the author using data obtained from FAO, “FAO Food Price Index,”
World Food Situation.
Figure 1 also shows the more pronounced fluctuations in food prices beginning in late 2006. These are due to the growing volatility in food prices experienced from 2006 to 2011.9 Some studies have shown that price volatility, with its price increases and price decreases, contributes to uncertainty, which in turn puts certain market stakeholders, like farmers and consumers, at economic risk.10 It is the price increase element of price volatility that can affect the short-term purchasing power of market stakeholders, and so lead to some of the impacts discussed in this paper. For that reason, this paper will focus only on food price increases in its presentation of the situation in 2010 and 2011.
The food price increase of early 2011 was mainly due to the increase in the price of cereals, which rose by 35% (see Figure 2).
80
100
120
140
160
180
200
220
240
260
Food
Pric
e In
dex

THE FOOD PRICE INCREASE OF 2010–2011: CAUSES AND IMPACTS
LIBRARY OF PARLIAMENT 3 PUBLICATION NO. 2013-02-E
Figure 2 – Changes in Food Price Indices, 2010–2011
Source: Figure prepared by the author using data obtained from FAO, “FAO Food Price Index,”
World Food Situation.
The next section deals with the factors that caused the increase in the price of cereals. One of the primary exports of developed countries, cereals make up a significant part of the diet of people in developing countries. For that reason, they have a profound effect on the well-being of the world’s population. In fact, the FAO uses global cereal inventories as indicators of global food security.11
3 CAUSES OF THE 2010–2011 RISE IN CEREAL PRICES
The literature on food price increases identifies a number of factors that could explain the cereal price increase of 2010–2011. Some, structural in nature, create an imbalance in supply and demand; others are macroeconomic factors related to exchange rates and oil prices. These factors are in fact similar to those that caused the price increase of June 2008.12
3.1 IMBALANCE IN CEREAL SUPPLY AND DEMAND
The price of a commodity is determined by the interplay between supply and demand. Anything that affects either of these two parameters has repercussions on the price of the commodity.
100
150
200
250
300
350
400
450Pr
ice
Inde
x
Meat Dairy productsCereals Oils and fatsSugar

THE FOOD PRICE INCREASE OF 2010–2011: CAUSES AND IMPACTS
LIBRARY OF PARLIAMENT 4 PUBLICATION NO. 2013-02-E
3.1.1 FACTORS AFFECTING DEMAND
3.1.1.1 DIETARY CHANGES
The increased demand from developing countries for meat products 13 was one of the causes of the increase in cereal prices. Developing countries’ growing populations (which were estimated to be 1.25% larger in 2010 than in 2009)14 and rising incomes (their gross domestic product was 7.6% higher in 2010 than in 2009)15 boosted the their inhabitants’ demand for meat products, which in turn increased their demand for imported meat by 6.5%.16 Since additional livestock production requires more cereals for animal feed17 (particularly corn, wheat, barley and soy), cereal prices came under upward pressure.
3.1.1.2 ETHANOL PRODUCTION
The United States and Brazil are the principal producers of ethanol, together responsible for 87.1% of global production in 2011.18 Brazil uses sugar cane to produce its ethanol, and the United States uses mainly corn.
The environmental regulations passed by the United States in 2005, which led to the replacement of methyl tertiary butyl ether with ethanol in conventional fuel, resulted in increased American production of ethanol. Some researchers have also attributed this increase to subsidies and the imposition of import tariffs.19
In the United States, about one metric ton of corn produces 400 litres of ethanol. Over time, the increase in ethanol production created a downward pressure on corn availability, which resulted in higher corn prices in the United States (see Figure 3). The United States was the world’s largest exporter of corn in 2011–2012, with a 37.2% share.20 Since the United States is not a small country, according to international economic theory, it influences world prices by passing along the domestic price increase to world markets.21

THE FOOD PRICE INCREASE OF 2010–2011: CAUSES AND IMPACTS
LIBRARY OF PARLIAMENT 5 PUBLICATION NO. 2013-02-E
Figure 3 – Changes in the Demand for Corn for Ethanol and in the Price of Corn Received by United States Farmers, 1990–2012
Note: Data for the 2011–2012 year are estimated.
Source: Figure prepared by the author using data obtained from United States Department of Agriculture, Economic Research Service, Feed Grains: Yearbook Tables, Tables 9 and 31.
3.1.2 FACTORS AFFECTING SUPPLY
3.1.2.1 EXTENT OF AGRICULTURAL LAND
The total area of agricultural land worldwide – about 4.6 billion hectares22 – has increased only slightly in recent decades (8% from 1967 to 2007). Furthermore, devoting more land to growing cereals for animal feed or ethanol production has reduced the area used to grow cereals for food, thereby shrinking the amount produced for people. This reduction in supply coupled with world population growth has driven up the price of cereals for human consumption.
3.1.2.2 WEATHER CONDITIONS
In the summer of 2010, Russia, Ukraine and Kazakhstan were hit by a drought that reduced wheat yields by approximately 27%, 19% and 35% respectively compared with the summer of 2009. Since these three nations account for about 14% of production and 27% of global exports, these declines affected global export supplies and therefore contributed to higher wheat prices.23
50
70
90
110
130
150
170
190
210
230
250
0
20
40
60
80
100
120
140
US$
per m
etric
ton
Mill
ions
of m
etric
tons
Demand for corn for ethanol Price of corn received by farmers
THE FOOD PRICE INCREASE OF 2010–2011: CAUSES AND IMPACTS
LIBRARY OF PARLIAMENT 6 PUBLICATION NO. 2013-02-E
3.2 THE EFFECT OF MACROECONOMIC VARIABLES
3.2.1 EXCHANGE RATES
A positive relationship has been established between the price of cereals, especially corn and wheat, and U.S. dollar exchange rates. Generally speaking, cereals are bought and sold in U.S. dollars because of the size of global corn and wheat exports from the United States. As a result, an appreciation of the U.S. dollar leads to increases in the price of cereals on the world market.
3.2.2 OIL PRICES
Higher oil prices affect the price of cereals because certain agricultural activities, such as the production and application of pesticides and fertilizers and the use of agricultural machinery, use a great deal of energy.24 The cost of these inputs makes up a significant share of the variable cost of producing cereals like corn and wheat.25
Oil prices also affect cereal prices because cereals are used to produce ethanol, a petroleum substitute.26 When oil prices rise, fuel blenders replace some petroleum with ethanol. This increases the demand for, price of and production of ethanol, which in turn boosts the demand for and price of corn.27
3.3 SPECULATION
While they do not all agree, some experts and political representatives believe that the supply of and demand for cereals have also suffered the effects of speculation.28 A 2011 study showed a positive correlation between stock market values and the price of food in the wake of the U.S. real estate market collapse. The study also showed a positive correlation between the 2008 financial crisis and the spike in food prices.
According to this view, the relationship between stock transactions and the rise in food prices results from investors turning to other markets, and particularly the agricultural commodities futures market, following the U.S. real estate market crash. These substantial investments were made possible by the Commodity Futures Modernization Act, a U.S. law passed in 2000. By liberalizing commodities markets, this law authorized speculation in unregulated markets.29
Finally, it is worth noting that the various causes of the cereal price increase had different degrees of influence. The results of the studies on this issue do not help determine the relative importance of these factors. Some of them point to biofuels and oil prices as the key causes; others cite biofuels and speculation. Still others demonstrate that all of the causes listed in this section played a role in the cereal price increase.30

THE FOOD PRICE INCREASE OF 2010–2011: CAUSES AND IMPACTS
LIBRARY OF PARLIAMENT 7 PUBLICATION NO. 2013-02-E
4 IMPACTS OF FOOD PRICE INCREASES ON CERTAIN POPULATIONS
When an increase in world prices is transmitted to local markets, it can have negative consequences for the people and the political stability of some developing countries.
4.1 INCREASED POVERTY AND FOOD INSECURITY
Although the number of people living below the poverty line declined between 1981 and 2008, 43% of the world’s population still lived on less than two dollars a day31 and devoted up to 60% of their income to food in 2008.32 Increases in food prices can harm people in these circumstances because the increases heighten their precarious economic situation by reducing their purchasing power and undermining their food security.33
The commonly accepted definition of “food security,” agreed on at the 1996 World Food Summit, is as follows:
Food security exists when all people, at all times, have physical and economic access to sufficient, safe and nutritious food that meets their dietary needs and food preferences for an active and healthy life. 34
Food security thus implies a balance between the various elements set out in the above definition – purchasing power, available food, access to food and food utilization that provides for a healthy diet and sustainable food supplies. One of the factors that can disrupt this balance is the price at which local populations can buy food.
The Asian Development Bank has run various simulations of food price increases, which have shown that in countries like the Philippines and Pakistan, a 20% rise in prices would increase the number of people in poverty by between 6 million and 15 million; a 30% rise would increase the number of people in poverty by between 9 million and 22 million.35 In sub-Saharan African countries, this figure rises to 30 million people on average.36 Estimates also show that a 50% increase in the price of corn would lead to a decline in corn consumption of between 8.5% and 15.6% in certain southern African countries.37
4.2 RIOTS
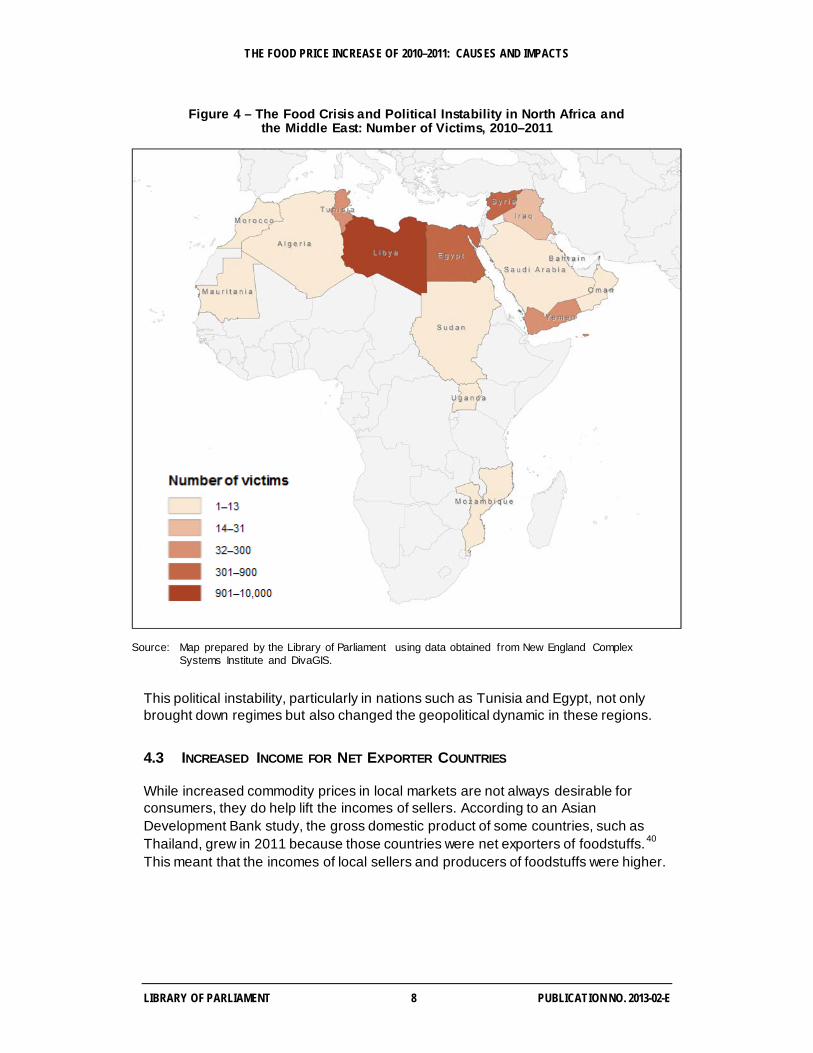
In addition to their consequences for poverty and food security, food price increases can affect political stability. One study has shown that the food price increase of 2010–2011 were a contributing factor in the riots that took place in some developing countries.38 These riots brought about many deaths (see Figure 4) and were among the causes of the political instability in certain North African countries (including the “Arab Spring”) and the Middle East.39
THE FOOD PRICE INCREASE OF 2010–2011: CAUSES AND IMPACTS
LIBRARY OF PARLIAMENT 8 PUBLICATION NO. 2013-02-E
Figure 4 – The Food Crisis and Political Instability in North Africa and the Middle East: Number of Victims, 2010–2011
Source: Map prepared by the Library of Parliament using data obtained from New England Complex
Systems Institute and DivaGIS.
This political instability, particularly in nations such as Tunisia and Egypt, not only brought down regimes but also changed the geopolitical dynamic in these regions.
4.3 INCREASED INCOME FOR NET EXPORTER COUNTRIES
While increased commodity prices in local markets are not always desirable for consumers, they do help lift the incomes of sellers. According to an Asian Development Bank study, the gross domestic product of some countries, such as Thailand, grew in 2011 because those countries were net exporters of foodstuffs.40 This meant that the incomes of local sellers and producers of foodstuffs were higher.
THE FOOD PRICE INCREASE OF 2010–2011: CAUSES AND IMPACTS
LIBRARY OF PARLIAMENT 9 PUBLICATION NO. 2013-02-E
5 CONCLUSION
The food price increase of 2010–2011 was caused by a range of factors similar to those that brought about the food crisis of 2007–2008, including changing diets in developing countries, ethanol production, the limited increase in the surface area of land devoted to agricultural use, weather conditions, exchange rates, oil prices, and speculation.
When commodity price increases hit local markets, they reduce consumer purchasing power and can compromise the food security of people with unstable incomes. Higher prices also contribute to social unrest, such as the events of the Arab Spring in Tunisia and Egypt in 2011, and disrupt countries’ political stability and geopolitical relations in affected regions.
However, increases in food prices also have a positive effect. Net exporters of foodstuffs benefit from higher incomes.
In this context, it is important to reflect on the types of measures that must be taken to fulfill the interests of all those concerned, as well as on the efficiency of such measures in an economic crisis.
NOTES
1. Food and Agriculture Organization of the United Nations [FAO], FAO Food Price Index, 12 June 2012.
2. The FAO uses the analysis template of the Integrated Food Security Phase Classification (IPC) to differentiate between food security, food insecurity, a food crisis, a humanitarian emergency and a famine. According to the template, a food crisis exists when the following conditions are present: lack of guaranteed access to food, acute dietary diversity deficit and limited spread, low-intensity conflict. (The IPC analysis template can be found in Integrated Food Security Phase Classification (IPC) Global Partners, Table 1, “IPC Reference Table,” Integrated Food Security Phase Classification: Technical Manual, Version 1.1, Rome, FAO, 2008, p. 4.)
3. FAO, “No food crisis seen, but greater market stability needed,” 7 September 2010.
4. Marco Lagi, Karla Z. Bertrand and Yaneer Bar-Yam, The Food Crises and Political Instability in North Africa and the Middle East, New England Complex Systems Institute, 28 September 2011.
5. While the price increase was a trigger for the riots, other factors also played an important role, including poverty, high unemployment and the unequal distribution of wealth.
6. G20 Agriculture Ministers, Action Plan on Food Price Volatility and Agriculture, Ministerial Declaration, Paris, 22–23 June 2011.
7. FAO (2012).

THE FOOD PRICE INCREASE OF 2010–2011: CAUSES AND IMPACTS
LIBRARY OF PARLIAMENT 10 PUBLICATION NO. 2013-02-E
8. The International Monetary Fund and the World Bank agricultural commodity price indices track six types of products: oils, cereals, meat, sugar, seafood and fruits. They are composite indices weighted according to each commodity type’s share of world exports between 2002 and 2004. See International Monetary Fund, Table 1a, “Indices of Primary Commodity Prices, 2003–2013,” Indices of Primary Commodity Prices, 2002–2012, accessed 14 January 2013; and World Bank, Table 4, “World Bank Commodity Price Index Weights,” Commodity Price Forecast Update, 15 January 2013.
9. Price volatility comprises two factors, the increase or decrease in prices and the period over which the changes occur.
10. High Level Panel of Experts on Food Security and Nutrition [HLPE], Price volatility and food security, Rome, July 2011, p. 23; and FAO et al., Price Volatility in Food and Agricultural Markets: Policy Responses, June 2011, p. 9.
11. Momagri (Mouvement pour une organisation mondiale de l’agriculture), “La sécurité alimentaire: un enjeu politique d’actualité” [Available in French only].
12. FAO et al. (2011).
13. Countries classified as low income, lower middle income and upper middle income using the World Bank classification system. See World Bank, “Countries and Economies,” Data.
14. Author’s calculations based on data from World Bank, World Development Indicators and Global Development Finance (population growth and gross domestic product in constant dollars).
15. Ibid.
16. Percentages calculated using data from United States Department of Agriculture, Economic Research Service, Feed Grains: Yearbook Tables, Tables 15, 16 and 17.
17. Feed efficiency measures the volume of feed required to produce a kilogram of animal meat. It averages 5 for beef and 2.68 for pork. These ratios are calculated using data from Manitoba Agriculture, Food and Rural Initiatives, “Budget Guidelines and Guidelines for Estimating Costs of Production,” Cost of Production.
18. Author’s calculations based on data from Renewable Fuels Association, Accelerating Industry Innovation: 2012 Ethanol Industry Outlook, Washington, D.C.
19. Rosamond L. Naylor and Walter P. Falcon, “Food Security in an Era of Economic Volatility,” Population and Development Review, Vol. 36, No. 4, December 2010.
20. Author’s calculations based on data from United States Department of Agriculture, Foreign Agricultural Service, Production, Supply and Distribution Online.
21. Jean-Pierre Ponssard, Concurrence internationale, croissance et emploi: Théories économiques et expériences industrielles, “Dynamiques d’entreprises” collection, L’Harmattan, Paris, 1997.
22. United States Department of Agriculture, Foreign Agricultural Service, Production, Supply and Distribution Online.
23. Naylor and Falcon (2010); and World Bank, Poverty Reduction and Equity Group, Food Price Watch, August 2011.
24. Naylor and Falcon (2010).
25. Wen-Yuan Huang, William D. McBride and Utpal Vasavada, “Recent Volatility in U.S. Fertilizer Prices: Causes and Consequences,” Amber Waves, Economic Research Service, United States Department of Agriculture, Vol. 7, No. 1, March 2009.
26. The energy content of ethanol is lower than that of oil.
THE FOOD PRICE INCREASE OF 2010–2011: CAUSES AND IMPACTS
LIBRARY OF PARLIAMENT 11 PUBLICATION NO. 2013-02-E
27. Hayes et al., “Biofuels: Potential Production Capacity, Effects on Grain and Livestock Sectors, and Implications for Food Prices and Consumers,” Journal of Agricultural and Applied Economics, Vol. 41, No. 2, August 2009; and Naylor and Falcon (2010).
28. Marco Lagi et al., The Food Crises: A quantitative model of food prices including speculators and ethanol conversion, New England Complex Systems Institute, 21 September 2011; Olivier De Schutter, United Nations Special Rapporteur on the Right to Food, Food Commodities Speculation and Food Price Crises, Briefing Note 02, Brussels, September 2010; and United States Senate, Permanent Subcommittee on Investigations, Excessive Speculation in the Wheat Market, 24 June 2009.
29. HLPE (2011), p. 27. This law had been passed by the Government of the United States following the stock market crash of 1929 and the Great Depression of the 1930s to limit the undesirable effects of unfettered speculation.
30. Lagi et al. (2011).
31. Observatoire des inégalités, La pauvreté dans le monde, 14 May 2012.
32. Naylor and Falcon (2010).
33. HLPE (2011).
34. FAO, Food Security, Policy Brief, June 2006, quoting a statement from the World Food Summit, 1996.
35. Asian Development Bank, Soaring Food Prices: Response to the Crisis, 2008.
36. Quentin Wodon and Hassan Zaman, Rising Food Prices in Sub-Saharan Africa: Poverty Impact and Policy Responses, Policy Research Working Paper No. 4738, World Bank Human Development Network and Poverty Reduction and Economic Management Network, October 2008.
37. George Rapsomanikis, The 2007–2008 food price swing: Impact and policies in Eastern and Southern Africa, FAO Commodities and Trade Technical Paper 12, Rome, 2009.
38. Marc Bellemare, Rising Food Prices, Food Price Volatility and Political Unrest, 28 June 2011.
39. Lagi, Bertrand and Bar-Yam (2011).
40. Asian Development Bank, Global Food Price Inflation and Developing Asia, March 2011.