Embed Size (px)
DESCRIPTION
Citation preview
1

Acknowledgements We extend our deepest gratitude to Dr. Osvaldo F. Canziani, former Co-Chair of Working Group II, Intergovernmental Panel on Climate Change, for his thoughtful guidance, direction and contributions which made the production of this report possible.
We would like to thank Marshall Hoffman, President of FEU-US; Gabriel Juricich, President of FEU; and Emilio Hisas, for their continuous support throughout the process of producing this report. Lastly, we also extend our thanks to Claudia Solari ([email protected]) for the cover design. Author Liliana Hisas Executive Director, FEU-US
About FEU-US
Universal Ecological Fund (Fundación Ecológica Universal FEU-US), a non-profit, non-governmental organization, seeks to increase awareness that encourages actions on sustainable development issues through researching, analyzing, producing and disseminating information. We believe in the need for a more equitable society, especially for those living under underprivileged circumstances. Established in 2005, FEU-US is the US subsidiary of Fundación Ecológica Universal (FEU), founded in Buenos Aires, Argentina in 1990.
Universal Ecological Fund (Fundación Ecológica Universal FEU-US) 2308 Mount Vernon Avenue, Suite 759 Alexandria, VA 22130, USA E-mail: [email protected]
ISBN: 978-0-9831909-0-5 January, 2011
The Impacts of Climate Change on Food Production: A 2020 Perspective - i
About this Report For the last 20 years, scientists at the Intergovernmental Panel on Climate Change (IPCC) have been assessing the scientific, technical and socio-economic information relevant for the understanding of the risk of climate change. These assessments are published in comprehensive Assessment Reports, which serve as a basis for policy-makers. For the last two decades, world leaders have been discussing how to achieve the “stabilization of greenhouse gas concentrations in the atmosphere at a level that would prevent dangerous anthropogenic (man-made) interference with the climate system1”. These discussions are held annually, at the Conference of the Parties of the United Nations Framework Convention on Climate Change (UNFCCC). Despite overwhelming scientific evidence, and efforts by the international community, not much has changed in the last two decades. Greenhouse gas emissions are steadily rising. If this trend continues, the adverse effects of climate change will be exacerbated. A Different Approach Climate change is advancing much faster than anticipated. Many reasons could be attributed to this –consumption patterns and increasing demands of a growing population, among many others, which are rising greenhouse gas emissions. One reason, however, can be attributed to the lack of full understanding of climate change. Scientific information is usually not easy to understand. Communicating climate change is often also complicated. As a result, the understanding of climate change has led to misconceptions. For many, climate change is solely an environmental issue –abstract, intangible and distant. However, climate change is also a development and economic issue; it is a social issue as well. Climate change is a complex inter-relation between various components. Simply put, the climate change issue is the result of a combination of factors, including environmental, economic, social and technological issues, all of which have an impact on the global environment. The purpose of this report is to address the need for a simplified way to present and explain the linkages between climate change and the various components. To achieve this goal, this report was developed under the following guiding principles:
1. The analysis is based on the scientific evidence and conclusions from the IPCC Fourth Assessment Report (AR4).
1 United Nations Framework Convention on Climate Change (UNFCCC), Article 2
The Impacts of Climate Change on Food Production: A 2020 Perspective - ii
The latest IPCC Assessment Report was published in 2007, presenting the scientific view on the current state of knowledge on climate change. “For their efforts to build up and disseminate greater knowledge about man-made climate change, and to lay the foundations for the measures that are needed to counteract such change” the IPCC was honored with the Nobel Peace Prize that same year.
2. The analysis uses the business-as-usual path the world is currently following.
The IPCC developed a set of scenarios2 to project the long-term impacts of climate change. These scenarios are a combination of demographic, social, economic and technological components, which use the end of the 21st century as a target.
After analyzing in detail each of these scenarios, none of them considers the path the world is currently following. Thus, the selection of the current business-as-usual path for the analysis.
3. The assessment of the impacts of climate change is based on a short-term target. Thus, the selection of 2020 as the target year.
Some key data was updated, and current levels of growth were considered (e.g.: emission levels, population) to estimate projections for the next decade. Also, concrete figures (e.g.: global food production and consumption) were included to better reflect the projected impacts.
The sources used to meet the information update requirements were publications from United Nations organizations, namely the World Meteorological Organization (WMO), the Food and Agriculture Organization (FAO), the Population Division of the Department of Economic and Social Affairs of the United Nations Secretariat, the United Nations Children's Fund (UNICEF), the World Health Organization (WHO) and The World Bank. All sources for each citation are included as footnotes.
In addition, human beings are at the core of this publication. Without putting a human face to it, climate change may continue to be perceived as an abstract issue. It is not. We hope the information contained in this report will contribute to a better understanding and increased awareness of climate change and its impacts. We believe that an increased understanding would translate into actions that lead to the adoption of concrete measures and appropriate policies towards a more sustainable and equitable future.
2 Special Report on Emission Scenarios (SRES), IPCC, 2000
The Impacts of Climate Change on Food Production: A 2020 Perspective - iii
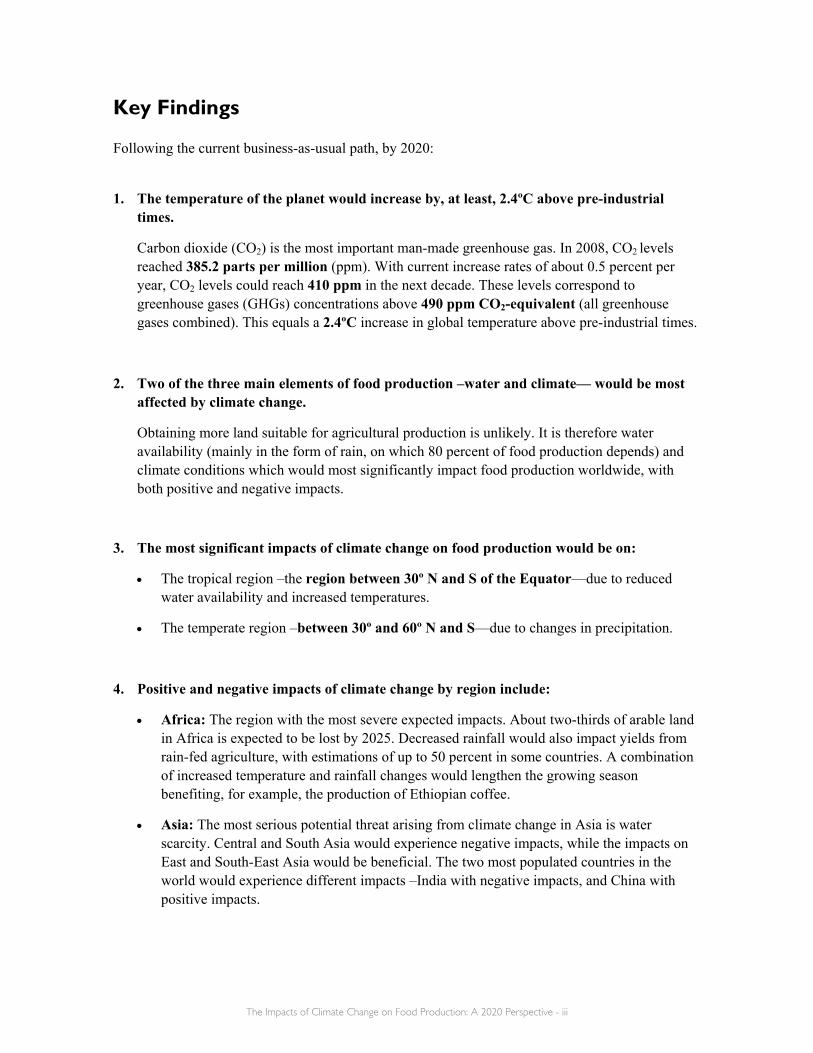
Key Findings Following the current business-as-usual path, by 2020:
1. The temperature of the planet would increase by, at least, 2.4ºC above pre-industrial
times.
Carbon dioxide (CO2) is the most important man-made greenhouse gas. In 2008, CO2 levels reached 385.2 parts per million (ppm). With current increase rates of about 0.5 percent per year, CO2 levels could reach 410 ppm in the next decade. These levels correspond to greenhouse gases (GHGs) concentrations above 490 ppm CO2-equivalent (all greenhouse gases combined). This equals a 2.4ºC increase in global temperature above pre-industrial times.
2. Two of the three main elements of food production –water and climate— would be most affected by climate change.
Obtaining more land suitable for agricultural production is unlikely. It is therefore water availability (mainly in the form of rain, on which 80 percent of food production depends) and climate conditions which would most significantly impact food production worldwide, with both positive and negative impacts.
3. The most significant impacts of climate change on food production would be on:
• The tropical region –the region between 30º N and S of the Equator—due to reduced water availability and increased temperatures.
• The temperate region –between 30º and 60º N and S—due to changes in precipitation.
4. Positive and negative impacts of climate change by region include:
• Africa: The region with the most severe expected impacts. About two-thirds of arable land in Africa is expected to be lost by 2025. Decreased rainfall would also impact yields from rain-fed agriculture, with estimations of up to 50 percent in some countries. A combination of increased temperature and rainfall changes would lengthen the growing season benefiting, for example, the production of Ethiopian coffee.
• Asia: The most serious potential threat arising from climate change in Asia is water scarcity. Central and South Asia would experience negative impacts, while the impacts on East and South-East Asia would be beneficial. The two most populated countries in the world would experience different impacts –India with negative impacts, and China with positive impacts.
The Impacts of Climate Change on Food Production: A 2020 Perspective - iv
• Europe: Climate-related increases in crop yields, of about 5 percent in wheat, are expected mainly in northern Europe; while the largest reductions of all crops, of up to 10 percent, are expected in the Mediterranean region.
• Latin America and the Caribbean: Overall yield production of wheat, rice, maize, and soybean is estimated to decrease by 2.5 to 5 percent. The impact of climate change in Latin America’s productive sectors is estimated to be a 1.3 percent reduction in the region’s GDP for an increase of 2°C in global temperature
• Northern America: Overall, decreased precipitation will create important problems for the United States, restricting the availability of water for irrigation and at the same time increasing water demand for irrigated agriculture. This would affect in particular the western region of the United States; some yield increases are expected in the Great Plains.
• Oceania: As a result of reduced precipitation, water security problems are very likely to intensify, and change land use away from drier areas. This would negatively affect Australia in particular, the major food producing country in the region.
5. The amount of food estimated to be produced in the next decade would not be enough to meet the food requirements of an additional 890 million people estimated to inhabit the world in the next decade.
Current production figures for the four major food crops –wheat, rice, maize and soybean—were analyzed, and projections made based on the estimated population growth, to determine the demand for food for the next decade. When taking into account the impacts of climate change on these crops, results show that by 2020:
• Global wheat production vs. demand: 14 percent deficit
Countries with expected increase in production: China, United States, Canada and Argentina.
Countries with expected decrease in production: India, Egypt, Russian Federation, Ukraine, Italy, Pakistan, France, Germany, Iran, Romania, Australia, Turkey, United Kingdom, Kazakhstan, Poland and Spain.
• Global rice production vs. demand: 11 percent deficit
Countries with expected increase in production: China, United States, Indonesia, Vietnam, Philippines, Japan, Thailand, Myanmar, Cambodia, Republic of Korea, Lao Peoples Democratic Republic.
Countries with expected decrease in production: India, Brazil, Egypt, Nigeria, Pakistan, Bangladesh, Nepal, Sri Lanka, Madagascar
• Global maize production vs. demand: 9 percent deficit
Countries with expected increase in production: China, United States, Indonesia, Canada and Philippines.

The Impacts of Climate Change on Food Production: A 2020 Perspective - v
Countries with expected decrease in production: India, Brazil, Egypt, Nigeria, Russian Federation, Ukraine, Italy, Argentina, France, Germany, Romania, South Africa, Mexico, Hungary and Serbia.
• Global soybean production vs. demand: 5 percent surplus
Countries with expected increase in production: China, United States, Indonesia, Brazil, Canada, Argentina, Vietnam, Japan, Serbia, Paraguay, Bolivia, Uruguay and Democratic People's Republic of Korea.
Countries with expected decrease in production: India, Nigeria, Russian Federation, Ukraine, Italy, Iran and South Africa.
6. As a result of decreased availability of food, prices could increase up to 20 percent. The inevitable consequence would be the increase in the share of hunger, which could reach one in every five people.
The current level of undernourishment in the world is 1 billion people –one in every seven is hungry today. Currently, about 6.5 million children under five die every year of malnutrition and hunger-related diseases –about 18,000 deaths a day.
Within the next decade, these figures could almost double, reaching one in every five people being hungry. At least every other newborn in Africa; one in every four newborns in Asia; and one in every seven newborns in Latin America and the Caribbean would be sentenced to undernourishment and malnutrition.
Concrete actions to address the impacts of climate change on food production include:
7. Reduce GHG emissions
Reducing GHG emissions is the first and most important step. Efforts so far have been numerous, but unsuccessful. The annual meetings among world leaders and negotiators at the United Nations Framework Convention on Climate Change (UNFCCC) failed to produce a formal agreement to reduce GHG emissions.
Global GHG emissions have already exceeded the levels projected by the IPCC as the safe upper limit, which would increase the global temperature by 1ºC. Thus, currently, global GHG emissions are steadily increasing to a level which would be dangerous –more than 2ºC.
The IPCC concluded that developed countries as a group –responsible for almost 50 percent of the global GHG emissions—would need to reduce their emissions by 2020 in the range of 25 to 40 percent below 1990 levels.
The commitments made through the Copenhagen Accord (2009) were reaffirmed by the Cancun Agreements (2010). No formal agreement, however, was reached to reduce GHG emissions. Also, consensus was reached by industrialized countries to provide $30 billion for the period 2010-2012 and to jointly mobilize $100 billion per year by 2020 to assist developing
The Impacts of Climate Change on Food Production: A 2020 Perspective - vi
countries to implement actions against climate change; but no financial commitments were made.
8. Adapt to climate change
The implementation of measures to cope with climate change, including two main categories:
• Actions which adjust practices and processes including, among others, altering the timing of and relocating crops and livestock activities and more effective use of water in areas with rainfall decreases.
The benefits of adaptation vary with crops and across regions and temperature changes; however, on average, they provide approximately a 10 percent yield benefit when compared with yields when no adaptation is used.
• Effective planning for adaptation to climate change –deliberate, planned measures to ‘mainstream’ climate change into policies, to create and strengthen favorable conditions for effective adaptation and investment in new technologies and infrastructure.
9. Change dietary habits
Trends in food consumption for the last two decades may change by 2020 to cope with the decrease in food production due to climate change. To maintain a balanced and healthy diet, and sustain the shares of food sources, some of the changes in dietary habits may include:
• Cereal consumption for food may shift to roots and tubers (e.g.: potatoes, sweet potatoes)
• The consumption of alternative sources of protein may increase, in particular of legumes (e.g.: beans, lentils)
The Impacts of Climate Change on Food Production: A 2020 Perspective - vii
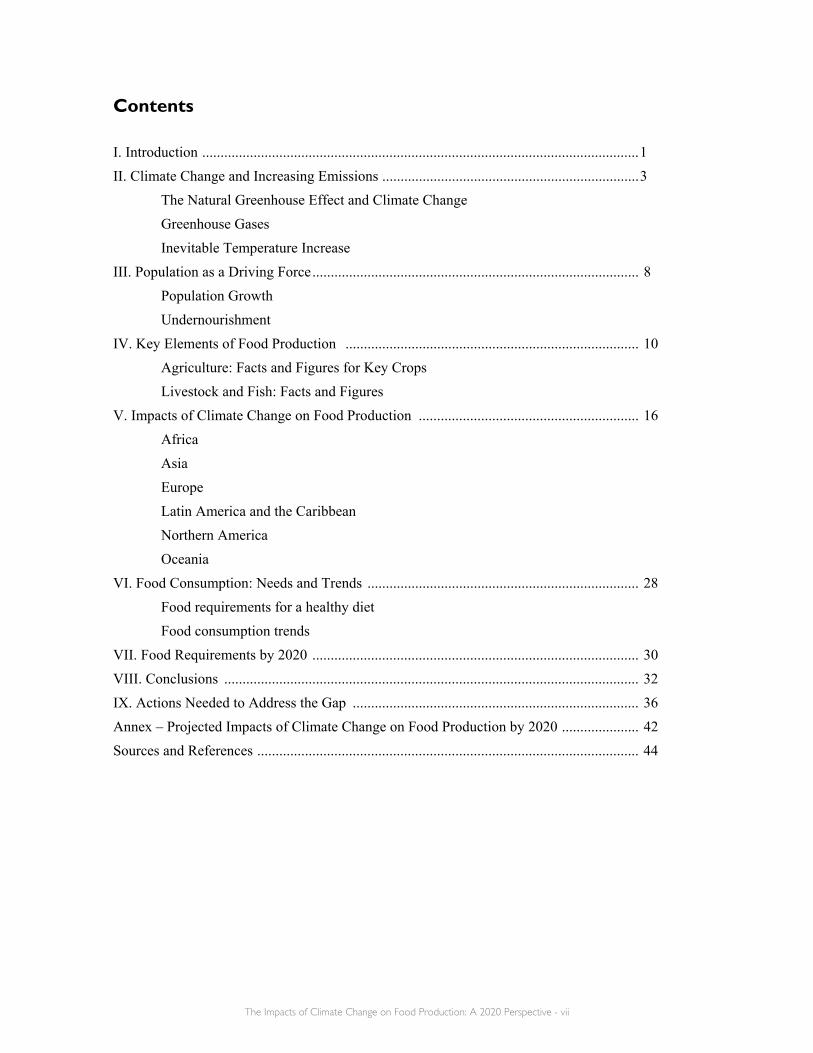
Contents I. Introduction .......................................................................................................................1 II. Climate Change and Increasing Emissions ......................................................................3
The Natural Greenhouse Effect and Climate Change Greenhouse Gases Inevitable Temperature Increase
III. Population as a Driving Force......................................................................................... 8 Population Growth Undernourishment
IV. Key Elements of Food Production ................................................................................ 10 Agriculture: Facts and Figures for Key Crops Livestock and Fish: Facts and Figures
V. Impacts of Climate Change on Food Production ............................................................ 16 Africa Asia Europe Latin America and the Caribbean Northern America Oceania
VI. Food Consumption: Needs and Trends .......................................................................... 28 Food requirements for a healthy diet Food consumption trends
VII. Food Requirements by 2020 ......................................................................................... 30 VIII. Conclusions ................................................................................................................. 32 IX. Actions Needed to Address the Gap .............................................................................. 36 Annex – Projected Impacts of Climate Change on Food Production by 2020 ..................... 42 Sources and References ........................................................................................................ 44
The Impacts of Climate Change on Food Production: A 2020 Perspective - viii
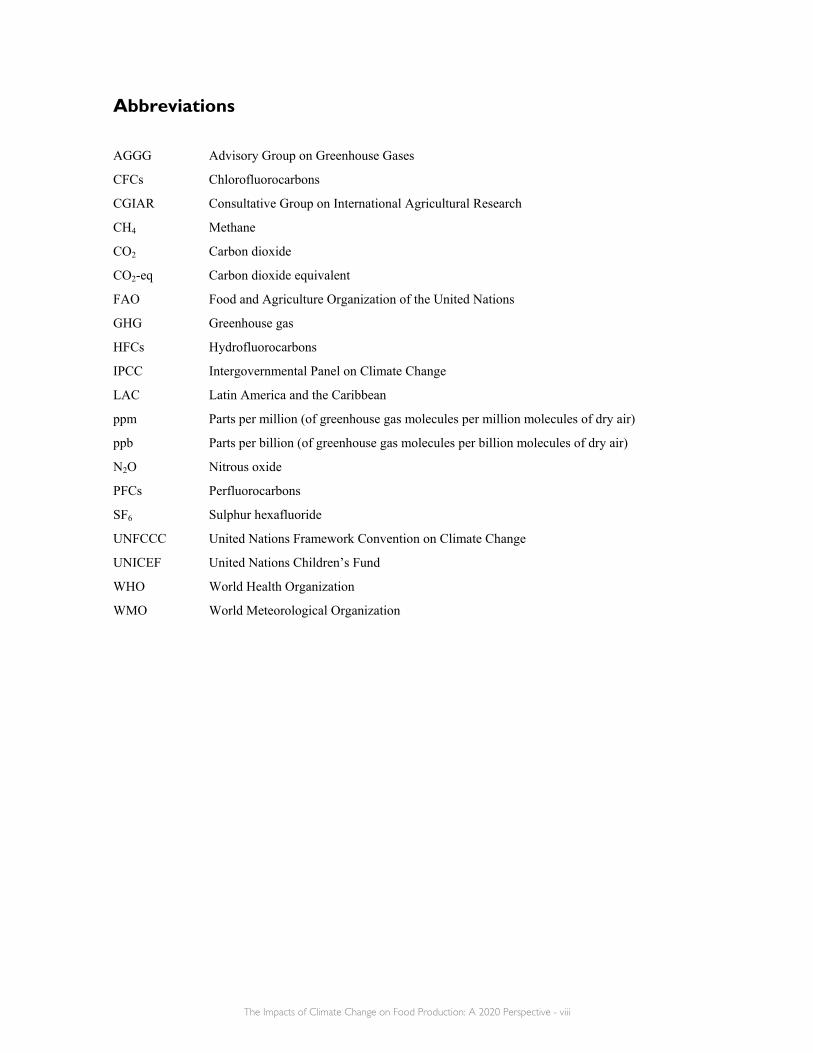
Abbreviations
AGGG Advisory Group on Greenhouse Gases
CFCs Chlorofluorocarbons
CGIAR Consultative Group on International Agricultural Research
CH4 Methane
CO2 Carbon dioxide
CO2-eq Carbon dioxide equivalent
FAO Food and Agriculture Organization of the United Nations
GHG Greenhouse gas
HFCs Hydrofluorocarbons
IPCC Intergovernmental Panel on Climate Change
LAC Latin America and the Caribbean
ppm Parts per million (of greenhouse gas molecules per million molecules of dry air)
ppb Parts per billion (of greenhouse gas molecules per billion molecules of dry air)
N2O Nitrous oxide
PFCs Perfluorocarbons
SF6 Sulphur hexafluoride
UNFCCC United Nations Framework Convention on Climate Change
UNICEF United Nations Children’s Fund
WHO World Health Organization
WMO World Meteorological Organization
1
I. Introduction
Nothing exists until it is measured Niels Bohr, 1922 Nobel Prize in Physics
Climate change is a complex inter-relation between various components. Climate change is a global environmental issue. It is also a development issue, with economic and social implications. This report connects these issues by analyzing and combining population growth, food production, nutrition and undernourishment, and linking these variables to climate change, to assess the impacts on food production. To fully understand the linkages among all of these components, each of them have been developed into separate sections. Although some of the elements may seem unrelated, each component contributes to the projection of the impacts of climate change on food production. These are:
• Climate change, including a basic explanation of the natural greenhouse effect and why the climate is changing; and a description of the greenhouse gases (GHGs). Current levels and rates of increase of GHG emissions are included, to project the global temperature increase by 2020.
• Population. The additional population estimated to inhabit the world in the next decade would need to meet basic requirements. Thus, population growth is included as an additional driving force for climate change. In addition, the number of undernourished is considered.
• Key Elements of Food Production. To present a clearer picture on the basics of food production, the key elements (land, water and climate) are described. Also, facts and figures for the four major food crops and how these are grown are described, including the top producing countries. Figures for global production and consumption of livestock and fish are included as well.
• Impacts of climate change on food production. Impacts of climate change, both positive and negative, are presented at a global level, as well as by region –in Africa, Asia, Europe, Latin America and the Caribbean, Northern America and Oceania. In each region, countries which would benefit and those which would be most affected are listed.
• Food consumption trends. To better understand the food needs for the next decade, food requirements for a healthy diet and food consumption trends for the last two decades are analyzed.
• Food consumption needs. Based on the estimated population growth, projections to meet the basic food requirements by 2020 are calculated.
The Impacts of Climate Change on Food Production: A 2020 Perspective - 2
• Conclusions. The conclusions present the combination of all the elements listed above, namely the impacts of climate change on the four major food crops as related to food production and demand by 2020; and the impacts on food prices and undernourishment.
• Actions to address the gap are included, in three main categories – reducing GHG emissions, adapting to climate change and changing dietary habits. Each set of actions are complementary, and would reinforce each other.
The Impacts of Climate Change on Food Production: A 2020 Perspective - 3
II. Climate Change and Increasing GHG Emissions Twenty years ago, the world recognized that emissions resulting from human activities were substantially increasing the atmospheric concentrations of the greenhouse gases. These increases were enhancing the natural greenhouse effect, resulting in an additional warming of the Earth's surface3. The Natural Greenhouse Effect and Climate Change The natural greenhouse effect makes life on Earth possible. The Sun powers Earth’s climate, radiating energy. About one-third of the solar energy that reaches the top of Earth’s atmosphere is reflected directly back to space. The remaining two-thirds is absorbed by the Earth’s surface and, to a lesser extent, by the atmosphere4. To balance the absorbed incoming energy, the Earth must, on average, radiate the same amount of energy back to space. Much of this radiation emitted by the Earth, through land and ocean, is absorbed by the atmosphere, and reradiated back to Earth. This is called the natural greenhouse effect. The Earth’s natural greenhouse effect warms the surface of the planet. Without it, the Earth’s mean temperature would be around –18ºC. The re-radiation of the Earth’s energy back to its surface brings its surface temperature to a mean value of around 15ºC. The reason the Earth’s surface is around 15ºC is the presence of greenhouse gases (GHGs) in the atmosphere. These GHGs act as a partial blanket for the radiation coming from the surface. Human activities, however, have greatly intensified the natural greenhouse effect. Increasing GHG concentrations in the atmosphere, primarily due to the burning of fossil fuels, exacerbate the natural greenhouse effect, warming the Earth’s climate. Therefore, in simple terms, climate change is due to the additional warming of the Earth’s surface, as a result of increasing GHG concentrations. Increasing temperatures, in turn, modify the thermodynamics of the entire atmosphere, exacerbating the already observed changes in weather and climate. The extreme events (i.e. floods, droughts, heat-waves, severe storms) being registered from, approximately, the last quarter of the 20th century, are due to the increasing GHG atmospheric concentrations. In this regard, three issues are significant:
1. The Earth’s warming has adverse and beneficial effects on the environment and human society. It should be noted, however, that the adverse ones are predominant. Nevertheless, in both circumstances, science and technology have developed appropriate strategies to alleviate the adverse and to take advantage of the beneficial impacts.
3 IPCC, 1990. First Assessment Report 4 IPCC, 2007a
The Impacts of Climate Change on Food Production: A 2020 Perspective - 4
2. The physics of the atmosphere shows that there are also natural and artificial substances and compounds that produce an effect different than that of GHGs. Aerosols and particles cool the Earth’s surface.
3. The emission of GHGs into the atmosphere gives origin to changes in the air composition over the entire atmosphere. This is what the specialists call an air background pollution process. Since the atmospheric circulation mixes the air masses, the sampling of air in different regions of the world shows rather quickly that, since the Industrial Revolution, the air composition is homogeneously changing over the entire planet.
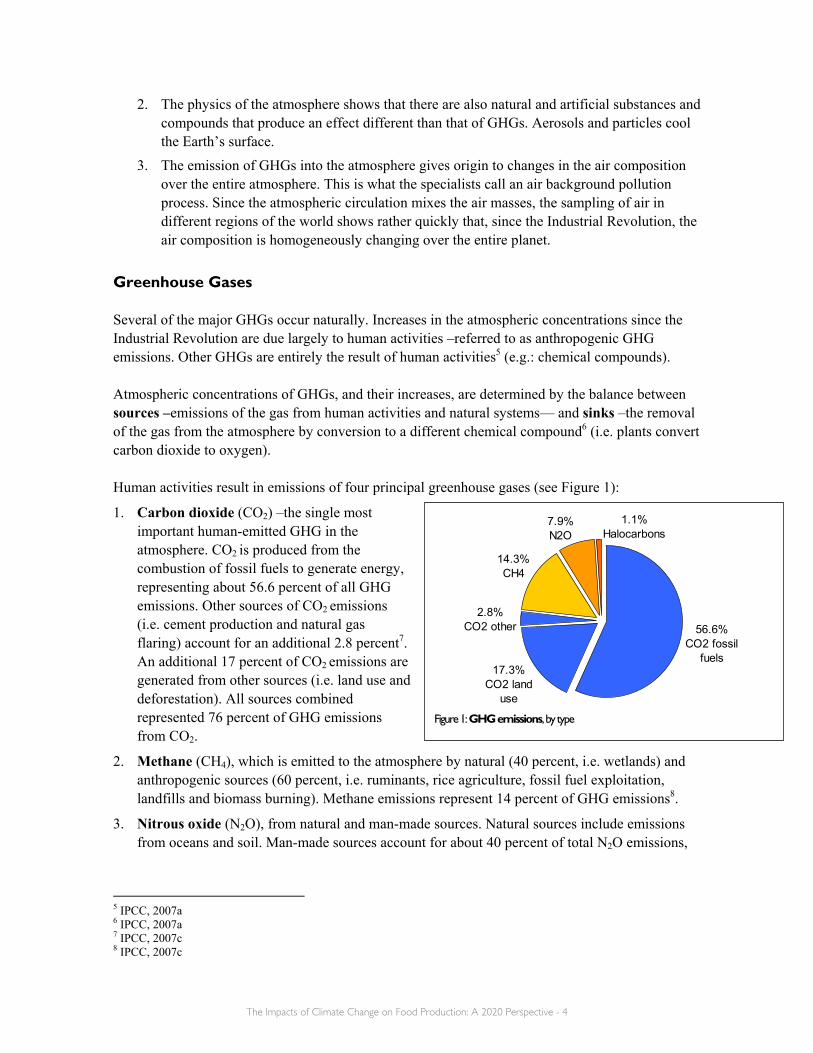
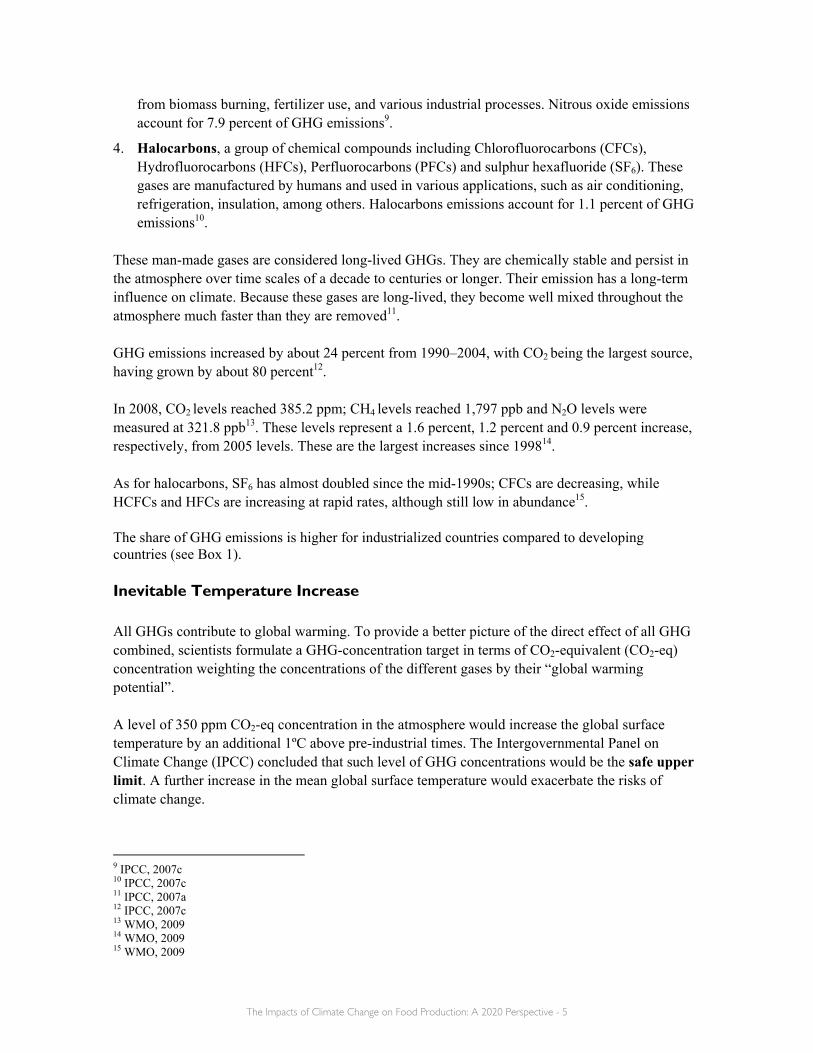
Greenhouse Gases Several of the major GHGs occur naturally. Increases in the atmospheric concentrations since the Industrial Revolution are due largely to human activities –referred to as anthropogenic GHG emissions. Other GHGs are entirely the result of human activities5 (e.g.: chemical compounds). Atmospheric concentrations of GHGs, and their increases, are determined by the balance between sources –emissions of the gas from human activities and natural systems— and sinks –the removal of the gas from the atmosphere by conversion to a different chemical compound6 (i.e. plants convert carbon dioxide to oxygen). Human activities result in emissions of four principal greenhouse gases (see Figure 1):
1. Carbon dioxide (CO2) –the single most important human-emitted GHG in the atmosphere. CO2 is produced from the combustion of fossil fuels to generate energy, representing about 56.6 percent of all GHG emissions. Other sources of CO2 emissions (i.e. cement production and natural gas flaring) account for an additional 2.8 percent7. An additional 17 percent of CO2 emissions are generated from other sources (i.e. land use and deforestation). All sources combined represented 76 percent of GHG emissions from CO2.
2. Methane (CH4), which is emitted to the atmosphere by natural (40 percent, i.e. wetlands) and anthropogenic sources (60 percent, i.e. ruminants, rice agriculture, fossil fuel exploitation, landfills and biomass burning). Methane emissions represent 14 percent of GHG emissions8.
3. Nitrous oxide (N2O), from natural and man-made sources. Natural sources include emissions from oceans and soil. Man-made sources account for about 40 percent of total N2O emissions,
5 IPCC, 2007a 6 IPCC, 2007a 7 IPCC, 2007c 8 IPCC, 2007c
1.1% Halocarbons
7.9%N2O
14.3%CH4
2.8%CO2 other
17.3%CO2 land
use
56.6% CO2 fossil
fuels
Figure 1: GHG emissions, by type
The Impacts of Climate Change on Food Production: A 2020 Perspective - 5
from biomass burning, fertilizer use, and various industrial processes. Nitrous oxide emissions account for 7.9 percent of GHG emissions9.
4. Halocarbons, a group of chemical compounds including Chlorofluorocarbons (CFCs), Hydrofluorocarbons (HFCs), Perfluorocarbons (PFCs) and sulphur hexafluoride (SF6). These gases are manufactured by humans and used in various applications, such as air conditioning, refrigeration, insulation, among others. Halocarbons emissions account for 1.1 percent of GHG emissions10.
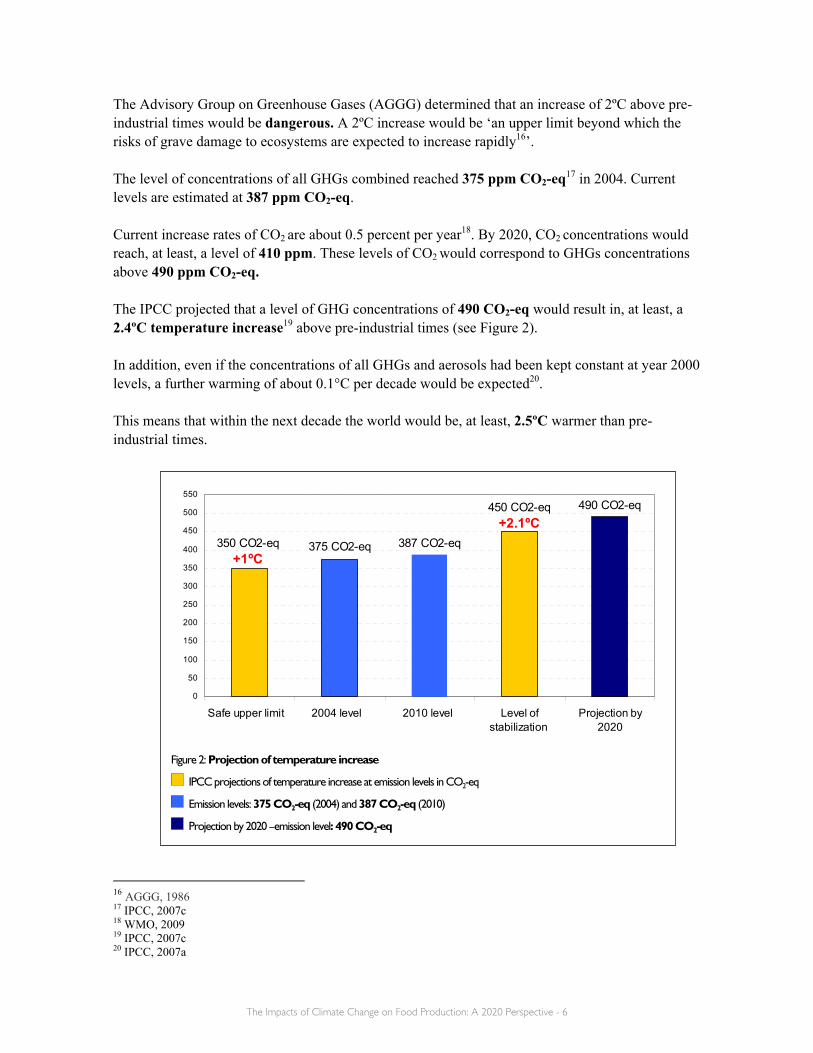
These man-made gases are considered long-lived GHGs. They are chemically stable and persist in the atmosphere over time scales of a decade to centuries or longer. Their emission has a long-term influence on climate. Because these gases are long-lived, they become well mixed throughout the atmosphere much faster than they are removed11. GHG emissions increased by about 24 percent from 1990–2004, with CO2 being the largest source, having grown by about 80 percent12. In 2008, CO2 levels reached 385.2 ppm; CH4 levels reached 1,797 ppb and N2O levels were measured at 321.8 ppb13. These levels represent a 1.6 percent, 1.2 percent and 0.9 percent increase, respectively, from 2005 levels. These are the largest increases since 199814. As for halocarbons, SF6 has almost doubled since the mid-1990s; CFCs are decreasing, while HCFCs and HFCs are increasing at rapid rates, although still low in abundance15. The share of GHG emissions is higher for industrialized countries compared to developing countries (see Box 1). Inevitable Temperature Increase All GHGs contribute to global warming. To provide a better picture of the direct effect of all GHG combined, scientists formulate a GHG-concentration target in terms of CO2-equivalent (CO2-eq) concentration weighting the concentrations of the different gases by their “global warming potential”. A level of 350 ppm CO2-eq concentration in the atmosphere would increase the global surface temperature by an additional 1ºC above pre-industrial times. The Intergovernmental Panel on Climate Change (IPCC) concluded that such level of GHG concentrations would be the safe upper limit. A further increase in the mean global surface temperature would exacerbate the risks of climate change.
9 IPCC, 2007c 10 IPCC, 2007c 11 IPCC, 2007a 12 IPCC, 2007c 13 WMO, 2009 14 WMO, 2009 15 WMO, 2009
The Impacts of Climate Change on Food Production: A 2020 Perspective - 6
The Advisory Group on Greenhouse Gases (AGGG) determined that an increase of 2ºC above pre-industrial times would be dangerous. A 2ºC increase would be ‘an upper limit beyond which the risks of grave damage to ecosystems are expected to increase rapidly16’. The level of concentrations of all GHGs combined reached 375 ppm CO2-eq17 in 2004. Current levels are estimated at 387 ppm CO2-eq. Current increase rates of CO2 are about 0.5 percent per year18. By 2020, CO2 concentrations would reach, at least, a level of 410 ppm. These levels of CO2 would correspond to GHGs concentrations above 490 ppm CO2-eq. The IPCC projected that a level of GHG concentrations of 490 CO2-eq would result in, at least, a 2.4ºC temperature increase19 above pre-industrial times (see Figure 2). In addition, even if the concentrations of all GHGs and aerosols had been kept constant at year 2000 levels, a further warming of about 0.1°C per decade would be expected20. This means that within the next decade the world would be, at least, 2.5ºC warmer than pre-industrial times. 16 AGGG, 1986 17 IPCC, 2007c 18 WMO, 2009 19 IPCC, 2007c 20 IPCC, 2007a
375 CO2-eq 387 CO2-eq
450 CO2-eq+2.1ºC
490 CO2-eq
350 CO2-eq +1ºC
0
50
100
150
200
250
300
350
400
450
500
550
Safe upper limit 2004 level 2010 level Level ofstabilization
Projection by2020
Figure 2: Projection of temperature increase
IPCC projections of temperature increase at emission levels in CO2-eq
Emission levels: 375 CO2-eq (2004) and 387 CO2-eq (2010)
Projection by 2020 –emission level: 490 CO2-eq
The Impacts of Climate Change on Food Production: A 2020 Perspective - 7
Box 1: GHG emissions: Industrialized vs. developing countries
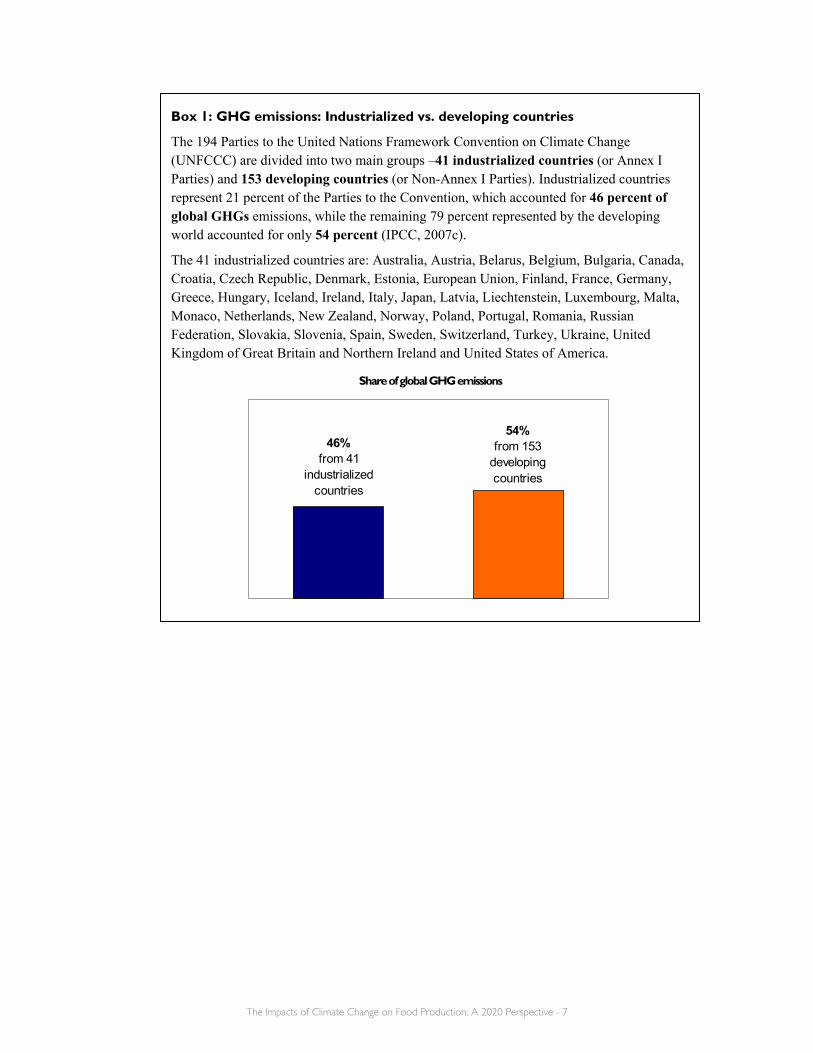
The 194 Parties to the United Nations Framework Convention on Climate Change (UNFCCC) are divided into two main groups –41 industrialized countries (or Annex I Parties) and 153 developing countries (or Non-Annex I Parties). Industrialized countries represent 21 percent of the Parties to the Convention, which accounted for 46 percent of global GHGs emissions, while the remaining 79 percent represented by the developing world accounted for only 54 percent (IPCC, 2007c).
The 41 industrialized countries are: Australia, Austria, Belarus, Belgium, Bulgaria, Canada, Croatia, Czech Republic, Denmark, Estonia, European Union, Finland, France, Germany, Greece, Hungary, Iceland, Ireland, Italy, Japan, Latvia, Liechtenstein, Luxembourg, Malta, Monaco, Netherlands, New Zealand, Norway, Poland, Portugal, Romania, Russian Federation, Slovakia, Slovenia, Spain, Sweden, Switzerland, Turkey, Ukraine, United Kingdom of Great Britain and Northern Ireland and United States of America.
Share of global GHG emissions
46% from 41
industrialized countries
54% from 153
developing countries
The Impacts of Climate Change on Food Production: A 2020 Perspective - 8
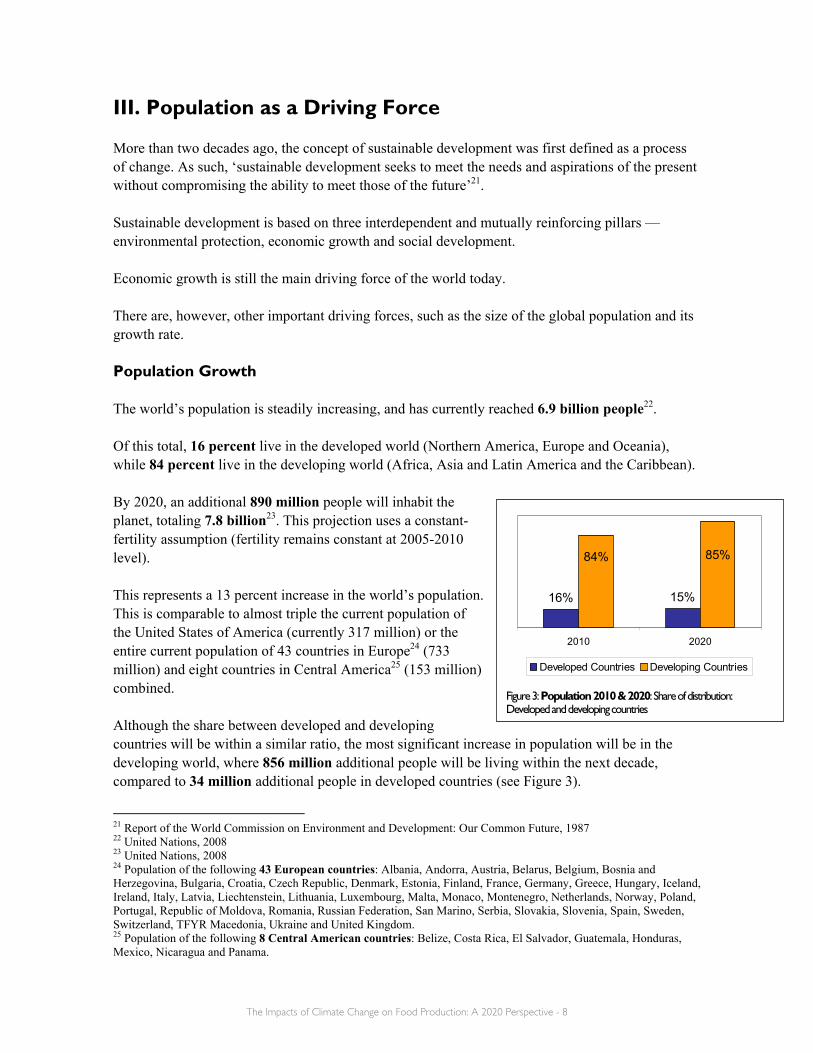
III. Population as a Driving Force More than two decades ago, the concept of sustainable development was first defined as a process of change. As such, ‘sustainable development seeks to meet the needs and aspirations of the present without compromising the ability to meet those of the future’21. Sustainable development is based on three interdependent and mutually reinforcing pillars — environmental protection, economic growth and social development. Economic growth is still the main driving force of the world today. There are, however, other important driving forces, such as the size of the global population and its growth rate. Population Growth The world’s population is steadily increasing, and has currently reached 6.9 billion people22. Of this total, 16 percent live in the developed world (Northern America, Europe and Oceania), while 84 percent live in the developing world (Africa, Asia and Latin America and the Caribbean). By 2020, an additional 890 million people will inhabit the planet, totaling 7.8 billion23. This projection uses a constant-fertility assumption (fertility remains constant at 2005-2010 level). This represents a 13 percent increase in the world’s population. This is comparable to almost triple the current population of the United States of America (currently 317 million) or the entire current population of 43 countries in Europe24 (733 million) and eight countries in Central America25 (153 million) combined. Although the share between developed and developing countries will be within a similar ratio, the most significant increase in population will be in the developing world, where 856 million additional people will be living within the next decade, compared to 34 million additional people in developed countries (see Figure 3).
21 Report of the World Commission on Environment and Development: Our Common Future, 1987 22 United Nations, 2008 23 United Nations, 2008 24 Population of the following 43 European countries: Albania, Andorra, Austria, Belarus, Belgium, Bosnia and Herzegovina, Bulgaria, Croatia, Czech Republic, Denmark, Estonia, Finland, France, Germany, Greece, Hungary, Iceland, Ireland, Italy, Latvia, Liechtenstein, Lithuania, Luxembourg, Malta, Monaco, Montenegro, Netherlands, Norway, Poland, Portugal, Republic of Moldova, Romania, Russian Federation, San Marino, Serbia, Slovakia, Slovenia, Spain, Sweden, Switzerland, TFYR Macedonia, Ukraine and United Kingdom. 25 Population of the following 8 Central American countries: Belize, Costa Rica, El Salvador, Guatemala, Honduras, Mexico, Nicaragua and Panama.
16% 15%
85%84%
2010 2020
Developed Countries Developing Countries
Figure 3: Population 2010 & 2020: Share of distribution: Developed and developing countries
The Impacts of Climate Change on Food Production: A 2020 Perspective - 9
0.2%9%
15%29%
Africa Asia LAC Developedcountries
Figure 5: Current level of undernourishment: Share of population, by region
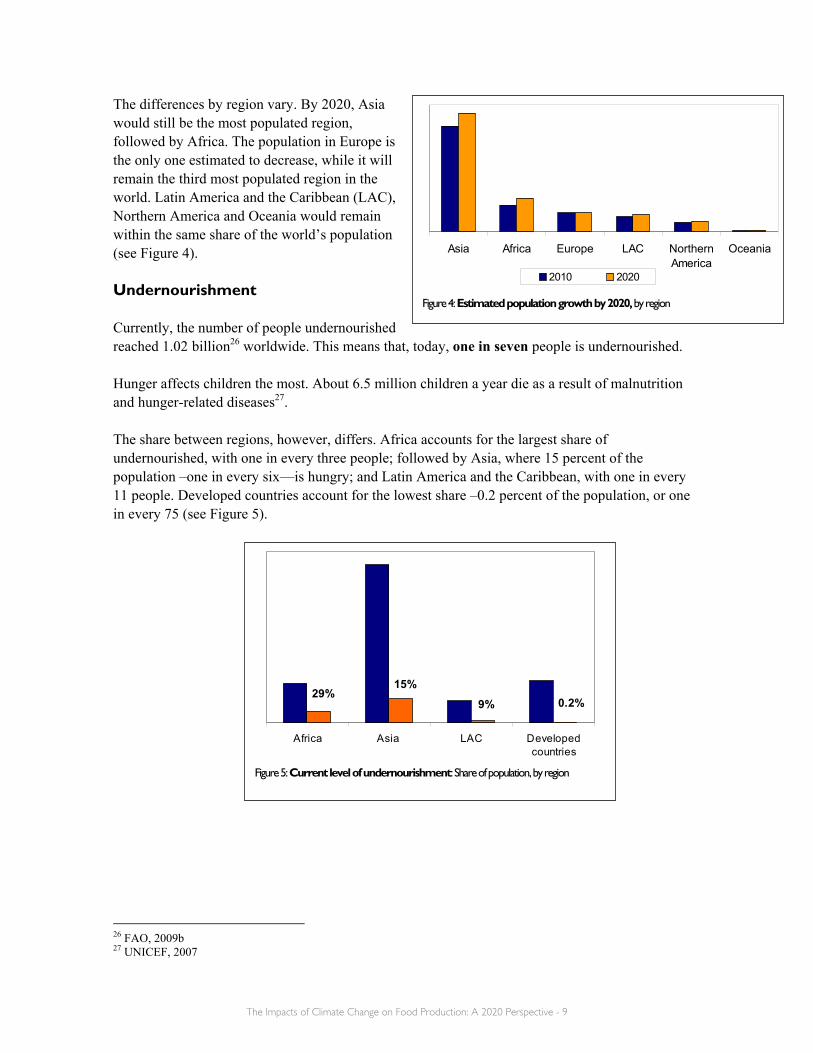
The differences by region vary. By 2020, Asia would still be the most populated region, followed by Africa. The population in Europe is the only one estimated to decrease, while it will remain the third most populated region in the world. Latin America and the Caribbean (LAC), Northern America and Oceania would remain within the same share of the world’s population (see Figure 4). Undernourishment Currently, the number of people undernourished reached 1.02 billion26 worldwide. This means that, today, one in seven people is undernourished. Hunger affects children the most. About 6.5 million children a year die as a result of malnutrition and hunger-related diseases27. The share between regions, however, differs. Africa accounts for the largest share of undernourished, with one in every three people; followed by Asia, where 15 percent of the population –one in every six—is hungry; and Latin America and the Caribbean, with one in every 11 people. Developed countries account for the lowest share –0.2 percent of the population, or one in every 75 (see Figure 5).
26 FAO, 2009b 27 UNICEF, 2007
Asia Africa Europe LAC NorthernAmerica
Oceania
2010 2020
Figure 4: Estimated population growth by 2020, by region

The Impacts of Climate Change on Food Production: A 2020 Perspective - 10
IV. Key Elements of Food Production There are three main elements of food production:
1. Arable land. Arable land is the land under temporary agricultural crops (multiple-cropped areas are counted only once), temporary meadows for mowing or pasture, land under market and kitchen gardens and land temporarily fallow (less than five years)28.
The arable land in the world totals 1,411.1 million ha –41 percent (576.2 million ha) in the developed world and 59 percent (834.9 million ha) in the developing world29. Asia accounts for the largest share of arable land in the world, followed by Europe. Africa and Northern America account for a similar share; while the percentage in Latin America and the Caribbean is around half of Europe’s share of arable land (see Figure 6).
Over the last 15 years, the arable land in the world expanded by 7.9 million ha representing a 0.56 percent increase30. This increase is comparable to almost the total land area of Austria (8.2 million ha) or South Carolina in the United States (7.8 million ha). Since 1991, the developed world has lost 56.2 million ha of arable land –a 4 percent decrease. In the developing world, there was a 64 million ha gain in arable land –a 4 percent increase.
The utilization of intensive cropping systems and increased use of fertilizers to boost yields has already impacted the world’s arable land –about 40 percent is degraded to some extent31.
2. Water. More than 80 percent of total agricultural land, and close to 100 percent of pasture
land, is rain-fed32. The rest depends on irrigation, for which about 70 percent of the world’s fresh water is being used33.
28 Food and Agriculture Organization of the United Nations (FAO) 29 FAO, 2009c, FAO, 2009d 30 FAO, 2009c 31 IIASA, 2002 32 IPCC, 2007c; FAO, 2009d 33 FAO, 2006, IIASA, 2002
3%
15%
20%
36%
10.5%
15.5%
Oceania
LAC
Northern America
Africa
Europe
Asia
Figure 6: Arable land: Share of world’s total, by region
The Impacts of Climate Change on Food Production: A 2020 Perspective - 11
Box 2: Climate regions
The world is divided into three main climate regions:
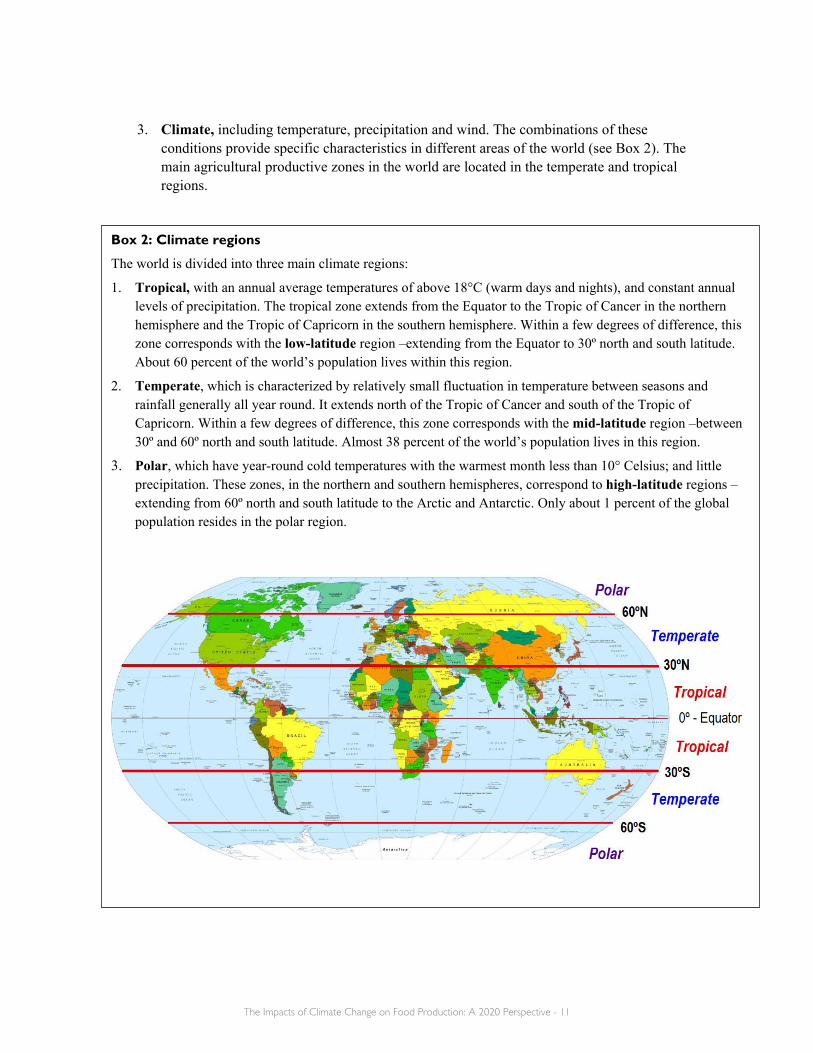
1. Tropical, with an annual average temperatures of above 18°C (warm days and nights), and constant annual levels of precipitation. The tropical zone extends from the Equator to the Tropic of Cancer in the northern hemisphere and the Tropic of Capricorn in the southern hemisphere. Within a few degrees of difference, this zone corresponds with the low-latitude region –extending from the Equator to 30º north and south latitude. About 60 percent of the world’s population lives within this region.
2. Temperate, which is characterized by relatively small fluctuation in temperature between seasons and rainfall generally all year round. It extends north of the Tropic of Cancer and south of the Tropic of Capricorn. Within a few degrees of difference, this zone corresponds with the mid-latitude region –between 30º and 60º north and south latitude. Almost 38 percent of the world’s population lives in this region.
3. Polar, which have year-round cold temperatures with the warmest month less than 10° Celsius; and little precipitation. These zones, in the northern and southern hemispheres, correspond to high-latitude regions –extending from 60º north and south latitude to the Arctic and Antarctic. Only about 1 percent of the global population resides in the polar region.
3. Climate, including temperature, precipitation and wind. The combinations of these conditions provide specific characteristics in different areas of the world (see Box 2). The main agricultural productive zones in the world are located in the temperate and tropical regions.
The Impacts of Climate Change on Food Production: A 2020 Perspective - 12
Food Production: Facts and Figures Food production encompasses crops, livestock and fish products. These are products that are obtained through agriculture and animal raising, including fish, for food. For example, cereal crops such as rice and fresh milk are some of the basic staples used for food. Agriculture: Facts and Figures for Key Crops The total cereal production in 2009 was 2,238 million tons. Of this total, only 12 percent was destined for trade –the rest was either consumed or used (e.g. for animal feed) where it was grown. About 45 percent (1,028.5 million tons34) of the world’s total cereal production was utilized for food. Main cereal crops destined for food include: 1. Wheat –the world's major cereal crop. Wheat is a major source of energy in human diet, due to
its protein content –higher than almost all other cereals. There are different varieties of wheat. Those used mainly for human consumption are utilized for flour for breadmaking and semolina for making pasta35.
Wheat is grown as a rainfed crop in temperate climate regions, characterized by a long rainy season. In these regions, wheat is grown as a winter crop. Also, wheat is grown under irrigation in the tropics; and in the subtropics with summer rainfall and under irrigation in the winter months. Wheat is sensitive to frost. Thus, in areas of severe winters, cold winds and little snow, spring wheat varieties are grown. For winter and spring wheat, minimum daily temperature for measurable growth is about 5°C, but the temperature for optimum growth is between 15 and 20°C. Sensitivity to water deficit is somewhat higher in spring than in winter wheat36. About 66 percent of global wheat production was utilized for food (452 million tons) and about 82 percent was used where it was grown37. The following 20 countries produce 86 percent of the wheat in the world: China, India, United States of America, Russian Federation, France, Canada, Germany, Ukraine, Australia, Pakistan, Turkey, United Kingdom, Kazakhstan, Poland, Italy, Argentina, Egypt, Iran (Islamic Republic of), Romania and Spain.
2. Rice –one of the main food staples for a large part of the world's population. Rice protein ranks high in nutritional quality among cereals, but protein content is modest. Rice also provides minerals, vitamins, and fiber38.
Rice grows best when submerged in water. It is grown in tropical to warm-temperate climates, under two main systems –irrigated (lowland) or rainfed (upland or lowland). In the irrigated rice 34 FAO, 2009a 35 CGIAR 36 CGIAR 37 FAO, 2009a 38 CGIAR
The Impacts of Climate Change on Food Production: A 2020 Perspective - 13
system, water is available for most part of the year. Thus, it can be grown all year long, resulting in at least two crops per year. In the rainfed lowland rice system, rice grows in enclosed fields that are flooded for at least part of the cropping season. Rice is extremely sensitive to water shortage39. Rice needs to be processed to be used as food. Rice processing involves separating the husk and bran layers from the rice grain (or paddy rice) to obtain milled rice. About 70 percent of paddy rice is used to obtain milled rice for food. About 84 percent of global processed rice production was utilized for food (385.2 million tons of milled rice); and about 94 percent was used where it was grown40. The following 20 countries produce 95 percent of the rice in the world: China, India, Indonesia, Bangladesh, Vietnam, Thailand, Myanmar, Philippines, Brazil, Japan, Pakistan, United States of America, Egypt, Cambodia, Republic of Korea, Nepal, Nigeria, Sri Lanka, Madagascar and Lao People's Democratic Republic.
3. Coarse grains, including maize, soybean, sorghum, barley, rye, oats and millet. More than 56 percent of world production of coarse grains is used for animal feed, while about 17 percent (191.6 million tons41) was utilized for food. Among the coarse grains, two crops are particularly important:
(a) Maize (also known as corn) –when used for food, maize constitutes an important source of carbohydrate and is complete in nutrients compared to other cereals. It can also be processed by dry milling techniques to give a relatively large number of intermediary products, such as maize grits of different particle size, maize meal, maize flour and flaking grits. These materials in turn have a great number of applications in a large variety of foods42. In addition to its use as food, it is also used as a feedgrain and a fodder crop43. Maize is also being increasingly used as a biofuel for the production of ethanol.
Maize is grown in climates ranging from temperate to tropic during the period when mean daily temperatures are above 15°C and frost-free. It is very sensitive to frost, but tolerates hot and dry atmospheric conditions as long as sufficient water is available. In general, maize can be grown continuously as long as soil fertility is maintained44. About 12 percent of the global production of maize was utilized as a biofuel to produce ethanol, and 60 percent for animal feed. The remaining 28 percent was used for food or food products45. The following 20 countries produce 88 percent of the maize in the world: United States of America, China, Brazil, Mexico, Argentina, India, Indonesia, France, South Africa, Ukraine,
39 CGIAR’s International Rice Research Institute 40 FAO, 2009a 41 FAO, 2009a 42 FAO 43 CGIAR 44 FAO 45 FAO, 2008a
The Impacts of Climate Change on Food Production: A 2020 Perspective - 14
Canada, Italy, Hungary, Romania, Nigeria, Philippines, Russian Federation, Egypt, Serbia and Germany.
(b) Soybean has the highest protein content of all food crops. It is an important source of high quality, inexpensive protein for human consumption. Compared to other protein-rich foods (i.e. meat, fish and eggs) soybean is by far the cheapest46. Soybean is an important food staple in most of Asia, where it is consumed in various foods 47 (e.g. Tofu, soybean milk, soy sauce).
Soybean is grown under warm conditions in the tropics, subtropics and temperate climates –above 18°C and below 35°C. Soybean is usually not grown under full irrigation48.
Soybean is often grown as a rotation crop in combination with cotton, maize and sorghum. However, the current profitability of soybean has modified the way it is grown. Soybeans fit into the maize-base cropping system –either intercropped with maize or rotated with maize49. However, most soybean is currently grown on large-scale high-input (using fertilizer or pesticides) farms as a monocrop50. As a consequence, there are considerable aggregate environmental impacts, including soil acidification, excessive fertilizer use, and biodiversity loss, among others51.
Monocropping leads to depletion of the nutrients in the soil. The soil becomes arid and useless. To maintain high levels of production, more land is needed. Thus, another environmental impact of monocropping is deforestation. In addition, the use of fertilizers, mainly nitrogen-based, contributes to climate change. For example, nitrous oxide, a GHG with a global warming potential around 300 times greater than that of CO2, is released from nitrogen fertilizers52.
About 10 percent of the world’s production of soybean was used for food and about 75 percent to produce soybean oil, which is the single most important vegetable oil53. The following 20 countries produce 99 percent of the soybeans in the world: United States of America, Brazil, Argentina, China, India, Paraguay, Canada, Bolivia, Uruguay, Ukraine, Indonesia, Russian Federation, Nigeria, Serbia, Italy, Democratic People's Republic of Korea, South Africa, Vietnam, Japan and Iran (Islamic Republic of). Livestock and Fish: Facts and Figures The remainder of these food crops which is not utilized for food is used for various purposes, including industrial process (food production), as feedstock for biofuels and, most importantly, as animal feed. About 35 percent of the world’s cereals54 are used as animal feed. 46 CGIAR 47 FAO 48 FAO 49 The World Bank, 2008 50 CGIAR 51 FAO, 2008b 52 FAO, 2008b 53 FAO, 2004 54 FAO, 2003
The Impacts of Climate Change on Food Production: A 2020 Perspective - 15
Globally, around 48 percent of the beef production and 53 percent of milk production originates from the rainfed mixed farming system (where cropping and livestock raising are linked activities); while more than two-thirds of global production of poultry meat originates from industrial systems (intensive systems that purchase at least 90 percent of their feed)55. Meat production includes bovine, poultry, pigmeat and ovine meat. The balance between meat production and utilization is even –the total amount of meat and meat products produced were consumed, totaling 282.1 million tons56. There are, however, considerable differences in consumption between developing and developed countries. The per capita consumption of meat was, on average, 31.5 kg/year in the developing world, while the average in developed countries was more than double, with 81.9 kg/year57. Similar differences are recorded in milk and milk products –the per capita consumption in developing countries averaged 65.5 kg/year and almost four times more in developed countries where 246.9 kg/year were consumed58. About half of the world’s population consumes at least 15 percent of the average per capita animal protein intake from fish59. About 141.6 million tons of fish were produced, of which 64 percent (90 million tons) were from capture and 36 percent (51.6 million tons) from aquaculture. About 80 percent of the world’s production (113.9 million tons) was utilized for food60. The amount of food produced should be enough to feed the current world’s population. However, due to poor distribution of food, 15 percent of the world’s population is undernourished.
55 FAO, 2009c 56 FAO, 2009a 57 FAO, 2009a 58 FAO, 2009a 59 FAO, 2008c 60 FAO, 2009a
The Impacts of Climate Change on Food Production: A 2020 Perspective - 16
15%
17%
1,033 million 2010
1,325 million 2020
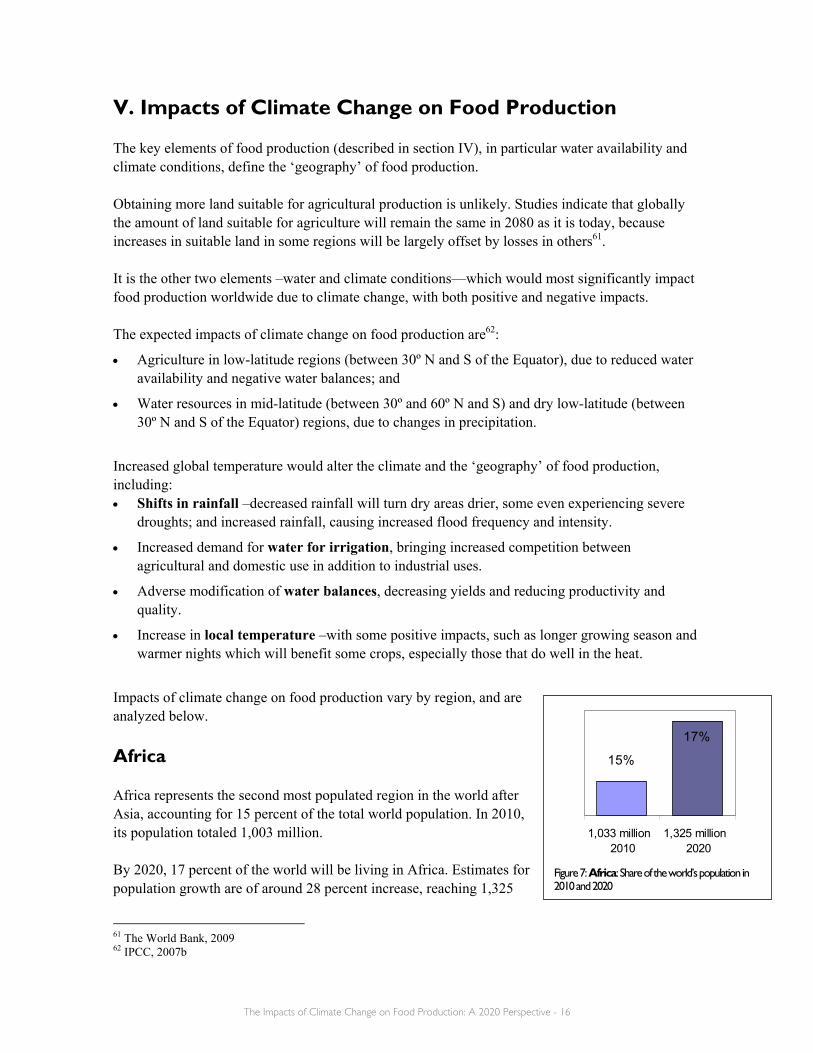
Figure 7: Africa: Share of the world’s population in 2010 and 2020
V. Impacts of Climate Change on Food Production The key elements of food production (described in section IV), in particular water availability and climate conditions, define the ‘geography’ of food production. Obtaining more land suitable for agricultural production is unlikely. Studies indicate that globally the amount of land suitable for agriculture will remain the same in 2080 as it is today, because increases in suitable land in some regions will be largely offset by losses in others61. It is the other two elements –water and climate conditions—which would most significantly impact food production worldwide due to climate change, with both positive and negative impacts. The expected impacts of climate change on food production are62:
• Agriculture in low-latitude regions (between 30º N and S of the Equator), due to reduced water availability and negative water balances; and
• Water resources in mid-latitude (between 30º and 60º N and S) and dry low-latitude (between 30º N and S of the Equator) regions, due to changes in precipitation.
Increased global temperature would alter the climate and the ‘geography’ of food production, including: • Shifts in rainfall –decreased rainfall will turn dry areas drier, some even experiencing severe
droughts; and increased rainfall, causing increased flood frequency and intensity.
• Increased demand for water for irrigation, bringing increased competition between agricultural and domestic use in addition to industrial uses.
• Adverse modification of water balances, decreasing yields and reducing productivity and quality.
• Increase in local temperature –with some positive impacts, such as longer growing season and warmer nights which will benefit some crops, especially those that do well in the heat.
Impacts of climate change on food production vary by region, and are analyzed below. Africa Africa represents the second most populated region in the world after Asia, accounting for 15 percent of the total world population. In 2010, its population totaled 1,003 million. By 2020, 17 percent of the world will be living in Africa. Estimates for population growth are of around 28 percent increase, reaching 1,325
61 The World Bank, 2009 62 IPCC, 2007b
The Impacts of Climate Change on Food Production: A 2020 Perspective - 17
15.5%
3%
4%
10%
5%
5%Milk & milk products
Meat & meat products
Coarse grains
Rice
Wheat
Arable land
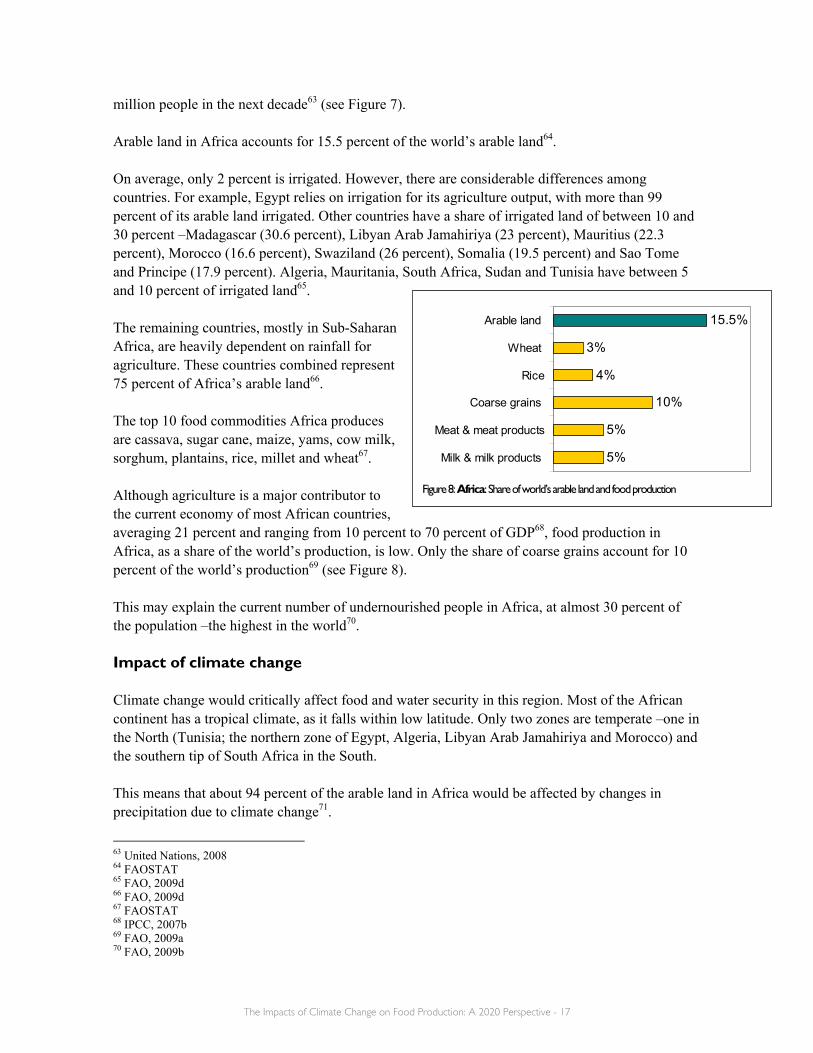
Figure 8: Africa: Share of world’s arable land and food production
million people in the next decade63 (see Figure 7). Arable land in Africa accounts for 15.5 percent of the world’s arable land64. On average, only 2 percent is irrigated. However, there are considerable differences among countries. For example, Egypt relies on irrigation for its agriculture output, with more than 99 percent of its arable land irrigated. Other countries have a share of irrigated land of between 10 and 30 percent –Madagascar (30.6 percent), Libyan Arab Jamahiriya (23 percent), Mauritius (22.3 percent), Morocco (16.6 percent), Swaziland (26 percent), Somalia (19.5 percent) and Sao Tome and Principe (17.9 percent). Algeria, Mauritania, South Africa, Sudan and Tunisia have between 5 and 10 percent of irrigated land65. The remaining countries, mostly in Sub-Saharan Africa, are heavily dependent on rainfall for agriculture. These countries combined represent 75 percent of Africa’s arable land66. The top 10 food commodities Africa produces are cassava, sugar cane, maize, yams, cow milk, sorghum, plantains, rice, millet and wheat67. Although agriculture is a major contributor to the current economy of most African countries, averaging 21 percent and ranging from 10 percent to 70 percent of GDP68, food production in Africa, as a share of the world’s production, is low. Only the share of coarse grains account for 10 percent of the world’s production69 (see Figure 8). This may explain the current number of undernourished people in Africa, at almost 30 percent of the population –the highest in the world70. Impact of climate change Climate change would critically affect food and water security in this region. Most of the African continent has a tropical climate, as it falls within low latitude. Only two zones are temperate –one in the North (Tunisia; the northern zone of Egypt, Algeria, Libyan Arab Jamahiriya and Morocco) and the southern tip of South Africa in the South. This means that about 94 percent of the arable land in Africa would be affected by changes in precipitation due to climate change71.
63 United Nations, 2008 64 FAOSTAT 65 FAO, 2009d 66 FAO, 2009d 67 FAOSTAT 68 IPCC, 2007b 69 FAO, 2009a 70 FAO, 2009b
The Impacts of Climate Change on Food Production: A 2020 Perspective - 18
60%60%
4,166 million 2010
4,660 million 2020
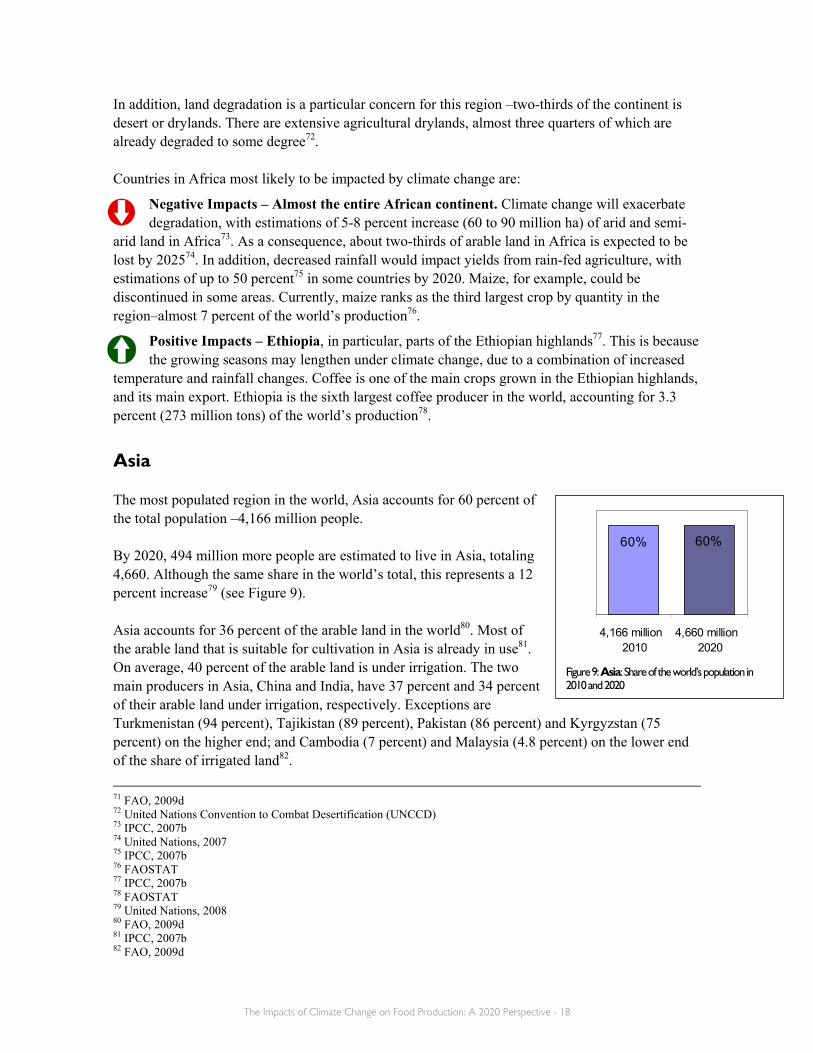
Figure 9: Asia: Share of the world’s population in 2010 and 2020
In addition, land degradation is a particular concern for this region –two-thirds of the continent is desert or drylands. There are extensive agricultural drylands, almost three quarters of which are already degraded to some degree72. Countries in Africa most likely to be impacted by climate change are:
Negative Impacts – Almost the entire African continent. Climate change will exacerbate degradation, with estimations of 5-8 percent increase (60 to 90 million ha) of arid and semi-
arid land in Africa73. As a consequence, about two-thirds of arable land in Africa is expected to be lost by 202574. In addition, decreased rainfall would impact yields from rain-fed agriculture, with estimations of up to 50 percent75 in some countries by 2020. Maize, for example, could be discontinued in some areas. Currently, maize ranks as the third largest crop by quantity in the region–almost 7 percent of the world’s production76.
Positive Impacts – Ethiopia, in particular, parts of the Ethiopian highlands77. This is because the growing seasons may lengthen under climate change, due to a combination of increased
temperature and rainfall changes. Coffee is one of the main crops grown in the Ethiopian highlands, and its main export. Ethiopia is the sixth largest coffee producer in the world, accounting for 3.3 percent (273 million tons) of the world’s production78.
Asia The most populated region in the world, Asia accounts for 60 percent of the total population –4,166 million people. By 2020, 494 million more people are estimated to live in Asia, totaling 4,660. Although the same share in the world’s total, this represents a 12 percent increase79 (see Figure 9). Asia accounts for 36 percent of the arable land in the world80. Most of the arable land that is suitable for cultivation in Asia is already in use81. On average, 40 percent of the arable land is under irrigation. The two main producers in Asia, China and India, have 37 percent and 34 percent of their arable land under irrigation, respectively. Exceptions are Turkmenistan (94 percent), Tajikistan (89 percent), Pakistan (86 percent) and Kyrgyzstan (75 percent) on the higher end; and Cambodia (7 percent) and Malaysia (4.8 percent) on the lower end of the share of irrigated land82.
71 FAO, 2009d 72 United Nations Convention to Combat Desertification (UNCCD) 73 IPCC, 2007b 74 United Nations, 2007 75 IPCC, 2007b 76 FAOSTAT 77 IPCC, 2007b 78 FAOSTAT 79 United Nations, 2008 80 FAO, 2009d 81 IPCC, 2007b 82 FAO, 2009d
The Impacts of Climate Change on Food Production: A 2020 Perspective - 19
36%
42%
24%
90%
40%
36%
Milk & milk products
Meat & meat products
Coarse grains
Rice
Wheat
Arable land
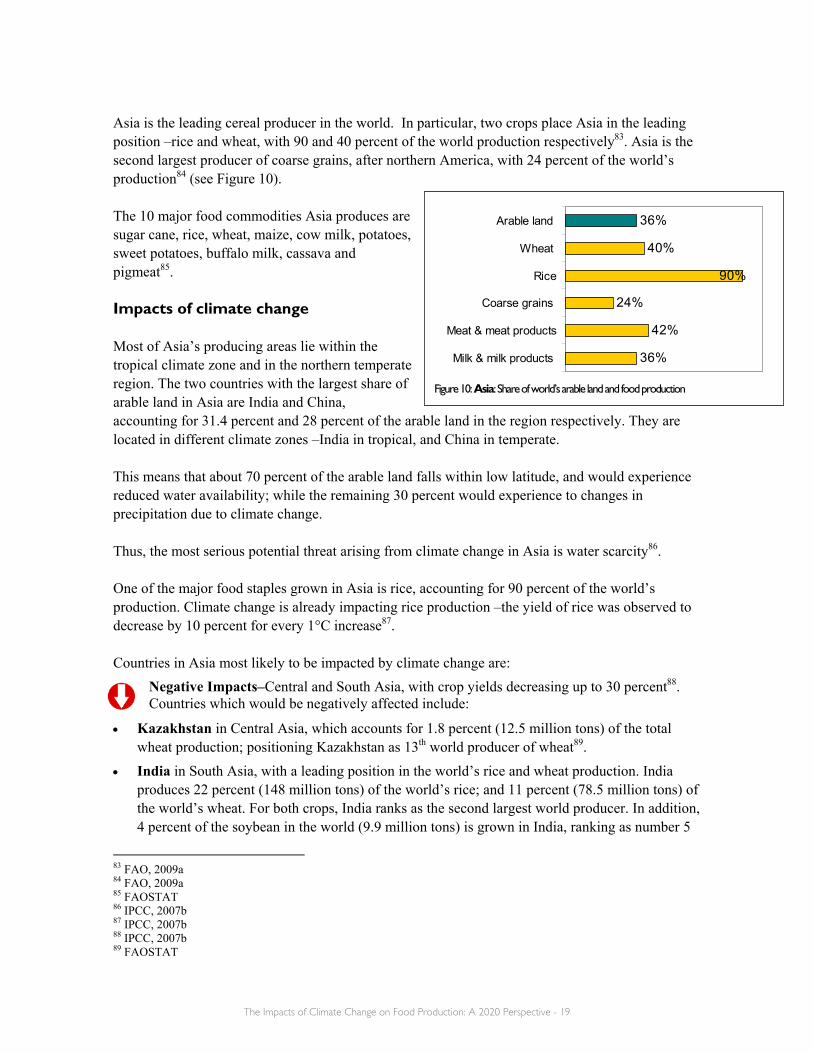
Figure 10: Asia: Share of world’s arable land and food production
Asia is the leading cereal producer in the world. In particular, two crops place Asia in the leading position –rice and wheat, with 90 and 40 percent of the world production respectively83. Asia is the second largest producer of coarse grains, after northern America, with 24 percent of the world’s production84 (see Figure 10). The 10 major food commodities Asia produces are sugar cane, rice, wheat, maize, cow milk, potatoes, sweet potatoes, buffalo milk, cassava and pigmeat85. Impacts of climate change Most of Asia’s producing areas lie within the tropical climate zone and in the northern temperate region. The two countries with the largest share of arable land in Asia are India and China, accounting for 31.4 percent and 28 percent of the arable land in the region respectively. They are located in different climate zones –India in tropical, and China in temperate. This means that about 70 percent of the arable land falls within low latitude, and would experience reduced water availability; while the remaining 30 percent would experience to changes in precipitation due to climate change. Thus, the most serious potential threat arising from climate change in Asia is water scarcity86. One of the major food staples grown in Asia is rice, accounting for 90 percent of the world’s production. Climate change is already impacting rice production –the yield of rice was observed to decrease by 10 percent for every 1°C increase87. Countries in Asia most likely to be impacted by climate change are:
Negative Impacts–Central and South Asia, with crop yields decreasing up to 30 percent88. Countries which would be negatively affected include:
• Kazakhstan in Central Asia, which accounts for 1.8 percent (12.5 million tons) of the total wheat production; positioning Kazakhstan as 13th world producer of wheat89.
• India in South Asia, with a leading position in the world’s rice and wheat production. India produces 22 percent (148 million tons) of the world’s rice; and 11 percent (78.5 million tons) of the world’s wheat. For both crops, India ranks as the second largest world producer. In addition, 4 percent of the soybean in the world (9.9 million tons) is grown in India, ranking as number 5
83 FAO, 2009a 84 FAO, 2009a 85 FAOSTAT 86 IPCC, 2007b 87 IPCC, 2007b 88 IPCC, 2007b 89 FAOSTAT
The Impacts of Climate Change on Food Production: A 2020 Perspective - 20
9%11%
732.7 million 2010
728.7million 2020
Figure 11: Europe: Share of the world’s population in 2010 and 2020
world producer; and maize, with a 2.3 percent share of the world’s production (19.7 million tons) –the sixth largest producer90.
Other countries which would be negatively affected are Bangladesh –producing 7 percent (46.9 million tons) of the world’s rice; and Pakistan –producing 3 percent (20.9 million tons) of the world’s wheat; and 1.5 percent (10.4 million tons) of the world’s rice91.
Positive Impacts – East and South-East Asia, with crop yields increasing up to 20 percent92. Countries which would be positively affected include:
• China in East Asia—with 28 percent (193.3 million tons) of the world’s production of rice and 16 percent (112.4 million tons) of the total production of wheat, China is the largest producer of rice and wheat in the world. In addition, 20 percent of the maize in the world (166 million tons) is produced in China, positioned as the second largest producer; and the fourth producer of soybeans, with 6.7 percent of the total production (15.5 million tons)93.
• Indonesia in South-East Asia, the third largest producer of rice in the world, with 8.7 percent of the total production (60.2 million tons)94.
East and South-East Asia combined produce 56 percent of the rice in the world, within seven out of the top 10 world producers: China, Indonesia, Vietnam, Thailand, Myanmar, Philippines and Japan95.
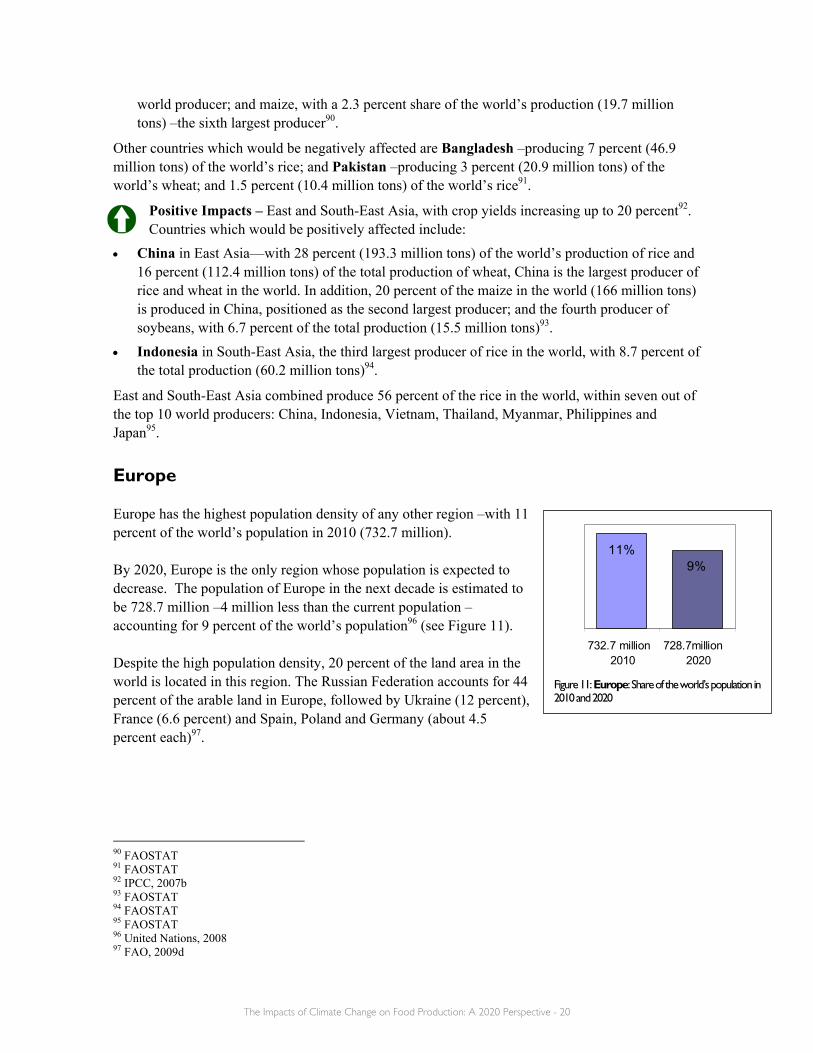
Europe Europe has the highest population density of any other region –with 11 percent of the world’s population in 2010 (732.7 million). By 2020, Europe is the only region whose population is expected to decrease. The population of Europe in the next decade is estimated to be 728.7 million –4 million less than the current population –accounting for 9 percent of the world’s population96 (see Figure 11). Despite the high population density, 20 percent of the land area in the world is located in this region. The Russian Federation accounts for 44 percent of the arable land in Europe, followed by Ukraine (12 percent), France (6.6 percent) and Spain, Poland and Germany (about 4.5 percent each)97.
90 FAOSTAT 91 FAOSTAT 92 IPCC, 2007b 93 FAOSTAT 94 FAOSTAT 95 FAOSTAT 96 United Nations, 2008 97 FAO, 2009d
The Impacts of Climate Change on Food Production: A 2020 Perspective - 21
20%
36%
0.5%
22%
19%
31%Milk & milk products
Meat & meat products
Coarse grains
Rice
Wheat
Arable land
Figure 12: Europe: Share of world’s arable land and food production
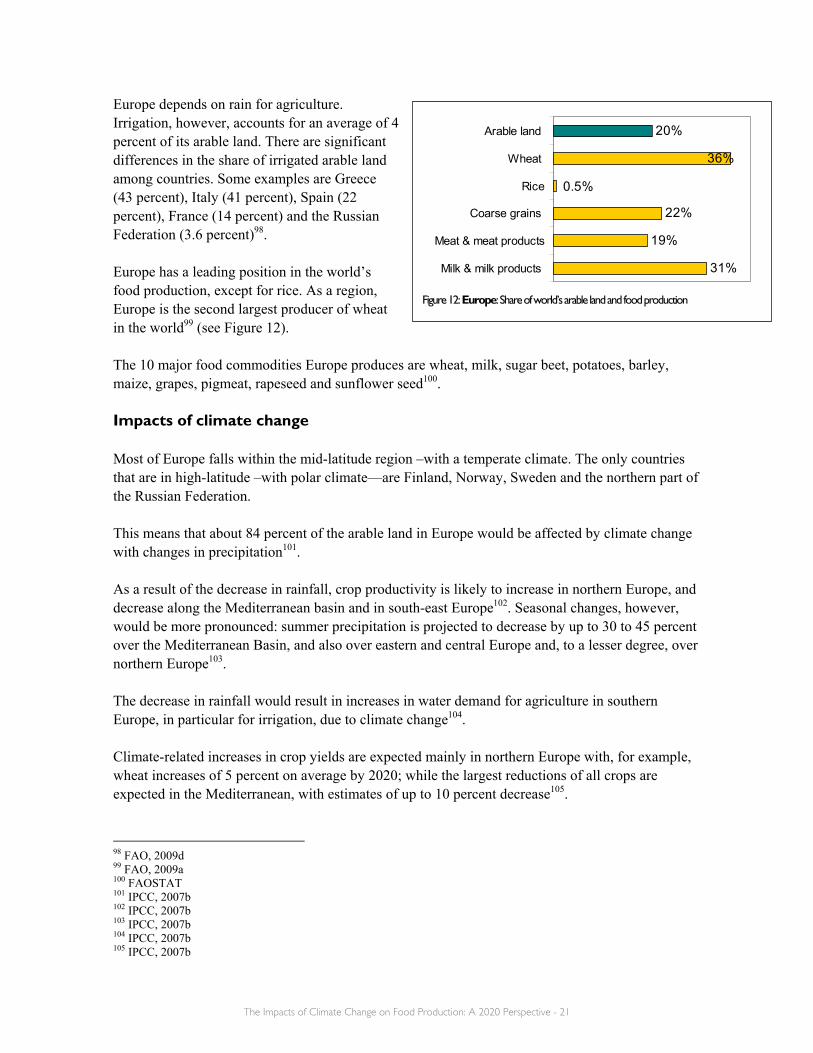
Europe depends on rain for agriculture. Irrigation, however, accounts for an average of 4 percent of its arable land. There are significant differences in the share of irrigated arable land among countries. Some examples are Greece (43 percent), Italy (41 percent), Spain (22 percent), France (14 percent) and the Russian Federation (3.6 percent)98. Europe has a leading position in the world’s food production, except for rice. As a region, Europe is the second largest producer of wheat in the world99 (see Figure 12). The 10 major food commodities Europe produces are wheat, milk, sugar beet, potatoes, barley, maize, grapes, pigmeat, rapeseed and sunflower seed100. Impacts of climate change Most of Europe falls within the mid-latitude region –with a temperate climate. The only countries that are in high-latitude –with polar climate—are Finland, Norway, Sweden and the northern part of the Russian Federation. This means that about 84 percent of the arable land in Europe would be affected by climate change with changes in precipitation101. As a result of the decrease in rainfall, crop productivity is likely to increase in northern Europe, and decrease along the Mediterranean basin and in south-east Europe102. Seasonal changes, however, would be more pronounced: summer precipitation is projected to decrease by up to 30 to 45 percent over the Mediterranean Basin, and also over eastern and central Europe and, to a lesser degree, over northern Europe103. The decrease in rainfall would result in increases in water demand for agriculture in southern Europe, in particular for irrigation, due to climate change104. Climate-related increases in crop yields are expected mainly in northern Europe with, for example, wheat increases of 5 percent on average by 2020; while the largest reductions of all crops are expected in the Mediterranean, with estimates of up to 10 percent decrease105.
98 FAO, 2009d 99 FAO, 2009a 100 FAOSTAT 101 IPCC, 2007b 102 IPCC, 2007b 103 IPCC, 2007b 104 IPCC, 2007b 105 IPCC, 2007b
The Impacts of Climate Change on Food Production: A 2020 Perspective - 22
8.5%8.5%
588 million 2010
657.7 million 2020
Figure 13: Latin America and the Caribbean: Share of the world’s population in 2010 and 2020
Countries in Europe most likely to be impacted by climate change are:
Negative Impacts –the Mediterranean region, with a reduction of all crops. Staples of this region include, for example:
• Grapes, with Italy, Spain and France ranking at first, fourth and fifth in the world production. Combined, these three countries represent 30 percent of the world’s production of grapes. Some of the finest wines in the world are currently produced in these countries. Excessive warming will affect vineyards, reducing the quality of yields and affecting wine quality. Grapes represent the fourth food commodity produced in Italy and Spain, and the seventh in France106.
• Olives, with Spain, Italy and Greece as the top three world producers, and Portugal ranking as number nine. Combined, these four countries account for 66 percent of the production of olives in the world. Olives represent the fifth, seventh, second and seventh commodity produced in these Mediterranean countries, respectively107.
Another major food staple in the Mediterranean region is wheat. France, Spain, Greece and Italy combined produce 8 percent (56.5 million tons) of the world’s wheat108.
Positive Impacts –Northern Europe, with increases of between 3 to 4 percent in wheat yields by 2020. Norway, Finland and Sweden combined account today for 1.4 percent (3.4 million
tons109) of the total European wheat production; and 0.5 percent of the current world’s production. The yield increase represents, on average, 120,000 more tons of wheat produced in these three countries.
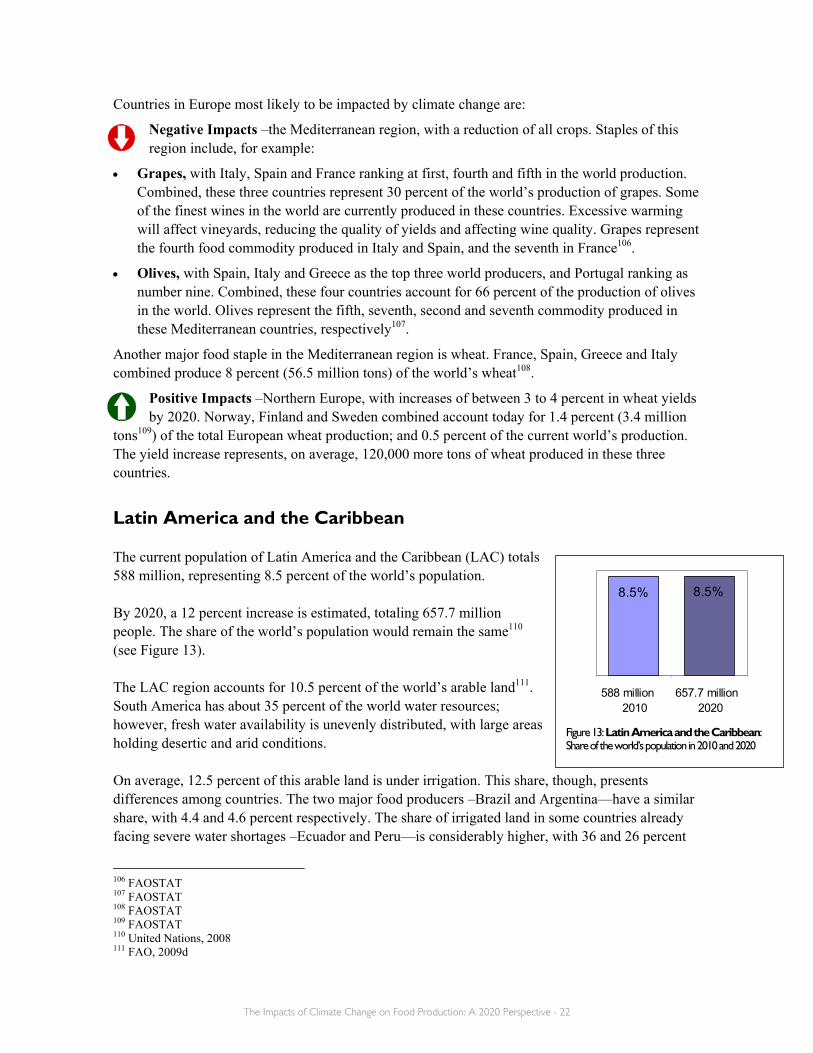
Latin America and the Caribbean The current population of Latin America and the Caribbean (LAC) totals 588 million, representing 8.5 percent of the world’s population. By 2020, a 12 percent increase is estimated, totaling 657.7 million people. The share of the world’s population would remain the same110 (see Figure 13). The LAC region accounts for 10.5 percent of the world’s arable land111. South America has about 35 percent of the world water resources; however, fresh water availability is unevenly distributed, with large areas holding desertic and arid conditions. On average, 12.5 percent of this arable land is under irrigation. This share, though, presents differences among countries. The two major food producers –Brazil and Argentina—have a similar share, with 4.4 and 4.6 percent respectively. The share of irrigated land in some countries already facing severe water shortages –Ecuador and Peru—is considerably higher, with 36 and 26 percent
106 FAOSTAT 107 FAOSTAT 108 FAOSTAT 109 FAOSTAT 110 United Nations, 2008 111 FAO, 2009d
The Impacts of Climate Change on Food Production: A 2020 Perspective - 23
10.5%
3%
4%
12%
15%
11%Milk & milk products
Meat & meat products
Coarse grains
Rice
Wheat
Arable land
Figure 14: Latin America and the Caribbean: Share of world’s arable land and food production
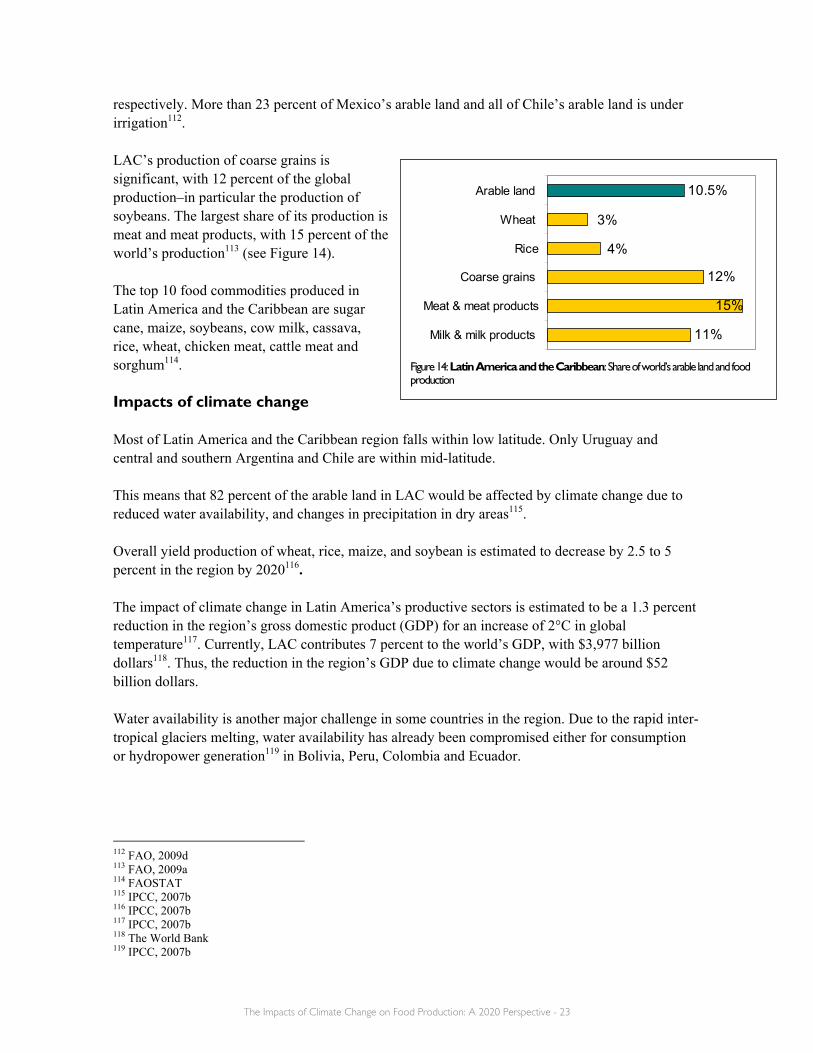
respectively. More than 23 percent of Mexico’s arable land and all of Chile’s arable land is under irrigation112. LAC’s production of coarse grains is significant, with 12 percent of the global production–in particular the production of soybeans. The largest share of its production is meat and meat products, with 15 percent of the world’s production113 (see Figure 14). The top 10 food commodities produced in Latin America and the Caribbean are sugar cane, maize, soybeans, cow milk, cassava, rice, wheat, chicken meat, cattle meat and sorghum114. Impacts of climate change Most of Latin America and the Caribbean region falls within low latitude. Only Uruguay and central and southern Argentina and Chile are within mid-latitude. This means that 82 percent of the arable land in LAC would be affected by climate change due to reduced water availability, and changes in precipitation in dry areas115. Overall yield production of wheat, rice, maize, and soybean is estimated to decrease by 2.5 to 5 percent in the region by 2020116. The impact of climate change in Latin America’s productive sectors is estimated to be a 1.3 percent reduction in the region’s gross domestic product (GDP) for an increase of 2°C in global temperature117. Currently, LAC contributes 7 percent to the world’s GDP, with $3,977 billion dollars118. Thus, the reduction in the region’s GDP due to climate change would be around $52 billion dollars. Water availability is another major challenge in some countries in the region. Due to the rapid inter-tropical glaciers melting, water availability has already been compromised either for consumption or hydropower generation119 in Bolivia, Peru, Colombia and Ecuador.
112 FAO, 2009d 113 FAO, 2009a 114 FAOSTAT 115 IPCC, 2007b 116 IPCC, 2007b 117 IPCC, 2007b 118 The World Bank 119 IPCC, 2007b
The Impacts of Climate Change on Food Production: A 2020 Perspective - 24
Countries in LAC most likely to be impacted by climate change are:
Negative Impacts– About 13 percent (105 million tons) of the world’s production of maize is currently produced in Brazil, Mexico and Argentina combined –third, fourth and fifth largest
producers120. Countries estimated to be most negatively impacted are:
• Brazil is estimated to experience 15 percent yield reduction in maize121. Brazil produces 7 percent (58.9 million tons) of the world’s total maize122.
• Argentina will experience reductions in yields from maize of up to 5 percent123. Current production of maize in Argentina represents 2.6 percent (22 million tons) of the total maize production in the world124.
Also, Brazil is estimated to experience a 30 percent yield reduction in wheat125. Brazil produces less than one percent (6 million tons) of the world’s total wheat production126.
Positive Impacts –Almost 50 percent of the soybean produced in the world (113.9 million tons) is grown in five countries in LAC: Brazil, Argentina, Paraguay, Bolivia and Uruguay127.
Countries estimated to be most positively impacted are:
• Argentina, with estimated yield increases of up to 42 percent128. Current production represents 20 percent (46.2 million tons) of the world’s total. Argentina is the third largest soybean producer in the world129.
• Brazil, with estimated yield increases of up to 21 percent130. Current production represents 26 percent (59.2 million tons) of the world’s total, positioning Brazil as the second largest soybean producer in the world131.
Also, Argentina is estimated to experience a 3 percent increase in wheat. However, if temperature increases more than 3ºC, a 4 percent reduction might be experienced132. Wheat production in Argentina represents 1.2 percent (8.5 million tons) of the world’s total133.
120 FAOSTAT 121 IPCC, 2007b 122 FAOSTAT 123 IPCC, 2007b 124 FAOSTAT 125 IPCC, 2007b 126 FAOSTAT 127 FAOSTAT 128 IPCC, 2007b 129 FAOSTAT 130 IPCC, 2007b 131 FAOSTAT 132 IPCC, 2007b 133 FAOSTAT

The Impacts of Climate Change on Food Production: A 2020 Perspective - 25
5% 5%
351 million 2010
385 million 2020
Figure 15: Northern America: Share of the world’s population in 2010 and 2020
14%
17%
31%
1%
14%
15%
Milk & milk products
Meat & meat products
Coarse grains
Rice
Wheat
Arable land
Figure 16: Northern America: Share of world’s arable land and food production
Northern America The northern America region comprises two counties –Canada and the United States of America. In 2010, the population was 351 million, representing 5 percent of the world’s population. By 2020, although the share of the world’s population will remain the same, 34 million more people are estimated to live in this region, totaling 385 million134 (see Figure 15). Northern America has 15 percent of the arable land in the world135. The region depends on rainfall for agriculture. On average, only 11 percent of the arable land in northern America is irrigated –11 percent in the United States and less than 2 percent in Canada136. Northern America is the number one producing region of coarse grains (maize, sorghum, barley, rye, oats and millet), totaling 31 percent of the world’s production. In particular, the production of maize is the largest in the world, with 39 percent137. The United States is the largest user of grains for biofuel production138, where maize has been increasingly used as feedstock for the production of ethanol. The maize-based ethanol production has rapidly expanded in the United States, representing around 30 percent of its total domestic utilization139 (see Figure 16). The top 10 food commodities produced in northern America are maize, wheat, milk, soybeans, sugar cane, sugar beet, potatoes, chicken, barley and rapeseed140. Impacts of climate change All of the United States (except for the states of Alaska in the North and Florida in the South) and the southern part of Canada fall within mid-latitude –with a temperate climate. This means changes in precipitation due to the increase in global temperature in almost all of the United States and the southern half of Canada. Overall, decreased precipitation would create important challenges for the United States, restricting the availability of water for irrigation141.
134 United Nations, 2008 135 FAO, 2009d 136 FAO, 2009d 137 FAO, 2009a 138 FAO, 2009a 139 FAO, 2009f 140 FAOSTAT 141 IPCC, 2007b

The Impacts of Climate Change on Food Production: A 2020 Perspective - 26
0.5% 0.5%
36 million 2010
40.7 million 2020
Figure 17: Oceania: Share of the world’s population in 2010 and 2020
Temperature increase has already negatively impacted the two major crop producing regions in the United States. From 1982 to 1998, the Corn (Western) and Wheat Belts (Great Plains) decreased yields by 17 percent for each 1°C of warm-temperature anomaly142.
Regions within northern America most likely to be impacted by climate change are:
Negative Impacts –the western region of the United States will suffer a decrease in water resources due to climate change. Wine grapes in California are likely to suffer decreases in yields, quality, or both.143 Grapes represent the top crop in this US state—with $3.9 billion in annual gross production revenue– positioning the United States as the third largest producer of grapes in the world144.
Positive Impacts–some assessments for corn, soybean and wheat project yield increases of 5 to 20 percent over the first decades of the century. The Unites States leads the world
production of maize and soybean, and ranks as the third producer of wheat. Canada is the 11th world producer for maize, seventh for soybean, and sixth for wheat. Combined, the United States and Canadian production of wheat totals 13 percent (85 million tons) of the world’s production; 38 percent (317 million tons) of the maize world’s total; and 36 percent (84 million tons) of soybean145. However, an increase in temperature (increased climate sensitivity) is anticipated in the United States Corn Belt (negatively impacting corn and soybean), but not in the Great Plains (for wheat)146.
Oceania Oceania has the lowest share of the world’s population –a 0.5 percent, totaling 36 million in 2010. By 2020, the share will remain the same, but 5 million additional people will be living in this region, totaling 40.7 million147 (see Figure 17). The available arable land in this region totals three percent of the world’s arable land, mainly dominated by only one (Australia, with 97 percent of the arable land) of the 11 countries in the region148. On average, only 7 percent of the arable land in Oceania is irrigated. The remaining 93 percent depends on rainfall. This share, however, is mainly in New Zealand (with almost 60 percent of its arable land irrigated) and Australia (6 percent)149.
142 IPCC, 2007b 143 IPCC, 2007b 144 FAOSTAT 145 FAOSTAT 146 IPCC, 2007b 147 United Nations, 2008 148 FAO, 2009d 149 FAO, 2009d

The Impacts of Climate Change on Food Production: A 2020 Perspective - 27
3%
2%
1%
3%
3%
Milk & milk products
Meat & meat products
Coarse grains
Rice
Wheat
Arable land
Figure 18: Oceania: Share of world’s arable land and food production
Oceania’s share in the world’s food production accounts for 3 percent150 of the world’s wheat production –a similar share as in Africa and LAC (see Figure 18). The 10 major commodities Oceania produces are sugar cane, milk, wheat, barley, sorghum, cattle meat, grapes, coconuts, potatoes and rapeseed151. Impacts of climate change More than half of the region falls within low-latitude, including the southern part of Australia and New Zealand. The central and northern zones of Australia and Papua New Guinea fall within mid-latitude. This means that about 66 percent of the arable land in Oceania would be impacted by climate change, with changes in precipitation and reduced water availability. The rest of the region consists of smaller islands, including Fiji and Samoa (the ones with largest share of arable land in the region), New Caledonia, Solomon Islands, Tonga and Vanuatu. The main difficulty in these island states is the limited amount of safe water, which, in turn influences the agriculture and cattle production. Overall, the region is already experiencing water security problems. As a result of reduced precipitation, water security problems are very likely to intensify152. Decreased rainfall due to climate change would also exacerbate the water problems in the region, and change land use away from drier areas. The major food producing country in the region is Australia. Impacts of climate change would be negative and positive, depending on the region:
Negative Impacts–south-western Australian regions are likely to have significant yield reductions153.
Positive Impacts –regions in north-eastern Australia are likely to have moderate increases in yields154.
Although land use changes may offset yield reductions, national median crop yields in Australia are expected to drop155. Wheat is the largest crop in Australia, ranking as the number 9 wheat producer in the world, with 3 percent (21.4 million tons) of the world’s total production156.
150 FAO, 2009a 151 FAOSTAT 152 IPCC, 2007b 153 IPCC, 2007b 154 IPCC, 2007b 155 IPCC, 2007b 156 FAOSTAT

The Impacts of Climate Change on Food Production: A 2020 Perspective - 28
VI. Food Consumption: Needs and Trends Food provides nutritional support for our bodies. What we eat is assimilated by our bodies to produce energy, stimulate growth, and maintain life. Good nutrition –an adequate, well balanced diet– is a cornerstone of good health. Poor nutrition can lead to reduced immunity, increased susceptibility to disease, impaired physical and mental development, and reduced productivity157. Food requirements for a healthy diet Various and distinct interrelated characteristics, such as age, gender, body size, and physical activity, demand different energy requirements. Thus, there are not specific recommended amounts of food (or dietary) energy needed for a healthy diet. In general terms, basic food requirements include macronutrients –carbohydrates, proteins and fats—and micronutrients such as vitamins and minerals. In order to support and maintain health and good nutrition, average food requirements, described in terms of the proportions of the various energy sources158, should include:
• Total carbohydrate –55 to 75 percent. Carbohydrates come from starchy foods. These include grains like wheat, rice and maize; and roots and tubers like potatoes, sweet potatoes and cassava. Carbohydrates provide energy for physical activity, generating warmth and growth and repairing body tissues.
• Protein –10 to 15 percent. Proteins are provided by meat, fish, eggs and milk, but also come from plant foods like legumes. Proteins build our bodies, construct muscle, body fluids, and antibodies, and fortify the immune system.
• Total fat –15 to 30 percent, although an average of at least 20 percent is consistent with good health. There are various types of fats: unsaturated fats (vegetable oils and nuts) are healthier than saturated fats (butter and processed meat) and trans-fats (from solidified vegetable fats). Fats are a vital source of energy for physical activity, growth, and health, and help our bodies to absorb fat soluble vitamins from food, like Vitamins A and E.
Additionally, 400 grams (about five portions) per day of fruit and vegetables are recommended. Fruits and vegetables are good sources of vitamins and minerals (e.g.: vitamin A, vitamin C, potassium, among many others). Food consumption trends For the last two decades, trends in the share of food products consumed in the world have not significantly changed.
157 WHO 158 WHO, 2003
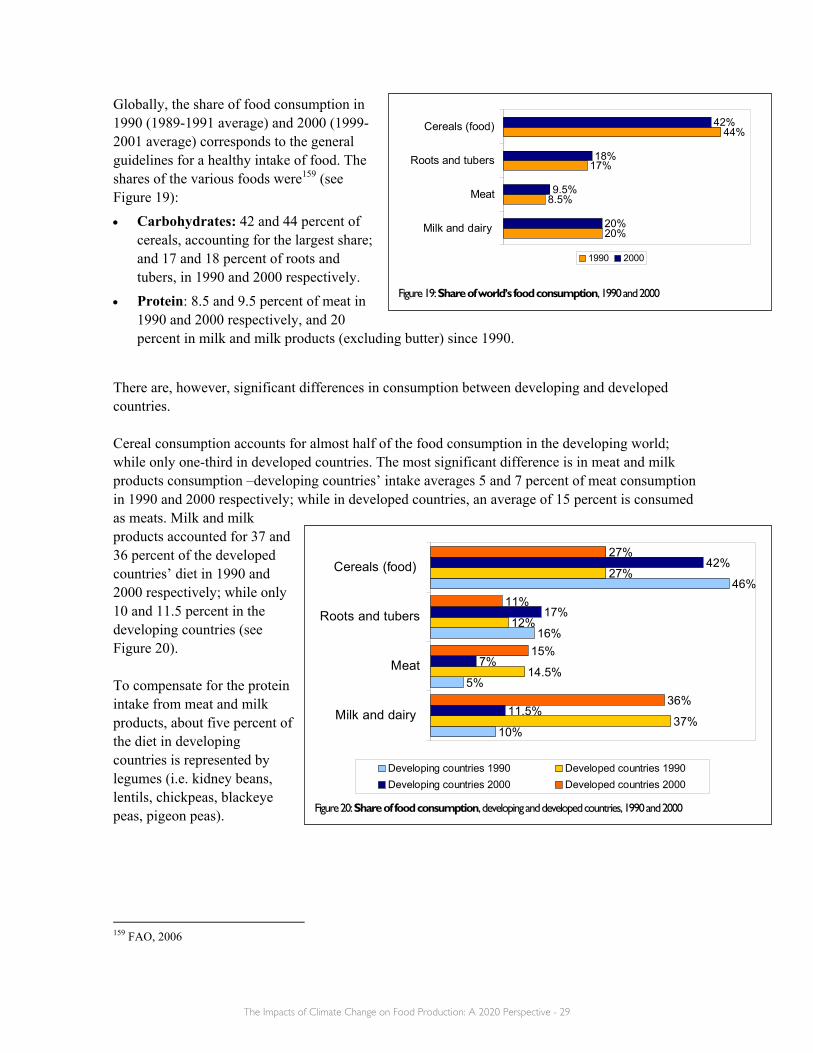
The Impacts of Climate Change on Food Production: A 2020 Perspective - 29
20%
44%
20%
18%
42%
17%
8.5%9.5%
Milk and dairy
Meat
Roots and tubers
Cereals (food)
1990 2000
Figure 19: Share of world’s food consumption, 1990 and 2000
10%
5%
46%
37%
12%
27%
7%
17%
42%
36%
15%
11%
27%
16%
14.5%
11.5%Milk and dairy
Meat
Roots and tubers
Cereals (food)
Developing countries 1990 Developed countries 1990Developing countries 2000 Developed countries 2000
Figure 20: Share of food consumption, developing and developed countries, 1990 and 2000
Globally, the share of food consumption in 1990 (1989-1991 average) and 2000 (1999-2001 average) corresponds to the general guidelines for a healthy intake of food. The shares of the various foods were159 (see Figure 19): • Carbohydrates: 42 and 44 percent of
cereals, accounting for the largest share; and 17 and 18 percent of roots and tubers, in 1990 and 2000 respectively.
• Protein: 8.5 and 9.5 percent of meat in 1990 and 2000 respectively, and 20 percent in milk and milk products (excluding butter) since 1990.
There are, however, significant differences in consumption between developing and developed countries. Cereal consumption accounts for almost half of the food consumption in the developing world; while only one-third in developed countries. The most significant difference is in meat and milk products consumption –developing countries’ intake averages 5 and 7 percent of meat consumption in 1990 and 2000 respectively; while in developed countries, an average of 15 percent is consumed as meats. Milk and milk products accounted for 37 and 36 percent of the developed countries’ diet in 1990 and 2000 respectively; while only 10 and 11.5 percent in the developing countries (see Figure 20). To compensate for the protein intake from meat and milk products, about five percent of the diet in developing countries is represented by legumes (i.e. kidney beans, lentils, chickpeas, blackeye peas, pigeon peas).
159 FAO, 2006

The Impacts of Climate Change on Food Production: A 2020 Perspective - 30
VII. Food Requirements by 2020 By 2020, food production should increase by about 13 percent, to meet the demand of a global population of 7.8 billion –an additional 890 million people. Based on current production and consumption figures of key food commodities, some concrete projections include:
1. Wheat • Current total production: 683.4 million tons160 • Production needed by 2020: 772.3 million tons
This means that an additional 88.9 million tons would be needed. This amount is comparable to the wheat production of India (second largest wheat producer, with 78.5 million tons in 2008) or the United States (third largest wheat producer in the world, totaling 68 million tons in 2008)161.
2. Rice
• Current global production (paddy): 685.8 million tons162.
• Production needed by 2020 (paddy): 775.1 million tons
This means that an additional 89.2 million tons of paddy rice would be needed. This equals about 45 percent of the production of China (largest rice producer in the world, with 193 million tons in 2008) or about 60 percent of the production of India (second largest producer, with 148 million tons in 2008)163.
3. Maize
• Current total production: 826.2 million tons164
• Production needed by 2020: 933.7 million tons
This means that an additional 107.5 million tons would be needed. This equals one third of the maize production of the United States (largest maize producer in the world, with 307 million tons in 2008) or 65 percent of the maize production of China (second world producer, with 166 million tons in 2008)165.
4. Soybean
• Current total production: 230.5 million tons166
• Production needed by 2020: 260.5 million tons
160 FAOSTAT 161 FAOSTAT 162 FAOSTAT 163 FAOSTAT 164 FAOSTAT 165 FAOSTAT 166 FAOSTAT

The Impacts of Climate Change on Food Production: A 2020 Perspective - 31
This means that an additional 30 million tons would be needed. This equals almost 40 percent of the soybean production of the United States (largest soybean producer in the world, with 80.7 million tons in 2008) or half of the soybean production of Brazil (second soybean world producer, with 59.2 million tons in 2008)167.
5. Meat and meat products
• Current total production: 282.1 million tons168
• Production needed by 2020: 318.8 million tons
This means that an additional 36.7 million tons would be needed. This equals around 85 percent of the total meat production of the European Union or the United States (with 44.1 and 42.9 million tons respectively in 2008)169.
6. Milk and milk products
• Current total production: 687.7 million tons170
• Production needed by 2020: 777.2 million tons
This means that an additional 89.5 million tons would be needed. This amount is comparable to the total production in the United States (with 86.2 million tons in 2008)171.
7. Fish (capture and aquaculture)
• Current total production: 141.6 million tons172
• Production needed by 2020: 160 million tons
This means that an additional 18.4 million tons would be needed. This amount is comparable to 40 percent of the production in China (largest fish production in the world, with 47.5 million tons from capture and aquaculture in 2008173) or the production of India, Peru and Japan combined (with 7.5, 7.4 and 4.9 million tons respectively from capture and aquaculture in 2008)174.
167 FAOSTAT 168 FAO, 2009a 169 FAO, 2009a 170 FAO, 2009a 171 FAO, 2009a 172 FAO, 2009a 173 FAO, 2008d 174 FAO, 2008d
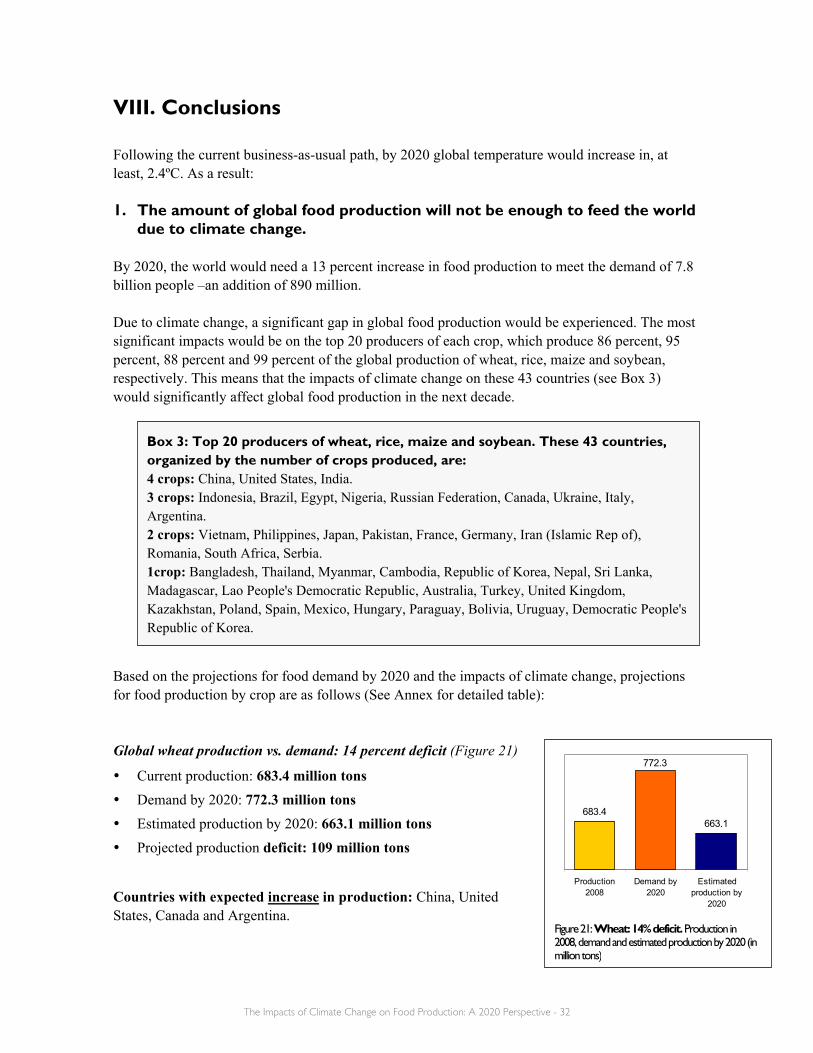
The Impacts of Climate Change on Food Production: A 2020 Perspective - 32
Box 3: Top 20 producers of wheat, rice, maize and soybean. These 43 countries, organized by the number of crops produced, are: 4 crops: China, United States, India. 3 crops: Indonesia, Brazil, Egypt, Nigeria, Russian Federation, Canada, Ukraine, Italy, Argentina. 2 crops: Vietnam, Philippines, Japan, Pakistan, France, Germany, Iran (Islamic Rep of), Romania, South Africa, Serbia. 1crop: Bangladesh, Thailand, Myanmar, Cambodia, Republic of Korea, Nepal, Sri Lanka, Madagascar, Lao People's Democratic Republic, Australia, Turkey, United Kingdom, Kazakhstan, Poland, Spain, Mexico, Hungary, Paraguay, Bolivia, Uruguay, Democratic People's Republic of Korea.
683.4663.1
772.3
Production2008
Demand by2020
Estimatedproduction by
2020
Figure 21: Wheat: 14% deficit. Production in 2008, demand and estimated production by 2020 (in million tons)
VIII. Conclusions Following the current business-as-usual path, by 2020 global temperature would increase in, at least, 2.4ºC. As a result: 1. The amount of global food production will not be enough to feed the world
due to climate change. By 2020, the world would need a 13 percent increase in food production to meet the demand of 7.8 billion people –an addition of 890 million. Due to climate change, a significant gap in global food production would be experienced. The most significant impacts would be on the top 20 producers of each crop, which produce 86 percent, 95 percent, 88 percent and 99 percent of the global production of wheat, rice, maize and soybean, respectively. This means that the impacts of climate change on these 43 countries (see Box 3) would significantly affect global food production in the next decade.
Based on the projections for food demand by 2020 and the impacts of climate change, projections for food production by crop are as follows (See Annex for detailed table): Global wheat production vs. demand: 14 percent deficit (Figure 21)
Current production: 683.4 million tons Demand by 2020: 772.3 million tons Estimated production by 2020: 663.1 million tons Projected production deficit: 109 million tons
Countries with expected increase in production: China, United States, Canada and Argentina.
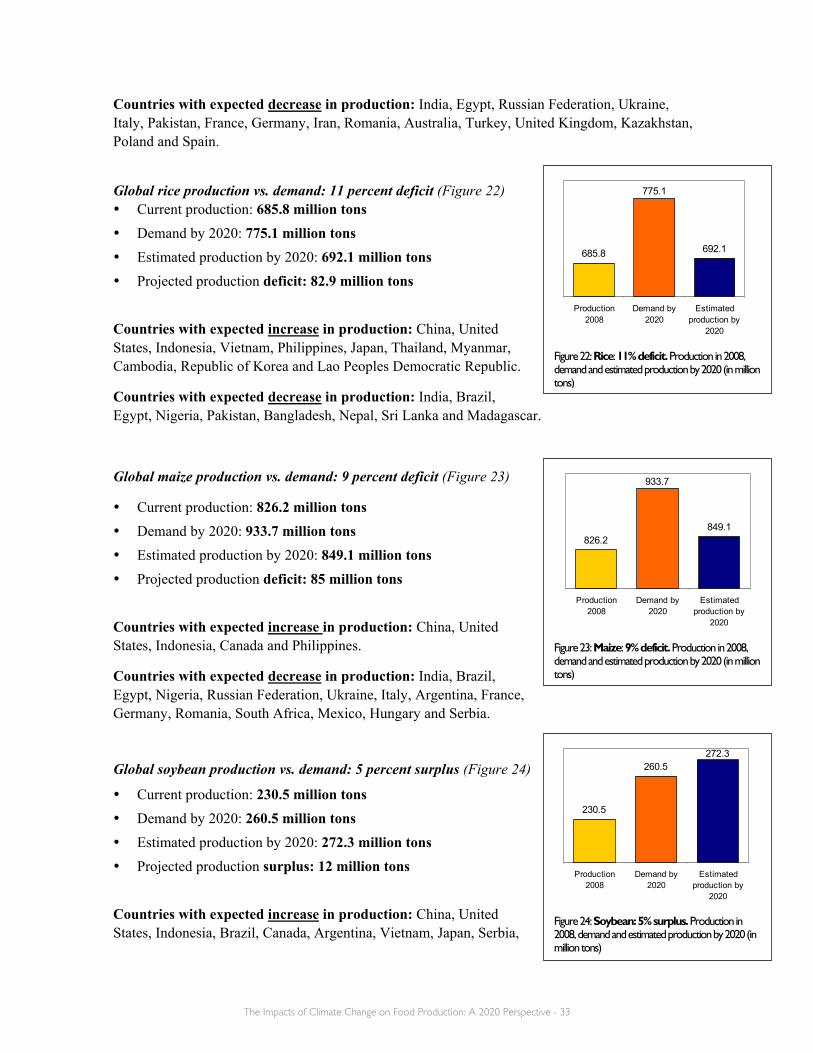
The Impacts of Climate Change on Food Production: A 2020 Perspective - 33
230.5
260.5272.3
Production2008
Demand by2020
Estimatedproduction by
2020
Figure 24: Soybean: 5% surplus. Production in 2008, demand and estimated production by 2020 (in million tons)
685.8 692.1
775.1
Production2008
Demand by2020
Estimatedproduction by
2020
Figure 22: Rice: 11% deficit. Production in 2008, demand and estimated production by 2020 (in million tons)
826.2849.1
933.7
Production2008
Demand by2020
Estimatedproduction by
2020
Figure 23: Maize: 9% deficit. Production in 2008, demand and estimated production by 2020 (in million tons)
Countries with expected decrease in production: India, Egypt, Russian Federation, Ukraine, Italy, Pakistan, France, Germany, Iran, Romania, Australia, Turkey, United Kingdom, Kazakhstan, Poland and Spain.
Global rice production vs. demand: 11 percent deficit (Figure 22) Current production: 685.8 million tons Demand by 2020: 775.1 million tons Estimated production by 2020: 692.1 million tons Projected production deficit: 82.9 million tons
Countries with expected increase in production: China, United States, Indonesia, Vietnam, Philippines, Japan, Thailand, Myanmar, Cambodia, Republic of Korea and Lao Peoples Democratic Republic.
Countries with expected decrease in production: India, Brazil, Egypt, Nigeria, Pakistan, Bangladesh, Nepal, Sri Lanka and Madagascar.
Global maize production vs. demand: 9 percent deficit (Figure 23)
Current production: 826.2 million tons Demand by 2020: 933.7 million tons Estimated production by 2020: 849.1 million tons Projected production deficit: 85 million tons
Countries with expected increase in production: China, United States, Indonesia, Canada and Philippines.
Countries with expected decrease in production: India, Brazil, Egypt, Nigeria, Russian Federation, Ukraine, Italy, Argentina, France, Germany, Romania, South Africa, Mexico, Hungary and Serbia.
Global soybean production vs. demand: 5 percent surplus (Figure 24)
Current production: 230.5 million tons Demand by 2020: 260.5 million tons Estimated production by 2020: 272.3 million tons Projected production surplus: 12 million tons
Countries with expected increase in production: China, United States, Indonesia, Brazil, Canada, Argentina, Vietnam, Japan, Serbia,

The Impacts of Climate Change on Food Production: A 2020 Perspective - 34
Paraguay, Bolivia, Uruguay and Democratic People's Republic of Korea.
Countries with expected decrease in production: India, Nigeria, Russian Federation, Ukraine, Italy, Iran and South Africa.
The resulting balance between deficits and surplus in these food crops would not only impact global availability of these crops for food, but also have a significant impact on livestock and fisheries. Meat and milk products would experience a deficit in production, due to the decrease in feedstock as well as the quality and extent of rangeland for animals175. As for fish, three-quarters of global fisheries are currently fully exploited, overexploited or depleted176. Climate change will affect freshwater and marine ecosystems for fish –higher temperatures will negatively affect the distribution of many fish species due to the associated increase in the temperature of the water. Aquaculture production would need to increase, to cope with the decrease of capture production due to climate-induced changes in natural aquatic ecosystems (i.e.: loss of biodiversity, water pollution and changes in water resources). One example is the estimated more than 10 percent lose of fish species in rivers globally177. 2. Global food prices would increase
Agricultural commodity prices are mainly determined by demand and supply. Scientists estimate that for a 2.4ºC increase in temperature, global agricultural prices would increase up to 20 percent178. Countries with estimated increases in food commodities would prioritize meeting the food demands of their own growing population. Thus, surplus in production may be stocked up; and if exported, be considerably more expensive due to increased demand from those countries with estimated decreased in food commodities. Recent evidence shows impacts of climate change on food production and supply in 2008, registering reductions as a result of drought in major exporters and the lowest cereal stock levels for more than 30 years179. Other factors, however, were attributed to the peak in prices in 2008. Increased demand for certain agricultural products as feedstocks for biofuel production, particularly maize for ethanol180, was identified as one the major drivers. The increased use of grains for biofuel would also reduce availability for food.
175 IPCC, 2007b 176 IPCC, 2007b 177 IPCC, 2007b 178 IPCC, 2007b 179 FAO, 2009f 180 FAO, 2009f
The Impacts of Climate Change on Food Production: A 2020 Perspective - 35
By mid-2008, prices of basic foods on international markets reached their highest levels for 30 years181. Some countries may be able to afford increased prices for some food commodities in the next decade; while others may not. This would impact the amount of food that some households, especially in developing countries, would be able to purchase for consumption. The impact of high food prices is most severe for the poor who rely on purchased food. Food expenditures can account for at least 50 percent and up to 70–80 percent of household budgets in developing countries; while for most developed countries, food expenditure shares range between 10 and 20 percent of household budgets182. 3. The share of hunger would inevitability increase Increased food prices coupled with reduced food availability due to climate change would significantly exacerbate world hunger. As a consequence, the number of undernourished in the world would inevitability increase. In 2007 and 2008, because of high food prices, an additional 115 million people were pushed into chronic hunger183. The major impact of malnutrition and undernourishment is on women and children, in particular in the developing world. Low birthweight, which is related to maternal malnutrition, is a causal factor in 60–80 per cent of neonatal deaths184. Today, 10.9 million children under five die each year in developing countries. Malnutrition and hunger-related diseases cause 60 percent of the deaths185. This represents 6.5 million unnecessary and preventable deaths a year –about 18,000 deaths a day. By 2020, when food requirements for an additional 890 million people would need to be met, the number of undernourished could increase to up to 70 percent. The share of hunger could increase to one in every five people. In the next decade, at least every other newborn in Africa, one in every four newborns in Asia; and one in every seven newborns in Latin America and the Caribbean would be sentenced to undernourishment and malnutrition. Malnutrition and hunger-related diseases could almost double the number of deaths of children under five in the next 10 years.
181 FAO, 2009f 182 FAO, 2009f 183 FAO, 2009f 184 UNICEF, 2009 185 UNICEF, 2007
The Impacts of Climate Change on Food Production: A 2020 Perspective - 36
Box 4: The Framework Convention on Climate Change
The United Nations Framework Convention on Climate Change (UNFCCC) was signed in 1992, and entered into force two years later. The ultimate objective of the Convention is to achieve ‘stabilization of greenhouse gas concentrations in the atmosphere at a level that would prevent dangerous anthropogenic interference with the climate system’ (UNFCCC, Article 2).
Because the Convention does not establish targets or timeframes for developed countries to reduce GHG emissions, an international agreement linked to the UNFCCC was adopted in 1997 –the Kyoto Protocol.
The Kyoto Protocol sets binding targets for 37 industrialized countries and the European community for reducing GHG emissions. Using 1990 as the baseline year, the commitments of the Kyoto Protocol average five percent GHG emission reductions over the five-year period 2008-2012.
Emissions from developing countries are not limited by the UNFCCC or the Kyoto Protocol.
IX. Actions Needed to Address the Gap A set of actions can be taken today to avoid the impacts of climate change on food production. These include: 1. Reduce GHG emissions In order to address the threats from climate change, reducing GHG emissions is the first and most important step. These actions are referred to as mitigation of climate change. Efforts so far have been numerous, but unsuccessful. The annual meetings among world leaders and negotiators at the United Nations Framework Convention on Climate Change (UNFCCC) failed to produce a formal agreement to reduce GHG emissions. Global GHG emissions have already exceeded the levels projected by the IPCC as the safe upper limit, which would increase the global surface temperature in an additional 1ºC. Currently, global GHG emissions are steadily increasing to a level determined to be dangerous186 –more than 2ºC. To avoid a dangerous increase in temperature, scientists at the IPCC concluded that developed countries as a group would need to reduce their emissions by 2020 in the range of 25 to 40 percent below 1990 levels. Further reductions would be needed by 2050 (40 to 95 percent below 1990 levels), even if developing countries make substantial reductions187. This recommendation is based on what the UNFCCC establishes (see Box 4). Based on the share of emissions, industrialized countries have a higher burden of responsibility to reduce GHG than developing countries. This is because 41 industrialized countries, representing 21 percent of the world, account for almost 50 percent of the global GHG emissions, while 153 developing countries are responsible for the other half. Thus, the Convention limits GHG emissions for industrialized countries, while developing countries have the common responsibility to reduce their emissions, under the principle of ‘common but differentiated responsibilities188’. This principle has caused a deadlock in the negotiations.
186 AGGG, 1986 187 IPCC, 2007c 188 UNFCCC, Article 3
The Impacts of Climate Change on Food Production: A 2020 Perspective - 37
Industrialized countries, on the one hand, are reluctant to commit to reducing their emissions unless developing countries commit too. Developing countries, on the other hand, argue that their contribution to global GHG emissions has not been as significant compared to industrialized countries, thus are also reluctant to commit. Although positions may be in conflict, the fact is that neither industrialized nor developing countries have adopted an agreement to reduce GHG emissions to a level which would avoid a dangerous increase in global temperature. Besides, the increasing demand for food, transportation and energy to meet the requirements from a growing population, especially in the developing world, would likely increase GHG emissions from these countries. This would only aggravate the current situation. Despite disparate positions, the Copenhagen Accord (2009) resulted in commitments from industrialized countries for emission reductions by 2020. These commitments were issued as pledges towards emissions reductions of GHGs, ranging from 5 to 25 percent. Although these pledges represent a starting point, on average they do not meet the emission reduction levels recommended by the IPCC. Also, they are not legally-binding. In addition, most of these pledges were stated under the premise of the establishment of a fair and effective international framework in which all major economies would participate. In addition, the Copenhagen Accord established a commitment by industrialized countries to provide financial resources of $30 billion dollars for the period 2010-2012; and mobilize jointly $100 billion dollars per year by 2020. These funds would assist developing countries to develop actions against climate change, by implementing measures to reduce their GHG emissions as well as adaptation measures to cope with climate change. All of these commitments were reaffirmed by the Cancun Agreements (2010). No formal agreement, however, was reached to reduce GHG emissions; and no financial commitments were made. Coming meetings of the UNFCCC would need to reach a concrete international legally-binding agreement with clear targets and a concrete timeframe to reduce GHG emissions. Without a clear global commitment to stabilize and reduce GHG emissions, mitigation (reduction of GHG emissions) will remain as a mere intention, while GHG emissions continue to rise. 2. Adapt to Climate Change Adjusting practices, developing strategies and adopting related policies can also help to cope with climate change. These actions are referred to as adaptation to climate change. These are targeted to the national level.
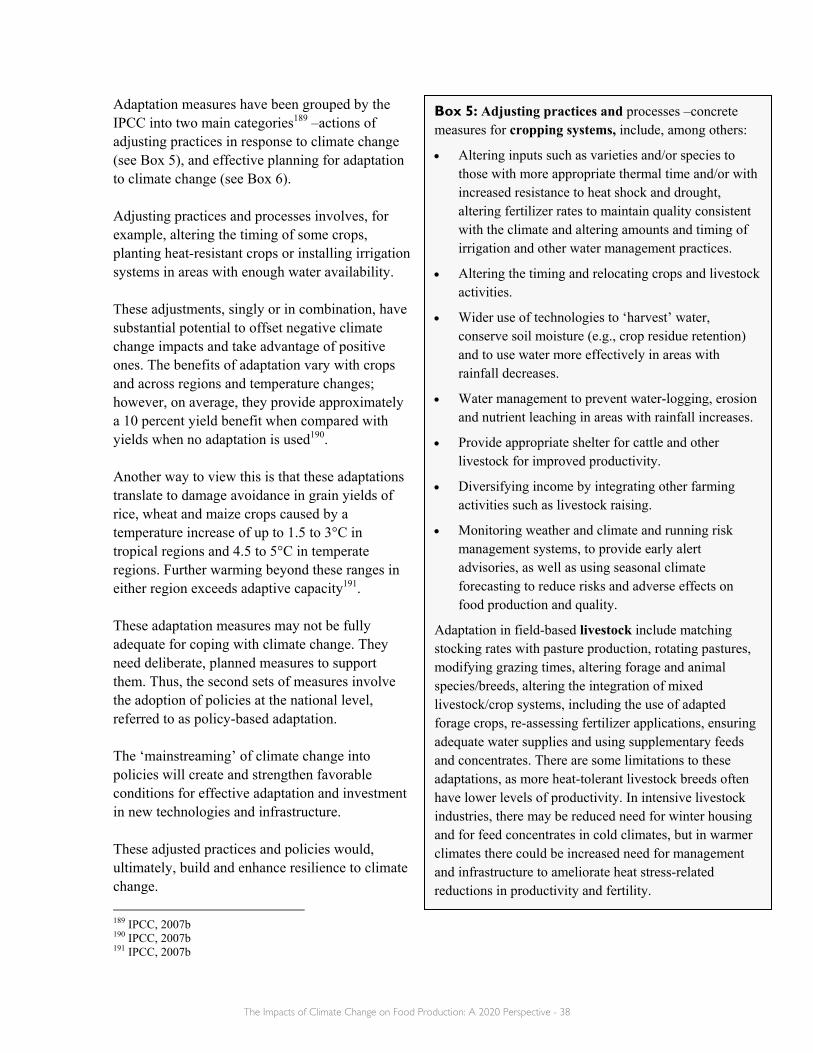
The Impacts of Climate Change on Food Production: A 2020 Perspective - 38
Box 5: Adjusting practices and processes –concrete measures for cropping systems, include, among others:
• Altering inputs such as varieties and/or species to those with more appropriate thermal time and/or with increased resistance to heat shock and drought, altering fertilizer rates to maintain quality consistent with the climate and altering amounts and timing of irrigation and other water management practices.
• Altering the timing and relocating crops and livestock activities.
• Wider use of technologies to ‘harvest’ water, conserve soil moisture (e.g., crop residue retention) and to use water more effectively in areas with rainfall decreases.
• Water management to prevent water-logging, erosion and nutrient leaching in areas with rainfall increases.
• Provide appropriate shelter for cattle and other livestock for improved productivity.
• Diversifying income by integrating other farming activities such as livestock raising.
• Monitoring weather and climate and running risk management systems, to provide early alert advisories, as well as using seasonal climate forecasting to reduce risks and adverse effects on food production and quality.
Adaptation in field-based livestock include matching stocking rates with pasture production, rotating pastures, modifying grazing times, altering forage and animal species/breeds, altering the integration of mixed livestock/crop systems, including the use of adapted forage crops, re-assessing fertilizer applications, ensuring adequate water supplies and using supplementary feeds and concentrates. There are some limitations to these adaptations, as more heat-tolerant livestock breeds often have lower levels of productivity. In intensive livestock industries, there may be reduced need for winter housing and for feed concentrates in cold climates, but in warmer climates there could be increased need for management and infrastructure to ameliorate heat stress-related reductions in productivity and fertility.
Adaptation measures have been grouped by the IPCC into two main categories189 –actions of adjusting practices in response to climate change (see Box 5), and effective planning for adaptation to climate change (see Box 6). Adjusting practices and processes involves, for example, altering the timing of some crops, planting heat-resistant crops or installing irrigation systems in areas with enough water availability. These adjustments, singly or in combination, have substantial potential to offset negative climate change impacts and take advantage of positive ones. The benefits of adaptation vary with crops and across regions and temperature changes; however, on average, they provide approximately a 10 percent yield benefit when compared with yields when no adaptation is used190. Another way to view this is that these adaptations translate to damage avoidance in grain yields of rice, wheat and maize crops caused by a temperature increase of up to 1.5 to 3°C in tropical regions and 4.5 to 5°C in temperate regions. Further warming beyond these ranges in either region exceeds adaptive capacity191. These adaptation measures may not be fully adequate for coping with climate change. They need deliberate, planned measures to support them. Thus, the second sets of measures involve the adoption of policies at the national level, referred to as policy-based adaptation. The ‘mainstreaming’ of climate change into policies will create and strengthen favorable conditions for effective adaptation and investment in new technologies and infrastructure. These adjusted practices and policies would, ultimately, build and enhance resilience to climate change. 189 IPCC, 2007b 190 IPCC, 2007b 191 IPCC, 2007b
The Impacts of Climate Change on Food Production: A 2020 Perspective - 39
Box 6: Policy-based adaptation –Options can either involve adaptation activities such as developing infrastructure or building the capacity to adapt by changing the decision-making environment under which management-level adaptation activities occur. Effective planning and capacity building for adaptation to climate change could include: • To change their management, enterprise managers need to be convinced that the climate changes are real and
are likely to continue. This will be assisted by policies that maintain climate monitoring and communicate this information effectively.
• Managers need to be confident that the projected changes will significantly impact on their enterprise. This could be assisted by policies that support the research, systems analysis, extension capacity, and industry and regional networks that provide this information.
• There needs to be technical and other options available to respond to the projected changes. Where the existing technical options are inadequate to respond, investment in new technical or management options may be required (e.g., improved crops) or old technologies revived in response to the new conditions.
• Where there are major land use changes, industry location changes and migration, there may be a role for governments to support these transitions via direct financial and material support, creating alternative livelihood options.
• Developing new infrastructure, policies and institutions to support the new management and land use arrangements by addressing climate change in development programs, and enhanced investment in irrigation infrastructure and efficient water use technologies, among others.
• The capacity to make continuing adjustments and improvements in adaptation by understanding what is working, what is not and why, via targeted monitoring of adaptations to climate change and their costs and effects.
3. Change dietary habits Changes in dietary habits can complement actions to address the decrease in food availability. Trends in food consumption for the last two decades may change by 2020 to cope with the decrease in food production due to climate change. Decreased availability of cereals could result in shifting away from cereal consumption, to an increased consumption of roots and tubers. To maintain a balanced and healthy diet, and sustain the shares of food sources, some of the changes in diet may include:
• Cereal consumption for food may shift to roots and tubers in order to maintain a healthy intake of carbohydrates. This may impact in particular developing countries, where the share of cereals for food has been on average 44 percent for the last two decades. The global production of roots and tubers would need to increase.
Potatoes represent the fourth most important crop. The increase in production would need to be in cooler temperatures, as the main constraint limiting its expansion is heat. In addition, due to its
The Impacts of Climate Change on Food Production: A 2020 Perspective - 40
susceptibility to pests and diseases, potato is the number two user of agricultural pesticides worldwide192.
Sweet potatoes, on the other hand, represent the fifth most important food crop. Its hardy nature and broad adaptability make it more suitable for expansion. Sweet potato grows well in many farming conditions and is well adapted to warm tropical lowlands; pesticides are rarely used to produce it and it can be grown in poor soils with little fertilizer193. Also, it requires less water compared to rice, maize or potato.
• Meat and meat products, and milk may shift to other sources of protein. This may impact in particular developed countries, where on average, the proportion of meat and milk consumption was 15 and 36 percent respectively for the last two decades.
• The consumption of alternative sources of protein may increase, in particular of legumes (kidney beans, lentils, chickpeas, blackeye peas, pigeon peas, among others). The protein contained in these leguminous crops is about 18-25 percent. Developing countries have relied on legumes for about 5 percent of their food intake; while developed countries have only consumed 0.5 percent of legumes for the last two decades.
Beans represent the world’s most important food legume. It is characterized by its adaptability to different cropping systems and short growing cycle. The disadvantage, however, is its susceptibility to many diseases and climatic stresses194 (extreme weather conditions).
Lentils are 25 percent protein—second only to soybeans as a source of usable protein for food. Its production can be increased significantly by shifting planting from spring to early-spring or fall, allowing optimum vegetative growth, development of higher yield potential, and higher water-use efficiency195.
192 CGIAR 193 CGIAR 194 CGIAR 195 CGIAR
Bangladesh: Already shifting from rice to potatoes
At the end of 2007, Bangladesh experienced severe floods and a cyclone, which caused a steep fall in rice production. Rice –one of Bangladesh’s main food staples— was in short supply, expensive and had to be imported. That same year saw a record potato production was produced and Bangladeshis changed their food habits by increasing their potato consumption. Currently, potatoes are Bangladesh's second largest crop after rice. (Source: Indo-Asian News Service).
The Impacts of Climate Change on Food Production: A 2020 Perspective - 41
Final Message For the last two decades, too much has been said on sustainable development. Numerous commitments, goals and targets were agreed. Not enough, however, has been effectively done. Still, economic growth remains the prime driving force of today’s world; while environmental devastation and social inequities have been significantly enhanced. The implementation of concrete actions and the adoption of appropriate policies –at both the national and international levels– would ensure balance and respect for the limitation of the environment in the promotion of economic growth. The human cost of inaction, otherwise, could be devastatingly expensive –not only for future generations, but for this one. ■

The Impacts of Climate Change on Food Production: A 2020 Perspective - 42
Annex –Projected Impacts of Climate Change on Food Production by 2020 The table below presents the top 20 producers of the four major food crops. To complete the total current production by crop, amounts for other countries were also included. Countries were grouped according to the number of crops produced. Based on amounts of current production, and considering the positive and negative impacts of climate change, projected amounts by 2020 were estimated. Amounts in red represent a decrease in production (due to negative impacts), while amounts in green represent an increase in production (due to positive impacts).
Wheat
Rice (paddy)
Maize
Soybean
Amounts in million tons
Production 2008
Production by 2020
Production 2008
Production by 2020
Production 2008
Production by 2020
Production 2008
Production by 2020
4 crops
China 112.4 134.9 193.3 232 166 199.2 15.5 18.6
United States 68 74.8 9.2 10.1 307.1 337.8 80.7 88.8
India 78.5 54.9 148.2 103.7 19.7 13.8 9.9 6.9
3 crops
Indonesia 60.2 72.3 16.3 19.5 0.7 0.9
Brazil 12 10.8 58.9 53 59.2 71.6
Egypt 7.9 3.9 7.2 3.6 6.5 3.2
Nigeria 4.1 2 7.5 3.7 0.5 0.3
Russian Federation 63.7 66.9 6.6 6 0.7 0.6
Canada 28.6 31.4 10.5 11.6 3.3 3.6
Ukraine 25.8 24.5 11.4 10.3 0.8 0.7
Italy 8.8 7.9 9.4 8.5 0.34 0.31
Argentina 8.5 8.7 22 20.9 46.2 65.6
2 crops
Vietnam 38.7 46.4 0.26 0.32
Philippines 16.8 20.1 6.9 8.3
Japan 11 13.2 0.26 0.31
Pakistan 20.9 14.6 10.4 7.2
France 39 37 15.8 14.2
Germany 25.9 24.6 5.1 4.5
Iran (Islamic Rep of) 7.9 5.5 0.19 0.13

The Impacts of Climate Change on Food Production: A 2020 Perspective - 43
Romania 7.1 6.8 7.8 7
Serbia 6.1 5.5 0.35 0.31
South Africa 12.7 6.3 0.28 0.14
1crop
Bangladesh 46.9 32.8
Thailand 31.6 37.9
Myanmar 30.5 36.6
Cambodia 7.1 8.6
Republic of Korea 6.9 8.3
Nepal 4.2 3
Sri Lanka 3.8 2.7
Madagascar 3 1.5
Lao People's Dem. Rep. 2.9 3.5
Australia 21.4 18.9
Turkey 17.7 16.8
United Kingdom 17.2 16.3
Kazakhstan 12.5 8.7
Poland 9.2 8.8
Spain 6.7 6
Mexico 24.3 20.6
Hungary 8.8 8
Paraguay 6.3 7.6
Bolivia 1.2 1.5
Uruguay 0.88 1.2
Dem. People' Rep. of Korea 0.34 0.41
Subtotal – Top 20 producers 588.6 573.1 648.8 657 730.2 762.7 228.4 270.4
Other countries 94.8 90 37 35 96 86.4 2.1 1.9
683.4 663.1 685.8 692.1 826.2 849.1 230.5 272.3 Total Wheat Rice (paddy) Maize Soybean Sources: FAOSTAT (production 2008); IPCC, 2007b and Parry et al., 2004 (estimated production by 2020).

The Impacts of Climate Change on Food Production: A 2020 Perspective - 44
Sources and References IPCC, 2007a. Climate Change 2007: The Physical Science Basis. Contribution of Working Group I to the Fourth Assessment Report of the Intergovernmental Panel on Climate Change [Solomon, S., D. Qin, M. Manning, Z. Chen, M. Marquis, K.B. Averyt, M. Tignor and H.L. Miller (eds.)]. Cambridge University Press, Cambridge, United Kingdom and New York, NY, USA.
IPCC, 2007b. Climate Change 2007: Impacts, Adaptation and Vulnerability. Contribution of Working Group II to the Fourth Assessment Report of the Intergovernmental Panel on Climate Change, M.L. Parry, O.F. Canziani, J.P. Palutikof, P.J. van der Linden and C.E. Hanson, Eds., Cambridge University Press, Cambridge, UK.
IPCC, 2007c. Climate Change 2007: Mitigation. Contribution of Working Group III to the Fourth Assessment Report of the Intergovernmental Panel on Climate Change [B. Metz, O.R. Davidson, P.R. Bosch, R. Dave, L.A. Meyer (eds)], Cambridge University Press, Cambridge, United Kingdom and New York, NY, USA
Advisory Group on Greenhouse Gases (AGGG), 1986. Joint expert group established by the World Meteorological Organization (WMO), the United Nations Environment Programme (UNEP) and the International Council of Scientific Unions (ICSU).
IIASA, 2002. Climate Change and Agricultural Vulnerability, Günther Fischer, Mahendra Shah, Harrij van Velthuizen, International Institute for Applied Systems Analysis (IIASA) (Vienna, Austria)
FAO, 2009a. Food Outlook, Global Market Analysis, Food and Agriculture Organization of the United Nations, June 2009 (Rome, Italy) June, 2009 (Rome, Italy)
FAO, 2009b. The State of Food Insecurity in the World 2009, Food and Agriculture Organization of the United Nations (Rome, Italy)
FAO, 2009c. The State of Food and Agriculture 2009, Food and Agriculture Organization of the United Nations (Rome, Italy)
FAO, 2009d. FAO Statistical Yearbook, 2009, Food and Agriculture Organization of the United Nations (Rome, Italy)
FAO, 2009f. The State of Agricultural Commodity Markets 2009, UN Food and Agriculture Organization (Rome, Italy)
FAO, 2008a. Economic and Social Development Department, Food and Agriculture Organization of the United Nations (Rome, Italy)
FAO, 2008b. The State of Food and Agriculture 2008, Food and Agriculture Organization of the United Nations (Rome, Italy)
FAO, 2008c. The State of World Fisheries and Aquaculture (SOFIA) 2008, Food and Agriculture Organization of the United Nations (Rome, Italy)
FAO, 2008d. Yearbooks of Fishery Statistics 2008, Fisheries and Aquaculture Department, Food and Agriculture Organization of the United Nations (Rome, Italy)
FAO, 2006. World agriculture: Towards 2030/2050, Prospects for food, nutrition, agriculture and major commodity groups, Food and Agriculture Organization of the United Nations (Rome, Italy)
The Impacts of Climate Change on Food Production: A 2020 Perspective - 45
FAO, 2004. The Role of Soybean in Fighting World Hunger, Food and Agriculture Organization of the United Nations (Rome, Italy)
FAO, 2003. World agriculture: Towards 2015/2030, An FAO Perspective, Food and Agriculture Organization of the United Nations (Rome, Italy)
Parry et al., 2004. Effects of climate change on global food production, Martin L. Parry, Cynthia Rosenzweig, Ana Iglesias, Mathew Livermore, Günter Fischer; Global Environmental Change 14.
United Nations, 2008. World Population Prospects: The 2008 Revision, Population Division of the Department of Economic and Social Affairs of the United Nations Secretariat (New York, USA)
United Nations, 2007. Africa Review Report on Drought and Desertification, Economic Commission for Africa, Economic and Social Council, (New York, NY, USA)
UNICEF, 2009. The State of the World’s Children: Maternal and Newborn Health, United Nations Children’s Fund - UNICEF (New York, USA)
UNICEF, 2007. The State of the World's Children: Women and Children- The Double Dividend of Gender Equality, United Nations Children’s Fund - UNICEF (New York, USA)
WMO, 2009. Greenhouse Gas Bulletin No. 5: 23 November 2009, World Meteorological Organization (Geneva, Switzerland)
WHO, 2003. Diet, Nutrition and the Prevention of Chronic Diseases, Report of a Joint WHO/FAO Expert Consultation, World Health Organization (Geneva, Switzerland).
The World Bank, 2009. World Development Report 2010, Development and Climate Change, The World Bank (Washington, DC, USA)
The World Bank, 2008. Sustainable Land Management Sourcebook (Washington, DC, USA).