Embed Size (px)
Citation preview

1
The following pages are from a book called “Protein Trafficking in Neurons” Ed. Andy Bean, published by Academic Press in 2007 Title: Molecular Mobility in Cells Examined with Optical Methods Author: M. Neal Waxham The University of Texas Medical School at Houston Department of Neurobiology and Anatomy 6431 Fannin, Room 7.254 MSB Houston, TX 77030 telephone: 713-500-5621 fax: 713-500-0621 e-mail: [email protected]
2
The efficient delivery of cellular constituents to their proper location is fundamental to all aspects of cell biology and is of particular interest to neuroscientists, in part, due to the unique and complex architecture of neurons. Compartments near the end of dendrites and, in particular axons, can be far from the cell soma and these large distances (axons can be as long as one meter) present a difficult problem for delivery of macromolecules. Diffusion due to the random walk of molecules is extremely efficient over short (μm) distances, but movement of molecules over larger distances requires active transport and expenditure of energy. A significant proportion of this book is devoted to describing the process of protein trafficking through the use of vesicle movement and active transport. The purpose of this chapter is to address the issue of protein mobility from the point of view of non-directed random walk of molecules. Whether one is interested in receptors and ion channels movement in the membrane, the range of action of a given second messenger, or the activation and movement of transcriptional factors to the nucleus, all require an understanding of the basic principles of translational diffusion. Diffusion of molecules in well-mixed dilute environments is relatively straightforward and follows a set of basic well established principles. However, the interior of cells presents a much more complex environment to a moving molecule. Macromolecular crowding, viscosity, physical barriers and specific and/or non-specific binding can each influence the distance a given molecule can travel per unit time. The goal of this chapter is to provide a brief description of each of the factors that influence translational diffusion relevant to cell biologists. A discussion of the present techniques used to quantify translational diffusion is also presented along with some examples of how each of these techniques has helped advance our understanding of molecular mobility in the cellular setting.
I. Brownian motion and the Fundamentals of Diffusion An appreciation for molecular movement requires a rudimentary understanding of the forces sensed by molecules. For objects of the size relevant to cell biology, the most important forces include mechanical (viscous), thermal (collisional), and chemical. One reason that other forces can be ignored is that protein molecules, and cells for that matter, have little inertia in relation to the large viscous forces from the environment. Gravity for instance has little effect on objects the size of proteins. There are several excellent books that discuss the basic principles and mathematics of diffusion (Berg, 1993; Crank, 1956). The following brief discussion borrows from the book by Howard (Howard, 2001) to which the reader is referred for a more complete treatment of these concepts. A. Viscosity and Collisional Forces Viscosity is of fundamental importance to diffusion. As a molecule moves through a stationary liquid, the drag force sensed is related to the molecule's velocity and a drag coefficient that takes into account the size and shape of the object and the viscosity of the liquid. A simple formula representing this relationship is:
rF πην 6⋅= , (1)
3
where ν equals velocity, η equals viscosity and r is the hydrodynamic radius of the molecule.
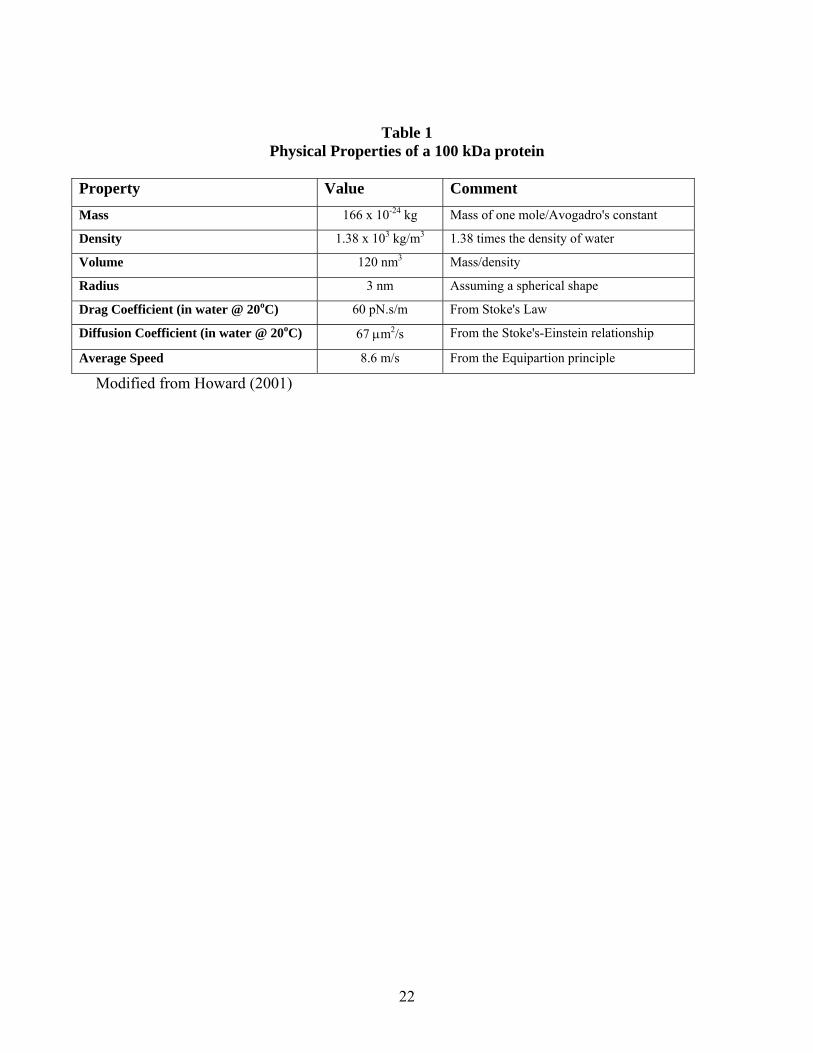
Thus, the force sensed by a molecule increases as the velocity, viscosity, or size of the molecule increases. An approximate viscous force sensed by an average size protein of 100 kDa is ~ 480 pN (picoNwetons; see Table 1 for additional physical properties of a 100 kDa protein; adapted from Howard, (Howard, 2001)). For reference, the viscosity [in cP (centipoises) at 20oC] of water is 1, acetone is 0.32, a 50% solution of Ficoll 400 is 600, and glycerol is 1408. Cell cytoplasm is thought to have a viscosity of approximately 1-3, and the viscosity of the membrane bilayer is approximately 50-100 (discussed later in this chapter). While viscous forces retard movement, collisional (thermal) forces drive molecular movement. A protein in solution moves because of the immense number of collisions experienced from water molecules. Since these collisions are not directed, the movement of the protein molecule is random, and this is the basic premise of the random walk taken by molecules observed as Brownian motion. When two objects collide (e.g., a water molecule and a protein), the force produced is related to the rate of change of momentum and momentum is, in turn, related to the velocity and mass of the molecule. Water molecules travel at significant velocity (600 m/s), but their momentum is small due to their small mass. Their number, however, is enormous (water has a molar concentration of 55.35 mol/L) producing a massive number of collisions per unit time. This randomly directed force is also called the thermal force and for a 100 kDa protein is calculated to be approximately 500 pN. The thermal force is significant enough to balance the viscous force noted above. However, as Howard (Howard, 2001) notes, even with the relative large instantaneous speed of a 100 kDa protein (8.6 m/s), the average distance that the protein moves before its direction is randomized by collisions is only ~0.024 nm. This is an almost imperceptibly small step size relative to the size of the protein (~3 nm in diameter). In total, it is thermal/collisional events that provide the force for moving molecules, but the viscosity of the solution and size of the molecule undergoing collisions that retard movement. The movement of proteins through solution is said to be "overdamped." Overdamped relates the fact that inertial forces are very small in relation to the viscous forces. An important consequence of this statement is that the drag force sensed by a protein is proportional to its velocity, and vice versa, since the inertial forces due to their small mass can be ignored. Ignoring inertial forces is a necessary prerequisite for applying Stoke's law to describe the forces associated with protein motion in cytoplasm or membranes. The velocity of a molecule in three dimensions can be calculated by the relationship:
mkT
rms3
=υ , (2)
where vrms is the root mean square velocity, k is the Boltzmann's constant (1.381 x 10⁻²³ J/K), T is temperature (in Kelvin), and m is the mass of the molecule.
4
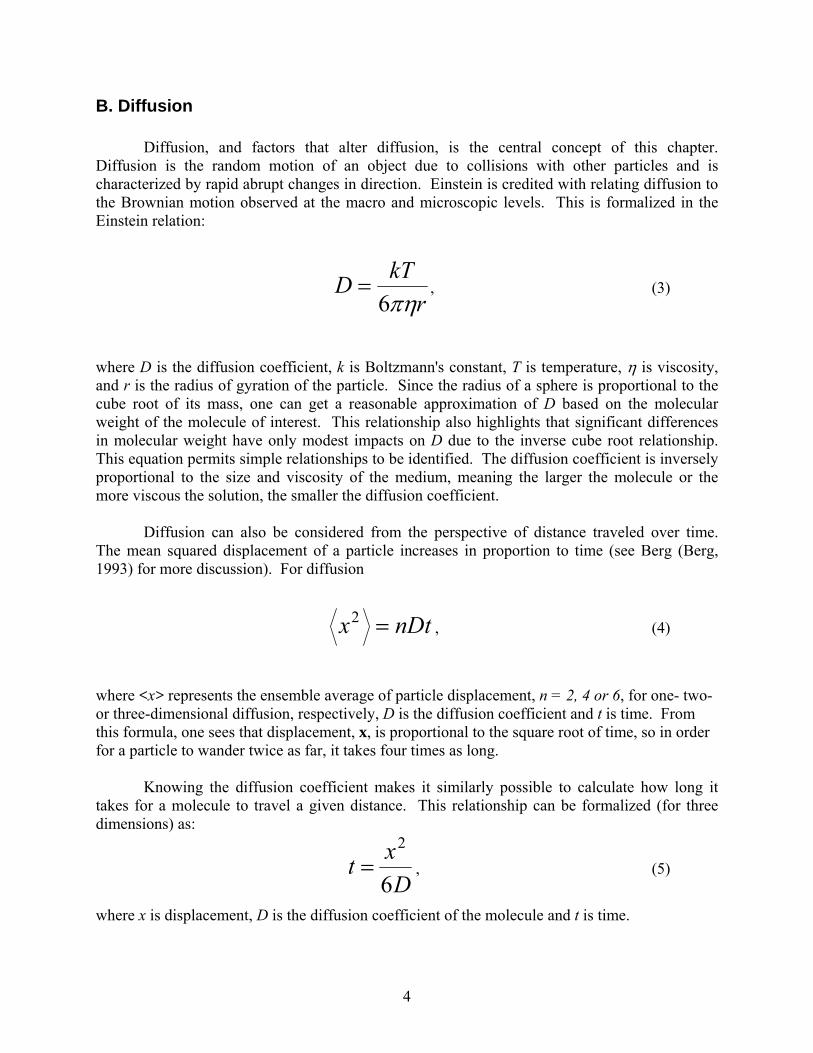
B. Diffusion Diffusion, and factors that alter diffusion, is the central concept of this chapter. Diffusion is the random motion of an object due to collisions with other particles and is characterized by rapid abrupt changes in direction. Einstein is credited with relating diffusion to the Brownian motion observed at the macro and microscopic levels. This is formalized in the Einstein relation:
r
kTDπη6
= , (3)
where D is the diffusion coefficient, k is Boltzmann's constant, T is temperature, η is viscosity, and r is the radius of gyration of the particle. Since the radius of a sphere is proportional to the cube root of its mass, one can get a reasonable approximation of D based on the molecular weight of the molecule of interest. This relationship also highlights that significant differences in molecular weight have only modest impacts on D due to the inverse cube root relationship. This equation permits simple relationships to be identified. The diffusion coefficient is inversely proportional to the size and viscosity of the medium, meaning the larger the molecule or the more viscous the solution, the smaller the diffusion coefficient. Diffusion can also be considered from the perspective of distance traveled over time. The mean squared displacement of a particle increases in proportion to time (see Berg (Berg, 1993) for more discussion). For diffusion
nDtx =2, (4)
where <x> represents the ensemble average of particle displacement, n = 2, 4 or 6, for one- two- or three-dimensional diffusion, respectively, D is the diffusion coefficient and t is time. From this formula, one sees that displacement, x, is proportional to the square root of time, so in order for a particle to wander twice as far, it takes four times as long. Knowing the diffusion coefficient makes it similarly possible to calculate how long it takes for a molecule to travel a given distance. This relationship can be formalized (for three dimensions) as:
D
xt6
2= , (5)
where x is displacement, D is the diffusion coefficient of the molecule and t is time.
5
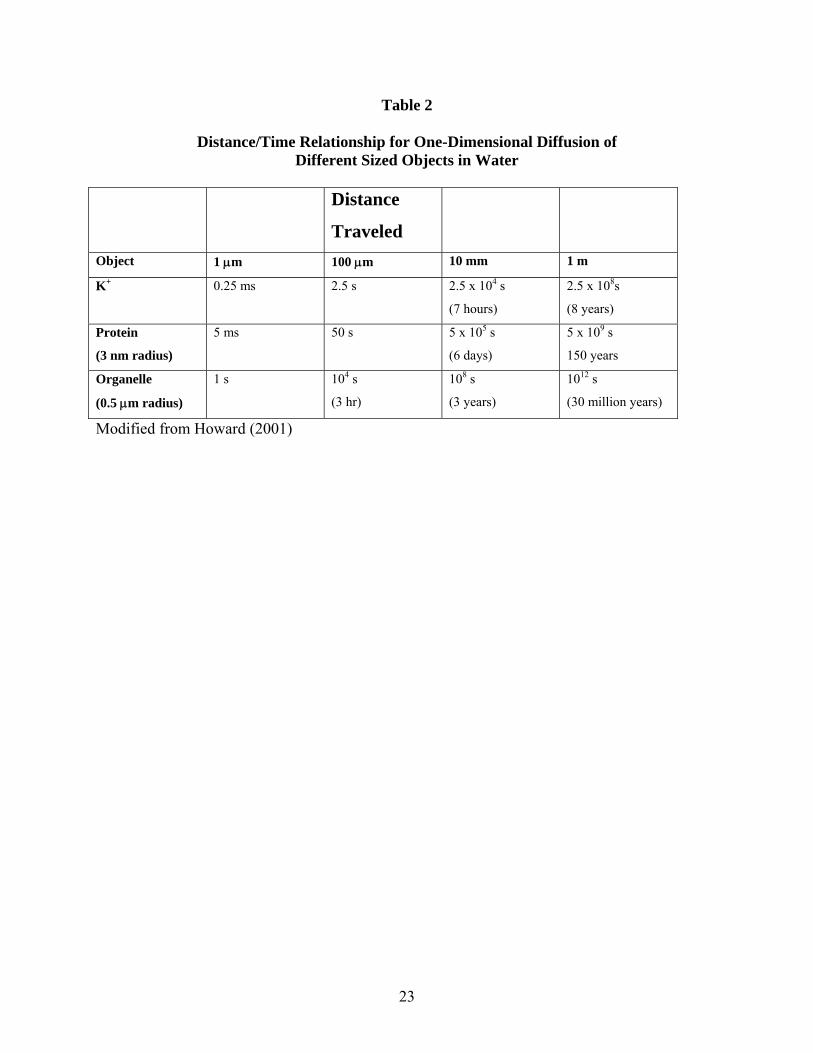
It is clear that diffusion is an extremely efficient process for moving molecules over short distances. However, as a consequence of the square root of time relationship, the time cost for traveling distances greater than a few μm can become prohibitive. Some examples are shown in the Table 2 (modified from Howard, (Howard, 2001)). As discussed later in this chapter, if one considers that the cytoplasm presents additional barriers to diffusion, it becomes obvious that the random walk of proteins is insufficient to deliver molecules efficiently at distances more than a few μm.
II. A View of Cytoplasm and Membrane from the Single Molecule Perspective The above discussion of diffusion has assumed the objects are moving in a homogeneous, uncrowded environment. This is clearly not the situation when considering molecular movement in cellular cytoplasm or membranes. These complexities present a daunting challenge to the study of protein mobility in living cells, but significant progress has been made. Advances in electron microscopy are providing important details concerning the spatial geometry of macromolecules within cells. Similar advances in light and fluorescence microscopy and spectroscopy are providing quantitative experimental data on the non-idealities of diffusion in cytoplasm and cellular membranes.
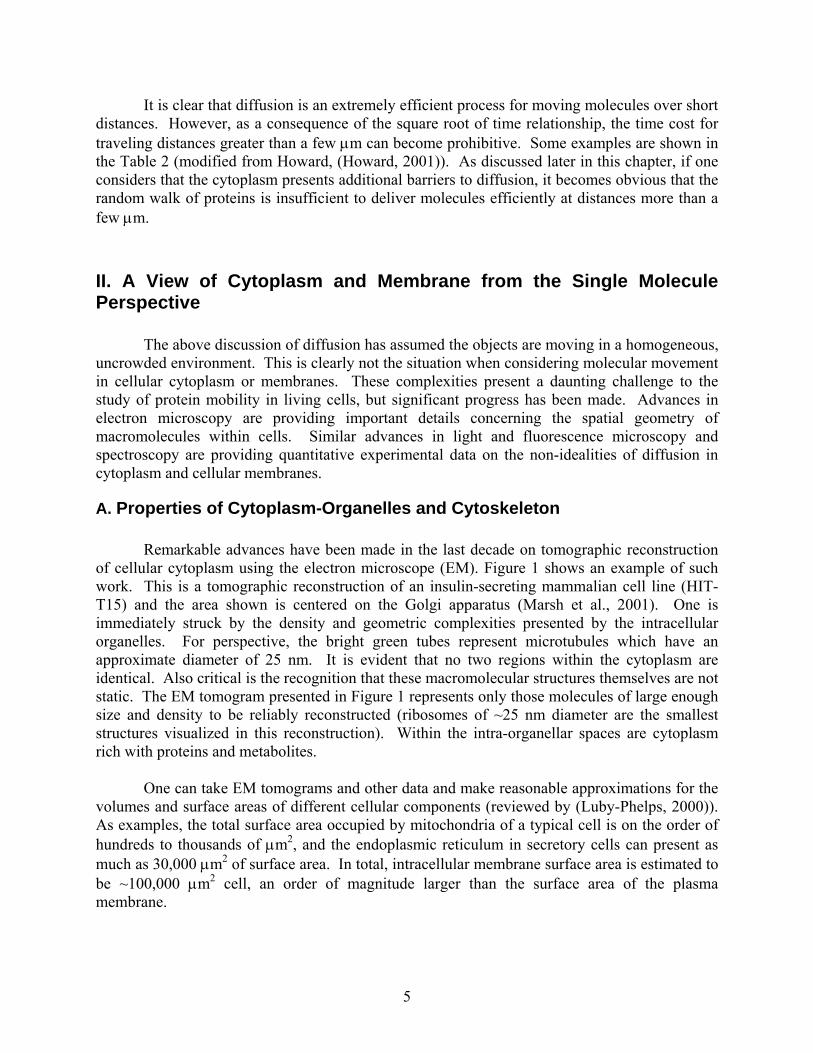
A. Properties of Cytoplasm-Organelles and Cytoskeleton Remarkable advances have been made in the last decade on tomographic reconstruction of cellular cytoplasm using the electron microscope (EM). Figure 1 shows an example of such work. This is a tomographic reconstruction of an insulin-secreting mammalian cell line (HIT-T15) and the area shown is centered on the Golgi apparatus (Marsh et al., 2001). One is immediately struck by the density and geometric complexities presented by the intracellular organelles. For perspective, the bright green tubes represent microtubules which have an approximate diameter of 25 nm. It is evident that no two regions within the cytoplasm are identical. Also critical is the recognition that these macromolecular structures themselves are not static. The EM tomogram presented in Figure 1 represents only those molecules of large enough size and density to be reliably reconstructed (ribosomes of ~25 nm diameter are the smallest structures visualized in this reconstruction). Within the intra-organellar spaces are cytoplasm rich with proteins and metabolites. One can take EM tomograms and other data and make reasonable approximations for the volumes and surface areas of different cellular components (reviewed by (Luby-Phelps, 2000)). As examples, the total surface area occupied by mitochondria of a typical cell is on the order of hundreds to thousands of μm2, and the endoplasmic reticulum in secretory cells can present as much as 30,000 μm2 of surface area. In total, intracellular membrane surface area is estimated to be ~100,000 μm2 cell, an order of magnitude larger than the surface area of the plasma membrane.
6
The cytoplasm is rich in cytoskeletal elements. Actin, tubulin and intermediate filaments are typically the most abundant proteins present in cells. Each of these proteins can assemble into polymers with unique structure and functional properties. The levels of actin are estimated to be approximately 4 mg/ml in cells, half being in the polymerized F-actin state, and the remainder in the soluble G-actin state. F-actin has a diameter of approximately 8 nm and exists in a dynamic state of assembly and disassembly. Tubulin (α- and β-tubulin) is the fundamental component of microtubules that have an approximate diameter of 25 nm. Intermediate filaments are approximately 10 nm in diameter and are more stable than either F-actin or microtubules. Intermediate filaments can be assembled from different monomeric components, including vimentin and neurofilaments. Neurofilaments are the fundamental elements that provide axons with their remarkable structural resilience. The surface area occupied by the array of cytoskeletal elements also presents significant obstacles between which cytoplasmic molecules must navigate. Ultrastructural data suggests that the lattice of cytoskeletal elements, including but not exclusive of the three main elements discussed above, present as much as 70,000-90,000 μm2 of surface area (Luby-Phelps, 2000). Obviously, these values vary significantly depending on the particular cell type under investigation. The state of cellular differentiation and cell division are also significant factors in determining the content of organellar and cytoskeletal components.
B. Properties of Cytoplasm-Water, Protein and Other Soluble Constituents
The space outside of organelles and cytoskeleton is filled with fluid whose composition has a major potential impact on the translational and rotational diffusion of molecules. Water composes approximately 70 percent of this space. Experimental approaches to examine water properties inside cells (nuclear magnetic resonance and quasielastic neutron scattering) are somewhat difficult to interpret, but suggest that the overall rotational mobility of intracellular water is reduced about twofold. Importantly, these studies highlight the concept that bulk water has distinctly different properties than water associated with macromolecules or other intracellular surfaces and the twofold difference in rotational mobility is the sum of both these water compartments. The ordering of water near surfaces reduces its chemical activity which can impact chemical reactions. As pointed-out by Luby-Phelps (Luby-Phelps, 2000), an alternative way of thinking about this issue is that water will be more concentrated (and ordered) around hydrophilic surfaces then around hydrophobic surfaces.
An additional, and perhaps more meaningful of this chapter more meaningful method for
probing the aqueous environment of the cytoplasm is to study the rotational mobility of labeled molecules. Rotational mobility is largely dictated by solvent viscosity and thus provides this fundamental parameter necessary for understanding the translational mobility of objects. Nuclear magnetic resonance of labeled or endogenous proteins, spin-labels, and fluorescent labels have all been used to examine the viscosity of the aqueous intracellular environment (reviewed in (Luby-Phelps, 2000)). A distillation of this data is that the viscosity of the aqueous intracellular environment does not appear significantly different from bulk water with, at most, a two- to three-fold increase in reported viscosity. Interestingly, there is also little variation in viscosity throughout the cell including the nucleus. These data indicate that intracellular viscosity is similar to water, and that viscosity per se produces only a modest impact on intracellular diffusion, at least for molecules the size of small fluorescent dyes.
7
To apply the Einstein relationship to analyze particle behavior, one assumes that
interactions between diffusing particles can be neglected. While this assumption can be satisfied rather easily in vitro, this assumption cannot be made when analyzing the diffusive behavior of particles inside cells. As noted above, the cellular cytoplasm is a complex and dynamic matrix of organelles that will present significant surface area to diffusing molecules. In addition, the fluid filled space surrounding organelles is not dilute. The protein content of cells is estimated to be between 17-35 percent by weight (Luby-Phelps, 2000; Minton, 2001). This concentration of macromolecules results in significant probabilities for protein-protein collisions and also produces a volume exclusion effect termed macromolecular crowding. By assessing the translational mobility of molecules of increasing size at increasing concentrations of Ficoll-70 (an inert molecule used to produce macromolecular crowding), it was determined that macromolecular crowding produces significant slowing of translational diffusion (Dauty and Verkman, 2004). Surprisingly, the impact of the size of the diffusing molecule was relatively insensitive to the effects of crowding, and these authors concluded that significantly hindered diffusion of larger (> 500 kDa) molecules must be due to immobile obstacles in addition to the slowed diffusion due to crowding. Others have shown similar slowing of diffusion in the presence of crowding obstacles but have found that molecules < 500 kDa also suffer hindered diffusion (Weiss et al., 2004)
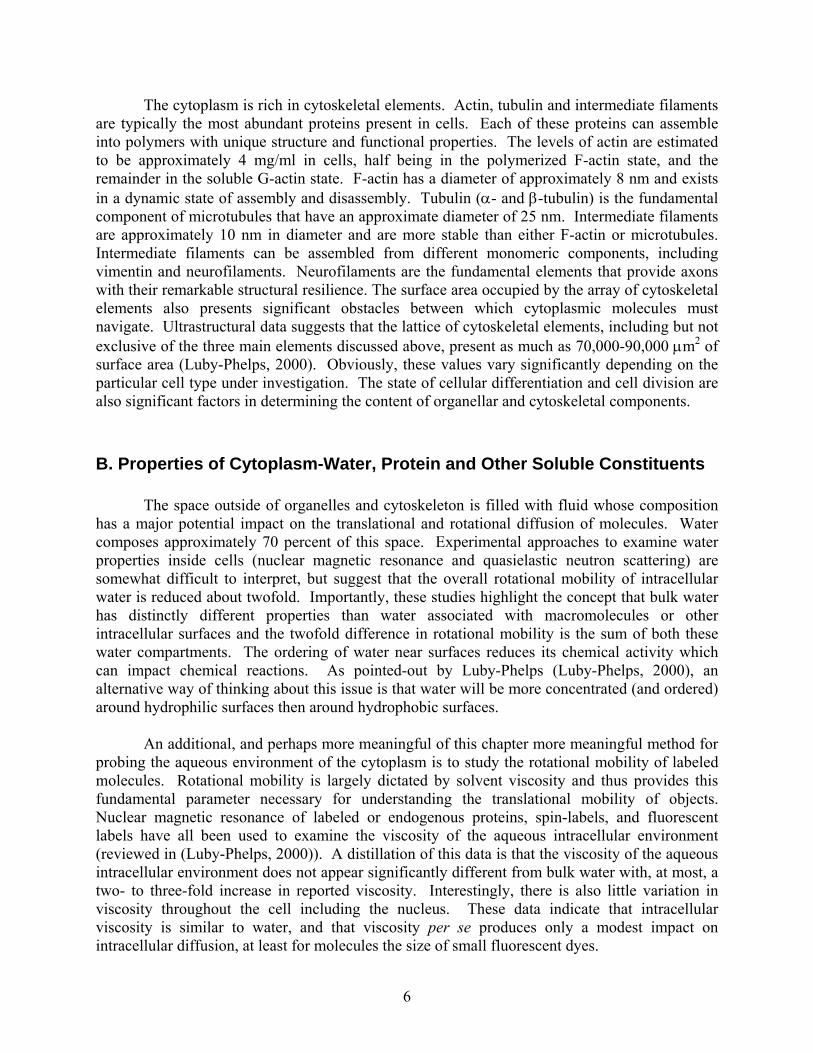
C. Properties of Membranes- Lipids and Integral Membrane Proteins Cellular membranes are two-dimensional structures approximately 60-100 nm in thickness that are composed of lipids and proteins (see Figure 2). Estimates are that approximately 40 percent of the plasma membrane is lipids, while the other 60 percent is protein (Choquet and Triller, 2003). The Sanger-Nicholson fluid-mosaic model for membrane structure remains an excellent starting point for discussion (modifications will be introduced later in the chapter). Membranes are fluid structures at normal physiological temperatures with the lipids being held together by numerous cooperative noncovalent interactions. Due to the hydrophobic nature of the hydrocarbon tails, and the associated attractive van der Walls forces, lipids spontaneously form closed structures but at the same time maintain a reasonable degree of fluidity.
Diffusion of molecules in the cytoplasm provides three degrees of freedom in the x, y and z axes. Diffusion in membranes is constrained by the loss of movement in the z dimension. At a theoretical level, this would enhance the mean squared displacement of a particle for a given time interval (see Eq. 4). The lipid bilayer however, is significantly different in its composition than the cytoplasm and is significantly different in composition between different cellular organelles (see Table 3; from (Lehninger, 1982)). The concentration of phospholipids in the bilayer is very high resulting in an increase in membrane viscosity that is sensed by a moving particle. The viscosity of the membrane has been likened to that of olive oil, some 50-100 times that of water (Stryer, 1988). The membrane viscosity plays a dominate role in the translational mobility of proteins in the membrane. This can lead to significantly slowed translational mobility relative to what would be seen of the same sized molecule in solution.
8
Membrane fluidity (viscosity) can also be controlled by the composition of the fatty acyl chains of the lipids. Increased fluidity is produced by acyl chains with shorter lengths and decreased degrees of saturation. Membrane fluidity in eukaryotic cells is also regulated through the concentration of cholesterol in the bilayer. Cholesterol intercalates into the lipid membranes and, in doing so, increases lipid disorder and results in increased fluidity. Cholesterol can also have the opposite effect by preventing free motion of the fatty acyl chains, thus decreasing fluidity and forming microdomains of certain types of lipids.
The concept of lipid rafts highlights the heterogeneous environment of the bilayer where lipids themselves can form small microdomains (<250-300 nm) that influence the lateral mobility of membrane bound constituents. Lipid rafts are described as detergent insoluble membrane domains constructed largely of cholesterol and sphingolipids that contain saturated fatty acid chains that permit tight packing, leading to a liquid ordered phase. This ordering influences translational diffusion of the resident lipids, but also influences the mobility of lipids in the immediate domain surrounding the raft as the raft itself produces a barrier, albeit mobile, to translational diffusion. Lipid rafts have many proposed functions including roles in endocytosis, internalization of toxins and viruses, calcium homeostasis, and protein sorting (Zajchowski and Robbins, 2002). However, one of their best studied roles is in fostering the association (or potentially excluding) of signaling molecules into effective complexes. A number of membrane associated proteins contain glycosylphosphatidylinositol (GPI) linked moieties that facilitate their association with lipid rafts, restricting their translational mobility and facilitating the probability of interactions. Some of the best studied GPI anchored proteins are those involved in growth factor signaling; the epidermal growth factor (EGF) receptor and platelet derived growth factor receptor are each enriched in lipid rafts. EGF receptor activation, tyrosine kinase phosphorylation, and recruitment of adapter proteins all occur in the confines of lipid rafts. The Src family of protein kinases is also GPI linked and concentrates into rafts. Lipid rafts themselves also seem to be dynamic structures assembling and disassembling as needed.Typical diffusion coefficients for lipids in the plasma membrane are in the range of 10-9 to 10-8 cm2/s, while values in synthetic bilayers are nearly an order of magnitude higher (10-8 to 10-7 cm2/s) as measured by FPR (Fluorescence Photobleaching Recovery). Clearly there are factors affecting lipid diffusion in the cellular environment not represented in synthetic bilayers. Constraints to consider are the packing of unique lipid domains, high density of membrane bound protein components, and the interactions of the cytoplasmic face of the membrane with cytoskeletal elements that help maintain the shape and integrity of the plasma membrane.
III. Diffusion and Mobility of Proteins in Cells Studied with Biophysical Techniques
A. Diffusion of Proteins within Cytoplasm Proteins vary widely in size, and size is inversely proportional to the rate of diffusion if
one considers proteins as chemically inert spheres. This is obviously not the case. Proteins present complex chemical surfaces and can deviate significantly in shape from simple spheres.
9
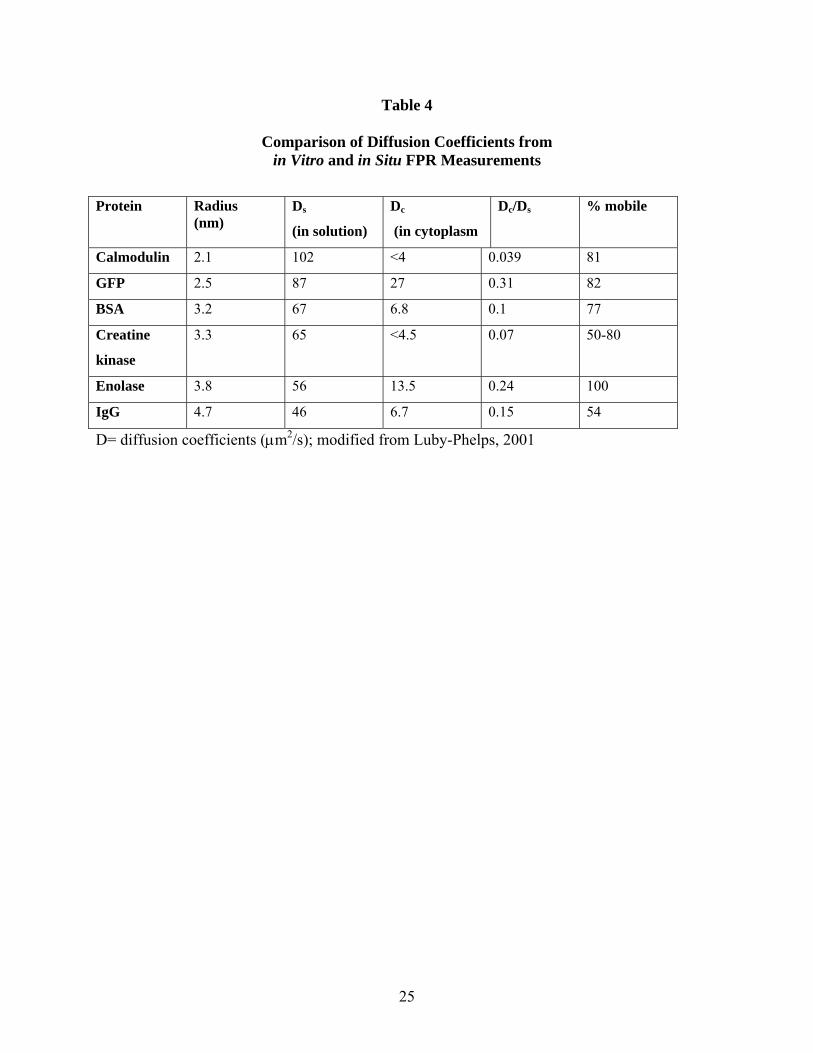
Protein shape is somewhat less important since measurement of the hydrodynamic radius of a protein in solution accounts for non-spherical shapes and can be used as an accurate parameter in calculating a diffusion coefficient through the Einstein relationship. The chemical surface of a protein, however, can fundamentally change the diffusive behavior of a protein inside cells. Sites for binding to mobile or immobile elements within the cell have the potential to significantly decrease the apparent mobility (quantified as a decreased diffusion coefficient) of a protein. Tabulation (Table 4) of some examples compiled by Luby-Phelps (Luby-Phelps, 2000) highlights this point and provides a sense of the magnitude of differences one detects in diffusion coefficients.
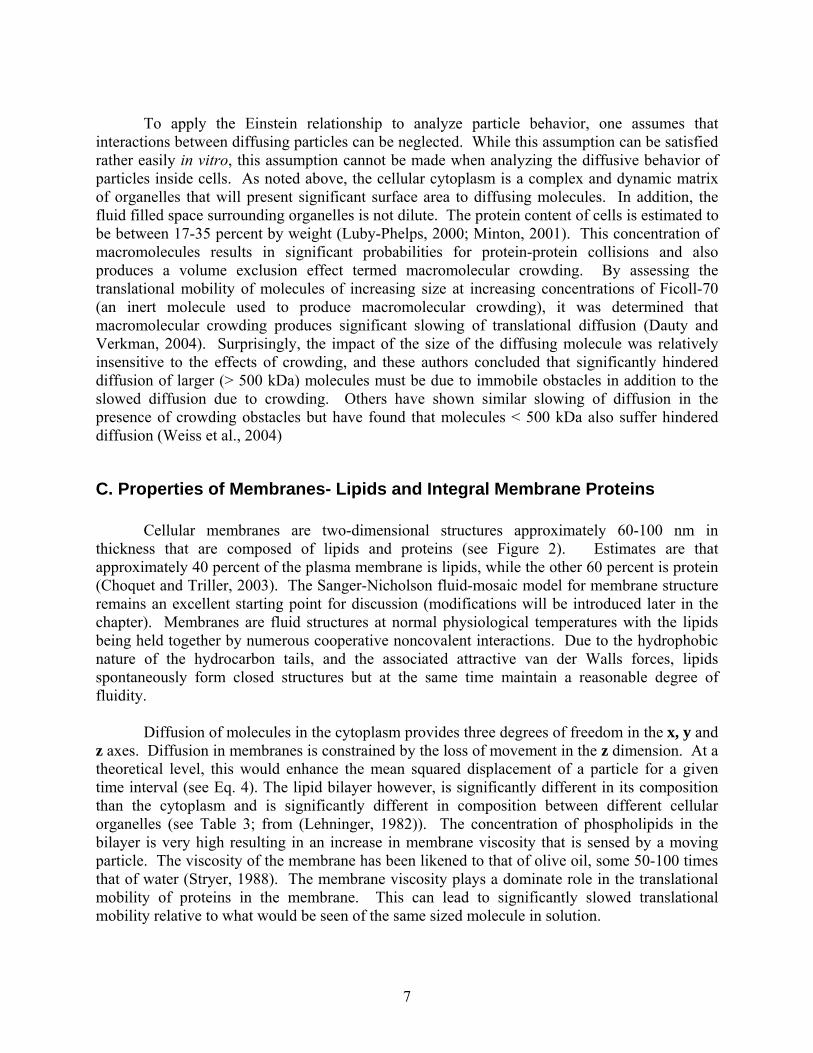
Translational diffusion in cytoplasm and membranes is most conveniently studied using fluorescence techniques. In particular, fluorescence photobleaching recovery (FPR), also known as fluorescence recovery after photobleaching (FRAP), and fluorescence correlation spectroscopy (FCS) have been widely applied to quantify diffusion in different cellular compartments. The two techniques have inherent advantages and disadvantages. An experimental set-up to accomplish such experiments is shown in Figure 3. This particular set-up uses multiphoton excitation to illuminate the fluorescent specimens.
A typical FPR experiment is accomplished by first generating an image of a cell and
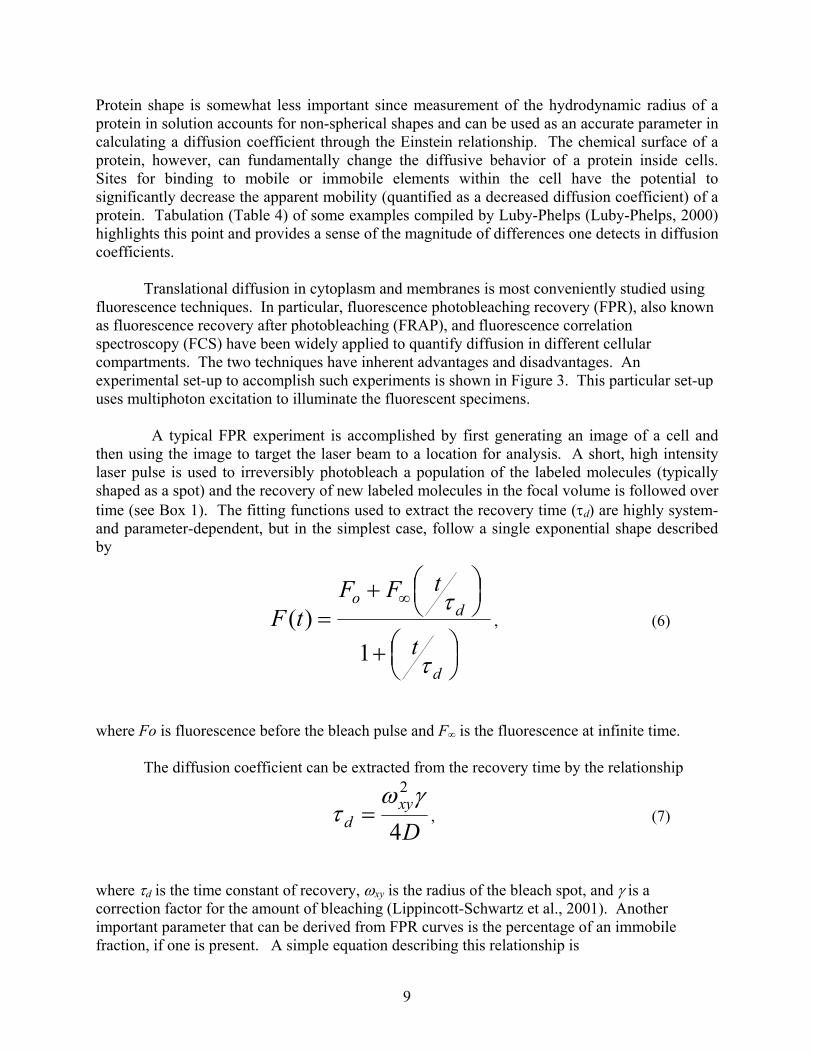
then using the image to target the laser beam to a location for analysis. A short, high intensity laser pulse is used to irreversibly photobleach a population of the labeled molecules (typically shaped as a spot) and the recovery of new labeled molecules in the focal volume is followed over time (see Box 1). The fitting functions used to extract the recovery time (τd) are highly system- and parameter-dependent, but in the simplest case, follow a single exponential shape described by
⎟⎠⎞⎜
⎝⎛+
⎟⎠⎞⎜
⎝⎛+
=∞
d
do
t
tFFtF
τ
τ
1)( , (6)
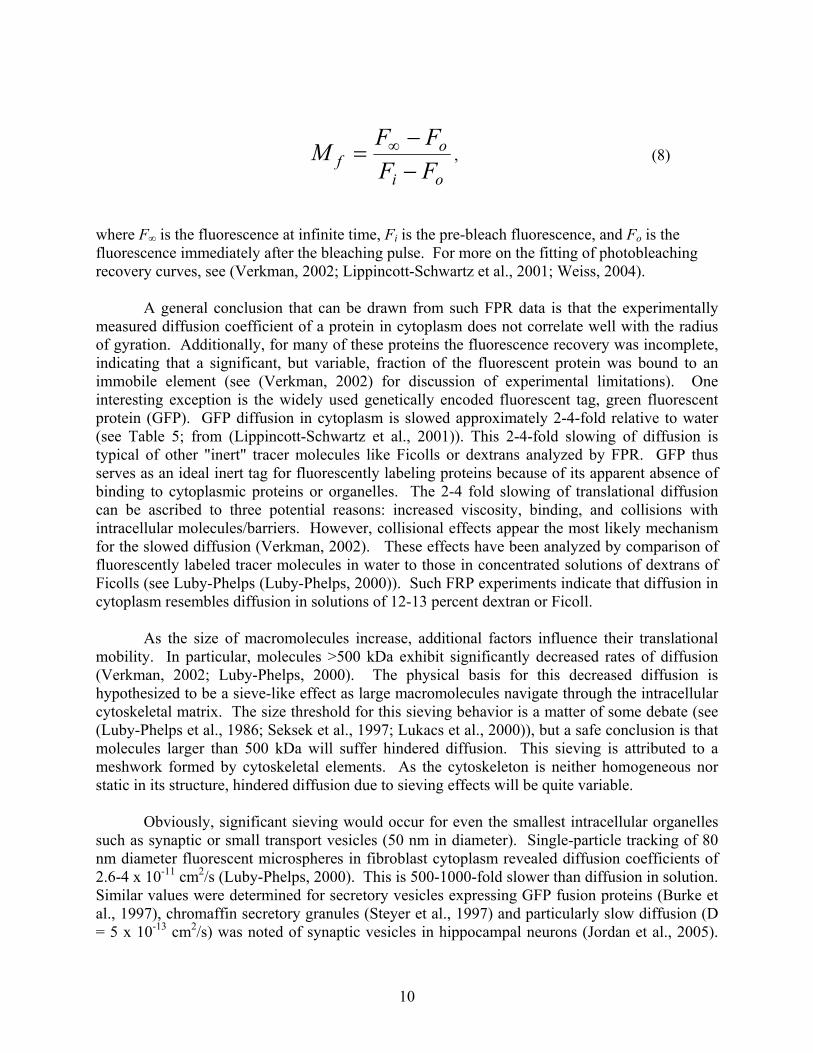
where Fo is fluorescence before the bleach pulse and F∞ is the fluorescence at infinite time. The diffusion coefficient can be extracted from the recovery time by the relationship
D
xyd 4
2 γωτ = , (7)
where τd is the time constant of recovery, ωxy is the radius of the bleach spot, and γ is a correction factor for the amount of bleaching (Lippincott-Schwartz et al., 2001). Another important parameter that can be derived from FPR curves is the percentage of an immobile fraction, if one is present. A simple equation describing this relationship is
10
oi
of FF
FFM−−
= ∞ , (8)
where F∞ is the fluorescence at infinite time, Fi is the pre-bleach fluorescence, and Fo is the fluorescence immediately after the bleaching pulse. For more on the fitting of photobleaching recovery curves, see (Verkman, 2002; Lippincott-Schwartz et al., 2001; Weiss, 2004).
A general conclusion that can be drawn from such FPR data is that the experimentally
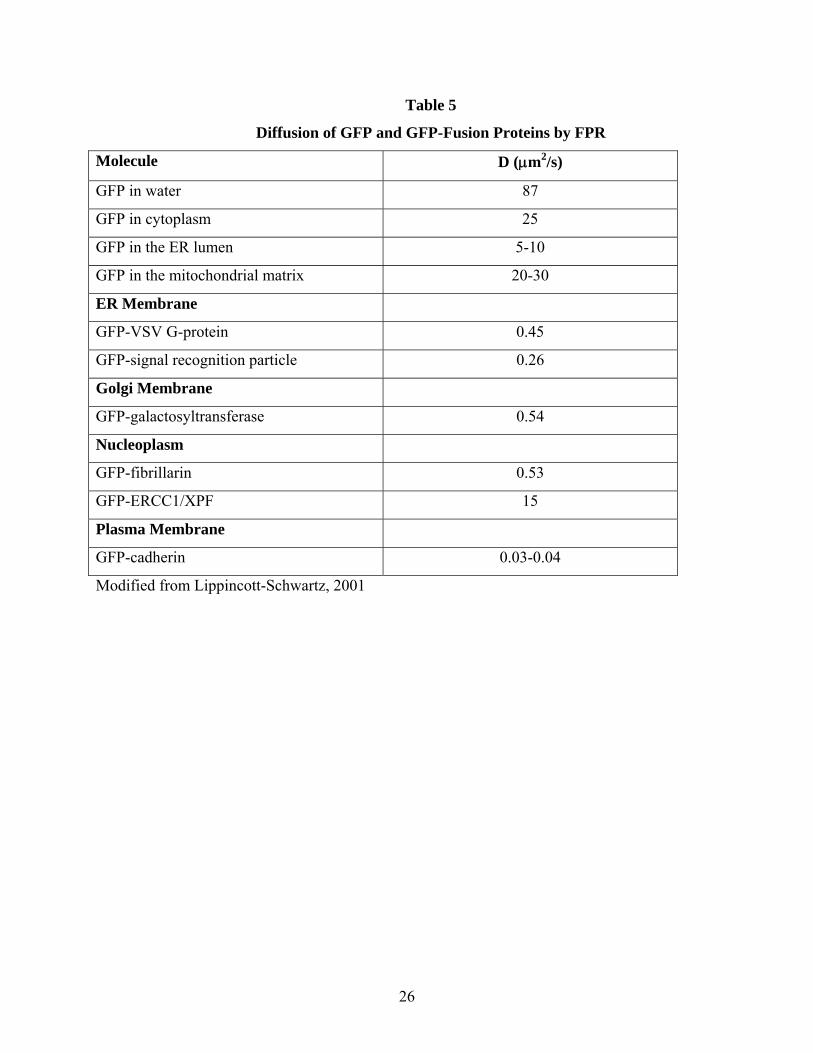
measured diffusion coefficient of a protein in cytoplasm does not correlate well with the radius of gyration. Additionally, for many of these proteins the fluorescence recovery was incomplete, indicating that a significant, but variable, fraction of the fluorescent protein was bound to an immobile element (see (Verkman, 2002) for discussion of experimental limitations). One interesting exception is the widely used genetically encoded fluorescent tag, green fluorescent protein (GFP). GFP diffusion in cytoplasm is slowed approximately 2-4-fold relative to water (see Table 5; from (Lippincott-Schwartz et al., 2001)). This 2-4-fold slowing of diffusion is typical of other "inert" tracer molecules like Ficolls or dextrans analyzed by FPR. GFP thus serves as an ideal inert tag for fluorescently labeling proteins because of its apparent absence of binding to cytoplasmic proteins or organelles. The 2-4 fold slowing of translational diffusion can be ascribed to three potential reasons: increased viscosity, binding, and collisions with intracellular molecules/barriers. However, collisional effects appear the most likely mechanism for the slowed diffusion (Verkman, 2002). These effects have been analyzed by comparison of fluorescently labeled tracer molecules in water to those in concentrated solutions of dextrans of Ficolls (see Luby-Phelps (Luby-Phelps, 2000)). Such FRP experiments indicate that diffusion in cytoplasm resembles diffusion in solutions of 12-13 percent dextran or Ficoll.
As the size of macromolecules increase, additional factors influence their translational
mobility. In particular, molecules >500 kDa exhibit significantly decreased rates of diffusion (Verkman, 2002; Luby-Phelps, 2000). The physical basis for this decreased diffusion is hypothesized to be a sieve-like effect as large macromolecules navigate through the intracellular cytoskeletal matrix. The size threshold for this sieving behavior is a matter of some debate (see (Luby-Phelps et al., 1986; Seksek et al., 1997; Lukacs et al., 2000)), but a safe conclusion is that molecules larger than 500 kDa will suffer hindered diffusion. This sieving is attributed to a meshwork formed by cytoskeletal elements. As the cytoskeleton is neither homogeneous nor static in its structure, hindered diffusion due to sieving effects will be quite variable.
Obviously, significant sieving would occur for even the smallest intracellular organelles
such as synaptic or small transport vesicles (50 nm in diameter). Single-particle tracking of 80 nm diameter fluorescent microspheres in fibroblast cytoplasm revealed diffusion coefficients of 2.6-4 x 10-11 cm2/s (Luby-Phelps, 2000). This is 500-1000-fold slower than diffusion in solution. Similar values were determined for secretory vesicles expressing GFP fusion proteins (Burke et al., 1997), chromaffin secretory granules (Steyer et al., 1997) and particularly slow diffusion (D = 5 x 10-13 cm2/s) was noted of synaptic vesicles in hippocampal neurons (Jordan et al., 2005).

11
These experiments reveal the fundamental need for directional trafficking and active transport to efficiently move even the smallest organelles through the cytoplasm.
GFP can be fused to a variety of proteins that target the reporter to specific organelles.
FPR studies of GFP in the mitochondrion revealed a 3-4-fold slowing of diffusion relative to water similar to what has been discovered for the mobility of GFP in the cytoplasm (Verkman, 2002). This indicates that the aqueous phase of the mitochondrial matrix is similar to that in cytoplasm. A similar strategy was used to target GFP to the endoplasmic reticulum (ER), and FPR was used to examine diffusion in the ER lumen. In this organelle, diffusion was slowed 9-18-fold relative to water, indicating that the ER lumen presents an environment to GFP that hinders its translational mobility. The convoluted lumen of these small organelles confounds the application of simple models for diffusion. Applying the appropriate physical model is a necessary component for the proper interpretation of the FPR data (see (Verkman, 2002) for further discussion). Fluorescence correlation spectroscopy (FCS) is a complementary method to FPR for quantifying translational diffusion in vitro and in living cells. FCS has found significant applications in cell biology since the mid 1990s, and while the number of papers is growing quickly, specific results from FCS lag behind those for FPR. The fundamental principles of FCS are described in Box 2. FCS compares the photon intensity profile produced from fluorophores entering and exiting the focal volumes as time progresses. The fluctuations become more dissimilar at increasing times leading to decay in the autocorrelation function. From this simple scenario, one can deduce that fewer numbers of molecules (and therefore fewer photons) in the observation volume, will result in a more dissimilar intensity profile. As the concentration of fluorophore increases, the amplitude (G(0) on the y-axis) decreases. FCS thus lends itself to situations of low fluorophore number which is often more relevant in the cellular setting. By introducing or expressing fewer fluorescently tagged molecules, the experimental system is less perturbed from its normal equilibrium. More concretely, if one adds a significant excess of fluorescent molecules over those endogenously present, binding sites might become saturated leading to the appearance of free diffusion of the labeled ligand when a significant fraction is actually bound at the normal concentration of ligand. This is of fundamental importance when one wishes to quantify translational mobility in the complex intracellular setting.
In FCS, molecules that traverse the volume more quickly (that have faster diffusion coefficients) produce an autocorrelation function that decays at an earlier time point. The simplest analytic function used to fit the autocorrelation data is:
( )dd KN
Gτ
ττ
ττ
⋅+⋅
+⋅=
11
111)( , (9)
12
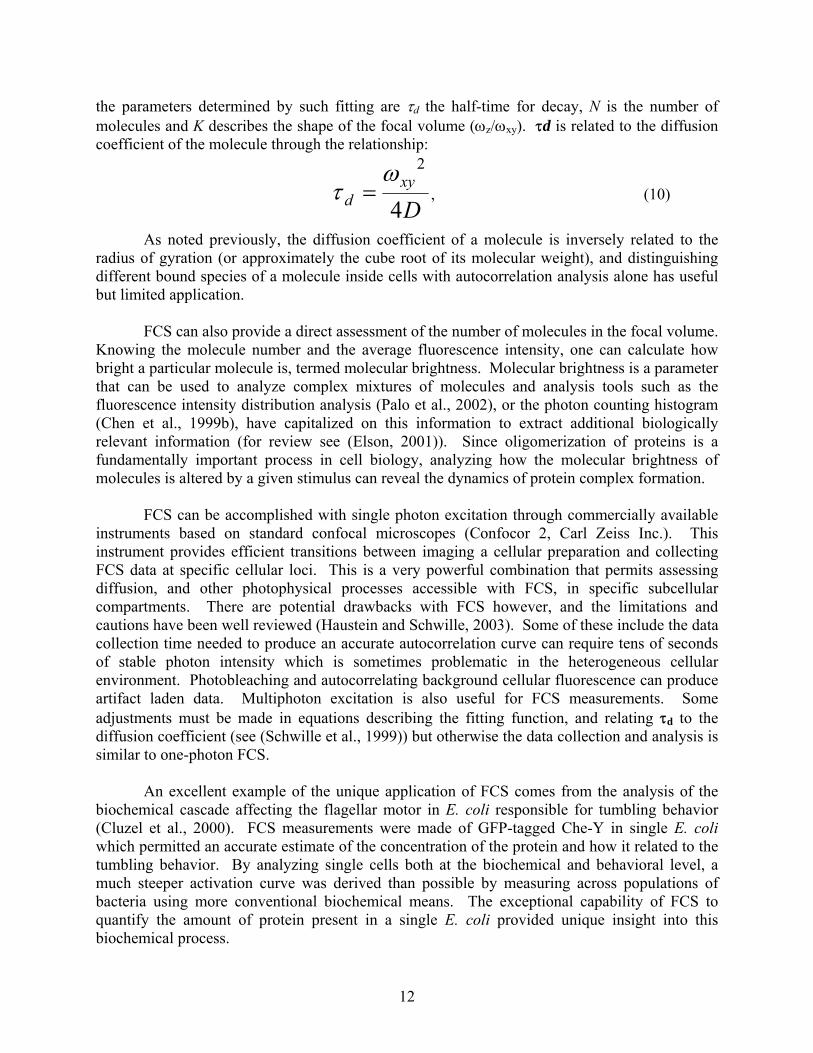
the parameters determined by such fitting are τd the half-time for decay, N is the number of molecules and K describes the shape of the focal volume (ωz/ωxy). τd is related to the diffusion coefficient of the molecule through the relationship:
Dxy
d 4
2ωτ = , (10)
As noted previously, the diffusion coefficient of a molecule is inversely related to the radius of gyration (or approximately the cube root of its molecular weight), and distinguishing different bound species of a molecule inside cells with autocorrelation analysis alone has useful but limited application.
FCS can also provide a direct assessment of the number of molecules in the focal volume. Knowing the molecule number and the average fluorescence intensity, one can calculate how bright a particular molecule is, termed molecular brightness. Molecular brightness is a parameter that can be used to analyze complex mixtures of molecules and analysis tools such as the fluorescence intensity distribution analysis (Palo et al., 2002), or the photon counting histogram (Chen et al., 1999b), have capitalized on this information to extract additional biologically relevant information (for review see (Elson, 2001)). Since oligomerization of proteins is a fundamentally important process in cell biology, analyzing how the molecular brightness of molecules is altered by a given stimulus can reveal the dynamics of protein complex formation. FCS can be accomplished with single photon excitation through commercially available instruments based on standard confocal microscopes (Confocor 2, Carl Zeiss Inc.). This instrument provides efficient transitions between imaging a cellular preparation and collecting FCS data at specific cellular loci. This is a very powerful combination that permits assessing diffusion, and other photophysical processes accessible with FCS, in specific subcellular compartments. There are potential drawbacks with FCS however, and the limitations and cautions have been well reviewed (Haustein and Schwille, 2003). Some of these include the data collection time needed to produce an accurate autocorrelation curve can require tens of seconds of stable photon intensity which is sometimes problematic in the heterogeneous cellular environment. Photobleaching and autocorrelating background cellular fluorescence can produce artifact laden data. Multiphoton excitation is also useful for FCS measurements. Some adjustments must be made in equations describing the fitting function, and relating τd to the diffusion coefficient (see (Schwille et al., 1999)) but otherwise the data collection and analysis is similar to one-photon FCS. An excellent example of the unique application of FCS comes from the analysis of the biochemical cascade affecting the flagellar motor in E. coli responsible for tumbling behavior (Cluzel et al., 2000). FCS measurements were made of GFP-tagged Che-Y in single E. coli which permitted an accurate estimate of the concentration of the protein and how it related to the tumbling behavior. By analyzing single cells both at the biochemical and behavioral level, a much steeper activation curve was derived than possible by measuring across populations of bacteria using more conventional biochemical means. The exceptional capability of FCS to quantify the amount of protein present in a single E. coli provided unique insight into this biochemical process.
13
FCS was also used to examine the transport properties of tubulin and creatine kinase in neuronal axons (Terada et al., 2000). The results showed that it was possible to distinguish unique diffusion of these two proteins in complexes undergoing active transport within the axon. Similarly, FCS was used to examine diffusion of an inert tetramethylrhodamine-10 kDa dextran tracer in neuronal dendrites (Gennerich and Schild, 2002). New models appropriate for fitting FCS data collected from the restricted geometry of dendrites were developed and were used to show that diffusion along the dendrite was slowed by 1-2 fold relative to diffusion of the same tracer in neuronal soma. However, diffusion across the dendrite was slowed some 90-fold. The extensive cytoskeletal network in dendrites was suggested to be the probable barrier to diffusion across the dendrite.
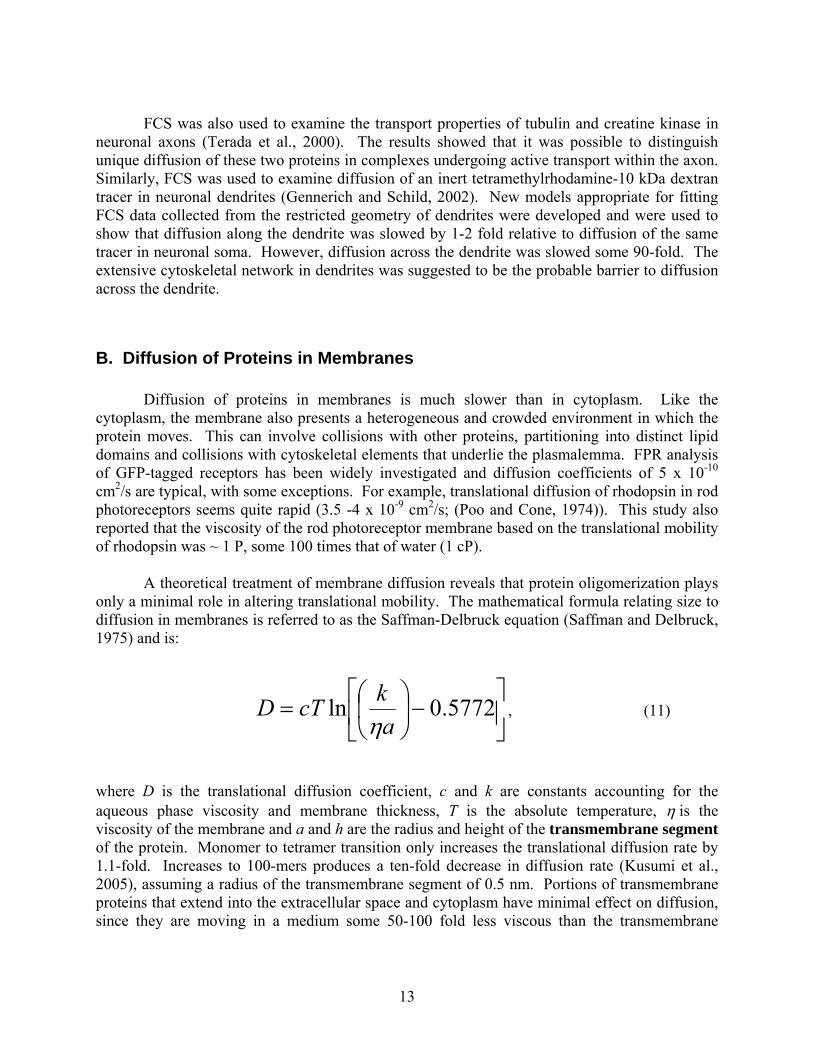
B. Diffusion of Proteins in Membranes Diffusion of proteins in membranes is much slower than in cytoplasm. Like the cytoplasm, the membrane also presents a heterogeneous and crowded environment in which the protein moves. This can involve collisions with other proteins, partitioning into distinct lipid domains and collisions with cytoskeletal elements that underlie the plasmalemma. FPR analysis of GFP-tagged receptors has been widely investigated and diffusion coefficients of 5 x 10⁻¹⁰ cm2/s are typical, with some exceptions. For example, translational diffusion of rhodopsin in rod photoreceptors seems quite rapid (3.5 -4 x 10⁻⁹ cm2/s; (Poo and Cone, 1974)). This study also reported that the viscosity of the rod photoreceptor membrane based on the translational mobility of rhodopsin was ~ 1 P, some 100 times that of water (1 cP). A theoretical treatment of membrane diffusion reveals that protein oligomerization plays only a minimal role in altering translational mobility. The mathematical formula relating size to diffusion in membranes is referred to as the Saffman-Delbruck equation (Saffman and Delbruck, 1975) and is:
⎥⎦
⎤⎢⎣
⎡−⎟
⎠
⎞⎜⎝
⎛= 5772.0lnakcTD
η, (11)
where D is the translational diffusion coefficient, c and k are constants accounting for the aqueous phase viscosity and membrane thickness, T is the absolute temperature, η is the viscosity of the membrane and a and h are the radius and height of the transmembrane segment of the protein. Monomer to tetramer transition only increases the translational diffusion rate by 1.1-fold. Increases to 100-mers produces a ten-fold decrease in diffusion rate (Kusumi et al., 2005), assuming a radius of the transmembrane segment of 0.5 nm. Portions of transmembrane proteins that extend into the extracellular space and cytoplasm have minimal effect on diffusion, since they are moving in a medium some 50-100 fold less viscous than the transmembrane
14
segment(s) within the bilayer. Based on this argument, the diffusion coefficients of many membrane-bound proteins collapse into a relatively small range.
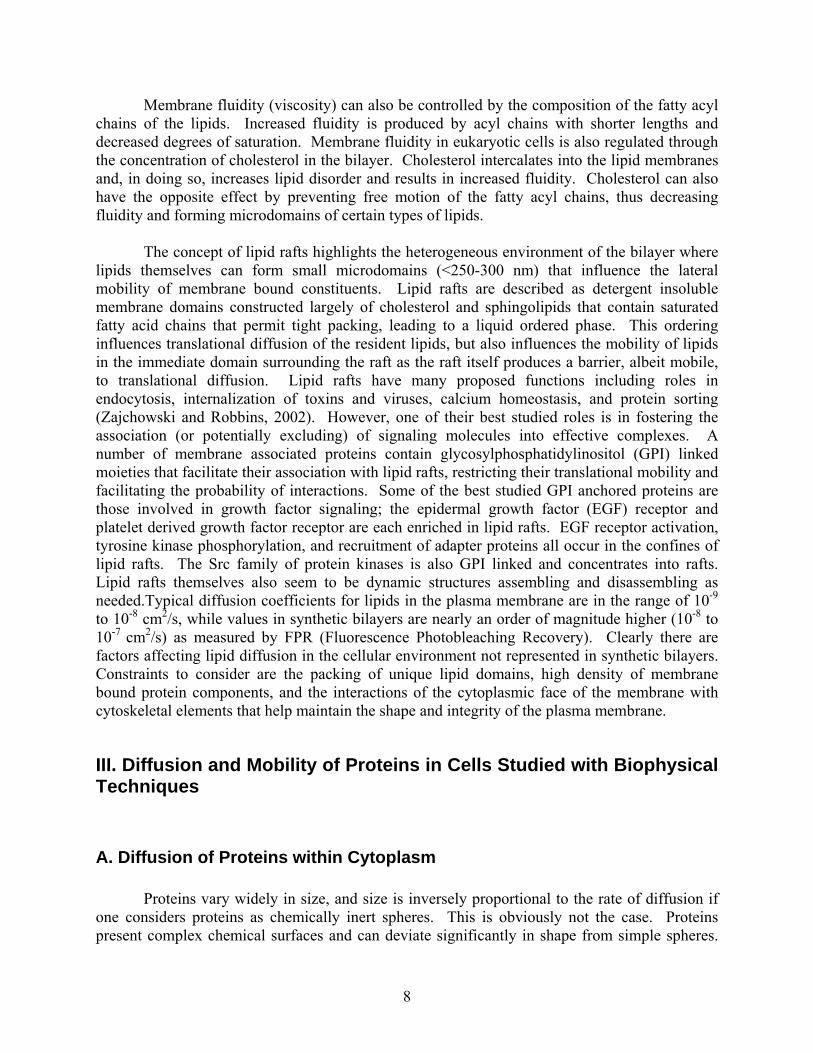
Diffusion of proteins in cellular membranes is slowed some five- to fifty-fold relative to their mobility in pure lipid membranes. Recent advances in high-speed data capture and single particle imaging have provided a plausible explanation for these observations (Figure 4). Cellular membranes have a well-developed cytoskeletal matrix lying just beneath the plasmalemmal surface. This matrix produces barriers to the translational mobility of lipids and membrane associated proteins. The mechanistic impact projected onto receptor mobility is that diffusion rates are typical of those found in pure lipid bilayers within the confines or "corrals" formed by the matrix. However, the corrals hinder the diffusion of the receptors on larger spatial scales. To sample greater distances, the receptors must hop these fences and a "hop-diffusion" model was put forth to explain the macroscopic behavior of receptor mobility. Recent experimental data has directly supported this model (Kusumi et al., 2005). By tracking the trajectories of single particles (single particle tracking of SPT) at extremely high temporal resolution (25 μsec sampling rate), it was possible to reconstruct the random walk of particles in the membrane (see example in Figure 4). Individual particle motion was found to be restricted to domains within the membrane, but at certain points the particle would hop to a new domain where it would again sample the environment through diffusion similar to its rate in pure lipid membranes. A summary of the types of interactions that an integral protein might encounter that would hinder its diffusion is shown in Figure 5 (modified from Lippincott-Schwartz (Lippincott-Schwartz et al., 2001)).
The behavior of the AMPA and NMDA subtypes of glutamate receptors in neuronal
membranes has also been examined with single particle tracking. The diffusion coefficients of AMPA receptors (median of 0.01 μm2/s) was approximately four times faster than NMDA receptors (median of 0.0023 μm2/s) in extrasynaptic areas, while at synapses, the diffusion coefficients were similar (0.028 and 0.021 μm2/s, respectively). Interestingly, the percentage of the two receptors that were mobile in either synaptic or non-synaptic sites were similar, and the percentage of mobile receptors could be affected by various stimuli (see (Groc et al., 2004) for details and review by (Choquet and Triller, 2003)). FCS has found a unique application in the study of membrane protein oligomerization by capitalizing on changes in molecular brightness and translational mobility as monomers form dimers or higher order structures. The dynamics of light induced rhodopsin oligomerization were assessed using FCS (Kahya et al., 2002). The translational mobility of rhodopsin reconstituted in lipid bilayers decreased in a time-dependent manner (time course of minutes) from 1.0 μm2/s to 0.2 μm2/s upon exposure to light. The cell surface expression and oligomerization state of serotonin (5-HT3) receptors was also examined in neurons using FCS (Pick et al., 2003). It is also possible using FCS to analyze binding constants for fluorescent ligands to their receptors ((Gosch and Rigler, 2005) for discussion). The interaction of ligands with GABA receptors on neuronal membranes is one example of the application of FCS in the measurement of binding constants (Meissner and Haberlein, 2003).
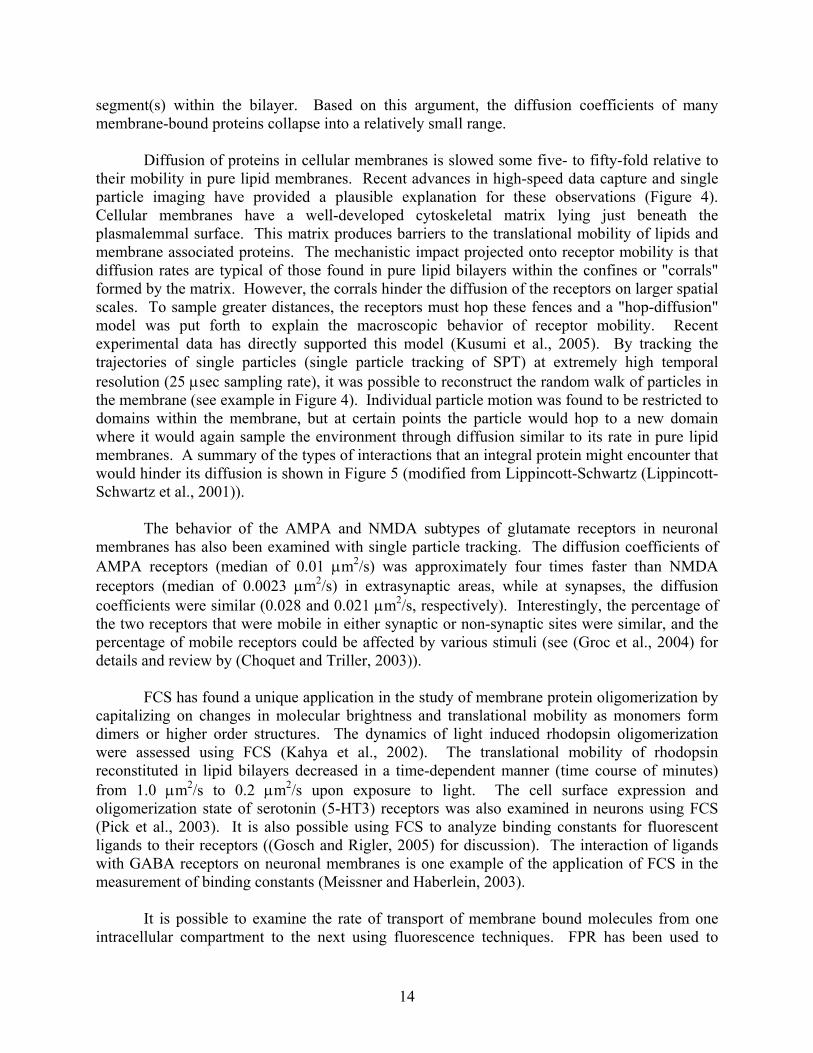
It is possible to examine the rate of transport of membrane bound molecules from one intracellular compartment to the next using fluorescence techniques. FPR has been used to
15
examine both anterograde and retrograde transport rates of proteins between the ER and the Golgi. By using GFP-tagged transport proteins and photobleaching either the pool resident in the ER or the Golgi, one can then follow the recovery of the fluorescence from one pool to the next. This experiment establishes the cycling time between individual compartments and how different proteins are trafficked within and between these organelles and the plasma membrane (for review see (Lippincott-Schwartz et al., 2001) and references therein). Many variations on this theme can be envisioned to study the kinetics of various transport processes.
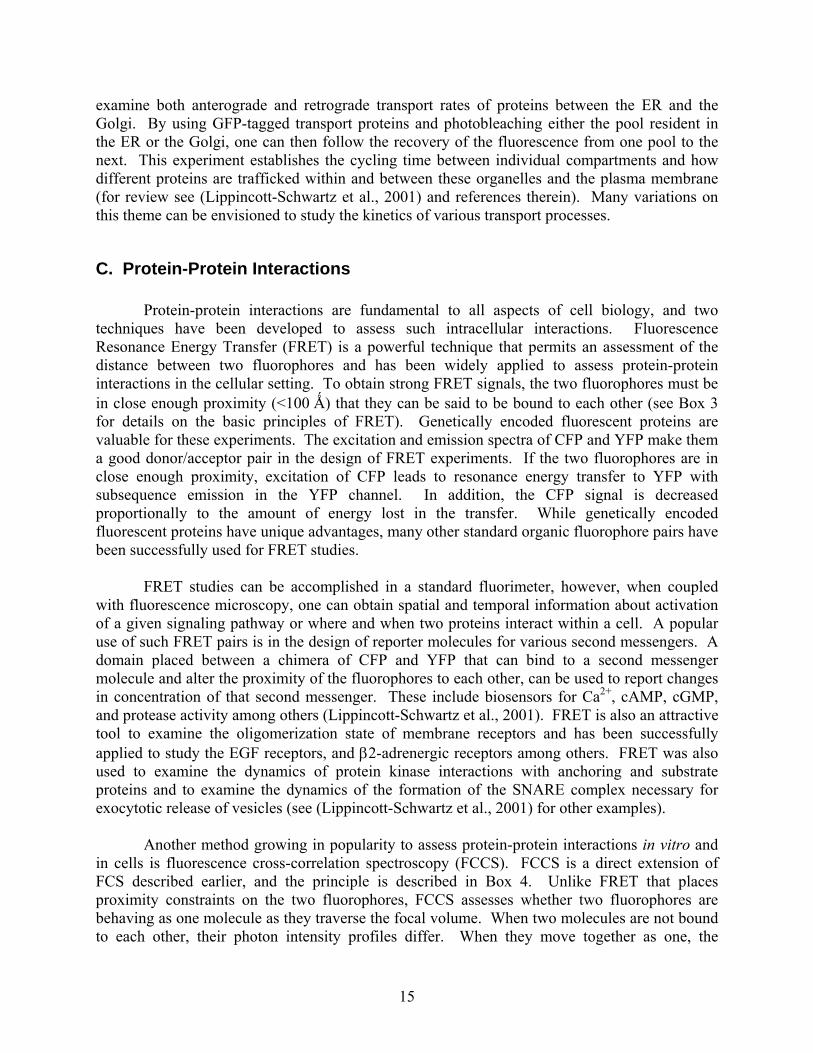
C. Protein-Protein Interactions Protein-protein interactions are fundamental to all aspects of cell biology, and two techniques have been developed to assess such intracellular interactions. Fluorescence Resonance Energy Transfer (FRET) is a powerful technique that permits an assessment of the distance between two fluorophores and has been widely applied to assess protein-protein interactions in the cellular setting. To obtain strong FRET signals, the two fluorophores must be in close enough proximity (<100 Ǻ) that they can be said to be bound to each other (see Box 3 for details on the basic principles of FRET). Genetically encoded fluorescent proteins are valuable for these experiments. The excitation and emission spectra of CFP and YFP make them a good donor/acceptor pair in the design of FRET experiments. If the two fluorophores are in close enough proximity, excitation of CFP leads to resonance energy transfer to YFP with subsequence emission in the YFP channel. In addition, the CFP signal is decreased proportionally to the amount of energy lost in the transfer. While genetically encoded fluorescent proteins have unique advantages, many other standard organic fluorophore pairs have been successfully used for FRET studies. FRET studies can be accomplished in a standard fluorimeter, however, when coupled with fluorescence microscopy, one can obtain spatial and temporal information about activation of a given signaling pathway or where and when two proteins interact within a cell. A popular use of such FRET pairs is in the design of reporter molecules for various second messengers. A domain placed between a chimera of CFP and YFP that can bind to a second messenger molecule and alter the proximity of the fluorophores to each other, can be used to report changes in concentration of that second messenger. These include biosensors for Ca2+, cAMP, cGMP, and protease activity among others (Lippincott-Schwartz et al., 2001). FRET is also an attractive tool to examine the oligomerization state of membrane receptors and has been successfully applied to study the EGF receptors, and β2-adrenergic receptors among others. FRET was also used to examine the dynamics of protein kinase interactions with anchoring and substrate proteins and to examine the dynamics of the formation of the SNARE complex necessary for exocytotic release of vesicles (see (Lippincott-Schwartz et al., 2001) for other examples). Another method growing in popularity to assess protein-protein interactions in vitro and in cells is fluorescence cross-correlation spectroscopy (FCCS). FCCS is a direct extension of FCS described earlier, and the principle is described in Box 4. Unlike FRET that places proximity constraints on the two fluorophores, FCCS assesses whether two fluorophores are behaving as one molecule as they traverse the focal volume. When two molecules are not bound to each other, their photon intensity profiles differ. When they move together as one, the
16
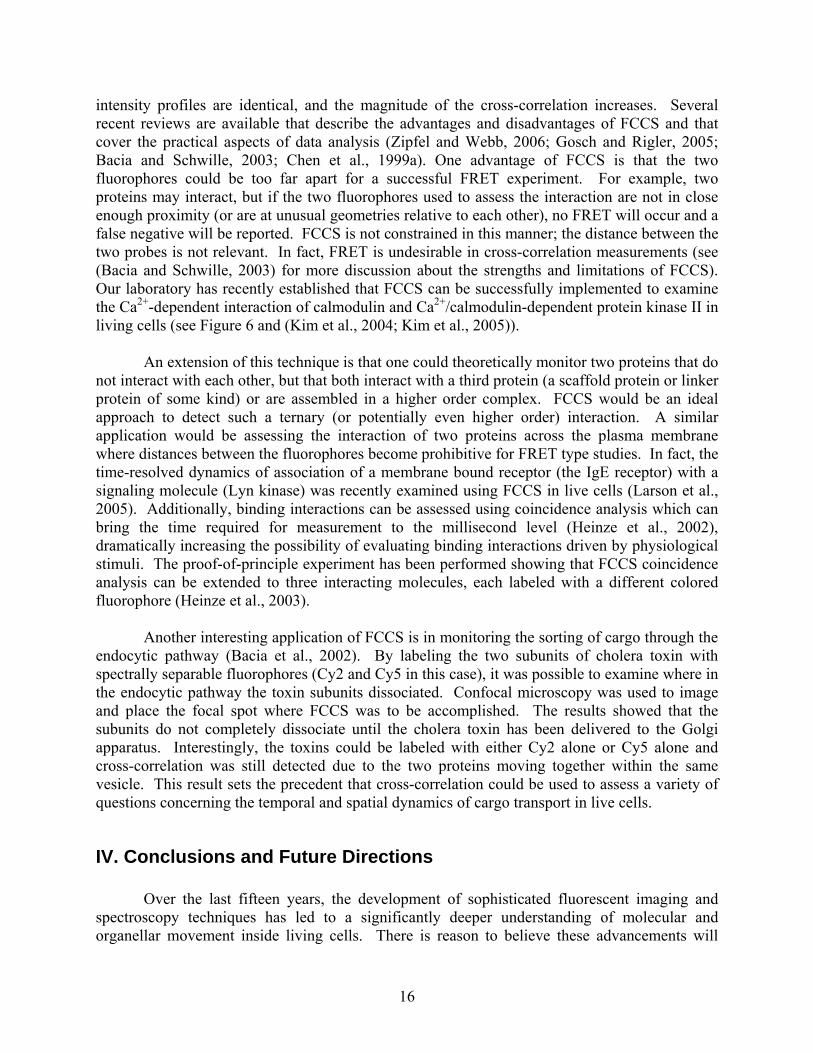
intensity profiles are identical, and the magnitude of the cross-correlation increases. Several recent reviews are available that describe the advantages and disadvantages of FCCS and that cover the practical aspects of data analysis (Zipfel and Webb, 2006; Gosch and Rigler, 2005; Bacia and Schwille, 2003; Chen et al., 1999a). One advantage of FCCS is that the two fluorophores could be too far apart for a successful FRET experiment. For example, two proteins may interact, but if the two fluorophores used to assess the interaction are not in close enough proximity (or are at unusual geometries relative to each other), no FRET will occur and a false negative will be reported. FCCS is not constrained in this manner; the distance between the two probes is not relevant. In fact, FRET is undesirable in cross-correlation measurements (see (Bacia and Schwille, 2003) for more discussion about the strengths and limitations of FCCS). Our laboratory has recently established that FCCS can be successfully implemented to examine the Ca2+-dependent interaction of calmodulin and Ca2+/calmodulin-dependent protein kinase II in living cells (see Figure 6 and (Kim et al., 2004; Kim et al., 2005)).
An extension of this technique is that one could theoretically monitor two proteins that do not interact with each other, but that both interact with a third protein (a scaffold protein or linker protein of some kind) or are assembled in a higher order complex. FCCS would be an ideal approach to detect such a ternary (or potentially even higher order) interaction. A similar application would be assessing the interaction of two proteins across the plasma membrane where distances between the fluorophores become prohibitive for FRET type studies. In fact, the time-resolved dynamics of association of a membrane bound receptor (the IgE receptor) with a signaling molecule (Lyn kinase) was recently examined using FCCS in live cells (Larson et al., 2005). Additionally, binding interactions can be assessed using coincidence analysis which can bring the time required for measurement to the millisecond level (Heinze et al., 2002), dramatically increasing the possibility of evaluating binding interactions driven by physiological stimuli. The proof-of-principle experiment has been performed showing that FCCS coincidence analysis can be extended to three interacting molecules, each labeled with a different colored fluorophore (Heinze et al., 2003). Another interesting application of FCCS is in monitoring the sorting of cargo through the endocytic pathway (Bacia et al., 2002). By labeling the two subunits of cholera toxin with spectrally separable fluorophores (Cy2 and Cy5 in this case), it was possible to examine where in the endocytic pathway the toxin subunits dissociated. Confocal microscopy was used to image and place the focal spot where FCCS was to be accomplished. The results showed that the subunits do not completely dissociate until the cholera toxin has been delivered to the Golgi apparatus. Interestingly, the toxins could be labeled with either Cy2 alone or Cy5 alone and cross-correlation was still detected due to the two proteins moving together within the same vesicle. This result sets the precedent that cross-correlation could be used to assess a variety of questions concerning the temporal and spatial dynamics of cargo transport in live cells.
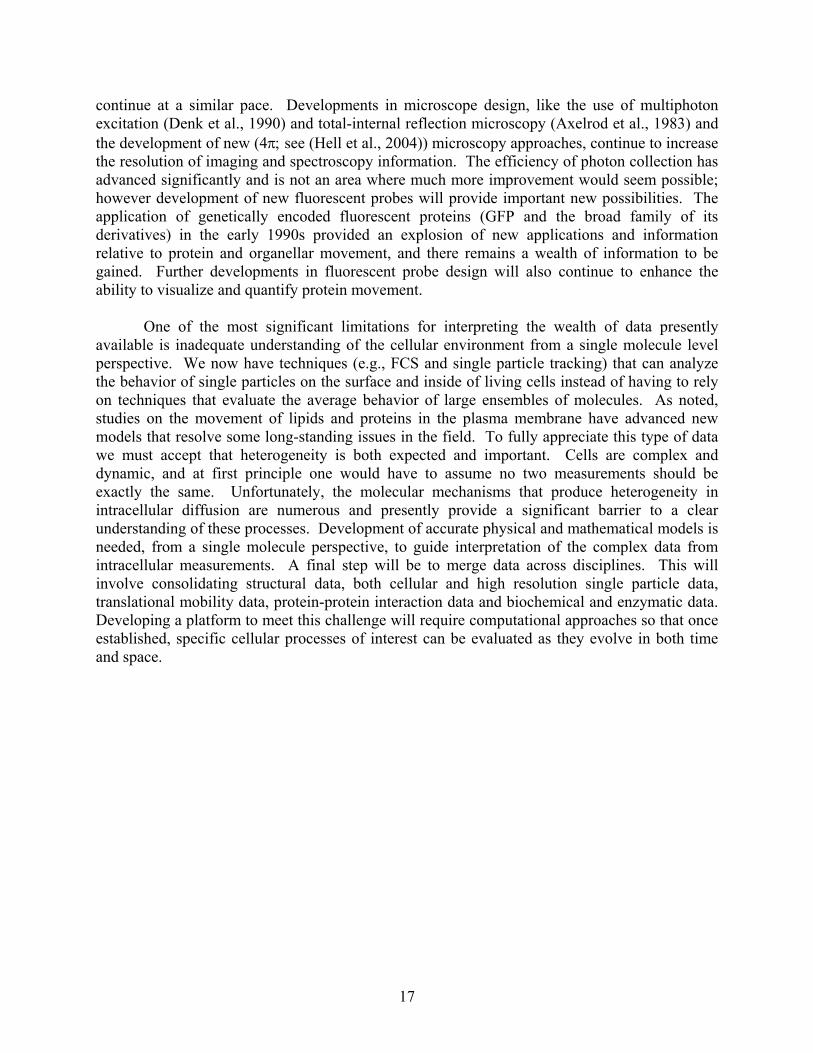
IV. Conclusions and Future Directions Over the last fifteen years, the development of sophisticated fluorescent imaging and spectroscopy techniques has led to a significantly deeper understanding of molecular and organellar movement inside living cells. There is reason to believe these advancements will
17
continue at a similar pace. Developments in microscope design, like the use of multiphoton excitation (Denk et al., 1990) and total-internal reflection microscopy (Axelrod et al., 1983) and the development of new (4π; see (Hell et al., 2004)) microscopy approaches, continue to increase the resolution of imaging and spectroscopy information. The efficiency of photon collection has advanced significantly and is not an area where much more improvement would seem possible; however development of new fluorescent probes will provide important new possibilities. The application of genetically encoded fluorescent proteins (GFP and the broad family of its derivatives) in the early 1990s provided an explosion of new applications and information relative to protein and organellar movement, and there remains a wealth of information to be gained. Further developments in fluorescent probe design will also continue to enhance the ability to visualize and quantify protein movement.
One of the most significant limitations for interpreting the wealth of data presently available is inadequate understanding of the cellular environment from a single molecule level perspective. We now have techniques (e.g., FCS and single particle tracking) that can analyze the behavior of single particles on the surface and inside of living cells instead of having to rely on techniques that evaluate the average behavior of large ensembles of molecules. As noted, studies on the movement of lipids and proteins in the plasma membrane have advanced new models that resolve some long-standing issues in the field. To fully appreciate this type of data we must accept that heterogeneity is both expected and important. Cells are complex and dynamic, and at first principle one would have to assume no two measurements should be exactly the same. Unfortunately, the molecular mechanisms that produce heterogeneity in intracellular diffusion are numerous and presently provide a significant barrier to a clear understanding of these processes. Development of accurate physical and mathematical models is needed, from a single molecule perspective, to guide interpretation of the complex data from intracellular measurements. A final step will be to merge data across disciplines. This will involve consolidating structural data, both cellular and high resolution single particle data, translational mobility data, protein-protein interaction data and biochemical and enzymatic data. Developing a platform to meet this challenge will require computational approaches so that once established, specific cellular processes of interest can be evaluated as they evolve in both time and space.
18
REFERENCE LIST
Axelrod,D., Thompson,N.L., and Burghardt,T.P. (1983). Total internal inflection fluorescent microscopy. J. Microsc. 129 Pt 1, 19-28.
Bacia,K., Majoul,I.V., and Schwille,P. (2002). Probing the endocytic pathway in live cells using dual-color fluorescence cross-correlation analysis. Biophysical Journal 83, 1184-1193.
Bacia,K. and Schwille,P. (2003). A dynamic view of cellular processes by in vivo fluorescence auto- and cross-correlation spectroscopy. Methods 29, 74-85.
Berg,H.C. (1993). Random walks in biology. (Princeton: Princeton University Press).
Burke,N.V., Han,W., Li,D., Takimoto,K., Watkins,S.C., and Levitan,E.S. (1997). Neuronal peptide release is limited by secretory granule mobility. Neuron 19, 1095-1102.
Chen,Y., Muller,J.D., Berland,K.M., and Gratton,E. (1999a). Fluorescence fluctuation spectroscopy. Methods 19, 234-252.
Chen,Y., Muller,J.D., So,P.T., and Gratton,E. (1999b). The photon counting histogram in fluorescence fluctuation spectroscopy. Biophys. J. 77, 553-567.
Choquet,D. and Triller,A. (2003). The role of receptor diffusion in the organization of the postsynaptic membrane. Nat. Rev. Neurosci. 4, 251-265.
Cluzel,P., Surette,M., and Leibler,S. (2000). An ultrasensitive bacterial motor revealed by monitoring signaling proteins in single cells. Science 287, 1652-1655.
Crank,J. (1956). The mathematics of diffusion. (Oxford: Clarendon Press).
Dauty,E. and Verkman,A.S. (2004). Molecular crowding reduces to a similar extent the diffusion of small solutes and macromolecules: measurement by fluorescence correlation spectroscopy. Journal of Molecular Recognition 17, 441-447.
Denk,W., Strickler,J.H., and Webb,W.W. (1990). Two-photon laser scanning fluorescence microscopy. Science 248, 73-76.
Elson,E.L. (2001). Fluorescence correlation spectroscopy measures molecular transport in cells. Traffic. 2, 789-796.
Gennerich,A. and Schild,D. (2002). Anisotropic diffusion in mitral cell dendrites revealed by fluorescence correlation spectroscopy. Biophys. J. 83, 510-522.
Gosch,M. and Rigler,R. (2005). Fluorescence correlation spectroscopy of molecular motions and kinetics. Adv. Drug Deliv. Rev. 57, 169-190.
19
Groc,L., Heine,M., Cognet,L., Brickley,K., Stephenson,F.A., Lounis,B., and Choquet,D. (2004). Differential activity-dependent regulation of the lateral mobilities of AMPA and NMDA receptors. Nat. Neurosci. 7, 695-696.
Haustein,E. and Schwille,P. (2003). Ultrasensitive investigations of biological systems by fluorescence correlation spectroscopy. Methods 29, 153-166.
Heinze,K.G., Jahnz,M., and Schwille,P. (2003). Triple fluorescence coincidence analysis (TFCA): Direct analysis of ternary complex formation. Biophysical Journal 84, 472A-473A.
Heinze,K.G., Rarbach,M., Jahnz,M., and Schwille,P. (2002). Two-photon fluorescence coincidence analysis: Rapid measurements of enzyme kinetics. Biophysical Journal 83, 1671-1681.
Hell,S.W., Dyba,M., and Jakobs,S. (2004). Concepts for nanoscale resolution in fluorescence microscopy. Curr. Opin. Neurobiol. 14, 599-609.
Howard,J. (2001). Mechanics of motor protein and the cytoskeleton. (Sunderland: Sinauer Associates, Inc.).
Jordan,R., Lemke,E.A., and Klingauf,J. (2005). Visualization of synaptic vesicle movement in intact synaptic boutons using fluorescence fluctuation spectroscopy. Biophysical Journal 89, 2091-2102.
Kahya,N., Wiersma,D.A., Poolman,B., and Hoekstra,D. (2002). Spatial organization of bacteriorhodopsin in model membranes. Light-induced mobility changes. J. Biol. Chem. 277, 39304-39311.
Kim,S.A., Heinze,K.G., Bacia,K., Waxham,M.N., and Schwille,P. (2005). Two-photon cross-correlation analysis of intracellular reactions with variable stoichiometry. Biophysical Journal 88, 4319-4336.
Kim,S.A., Heinze,K.G., Waxham,M.N., and Schwille,P. (2004). Intracellular calmodulin availability accessed with two-photon cross-correlation. Proceedings of the National Academy of Sciences of the United States of America 101, 105-110.
Kusumi,A., Nakada,C., Ritchie,K., Murase,K., Suzuki,K., Murakoshi,H., Kasai,R.S., Kondo,J., and Fujiwara,T. (2005). Paradigm shift of the plasma membrane concept from the two-dimensional continuum fluid to the partitioned fluid: high-speed single-molecule tracking of membrane molecules. Annu. Rev. Biophys. Biomol. Struct. 34, 351-378.
Larson,D.R., Gosse,J.A., Holowka,D.A., Baird,B.A., and Webb,W.W. (2005). Temporally resolved interactions between antigen-stimulated IgE receptors and Lyn kinase on living cells. J. Cell Biol. 171, 527-536.
Lehninger,A.L. (1982). Pinciples of biochemistry. (New York: Worth Publishers, Inc.).
20
Lippincott-Schwartz,J., Snapp,E., and Kenworthy,A. (2001). Studying protein dynamics in living cells. Nat. Rev. Mol. Cell Biol. 2, 444-456.
Luby-Phelps,K. (2000). Cytoarchitecture and physical properties of cytoplasm: Volume, viscosity, diffusion, intracellular surface area. In Microcompartmentation and phase separation in cytoplasm, H.Walter, D.E.Brooks, and P.A.Srere, eds. (London: Academic Press), pp. 189-221.
Luby-Phelps,K., Taylor,D.L., and Lanni,F. (1986). Probing the structure of cytoplasm. J. Cell Biol. 102, 2015-2022.
Lukacs,G.L., Haggie,P., Seksek,O., Lechardeur,D., Freedman,N., and Verkman,A.S. (2000). Size-dependent DNA mobility in cytoplasm and nucleus. Journal of Biological Chemistry 275, 1625-1629.
Marsh,B.J., Mastronarde,D.N., Buttle,K.F., Howell,K.E., and McIntosh,J.R. (2001). Organellar relationships in the Golgi region of the pancreatic beta cell line, HIT-T15, visualized by high resolution electron tomography. Proc. Natl. Acad. Sci. U. S. A 98, 2399-2406.
Meissner,O. and Haberlein,H. (2003). Lateral mobility and specific binding to GABA(A) receptors on hippocampal neurons monitored by fluorescence correlation spectroscopy. Biochemistry 42, 1667-1672.
Minton,A.P. (2001). The influence of macromolecular crowding and macromolecular confinement on biochemical reactions in physiological media. J. Biol. Chem. 276, 10577-10580.
Palo,K., Brand,L., Eggeling,C., Jager,S., Kask,P., and Gall,K. (2002). Fluorescence intensity and lifetime distribution analysis: Toward higher accuracy in fluorescence fluctuation spectroscopy. Biophysical Journal 83, 605-618.
Pick,H., Preuss,A.K., Mayer,M., Wohland,T., Hovius,R., and Vogel,H. (2003). Monitoring expression and clustering of the ionotropic 5HT3 receptor in plasma membranes of live biological cells. Biochemistry 42, 877-884.
Poo,M. and Cone,R.A. (1974). Lateral diffusion of rhodopsin in the photoreceptor membrane. Nature 247, 438-441.
Saffman,P.G. and Delbruck,M. (1975). Brownian motion in biological membranes. Proc. Natl. Acad. Sci. U. S. A 72, 3111-3113.
Schwille,P., Haupts,U., Maiti,S., and Webb,W.W. (1999). Molecular dynamics in living cells observed by fluorescence correlation spectroscopy with one- and two-photon excitation. Biophysical Journal 77, 2251-2265.
Seksek,O., Biwersi,J., and Verkman,A.S. (1997). Translational diffusion of macromolecule-sized solutes in cytoplasm and nucleus. Journal of Cell Biology 138, 131-142.
Steyer,J.A., Horstmann,H., and Almers,W. (1997). Transport, docking and exocytosis of single secretory granules in live chromaffin cells. Nature 388, 474-478.
21
Stryer,L. (1988). Biochemistry. (New York: W.H. Freeman and Co.).
Terada,S., Kinjo,M., and Hirokawa,N. (2000). Oligomeric tubulin in large transporting complex is transported via kinesin in squid giant axons. Cell 103, 141-155.
Verkman,A.S. (2002). Solute and macromolecule diffusion in cellular aqueous compartments. Trends in Biochemical Sciences 27, 27-33.
Weiss,M. (2004). Challenges and artifacts in quantitative photobleaching experiments. Traffic. 5, 662-671.
Weiss,M., Elsner,M., Kartberg,F., and Nilsson,T. (2004). Anomalous subdiffusion is a measure for cytoplasmic crowding in living cells. Biophys. J. 87, 3518-3524.
Zajchowski,L.D. and Robbins,S.M. (2002). Lipid rafts and little caves. Compartmentalized signalling in membrane microdomains. Eur. J. Biochem. 269, 737-752.
Zipfel,W.R. and Webb,W.W. (2006). In vivo diffusion measurements using multiphoton excitation fluorescence photobleaching recovery and fluorescence correlation spectroscopy. In Methods in Cellular Imaging, A.Periasamy, ed. (Oxford: Oxford University Press), pp. 216-235.
22
Table 1 Physical Properties of a 100 kDa protein
Property Value Comment Mass 166 x 10-24 kg Mass of one mole/Avogadro's constant
Density 1.38 x 10³ kg/m3 1.38 times the density of water
Volume 120 nm3 Mass/density
Radius 3 nm Assuming a spherical shape
Drag Coefficient (in water @ 20oC) 60 pN.s/m From Stoke's Law
Diffusion Coefficient (in water @ 20oC) 67 μm2/s From the Stoke's-Einstein relationship
Average Speed 8.6 m/s From the Equipartion principle
Modified from Howard (2001)
23
Table 2
Distance/Time Relationship for One-Dimensional Diffusion of Different Sized Objects in Water
Distance
Traveled
Object 1 μm 100 μm 10 mm 1 m
K+ 0.25 ms 2.5 s 2.5 x 10⁴ s
(7 hours)
2.5 x 10⁸s
(8 years)
Protein
(3 nm radius)
5 ms 50 s 5 x 10⁵ s
(6 days)
5 x 10⁹ s
150 years
Organelle
(0.5 μm radius)
1 s 104 s
(3 hr)
108 s
(3 years)
1012 s
(30 million years)
Modified from Howard (2001)

24
Table 3
Lipid Composition from Membranes (percent by weight)
Membrane Phospholipids Cholesterol Glycolipids Cholesterol esters and
other Plasma 57 15 6 22
Golgi 57 9 0 34
ER 85 5 0 10
Inner Mito 92 0 0 8
Nuclear 85 5 0 10
Modified from Lehninger, 1982
25
Table 4
Comparison of Diffusion Coefficients from in Vitro and in Situ FPR Measurements
Protein
Radius (nm)
Ds
(in solution) Dc
(in cytoplasm Dc/Ds % mobile
Calmodulin 2.1 102 <4 0.039 81 GFP 2.5 87 27 0.31 82 BSA 3.2 67 6.8 0.1 77 Creatine
kinase 3.3 65 <4.5 0.07 50-80
Enolase 3.8 56 13.5 0.24 100 IgG 4.7 46 6.7 0.15 54
D= diffusion coefficients (μm2/s); modified from Luby-Phelps, 2001
26
Table 5
Diffusion of GFP and GFP-Fusion Proteins by FPR
Molecule D (μm2/s)
GFP in water 87
GFP in cytoplasm 25
GFP in the ER lumen 5-10
GFP in the mitochondrial matrix 20-30
ER Membrane
GFP-VSV G-protein 0.45
GFP-signal recognition particle 0.26
Golgi Membrane
GFP-galactosyltransferase 0.54
Nucleoplasm
GFP-fibrillarin 0.53
GFP-ERCC1/XPF 15
Plasma Membrane
GFP-cadherin 0.03-0.04
Modified from Lippincott-Schwartz, 2001
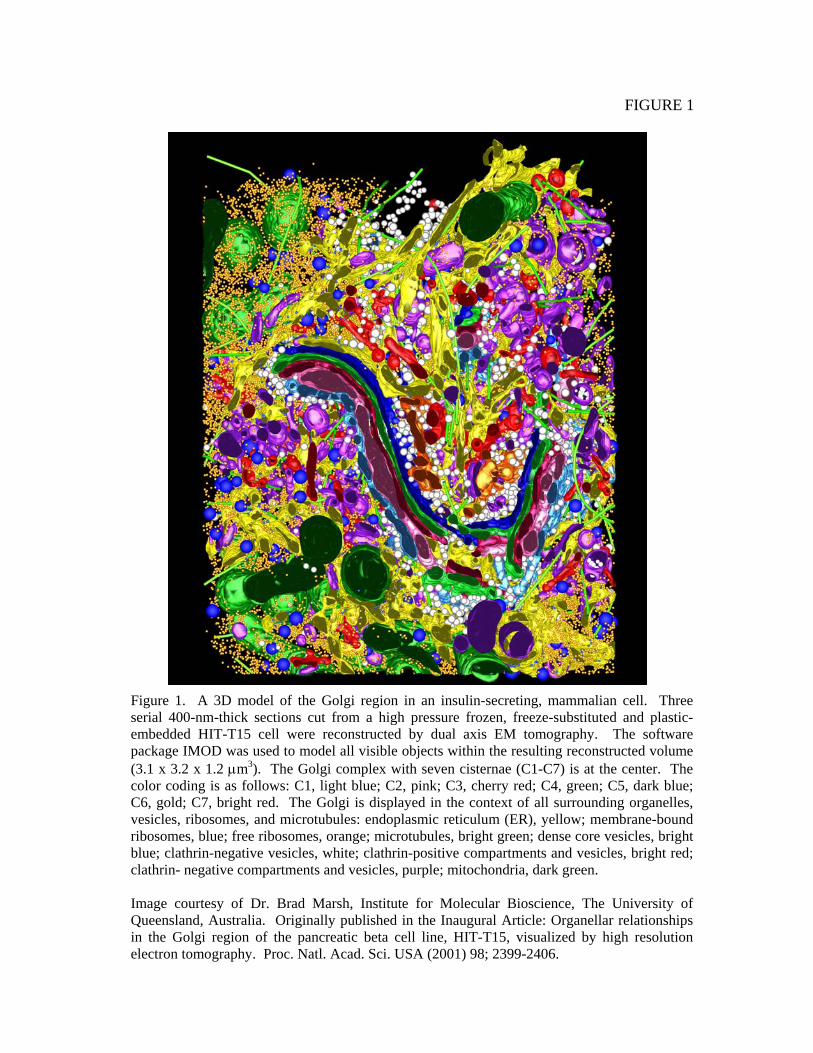
FIGURE 1
Figure 1. A 3D model of the Golgi region in an insulin-secreting, mammalian cell. Three serial 400-nm-thick sections cut from a high pressure frozen, freeze-substituted and plastic-embedded HIT-T15 cell were reconstructed by dual axis EM tomography. The software package IMOD was used to model all visible objects within the resulting reconstructed volume (3.1 x 3.2 x 1.2 μm3). The Golgi complex with seven cisternae (C1-C7) is at the center. The color coding is as follows: C1, light blue; C2, pink; C3, cherry red; C4, green; C5, dark blue; C6, gold; C7, bright red. The Golgi is displayed in the context of all surrounding organelles, vesicles, ribosomes, and microtubules: endoplasmic reticulum (ER), yellow; membrane-bound ribosomes, blue; free ribosomes, orange; microtubules, bright green; dense core vesicles, bright blue; clathrin-negative vesicles, white; clathrin-positive compartments and vesicles, bright red; clathrin- negative compartments and vesicles, purple; mitochondria, dark green. Image courtesy of Dr. Brad Marsh, Institute for Molecular Bioscience, The University of Queensland, Australia. Originally published in the Inaugural Article: Organellar relationships in the Golgi region of the pancreatic beta cell line, HIT-T15, visualized by high resolution electron tomography. Proc. Natl. Acad. Sci. USA (2001) 98; 2399-2406.
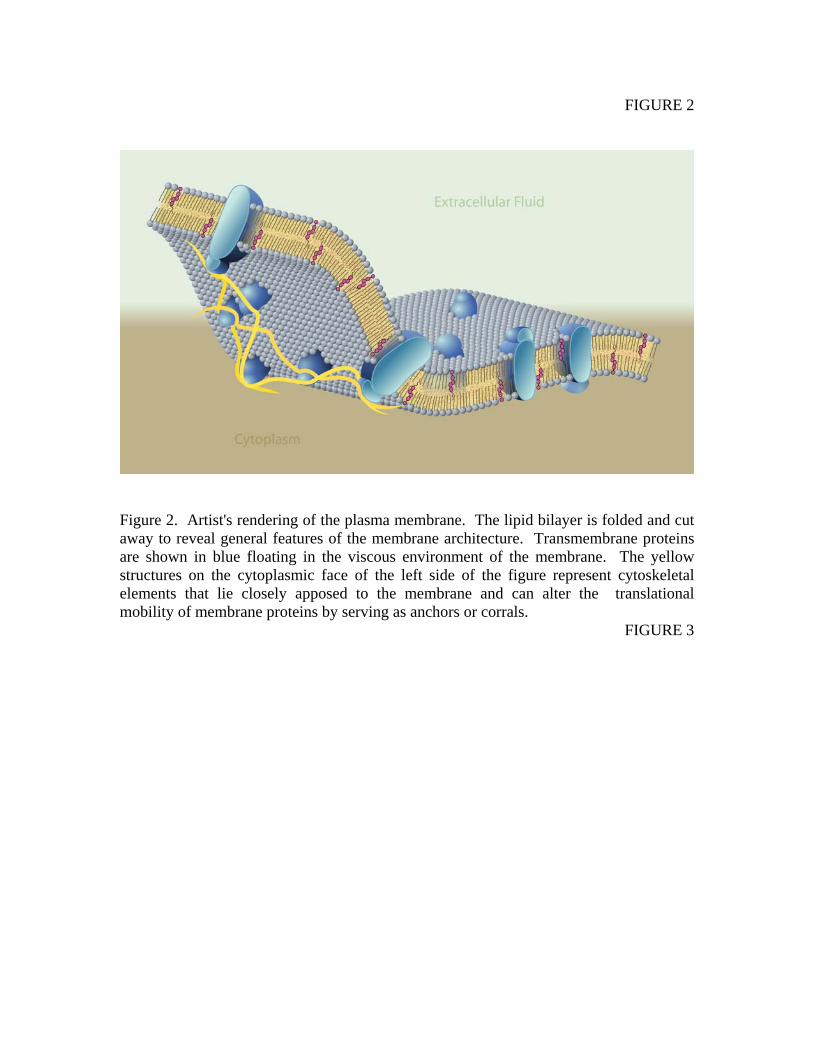
FIGURE 2
Figure 2. Artist's rendering of the plasma membrane. The lipid bilayer is folded and cut away to reveal general features of the membrane architecture. Transmembrane proteins are shown in blue floating in the viscous environment of the membrane. The yellow structures on the cytoplasmic face of the left side of the figure represent cytoskeletal elements that lie closely apposed to the membrane and can alter the translational mobility of membrane proteins by serving as anchors or corrals.
FIGURE 3
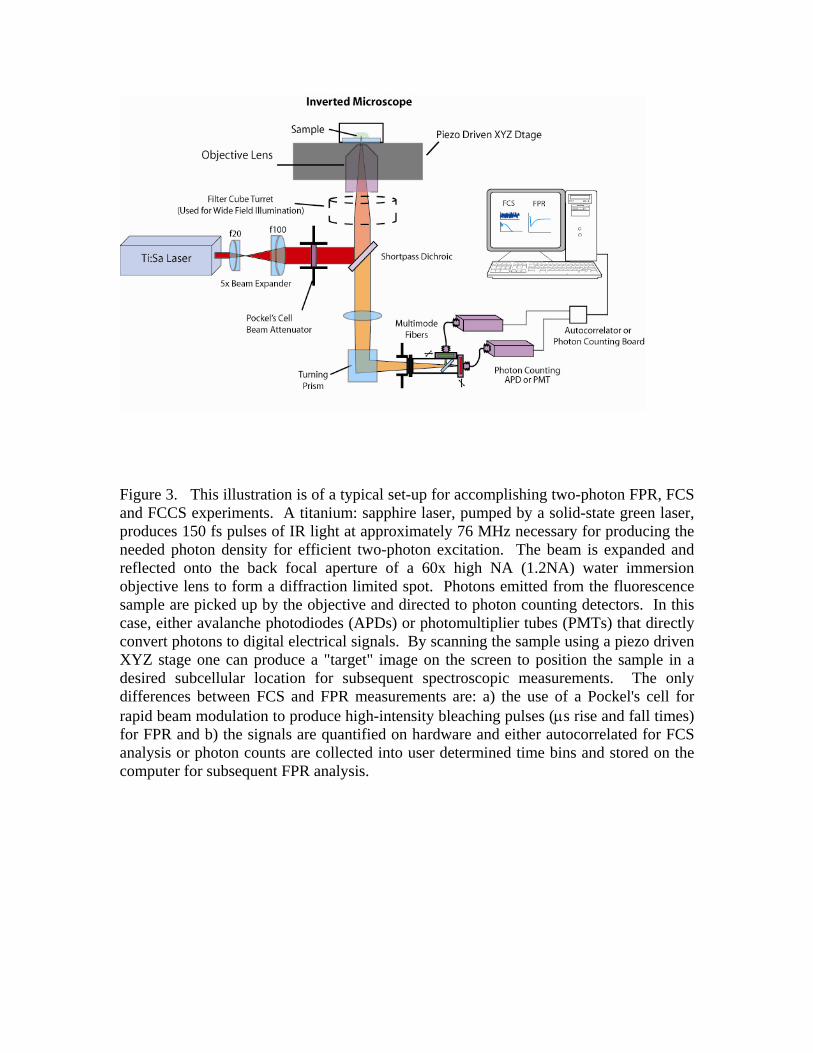
Figure 3. This illustration is of a typical set-up for accomplishing two-photon FPR, FCS and FCCS experiments. A titanium: sapphire laser, pumped by a solid-state green laser, produces 150 fs pulses of IR light at approximately 76 MHz necessary for producing the needed photon density for efficient two-photon excitation. The beam is expanded and reflected onto the back focal aperture of a 60x high NA (1.2NA) water immersion objective lens to form a diffraction limited spot. Photons emitted from the fluorescence sample are picked up by the objective and directed to photon counting detectors. In this case, either avalanche photodiodes (APDs) or photomultiplier tubes (PMTs) that directly convert photons to digital electrical signals. By scanning the sample using a piezo driven XYZ stage one can produce a "target" image on the screen to position the sample in a desired subcellular location for subsequent spectroscopic measurements. The only differences between FCS and FPR measurements are: a) the use of a Pockel's cell for rapid beam modulation to produce high-intensity bleaching pulses (μs rise and fall times) for FPR and b) the signals are quantified on hardware and either autocorrelated for FCS analysis or photon counts are collected into user determined time bins and stored on the computer for subsequent FPR analysis.
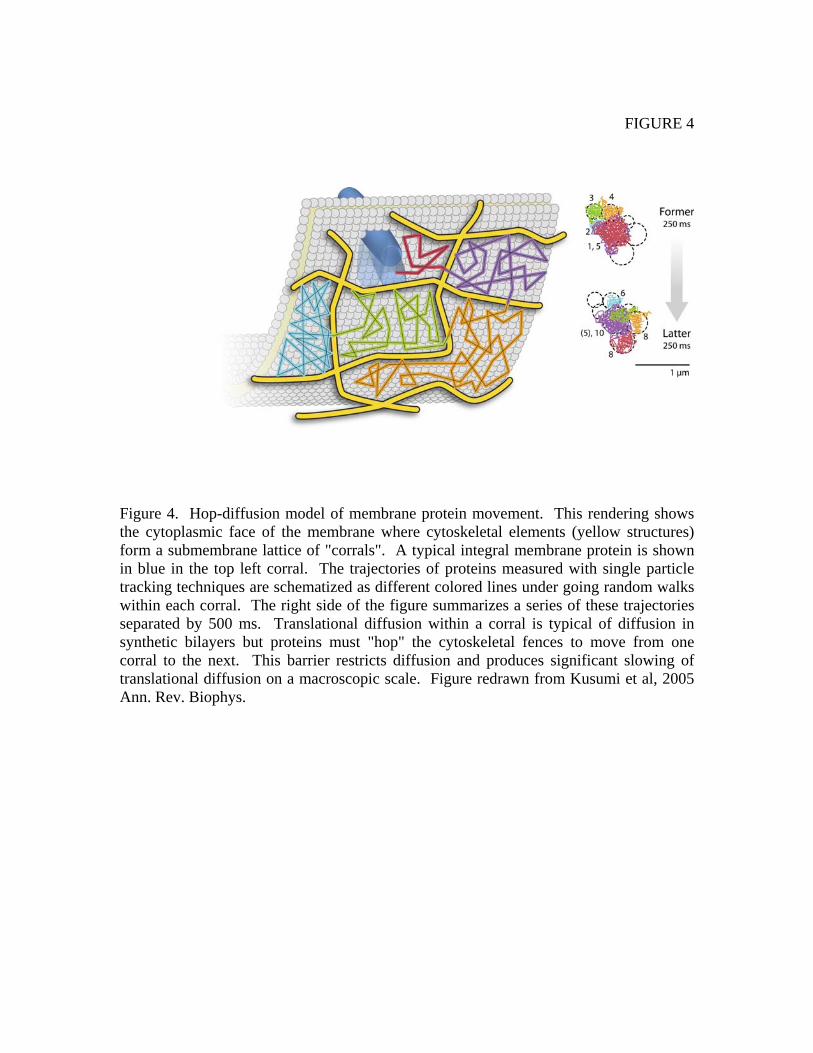
FIGURE 4
Figure 4. Hop-diffusion model of membrane protein movement. This rendering shows the cytoplasmic face of the membrane where cytoskeletal elements (yellow structures) form a submembrane lattice of "corrals". A typical integral membrane protein is shown in blue in the top left corral. The trajectories of proteins measured with single particle tracking techniques are schematized as different colored lines under going random walks within each corral. The right side of the figure summarizes a series of these trajectories separated by 500 ms. Translational diffusion within a corral is typical of diffusion in synthetic bilayers but proteins must "hop" the cytoskeletal fences to move from one corral to the next. This barrier restricts diffusion and produces significant slowing of translational diffusion on a macroscopic scale. Figure redrawn from Kusumi et al, 2005 Ann. Rev. Biophys.
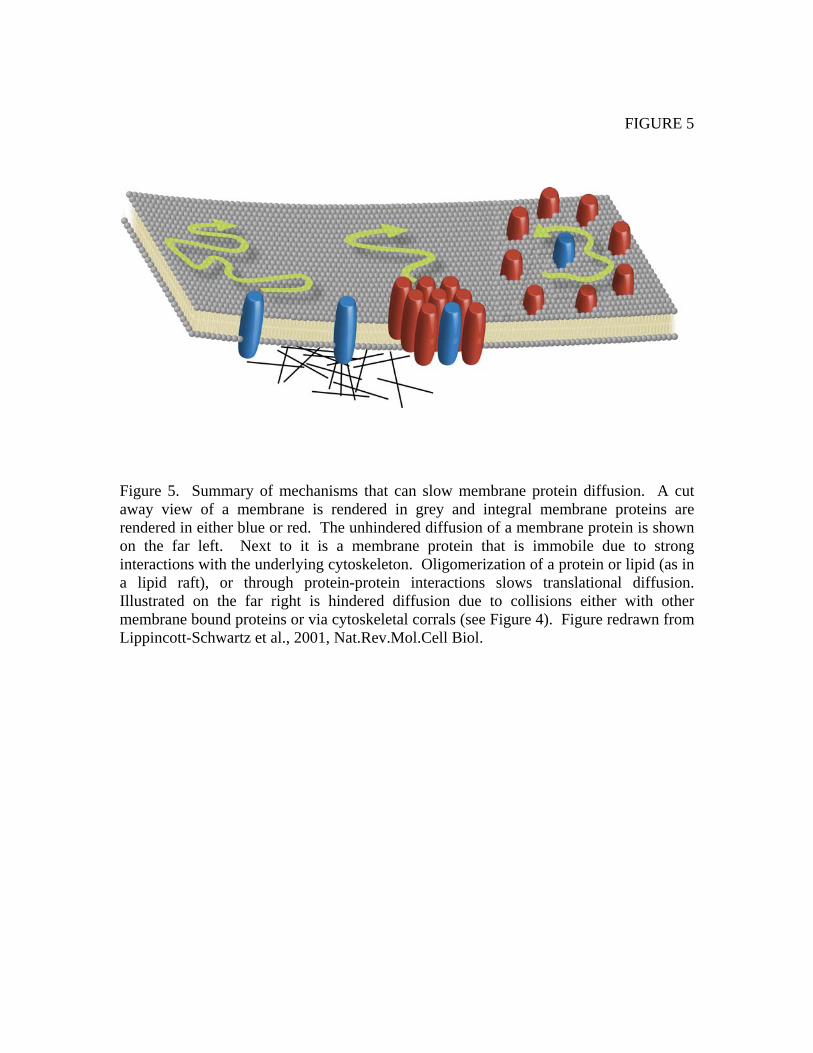
FIGURE 5
Figure 5. Summary of mechanisms that can slow membrane protein diffusion. A cut away view of a membrane is rendered in grey and integral membrane proteins are rendered in either blue or red. The unhindered diffusion of a membrane protein is shown on the far left. Next to it is a membrane protein that is immobile due to strong interactions with the underlying cytoskeleton. Oligomerization of a protein or lipid (as in a lipid raft), or through protein-protein interactions slows translational diffusion. Illustrated on the far right is hindered diffusion due to collisions either with other membrane bound proteins or via cytoskeletal corrals (see Figure 4). Figure redrawn from Lippincott-Schwartz et al., 2001, Nat.Rev.Mol.Cell Biol.

FIGURE 6
Figure 6. Example of FCCS measurements in live cells. Shown at the top are confocal images of HEK293 cells. The cells were transfected with EGFP-tagged CaM-kinase II (green in the images) and then Alexa-633-CaM (red in the images) was introduced using electroporation. After time for equilibration, FCCS measurements were made using an experimental system very similar to that shown in Figure 3. The bottom panel shows the cross-correlation curves of the red and green signals after elevating intracellular Ca2+ levels by toxin permeabilization (light blue curve) followed by EGTA treatment to remove Ca2+ (purple curve). The two images shown at the top are of these two conditions, respectively. The results demonstrate the Ca2+ mediated binding and unbinding of CaM to CaM-kinase II in live cells. This figure was taken from Kim et al., 2004, PNAS where more details can be found for the experimental design and data analysis.
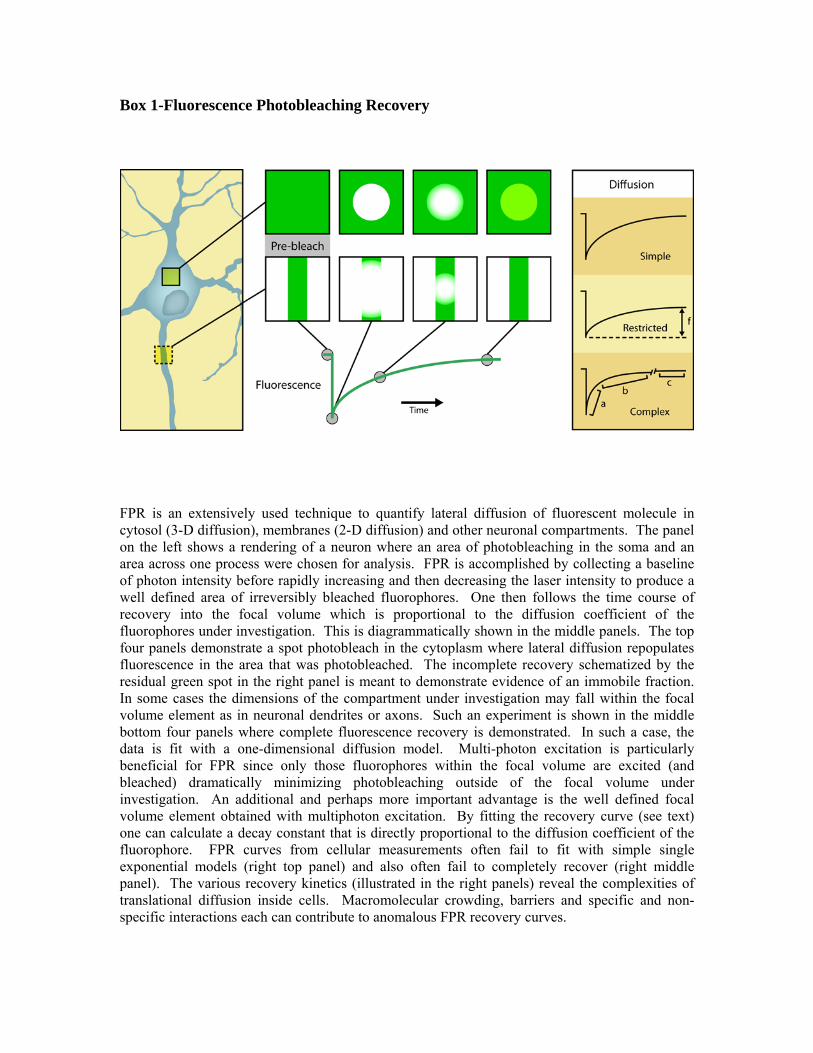
Box 1-Fluorescence Photobleaching Recovery
FPR is an extensively used technique to quantify lateral diffusion of fluorescent molecule in cytosol (3-D diffusion), membranes (2-D diffusion) and other neuronal compartments. The panel on the left shows a rendering of a neuron where an area of photobleaching in the soma and an area across one process were chosen for analysis. FPR is accomplished by collecting a baseline of photon intensity before rapidly increasing and then decreasing the laser intensity to produce a well defined area of irreversibly bleached fluorophores. One then follows the time course of recovery into the focal volume which is proportional to the diffusion coefficient of the fluorophores under investigation. This is diagrammatically shown in the middle panels. The top four panels demonstrate a spot photobleach in the cytoplasm where lateral diffusion repopulates fluorescence in the area that was photobleached. The incomplete recovery schematized by the residual green spot in the right panel is meant to demonstrate evidence of an immobile fraction. In some cases the dimensions of the compartment under investigation may fall within the focal volume element as in neuronal dendrites or axons. Such an experiment is shown in the middle bottom four panels where complete fluorescence recovery is demonstrated. In such a case, the data is fit with a one-dimensional diffusion model. Multi-photon excitation is particularly beneficial for FPR since only those fluorophores within the focal volume are excited (and bleached) dramatically minimizing photobleaching outside of the focal volume under investigation. An additional and perhaps more important advantage is the well defined focal volume element obtained with multiphoton excitation. By fitting the recovery curve (see text) one can calculate a decay constant that is directly proportional to the diffusion coefficient of the fluorophore. FPR curves from cellular measurements often fail to fit with simple single exponential models (right top panel) and also often fail to completely recover (right middle panel). The various recovery kinetics (illustrated in the right panels) reveal the complexities of translational diffusion inside cells. Macromolecular crowding, barriers and specific and non-specific interactions each can contribute to anomalous FPR recovery curves.
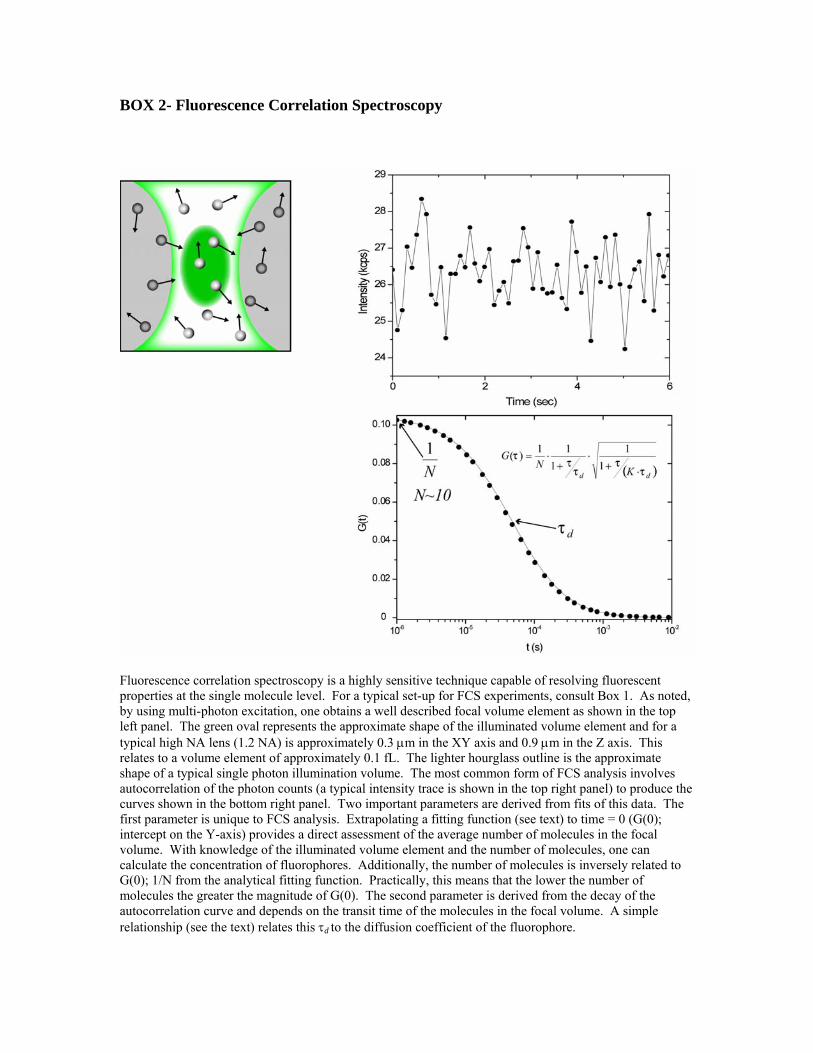
BOX 2- Fluorescence Correlation Spectroscopy
Fluorescence correlation spectroscopy is a highly sensitive technique capable of resolving fluorescent properties at the single molecule level. For a typical set-up for FCS experiments, consult Box 1. As noted, by using multi-photon excitation, one obtains a well described focal volume element as shown in the top left panel. The green oval represents the approximate shape of the illuminated volume element and for a typical high NA lens (1.2 NA) is approximately 0.3 μm in the XY axis and 0.9 μm in the Z axis. This relates to a volume element of approximately 0.1 fL. The lighter hourglass outline is the approximate shape of a typical single photon illumination volume. The most common form of FCS analysis involves autocorrelation of the photon counts (a typical intensity trace is shown in the top right panel) to produce the curves shown in the bottom right panel. Two important parameters are derived from fits of this data. The first parameter is unique to FCS analysis. Extrapolating a fitting function (see text) to time = 0 (G(0); intercept on the Y-axis) provides a direct assessment of the average number of molecules in the focal volume. With knowledge of the illuminated volume element and the number of molecules, one can calculate the concentration of fluorophores. Additionally, the number of molecules is inversely related to G(0); 1/N from the analytical fitting function. Practically, this means that the lower the number of molecules the greater the magnitude of G(0). The second parameter is derived from the decay of the autocorrelation curve and depends on the transit time of the molecules in the focal volume. A simple relationship (see the text) relates this τd to the diffusion coefficient of the fluorophore.
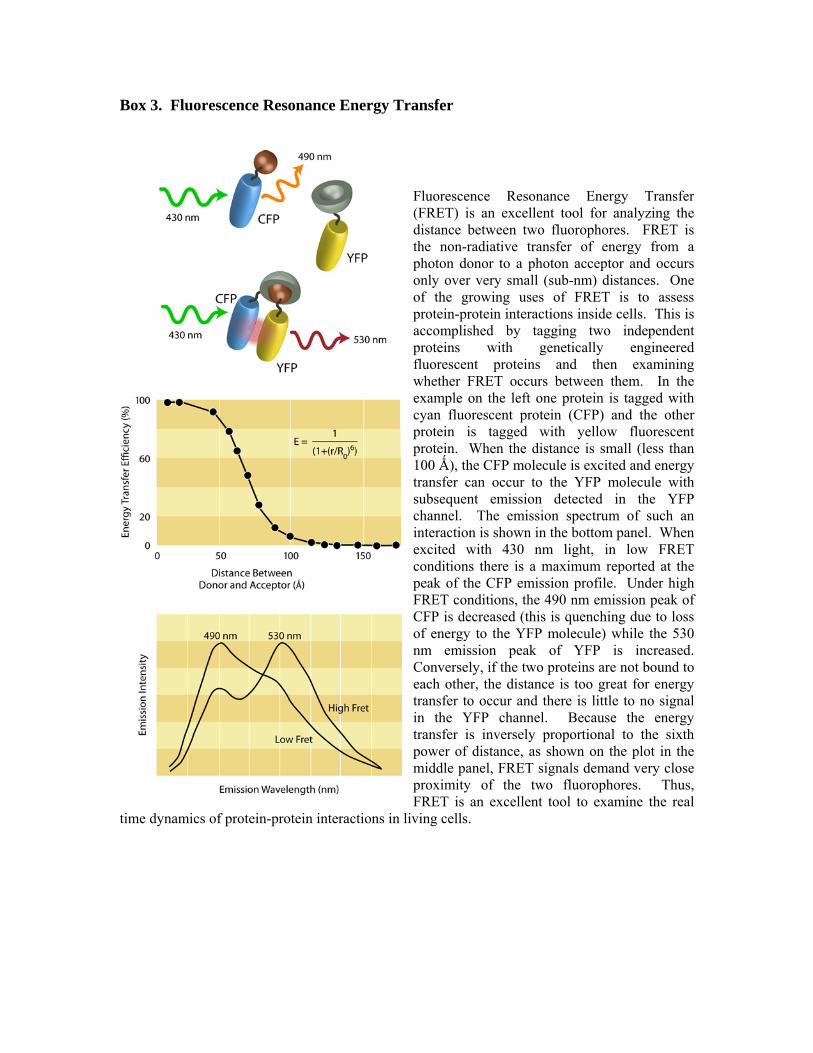
Box 3. Fluorescence Resonance Energy Transfer
Fluorescence Resonance Energy Transfer (FRET) is an excellent tool for analyzing the distance between two fluorophores. FRET is the non-radiative transfer of energy from a photon donor to a photon acceptor and occurs only over very small (sub-nm) distances. One of the growing uses of FRET is to assess protein-protein interactions inside cells. This is accomplished by tagging two independent proteins with genetically engineered fluorescent proteins and then examining whether FRET occurs between them. In the example on the left one protein is tagged with cyan fluorescent protein (CFP) and the other protein is tagged with yellow fluorescent protein. When the distance is small (less than 100 Ǻ), the CFP molecule is excited and energy transfer can occur to the YFP molecule with subsequent emission detected in the YFP channel. The emission spectrum of such an interaction is shown in the bottom panel. When excited with 430 nm light, in low FRET conditions there is a maximum reported at the peak of the CFP emission profile. Under high FRET conditions, the 490 nm emission peak of CFP is decreased (this is quenching due to loss of energy to the YFP molecule) while the 530 nm emission peak of YFP is increased. Conversely, if the two proteins are not bound to each other, the distance is too great for energy transfer to occur and there is little to no signal in the YFP channel. Because the energy transfer is inversely proportional to the sixth power of distance, as shown on the plot in the middle panel, FRET signals demand very close proximity of the two fluorophores. Thus, FRET is an excellent tool to examine the real
time dynamics of protein-protein interactions in living cells.
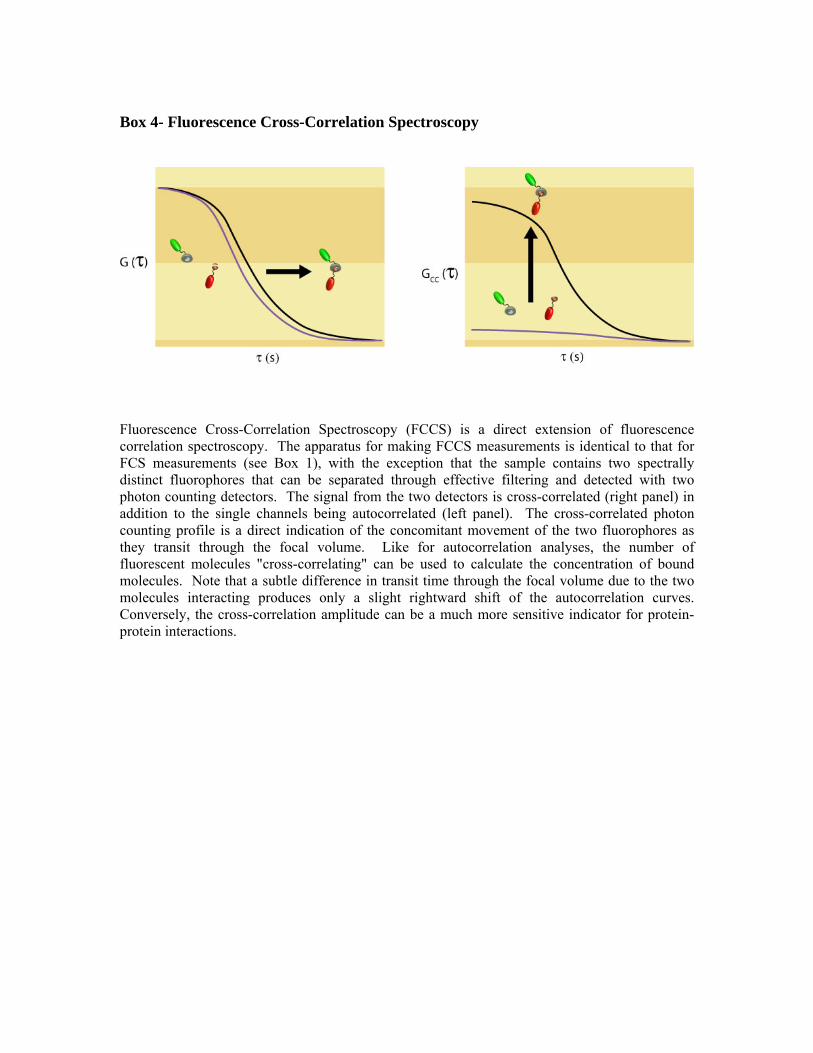
Box 4- Fluorescence Cross-Correlation Spectroscopy
Fluorescence Cross-Correlation Spectroscopy (FCCS) is a direct extension of fluorescence correlation spectroscopy. The apparatus for making FCCS measurements is identical to that for FCS measurements (see Box 1), with the exception that the sample contains two spectrally distinct fluorophores that can be separated through effective filtering and detected with two photon counting detectors. The signal from the two detectors is cross-correlated (right panel) in addition to the single channels being autocorrelated (left panel). The cross-correlated photon counting profile is a direct indication of the concomitant movement of the two fluorophores as they transit through the focal volume. Like for autocorrelation analyses, the number of fluorescent molecules "cross-correlating" can be used to calculate the concentration of bound molecules. Note that a subtle difference in transit time through the focal volume due to the two molecules interacting produces only a slight rightward shift of the autocorrelation curves. Conversely, the cross-correlation amplitude can be a much more sensitive indicator for protein-protein interactions.