Embed Size (px)
Citation preview
1

The following is intended to outline our general product direction. It is intended for information purposes only, and may not be incorporated into any contract. It is not a commitment to deliver anycontract. It is not a commitment to deliver any material, code, or functionality, and should not be relied upon in making purchasing decisions.The development release and timing of anyThe development, release, and timing of any features or functionality described for Oracle’s products remains at the sole discretion of Oracle.
2

<Insert Picture Here>
Session #S317066Diving Deep Into the Root Cause of Problems with JVM Diagnostics In Enterprise ManagerGlen Hawkins Director of Product ManagementGlen Hawkins, Director of Product Management

The following is intended to outline our general product direction. It is intended for information purposes only, and may not be incorporated into any contract. It is not a commitment to deliver anycontract. It is not a commitment to deliver any material, code, or functionality, and should not be relied upon in making purchasing decisions.The development release and timing of anyThe development, release, and timing of any features or functionality described for Oracle’s products remains at the sole discretion of Oracle.
4

Agenda
<Insert Picture Here>• Oracle Enterprise Manager Overviewg• JVM Diagnostics Challenges
• Gaps in existing tools for production use
K U C• Key Use Cases• JVM Diagnostics Key Advantages• Customer Success Story• Customer Success Story• Demonstration• Q&AQ&
5

<Insert Picture Here>
Oracle Enterprise Manager OverviewManager Overview

Business-Driven IT Management
7© 2010 Oracle Corporation 7

<Insert Picture Here>
JVM Diagnostics ChallengesChallenges
8
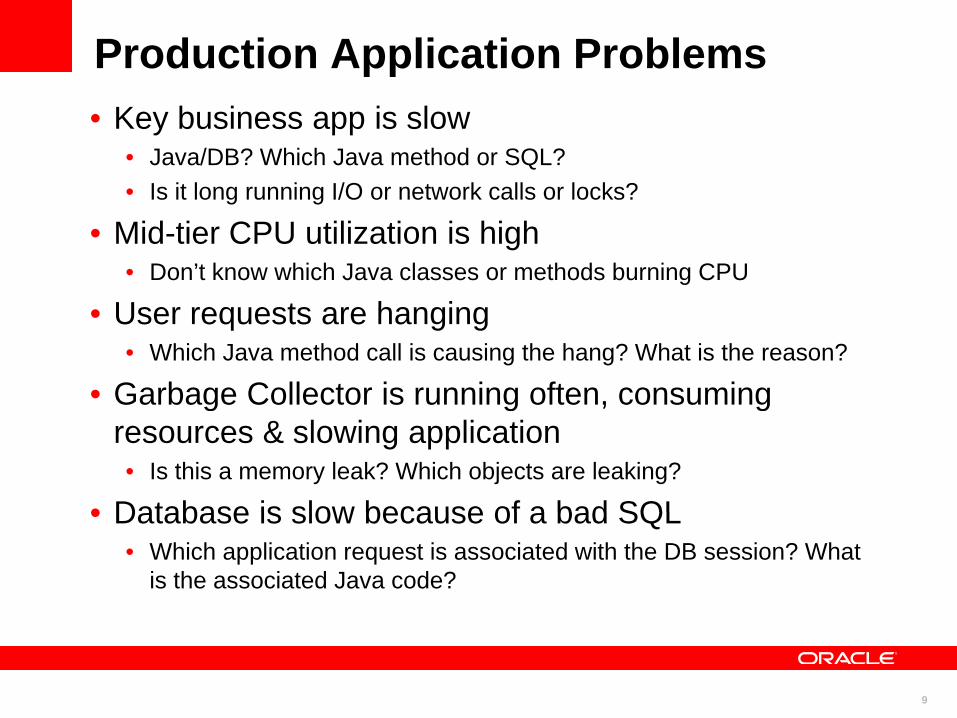
Production Application Problems• Key business app is slow
• Java/DB? Which Java method or SQL?• Is it long running I/O or network calls or locks?
• Mid-tier CPU utilization is high• Don’t know which Java classes or methods burning CPU
User requests are hanging• User requests are hanging• Which Java method call is causing the hang? What is the reason?
• Garbage Collector is running often, consuming g g gresources & slowing application• Is this a memory leak? Which objects are leaking?
• Database is slow because of a bad SQL• Database is slow because of a bad SQL• Which application request is associated with the DB session? What
is the associated Java code?
9

Production Diagnostic VisibilityA must have for viable problem resolutionA must have for viable problem resolution• Large number of problems occur ONLY in production
and cannot be reproduced elsewhere• Typically they occur at the WORST possible time and
hence need to be resolved rapidly• Retailers facing crushing loads on Black Friday or Tax• Retailers facing crushing loads on Black Friday or Tax
processing servers on 15th April
• Must accelerate problem resolution times• Reduce costs by saving time spent by IT operations
teams, developers, architects & DBAs • Empowers IT teams to diagnose Java application• Empowers IT teams to diagnose Java application
problems
10

Diagnostic Challenges
• Limited production visibility• Not enough depth to diagnose production issues• Diagnostic tools not suited for production• Inability to reproduce problems on other environments• Hard to isolate culprit tier and component• Impacts time to resolution
Java is a black box
11

<Insert Picture Here>
Key Use Cases
12
The Four Primary Use Cases
• Performance and resource use over time• “Why does my application feel so slow?”y y pp
• Immediate/live resource consumption• “Why is my system hung?”
M bl b h i• Momentary problem behavior• “It only happens when I click here…”
• Memory/heap consumption between pointsMemory/heap consumption between points• “What ate up all my memory?”
13

Performance & Resource Usage“Why does my application feel so slow?”y y pp
• Symptoms• General reports of slowdowns from usersp• Greater than expected server resources• Feeling that there are “low-hanging fruit” opportunities for
optimizationoptimization
• Solution Approach• Trend resource consumption
• By type: DB vs. IO vs. Net vs. CPU• By class/methody
14

Thread-based Resource ConsumptionImmediate Examine CPU
dImmediatevisibility into the state of threads for a JVM or JVM Pool
and memory heap utilization by JVM
Filter and analyze your JVMs by requests in addition to restricting the cross-tier analysis to the database
T th dTop methods can easily be filtered on and drilled into to identify referenced
15
referenced objects

Live Resource Consumption“Why is my system hung?”Why is my system hung?
• Symptoms• System not respondingy p g• Application server process not crashed• Server accepting new requests
• But not responding to them• But not responding to them
• Solution Approach• Live thread visibility• Thread lock analysis
16

Live Thread and Stack View/Browse
Live threads with statuswith status,request entry point, Java file and line number in addition toaddition to state information
Method stack details and informationrelated to whichrelated to which thread holds the current lock
17

Momentary Problem Behavior“It l h h I li k h ”“It only happens when I click here…”
• Symptomsy• Reproducible test case• Short lived (seconds to minutes) behavior that requires
isolationisolation
• Solution Approach• Fine grained data capture during known duration• Analysis of a defined snapshot period
18
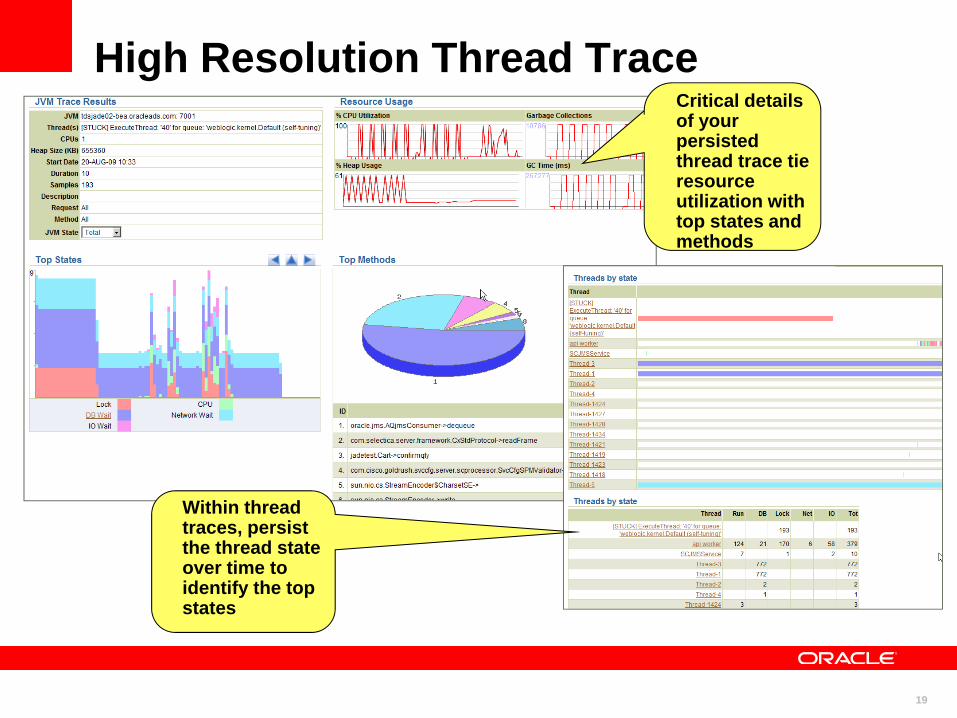
High Resolution Thread TraceCritical detailsCritical details of your persisted thread trace tie resource utilization withutilization with top states and methods
Within threadWithin thread traces, persistthe thread state over time to identify the top states
19

Memory/Heap Consumption“What ate up all my memory?”What ate up all my memory?
• Symptomsy• Out of memory errors• Intermittent whole-system sluggishness• High process resident memory usage• High process resident memory usage
• Solution Approach• Quickly take heap snapshots• Browse and compare heap contents
20

Heap Object Analysis
Quickly determine the cause of performanceperformance degradationsthat occur over time with heap comparisons
Deep contextual drill-downs allow identify the objects in the heap stack that are consuming memory on the
21
heap

<Insert Picture Here>
JVM Diagnostics Key AdvantagesAdvantages
22
Difference: HOT DeploymentDynamic deployment on running applicationsDynamic deployment on running applications
• No parameter changes neededg• Deploys dynamically as a web application• Does not need app configuration changes• Does not need profiling support• Does not alter the class loader
23

Cross-tier Trace With Database
• Trace Java thread to DB session• Identify in-flight Java
threads waiting for database resourceD ill t SQL• Drill to SQL
• Trace DB session to Java thread• View database
sessions waiting for h ldi l kor holding locks
• Identify Java thread holding database session
24
session

<Insert Picture Here>
Customer Success Story
25

SEAT Pagine Gialle
• Large number of Java EE applications running on shared infrastructure
Challenges• Must quickly determine the root cause of performance problems
and deliver actionable information at the Java class/method level to customers and partners
• Java developers must assure software quality before production deployment
Solution • Diagnostics Pack for Oracle Middleware
Business
• Java EE application performance problems tracked more quickly and with less effort
• Faster cycle time for fixing core production application codeResults
y g p pp• New Java EE applications can be tested with less effort and
more detail• Low overhead means no extra hardware cost
26

<Insert Picture Here>
Packaging and Future DirectionDirection
27

WebLogic Server Management Pack EEComplete management for all WebLogic ServersComplete management for all WebLogic Servers
• Business Transaction Management• Discovery of transaction flows across
the enterprisethe enterprise• Leverages transaction content/payload
for business visibility• Exception Management Performance Business
Transaction
Development
• Performance & Diagnostics• Enterprise scale multi-domain
management• Deep JVM diagnostics pinpoints
& DiagnosticsTransaction Management
P d ti T t• Deep JVM diagnostics pinpoints application issues in production
• Improve performance and availability of Java EE and SOA applications
Lifecycle Management
Production Test
• Lifecycle Management• Manage configuration changes• Automated deployment procedures to
clone and scale-up applications
28
clone and scale up applications

WLS Management Pack EEHigh-level RoadmapHigh-level Roadmap
CurrentPlatform Support
WebLogic Server Virtual
Future ReleasesEM / E2E Integration
BTM Integration
Next ReleaseAgent/Manager update
Consolidate agent deploymentEdition
Additional 64-bit IBM JREsExalogic Management
JVM Diagnostics
Consolidated end-to-end agent (ADP/JVM/BTM)
Consolidated automated installation
User Experience data integration for dimensional
Bi-directional impact analysis with Database diagnostics
Full Configuration Management (ACC/CCC) IntegrationJRockit Virtual Edition
Continued new JRE supportSQL Hash look-up
Request MonitoringSi l t i t
integration for dimensional analysis of transactions
Platform SupportLatest versions of Fusion Apps
and FMW
IntegrationJVM as a target
Lifecycle ManagementWLS PatchingWLS Gold Image ProvisioningSingle request instance
transaction tracing
EM / RUEI IntegrationEnhance contextual drill-down
and FMW
Support IntegrationOffline Diagnostics expansion
framework
WLS Gold Image ProvisioningJava EE application
provisioning
Application Performance Management
Provisioning/CloningExpand platform support
(Solaris, AIX, Windows)
ManagementMiddleware Diagnostics
Advisor (MDA)
Support IntegrationOffline DiagnosticsOffline Diagnostics

Oracle Enterprise Manager 11gResource Center
Access Videos, Webcasts, White Papers, and More
Oracle com/enterprisemanager11gOracle.com/enterprisemanager11g

Additional Sessions / Demos / Hands-On Labs
SESSION ID
TITLE OF TECHNICAL SESSION DATE & TIME
LOCATION
S317067 WebLogic Server Management for Oracle DBAs
Thursday 9:00 am
Marriott Hotel, Salon 9
S316996 Oracle Enterprise Manager Grid Control Deployment Best Practices
Thursday 10:30 am
Moscone South, Room 102Deployment Best Practices 10:30 am Room 102
S317066 Deep Java Diagnostics and Performance Tuning: Expert Tips and Techniques
Thursday 1:30 pm
Marriott Hotel, Salon 9
S317060 Managing User Experience in the Cloud: Thursday Marriott Hotel, g g pLessons from eBay
y1:30 pm
,Golden Gate A
Enterprise Manager DEMOgrounds in Moscone West
Fusion Middleware Management Hands-On Lab on Tuesday 2:00-3:00 pm and Thursday 10:30 – 11:30 am in
Marriott Hotel Salon 12/13 YB Level
31
Marriott Hotel, Salon 12/13, YB Level

<Insert Picture Here>
Questions and Answers
32

33

34