Embed Size (px)
Citation preview
sustainability
Article
The Flexible Operation of Coal Power and ItsRenewable Integration Potential in China
Chunning Na 1,* , Huan Pan 1 , Yuhong Zhu 1, Jiahai Yuan 2, Lixia Ding 3 and Jungang Yu 4
1 School of Physics and Electrical Engineering, Ningxia University, Yinchuan 750021, China2 School of Economics and Management, North China Electric Power University, Beijing 102206, China3 Eco-tech Research Institute, State Grid Ningxia Electric Power Co., Ltd., Yinchuan 750004, China4 Ningxia Jingneng Ningdong Electric Power Co., Ltd., Yinchuan 750409, China* Correspondence: [email protected]
Received: 4 July 2019; Accepted: 13 August 2019; Published: 16 August 2019�����������������
Abstract: At present time, China’s power systems face significant challenges in integrating large-scalerenewable energy and reducing the curtailed renewable energy. In order to avoid the curtailment ofrenewable energy, the power systems need significant flexibility requirements in China. In regionswhere coal is still heavily relied upon for generating electricity, the flexible operations of coal powerunits will be the most feasible option to face these challenges. The study first focused on the reasonswhy the flexible operation of existing coal power units would potentially promote the integrationof renewable energy in China and then reviewed the impacts on the performance levels of theunits. A simple flexibility operation model was constructed to estimate the integration potentialwith the existing coal power units under several different scenarios. This study’s simulation resultsrevealed that the existing retrofitted coal power units could provide flexibility in the promotion of theintegration of renewable energy in a certain extent. However, the integration potential incrementof 20% of the rated power for the coal power units was found to be lower than that of 30% of therated power. Therefore, by considering the performance impacts of the coal power units with lowperformances in load operations, it was considered to not be economical for those units to operate atlower than 30% of the rated power. It was believed that once the capacity share of the renewableenergy had achieved a continuously growing trend, the existing coal power units would fail to meetthe flexibility requirements. Therefore, it was recommended in this study that other flexible resourcesshould be deployed in the power systems for the purpose of reducing the curtailment of renewableenergy. Furthermore, based on this study’s obtained evidence, in order to realize a power systemwith high proportions of renewable energy, China should strive to establish a power system withadequate flexible resources in the future.
Keywords: coal power; flexible operation; renewable energy; integration potential; China
1. Introduction
The integration of renewable energy in China’s power system is in urgent demand in order topromote a sustainable energy transition [1]. During the last decade, technologies related to renewableenergy have experienced exploding increases. By the end of 2018, China enjoyed the largest scale windpower energy resources in the world, with an installed capacity of 184 GW [2]. However, China stillfaces enormous challenges in regard to integrating large-scale renewable energy into the current powersystem while reducing curtailed renewable energy [3]. In order to avoid curtailment and promotethe integration of renewable energy processes, the flexibility requirement of China’s power systemswill be required to reach higher levels [4]. Therefore, various flexible resources have been proposedin order to achieve these flexibility requirement goals. These include interregional transmissions [4],
Sustainability 2019, 11, 4424; doi:10.3390/su11164424 www.mdpi.com/journal/sustainability
Sustainability 2019, 11, 4424 2 of 17
energy storage technology [5–7], and demand responses [8–10]. Meanwhile the availability of theaforementioned resources is currently not sufficient to meet the flexibility requirements of China’spower system [3]. Due to China’s existing coal power endowment, the flexible operation of the existingcoal power units is still the most feasible choice to ensure the integration of renewable energy, andwould potentially contribute to reductions in the curtailment of renewable energy, as well as ensurethe safe, stable, and reliable operation of the power grids [11].
Currently, a tremendous amount of research is being focused on the evaluation indexes andmodels of power system flexibility [12–19]. However, not as many research studies are presentlyexploring the flexibility potential of coal power based on simulations or modeling methods. Kubiket al. highlighted that insufficient attention has been given to the potential flexibility of the existingthermal plants, and put forward certain operating strategies with three thermal units for the purposeof reducing variability impacts using a unit-by-unit approach [20]. However, it has been suggestedthat this would be an inefficient approach for larger energy systems, and closer attention should bepaid to the units’ characteristics and non-synchronous generation limits. In the studies conducted byStefanía et al., it was also indicated that coal-fired power generators could potentially supply flexibilityand contribute to lower system costs in three regional electricity generation systems using a linearcost-minimizing investment model [21]. However, it was found that both of the aforementioned studieshad not calculated the potential flexibility of thermal power. In another related study, Luo et al. haspredicted the minimum technical output of thermal power under different levels of accommodatingwind power in typical days of 2020 in North Hebei (China), and stated that the minimum technicaloutput of condensing units must be lower than the international advanced level of 25%, in order toachieve the objective of a 10% curtailment rate of renewable energy [11]. However, the performanceimpacts of coal power units during flexible operations [22] and the operation economy were notconsidered in the aforementioned study. Also, in the operational model, it was found that both thejoint operations with energy storage technology and the flexible operations with different ramp rateshad not been taken into consideration.
In the present study, the performance impacts and the operation economy were first reviewed.Then the flexible operation models of the peak shaving and ramp rates were established. Following this,the promotion effects of the renewable energy’s integration based on a Mixed-Integer Programmingmodel was proposed, in which the production processes with the existing coal power units flexibleoperations were simulated during the course of a one-day period. The main contributions of this studywere from three aspects. The first was the systematic explanation of the reasons for continuing todepend on the existing coal power units in order to promote the integration of intermittent renewableenergy in China. The second aspect involved a review of the negative impacts of flexible operation oncoal power units. The third was the construction of a flexible operation model, and the calculation ofthe integration potential using sequential production simulations. Then, the boundary conditions ofthe renewable capacity could be deduced using the constant coal power capacity and different peakshaving depths of the coal power units.
The research study is organized as follows: Section 2 reviews the reasons for the use of the flexibleoperations of coal power units to promote the integration of renewable energy in China. Section 3describes the impacts on the flexible operations of the coal power units on their future performances.Section 4 introduces this study’s constructed simulation model and various case scenarios. Also,this study’s calculations of the potential of the promoted renewable energy provided by the flexibleoperations of the coal power in different scenarios are detailed. Finally, Section 5 summarizes theconclusions reached in this study.
Sustainability 2019, 11, 4424 3 of 17
2. Reasons for the Flexible Operation of China’s Existing Coal Power Units in the Promotion ofthe Integration of Renewable Energy
2.1. Coal Power Remains the Main Generation Power
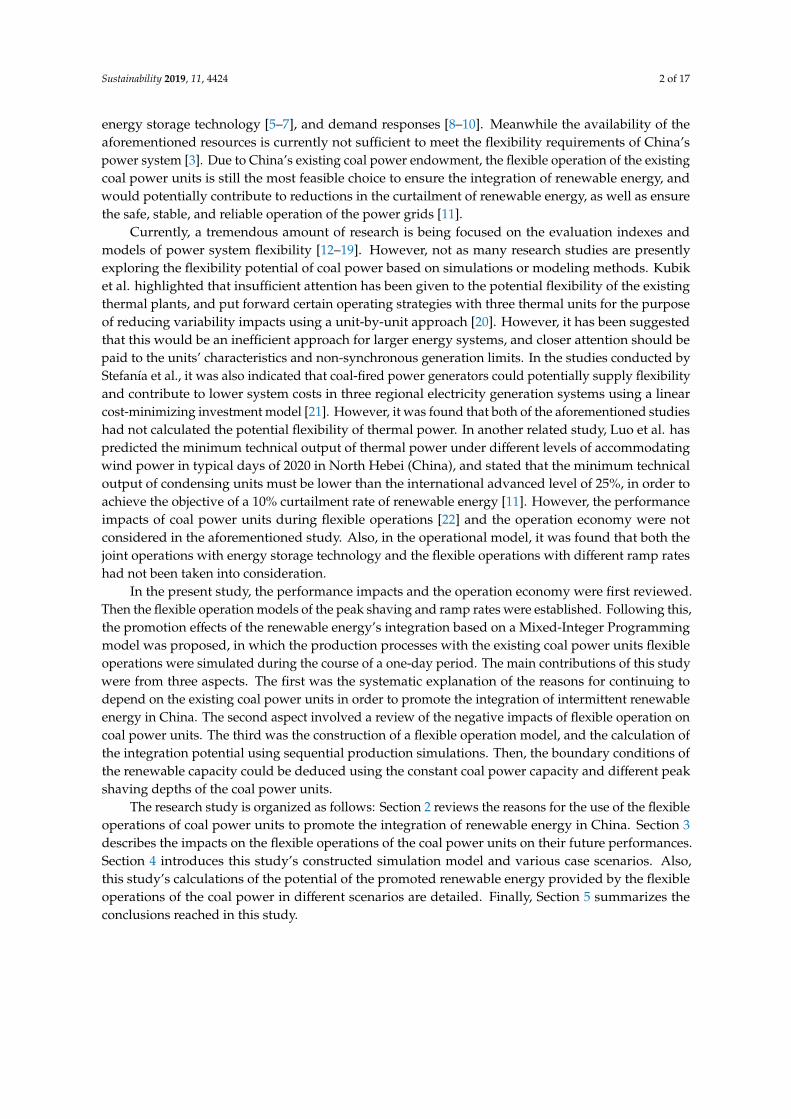
Although the installed capacity share of coal power has dropped year by year, it still remainsthe main generation power source in China. As shown in Figure 1, by the end of 2018, the share ofcoal power (53%) had surpassed more than half of the total installed capacity, while its current feed-intariff was lower than that of the other types of power generation [23]. Meanwhile, it can be seen inthe figure that its development trend had changed from ensuring a power supply to both ensuing apower supply and providing the ancillary services for renewable energy [1]. However, due to theplague of overcapacity in coal power [24,25], its capacity in China will not exceed 110 GW by 2020 [26].Therefore, under the double pressures of environmental pollution and climate change, the powersystems must rely on the flexible operation of the existing coal power units in order rapidly respond tothe residual load changes, with the purpose of promoting renewable energy integration.
Sustainability 2019, 11, x FOR PEER REVIEW 3 of 17
2. Reasons for the Flexible Operation of China’s Existing Coal Power Units in the Promotion of the Integration of Renewable Energy
2.1. Coal Power Remains the Main Generation Power
Although the installed capacity share of coal power has dropped year by year, it still remains the main generation power source in China. As shown in Figure 1, by the end of 2018, the share of coal power (53%) had surpassed more than half of the total installed capacity, while its current feed-in tariff was lower than that of the other types of power generation [23]. Meanwhile, it can be seen in the figure that its development trend had changed from ensuring a power supply to both ensuing a power supply and providing the ancillary services for renewable energy [1]. However, due to the plague of overcapacity in coal power [24,25], its capacity in China will not exceed 110 GW by 2020 [26]. Therefore, under the double pressures of environmental pollution and climate change, the power systems must rely on the flexible operation of the existing coal power units in order rapidly respond to the residual load changes, with the purpose of promoting renewable energy integration.
Figure 1. Installed capacity and share of coal power from 2011 to 2018 [27–29].
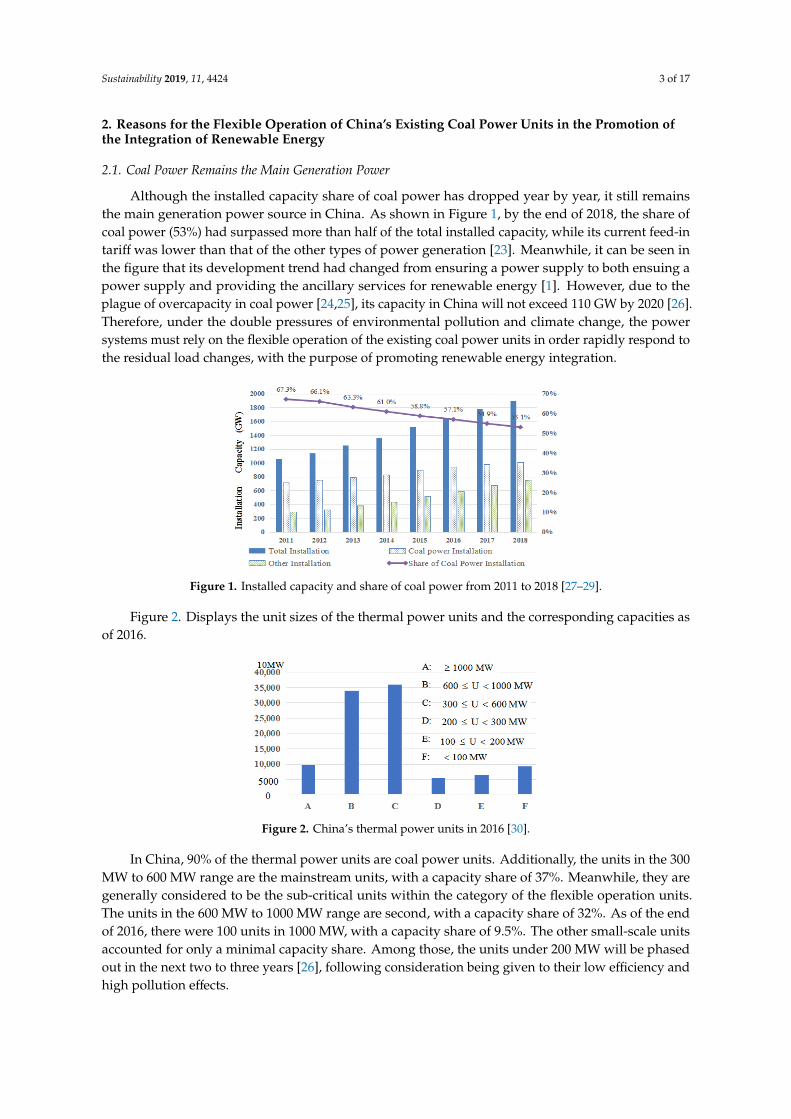
Figure 2. Displays the unit sizes of the thermal power units and the corresponding capacities as of 2016.
Figure 2. China’s thermal power units in 2016 [30].
In China, 90% of the thermal power units are coal power units. Additionally, the units in the 300 MW to 600 MW range are the mainstream units, with a capacity share of 37%. Meanwhile, they are generally considered to be the sub-critical units within the category of the flexible operation units. The units in the 600 MW to 1000 MW range are second, with a capacity share of 32%. As of the end of 2016, there were 100 units in 1000 MW, with a capacity share of 9.5%. The other small-scale units accounted for only a minimal capacity share. Among those, the units under 200 MW will be phased
Figure 1. Installed capacity and share of coal power from 2011 to 2018 [27–29].
Figure 2. Displays the unit sizes of the thermal power units and the corresponding capacities asof 2016.
Sustainability 2019, 11, x FOR PEER REVIEW 3 of 17
2. Reasons for the Flexible Operation of China’s Existing Coal Power Units in the Promotion of the Integration of Renewable Energy
2.1. Coal Power Remains the Main Generation Power
Although the installed capacity share of coal power has dropped year by year, it still remains the main generation power source in China. As shown in Figure 1, by the end of 2018, the share of coal power (53%) had surpassed more than half of the total installed capacity, while its current feed-in tariff was lower than that of the other types of power generation [23]. Meanwhile, it can be seen in the figure that its development trend had changed from ensuring a power supply to both ensuing a power supply and providing the ancillary services for renewable energy [1]. However, due to the plague of overcapacity in coal power [24,25], its capacity in China will not exceed 110 GW by 2020 [26]. Therefore, under the double pressures of environmental pollution and climate change, the power systems must rely on the flexible operation of the existing coal power units in order rapidly respond to the residual load changes, with the purpose of promoting renewable energy integration.
Figure 1. Installed capacity and share of coal power from 2011 to 2018 [27–29].
Figure 2. Displays the unit sizes of the thermal power units and the corresponding capacities as of 2016.
Figure 2. China’s thermal power units in 2016 [30].
In China, 90% of the thermal power units are coal power units. Additionally, the units in the 300 MW to 600 MW range are the mainstream units, with a capacity share of 37%. Meanwhile, they are generally considered to be the sub-critical units within the category of the flexible operation units. The units in the 600 MW to 1000 MW range are second, with a capacity share of 32%. As of the end of 2016, there were 100 units in 1000 MW, with a capacity share of 9.5%. The other small-scale units accounted for only a minimal capacity share. Among those, the units under 200 MW will be phased
Figure 2. China’s thermal power units in 2016 [30].
In China, 90% of the thermal power units are coal power units. Additionally, the units in the 300MW to 600 MW range are the mainstream units, with a capacity share of 37%. Meanwhile, they aregenerally considered to be the sub-critical units within the category of the flexible operation units.The units in the 600 MW to 1000 MW range are second, with a capacity share of 32%. As of the endof 2016, there were 100 units in 1000 MW, with a capacity share of 9.5%. The other small-scale unitsaccounted for only a minimal capacity share. Among those, the units under 200 MW will be phasedout in the next two to three years [26], following consideration being given to their low efficiency andhigh pollution effects.

Sustainability 2019, 11, 4424 4 of 17
2.2. High Costs and Severe Capacity Shortages in Natural Gas Power
Although the minimum steady output of a gas power unit is in the range of 0% to 30%, the ramprate ranges between 7% and 30% of the rated power every minute, and the start-up time is usuallywithin 10 min to one hour [31]. All these operational parameters are much better than those of thegenerally flexible coal power units [31], which means that gas power units are essentially more flexiblethan coal power units. However, in regard to the resource endowments, the available reserve resourcesof coal remains rich, while that of natural gas is currently poor, which has contributed to the higherprices of natural gas in China. Take Zhejiang Province as an example, the fit in the tariff of natural gaspower is 96.345 $/MWh [32], which is more expensive than that of coal power (60.672 $/MWh) [23].
In addition, the capacity share of the gas power units in China was only 4.4% at the end of 2018(Figure 3), whereas the total capacity shares of wind power and solar power had significantly increasedto 19% during that year [29]. Additionally, from the viewpoint of installation size, it is clear that theexisting gas power units in China are insufficient to supply the needed operational flexibility and alsobear the heavy burden of promoting the integration of renewable energy. Miguel et al. also revealedthat at their minimum load rates, gas power plants are less flexible and produced more NOx andCO emissions than coal power plants [33]. Therefore, when considering the operation economy, gaspower is usually considered to be a base load and unfit for low load operations with the purposes ofpromoting renewable energy integration.
Sustainability 2019, 11, x FOR PEER REVIEW 4 of 17
out in the next two to three years [26], following consideration being given to their low efficiency and high pollution effects.
2.2. High Costs and Severe Capacity Shortages in Natural Gas Power
Although the minimum steady output of a gas power unit is in the range of 0% to 30%, the ramp rate ranges between 7% and 30% of the rated power every minute, and the start-up time is usually within 10 min to one hour [31]. All these operational parameters are much better than those of the generally flexible coal power units [31], which means that gas power units are essentially more flexible than coal power units. However, in regard to the resource endowments, the available reserve resources of coal remains rich, while that of natural gas is currently poor, which has contributed to the higher prices of natural gas in China. Take Zhejiang Province as an example, the fit in the tariff of natural gas power is 96.345 $/MWh [32], which is more expensive than that of coal power (60.672 $/MWh) [23].
In addition, the capacity share of the gas power units in China was only 4.4% at the end of 2018 (Figure 3), whereas the total capacity shares of wind power and solar power had significantly increased to 19% during that year [29]. Additionally, from the viewpoint of installation size, it is clear that the existing gas power units in China are insufficient to supply the needed operational flexibility and also bear the heavy burden of promoting the integration of renewable energy. Miguel et al. also revealed that at their minimum load rates, gas power plants are less flexible and produced more NOx and CO emissions than coal power plants [33]. Therefore, when considering the operation economy, gas power is usually considered to be a base load and unfit for low load operations with the purposes of promoting renewable energy integration.
2.3. Capacity Shortages in Pump-Storage Power (PSP) Plants
PSP plants is a type of special power supplier with two main features. On the one hand, they are both a power supplier and a power user, with the ability to store energy in the load valleys, while outputting power in peak loads. On the other hand, they are considered to be the most effective accident cold standby units, with an outstanding short operation times of between 120 s and 150 s from a standby state to a rated power state [31]. Moreover, the PSP plants can operate flexibly and reliably to quickly respond to the load changes [34,35], which is superior to any other thermal power units [34]. Additionally, the PSP plants’ abilities in peak shaving are two times their capacities [36], which is much higher than all of the conventional units [31]. Although the PSP plants have the lowest levelized cost of energy [37] and the acceptance of renewable random fluctuations to a certain extent [38–41], the cumulative installed capacities have been less than 2% of the total generation capacity in recent years (Figure 3), which is far less than the capacity size of renewable energy [27–29] in China.
Figure 3. Installed capacities and shares of Pump-Storage Power (PSP) and gas power plants [27–29]. Figure 3. Installed capacities and shares of Pump-Storage Power (PSP) and gas power plants [27–29].
2.3. Capacity Shortages in Pump-Storage Power (PSP) Plants
PSP plants is a type of special power supplier with two main features. On the one hand, they areboth a power supplier and a power user, with the ability to store energy in the load valleys, whileoutputting power in peak loads. On the other hand, they are considered to be the most effectiveaccident cold standby units, with an outstanding short operation times of between 120 s and 150 s froma standby state to a rated power state [31]. Moreover, the PSP plants can operate flexibly and reliablyto quickly respond to the load changes [34,35], which is superior to any other thermal power units [34].Additionally, the PSP plants’ abilities in peak shaving are two times their capacities [36], which is muchhigher than all of the conventional units [31]. Although the PSP plants have the lowest levelized costof energy [37] and the acceptance of renewable random fluctuations to a certain extent [38–41], thecumulative installed capacities have been less than 2% of the total generation capacity in recent years(Figure 3), which is far less than the capacity size of renewable energy [27–29] in China.
It has been found that, due to the influences of the geographical environments, it is not suitablefor the PSP plants to be constructed in water resource constraint regions [22]. Therefore, the installedcapacity had increased from 2.33 GW in 2012 to 2.99 GW in 2018, and the capacity share of the PSPplant had still remained lower than 2%. As a result, the existing PSP plants can no longer accommodatethe heavy burden of promoting the integration of renewable energy under the conditions of the current
Sustainability 2019, 11, 4424 5 of 17
installed capacity and geographical restrictions. Therefore, it will be necessary for coal power units toundertake more long-term peak shaving tasks [22].
2.4. Small Capacities and High Commercial Costs of Energy Storage Devices
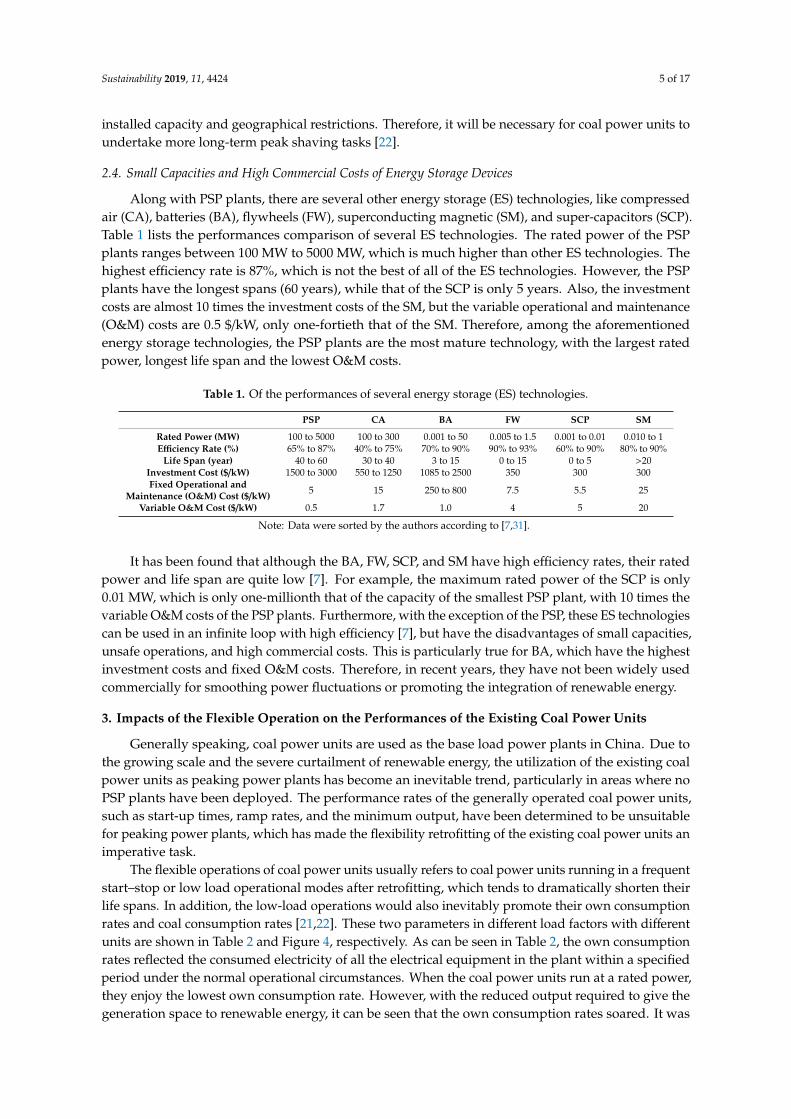
Along with PSP plants, there are several other energy storage (ES) technologies, like compressedair (CA), batteries (BA), flywheels (FW), superconducting magnetic (SM), and super-capacitors (SCP).Table 1 lists the performances comparison of several ES technologies. The rated power of the PSPplants ranges between 100 MW to 5000 MW, which is much higher than other ES technologies. Thehighest efficiency rate is 87%, which is not the best of all of the ES technologies. However, the PSPplants have the longest spans (60 years), while that of the SCP is only 5 years. Also, the investmentcosts are almost 10 times the investment costs of the SM, but the variable operational and maintenance(O&M) costs are 0.5 $/kW, only one-fortieth that of the SM. Therefore, among the aforementionedenergy storage technologies, the PSP plants are the most mature technology, with the largest ratedpower, longest life span and the lowest O&M costs.
Table 1. Of the performances of several energy storage (ES) technologies.
PSP CA BA FW SCP SM
Rated Power (MW) 100 to 5000 100 to 300 0.001 to 50 0.005 to 1.5 0.001 to 0.01 0.010 to 1Efficiency Rate (%) 65% to 87% 40% to 75% 70% to 90% 90% to 93% 60% to 90% 80% to 90%
Life Span (year) 40 to 60 30 to 40 3 to 15 0 to 15 0 to 5 >20Investment Cost ($/kW) 1500 to 3000 550 to 1250 1085 to 2500 350 300 300Fixed Operational and
Maintenance (O&M) Cost ($/kW) 5 15 250 to 800 7.5 5.5 25
Variable O&M Cost ($/kW) 0.5 1.7 1.0 4 5 20
Note: Data were sorted by the authors according to [7,31].
It has been found that although the BA, FW, SCP, and SM have high efficiency rates, their ratedpower and life span are quite low [7]. For example, the maximum rated power of the SCP is only0.01 MW, which is only one-millionth that of the capacity of the smallest PSP plant, with 10 times thevariable O&M costs of the PSP plants. Furthermore, with the exception of the PSP, these ES technologiescan be used in an infinite loop with high efficiency [7], but have the disadvantages of small capacities,unsafe operations, and high commercial costs. This is particularly true for BA, which have the highestinvestment costs and fixed O&M costs. Therefore, in recent years, they have not been widely usedcommercially for smoothing power fluctuations or promoting the integration of renewable energy.
3. Impacts of the Flexible Operation on the Performances of the Existing Coal Power Units
Generally speaking, coal power units are used as the base load power plants in China. Due tothe growing scale and the severe curtailment of renewable energy, the utilization of the existing coalpower units as peaking power plants has become an inevitable trend, particularly in areas where noPSP plants have been deployed. The performance rates of the generally operated coal power units,such as start-up times, ramp rates, and the minimum output, have been determined to be unsuitablefor peaking power plants, which has made the flexibility retrofitting of the existing coal power units animperative task.
The flexible operations of coal power units usually refers to coal power units running in a frequentstart–stop or low load operational modes after retrofitting, which tends to dramatically shorten theirlife spans. In addition, the low-load operations would also inevitably promote their own consumptionrates and coal consumption rates [21,22]. These two parameters in different load factors with differentunits are shown in Table 2 and Figure 4, respectively. As can be seen in Table 2, the own consumptionrates reflected the consumed electricity of all the electrical equipment in the plant within a specifiedperiod under the normal operational circumstances. When the coal power units run at a rated power,they enjoy the lowest own consumption rate. However, with the reduced output required to give thegeneration space to renewable energy, it can be seen that the own consumption rates soared. It was

Sustainability 2019, 11, 4424 6 of 17
observed that the greater the reduced output was, the higher the increment would be. In particular,as the ultra super-critical (USC) units ran at lower than 50% of rated power, their own consumptionrate and coal consumption had clearly soared, with increases of approximately 1.2 percentages and60 g/kWh in 30% rated power, respectively. As a result of these conditions, the high efficiency andenergy saving have been lowered. Also, when compared with the USC units, the impacts of the lowload operations on the performance of the super-critical (SC) units and sub-critical (SBC) units werefound to be much smaller. Therefore, USC units are usually not considered as the flexibility retrofittingunits, but rather as the base load power plants with full-power operations.
Table 2. Own consumption rates in different load ratios. USC: ultra super-critical; SC: super-critical;SBC: sub-critical.
Capacity Features Own Consumption Rates Increment
Load ratios 100% 50% 40% 30% 100% to 50% 100% to 40% 100% to 30%
1000 MW A USC + water cooled 4.16 4.93 5.14 5.33 0.77 0.98 1.17
660 MW
B USC + water cooled 4.26 4.84 5.02 5.21 0.58 0.76 0.95
C SC + water cooled 4.65 5.19 5.39 5.57 0.54 0.74 0.92
D SC + air cooled 4.83 5.40 5.57 5.73 0.57 0.74 0.90
600 MWE SBC + water cooled 4.79 5.30 5.47 5.66 0.51 0.68 0.87
F SBC + air cooled 5.20 5.82 6.01 6.22 0.62 0.81 1.02
300 MWG SBC + water cooled 4.67 5.24 5.43 5.61 0.57 0.76 0.94
H SBC + air cooled 5.56 6.17 6.36 6.57 0.61 0.80 1.01
Source: The predicted economic index obtained from the Eco-tech Research Institute of State Grid Ningxia ElectricPower Co., Ltd. according to the units of the entire power sector.
Sustainability 2019, 11, x FOR PEER REVIEW 6 of 17
own consumption rates and coal consumption rates [21,22]. These two parameters in different load factors with different units are shown in Table 2 and Figure 4, respectively. As can be seen in Table 2, the own consumption rates reflected the consumed electricity of all the electrical equipment in the plant within a specified period under the normal operational circumstances. When the coal power units run at a rated power, they enjoy the lowest own consumption rate. However, with the reduced output required to give the generation space to renewable energy, it can be seen that the own consumption rates soared. It was observed that the greater the reduced output was, the higher the increment would be. In particular, as the ultra super-critical (USC) units ran at lower than 50% of rated power, their own consumption rate and coal consumption had clearly soared, with increases of approximately 1.2 percentages and 60 g/kWh in 30% rated power, respectively. As a result of these conditions, the high efficiency and energy saving have been lowered. Also, when compared with the USC units, the impacts of the low load operations on the performance of the super-critical (SC) units and sub-critical (SBC) units were found to be much smaller. Therefore, USC units are usually not considered as the flexibility retrofitting units, but rather as the base load power plants with full-power operations.
Table 2. Own consumption rates in different load ratios. USC: ultra super-critical; SC: super-critical; SBC: sub-critical.
Capacity Features Own Consumption Rates Increment
Load ratios 100% 50% 40% 30% 100% to 50% 100% to 40% 100% to 30%
1000 MW A USC + water cooled 4.16 4.93 5.14 5.33 0.77 0.98 1.17
660 MW
B USC + water cooled 4.26 4.84 5.02 5.21 0.58 0.76 0.95
C SC + water cooled 4.65 5.19 5.39 5.57 0.54 0.74 0.92
D SC + air cooled 4.83 5.40 5.57 5.73 0.57 0.74 0.90
600 MW E SBC + water cooled 4.79 5.30 5.47 5.66 0.51 0.68 0.87
F SBC + air cooled 5.20 5.82 6.01 6.22 0.62 0.81 1.02
300 MW G SBC + water cooled 4.67 5.24 5.43 5.61 0.57 0.76 0.94
H SBC + air cooled 5.56 6.17 6.36 6.57 0.61 0.80 1.01
Source: The predicted economic index obtained from the Eco-tech Research Institute of State Grid Ningxia Electric Power Co., Ltd. according to the units of the entire power sector.
Figure 4. Power supply coal consumption rates with different units in different load factors. Source: The predicted economic index obtained from the Eco-tech Research Institute of State Grid Ningxia Electric Power Co., Ltd. according to the units of the entire power sector.
It has been found that low load operations also have impacts on flue gas denitration systems in coal power plants. Since the systems use the Selective Catalytic Reduction (SCR) technology, the
Figure 4. Power supply coal consumption rates with different units in different load factors. Source:The predicted economic index obtained from the Eco-tech Research Institute of State Grid NingxiaElectric Power Co., Ltd. according to the units of the entire power sector.
It has been found that low load operations also have impacts on flue gas denitration systems in coalpower plants. Since the systems use the Selective Catalytic Reduction (SCR) technology, the reactiontemperatures commonly range between 320 to 400 ◦C. However, the flue gas outlet temperatures willbe below the reaction temperatures due to the low load operations of the units, which will lower thesafety degree of the system, and increase the air pollution emissions. For instance, the 660 MW·SCair-cooled units of the Jinneng Ningxia Plant are currently at the low-load running state of 30% of therated power with a flue gas outlet temperature of 295 ◦C. Meanwhile the inlet flue gas temperaturewill reach that of the reaction temperature after the flexibility retrofitting.
However, it has been found that the amounts of generated NOx are higher in low load operations.Therefore, in order to improve this situation, the plant operators have reduced the amount of oxygenin the furnace chambers to a certain level. Unfortunately, if excessive adjustments occur, the furnace
Sustainability 2019, 11, 4424 7 of 17
chambers may experience unstable combustion situations, which would in turn to lower the efficiencyof the SCR reactor operations.
Moreover, the released NH3 from the SCR reactors will react with SO3 and H2O in the flue gasesto produce NH4HSO4 at a certain temperature. This strong cohesiveness product will adhere to thesurfaces of the air preheaters and lead to the accumulation of fly-ash particles. Then, after long periodsof time, these accumulated ash particles will increase the air-cooling fans’ power consumption, whichwould endanger the safe operations of the units, and even shorten the life spans of the units.
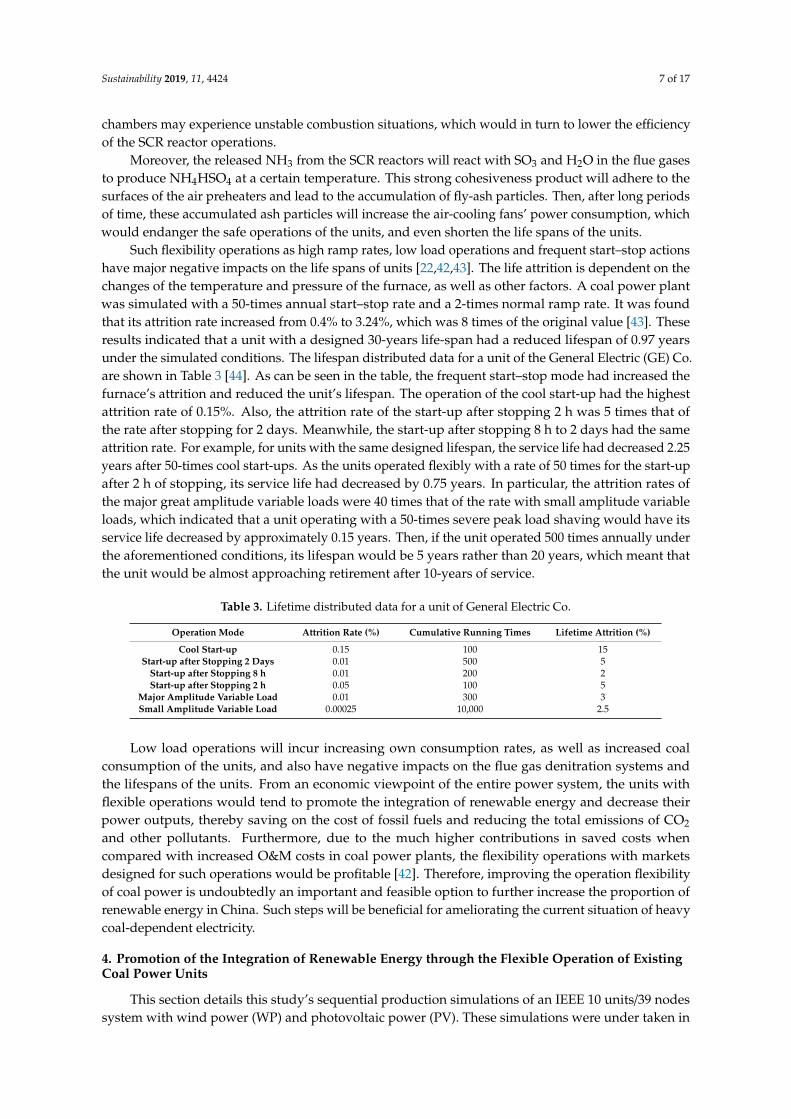
Such flexibility operations as high ramp rates, low load operations and frequent start–stop actionshave major negative impacts on the life spans of units [22,42,43]. The life attrition is dependent on thechanges of the temperature and pressure of the furnace, as well as other factors. A coal power plantwas simulated with a 50-times annual start–stop rate and a 2-times normal ramp rate. It was foundthat its attrition rate increased from 0.4% to 3.24%, which was 8 times of the original value [43]. Theseresults indicated that a unit with a designed 30-years life-span had a reduced lifespan of 0.97 yearsunder the simulated conditions. The lifespan distributed data for a unit of the General Electric (GE) Co.are shown in Table 3 [44]. As can be seen in the table, the frequent start–stop mode had increased thefurnace’s attrition and reduced the unit’s lifespan. The operation of the cool start-up had the highestattrition rate of 0.15%. Also, the attrition rate of the start-up after stopping 2 h was 5 times that ofthe rate after stopping for 2 days. Meanwhile, the start-up after stopping 8 h to 2 days had the sameattrition rate. For example, for units with the same designed lifespan, the service life had decreased 2.25years after 50-times cool start-ups. As the units operated flexibly with a rate of 50 times for the start-upafter 2 h of stopping, its service life had decreased by 0.75 years. In particular, the attrition rates ofthe major great amplitude variable loads were 40 times that of the rate with small amplitude variableloads, which indicated that a unit operating with a 50-times severe peak load shaving would have itsservice life decreased by approximately 0.15 years. Then, if the unit operated 500 times annually underthe aforementioned conditions, its lifespan would be 5 years rather than 20 years, which meant thatthe unit would be almost approaching retirement after 10-years of service.
Table 3. Lifetime distributed data for a unit of General Electric Co.
Operation Mode Attrition Rate (%) Cumulative Running Times Lifetime Attrition (%)
Cool Start-up 0.15 100 15Start-up after Stopping 2 Days 0.01 500 5
Start-up after Stopping 8 h 0.01 200 2Start-up after Stopping 2 h 0.05 100 5
Major Amplitude Variable Load 0.01 300 3Small Amplitude Variable Load 0.00025 10,000 2.5
Low load operations will incur increasing own consumption rates, as well as increased coalconsumption of the units, and also have negative impacts on the flue gas denitration systems andthe lifespans of the units. From an economic viewpoint of the entire power system, the units withflexible operations would tend to promote the integration of renewable energy and decrease theirpower outputs, thereby saving on the cost of fossil fuels and reducing the total emissions of CO2
and other pollutants. Furthermore, due to the much higher contributions in saved costs whencompared with increased O&M costs in coal power plants, the flexibility operations with marketsdesigned for such operations would be profitable [42]. Therefore, improving the operation flexibilityof coal power is undoubtedly an important and feasible option to further increase the proportion ofrenewable energy in China. Such steps will be beneficial for ameliorating the current situation of heavycoal-dependent electricity.
4. Promotion of the Integration of Renewable Energy through the Flexible Operation of ExistingCoal Power Units
This section details this study’s sequential production simulations of an IEEE 10 units/39 nodessystem with wind power (WP) and photovoltaic power (PV). These simulations were under taken in
Sustainability 2019, 11, 4424 8 of 17
order to investigate the promotion of renewable energy with the flexible operation of coal power unitsby employing mixed integer programming (MIP) method.
MIP is a common method of modeling production and business activities related to specializedissues, such how to utilize resource effectively. Generally speaking, the models are used simulatethe operations of power systems in competitive electricity markets [45]. During the simulationprocesses certain constraints are adopted and there are several commitments by which the unitsoperate. The output of those operating units is determined with a certain object function. However,despite the known advantages of the MIP method, it requires the solving of an NP (non-deterministicpolynomial)-hard problem [46]. Once a power system composed of several thousands of power plantsis modeled, it would take an enormous computational time to model the detailed behaviors of theindividual plants, including many constraint conditions. Therefore, in order to reduce the complexityproblem, an IEEE 10 units/39 nodes system was adopted in different scenarios in this research study.
The purpose of the aforementioned simulations was to solve two issues. The first investigatedissue was the scale of renewable energy which could potentially be consumed with the flexibleoperation of existing coal power units. The second issue was the determination of how much of theincrement scale of the renewable energy could be potentially consumed with the peak shaving depthschanging from 38% to 20% of the rated power. In the present study, the maximum consumption levelsof WP and PV were considered as the object functions using Formula (1) as follows:
F = maxT∑
t=1
(Ptw + Pt
v) (1)
where Ptw, Pt
v represent the integrated WP and PV in the moment of t, respectively. Then following theflexibility retrofitting, with the units running with higher peak shaving depths, the output constraintswill be changed into flexible constraints as indicated in Formula (2).
Ctj(P
minj − ∆P) ≤ Pt
j ≤ CtjP
maxj (2)
where j is the unit number; Ptj indicates the output at the moment of t for unit j; Pmin
j , Pmaxj are the
lower and upper output boundaries, respectively; and Ctj represents a binary variable which indicates
whether the unit j is running at moment t.As shown in Formula (3), the ramp rate constraints are usually used in dealing with dispatching
units schedules for thermal power systems [47], and can be applied to improve the reliability of unitcommitments. This is particularly important for the combined optimization of thermal power andPSP with intermittent energy, in order to improve operational security and promote the utilization ofintermittent energy [39]: Pt+1
j − Ptj ≤ Pup
j
(1 + Ct
j −Ct+1j
)+ Pmin
j (2−Ctj −Ct−1
j )
Ptj − Pt+1
j ≤ Pdownj (1−Ct
j + Ct+1j ) + Pmin
j (2−Ctj −Ct−1
j )(3)
Then, following the flexibility retrofitting, the improved ramp rates will become higher than thedesigned ramp rates. Therefore, their constraints will change into flexible constraints, as shown inFormula (4): Pt+1
j − Ptj ≤ (Pup
j + ∆Pup)(1 + Ct
j −Ct+1j
)+ Pmin
j (2−Ctj −Ct−1
j )
Ptj − Pt+1
j ≤ (Pdownj + ∆Pdown)(1−Ct
j + Ct+1j ) + Pmin
j (2−Ctj −Ct−1
j )(4)
where Pt+1j , Pt
j represent the outputs of coal power unit j in the adjacent moment, respectively; Pupj , Pdown
jrepresent the maximum upward and downward ramp rate, respectively.

Sustainability 2019, 11, 4424 9 of 17
As a result, Formula (4) can ensure that the output of all the coal power units can be adjusted toany value between the upper and lower boundaries in the next moment. In this way, the coal powerunits can balance the real-time fluctuations of renewable energy under the described conditions.
4.1. Case Data and Scenario Settings
The uncertainty characteristics of WP, PV, and power loads present major challenges to thedispatch operations in the power systems. It has been found that the traditional dispatch operationsare no longer suitable for the new dispatch demands of large-scale renewable energy integration.Therefore, highly efficient and schedulable strategies should be combined with the integration ofrenewable energy and the appropriate traditional resources will need to be determined.
At the present time, PSP plants, electric vehicles, large-scale batteries, and other ES technologies arethe most common measures used to restrain the volatility of renewable energy, and have demonstratedcertain abilities. Therefore, thermal power, WP, and PSP were combined in this study’s unit commitmentmodel. It was found that the optimization simulation results had indicated that the PSP plants werecritical to increasing the stability, reliability, and economic efficiency of power systems [38,39,48].Additionally, the PSP plants were verified to enjoy the advantages of WP integration, which helpedto improve the efficiency of the WP [34,49,50]. It had also been as a good complement to the WPfor managing the positive and negative energy imbalances over time, and as an effective solutionfor smoothing the WP fluctuations and reducing the operating costs for the wind-thermal powersystems [35,40,51,52]. It was considered that a joint operational approach of PV + WP + PSP, whichdemonstrated enormous potential for reducing the impacts of renewable energy during the operationof power systems, could be used to facilitate the integration process, as well as increase their share tocover future energy demands [53]. All of the aforementioned references demonstrated that the jointoperations of WP and PSP could greatly alleviate WP fluctuations in power grids [54,55]. Therefore, inorder to facilitate the integration of WP and PV, this study allocated WP-PSP and PV-ES joint operationsfor the purpose of inhibiting the uncertainties of renewable energy integration.
In the present research investigation, in accordance with a typical day’s power load in a northernarea of China (Figure 5), a power system’s capacity from a 2018 case study was assumed, and theintegrated capacity is shown in Table 4.
Sustainability 2019, 11, x FOR PEER REVIEW 9 of 17
Then, following the flexibility retrofitting, the improved ramp rates will become higher than the designed ramp rates. Therefore, their constraints will change into flexible constraints, as shown in Formula (4):
)2()1)(()2(1)(
1min11
1min11
tj
tjj
tj
tj
downdownj
tj
tj
tj
tjj
tj
tj
upupj
tj
tj
CCPCCPPPPCCPCCPPPP )(
(4)
where tj
tj PP ,1 represent the outputs of coal power unit j in the adjacent moment, respectively;
downj
upj PP , represent the maximum upward and downward ramp rate, respectively.
As a result, Formula (4) can ensure that the output of all the coal power units can be adjusted to any value between the upper and lower boundaries in the next moment. In this way, the coal power units can balance the real-time fluctuations of renewable energy under the described conditions.
4.1. Case Data and Scenario Settings
The uncertainty characteristics of WP, PV, and power loads present major challenges to the dispatch operations in the power systems. It has been found that the traditional dispatch operations are no longer suitable for the new dispatch demands of large-scale renewable energy integration. Therefore, highly efficient and schedulable strategies should be combined with the integration of renewable energy and the appropriate traditional resources will need to be determined.
At the present time, PSP plants, electric vehicles, large-scale batteries, and other ES technologies are the most common measures used to restrain the volatility of renewable energy, and have demonstrated certain abilities. Therefore, thermal power, WP, and PSP were combined in this study’s unit commitment model. It was found that the optimization simulation results had indicated that the PSP plants were critical to increasing the stability, reliability, and economic efficiency of power systems [38,39,48]. Additionally, the PSP plants were verified to enjoy the advantages of WP integration, which helped to improve the efficiency of the WP [34,49,50]. It had also been as a good complement to the WP for managing the positive and negative energy imbalances over time, and as an effective solution for smoothing the WP fluctuations and reducing the operating costs for the wind-thermal power systems [35,40,51,52]. It was considered that a joint operational approach of PV + WP + PSP, which demonstrated enormous potential for reducing the impacts of renewable energy during the operation of power systems, could be used to facilitate the integration process, as well as increase their share to cover future energy demands [53]. All of the aforementioned references demonstrated that the joint operations of WP and PSP could greatly alleviate WP fluctuations in power grids [54,55]. Therefore, in order to facilitate the integration of WP and PV, this study allocated WP-PSP and PV-ES joint operations for the purpose of inhibiting the uncertainties of renewable energy integration.
In the present research investigation, in accordance with a typical day’s power load in a northern area of China (Figure 5), a power system’s capacity from a 2018 case study was assumed, and the integrated capacity is shown in Table 4.
Figure 5. A typical day’s power load curve. Figure 5. A typical day’s power load curve.
Table 4. Integrated capacities of the examined case.
Total Coal Power WP PV PSP ES
The Examined Case15,365 MW 7665 MW 4000 MW 3000 MW 400 MW 300 MW
100% 49.89% 26.03% 19.52% 2.60% 1.95%Statistical Data from
2018 in China - 53% 10% 9% 1.6% -
According to China’s power industry statistical data from 2018, the shares of different powerresources in this case had conformed to the green development plan of deploying more renewable

Sustainability 2019, 11, 4424 10 of 17
energy and containing the coal power installations of China’s power industry during the coming years.The concentration of large-scale renewable energy in three northern areas of China were considered,as well as the influences of geographic conditions and water resource constraints. It was found thatthe share of PSP would not increase by a large percentage. Therefore, its share was set as 2.6% in theexamined case. It was presumed that during the next few years, the most promising electric vehicleswith large capacity batteries may be widely used in power systems in order to promote the integrationof large-scale renewable energy. Therefore, the share of ES was set as 1.95%. Additionally, the shares ofWP and PV were set as 26.03% and 19.52%, respectively, in which the output curves were set accordingto their minimum power unit output curves. As shown in Table 5, three scenarios were set in this studyaccording to the increased capacity shares of the WP and PV.
Table 5. Scenarios settings before and after retrofitting.
Shares of Wind and PV(Renewables) 21%, 15% (36%) 26%, 20% (46%) 29%, 23% (52%)
Ramp Rates No. 2 times No. 2 times No. 2 Times
Minimum Output No. to 20% rated power No. to 20% rated power No. to 20% rated power
ScenariosS01 S02 S11 S12 S21 S22
Low share BAU High share
In addition, each scenario was divided into two sub-scenarios before and after retrofitting. It wasfound that with the changed shares of the WP and PV, both the installed capacities of coal power units,and the ratio of the total installed capacity vs. the maximum load, had remained unchanged.
In the “business as usual” (BAU) scenarios, the examinations of the impacts on the integration ofrenewable energy with different peak shaving depths following the retrofitting of the coal power unitswere conducted. Generally speaking, the designed minimum output for IEEE 10 units/39 nodes isapproximately 30% of the rated power, and the coal power units usually do not run below a 40% ratedpower level due to the power system security and economic factors, and so on. Therefore, in orderto integrate increased amount renewable energy, five sub-scenarios were set to study the incrementintegration of renewable energy from 38% of the rated power to 20% of the rated power, as shown inTable 6.
Table 6. Scenarios settings after retrofitting with different peak shaving depths.
Peak ShavingDepth
38% RatedPower
35% RatedPower
32% RatedPower
30% RatedPower
20% RatedPower
Scenarios S1 S2 S3 S4 S5
4.2. Case Study
According to the objective functions and flexible constraint conditions mentioned above, thisstudy operated and analyzed the output curves of the WP and PV based on a CPLEX12.5 solver, whichhad the ability to contribute to the evaluation of the integration potentials.
4.2.1. WP and PV in the BAU Scenarios before and After Retrofitting
As shown in Figure 6, the integrated WP of scenario S12 was higher than that of scenario S11.The joint operation [41] and coal power units flexible operation efforts had successfully restrained thesharp fluctuations of the WP, resulting in 7% reduction of the curtailment rate from scenario S11 toscenario S12. These results had confirmed that the coal power units could promote WP integrationthrough flexible operation strategies.

Sustainability 2019, 11, 4424 11 of 17
Sustainability 2019, 11, x FOR PEER REVIEW 11 of 17
As shown in Figure 6, the integrated WP of scenario S12 was higher than that of scenario S11. The joint operation [41] and coal power units flexible operation efforts had successfully restrained the sharp fluctuations of the WP, resulting in 7% reduction of the curtailment rate from scenario S11 to scenario S12. These results had confirmed that the coal power units could promote WP integration through flexible operation strategies.
Figure 6. Output curves of the wind power (WP) and PSP plant ((left) S11, (right) S12.)
This study’s comparison of scenarios S12 and S11 are displayed in Figure 7. As can be seen in the figure, the power fluctuations had decreased (green line with filled dots) with the ES joint operation efforts and the flexible operations of the coal power units. Meanwhile, the integrated PV in scenario S12 had increased. Furthermore, the PV curtailment rate had decreased 9%, indicating that the flexible operations and joint operation had successfully promoted the integration of the PV [56–58].
Figure 7. Output curves of the photovoltaic power (PV) and ES (Battery) Technologies ((Left) S11; (Right) S12.)
4.2.2. Case Study of Low Share and High Share Scenarios after Retrofitting
It was determined from the flexible operations of the coal power units in the aforementioned three scenarios that the capacity of the renewable energy was the only increased factor. Meanwhile, the capacity of coal power units and the ratio of the total installed capacity vs. the maximum load had remained constant.
Figure 6. Output curves of the wind power (WP) and PSP plant ((left) S11, (right) S12.)
This study’s comparison of scenarios S12 and S11 are displayed in Figure 7. As can be seen in thefigure, the power fluctuations had decreased (green line with filled dots) with the ES joint operationefforts and the flexible operations of the coal power units. Meanwhile, the integrated PV in scenarioS12 had increased. Furthermore, the PV curtailment rate had decreased 9%, indicating that the flexibleoperations and joint operation had successfully promoted the integration of the PV [56–58].
Sustainability 2019, 11, x FOR PEER REVIEW 11 of 17
As shown in Figure 6, the integrated WP of scenario S12 was higher than that of scenario S11. The joint operation [41] and coal power units flexible operation efforts had successfully restrained the sharp fluctuations of the WP, resulting in 7% reduction of the curtailment rate from scenario S11 to scenario S12. These results had confirmed that the coal power units could promote WP integration through flexible operation strategies.
Figure 6. Output curves of the wind power (WP) and PSP plant ((left) S11, (right) S12.)
This study’s comparison of scenarios S12 and S11 are displayed in Figure 7. As can be seen in the figure, the power fluctuations had decreased (green line with filled dots) with the ES joint operation efforts and the flexible operations of the coal power units. Meanwhile, the integrated PV in scenario S12 had increased. Furthermore, the PV curtailment rate had decreased 9%, indicating that the flexible operations and joint operation had successfully promoted the integration of the PV [56–58].
Figure 7. Output curves of the photovoltaic power (PV) and ES (Battery) Technologies ((Left) S11; (Right) S12.)
4.2.2. Case Study of Low Share and High Share Scenarios after Retrofitting
It was determined from the flexible operations of the coal power units in the aforementioned three scenarios that the capacity of the renewable energy was the only increased factor. Meanwhile, the capacity of coal power units and the ratio of the total installed capacity vs. the maximum load had remained constant.
Figure 7. Output curves of the photovoltaic power (PV) and ES (Battery) Technologies ((Left) S11;(Right) S12.)
4.2.2. Case Study of Low Share and High Share Scenarios after Retrofitting
It was determined from the flexible operations of the coal power units in the aforementionedthree scenarios that the capacity of the renewable energy was the only increased factor. Meanwhile,the capacity of coal power units and the ratio of the total installed capacity vs. the maximum load hadremained constant.
As detailed in Table 7, according to the simulation results obtained in scenarios S02 to S12, theshare of coal power had decreased 9.5%, while the WP and PV integration had noticeably increasedwith the flexible operations of the coal power units. The consumption rates of the WP and PV weredetermined to be 86% and 79%, respectively. Additionally, the integration increment ratios of theWP and PV were approximately 15% and 10%, respectively. As revealed in the results obtained fromscenarios S12 to S22, the total capacity share of the WP and PV had increased to 52%, and the capacityof coal power was the same as in scenario S22. At the same time, the consumption rates of the WP
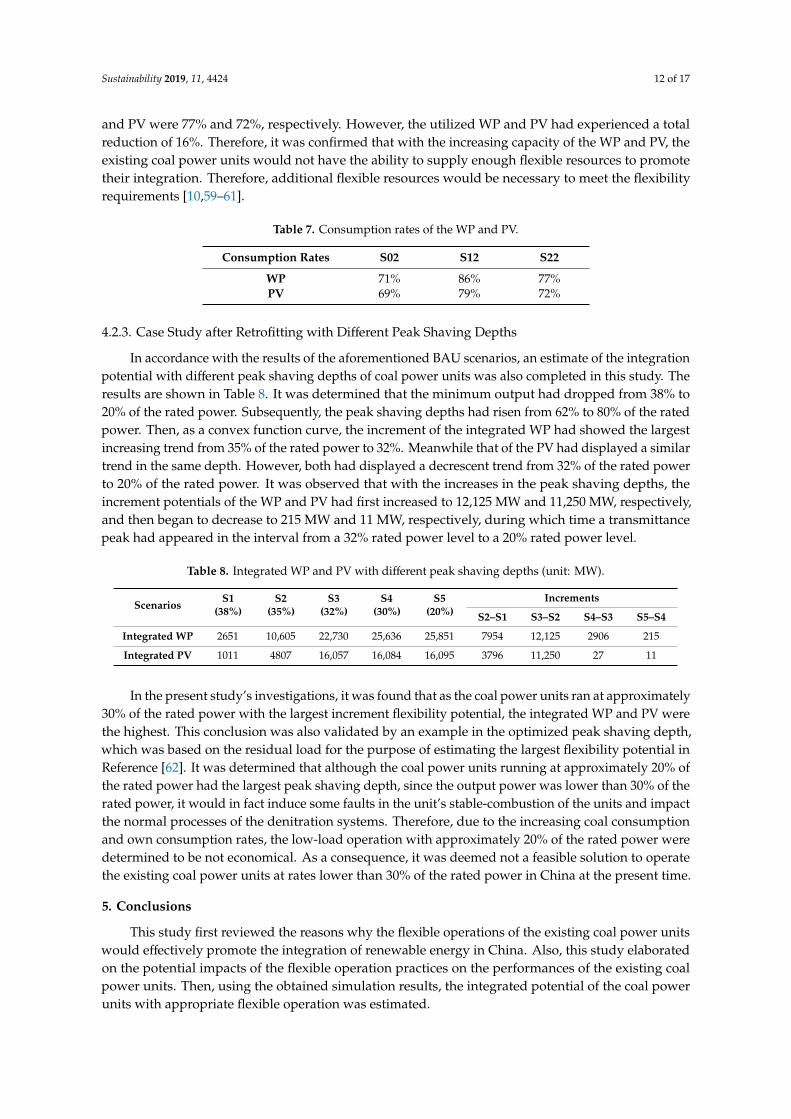
Sustainability 2019, 11, 4424 12 of 17
and PV were 77% and 72%, respectively. However, the utilized WP and PV had experienced a totalreduction of 16%. Therefore, it was confirmed that with the increasing capacity of the WP and PV, theexisting coal power units would not have the ability to supply enough flexible resources to promotetheir integration. Therefore, additional flexible resources would be necessary to meet the flexibilityrequirements [10,59–61].
Table 7. Consumption rates of the WP and PV.
Consumption Rates S02 S12 S22
WP 71% 86% 77%PV 69% 79% 72%
4.2.3. Case Study after Retrofitting with Different Peak Shaving Depths
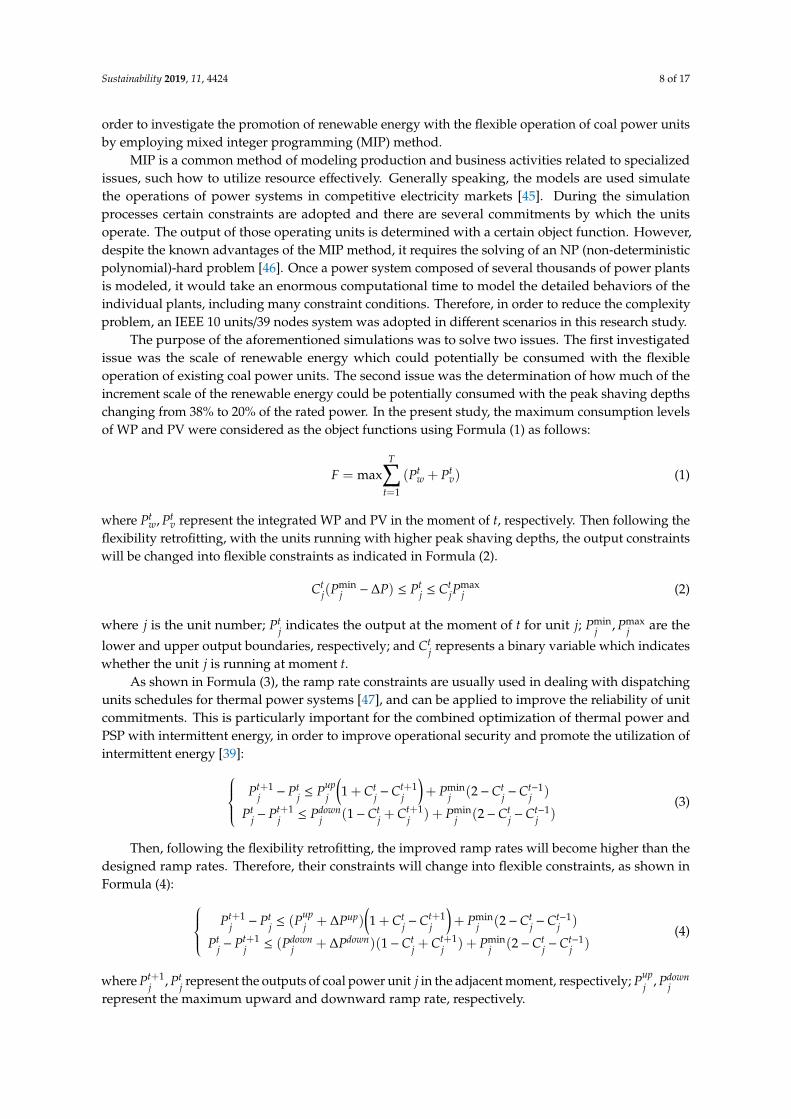
In accordance with the results of the aforementioned BAU scenarios, an estimate of the integrationpotential with different peak shaving depths of coal power units was also completed in this study. Theresults are shown in Table 8. It was determined that the minimum output had dropped from 38% to20% of the rated power. Subsequently, the peak shaving depths had risen from 62% to 80% of the ratedpower. Then, as a convex function curve, the increment of the integrated WP had showed the largestincreasing trend from 35% of the rated power to 32%. Meanwhile that of the PV had displayed a similartrend in the same depth. However, both had displayed a decrescent trend from 32% of the rated powerto 20% of the rated power. It was observed that with the increases in the peak shaving depths, theincrement potentials of the WP and PV had first increased to 12,125 MW and 11,250 MW, respectively,and then began to decrease to 215 MW and 11 MW, respectively, during which time a transmittancepeak had appeared in the interval from a 32% rated power level to a 20% rated power level.
Table 8. Integrated WP and PV with different peak shaving depths (unit: MW).
ScenariosS1
(38%)S2
(35%)S3
(32%)S4
(30%)S5
(20%)Increments
S2–S1 S3–S2 S4–S3 S5–S4
Integrated WP 2651 10,605 22,730 25,636 25,851 7954 12,125 2906 215
Integrated PV 1011 4807 16,057 16,084 16,095 3796 11,250 27 11
In the present study’s investigations, it was found that as the coal power units ran at approximately30% of the rated power with the largest increment flexibility potential, the integrated WP and PV werethe highest. This conclusion was also validated by an example in the optimized peak shaving depth,which was based on the residual load for the purpose of estimating the largest flexibility potential inReference [62]. It was determined that although the coal power units running at approximately 20% ofthe rated power had the largest peak shaving depth, since the output power was lower than 30% of therated power, it would in fact induce some faults in the unit’s stable-combustion of the units and impactthe normal processes of the denitration systems. Therefore, due to the increasing coal consumptionand own consumption rates, the low-load operation with approximately 20% of the rated power weredetermined to be not economical. As a consequence, it was deemed not a feasible solution to operatethe existing coal power units at rates lower than 30% of the rated power in China at the present time.
5. Conclusions
This study first reviewed the reasons why the flexible operations of the existing coal power unitswould effectively promote the integration of renewable energy in China. Also, this study elaboratedon the potential impacts of the flexible operation practices on the performances of the existing coalpower units. Then, using the obtained simulation results, the integrated potential of the coal powerunits with appropriate flexible operation was estimated.
Sustainability 2019, 11, 4424 13 of 17
This study’s simulation results showed that the PSP and ES technologies could potentiallyeffectively restrain the uncertainties and severe volatility of the renewable energy. However, theintegrated potential was severely impacted by their small capacity of the aforementioned technologies.Therefore, it was recommended that in order to improve the integration of renewable energy in China,the power system was required to more flexibly operate the existing coal power units. For example,it was observed in the simulations that when the total capacity of the WP and PV had progressivelyincreased to a value exceeding 52%, the existing coal power units could not adequately respond tothe volatility of renewable energy in a timely manner and under the conditions of power balanceconstraints. The increment integrated potential at 20% of the rated power for the coal power unitswas lower than that of the 30% rated power level. Luo et al. had previously found that in the forecastfor 2020, the wind curtailment rate would be 15% in northern Hebei, regardless of the economyof the peak shaving. Meanwhile, the minimum technical output of the condensing units wouldequal to 30% of the rated power, and the 20% minimum technical output had corresponded to a 5%curtailment rate of the wind power [11]. These projections had indicated it would successfully reachthe international advanced levels achieved in the majority of the European countries [63]. Therefore, itwas recommended that by relying on the flexible operation of the existing coal power units in China, a5% curtailment of renewable energy could certainly be achieved in the next few years [11].
In addition, the safe and stable operation of the power system is a priority for China’s powersector. Therefore, it will be necessary for dispatch operators to curtail the intermittent renewableenergy, once the power fluctuations exceed the system’s limit. In other words, the power fluctuationconstraints of the renewable energy sources will potentially become one of the main bottlenecks fortheir integration. According to the standards regarding the technical rules for connecting WP and PVtechnologies into the national power grid [64,65] and State Grid Corporation of China (SGCC) [66,67],the power fluctuations for connecting the WP and PV into the power grid should be limited to between10% and 33% among the different capacities and time scales. However, according to the local powergrid situations, specific values can be given by the dispatch operators which should be allowed to beexceeded [66,67]. Then, once the power fluctuation constraints of the integrated WP and PV becomeflexible for the different local power grids [68,69], the curtailment of the WP and PV can theoreticallybe reduced. These steps would provide feasible solutions for the dispatch operators in the practicalpower system situations and achieve the safe operations of certain power systems.
Author Contributions: C.N., H.P. and J.Y. (Jiahai Yuan) conceived this paper; C.N., analyzed the data and wrotethe paper; Y.Z. contributed to the revision of the paper; L.D. and J.Y. (Jungang Yu) collected the analysis data.
Funding: This paper was funded by: (1) Ningxia key research and development program under Grant No.2019BDE03007; (2) Ningxia key research and development program (Special Talents) under Grant No. 2018BEB04029;(3) National Natural Science Foundation of China under Grant No. 61763040; (4) Natural Science Foundation ofNingxia University under Grant No. ZR1706.
Acknowledgments: The authors thank the anonymous reviewers for their helpful suggestions and commentswhich improved this work.The responsibility for the contents lies with the authors.
Conflicts of Interest: The authors declare no conflict of interest. The founding sponsors had no role in the designof the study; in the collection, analyses, or interpretation of data; in the writing of the manuscript, and in thedecision to publish the results.
References
1. Yuan, J.; Na, C.; Lei, Q.; Xiong, M.; Guo, J.; Hu, Z. Coal use for power generation in China. Resour. Conserv.Recycl. 2016, 129, 443–453.
2. Wang, Q. Energy Data of 2018; Innovative Green Development of China Publisher: Beijing, China, 2018.3. Gang, X.; Yang, Y.P.; Lu, S.Y.; Li, L.; Song, X. Comprehensive evaluation of coal-fired power plants based on
grey relational analysis and analytic hierarchy process. Energy Policy 2011, 39, 2343–2351.4. Xue, S.; Wang, Y. Simulation and Analysis on Accommodating Cost for Power Generated by Trans-regional
Renewable Energy Source. Power Syst. Technol. 2015, 39, 647–654. (In Chinese)
Sustainability 2019, 11, 4424 14 of 17
5. Yang, J.; Zheng, X.; Hui, D.; Yang, S.; Luo, W.; Wang, H. Energy storage for enhancing transmission capacitiesand trans-regional reserves of a UHV AC/DC power grid. Energy Storage Sci. Technol. 2019, 8, 399–407.(In Chinese)
6. Østergaard, P.A. Wind power integration in Aalborg Municipality using compression heat pumps andgeothermal absorption heat pumps. Energy 2013, 49, 502–508. [CrossRef]
7. Mathiesen, B.V.; Lund, H. Comparative analyses of seven technologies to facilitate the integration offluctuating renewable energy sources. IET Renew. Power Gener. 2009, 3, 190–204. [CrossRef]
8. Dietrich, K.; Latorre-Canteli, J.M.; Olmos, L.; Ramos, A. Demand Response in an Isolated System with HighWind Integration. IEEE Trans. Power Syst. 2012, 27, 20–29. [CrossRef]
9. Salpakari, J.; Mikkola, J.; Lund, P.D. Improved flexibility with large-scale variable renewable power in citiesthrough optimal demand side management and power-to-heat conversion. Energy Convers. Manag. 2016,126, 649–661. [CrossRef]
10. Kies, A.; Schyska, B.U.; Von Bremen, L. The Demand Side Management Potential to Balance a HighlyRenewable European Power System. Energies 2016, 9, 955. [CrossRef]
11. Luo, G.; Zhang, X.; Liu, S.; Dan, E.; Guo, Y. Demand for flexibility improvement of thermal power units andaccommodation of wind power under the situation of high-proportion renewable integration-taking NorthHebei as an example. Environ. Sci. Pollut. Res. 2019, 26, 7033–7047. [CrossRef]
12. Ulbig, A.; Andersson, G. On operational flexibility in power systems. In Proceedings of the IEEE Power andEnergy Society General Meeting, San Diego, CA, USA, 22–26 July 2012; pp. 1–8.
13. Lannoye, E.; Flynn, D.; O’Malley, M. Power system flexibility assessment—State of the art. In Proceedings ofthe 2012 IEEE Power and Energy Society General Meeting, San Diego, CA, USA, 22–26 July 2012; pp. 1–6.
14. Lannoye, E.; Flynn, D.; O’Malley, M. Evaluation of Power System Flexibility. IEEE Trans. Power Syst. 2012,27, 922–931. [CrossRef]
15. Xiao, D.; Wang, C.; Zeng, P. A Survey on Power System Flexibility and Its Evaluations. Power Syst. Technol.2014, 6, 1569–1576. (In Chinese)
16. Capasso, A.; Falvo, M.C.; Lamedica, R.; Lauria, S.; Scalcino, S. A new methodology for power systemsflexibility evaluation. In Proceedings of the 2005 IEEE Russia Power Tech, St. Petersburg, Russia, 27–30 July2005; pp. 1–6.
17. Loisel, R. Power system flexibility with electricity storage technologies: A technical–economic assessment ofa large-scale storage facility. Int. J. Electr. Power Energy Syst. 2012, 42, 542–552. [CrossRef]
18. Li, H.; Lu, Z.; Qiao, Y. Assessment on Operational Flexibility of Power Grid with Grid-Connected Large-ScaleWind Farms. Power Syst. Technol. 2015, 6, 1672–1678. (In Chinese)
19. Xiao, D.; Wang, C.; Zeng, P. Power source flexibility evaluation considering renewable energy generationuncertainty. Electr. Power Autom. Equip. 2015, 7, 120–125. (In Chinese)
20. Kubik, M.L.; Coker, P.J.; Barlow, J.F. Increasing thermal plant flexibility in a high renewables power system.Appl. Energy 2015, 154, 102–111. [CrossRef]
21. Garearsdóttir, S.O.; Goransson, L.; Normann, F.; Johnsson, F. Improving the flexibility of coal-fired powergenerators: Impact on the composition of a cost-optimal electricity system. Appl. Energy 2018, 209, 277–289.[CrossRef]
22. Gu, Y.; Xu, J.; Chen, D.; Wang, Z.; Li, Q. Overall review of peak shaving for coal-fired power units in China.Renew. Sustain. Energy Rev. 2016, 54, 723–731. [CrossRef]
23. National Development and Reform Commission (NDRC). Notice about Reducing the Fit-in-tariff of Coal-firedPower and the General Industrial and Commercial Electricity Prices. Available online: http://www.ndrc.gov.cn/zwfwzx/zfdj/jggg/201512/t20151230_769630.html (accessed on 3 March 2019).
24. National Energy Administration. Notice on Coal Power Planning and Construction Risk Warning in 2020.Available online: http://zfxxgk.nea.gov.cn/auto84/201904/t20190419_3655.htm (accessed on 3 March 2019).
25. Greenpeace. The Fever of China Coal Power Plant. 2016. Available online: https://www.greenpeace.org.cn/
wp-content/uploads/2016/07/the-fever-of-china-coal-power-plant.pdf (accessed on 3 March 2019).26. National Development and Reform Commission (NDRC). Electric Power Development 13th Five-year Plan.
Available online: http://www.ndrc.gov.cn/fzgggz/fzgh/ghwb/gjjgh/201706/W020170605632835660561.pdf(accessed on 3 March 2019).
Sustainability 2019, 11, 4424 15 of 17
27. China Electricity Council (CEC,2014), Basic Data Statistics List of Power Industry in 2014. Availableonline: http://www.cec.org.cn/guihuayutongji/tongjxinxi/niandushuju/2015-11-30/146012.html (accessed on3 March 2019).
28. China Electricity Council (CEC,2016), Basic Data Statistics List of Power Industry in 2016. Availableonline: http://www.cec.org.cn/guihuayutongji/tongjxinxi/niandushuju/2018-03-21/178791.html (accessed on3 March 2019).
29. China Electricity Council (CEC,2018), Basic Data Statistics List of Power Industry in 2018. Availableonline: http://www.cec.org.cn/guihuayutongji/tongjxinxi/niandushuju/2019-01-22/188396.html (accessed on3 March 2019).
30. China Electricity Council (CEC). Compilation of Power Industry Statistics in 2016; China Electricity CouncilPublisher: Beijing, China, 2017.
31. China National Renewable Energy Center. China’s Renewable Energy Outlook 2016; Science Press: Beijing,China, 2017.
32. National Development and Reform Commission of Zhejiang Province. Notice on Adjustment of Feed-inTariff for Natural Gas Generating Units. Available online: http://www.zjdpc.gov.cn/art/2019/4/26/art_7_1757254.html (accessed on 3 March 2019).
33. Gonzalez-Salazar, M.A.; Kirsten, T.; Prchlik, L. Review of the operational flexibility and emissions of gas-and coal-fired power plants in a future with growing renewables. Renew. Sustain. Energy Rev. 2018, 82,1497–1513. [CrossRef]
34. Tian, Y.; Hu, W.; Hong, C.; Yuan, F.; Gao, Z. Joint optimal operation of wind farms and pumped storagepower station. In Proceedings of the 2014 IEEE PES Asia-Pacific Power and Energy Engineering Conference(APPEEC), Hong Kong, China, 7–10 December 2014. [CrossRef]
35. Garcia-Gonzalez, J.; De La Muela, R.M.R.; Santos, L.M.; Gonzalez, A.M. Stochastic Joint Optimization ofWind Generation and Pumped-Storage Units in an Electricity Market. IEEE Trans. Power Syst. 2008, 23,460–468. [CrossRef]
36. Han, L.; Zhuang, B.; Wu, Y. Power source’s output characteristics and relevance in wind-solar-hydro-thermalpower system. Power Syst. Prot. Control 2016, 44, 91–98. (In Chinese)
37. Lata-García, J.; Jurado, F.; Fernández-Ramírez, L.M.; Parra, P.; Larco, V. Techno-Economic Analysis of SeveralEnergy Storage Options for Off-Grid Renewable Energy Systems. Acta Polytech. Hung. 2019, 16, 119–141.
38. Li, D.; Liu, J.; Liu, Y.; Gao, H. Joint secure and economic dispatch considering WP, PSP and demand response.Electr. Power Autom. Equip. 2015, 35, 28–36. (In Chinese)
39. Liu, F.; Pan, Y.; Yang, J.; Zhou, J.; Zhou, J.; Zhu, Z.; Li, Q. Unit Commitment Model for Combined Optimizationof WP-Thermal Power-PSP Hydro. Proc. CSEE 2015, 35, 766–775. (In Chinese)
40. Chen, D.; Wang, X.; Zuo, J.; Guo, H.; Zhang, L. A Joint Optimal Dispatching Method for Pumped StoragePower Station and Wind Power Considering Wind Power Uncertainties. Power Syst. Clean Energy 2016, 32,110–116. (In Chinese)
41. Jurasz, J. Modeling and forecasting energy flow between national power grid and asolar–wind–pumped-hydroelectricity (PV–WT–PSH) energy source. Energy Convers. Manag. 2017, 136,382–394. [CrossRef]
42. Agora Energiewende (2017): Flexibility in Thermal Power Plants (Chinese translation)-With aFocus on Existing Coal-Fired Power Plants. Available online: https://www.agora-energiewende.de/
fileadmin2/Projekte/2017/Flexibility_in_thermal_plants/Agora_Flexibility_Report_ZH_WEB.pdf (accessedon 20 July 2109).
43. Dolins’ka, I.Y. Evaluation of the Residual Service Life of a Disk of the Rotor of Steam Turbine with Regardfor the Number of Shutdowns of the Equipment. Mater. Sci. 2018, 53, 637–644. [CrossRef]
44. Wu, R.; Hua, M.; Qin, P.; Bao, J.; Lou, K.; Ding, J.; Fan, Y. Influence of deep peak load regulation of coal-firedunits on turbine equipment. Therm. Power Gener. 2018, 47, 89–94. (In Chinese)
45. Carrión, M.; Arroyo, J.; Carrión, M. A Computationally Efficient Mixed-Integer Linear Formulation for theThermal Unit Commitment Problem. IEEE Trans. Power Syst. 2006, 21, 1371–1378. [CrossRef]
46. Huber, M.; Hamacher, T.; Ziems, C.; Weber, H. Combining LP and MIP approaches to model the impacts ofrenewable energy generation on individual thermal power plant operation. In Proceedings of the 2013 IEEEPower & Energy Society General Meeting, Vancouver, BC, Canada, 21–25 July 2013.
Sustainability 2019, 11, 4424 16 of 17
47. Wang, Y.; Xia, Q.; Kang, C. Unit Commitment with Volatile Node Injections by Using Interval Optimization.IEEE Trans. Power Syst. 2011, 26, 1705–1713. [CrossRef]
48. Wang, Y. An Adaptive Importance Sampling Method for Spinning Reserve Risk Evaluation of GeneratingSystems Incorporating Virtual Power Plants. IEEE Trans. Power Syst. 2018, 33, 5082–5091. [CrossRef]
49. Parastegari, M.; Hooshmand, R.-A.; Khodabakhshian, A.; Forghani, Z. Joint operation of wind farms andpump-storage units in the electricity markets: Modeling, simulation and evaluation. Simul. Model. Pract.Theory 2013, 37, 56–69. [CrossRef]
50. Sheng, S.; Sun, X. Operational Optimization Model for Combined Operation of WP and Pumped-storagePlant. Proc. CSU-EPSA 2016, 28, 100–103. (In Chinese)
51. You, W.; Chang, J.; Li, W.; Lu, J. Joint daily operational optimization of WP and PSP based on dynamicdiscrete price agreement. Water Resour. Power 2015, 33, 209–214. (In Chinese)
52. Yuan, B.; Zhou, M.; Zhang, X.P.; Li, G. A Joint Smart Generation Scheduling Approach for Wind, Thermal,PSP Systems. Electr. Power Compon. Syst. 2014, 42, 372–385. (In Chinese) [CrossRef]
53. Ntomaris, A.V.; Bakirtzis, A.G. Stochastic Scheduling of Hybrid Power Stations in Insular Power Systemswith High Wind Penetration. IEEE Trans. Power Syst. 2015, 31, 1–13. [CrossRef]
54. Duque, Á.J.; Castronuovo, E.D.; Sánchez, I.; Usaola, J. Optimal operation of a pumped-storage hydro plantthat compensates the imbalances of a WP producer. Electr. Power Syst. Res. 2011, 81, 1767–1777. [CrossRef]
55. Ding, H.; Hu, Z.; Song, Y. Stochastic optimization of the daily operation of wind farm andpumped-hydro-storage plant. Renew. Energy 2012, 48, 571–578. [CrossRef]
56. Parastegari, M.; Hooshmand, R.-A.; Khodabakhshian, A.; Zare, A.-H. Joint operation of wind farm,photovoltaic, pump-storage and energy storage devices in energy and reserve markets. Int. J. Electr. PowerEnergy Syst. 2015, 64, 275–284. [CrossRef]
57. Ghiassi-Farrokhfal, Y.; Kazhamiaka, F.; Rosenberg, C.; Keshav, S. Optimal Design of Solar PV Farms withStorage. IEEE Trans. Sustain. Energy 2015, 6, 1586–1593. [CrossRef]
58. Paul, D.; Trieu, M. Timescales of Energy Storage Needed for Reducing Renewable Energy Curtailment.Renew. Energy 2019, 130, 388–399.
59. Hale, E.T.; Stoll, B.L.; Novacheck, J. Integrating solar into Florida’s power system: Potential roles for flexibility.Sol. Energy 2018, 170, 741–751. [CrossRef]
60. Brouwer, A.S.; Broek, M.V.D.; Seebregts, A.; Faaij, A. Operational flexibility and economics of power plantsin future low-carbon power systems. Appl. Energy 2015, 156, 107–128. [CrossRef]
61. Jenkins, J.D.; Zhou, Z.; Ponciroli, R.; Vilim, R.B.; Ganda, F.; de Sisternes, F.; Botterud, A. The benefits ofnuclear flexibility in power system operations with renewable energy. Appl. Energy 2018, 222, 872–884.[CrossRef]
62. Na, C.; Yuan, J.; Zhu, Y.; Xue, L. Economic Decision-Making for Coal Power Flexibility Retrofitting andCompensation in China. Sustainability 2018, 10, 348. [CrossRef]
63. Jiang, L.; Wang, C.; Huang, Y.; Pei, Z.; Xin, S.; Ma, S.; Brown, T. Growth in Wind and Sun: Integrating VariableGeneration in China. IEEE Power Energy Mag. 2015, 13, 40–49. [CrossRef]
64. China National Standardization Administration Commission. GB/T 19963-2011: Technical Rule forConnecting Wind Farm to Power System.2011. Available online: http://www.gb688.cn/bzgk/gb/newGbInfo?hcno=C0B59C55FD4B287CDF02842D074D1476 (accessed on 12 July 2018).
65. China National Standardization Administration Commission. GB/T 19964-2012: Technical Rule forConnecting Photo-Voltaic Power Station to Power System. Available online: http://www.gb688.cn/bzgk/gb/
newGbInfo?hcno=632384BD208FDDFD359624B8EF7231B5 (accessed on 12 July 2018).66. State Grid Corporation of China. Q/GDW-1617-2015: Technical Rule for Connecting Wind Farm to Power
Grid. 2016. Available online: http://www.doc88.com/p-9377409711944.html (accessed on 12 July 2018).67. State Grid Corporation of China. Q/GDW-1617-2015: Technical Rule for Connecting Photo-Voltaic Power
Station to Power Grid. 2016. Available online: https://www.doc88.com/p-7982826931970.html (accessed on12 July 2018).
68. Dai, H.; Chi, Y. Comparison Study on Grid Codes for Connecting Wind Farm into Power System. Electr. Power2012, 45, 1–6. (In Chinese)

Sustainability 2019, 11, 4424 17 of 17
69. Wang, Z.; Yang, G.; Wang, Z.; Liu, Y. Relay Protection-Related Domestic and Foreign Standards forInterconnecting Distributed Resources with Electric Power Systems. Electr. Power, in press. Available online:http://kns.cnki.net/kcms/detail/11.3265.TM.20190521.1452.067.html (accessed on 29 March 2019).
© 2019 by the authors. Licensee MDPI, Basel, Switzerland. This article is an open accessarticle distributed under the terms and conditions of the Creative Commons Attribution(CC BY) license (http://creativecommons.org/licenses/by/4.0/).