Embed Size (px)
Citation preview


2
Introduction The State of New Jersey spends millions of dollars each year maintaining its roads. Since 1985, the state has spent more than $15 billion of its Transportation Trust Fund on highways and local aid roads. In 2015 alone, the state plans to spend $754 million on these projects1—and that total does not include the additional money municipalities spend to maintain local roads. Despite this spending, however, 35 percent of roads in New Jersey are in “poor condition” and 36 percent of bridges need repair or replacement,2 meaning New Jersey’s real road maintenance needs are actually even higher. A key reason for this high maintenance bill is the sheer quantity of roads that must be maintained. New Jersey has more than 5.4 billion square feet of road that must be maintained by one level of government or another. These costs include things like resurfacing, pothole repair, vegetation and litter control, and snow removal, among others. Could New Jersey reduce its maintenance bill without sacrificing road conditions? By directing new development into more compact, dense development patterns, the need for new roads—and therefore maintenance costs—can be reduced over the long-term. This research shows how. Smart Growth America and New Jersey Future have partnered to analyze the relationship between density and road infrastructure in New Jersey, using two similar but distinct approaches. The aim of this analysis is to make clear the long-term costs and implications of different development options on state and local finances, and to help New Jersey’s leaders make informed financial decisions about development.
Analysis and methodologies In early 2015, Smart Growth America created a new fiscal analysis model to compare the costs of different development scenarios.3 For this project, Smart Growth America researchers conducted a New Jersey-specific application of that model. The application compares population density with pavement area by partitioning the whole state into grid cells of equal size and then compiling data for each cell. Smart Growth America researchers overlaid a grid of 100-acre cells across the entire State of New Jersey. We compiled U.S. Census data regarding population and employment for each cell,4 and used the New Jersey Department of Transportation’s database of road segments, which contains information about both lengths and widths, to compute pavement area for each segment and then aggregate to the municipal level. Using this basis, Smart Growth America researchers constructed a scatterplot showing the relationship between density, as measured by the total number of residents and workers per acre
The Cost of Sprawl, published by the Real Estate Research Corporation in 1974, was the first study to show that providing infrastructure to low-density, sprawling development costs more than for compact, dense developments. Low-density development’s greater distances among homes, offices, shops, etc., require more road and pipe infrastructure than would be required to serve the same number of homes and businesses in a more compact development pattern. Looked at another way, one mile of infrastructure costs roughly the same to build no matter where it is, but that mile can serve many times more people in a high-density place than in a low-density place.

3
in the grid cell, and the road area per capita (including residents and employees) in each grid cell (see Figure 1 below). Grid cells covering protected areas such as state parks and wetlands were excluded from the analysis. FIGURE 1 Road area per capita, by density
As Figure 1 shows, the quantity of road surface per capita declines as density increases. Put another way, infrastructure in dense locations is used more efficiently. More people and employees use each square foot of road built. Based on the information in Figure 1, a neighborhood with a total density of 50 residents and employees per acre (or 32,000 per square mile, which is typical of the very dense municipalities of Hudson County) would have approximately 130 square feet of road for each resident and employee. If those same residents and employees were spread out in a lower-density pattern, of say, five residents and employees per acre (or 3,200 per square mile, roughly that of subdivision-and-office-park suburbs like East Brunswick, Plainsboro, Scotch Plains, Cinnaminson, or Moorestown), the road area per capita would increase to an estimated 423 square feet—more than three times as much.
--
This statewide analysis only provides part of the picture, however. Interstate highways and U.S. and state routes are designed to move traffic from one part of the state to another, and are thus largely beyond the control of any one municipality. Focusing on roads that serve mainly local travel can provide a better understanding of the long-term costs that proceed directly from local land-use decisions. To shed light on this, New Jersey Future analyzed road area per capita based on municipalities, rather than grid cells. New Jersey Future’s approach excluded roads maintained by the state and included only those road segments falling under municipal or county jurisdiction.5 New Jersey Future researchers collected 2013 municipal population estimates from the U.S.
y = 961.54x-0.51 R² = 0.50584
0
500
1000
1500
2000
2500
0 50 100 150 200 250 300
Road
are
a (in
sq.
ft.) p
er c
apita
(re
siden
ts a
nd e
mpl
oyee
s)
Density (residents and employees per acre)

4
Census Bureau, as well as 2013 municipal employment data from the New Jersey Department of Labor. And as with Smart Growth America’s approach, New Jersey Future used the New Jersey Department of Transportation’s database of road segments to compute pavement area for each segment and then aggregate to the municipal level. Another distinctive feature of the New Jersey Future analysis was the availability of land-development data at the municipal level. New Jersey Future researchers used this to compute “net activity density” for each municipality, defined as population plus employment divided by developed square miles.6 Excluding undeveloped land from the denominator gives a clearer picture of what the developed part of a municipality actually looks like and avoids understating the building densities of places like Atlantic City that have a dense, mixed-use downtown core but whose borders also encompass substantial swaths of undevelopable land (like wetlands or permanently preserved open space). Despite the differences between the two methodologies, New Jersey Future’s analysis results in a similar conclusion to Smart Growth America’s. Figure 2, below, shows the inverse relationship between net activity density and square feet of local-road pavement per user (including both residents and employees). The higher the activity density in the developed parts of a municipality, the less pavement is needed to serve each resident or job. FIGURE 2 Local road pavement area per capita, by net activity density Residents and employees per developed square mile Data excludes several outlier municipalities with very high net activity densities or with very low population and job totals.
In reality, the relationship is even more pronounced than it appears in Figure 2, because for a subset of municipalities—specifically, Shore towns—the use of year-round population and employment statistics substantially understates the seasonal peak populations for which these places’ building inventories and accompanying road networks were truly designed. Using year-
0
500
1,000
1,500
2,000
2,500
3,000
3,500
4,000
4,500
0 5,000 10,000 15,000 20,000 25,000 30,000
Squa
re fe
et o
f loca
l roa
d pa
vem
ent p
er
capi
ta (r
esid
ents
and
em
ploy
ees)
Net activity density (residents and employees per developed square mile)

5
round figures thus overstates the amount of local-road pavement per user, because the denominator of the ratio (the number of users) is artificially small. Figure 3 on page 5 highlights resort towns—the 58 municipalities in which at least 10 percent of housing units were classified in the 2010 U.S. Census as seasonal or recreational. Nearly all of the municipal data points that fall the farthest away from the downward-sloping curve generally describing the relationship between pavement area per user and net activity density are Shore municipalities. Including them in the comparison thus dilutes the true relationship between density and pavement per user, a relationship that becomes even more dramatic once the anomaly of Shore towns has been accounted for. FIGURE 3 Local road pavement area per capita, by net activity density—resort towns highlighted Municipalities in which at least 10 percent of housing units are seasonal or recreational units that are vacant for part of the year are highlighted. Several outlier municipalities with very high net activity densities or with very low population and job totals are excluded.
So which municipalities are getting the most out of their road investments? Hudson County dominates the list of places with the fewest square feet of pavement per person and job (see Table 1 on page 6), with Guttenberg, West New York, Jersey City, Hoboken, Union City, and Weehawken all appearing in the top 10. Not coincidentally, these six municipalities all also appear among the top 10 municipalities with the highest net activity densities (see Table 2 on page 6). The relationship between low square footage of roads and high net activity density remains clear as we move farther down the list. Of the 50 municipalities with the least local-road pavement per user, 41 are also among the 50 with the highest net activity densities.7 At the other end, of the 50 municipalities having the most pavement per user, 38 are also among the 50 with the lowest activity densities.
0
500
1,000
1,500
2,000
2,500
3,000
3,500
4,000
4,500
0 2,000 4,000 6,000 8,000 10,000 12,000 14,000 16,000 18,000
Squa
re fe
et o
f loca
l roa
d pa
vem
ent p
er
capi
ta (r
esid
ents
and
em
ploy
ees)
Net activity density (residents and employees per developed square mile)

6
TABLE 1 Local-road pavement per person Square feet per capita (residents and employees)
Rank County Municipality Pavement area/person
1 Hudson Guttenberg 53.9 sq. ft. 2 Hudson West New York 56.7 sq. ft. 3 Hudson Jersey City 59.0 sq. ft. 4 Hudson Hoboken 67.1 sq. ft. 5 Hudson Union City 68.8 sq. ft. 6 Bergen Teterboro 73.3 sq. ft. 7 Bergen Edgewater 100.6 sq. ft. 8 Hudson Weehawken 103.5 sq. ft. 9 Middlesex New Brunswick 108.5 sq. ft.
10 Passaic Passaic 108.9 sq. ft. 11 Hudson North Bergen 110.1 sq. ft. 12 Bergen Fort Lee 111.5 sq. ft. 13 Morris Morristown 111.8 sq. ft. 14 Bergen Cliffside Park 114.6 sq. ft. 15 Union Elizabeth 119.0 sq. ft. 16 Bergen Fairview 124.1 sq. ft. 17 Hudson Secaucus 124.2 sq. ft. 18 Hunterdon Flemington 125.0 sq. ft. 19 Essex Newark 125.3 sq. ft. 20 Hudson Harrison 129.4 sq. ft. 21 Bergen Hackensack 129.6 sq. ft. 22 Hudson East Newark 130.6 sq. ft. 23 Hudson Bayonne 130.7 sq. ft. 24 Hudson Kearny 140.0 sq. ft. 25 Bergen Palisades Park 140.8 sq. ft. 26 Passaic Paterson 145.3 sq. ft. 27 Bergen Rockleigh 155.2 sq. ft. 28 Atlantic Atlantic City 155.5 sq. ft. 29 Essex East Orange 156.0 sq. ft. 30 Essex Irvington 161.9 sq. ft. 31 Mercer Trenton 161.9 sq. ft. 32 Mercer Pennington 167.0 sq. ft. 33 Monmouth Farmingdale 168.3 sq. ft. 34 Bergen Lodi 168.8 sq. ft. 35 Bergen Garfield 169.9 sq. ft. 36 Passaic Prospect Park 171.2 sq. ft. 37 Bergen East Rutherford 172.2 sq. ft. 38 Monmouth Red Bank 172.2 sq. ft. 39 Bergen Wallington 173.5 sq. ft. 40 Monmouth Shrewsbury Tp. 174.9 sq. ft. 41 Bergen Lyndhurst 175.0 sq. ft. 42 Essex Orange 175.9 sq. ft. 43 Monmouth Englishtown 180.0 sq. ft. 44 Bergen Little Ferry 183.0 sq. ft. 45 Bergen Carlstadt 185.7 sq. ft. 46 Gloucester Swedesboro 186.1 sq. ft. 47 Middlesex Perth Amboy 187.4 sq. ft. 48 Hunterdon Lebanon 188.4 sq. ft. 49 Monmouth Freehold 188.9 sq. ft. 50 Sussex Newton 190.4 sq. ft.
TABLE 2 Net activity densities per mile
Rank County Municipality Net activity density (2007)
1 Hudson Guttenberg 62,153.8 2 Hudson Union City 60,354.1 3 Hudson West New York 58,380.6 4 Hudson Hoboken 51,099.2 5 Hudson Weehawken 29,593.3 6 Hudson East Newark 28,805.0 7 Passaic Passaic 28,321.5 8 Bergen Cliffside Park 27,626.3 9 Hudson Jersey City 26,385.0
10 Atlantic Atlantic City 23,298.3 11 Passaic Paterson 23,003.4 12 Essex Irvington 22,858.7 13 Bergen Fort Lee 22,337.8 14 Bergen Hackensack 22,167.1 15 Mercer Trenton 21,688.7 16 Middlesex New Brunswick 21,639.5 17 Essex East Orange 21,278.3 18 Passaic Prospect Park 20,745.6 19 Bergen Palisades Park 20,408.6 20 Monmouth Shrewsbury Tp. 20,254.1 21 Bergen Fairview 19,951.6 22 Monmouth Farmingdale 19,707.2 23 Hudson North Bergen 18,930.9 24 Essex Newark 18,561.5 25 Bergen Edgewater 17,664.2 26 Gloucester Swedesboro 17,452.1 27 Essex Orange 17,195.8 28 Bergen Garfield 16,995.2 29 Morris Morristown 16,974.4 30 Monmouth Red Bank 16,869.4 31 Hudson Harrison 16,465.2 32 Camden Woodlynne 15,483.6 33 Middlesex Perth Amboy 15,239.1 34 Monmouth Englishtown 14,954.9 35 Hudson Bayonne 14,774.0 36 Monmouth Asbury Park 14,674.7 37 Union Elizabeth 14,434.3 38 Bergen Wallington 14,408.9 39 Camden Camden 14,304.8 40 Essex Belleville 14,246.0 41 Bergen Lodi 13,460.4 42 Bergen Lyndhurst 13,353.5 43 Somerset North Plainfield 12,835.6 44 Morris Dover 12,631.1 45 Union Roselle Park 12,480.8 46 Bergen Rutherford 12,394.9 47 Bergen Bogota 12,374.9 48 Hunterdon Flemington 12,314.8 49 Monmouth Freehold 12,286.5 50 Hudson Secaucus 12,073.0
7
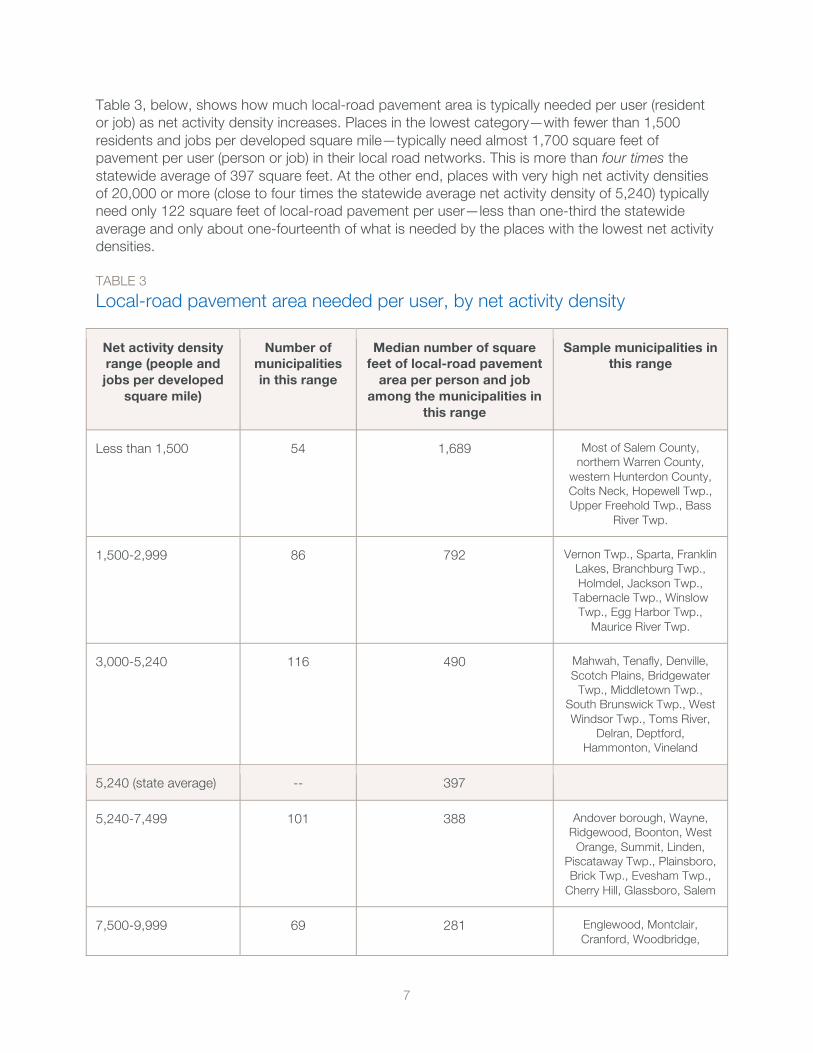
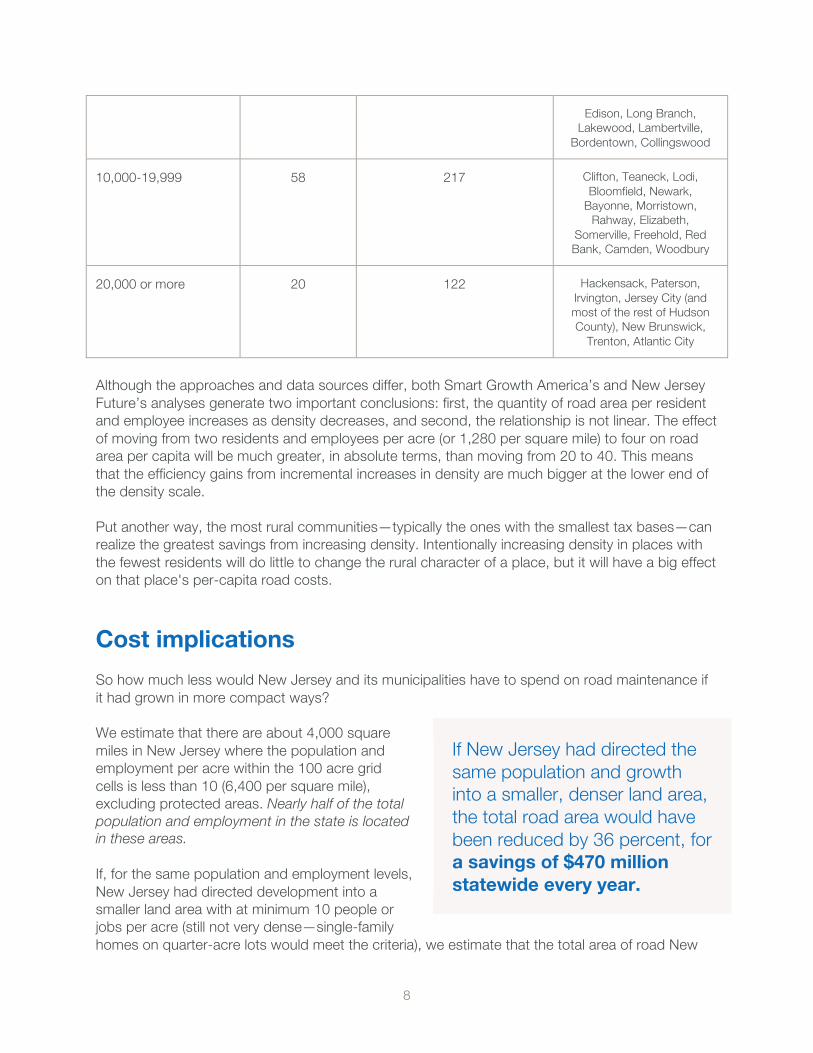
Table 3, below, shows how much local-road pavement area is typically needed per user (resident or job) as net activity density increases. Places in the lowest category—with fewer than 1,500 residents and jobs per developed square mile—typically need almost 1,700 square feet of pavement per user (person or job) in their local road networks. This is more than four times the statewide average of 397 square feet. At the other end, places with very high net activity densities of 20,000 or more (close to four times the statewide average net activity density of 5,240) typically need only 122 square feet of local-road pavement per user—less than one-third the statewide average and only about one-fourteenth of what is needed by the places with the lowest net activity densities. TABLE 3 Local-road pavement area needed per user, by net activity density
Net activity density range (people and jobs per developed
square mile)
Number of municipalities in this range
Median number of square feet of local-road pavement
area per person and job among the municipalities in
this range
Sample municipalities in this range
Less than 1,500 54 1,689 Most of Salem County, northern Warren County,
western Hunterdon County, Colts Neck, Hopewell Twp., Upper Freehold Twp., Bass
River Twp.
1,500-2,999 86 792 Vernon Twp., Sparta, Franklin Lakes, Branchburg Twp., Holmdel, Jackson Twp.,
Tabernacle Twp., Winslow Twp., Egg Harbor Twp.,
Maurice River Twp.
3,000-5,240 116 490 Mahwah, Tenafly, Denville, Scotch Plains, Bridgewater
Twp., Middletown Twp., South Brunswick Twp., West Windsor Twp., Toms River,
Delran, Deptford, Hammonton, Vineland
5,240 (state average) -- 397
5,240-7,499 101 388 Andover borough, Wayne, Ridgewood, Boonton, West
Orange, Summit, Linden, Piscataway Twp., Plainsboro, Brick Twp., Evesham Twp.,
Cherry Hill, Glassboro, Salem
7,500-9,999 69 281 Englewood, Montclair, Cranford, Woodbridge,
8
Edison, Long Branch, Lakewood, Lambertville,
Bordentown, Collingswood
10,000-19,999 58 217 Clifton, Teaneck, Lodi, Bloomfield, Newark,
Bayonne, Morristown, Rahway, Elizabeth,
Somerville, Freehold, Red Bank, Camden, Woodbury
20,000 or more 20 122 Hackensack, Paterson, Irvington, Jersey City (and most of the rest of Hudson County), New Brunswick,
Trenton, Atlantic City
Although the approaches and data sources differ, both Smart Growth America’s and New Jersey Future’s analyses generate two important conclusions: first, the quantity of road area per resident and employee increases as density decreases, and second, the relationship is not linear. The effect of moving from two residents and employees per acre (or 1,280 per square mile) to four on road area per capita will be much greater, in absolute terms, than moving from 20 to 40. This means that the efficiency gains from incremental increases in density are much bigger at the lower end of the density scale. Put another way, the most rural communities—typically the ones with the smallest tax bases—can realize the greatest savings from increasing density. Intentionally increasing density in places with the fewest residents will do little to change the rural character of a place, but it will have a big effect on that place's per-capita road costs.
Cost implications So how much less would New Jersey and its municipalities have to spend on road maintenance if it had grown in more compact ways? We estimate that there are about 4,000 square miles in New Jersey where the population and employment per acre within the 100 acre grid cells is less than 10 (6,400 per square mile), excluding protected areas. Nearly half of the total population and employment in the state is located in these areas. If, for the same population and employment levels, New Jersey had directed development into a smaller land area with at minimum 10 people or jobs per acre (still not very dense—single-family homes on quarter-acre lots would meet the criteria), we estimate that the total area of road New
If New Jersey had directed the same population and growth into a smaller, denser land area, the total road area would have been reduced by 36 percent, for a savings of $470 million statewide every year.

9
Jersey and its municipalities need to maintain would have be reduced by 36 percent, or approximately 1.9 billion square feet. And assuming an average cost of $0.25 per square foot8 to maintain the roads, the result would have been a $470 million savings statewide every year. Admittedly, this is a hypothetical scenario but it provides a useful illustration of the financial consequences of land-use decisions over the long term.
Conclusion The costs of low-density, sprawling development add up to significant amounts over time. Planners and policymakers in the state should take note before the next 50 years of development makes the problem even worse. Smarter growth, with more compact development patterns, would reduce long-term costs. In addition to the financial implications, there may also be regional equity implications to these findings. Higher-density places require fewer square feet of pavement per user (residents and employees). In New Jersey and in many other parts of the country, the most densely populated areas tend to be older urban and first-ring suburban areas These are the places that are making the most efficient use of their infrastructure, in the sense that a mile of local road (or water pipe, power line, etc.) serves many more households here than it does in a low-density suburban
environment where homes are much farther apart. Yet the costs of constructing and maintaining infrastructure don’t necessarily correlate with the actual amount of physical infrastructure that the household regularly uses. The results of this study suggest the possibility that higher-density places that require far less pavement area per user may be indirectly subsidizing local
street networks in lower-density places via transportation funding mechanisms that are collected on a roughly per-capita basis. In other words, are some of the real costs of higher-income households living in spread-out, large-lot developments effectively being underwritten by lower-income urbanites with much smaller infrastructure footprints (and with fewer resources to spare)? Further investigation of road-funding mechanisms is needed, however, before such cross-subsidization—if it is happening—could be authoritatively documented In any event, the large disparities in population and employment density among New Jersey’s 565 municipalities, and the clear advantages of density in lowering the per-capita costs of infrastructure, raises questions about whether the costs of infrastructure in low-density places should perhaps be more proportionally borne by the people who choose to live there.
Smarter growth, with more compact development patterns, would reduce long-term costs.

10
Endnotes 1 New Jersey Transportation Trust Fund Authority. "NJDOT/NJ Transit Capital Program." Retrieved October 15, 2015
from http://www.state.nj.us/ttfa/capital/. 2 Symons, M. (2015, February 22). "No solution in sight for fixing N.J.'s crumbling roads, bridges." Asbury Park Press.
Retrieved October 15, 2015 from http://www.courierpostonline.com/story/news/local/south-jersey/2015/02/22/solution-sight-fixing-njs-crumbling-roads-bridges/23864699/.
3 Smart Growth America. (2015, April). The Fiscal Implications of Development Patterns. Retrieved October 15, 2015 from http://www.smartgrowthamerica.org/documents/fiscal-implications-of-development-patterns.pdf.
4 The New Jersey Department of Transportation provided a GIS layer with road length and width information. Population data comes from 2010 census block data and employment data is from the 2011 Census Local Employment Dynamics. Because census block boundaries do not match up exactly with the grid cell boundaries, Smart Growth America estimated the population and employment of the cells based on the average population and employment density of the census blocks which intersect each grid cell, weighted by land area.
5 Some segments of roads that are signed as state or national numbered routes do host commercial districts, often functioning as de facto main streets for their host municipalities. In recognition of the fact that they primarily host local traffic, such segments are often delegated to local or county governments to maintain. Because road segments in the NJDOT database were filtered by maintenance jurisdiction rather than by functional system, these segments will still be tallied as local roads and will be retained in our analysis.
6 Net activity density is computed using data from 2007 because this is the most recent year for which the land-development data are available.
7 Excluding the 58 resort municipalities. 8 According to the Reason Foundation, which compiled highway expenditure statistics from the Federal Highway
Administration, the State of New Jersey spent $42,317 per lane mile on maintenance in 2012. If we assume that the average lane width is 12 feet, then the result is a per square foot maintenance cost of $0.66. The cost to maintain highways may well be higher than for local roads, however, therefore we have assumed a more conservative estimate of $0.25 per square foot. Actual costs for any given road will vary depending on weather and usage, especially by trucks.