Embed Size (px)
Citation preview
36
Croatian Regional Development Journal | Vol. 2 No. 2 | 2021
Paper type: Research article
THE FIRST YEAR OF COVID-19 IN CROATIA - A MATHEMATICAL MODEL Tibor Rodiger
Polytechnic of Međimurje in Čakovec
Edgar Glavaš
Čakovec County Hospital
Ivan Kovač
Geotechnical Faculty of the University of Zagreb
Abstract
The new coronavirus has spread around the world at an unprecedented speed. Understanding patterns of disease spread is an important contribution to controlling any epidemic, and today's mathematical methods offer a plethora of proven models to choose from. We provide a brief overview of epidemiological concepts, papers pertaining to mathematical modelling, and present a robust, simple mathematical model to model incidence of COVID-19 cases in Croatia during the first year of the disease. For our models, we chose logistic, Gumbel and Richards functions, with parameters generated using the Levenberg-Marquardt iterative method of nonlinear regression. In conclusion, all three models provided adequate estimation of incidence curve and final number of infected during the chosen time period, with relatively minor differences depending on chosen parameters of significance. The model using the logistic function proved to be the most applicable to available data. While no model can give the answers to ending the pandemic, this approach can provide a simple prognostic tool to evaluate interventions and estimate disease spread.
Keywords: COVID-19, mathematical modelling, Croatia
Received: 20.9.2021 Accepted: 30.9.2021 DOI: 10.2478/crdj-2021-0011
37
Croatian Regional Development Journal | Vol. 2 No. 2 | 2021
1. Introduction
Four human coronaviruses have long been recognized as a cause of common cold in humans. The discovery of SARS-CoV (in 2002) and MERS-CoV (in 2012) elevated the status of the Coronaviridae family from benign causes of mild respiratory disease to organisms of concern. These newly discovered viruses caused severe acute respiratory infections and nosocomial outbreaks. In 2019, a novel coronavirus, now known as SARS-CoV-2 (2019), emerged in Wuhan, China and subsequently caused the ongoing pandemic. The World Health Organization declared that the epidemic is a public health emergency of international concern on January 31, 2020.
The ongoing COVID-19 pandemic encourages experts from all areas to apply skills from their area of expertise. A never before seen accessibility of data and networking of experts allow for rapid exploration of all aspects of disease spread and management. From identification of mutated strains to long term planning of vaccine supplies, all aspects of science come to their own and can offer useful insight. Conversely, the huge amount of available data depends heavily on interpretation, necessitating a multidisciplinary approach. The degree of global integration and ease of disease transmission makes rapid research a necessity. (Panovska-Griffiths, 2020) No area of human activity seems untouched by this epidemic. A better understanding of disease spread and human behaviour were the only way of combating the disease prior to the advent of efficient vaccines. Even after vaccine introduction, due to economic and sociological pressures as well as emergence of new mutations the pandemic is still difficult to control. Human nature in general seems reluctant to bend in front of objective measures necessary to prevent disease spread and emergence of dangerous mutations.
We tried to fit available data on new infections into models containing commonly used sigmoidal mathematical functions: logistic, Gumbel and Richards. The intention was to estimate the final number of diagnosed cases and form a robust and usable estimator as to the total expected number of cases. This estimator could be useful in estimating future disease spread and appraising vaccine efficiency on a large scale. It is worth noting that the true number of COVID-19 patients is probably much greater than reported, and its true value will probably depend on later, population-wide serological probes. For the purposes of this paper, we focus on identified cases exclusively.
1.1. A brief overview of epidemiology
Epidemiology is the study and analysis of the distribution, patterns and determinants of health and disease conditions in defined populations. (Porta, 2014) Its roots can be traced back to the ancient era and rational efforts to link occurrences of disease with environmental influences. The term "epidemic" was coined by Hippocrates, and promptly nearly forgotten until the emergence of sweeping, large-scale infectious disease in the middle ages. By the 16th century scientific and mathematical advances solidified the theory of external disease causes. Observations of disease spread and
38
Croatian Regional Development Journal | Vol. 2 No. 2 | 2021
behavior led to formulation of rules to combat spread of disease. These rules were as unpopular then as they are today. Lockdowns, physical distancing, washing groceries and textiles, restricting shopping to one person per household, quarantines and health passports proved their efficiency in the past centuries.
Personal hygiene as a key component to stopping disease also had a long and rocky development. In 1846, Ignaz Semmelweis proposed using chlorinated lime to disinfect medical students' hands before attending to childbirth, which in practice dropped mortality in obstetrics wards by up to 10 times. This earned him a stay and ultimately death in a lunatic asylum, with his theories being vindicated only after his death.
John Snow is considered one of the founders of modern epidemiology due to his involvement in combating the 1854 Broad Street cholera outbreak. By correlating deaths from cholera and their temporal and spatial relationship, he determined the cause of the disease to be water from a particular pump. His measures of water chlorination and restriction of access to suspicious water sources is commonly credited with ending the outbreak.
Specific, targeted influence on disease spread became possible with development of potent vaccines and, later, antimicrobials. Despite efforts, only one infectious disease has been eradicated to date - smallpox, announced eradicated in 1980. (Magner, 2009)
1.2. Quantitative methods in modern epidemiology
Modern epidemiology uses quantitative methods to study diseases in human populations with the aim of shaping prevention and control efforts. Modern epidemiological models are quantifying models with parameters pertaining to causation of disease, natural history of disease, tracking health status of populations, and efficiency of interventions. (Bonita, 2006)
Mathematical modelling the spread of infectious disease via mathematical means is not new by any means. In 1766 Daniel Bernoulli published an article where he described the effects of smallpox variolation (a precursor of vaccination) on life expectancy using mathematical life table analysis From early on, the spread of infectious diseases has been understood as a balance between susceptible, infected, and immune proportions of the population, and tis approach was validated during the eradication of smallpox. (Kretzschmar, 2009)
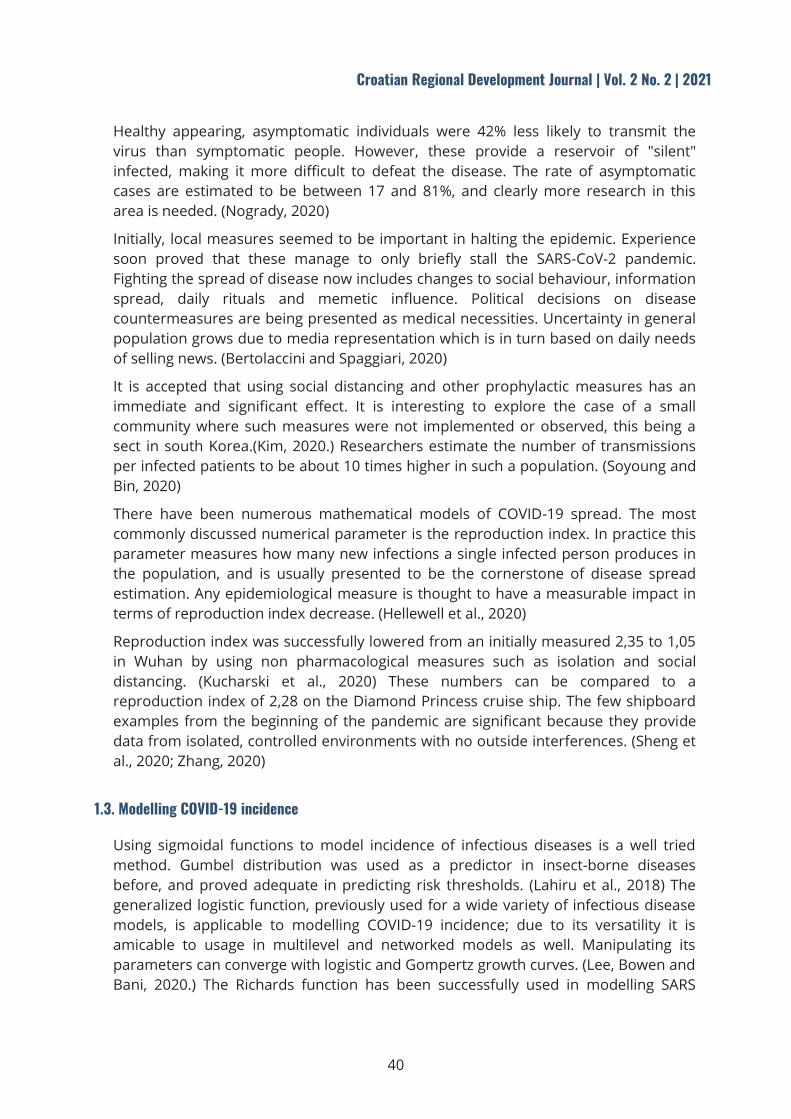
Reinfections, alternate modes of spread, variable duration of disease and communicability, new mutations, duration of immunity, and many other factors are difficult or impossible to account for in a mathematical model. Nevertheless, methods such as compartmentalization, continuous age modelling, networking, and so on have increased the quality of predictions. An example of a popular model of compartmentalization is the SIR (Susceptible, Infected, Recovered (or alternatively Removed)) model, as outlined in Figure 1. However, it takes a long observation time to gather enough data for a model, and COVID-19 is barely two years old at this point.
39
Croatian Regional Development Journal | Vol. 2 No. 2 | 2021
Figure 1. The SIR model
Source: Author’s illustration
COVID-19 is expected to follow patterns similar to prior infectious diseases. Number of infected should follow an initial steep increase, a short plateau and finally a taper towards zero. Due to the speed of spread and lethality, it has been shown that leaving the spread of COVID-19 unchecked leads towards quick saturation of medical capacities, with the untreated patients from risk groups suffering from mortality as high as 30%. "Flattening the curve" has been adopted as a strategy to combat overcrowding in hospitals, (Ferguson et al., 2020) but experience has shown that the population in general isn't likely to follow social distancing and other non-pharmacological strategies of disease spread prevention. Various mitigation and suppression measures for control of COVID-19 have been examined (Sandip et al., 2020), but in the end economic factors prevented serious efforts towards containment. Lethal outcome more than certainly depends on socioeconomic elements, as well as prior health problems and age. However, a clear picture of comorbidities and causes of death in COVID-19 patients is difficult to establish due to differences in reporting. In most countries, every SARS-CoV-2 positive person dying is counted as a death due to COVID-19, despite it not being the direct cause of death. (Bulut and Kato, 2020)
Increasing amounts of available data diminish uncertainties in disease behaviour. However, this is a very slow process. Every month new signs, symptoms and treatments are introduced - some are validated while others are rejected. Post-COVID syndromes seem to multiply, from "long COVID" disease, to emerging clinical entities appearing more than 12 weeks after infection ("post-COVID" and "long-haulers"). Some of these are merely being linked to chronic exhaustion, while some are possibly deadly like the MIS-C which can end fatally in children.
Humankind, being on the impatient end of the spectrum, itches to get answers now rather than later, so we fall back on mathematical description of the disease and its expected course. While expectations in initial rise, plateau and receding phases held true for initial phases of the pandemic, once the different infection waves and mutations overlap the difficult of applying quantitative models increases even further. The first step in establishing disease prevalence is reliable identification of the virus. Identifying COVID-19 patients relies on PCR testing, which is reasonably accurate. However, this is usually only used when other symptoms are present, and even then exhibits a 10% false negative results in the most optimistic case. (Kanji et al., 2021)
40
Croatian Regional Development Journal | Vol. 2 No. 2 | 2021
Healthy appearing, asymptomatic individuals were 42% less likely to transmit the virus than symptomatic people. However, these provide a reservoir of "silent" infected, making it more difficult to defeat the disease. The rate of asymptomatic cases are estimated to be between 17 and 81%, and clearly more research in this area is needed. (Nogrady, 2020)
Initially, local measures seemed to be important in halting the epidemic. Experience soon proved that these manage to only briefly stall the SARS-CoV-2 pandemic. Fighting the spread of disease now includes changes to social behaviour, information spread, daily rituals and memetic influence. Political decisions on disease countermeasures are being presented as medical necessities. Uncertainty in general population grows due to media representation which is in turn based on daily needs of selling news. (Bertolaccini and Spaggiari, 2020)
It is accepted that using social distancing and other prophylactic measures has an immediate and significant effect. It is interesting to explore the case of a small community where such measures were not implemented or observed, this being a sect in south Korea.(Kim, 2020.) Researchers estimate the number of transmissions per infected patients to be about 10 times higher in such a population. (Soyoung and Bin, 2020)
There have been numerous mathematical models of COVID-19 spread. The most commonly discussed numerical parameter is the reproduction index. In practice this parameter measures how many new infections a single infected person produces in the population, and is usually presented to be the cornerstone of disease spread estimation. Any epidemiological measure is thought to have a measurable impact in terms of reproduction index decrease. (Hellewell et al., 2020)
Reproduction index was successfully lowered from an initially measured 2,35 to 1,05 in Wuhan by using non pharmacological measures such as isolation and social distancing. (Kucharski et al., 2020) These numbers can be compared to a reproduction index of 2,28 on the Diamond Princess cruise ship. The few shipboard examples from the beginning of the pandemic are significant because they provide data from isolated, controlled environments with no outside interferences. (Sheng et al., 2020; Zhang, 2020)
1.3. Modelling COVID-19 incidence
Using sigmoidal functions to model incidence of infectious diseases is a well tried method. Gumbel distribution was used as a predictor in insect-borne diseases before, and proved adequate in predicting risk thresholds. (Lahiru et al., 2018) The generalized logistic function, previously used for a wide variety of infectious disease models, is applicable to modelling COVID-19 incidence; due to its versatility it is amicable to usage in multilevel and networked models as well. Manipulating its parameters can converge with logistic and Gompertz growth curves. (Lee, Bowen and Bani, 2020.) The Richards function has been successfully used in modelling SARS
41
Croatian Regional Development Journal | Vol. 2 No. 2 | 2021
outbreaks (Hsieh, 2009., Wang, 2012.) as well as used as a predictive tool in the current COVID-19 pandemic. (Aviv-Sharon, 2020)
If we accept that the new coronavirus is here to stay, there might be periodical or seasonal peaks, similar to the common cold, or ambrosia allergies. (Puc and Wolski, 2013.) Anticipatory mathematical models find their application in planning peak medical capacity utilization, drug and material consumption and usage of ICU beds. (Panovska and Griffiths, 2020.)
Network models (e.g. Bats-Hosts-Reservoir-People) can be used to estimate potential transmission from the infection source (animals, or asymptomatic infected) to the human infection. Such models reiterate the importance of preventive measures. (Chen et al., 2020)
Behaviour of COVID-19 is nevertheless still unpredictable. Early models were underestimating speed of disease spread, and predicted a number of cases with no control measures lower than actually measured with disease spread prevention measures in place. (Peirlinck et al., 2020, Mandal, 2020)
2. Materials and methods
Our intention was to form a robust model based on a commonly used sigmoidal function to estimate the final number of diagnosed (confirmed) cases (labeled as Ncnf) in in the first year of COVID-19 in Croatia. Models are created using time functions: N(t). As Ncnf needs to be a finite value, every function has to satisfy
(1)
From (1) it is visible that Ncnf is the upper limit of the function, while the lower limit is zero. The value of function parameters were estimated using the Levenberg-Marquardt iterative method of nonlinear regression. (Motulsky and Christopoulos, 2003) Data was evaluated using Statistica (TIBCO Software Inc) version 13.5.0.17.
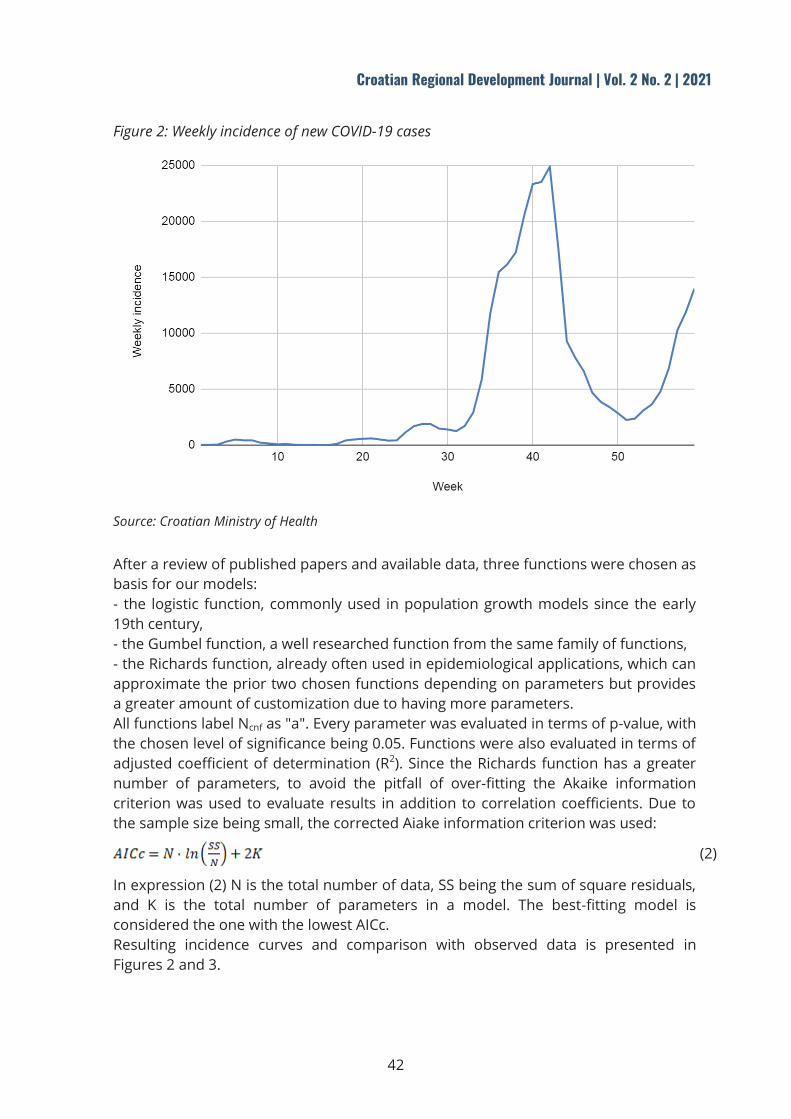
We used publicly available data on incidence of confirmed COVID-19 cases published daily by the Croatian Ministry of Health. The basis for our model is weekly incidence of confirmed COVID-19 cases. Weekly incidence was chosen to somewhat mitigate the anticipated amount of noise stemming from lower numbers of patients being tested during weekends, differences in reporting, and similar artefacts. We used data from the first confirmed case on 26th of February 2020, until 20th of March 2021. Weekly incidence of COVID-19 in Croatia from the start of the epidemic is presented graphically on Figure 2. Even a cursory glance reveals an obvious peak of incidence that looks amicable to modelling via a single logistic function. However, following week 51, the number of new cases started to increase again, as a probable prelude to a new wave of infections. Our model includes data up to week 52.
42
Croatian Regional Development Journal | Vol. 2 No. 2 | 2021
Figure 2: Weekly incidence of new COVID-19 cases
Source: Croatian Ministry of Health
After a review of published papers and available data, three functions were chosen as basis for our models: - the logistic function, commonly used in population growth models since the early 19th century, - the Gumbel function, a well researched function from the same family of functions, - the Richards function, already often used in epidemiological applications, which can approximate the prior two chosen functions depending on parameters but provides a greater amount of customization due to having more parameters. All functions label Ncnf as "a". Every parameter was evaluated in terms of p-value, with the chosen level of significance being 0.05. Functions were also evaluated in terms of adjusted coefficient of determination (R2). Since the Richards function has a greater number of parameters, to avoid the pitfall of over-fitting the Akaike information criterion was used to evaluate results in addition to correlation coefficients. Due to the sample size being small, the corrected Aiake information criterion was used:
(2)
In expression (2) N is the total number of data, SS being the sum of square residuals, and K is the total number of parameters in a model. The best-fitting model is considered the one with the lowest AICc. Resulting incidence curves and comparison with observed data is presented in Figures 2 and 3.

43
Croatian Regional Development Journal | Vol. 2 No. 2 | 2021
2.1. The logistic model
The first chosen model contains the logistic function. This is determined by the expression
(3)
where a is the total expected number of cases (Ncnf) and t is time in weeks since patient zero. The function hasa total of three parameters. Computed parameters and results are presented in Table 1.
Table 1: Logistic model fit to observed data
Parameter Estimate Standard error
t-value df = 48
p-value Lo. Conf Limit
Up. Conf Limit
a b c
241535 1596275 0.36077
2236.4 603203.3 0.0
107.9997 2.6463 36.1446
0.000000 0.010971 0.000000
237038.4 383452.9 0.3
246032 2809096 0
Model is: v2=a/(1+b*Euler**(-c*v1)) Level of confidence: 95.0% (alpha=0.050) Final value: 685474526.2409 Proportion of variance accounted for: 0.99811619 R =0.99905765
Source: Authors
2.2. Gumbel model
Our second model contains Gumbel's function, as determined by the expression
(4)
where a is the total expected number of cases and t is time in weeks since patient zero. The function has a total of three parameters. Computed parameters and results are presented in Table 2.
Table 2: Gumbel model fit to observed data
Parameter Estimate Standard error
t-value df = 40
p-value Lo. Conf Limit
Up. Conf Limit
a c b
258144.9 38.1 4.6
6474.607 0.188 0.291
39.8704 202.7342 15.6996
0.00 0.00 0.00
245059.2 37.8 4.0
271230.6 38.5 5.1
Model is: v2=a/(Euler**Euler**(-((v1-c)/b))) Level of confidence: 95.0% ( alpha=0.050) Final value: 1931807785.325 Proportion of variance accounted for: 0.99418559 R =0.99708855
Source: Authors
44
Croatian Regional Development Journal | Vol. 2 No. 2 | 2021
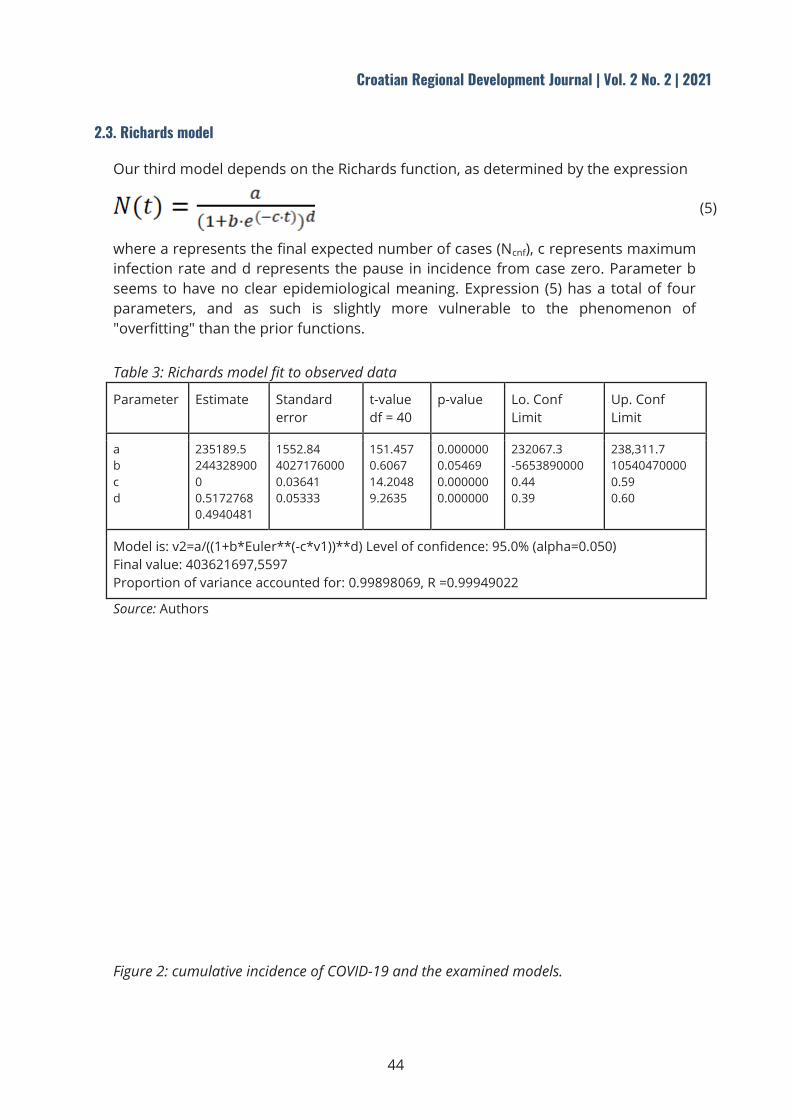
2.3. Richards model
Our third model depends on the Richards function, as determined by the expression
(5)
where a represents the final expected number of cases (Ncnf), c represents maximum infection rate and d represents the pause in incidence from case zero. Parameter b seems to have no clear epidemiological meaning. Expression (5) has a total of four parameters, and as such is slightly more vulnerable to the phenomenon of "overfitting" than the prior functions.
Table 3: Richards model fit to observed data
Parameter Estimate Standard error
t-value df = 40
p-value Lo. Conf Limit
Up. Conf Limit
a b c d
235189.5 2443289000 0.5172768 0.4940481
1552.84 4027176000 0.03641 0.05333
151.457 0.6067 14.2048 9.2635
0.000000 0.05469 0.000000 0.000000
232067.3 -5653890000 0.44 0.39
238,311.7 10540470000 0.59 0.60
Model is: v2=a/((1+b*Euler**(-c*v1))**d) Level of confidence: 95.0% (alpha=0.050) Final value: 403621697,5597 Proportion of variance accounted for: 0.99898069, R =0.99949022
Source: Authors
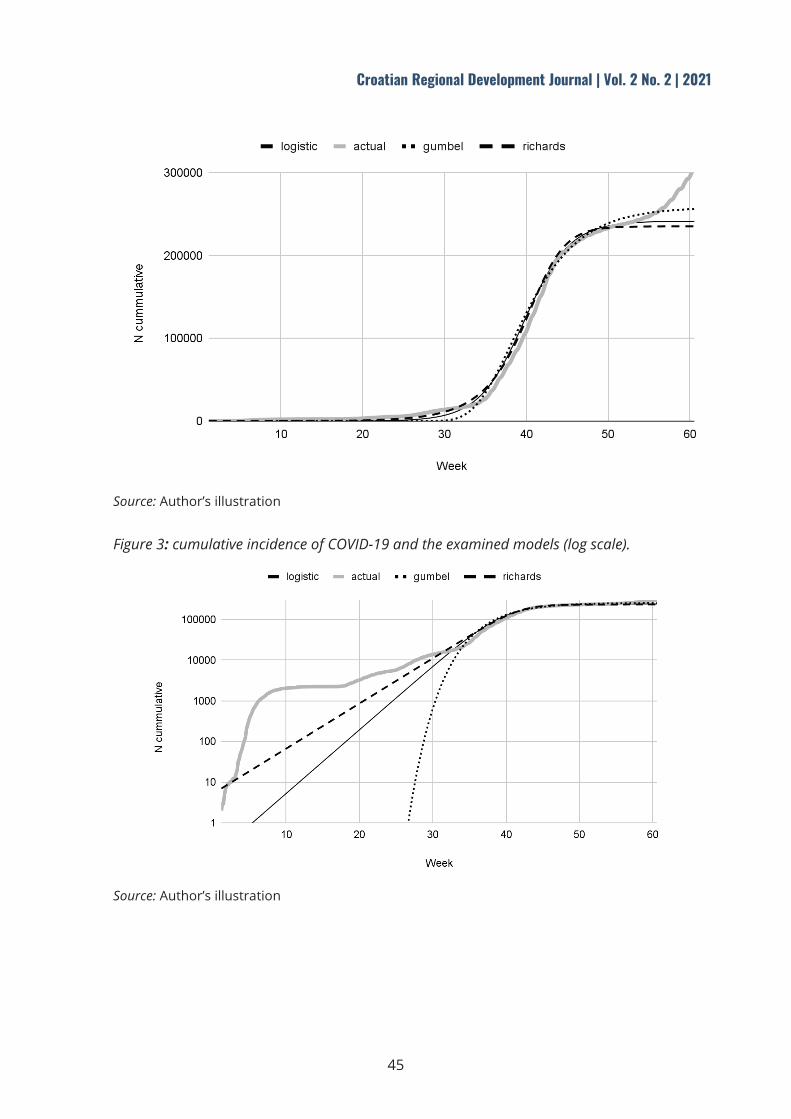
Figure 2: cumulative incidence of COVID-19 and the examined models.
45
Croatian Regional Development Journal | Vol. 2 No. 2 | 2021
Source: Author’s illustration
Figure 3: cumulative incidence of COVID-19 and the examined models (log scale).
Source: Author’s illustration

46
Croatian Regional Development Journal | Vol. 2 No. 2 | 2021
3. Discussion
All three models approximate the observed data with a statistically significant amount of accuracy. The logistic and Gumbel functions provided a R2
adj of 0.99811619 and 0.99418559 respectively. The model using the Richards function provided the best R2
adj of 0.99898069.
The estimates of the final number of COVID-19 patients (Ncnf, parameter "a") differ among the three models, with the greatest value predicted by the Gumbel model. Ending with week 52 the total number of CODIV-19 cases in Croatia was 242097.The observed number of cases was slightly underestimated by the logistic model (with a difference of 562 cases, which translates to 0,23% of total cases) while Gumbel model slightly overestimated (a difference of 16048 cases, which translates to around 6,62%). The Richards growth curve ended at 6907.5 cases above the final observed value, which amounts to a difference of 2,8% of the final value.
In week 53 an increase in the number of new cases was observed, signalling the start of a new wave of infections, and all the estimates were quickly exceeded in following weeks with a sharply upwards trend, so it is uncertain what the real final value of cases might have been.
The final results for all model parameters, adjusted coefficients of determinations, sums of squared residuals, Akaike information coefficient and difference to the final observed value at week 52 ("difference") are summarized in Table 4.
Table 4: Generated model summary
Model Logistic Gumbel Richards
parameter estimate p-value estimate p-value estimate p-value
a b c d
241535 1596275
0,361 -
0,000 0,011 0,000
-
258145 4,6
38,1 -
0,000 0,000 0,000
-
235189.5 2443289000
0.5172768 0.4940481
0,000 0,056 0,000 0,000
Rc2 R2 SS AIC AICc difference
0,998 0.99905765
685474526,241 858,508 858,988
-562
0,994 0.99708855
1931807785,325 912,385 912,865
16048
0,999 0.99949022
403621697,560 832,967 833,783 -6907.5
Source: Authors
All examined models display a high correlation with observed data. Judging by the coefficient of determination alone, the model using the Richards function provides the best fit for observed data. This is due to the inherent advantage of having more parameters, enabling the model to better follow the observed data. This can be seen
47
Croatian Regional Development Journal | Vol. 2 No. 2 | 2021
on Figure 3. Even when correcting for an increased number of parameters in the model via the corrected Akaike information criterion, this model still seems to have the best performance. However, the Richards model includes a parameter with a p-value worse than our chosen level of significance. The model using the logistic function appears to be a good compromise candidate since it satisfies all of our initial requirements, the function has adequate p-value for all parameters, and no significant underestimation of final number of cases.
After weighing all the above, the logistic function seems to be the most successful at describing the first year's incidence of COVID-19 in Croatia. As this estimate was made for data up to the 52nd week of the pandemic, it can be interpreted as the estimate of the final number of identified patients for the first two waves of the pandemic in Croatia.
4. Conclusion All three generated models provide accurate adequate estimation of incidence curve with high coefficients of determination. The model based on the logistic function provides the best fit to available data and so represents out choice for modeling the incidence of COVID-19 cases during the first year of the pandemic in Croatia.
While no model can give the answers to ending the pandemic, this approach can provide a simple prognostic tool to evaluate future interventions and estimate disease spread. Applying this methodology to following pandemic waves could help with prediction and decision-making on both country-wide and local scales, providing insights into acquired immunity, vaccination, and help planners anticipate health system utilization.
Literature 1. Aviv-Sharon E, Asaph Aharoni E. Generalized logistic growth modeling of the
COVID-19 pandemic in Asia. Infectious Disease Modelling 2020(5):502-509. https://doi.org/10.1016/j.idm.2020.07.003.
2. Bertolaccini L, Spaggiari L. The hearth of mathematical and statistical modelling during the Coronavirus pandemic. Interact CardioVasc Thorac Surg 2020; Published online 2020 Apr 9. doi:10.1093/icvts/ivaa076.
3. Bonita R. Basic epidemiology. 2nd edition..World Health Organization. 2006. https://apps.who.int/iris/bitstream/handle/10665/43541/9241547073_eng.pdf (Accessed: 18.04.2021.)
4. Bulut C, Kato Y. Epidemiology of COVID-19 Turk J Med Sci (2020) 50: p563-570 5. Chen TM, Rui T, Wang QP, Zhao ZY, Cui JA and Yin L. A mathematical model for
simulating the phase-based transmissibility of a novel coronavirus Chen et al. Infectious Diseases of Poverty (2020) 9: p24
48
Croatian Regional Development Journal | Vol. 2 No. 2 | 2021
6. Ferguson NM, Laydon D, Nedjati-Gilani G et al. Impact of non-pharmaceutical interventions (NPIs) to reduce COVID-19 mortality and healthcare demand. Imperial College London (16-03-2020), doi: https://doi.org/10.25561/77482.
7. Hellewell J, Abbott S, Gimma A, Bosse NI, et al. Centre for the Mathematical Modelling of Infectious Diseases COVID-19 Working Group. Feasibility of controlling COVID-19 outbreaks by isolation of cases and contacts. Lancet Glob Health 2020; 8: e488–96
8. Hsieh, Ying-Hen. (2009). Richards Model: A Simple Procedure for Real-time Prediction of Outbreak Severity. Modeling and Dynamics of Infectious Diseases Series in Contemporary Applied Mathematics (CAM). 11. 10.1142/9789814261265_0009.
9. Kanji, JN, Zelyas N, MacDonald C et al. False negative rate of COVID-19 PCR testing: a discordant testing analysis. Virol J 18, p 13 (2021). https://doi.org/10.1186/s12985-021-01489-0
10. Kim S, Seo YB, Jung E. Prediction of COVID-19 transmission dynamics using a mathematical model considering behavior changes in Korea. Epidemiology and Health 2020; 42: e2020026. https://doi.org/10.4178/epih.e2020026
11. Kretzschmar M, Wallinga J. (2009). Mathematical Models in Infectious Disease Epidemiology. Modern Infectious Disease Epidemiology: Concepts, Methods, Mathematical Models, and Public Health, 209–221. https://doi.org/10.1007/978-0-387-93835-6_12
12. Kucharski AJ, Russell TW, Diamond C, Liu Y et al. Centre for Mathematical Modelling of Infectious Diseases COVID-19 working group. Early dynamics of transmission and control of COVID-19: a mathematical modelling study Lancet Infect Dis 2020; 20: 553–58
13. Lee, Se Yoon; Lei, Bowen; Mallick, Bani (2020). "Estimation of COVID-19 spread curves integrating global data and borrowing information". PLOS ONE. 15 (7): e0236860. doi:10.1371/journal.pone.0236860.
14. Magner LN. (2009). A History of Infectious Diseases and the Microbial World. ABC-CLIO. (2009) Praeger
15. Mandal S, Bhatnagar T, Arinaminpathy N, Agarwal A et el. Prudent public health intervention strategies to control the coronavirus disease 2019 transmission in India: A mathematical model-based approach. Indian J Med Res 151, February & March 2020, pp 190-199. doi:10.4103/ijmr.IJMR_504_20
16. Miquel P (2014). A Dictionary of Epidemiology (6th ed.). New York: Oxford University Press. ISBN 978-0-19-997673-7.
17. Motulsky HJ, Christopoulos A. (2003). Fitting models to biological data using linear and nonlinear regression: a practical guide to curve fitting. USA: Oxford University Press.
49
Croatian Regional Development Journal | Vol. 2 No. 2 | 2021
18. Nogrady B. What the data say about asymptomatic COVID infections. Nature 587, 534-535 (2020) doi: https://doi.org/10.1038/d41586-020-03141-3
19. Panovska-Griffiths J. Can mathematical modelling solve the current Covid-19 crisis? BMC Public Health (2020) 20 p551. https://doi.org/10.1186/s12889-020-08671-z
20. Peirlinck M, Linka K, Costabal FS, Kuhl E. Outbreak dynamics of COVID‐19 in China and the United States. Biomechanics and Modeling in Mechanobiology 2020 Dec;19(6) pp2179-2193, https://doi.org/10.1007/s10237-020-01332-5.
21. Puc M, Wolski T. Forecasting of the selected features of Poaceae (R. Br.) Barnh., Artemisia L. and Ambrosia L. pollen season in Szczecin, north-western Poland, using Gumbel’s distribution. Annals of Agricultural and Environmental Medicine 2013, Vol 20, No 1, pp64-70
22. Wang, X. S., Wu, J., & Yang, Y. (2012). Richards model revisited: validation by and application to infection dynamics. Journal of theoretical biology, 313, 12–19. https://doi.org/10.1016/j.jtbi.2012.07.024
23. Zhang S, Diao MY, Yu W, Pei L, Lin Z, Chen D. Estimation of the reproductive number of novel coronavirus (COVID-19) and the probable outbreak size on the Diamond Princess cruise ship: A data-driven analysis International Journal of Infectious Diseases 93 (2020) pp201–204
About the authors Ivan Kovač, Ph.D. is an Associate Professor at the Geotechnical Faculty of the University of Zagreb where he has been teaching Applied Statistics, Geostatistics in Environmental Engineering, Environmental Risk Assessment and Environmental Modelling. He received a PhD in the field of technical sciences at the Faculty of Mining, Geology and Petroleum Engineering, University of Zagreb. His research interests are in the field of Environmental engineering - application of statistical and geostatistical methods in environmental engineering, especially in monitoring, analysis and modelling of groundwater quality. The author can be contacted at [email protected]
Edgar Glavaš MD, is a pediatric cardiologist mainly working at the Čakovec County hospital pediatric ward. His interests include biomedical statistics, medical education, and teaching computer programming to children. The author can be contacted at [email protected].
Tibor Rodiger is a senior lecturer at the Polytechnic of Međimurje in Čakovec. He received a Master's degree in the field of Mathematics at the Faculty of Science, University of Zagreb. He has been teaching Mathematics, Methodics of Teaching Mathematics, Mathematics for Economics, Probability and Statistics, Fundamentals of Statistics, Applied Statistics and Quantitative Methods. The author can be contacted at [email protected]