Embed Size (px)
Citation preview
Bucharest, October 29th, 2016
The first Romanian privatization through
the capital market
A success story
The IPO was structured as a capital increase of 105% of existing capital, with
proceeds to be invested especially in the refurbishment and development of the
distribution network
• First IPO where the Romanian State loses majority ownership
• The largest Romanian ECM transaction to date
The structure of the transaction and the clear equity story of Electrica attracted
great demand from both local and international institutional investors, enabling
the transaction to be oversubscribed more than 2 times
• The dual listing through GDRs in London permitted international institutional
investors to participate in the offering and gain access to the Romanian
Capital Market
• EBRD placed a significant order in the book on top of signing with Electrica a
Framework Agreement aiming at implementing a corporate governance
action plan
• The IPO structure included a clawback option in order to reallocate a part of
the institutional tranche to retail tranche in case of strong demand from these
investors
2
IPO Transaction highlights
*Base 100 as of 11/06/2014
Source: Bloomberg as of 26/06, Electrica, SG Syndicate, exchange rate EUR/RON of 4.3895 (spot, Bloomberg as of 27/06/2014)
2
Offering structure
Base offering (# of shares) 177,188,744
In % of existing capital 105.00%
Primary shares (% of offering) 100.00%
Brownshoe (# of shares) 8,420,000
Retail offering (%) 21.00%
Place of listing Bucharest / London (GDRs)
Ratio of GDRs 1 GDR / 4 shares
Pricing & Sizing
Initial price range RON 11.0 - RON 13.5
Final price RON 11.00
Deal Size (EURm) 444.00
Market capitalization (EURm) 866.90
Free float (pre-stabiliisation) 51.20%
Timetable
Announcement 30 May 2014
Bookbuilding 12 June - 24 June 2014
Pricing date 27 June 2014
First trade date 04 July 2014
Syndicate Structure
Global Coordinators and Joint Bookrunners Citi, Raiffeisen, SG CIB
Local manager BRD - Groupe SG
Context
of the
transaction
Strong demand from institutional
investors, with covered book message
delivered to the market 2 days prior end
of bookbuilding
Strong international demand with
Romanian institutions representing only
25% of the demand and GDRs
representing 20% of the overall final
allocation
Retail tranche oversubscribed more
than six times, leading the company to
use the clawback option to increase
the size of the retail tranche from
15% to 21%
Success
of the
placement
DEMAND BY INVESTOR PROFILE
Retail21%
Institutional79%
DEMAND BY COUNTRY
Romania25%
UK23%
Poland17%
US13%
RoW22%
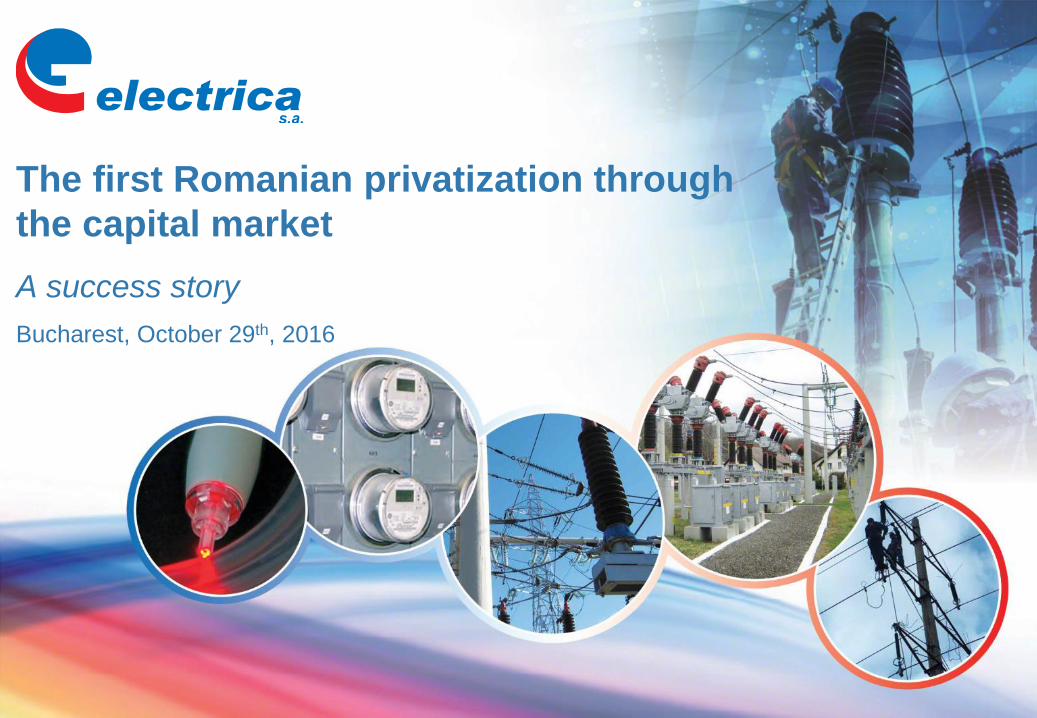
EDTN
EDTS
EDMN
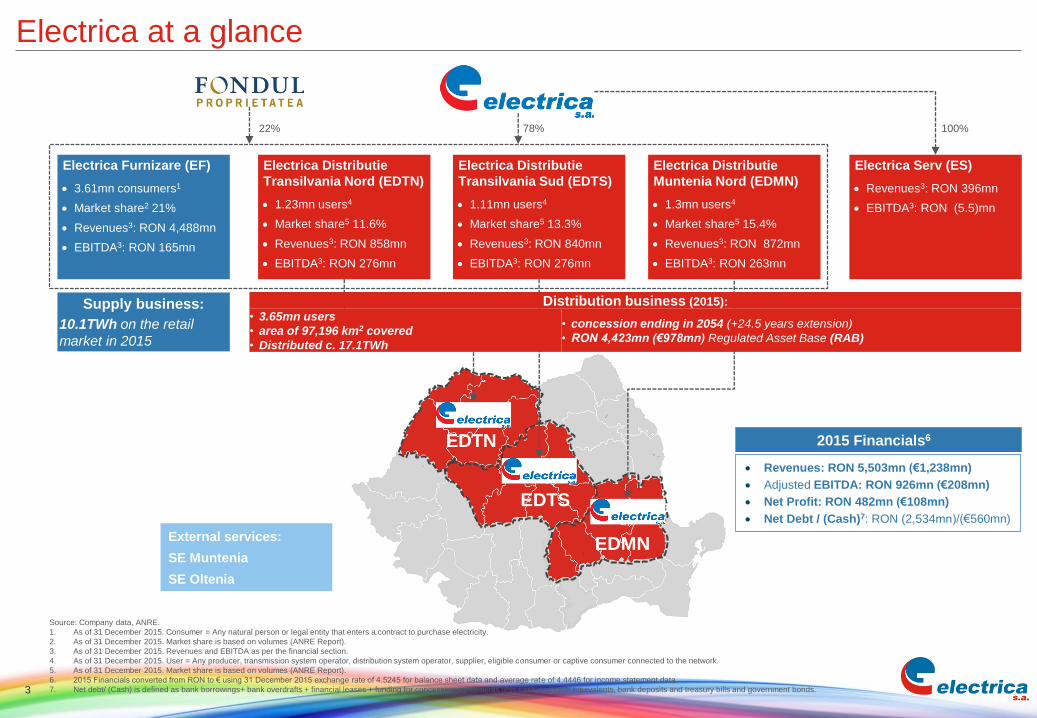
Electrica at a glance
Electrica Distributie
Transilvania Nord (EDTN)
1.23mn users4
Market share5 11.6%
Revenues3: RON 858mn
EBITDA3: RON 276mn
Electrica Distributie
Transilvania Sud (EDTS)
1.11mn users4
Market share5 13.3%
Revenues3: RON 840mn
EBITDA3: RON 276mn
Electrica Distributie
Muntenia Nord (EDMN)
1.3mn users4
Market share5 15.4%
Revenues3: RON 872mn
EBITDA3: RON 263mn
Electrica Furnizare (EF)
3.61mn consumers1
Market share2 21%
Revenues3: RON 4,488mn
EBITDA3: RON 165mn
Electrica Serv (ES)
Revenues3: RON 396mn
EBITDA3: RON (5.5)mn
78% 100%22%
Supply business:
10.1TWh on the retail
market in 2015
3
External services:
SE Muntenia
SE Oltenia
Distribution business (2015):
• 3.65mn users
• area of 97,196 km2 covered
• Distributed c. 17.1TWh
• concession ending in 2054 (+24.5 years extension)
• RON 4,423mn (€978mn) Regulated Asset Base (RAB)
Revenues: RON 5,503mn (€1,238mn)
Adjusted EBITDA: RON 926mn (€208mn)
Net Profit: RON 482mn (€108mn)
Net Debt / (Cash)7: RON (2,534mn)/(€560mn)
2015 Financials6
Source: Company data, ANRE.
1. As of 31 December 2015. Consumer = Any natural person or legal entity that enters a contract to purchase electricity.
2. As of 31 December 2015. Market share is based on volumes (ANRE Report).
3. As of 31 December 2015. Revenues and EBITDA as per the financial section.
4. As of 31 December 2015. User = Any producer, transmission system operator, distribution system operator, supplier, eligible consumer or captive consumer connected to the network.
5. As of 31 December 2015. Market share is based on volumes (ANRE Report).
6. 2015 Financials converted from RON to € using 31 December 2015 exchange rate of 4.5245 for balance sheet data and average rate of 4.4446 for income statement data.
7. Net debt/ (Cash) is defined as bank borrowings+ bank overdrafts + financial leases + funding for concession agreements less cash and cash equivalents, bank deposits and treasury bills and government bonds.
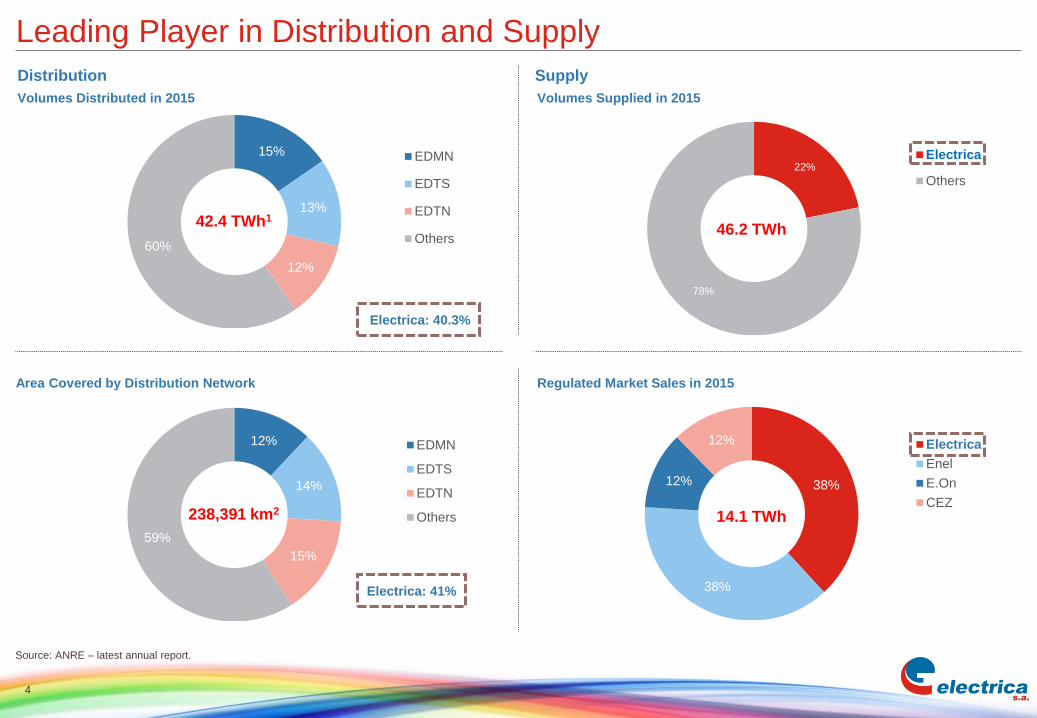
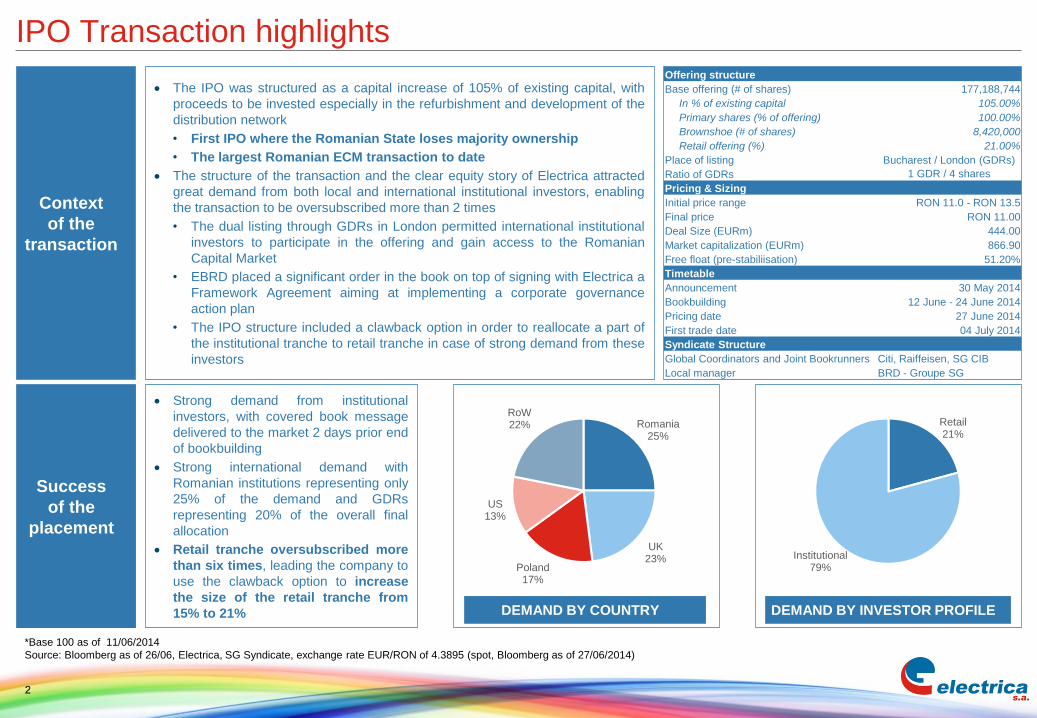
15%
13%
12%
60%
EDMN
EDTS
EDTN
Others
Volumes Distributed in 2015 Volumes Supplied in 2015
Regulated Market Sales in 2015Area Covered by Distribution Network
Distribution Supply
Leading Player in Distribution and Supply
Electrica: 40.3%
42.4 TWh1
Source: ANRE – latest annual report.
22%
78%
Electrica
Others
46.2 TWh
12%
14%
15%
59%
EDMN
EDTS
EDTN
Others238,391 km2
38%
38%
12%
12% Electrica
Enel
E.On
CEZ14.1 TWh
Electrica: 41%
4
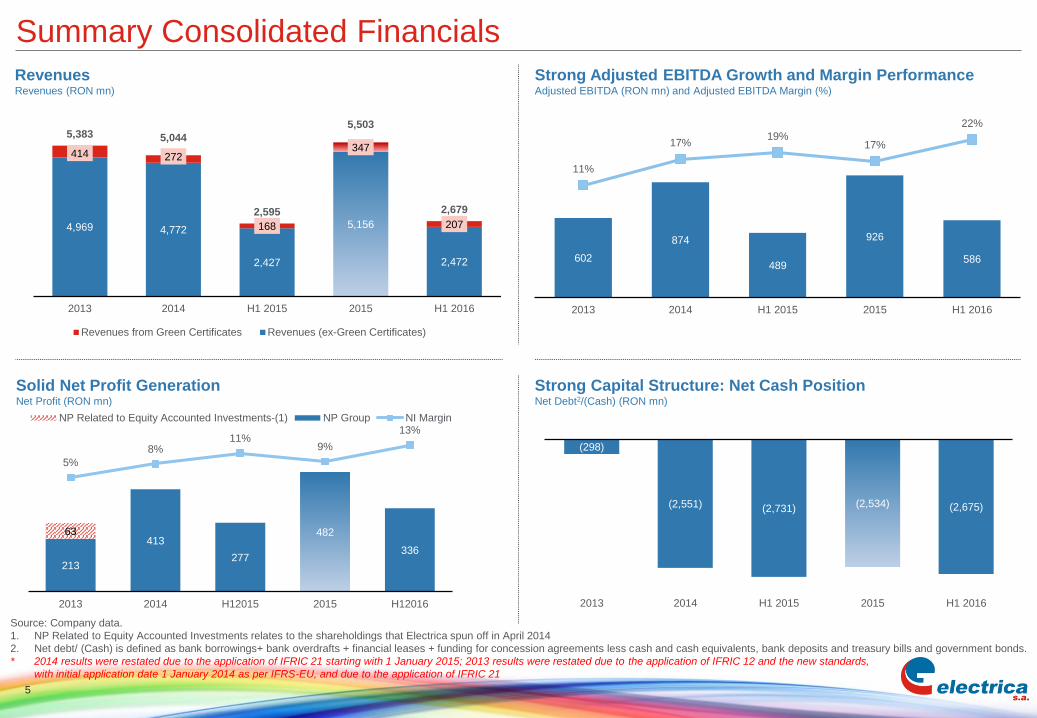
Summary Consolidated Financials
Strong Capital Structure: Net Cash PositionNet Debt2/(Cash) (RON mn)
Solid Net Profit GenerationNet Profit (RON mn)
RevenuesRevenues (RON mn)
Strong Adjusted EBITDA Growth and Margin PerformanceAdjusted EBITDA (RON mn) and Adjusted EBITDA Margin (%)
4,969 4,772
2,427
5,156
2,472
414 272
168
347
207
5,383 5,044
2,595
5,503
2,679
2013 2014 H1 2015 2015 H1 2016
Revenues from Green Certificates Revenues (ex-Green Certificates)
5
(298)
(2,551) (2,731) (2,534) (2,675)
2013 2014 H1 2015 2015 H1 2016
602
874
489
926
586
11%
17%19%
17%
22%
2013 2014 H1 2015 2015 H1 2016
213
413
277
482
336
63
5%
8%11%
9%
13%
2013 2014 H12015 2015 H12016
NP Related to Equity Accounted Investments-(1) NP Group NI Margin
Source: Company data.
1. NP Related to Equity Accounted Investments relates to the shareholdings that Electrica spun off in April 2014
2. Net debt/ (Cash) is defined as bank borrowings+ bank overdrafts + financial leases + funding for concession agreements less cash and cash equivalents, bank deposits and treasury bills and government bonds.
* 2014 results were restated due to the application of IFRIC 21 starting with 1 January 2015; 2013 results were restated due to the application of IFRIC 12 and the new standards,
with initial application date 1 January 2014 as per IFRS-EU, and due to the application of IFRIC 21
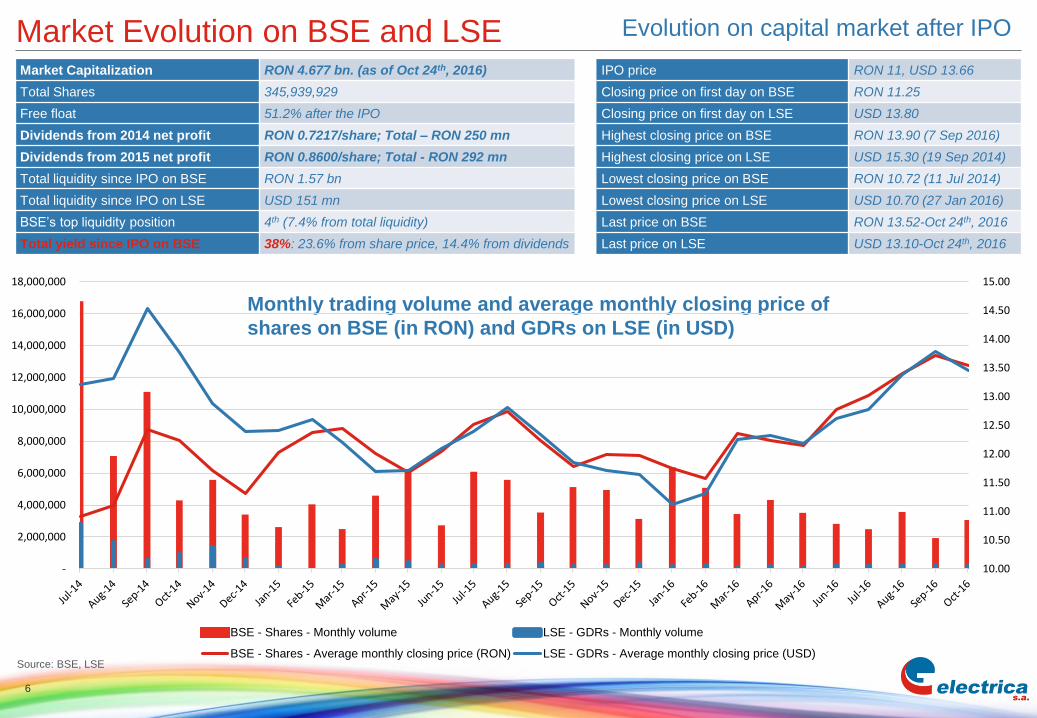
Source: BSE, LSE
Market Evolution on BSE and LSE
6
Monthly trading volume and average monthly closing price of
shares on BSE (in RON) and GDRs on LSE (in USD)
Evolution on capital market after IPO
Market Capitalization RON 4.677 bn. (as of Oct 24th, 2016) IPO price RON 11, USD 13.66
Total Shares 345,939,929 Closing price on first day on BSE RON 11.25
Free float 51.2% after the IPO Closing price on first day on LSE USD 13.80
Dividends from 2014 net profit RON 0.7217/share; Total – RON 250 mn Highest closing price on BSE RON 13.90 (7 Sep 2016)
Dividends from 2015 net profit RON 0.8600/share; Total - RON 292 mn Highest closing price on LSE USD 15.30 (19 Sep 2014)
Total liquidity since IPO on BSE RON 1.57 bn Lowest closing price on BSE RON 10.72 (11 Jul 2014)
Total liquidity since IPO on LSE USD 151 mn Lowest closing price on LSE USD 10.70 (27 Jan 2016)
BSE’s top liquidity position 4th (7.4% from total liquidity) Last price on BSE RON 13.52-Oct 24th, 2016
Total yield since IPO on BSE 38%: 23.6% from share price, 14.4% from dividends Last price on LSE USD 13.10-Oct 24th, 2016
10.00
10.50
11.00
11.50
12.00
12.50
13.00
13.50
14.00
14.50
15.00
-
2,000,000
4,000,000
6,000,000
8,000,000
10,000,000
12,000,000
14,000,000
16,000,000
18,000,000
BSE - Shares - Monthly volume LSE - GDRs - Monthly volume
BSE - Shares - Average monthly closing price (RON) LSE - GDRs - Average monthly closing price (USD)
Source: Company data; BSE
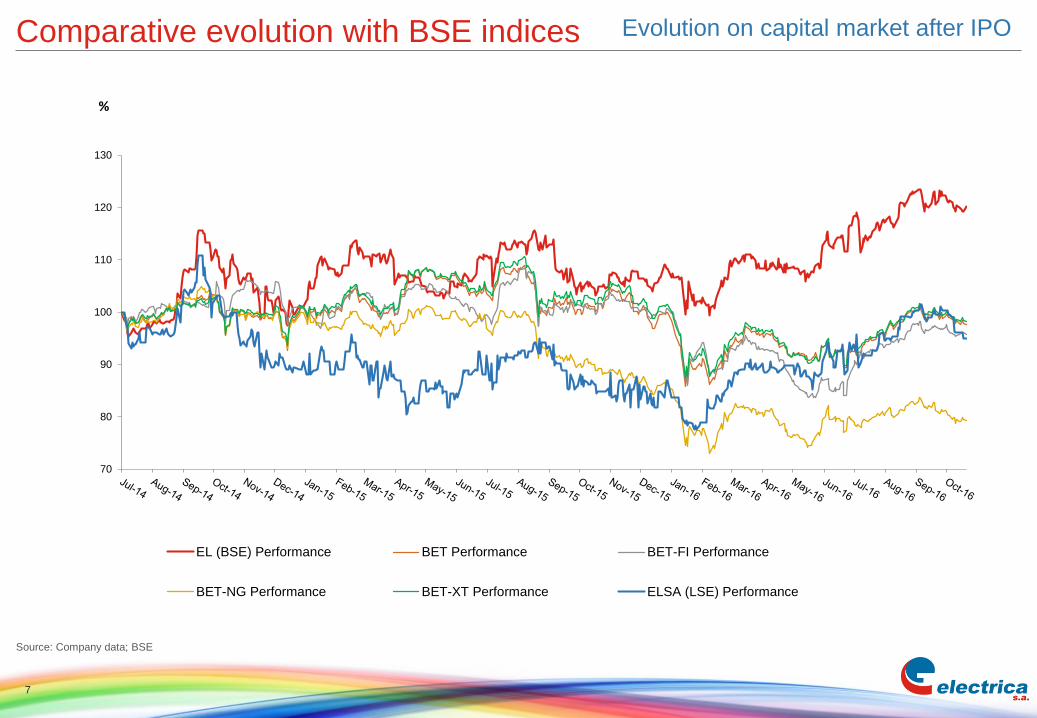
Comparative evolution with BSE indices
7
Evolution on capital market after IPO
70
80
90
100
110
120
130
EL (BSE) Performance BET Performance BET-FI Performance
BET-NG Performance BET-XT Performance ELSA (LSE) Performance
%
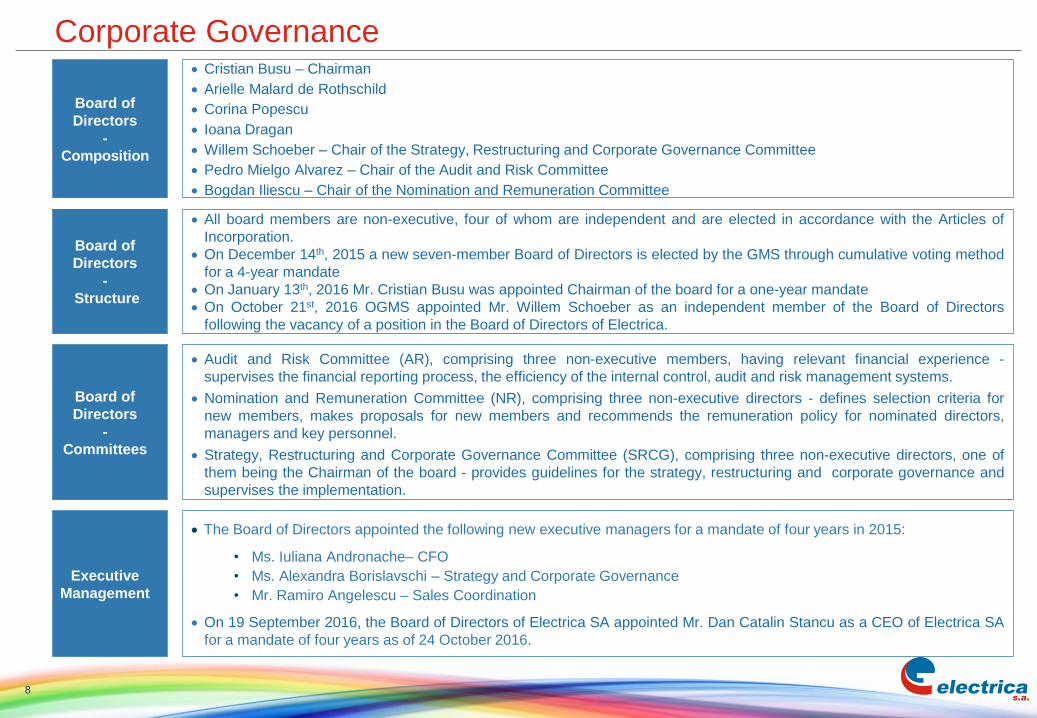
Corporate Governance
Board of
Directors
-
Structure
Board of
Directors
-
Committees
All board members are non-executive, four of whom are independent and are elected in accordance with the Articles of
Incorporation.
On December 14th, 2015 a new seven-member Board of Directors is elected by the GMS through cumulative voting method
for a 4-year mandate
On January 13th, 2016 Mr. Cristian Busu was appointed Chairman of the board for a one-year mandate
On October 21st, 2016 OGMS appointed Mr. Willem Schoeber as an independent member of the Board of Directors
following the vacancy of a position in the Board of Directors of Electrica.
Audit and Risk Committee (AR), comprising three non-executive members, having relevant financial experience -
supervises the financial reporting process, the efficiency of the internal control, audit and risk management systems.
Nomination and Remuneration Committee (NR), comprising three non-executive directors - defines selection criteria for
new members, makes proposals for new members and recommends the remuneration policy for nominated directors,
managers and key personnel.
Strategy, Restructuring and Corporate Governance Committee (SRCG), comprising three non-executive directors, one of
them being the Chairman of the board - provides guidelines for the strategy, restructuring and corporate governance and
supervises the implementation.
8
Board of
Directors
-
Composition
Cristian Busu – Chairman
Arielle Malard de Rothschild
Corina Popescu
Ioana Dragan
Willem Schoeber – Chair of the Strategy, Restructuring and Corporate Governance Committee
Pedro Mielgo Alvarez – Chair of the Audit and Risk Committee
Bogdan Iliescu – Chair of the Nomination and Remuneration Committee
The Board of Directors appointed the following new executive managers for a mandate of four years in 2015:
• Ms. Iuliana Andronache– CFO
• Ms. Alexandra Borislavschi – Strategy and Corporate Governance
• Mr. Ramiro Angelescu – Sales Coordination
On 19 September 2016, the Board of Directors of Electrica SA appointed Mr. Dan Catalin Stancu as a CEO of Electrica SA
for a mandate of four years as of 24 October 2016.
Executive
Management
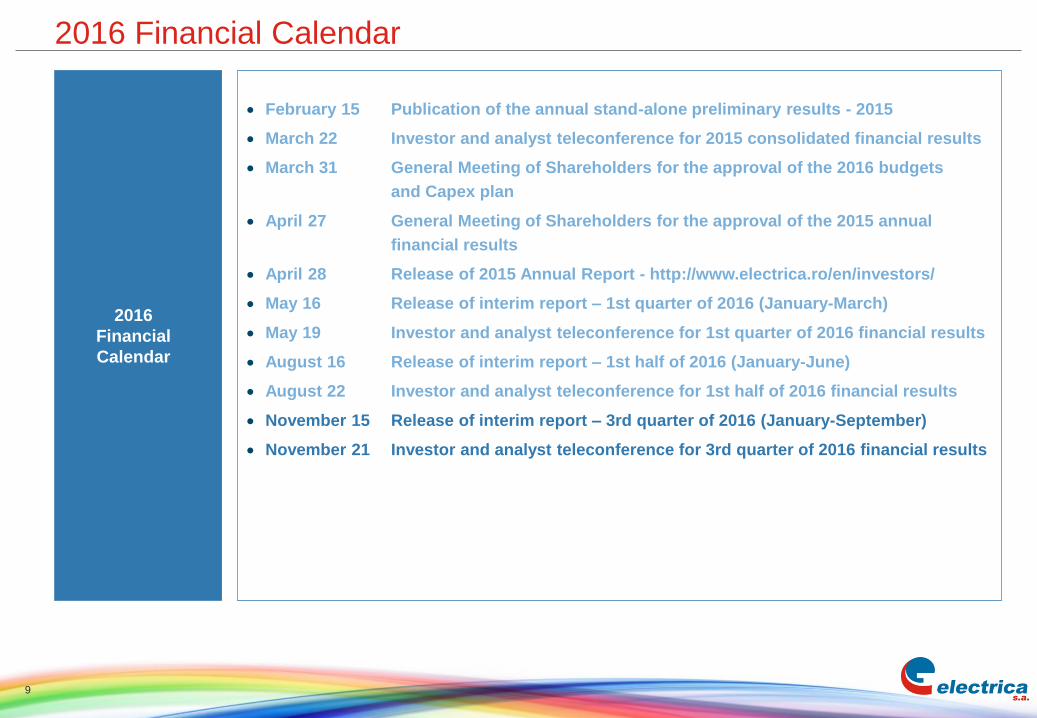
2016 Financial Calendar
February 15 Publication of the annual stand-alone preliminary results - 2015
March 22 Investor and analyst teleconference for 2015 consolidated financial results
March 31 General Meeting of Shareholders for the approval of the 2016 budgets
and Capex plan
April 27 General Meeting of Shareholders for the approval of the 2015 annual
financial results
April 28 Release of 2015 Annual Report - http://www.electrica.ro/en/investors/
May 16 Release of interim report – 1st quarter of 2016 (January-March)
May 19 Investor and analyst teleconference for 1st quarter of 2016 financial results
August 16 Release of interim report – 1st half of 2016 (January-June)
August 22 Investor and analyst teleconference for 1st half of 2016 financial results
November 15 Release of interim report – 3rd quarter of 2016 (January-September)
November 21 Investor and analyst teleconference for 3rd quarter of 2016 financial results
2016
Financial
Calendar
9