Embed Size (px)
Citation preview
percorsi
The firsT lighT of The Universefifty years of discoveries and new frontiers
Aniello MennellA1, PAolo nAtoli2
1Dipartimento di Fisica, Università di Milano, Milano, Italy2Dipartimento di Fisica e Scienze della Terra, Università di Ferrara, Ferrara, Italy
1 IntroductionThe subject of modern cosmology is the structure and evolution of the universe. More broadly,
its main objective is to provide us with science-grade answers to very old questions: how old and large is the universe? What is it made of? What is its fate? Such questions have accompanied human culture through history, yet only in recent times they started to receive quantitative answers, which are coming in with significant delay with respect to other fields of science. One may well wonder why. After all, the conceptual tools to do cosmology are not different from those used in other branches of physics, and the scientific revolution itself was built around “cosmological” arguments, Copernicus’ new system and Galilei’s telescope being just the two most famous examples. From a historical perspective, the delay can be wholly ascribed to the scarcity of good-quality data: cosmology is an observational rather than experimental science and precision observations over cosmological distances were simply not available until the first half of the XX century, with the first large telescopes for extragalactic astronomy. Still, the bulk of observations remained in the optical band. One has to wait until after the Second World War to witness the steady growth of radio astronomy. Its most remarkable success for cosmology is undoubtedly the discovery of the cosmic microwave background radiation in 1964. As many know, it was a serendipitous event. Perhaps, less people know that it was a largely expected serendipitous event.
2 Light from the blackSometimes changes are slow, but sometimes one can mark the exact date and time of sudden,
revolutionary changes.On May 20, 1964, at 11:15 at the Holmdel Bell Labs in New Jersey, Arno Penzias and Robert Wilson
did not know that they had marked on paper the beginning of a new era for cosmology. They did not know they had captured for the first time the photons of the first light in the universe.
Cosmology was still a small island in the sea of astronomy at the time. Despite the fact that
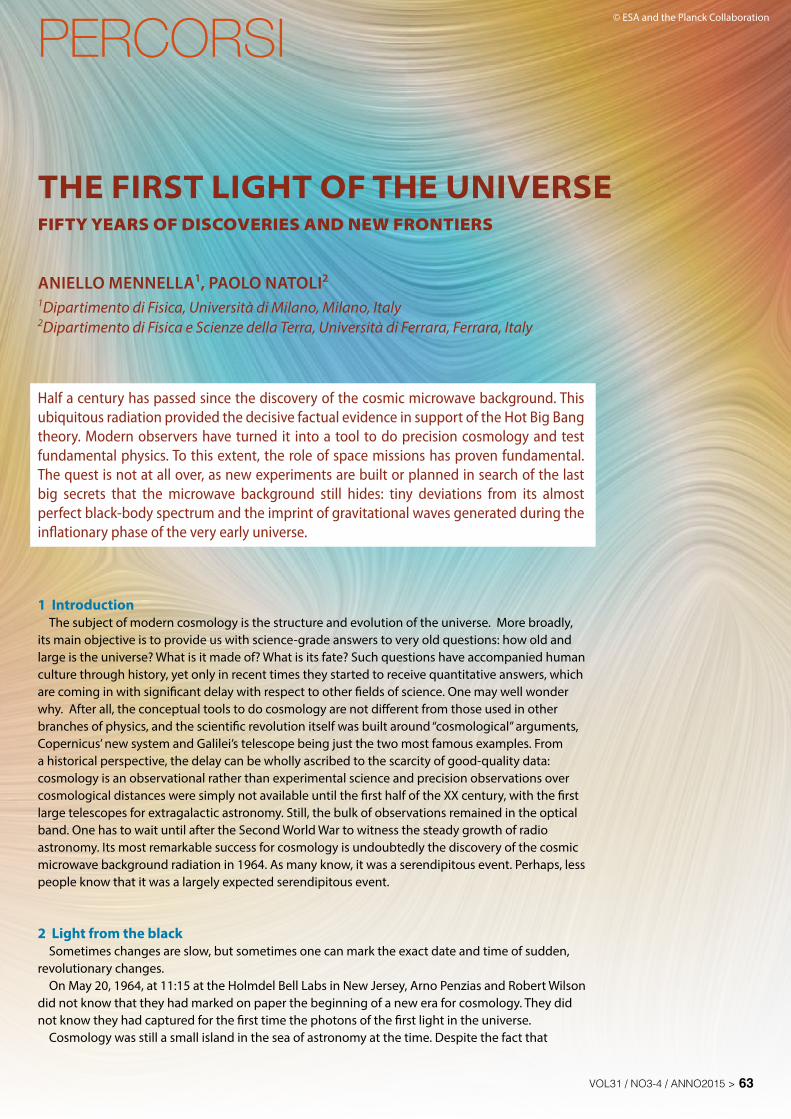
Half a century has passed since the discovery of the cosmic microwave background. This ubiquitous radiation provided the decisive factual evidence in support of the Hot big bang theory. Modern observers have turned it into a tool to do precision cosmology and test fundamental physics. To this extent, the role of space missions has proven fundamental. The quest is not at all over, as new experiments are built or planned in search of the last big secrets that the microwave background still hides: tiny deviations from its almost perfect black-body spectrum and the imprint of gravitational waves generated during the inflationary phase of the very early universe.
vol31 / no3-4 / anno2015 > 63
© ESA and the Planck Collaboration
64 < il nuovo saggiatore
percorsi
Hubble’s 1923 discovery of apparently receding galaxies had revolutionized our view of the universe, only few scientists were building their careers chasing a theory that was still poorly constrained by experimental data.
Indeed, the idea of a universe that evolves, that has a “history”, was difficult to cope with. Even Einstein failed to recognize this fact in his own equations of general relativity, in 1915, up to the point he forced in a cosmological constant to make them consistent with the general prejudice of a static universe. He recognized his mistake (“the biggest of my life”, as he defined it) only in front of Hubble’s data, eight years later.
A few far-sighted pioneers, however, could see through the fog and understand the great potential of this revolution. In the twenties the young Russian physicist Alexander Friedmann and the Belgian priest Georges Henry Lemaitre challenged Einstein’s skepticism and proposed solutions to his equations without the cosmological constant, highlighting various scenarios for the evolution of the universe. With a set of simple differential equations derived from general relativity, Friedmann showed that the universe could expand and then collapse, or expand forever depending on its total energy density. Lemaitre and later Gamow went beyond the geometrical description and studied the physical mechanisms acting in the early, hot and compressed universe.
The first of April 1948 Alpher, Bethe and Gamow published a short letter to “Physical Review” with a simple and forceful
title: “The origin of chemical elements” [1]. This paper would be known in the years to come as the αβγ paper, and Gamow himself admitted that the name of Bethe was added to the author list (with Bethe’s consent, of course) to honor the Greek alphabet (and, possibly, the three main nuclear decay processes identified with these letters) . The publishing date, the fool’s day of 1948, fit perfectly with the unconventional character of Gamow.
This paper laid the foundations of the primordial nucleosynthesis, the idea that the elements of the periodic table could have formed inside the primordial, expanding gas. The idea is simple and elegant. We start from a hot neutron gas that decays into protons, electrons, and neutrinos, which had not been discovered yet at the time. Then heavier elements form from a continuous build-up of protons and neutrons mediated by the decreasing temperature and density of the expanding universe, so that the various species “freeze out” from equilibrium at different times. Nowadays we know that only the lightest elements up to 7Li form during the first few minutes in the expanding plasma, while the heavier elements form much later, as a result of the thermonuclear processes in the stars and during supernova explosions.
The paper, however, missed an important point, that a bath of radiation thermalized the expanding gas. This was recognized later during that same, prolific year of 1948. Two papers by Gamow [2, 3] and then one by Alpher and
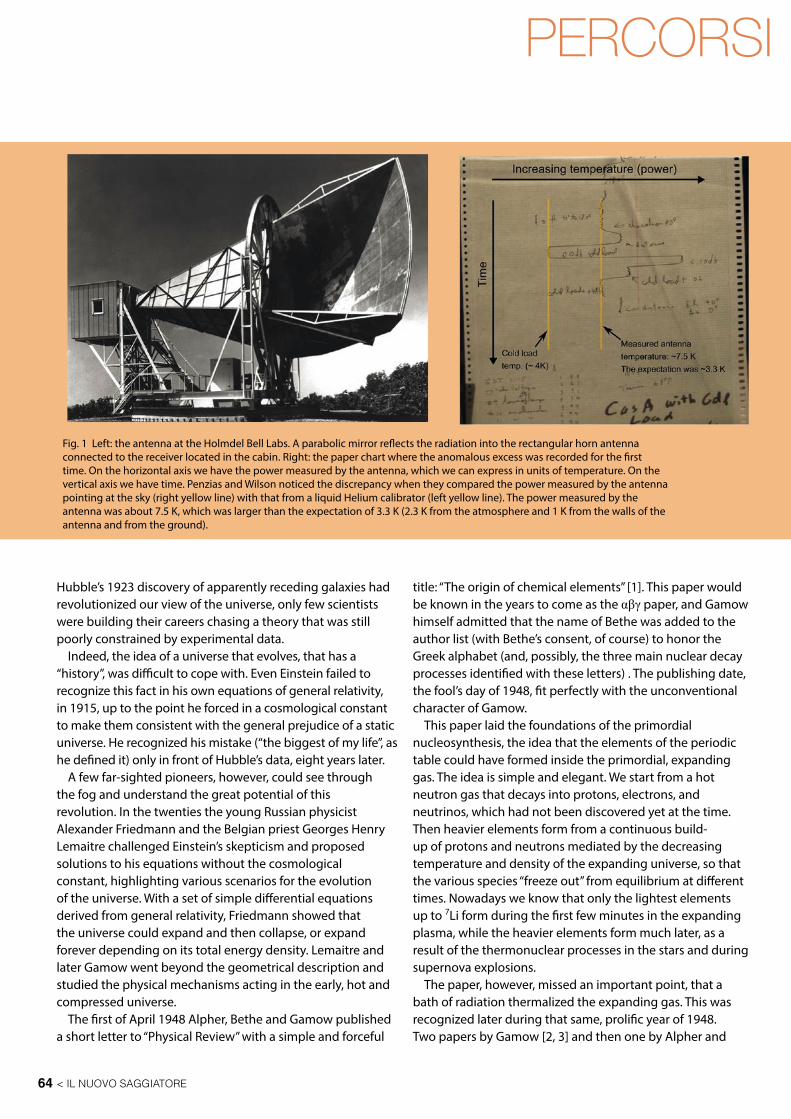
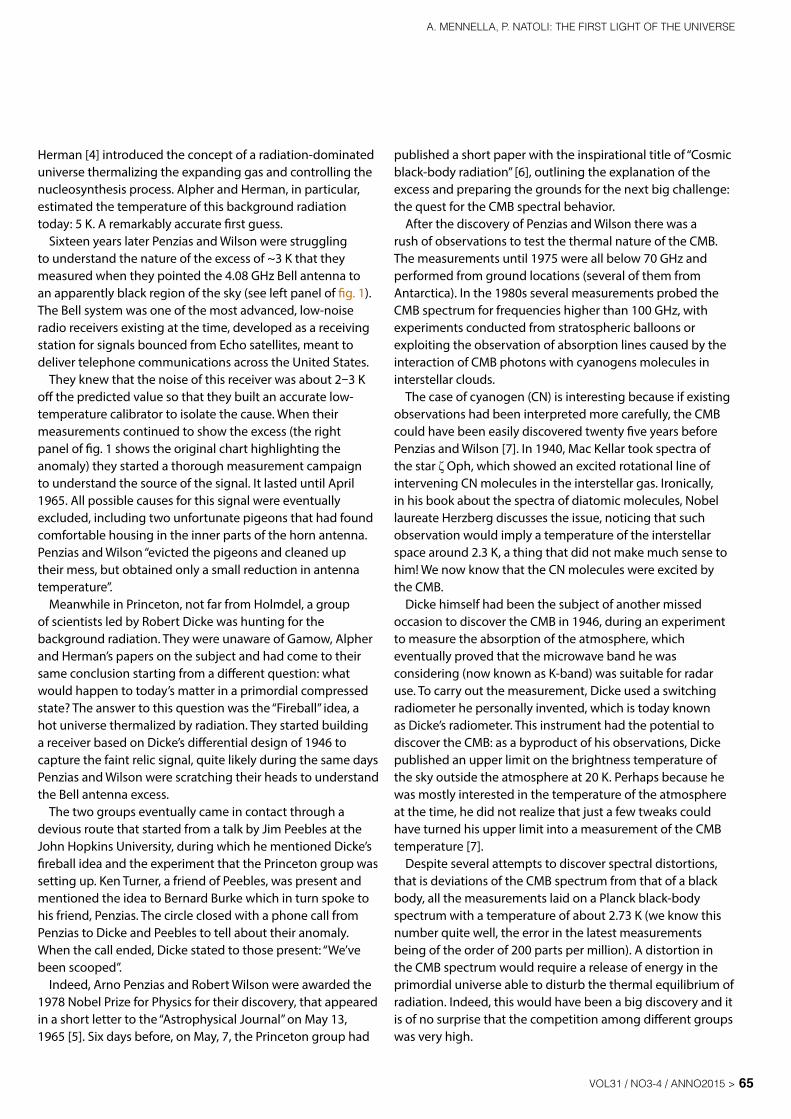
Fig. 1 Left: the antenna at the Holmdel Bell Labs. A parabolic mirror reflects the radiation into the rectangular horn antenna connected to the receiver located in the cabin. Right: the paper chart where the anomalous excess was recorded for the first time. On the horizontal axis we have the power measured by the antenna, which we can express in units of temperature. On the vertical axis we have time. Penzias and Wilson noticed the discrepancy when they compared the power measured by the antenna pointing at the sky (right yellow line) with that from a liquid Helium calibrator (left yellow line). The power measured by the antenna was about 7.5 K, which was larger than the expectation of 3.3 K (2.3 K from the atmosphere and 1 K from the walls of the antenna and from the ground).
65vol31 / no3-4 / anno2015 >
a. Mennella, P. natoli: the first light of the universe
Herman [4] introduced the concept of a radiation-dominated universe thermalizing the expanding gas and controlling the nucleosynthesis process. Alpher and Herman, in particular, estimated the temperature of this background radiation today: 5 K. A remarkably accurate first guess.
Sixteen years later Penzias and Wilson were struggling to understand the nature of the excess of ~3 K that they measured when they pointed the 4.08 GHz Bell antenna to an apparently black region of the sky (see left panel of fig. 1). The Bell system was one of the most advanced, low-noise radio receivers existing at the time, developed as a receiving station for signals bounced from Echo satellites, meant to deliver telephone communications across the United States.
They knew that the noise of this receiver was about 2–3 K off the predicted value so that they built an accurate low-temperature calibrator to isolate the cause. When their measurements continued to show the excess (the right panel of fig. 1 shows the original chart highlighting the anomaly) they started a thorough measurement campaign to understand the source of the signal. It lasted until April 1965. All possible causes for this signal were eventually excluded, including two unfortunate pigeons that had found comfortable housing in the inner parts of the horn antenna. Penzias and Wilson “evicted the pigeons and cleaned up their mess, but obtained only a small reduction in antenna temperature”.
Meanwhile in Princeton, not far from Holmdel, a group of scientists led by Robert Dicke was hunting for the background radiation. They were unaware of Gamow, Alpher and Herman’s papers on the subject and had come to their same conclusion starting from a different question: what would happen to today’s matter in a primordial compressed state? The answer to this question was the “Fireball” idea, a hot universe thermalized by radiation. They started building a receiver based on Dicke’s differential design of 1946 to capture the faint relic signal, quite likely during the same days Penzias and Wilson were scratching their heads to understand the Bell antenna excess.
The two groups eventually came in contact through a devious route that started from a talk by Jim Peebles at the John Hopkins University, during which he mentioned Dicke’s fireball idea and the experiment that the Princeton group was setting up. Ken Turner, a friend of Peebles, was present and mentioned the idea to Bernard Burke which in turn spoke to his friend, Penzias. The circle closed with a phone call from Penzias to Dicke and Peebles to tell about their anomaly. When the call ended, Dicke stated to those present: “We’ve been scooped”.
Indeed, Arno Penzias and Robert Wilson were awarded the 1978 Nobel Prize for Physics for their discovery, that appeared in a short letter to the “Astrophysical Journal” on May 13, 1965 [5]. Six days before, on May, 7, the Princeton group had
published a short paper with the inspirational title of “Cosmic black-body radiation” [6], outlining the explanation of the excess and preparing the grounds for the next big challenge: the quest for the CMB spectral behavior.
After the discovery of Penzias and Wilson there was a rush of observations to test the thermal nature of the CMB. The measurements until 1975 were all below 70 GHz and performed from ground locations (several of them from Antarctica). In the 1980s several measurements probed the CMB spectrum for frequencies higher than 100 GHz, with experiments conducted from stratospheric balloons or exploiting the observation of absorption lines caused by the interaction of CMB photons with cyanogens molecules in interstellar clouds.
The case of cyanogen (CN) is interesting because if existing observations had been interpreted more carefully, the CMB could have been easily discovered twenty five years before Penzias and Wilson [7]. In 1940, Mac Kellar took spectra of the star ζ Oph, which showed an excited rotational line of intervening CN molecules in the interstellar gas. Ironically, in his book about the spectra of diatomic molecules, Nobel laureate Herzberg discusses the issue, noticing that such observation would imply a temperature of the interstellar space around 2.3 K, a thing that did not make much sense to him! We now know that the CN molecules were excited by the CMB.
Dicke himself had been the subject of another missed occasion to discover the CMB in 1946, during an experiment to measure the absorption of the atmosphere, which eventually proved that the microwave band he was considering (now known as K-band) was suitable for radar use. To carry out the measurement, Dicke used a switching radiometer he personally invented, which is today known as Dicke’s radiometer. This instrument had the potential to discover the CMB: as a byproduct of his observations, Dicke published an upper limit on the brightness temperature of the sky outside the atmosphere at 20 K. Perhaps because he was mostly interested in the temperature of the atmosphere at the time, he did not realize that just a few tweaks could have turned his upper limit into a measurement of the CMB temperature [7].
Despite several attempts to discover spectral distortions, that is deviations of the CMB spectrum from that of a black body, all the measurements laid on a Planck black-body spectrum with a temperature of about 2.73 K (we know this number quite well, the error in the latest measurements being of the order of 200 parts per million). A distortion in the CMB spectrum would require a release of energy in the primordial universe able to disturb the thermal equilibrium of radiation. Indeed, this would have been a big discovery and it is of no surprise that the competition among different groups was very high.
percorsi
percorsi
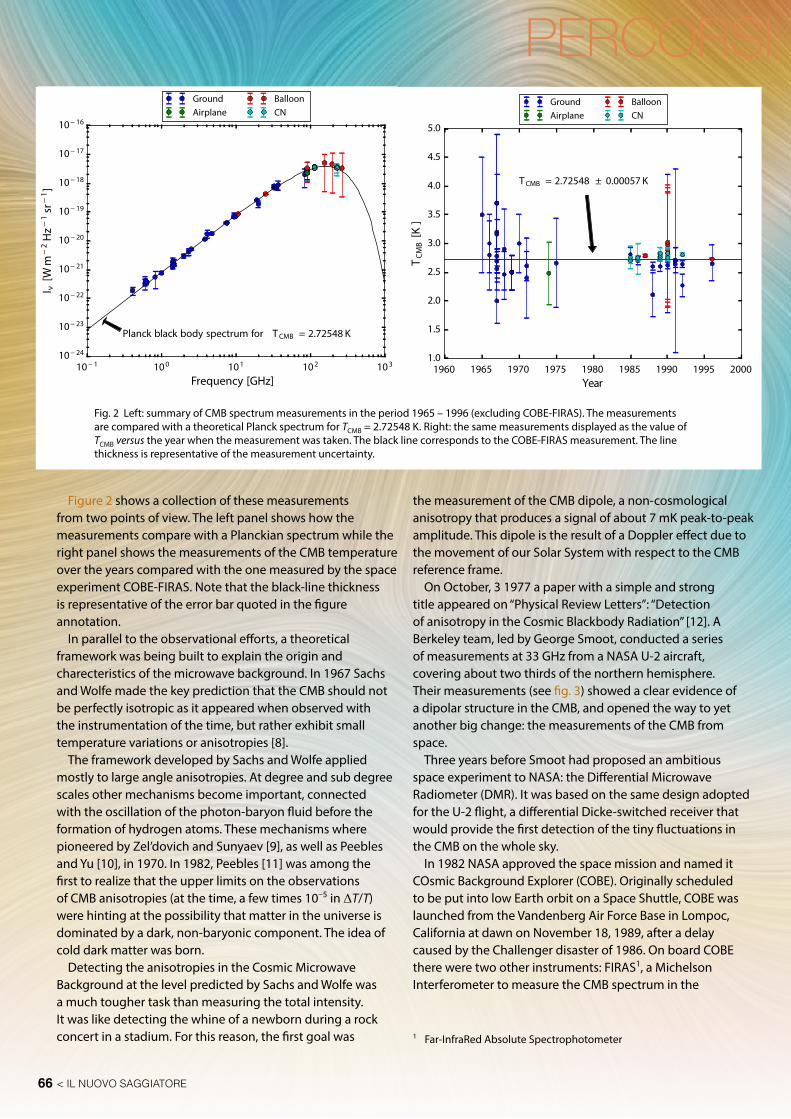
Figure 2 shows a collection of these measurements from two points of view. The left panel shows how the measurements compare with a Planckian spectrum while the right panel shows the measurements of the CMB temperature over the years compared with the one measured by the space experiment COBE-FIRAS. Note that the black-line thickness is representative of the error bar quoted in the figure annotation.
In parallel to the observational efforts, a theoretical framework was being built to explain the origin and charecteristics of the microwave background. In 1967 Sachs and Wolfe made the key prediction that the CMB should not be perfectly isotropic as it appeared when observed with the instrumentation of the time, but rather exhibit small temperature variations or anisotropies [8].
The framework developed by Sachs and Wolfe applied mostly to large angle anisotropies. At degree and sub degree scales other mechanisms become important, connected with the oscillation of the photon-baryon fluid before the formation of hydrogen atoms. These mechanisms where pioneered by Zel’dovich and Sunyaev [9], as well as Peebles and Yu [10], in 1970. In 1982, Peebles [11] was among the first to realize that the upper limits on the observations of CMB anisotropies (at the time, a few times 10–5 in ΔT/T) were hinting at the possibility that matter in the universe is dominated by a dark, non-baryonic component. The idea of cold dark matter was born.
Detecting the anisotropies in the Cosmic Microwave Background at the level predicted by Sachs and Wolfe was a much tougher task than measuring the total intensity. It was like detecting the whine of a newborn during a rock concert in a stadium. For this reason, the first goal was
the measurement of the CMB dipole, a non-cosmological anisotropy that produces a signal of about 7 mK peak-to-peak amplitude. This dipole is the result of a Doppler effect due to the movement of our Solar System with respect to the CMB reference frame.
On October, 3 1977 a paper with a simple and strong title appeared on “Physical Review Letters”: “Detection of anisotropy in the Cosmic Blackbody Radiation” [12]. A Berkeley team, led by George Smoot, conducted a series of measurements at 33 GHz from a NASA U-2 aircraft, covering about two thirds of the northern hemisphere. Their measurements (see fig. 3) showed a clear evidence of a dipolar structure in the CMB, and opened the way to yet another big change: the measurements of the CMB from space.
Three years before Smoot had proposed an ambitious space experiment to NASA: the Differential Microwave Radiometer (DMR). It was based on the same design adopted for the U-2 flight, a differential Dicke-switched receiver that would provide the first detection of the tiny fluctuations in the CMB on the whole sky.
In 1982 NASA approved the space mission and named it COsmic Background Explorer (COBE). Originally scheduled to be put into low Earth orbit on a Space Shuttle, COBE was launched from the Vandenberg Air Force Base in Lompoc, California at dawn on November 18, 1989, after a delay caused by the Challenger disaster of 1986. On board COBE there were two other instruments: FIRAS1, a Michelson Interferometer to measure the CMB spectrum in the
1 Far-InfraRed Absolute Spectrophotometer
Fig. 2 Left: summary of CMB spectrum measurements in the period 1965 – 1996 (excluding COBE-FIRAS). The measurements are compared with a theoretical Planck spectrum for TCMB = 2.72548 K. Right: the same measurements displayed as the value of TCMB versus the year when the measurement was taken. The black line corresponds to the COBE-FIRAS measurement. The line thickness is representative of the measurement uncertainty.
10− 1 100 101 102 103
Frequency [GHz]
10− 24
10− 23
10− 22
10− 21
10− 20
10− 19
10− 18
10− 17
10− 16
I ν[W
m−2Hz−
1sr
−1 ]
Planck black body spectrum for TCMB = 2.72548 K
GroundAirplane
BalloonCN
1960 1965 1970 1975 1980 1985 1990 1995 2000Year
1.0
1.5
2.0
2.5
3.0
3.5
4.0
4.5
5.0
TCM
B[K
]
TCMB = 2.72548 ± 0.00057 K
GroundAirplane
BalloonCN
66 < il nuovo saggiatore
a. Mennella, P. natoli: the first light of the universepercorsi
frequency range 60–600 GHz and DIRBE2, an infrared instrument to map the diffuse emission between 1.25 and 240 μm.
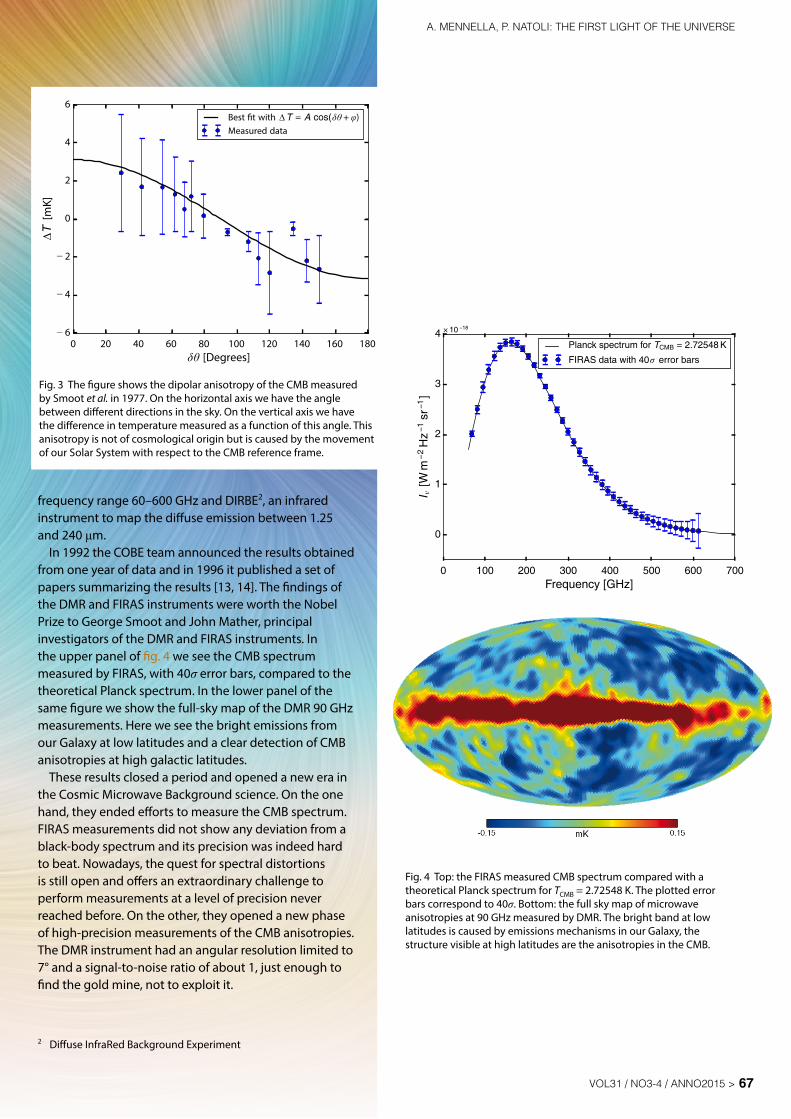
In 1992 the COBE team announced the results obtained from one year of data and in 1996 it published a set of papers summarizing the results [13, 14]. The findings of the DMR and FIRAS instruments were worth the Nobel Prize to George Smoot and John Mather, principal investigators of the DMR and FIRAS instruments. In the upper panel of fig. 4 we see the CMB spectrum measured by FIRAS, with 40σ error bars, compared to the theoretical Planck spectrum. In the lower panel of the same figure we show the full-sky map of the DMR 90 GHz measurements. Here we see the bright emissions from our Galaxy at low latitudes and a clear detection of CMB anisotropies at high galactic latitudes.
These results closed a period and opened a new era in the Cosmic Microwave Background science. On the one hand, they ended efforts to measure the CMB spectrum. FIRAS measurements did not show any deviation from a black-body spectrum and its precision was indeed hard to beat. Nowadays, the quest for spectral distortions is still open and offers an extraordinary challenge to perform measurements at a level of precision never reached before. On the other, they opened a new phase of high-precision measurements of the CMB anisotropies. The DMR instrument had an angular resolution limited to 7° and a signal-to-noise ratio of about 1, just enough to find the gold mine, not to exploit it.
2 Diffuse InfraRed Background Experiment
0 100 200 300 400 500 600 700Frequency [GHz]
0
1
2
3
4
I ν[W
m−
2H
z−1
sr−1
]
× 10 −18
Planck spectrum for TCMB = 2.72548 K
FIRAS data with 40σ error bars
Fig. 4 Top: the FIRAS measured CMB spectrum compared with a theoretical Planck spectrum for TCMB = 2.72548 K. The plotted error bars correspond to 40σ. Bottom: the full sky map of microwave anisotropies at 90 GHz measured by DMR. The bright band at low latitudes is caused by emissions mechanisms in our Galaxy, the structure visible at high latitudes are the anisotropies in the CMB.
vol31 / no3-4 / anno2015 > 67
Fig. 3 The figure shows the dipolar anisotropy of the CMB measured by Smoot et al. in 1977. On the horizontal axis we have the angle between different directions in the sky. On the vertical axis we have the difference in temperature measured as a function of this angle. This anisotropy is not of cosmological origin but is caused by the movement of our Solar System with respect to the CMB reference frame.
0 20 40 60 80 100 120 140 160 180δθ [Degrees]
− 6
− 4
− 2
0
2
4
6
∆T[m
K]
Best fit with ∆T = A cos(δθ + φ)Measured data
68 < il nuovo saggiatore
percorsi
3 The imprint of the baby universeThe CMB is a sea of photons that permeates the universe.
There are about 400 of these photons per cubic centimeters, which seem quite a lot, especially since the average density of baryons in the universe amounts to about four hydrogen atoms per cubic meter!
However, from the energetic point of view, the CMB amounts today only to about 0.005% of the total energy density of the universe. By comparison, ordinary baryons amount to 4.9%, and the remaining is divided between the elusive dark matter (26.5%) and the mysterious dark energy (68.6%). We will come back shortly to these dark components.
In the past, however, things were different, and the CMB was far more energetic than today: in a young enough universe, the CMB and other relativistic species where dominating the energy budget. The reason lies in the expanding nature of our universe: in the past, it was smaller and smaller, up to a state of infinite density, the Big Bang, a singularity that we can take as the origin of space and time. But not all species that make up the universe share the same behavior in terms of energy density. The energy density of non-relativistic particles just scales with the volume. For relativistic particles like the CMB photons, however, there is an extra factor other than the volume, namely the wavelength. In an expanding universe, the wavelength of photons, just like any other wavelength, is stretched by the expansion: this is why light that has traveled cosmological distances, such as the light reaching us from far away galaxies, is red-shifted.
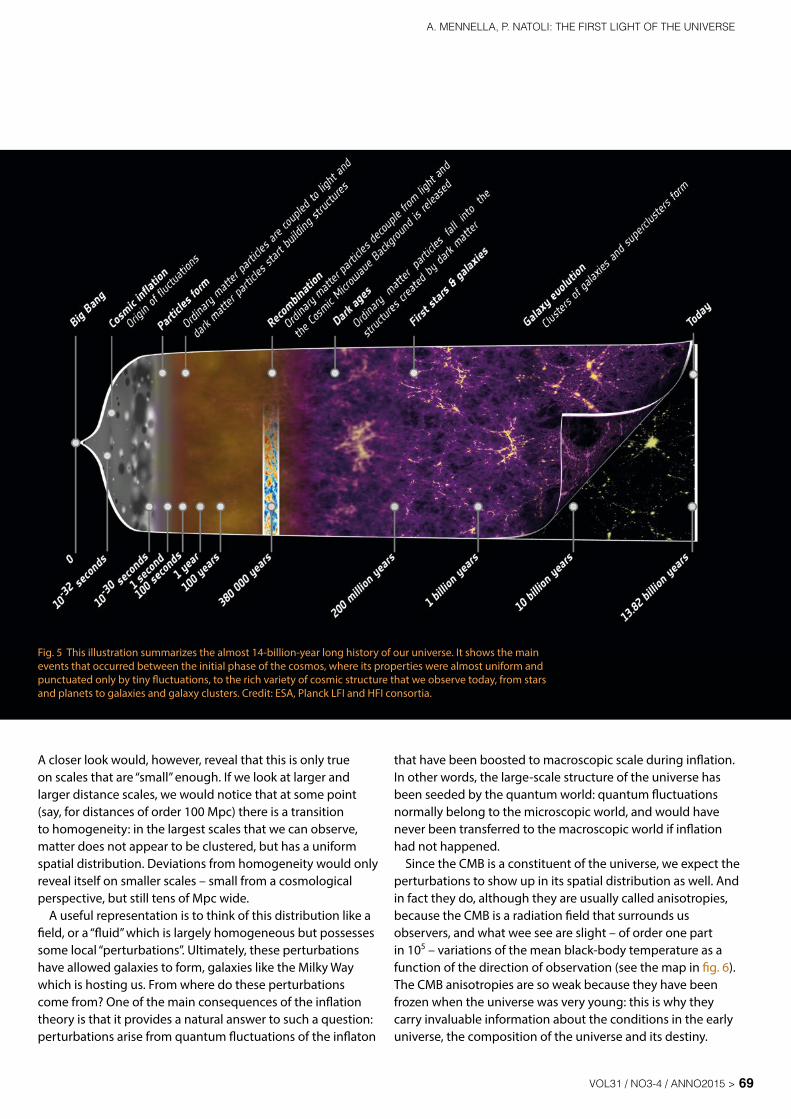
It was the observation of redshift in far galaxies by Edwin Hubble in 1929 that provided the critical clue to the expanding universe. The CMB is no exception and the wavelength of its photons was shorter in the past, and the radiation more energetic. In other words, the early universe was a hot place (hence the name Hot Big Bang model), so hot that ordinary matter could not exist as neutral atoms, but only in a state of plasma. A consequence is that the early universe was opaque to light propagation: photons were scattered by free charges in the plasma, and could not propagate freely: it is the same phenomenon that prevents one from looking through the Sun. At some point, however, the temperature dropped enough to allow atoms (mostly hydrogen) to form: the universe became transparent, since neutral atoms scatter light far less than ionized charges. This process happened about 380000 years after the Big Bang and is called recombination. After recombination, the great majority of the CMB photons could travel undisturbed without interacting with matter ever again, a journey that has lasted about 13.7 billion years.
In this sense, the CMB is the earliest light that we can observe, and conveys to us precious information about the early universe. Before recombination, the CMB was tightly
coupled to electrons, and in thermal equilibrium with matter, acquiring a black-body spectrum. This distribution has survived recombination and the subsequent decoupling of radiation and matter: we can still observe it intact today, albeit the temperature of the black-body spectrum has shifted from about 3000 K at decoupling to about 2.73 K nowadays: this corresponds to peak emission in the microwave range. Loosely speaking, the CMB provides us with an image of the universe at the epoch of hydrogen recombination: it is the earliest image of the universe one can observe since, as already noticed above, the plasma prevents us from looking any further. If we compare the present age of the universe to the life expectancy of a human being, then the CMB was emitted just hours after birth: truly an image of an infant universe (of course, this is a just a comparison: there is no reason to suspect that the universe is at the end of its life cycle!).
What information can we extract from the CMB? To answer this crucial question, we must review briefly our understanding of the evolution of the universe (see a time line in fig. 5). The expansion rate of the universe has not been always the same. When the universe was only about 10–36 seconds old (a place of enormously high density and temperature), it entered a phase of exponential expansion, which boosted its size of a whopping factor of order 1043 in just about 10–33 seconds.
This is called the cosmic inflation and while we do not yet know the details of the mechanism, we do have convincing proofs that it actually happened. And the main reason we know this is that we can read the imprint of inflation in the CMB! One possible model that explains inflation is connected with the presence of a scalar field, appropriately called the “inflaton”, that at some point happened to dominate the universe. The peculiarity of the inflaton field lies in the fact that its potential energy was much larger than its kinetic energy: this situation generated a sort of negative pressure, which can be roughly described as a repulsive force, responsible for the exponential expansion. In human units of time, inflation lasted just a tiny fraction of a second, yet it changed the fate of the universe forever.
Originally devised in the early 1980s to solve some otherwise catastrophic problems with the Hot Big Bang model, it was later realized that the inflation paradigm naturally provided a possible explanation for one of the most fundamental problems in cosmology. When inflation ended, the increase in size of the universe was not the only dramatic change that had taken place. Another, more subtle event had happened, which is deeply connected to our own existence: the birth of the cosmic perturbations.
If we observe the distribution of matter today in the universe as it can be traced, for instance, by galaxies, the first thing we notice is that it appears unevenly distributed.
69vol31 / no3-4 / anno2015 >
a. Mennella, P. natoli: the first light of the universe
A closer look would, however, reveal that this is only true on scales that are “small” enough. If we look at larger and larger distance scales, we would notice that at some point (say, for distances of order 100 Mpc) there is a transition to homogeneity: in the largest scales that we can observe, matter does not appear to be clustered, but has a uniform spatial distribution. Deviations from homogeneity would only reveal itself on smaller scales – small from a cosmological perspective, but still tens of Mpc wide.
A useful representation is to think of this distribution like a field, or a “fluid” which is largely homogeneous but possesses some local “perturbations”. Ultimately, these perturbations have allowed galaxies to form, galaxies like the Milky Way which is hosting us. From where do these perturbations come from? One of the main consequences of the inflation theory is that it provides a natural answer to such a question: perturbations arise from quantum fluctuations of the inflaton
that have been boosted to macroscopic scale during inflation. In other words, the large-scale structure of the universe has been seeded by the quantum world: quantum fluctuations normally belong to the microscopic world, and would have never been transferred to the macroscopic world if inflation had not happened.
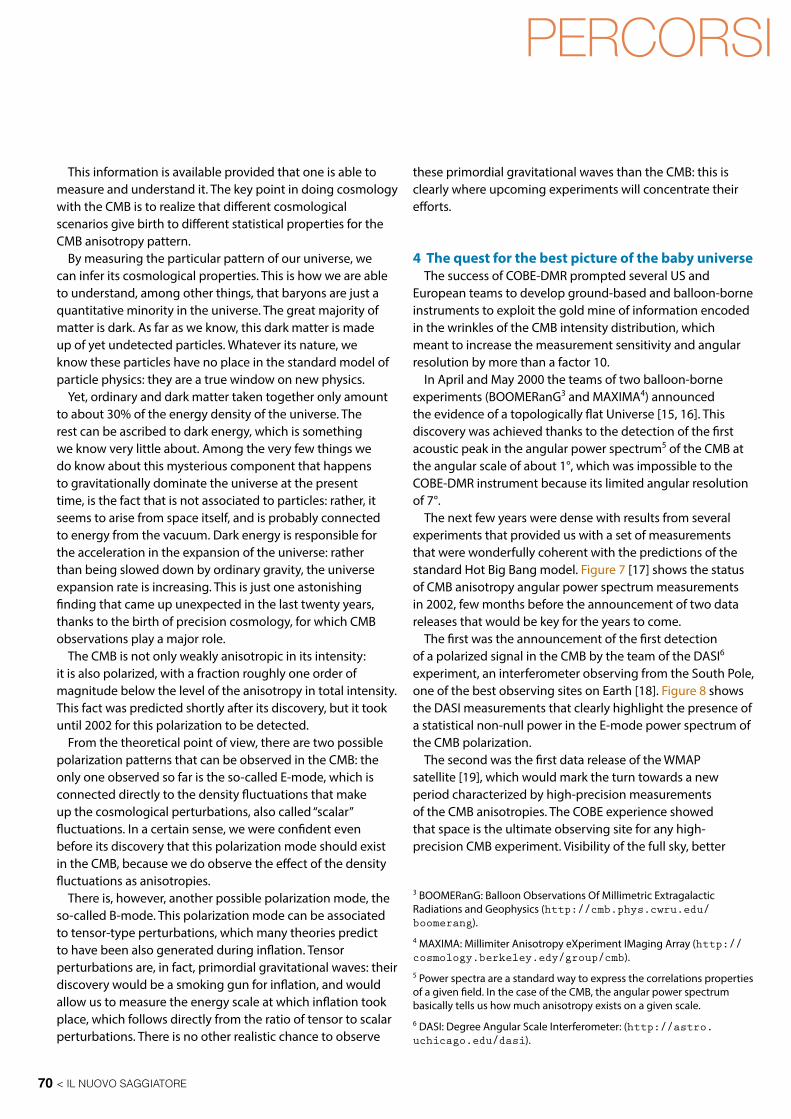
Since the CMB is a constituent of the universe, we expect the perturbations to show up in its spatial distribution as well. And in fact they do, although they are usually called anisotropies, because the CMB is a radiation field that surrounds us observers, and what wee see are slight – of order one part in 105 – variations of the mean black-body temperature as a function of the direction of observation (see the map in fig. 6). The CMB anisotropies are so weak because they have been frozen when the universe was very young: this is why they carry invaluable information about the conditions in the early universe, the composition of the universe and its destiny.
Fig. 5 This illustration summarizes the almost 14-billion-year long history of our universe. It shows the main events that occurred between the initial phase of the cosmos, where its properties were almost uniform and punctuated only by tiny fluctuations, to the rich variety of cosmic structure that we observe today, from stars and planets to galaxies and galaxy clusters. Credit: ESA, Planck LFI and HFI consortia.
a. Mennella, P. natoli: the first light of the universe
percorsi
70 < il nuovo saggiatore
percorsi
This information is available provided that one is able to measure and understand it. The key point in doing cosmology with the CMB is to realize that different cosmological scenarios give birth to different statistical properties for the CMB anisotropy pattern.
By measuring the particular pattern of our universe, we can infer its cosmological properties. This is how we are able to understand, among other things, that baryons are just a quantitative minority in the universe. The great majority of matter is dark. As far as we know, this dark matter is made up of yet undetected particles. Whatever its nature, we know these particles have no place in the standard model of particle physics: they are a true window on new physics.
Yet, ordinary and dark matter taken together only amount to about 30% of the energy density of the universe. The rest can be ascribed to dark energy, which is something we know very little about. Among the very few things we do know about this mysterious component that happens to gravitationally dominate the universe at the present time, is the fact that is not associated to particles: rather, it seems to arise from space itself, and is probably connected to energy from the vacuum. Dark energy is responsible for the acceleration in the expansion of the universe: rather than being slowed down by ordinary gravity, the universe expansion rate is increasing. This is just one astonishing finding that came up unexpected in the last twenty years, thanks to the birth of precision cosmology, for which CMB observations play a major role.
The CMB is not only weakly anisotropic in its intensity: it is also polarized, with a fraction roughly one order of magnitude below the level of the anisotropy in total intensity. This fact was predicted shortly after its discovery, but it took until 2002 for this polarization to be detected.
From the theoretical point of view, there are two possible polarization patterns that can be observed in the CMB: the only one observed so far is the so-called E-mode, which is connected directly to the density fluctuations that make up the cosmological perturbations, also called “scalar” fluctuations. In a certain sense, we were confident even before its discovery that this polarization mode should exist in the CMB, because we do observe the effect of the density fluctuations as anisotropies.
There is, however, another possible polarization mode, the so-called B-mode. This polarization mode can be associated to tensor-type perturbations, which many theories predict to have been also generated during inflation. Tensor perturbations are, in fact, primordial gravitational waves: their discovery would be a smoking gun for inflation, and would allow us to measure the energy scale at which inflation took place, which follows directly from the ratio of tensor to scalar perturbations. There is no other realistic chance to observe
these primordial gravitational waves than the CMB: this is clearly where upcoming experiments will concentrate their efforts.
4 The quest for the best picture of the baby universeThe success of COBE-DMR prompted several US and
European teams to develop ground-based and balloon-borne instruments to exploit the gold mine of information encoded in the wrinkles of the CMB intensity distribution, which meant to increase the measurement sensitivity and angular resolution by more than a factor 10.
In April and May 2000 the teams of two balloon-borne experiments (BOOMERanG3 and MAXIMA4) announced the evidence of a topologically flat Universe [15, 16]. This discovery was achieved thanks to the detection of the first acoustic peak in the angular power spectrum5 of the CMB at the angular scale of about 1°, which was impossible to the COBE-DMR instrument because its limited angular resolution of 7°.
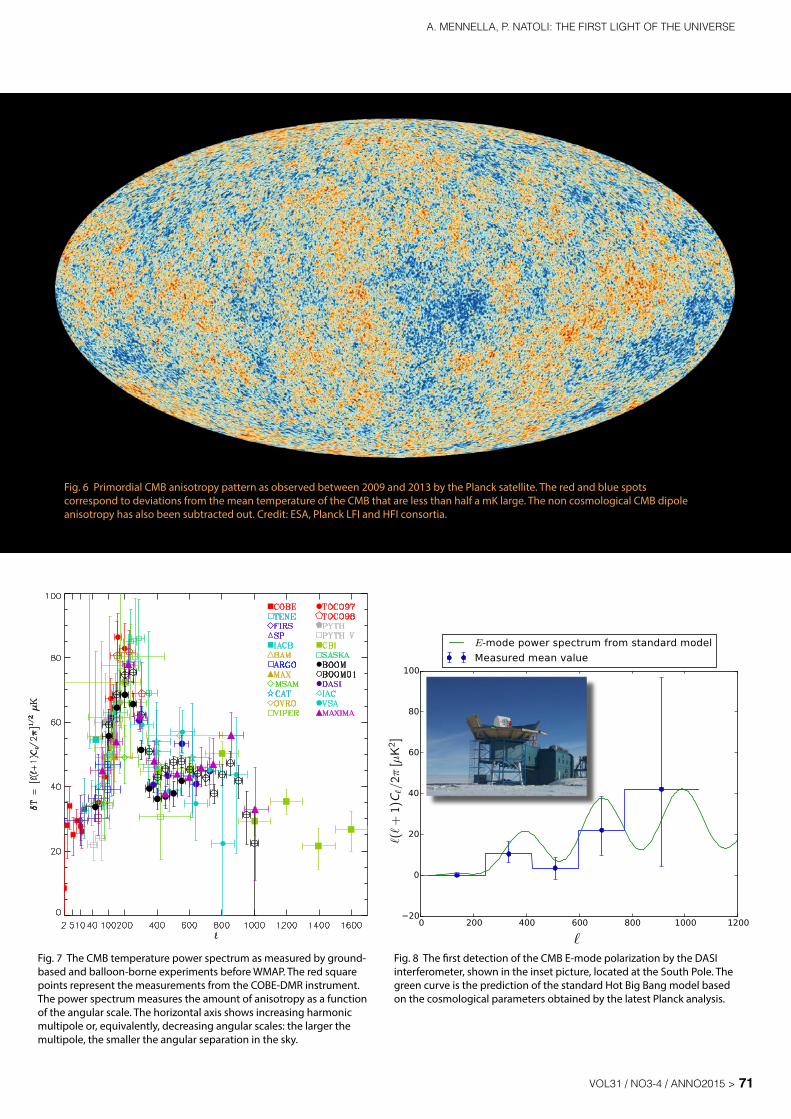
The next few years were dense with results from several experiments that provided us with a set of measurements that were wonderfully coherent with the predictions of the standard Hot Big Bang model. Figure 7 [17] shows the status of CMB anisotropy angular power spectrum measurements in 2002, few months before the announcement of two data releases that would be key for the years to come.
The first was the announcement of the first detection of a polarized signal in the CMB by the team of the DASI6 experiment, an interferometer observing from the South Pole, one of the best observing sites on Earth [18]. Figure 8 shows the DASI measurements that clearly highlight the presence of a statistical non-null power in the E-mode power spectrum of the CMB polarization.
The second was the first data release of the WMAP satellite [19], which would mark the turn towards a new period characterized by high-precision measurements of the CMB anisotropies. The COBE experience showed that space is the ultimate observing site for any high-precision CMB experiment. Visibility of the full sky, better
3 BOOMERanG: Balloon Observations Of Millimetric Extragalactic Radiations and Geophysics (http://cmb.phys.cwru.edu/boomerang).4 MAXIMA: Millimiter Anisotropy eXperiment IMaging Array (http://cosmology.berkeley.edy/group/cmb).5 Power spectra are a standard way to express the correlations properties of a given field. In the case of the CMB, the angular power spectrum basically tells us how much anisotropy exists on a given scale.6 DASI: Degree Angular Scale Interferometer: (http://astro.uchicago.edu/dasi).
71vol31 / no3-4 / anno2015 >
a. Mennella, P. natoli: the first light of the universe
Fig. 8 The first detection of the CMB E-mode polarization by the DASI interferometer, shown in the inset picture, located at the South Pole. The green curve is the prediction of the standard Hot Big Bang model based on the cosmological parameters obtained by the latest Planck analysis.
Fig. 6 Primordial CMB anisotropy pattern as observed between 2009 and 2013 by the Planck satellite. The red and blue spots correspond to deviations from the mean temperature of the CMB that are less than half a mK large. The non cosmological CMB dipole anisotropy has also been subtracted out. Credit: ESA, Planck LFI and HFI consortia.
Fig. 7 The CMB temperature power spectrum as measured by ground-based and balloon-borne experiments before WMAP. The red square points represent the measurements from the COBE-DMR instrument. The power spectrum measures the amount of anisotropy as a function of the angular scale. The horizontal axis shows increasing harmonic multipole or, equivalently, decreasing angular scales: the larger the multipole, the smaller the angular separation in the sky.
percorsi
72 < il nuovo saggiatore
percorsi
thermal stability and limited contamination from terrestrial microwave emissions are elements that played a key role in the production of what would have lately been named “The first picture of the baby universe”. It is not surprising that US and European scientists started working at a space mission immediately after the COBE team announced their discoveries.
In 1995 NASA approved the Microwave Anisotropy Probe (MAP7), a space mission proposed by a small team of Princeton scientists led by Dave Wilkinson, one of the founders of the COBE mission. Few years before, two European teams, one led by France, the other by Italy, submitted two competing proposals to the European Space Agency, that selected and joined them into what would have later become the Planck mission.
The MAP instrument inherited the design and know-how developed for COBE-DMR and extended the frequency range to the interval 26–90 GHz. This allowed MAP to cover the largest possible frequency region allowed by the existing technology in the field of low-noise coherent amplifiers. In September 2002, few months before the first results became public, Dave Wilkinson died at the age of 67, and the MAP satellite was renamed WMAP (W for Wilkinson) in his honor.
The Princeton team developed the WMAP satellite in
7 http://map.gsfc.nasa.gov
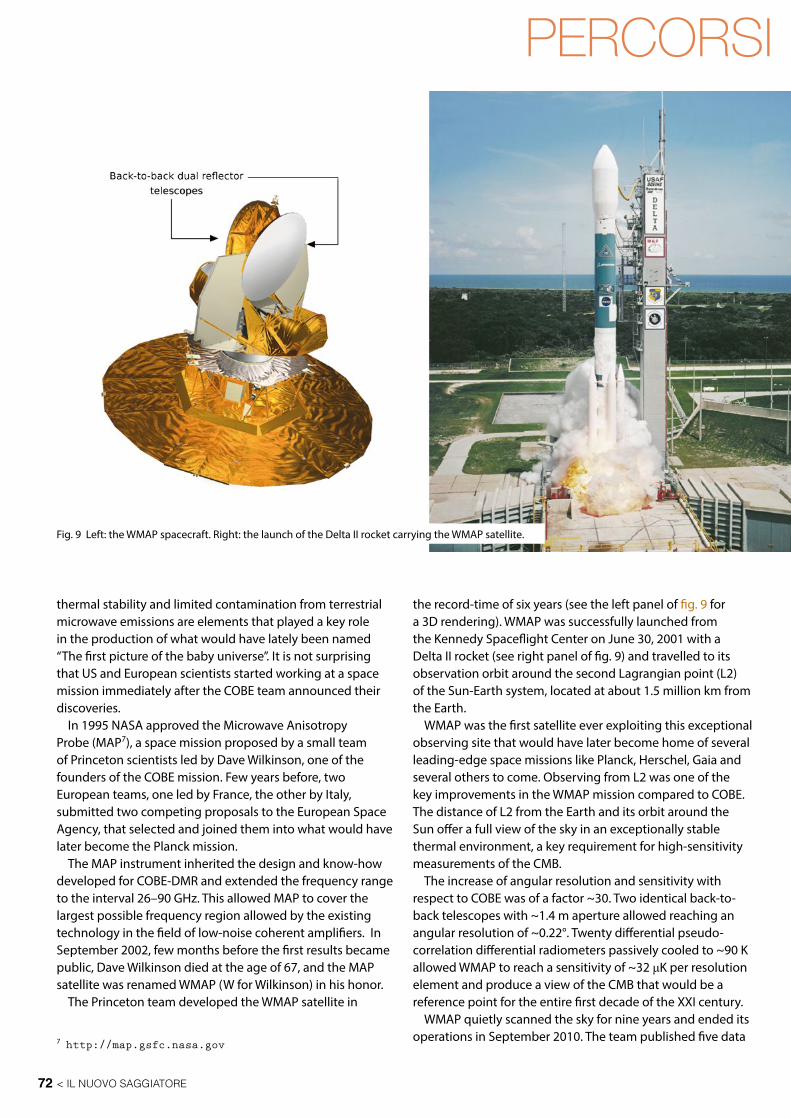
the record-time of six years (see the left panel of fig. 9 for a 3D rendering). WMAP was successfully launched from the Kennedy Spaceflight Center on June 30, 2001 with a Delta II rocket (see right panel of fig. 9) and travelled to its observation orbit around the second Lagrangian point (L2) of the Sun-Earth system, located at about 1.5 million km from the Earth.
WMAP was the first satellite ever exploiting this exceptional observing site that would have later become home of several leading-edge space missions like Planck, Herschel, Gaia and several others to come. Observing from L2 was one of the key improvements in the WMAP mission compared to COBE. The distance of L2 from the Earth and its orbit around the Sun offer a full view of the sky in an exceptionally stable thermal environment, a key requirement for high-sensitivity measurements of the CMB.
The increase of angular resolution and sensitivity with respect to COBE was of a factor ~30. Two identical back-to-back telescopes with ~1.4 m aperture allowed reaching an angular resolution of ~0.22°. Twenty differential pseudo-correlation differential radiometers passively cooled to ~90 K allowed WMAP to reach a sensitivity of ~32 μK per resolution element and produce a view of the CMB that would be a reference point for the entire first decade of the XXI century.
WMAP quietly scanned the sky for nine years and ended its operations in September 2010. The team published five data
Fig. 9 Left: the WMAP spacecraft. Right: the launch of the Delta II rocket carrying the WMAP satellite.
73vol31 / no3-4 / anno2015 >
a. Mennella, P. natoli: the first light of the universe
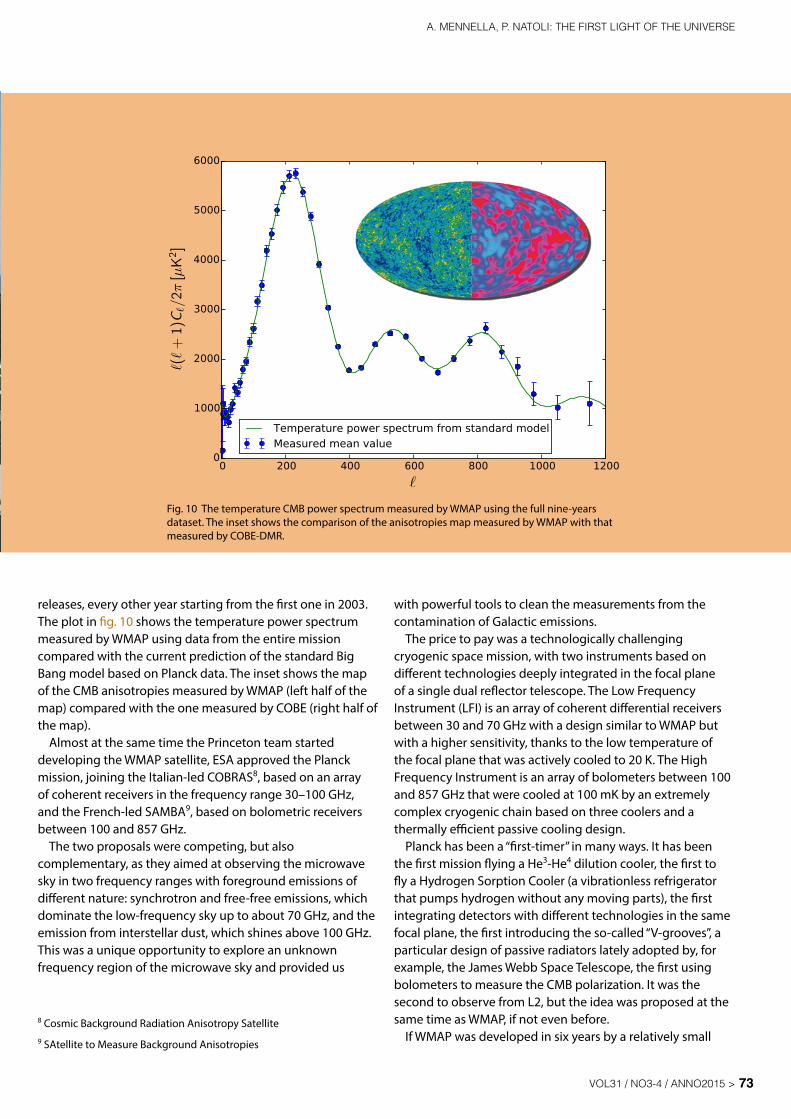
releases, every other year starting from the first one in 2003. The plot in fig. 10 shows the temperature power spectrum measured by WMAP using data from the entire mission compared with the current prediction of the standard Big Bang model based on Planck data. The inset shows the map of the CMB anisotropies measured by WMAP (left half of the map) compared with the one measured by COBE (right half of the map).
Almost at the same time the Princeton team started developing the WMAP satellite, ESA approved the Planck mission, joining the Italian-led COBRAS8, based on an array of coherent receivers in the frequency range 30–100 GHz, and the French-led SAMBA9, based on bolometric receivers between 100 and 857 GHz.
The two proposals were competing, but also complementary, as they aimed at observing the microwave sky in two frequency ranges with foreground emissions of different nature: synchrotron and free-free emissions, which dominate the low-frequency sky up to about 70 GHz, and the emission from interstellar dust, which shines above 100 GHz. This was a unique opportunity to explore an unknown frequency region of the microwave sky and provided us
8 Cosmic Background Radiation Anisotropy Satellite9 SAtellite to Measure Background Anisotropies
with powerful tools to clean the measurements from the contamination of Galactic emissions.
The price to pay was a technologically challenging cryogenic space mission, with two instruments based on different technologies deeply integrated in the focal plane of a single dual reflector telescope. The Low Frequency Instrument (LFI) is an array of coherent differential receivers between 30 and 70 GHz with a design similar to WMAP but with a higher sensitivity, thanks to the low temperature of the focal plane that was actively cooled to 20 K. The High Frequency Instrument is an array of bolometers between 100 and 857 GHz that were cooled at 100 mK by an extremely complex cryogenic chain based on three coolers and a thermally efficient passive cooling design.
Planck has been a “first-timer” in many ways. It has been the first mission flying a He3-He4 dilution cooler, the first to fly a Hydrogen Sorption Cooler (a vibrationless refrigerator that pumps hydrogen without any moving parts), the first integrating detectors with different technologies in the same focal plane, the first introducing the so-called “V-grooves”, a particular design of passive radiators lately adopted by, for example, the James Webb Space Telescope, the first using bolometers to measure the CMB polarization. It was the second to observe from L2, but the idea was proposed at the same time as WMAP, if not even before.
If WMAP was developed in six years by a relatively small
Fig. 10 The temperature CMB power spectrum measured by WMAP using the full nine-years dataset. The inset shows the comparison of the anisotropies map measured by WMAP with that measured by COBE-DMR.
percorsi
74 < il nuovo saggiatore
percorsi
team located in a single institute, Planck required 17 years of hard work and a widespread collaboration involving tens of institutes and industrial partners all over Europe with important contributions from the United States and Canada. Managing the collaboration in the context of such a challenging enterprise was an experiment by itself that taught several lessons that would deserve a dedicated paper to be discussed.
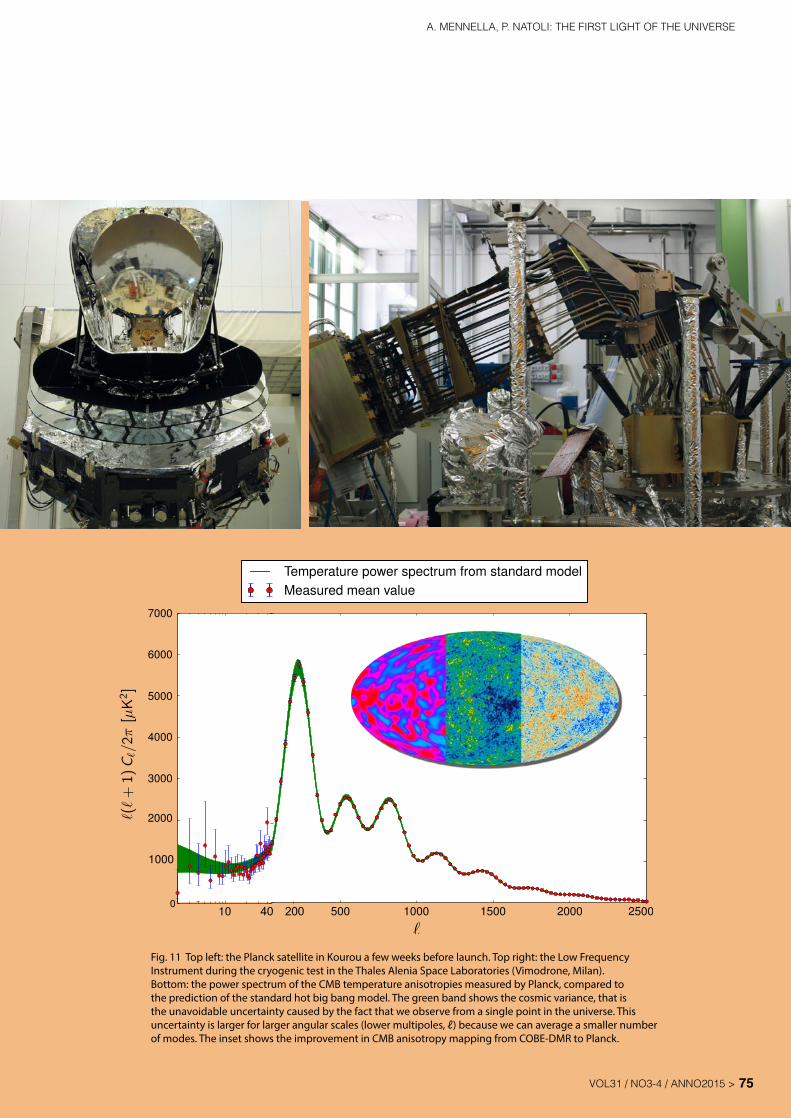
Italy has been the leading country of the Low Frequency Instrument, the most sensitive and technologically challenging coherent receiver array ever launched to space. This instrument was developed by a consortium of institutes and industries and then integrated and tested in Italy, before handing on to ESA in 2006, when the LFI was integrated with the HFI on the Planck satellite (see the upper panel of fig. 11).
Planck was finally launched on an Ariane V rocket with the Herschel satellite from Kourou, in French Guyana, on May 14, 2009 at 13:12 UT. It started its science operations on August 12, after three months of tests and calibration activities, and was finally switched off on October 23, 2013 at 12:10:27 UT, after four years of operations that were a complete technical and scientific success.
Planck has released three sets of data and results to date, and a final release is expected within 2016. The first one, in 2011, was focused on astrophysics, while the second and third, in 2013 and 2015, on cosmology. The lower panel of fig. 11 shows the temperature angular power spectrum measured by Planck compared to the spectrum predicted by the standard Hot Big Bang model. The figure inset shows the improvement in the measurement of the CMB map from COBE to Planck.
The level of precision obtained by Planck is at the same time a success and a wonder. It is a success, because this plot confirms the ambitious goals that the Planck team struggled so hard to achieve. It is also a wonder, because (as Einstein stated himself ) it is a deep mystery that we humans can understand nature the way we do.
Several people, including us, were present when the last telecommand was sent to Planck from the ESA Space Operation Center in Darmstadt. To most of us Planck was much more than a machine in space being turned off. It was more like saying goodbye to a part of us, a living thing we dedicated so many efforts, days and nights of our life.
Now Planck is orbiting the Sun. It will be again in the neighborhood of L2 in about 11 years: technically it could be switched on again.
5 What lays ahead The proprietary analysis of the Planck data is expected
to end in 2016. After this date, Planck will become a legacy for the CMB and microwave astrophysics in general. Planck has provided us with exquisitely accurate measurements of the parameters of the standard model of cosmology, whose errors can, in a few cases, be now measured in terms of parts per million. Among the most remarkable findings by Planck, one should mention the precise measurement of the spectral index of primordial perturbations: one prediction of inflation is that the perturbations are not exactly scale invariant: that is, they almost possess equal power on all scales, but not quite: large scales are slightly favored over small ones. The reason for this behavior is connected to the fact that inflation has to come to an end. Planck was able to assess this small effect, thereby corroborating the case for the inflationary scenario [20].
In terms of the CMB intensity anisotropies, Planck has most likely established the final legacy. If we speak of CMB polarization, however, the story is different. Planck was able to use its measurements of the E-mode of the CMB to increase the accuracy of its cosmological analysis and, in a few cases, to carry out analyses that are not possible with intensity data alone.
This is the case of the optical depth at re-ionization, or τ, that can be derived from the joint analysis of temperature and large angle CMB polarization. About 400 million years after the Big Bang, when the universe was about 1/10 of its present size, the intergalactic medium became ionized again. The main suspects for this re-ionization process – as it is called – are the first stars that came into existence. These provided a new source of energetic photons that were able ionize hydrogen again. This phenomenon did not wipe off the primordial CMB anisotropies from recombination because the density of hydrogen, diluted by the expansion, was too low when re-ionization occurred. However, it did have an effect on the CMB, which can be measured. It turns out that the best way to measure the effect is to look at CMB polarization. Measures of the optical depth carried out before Planck indicated a value of τ too high to sustain the hypothesis that the first stars are responsible for re-ionization. Recent measures by Planck [21] are pointing towards significantly lower values of τ thus providing further support to our picture of the evolution of the universe. Planck measurement of τ is expected to improve further in the near future.
It is clear, however, that Planck itself will not exhaust the
a. Mennella, P. natoli: the first light of the universe
Fig. 11 Top left: the Planck satellite in Kourou a few weeks before launch. Top right: the Low Frequency Instrument during the cryogenic test in the Thales Alenia Space Laboratories (Vimodrone, Milan). Bottom: the power spectrum of the CMB temperature anisotropies measured by Planck, compared to the prediction of the standard hot big bang model. The green band shows the cosmic variance, that is the unavoidable uncertainty caused by the fact that we observe from a single point in the universe. This uncertainty is larger for larger angular scales (lower multipoles, ℓ) because we can average a smaller number of modes. The inset shows the improvement in CMB anisotropy mapping from COBE-DMR to Planck.
75vol31 / no3-4 / anno2015 >
percorsi
References
[1] R.A. Alpher, H. Bethe, and G. Gamow, Phys. Rev., 73 (1948) 803. [2] G. Gamow, Phys. Rev., 74 (1948) 505. [3] G. Gamow, Nature, 162 (1948) 680. [4] R.A. Alpher, and R. Herman, Nature, 162 (1948) 774. [5] A.A. Penzias, and R.W. Wilson, Astrophys. J., 142 (1965) 419. [6] R.H. Dicke, P.J.E. Peebles, P.G. Roll, and D.T. Wilkinson, Astrophys. J.,
142 (1965) 414. [7] Ned Wright’s online cosmology tutorial: http://www.astro.
ucla.edu/~wright/cosmolog.htm [8] Sachs, R. K., & Wolfe, A. M. 1967, Astrophys. J., 147, 73. [9] Ya. Zeldovich and R. Sunyaev, Astrophys. Space Sci., 7, 3 (1970).[10] P.J.E. Peebles and J.T. Yu, Astrophys. J., 162, 815 (1970).[11] P.J.E. Peebles, Astrophys. J., 263 (1982) L1.[12] G.F. Smoot, M.V. Gorenstein, and R.A. Muller, Phys. Rev. Lett., 39
(1977) 898.
[13] C.L. Bennett, A.J. Banday, K.M. Gorski, et al., Astrophys. J. Lett., 464 (1996) L1.
[14] D.J. Fixsen, E.S. Cheng, J.M. Gales, et al., Astrophys. J. Lett. 473 (1996) 576.
[15] P. de Bernardis, P.A.R. Ade, J.J. Bock, et al., Nature 404 (2000) 955.[16] S. Hanany, P.A.R. Ade, A. Balbi, et al., Astrophys. J., 545 (2000) L5.[17] M. Bersanelli, D. Maino, and A. Mennella, Riv. Nuovo Cimento, 25,
n. 9 (2002) 1.[18] J.M. Kovac, E.M. Leitch, and C. Pryke, Nature, 420 (2002), 772.[19] C.L. Bennett, M. Halpern, G. Hinshaw, et al., Astrophys. J. Suppl. Ser.,
148 (2003) 1.[20] Planck Collaboration, submitted to Astron. Astrophys.
[arXiv:1502.01589], 2015.[21] Planck Collaboration, submitted to Astron. Astrophys.
[arXiv:1507.02704], 2015.[22] BICEP2/Keck and Planck Collaborations, Phys. Rev. Lett., 114
(2015) 301.
wealth of information encoded in the CMB polarization, neither for the E-mode, whose measurement is still limited by instrumental noise and systematic effects, nor for the B-mode, that appears to be beyond Planck’s reach.
In March 2014, the BICEP2 experiment hit the headlines, announcing a detection of a B-mode signal in the CMB that would correspond to an amplitude of primordial gravitational waves at roughly 20% of the scalar perturbation. Unfortunately, a subsequent joint analysis of the Planck and BICEP2 data has revealed that the detection was spurious [22]. Several sub-orbital experiments for CMB polarization are nonetheless in operations or planned for the near future. These include the balloon-borne Spider, EBEX and the Italian LSPE observers, as well as the ground-based Keck, ACTPOL and Polarbear efforts, just to mention a few. Any of these experiments may reveal the much sought-after B-modes. At the same time, there is a general consensus in the community that only a post-Planck satellite aimed at CMB polarization can provide the level of accuracy and control of systematic effects to fully exploit the CMB polarization pattern to do cosmology.
The quest for spectral distortions is the second big challenge in the future of CMB observations. The COBE-FIRAS measurements set a precision standard that is very hard to beat, but there are several reasons why one should expect tiny deviations of the CMB spectrum from that of a black body, even in standard recombination scenarios. These spectral distortions can be used to do cosmology, similarly to what is done for the anisotropy and its associated polarization pattern. Even more intriguing is the possibility that these spectral distortions could reveal unexpected features arising from new physics beyond the standard model. The technical challenge to detect such small deviations is great and relies on sensitivity at least a thousand times greater than FIRAS with a comparable level of systematic effects control.
There are several post Planck satellites under close study for a possible launch window in the 2020s, aiming at B-mode physics and spectral distortions. Among these, we find the Japanese-led Litebird, the European Core+ and the American PIXIE. The quest to study the CMB appears, half a century after its discovery, well alive and promising.
76 < il nuovo saggiatore
Paolo Natoli Paolo Natoli is Associate Professor at the University of Ferrara. He specializes in physical cosmology and has a twenty year experience in theory and phenomenology of the cosmic microwave background, having participated in the analysis of the BEAST and BOOMERanG balloon-borne experiments and of the Planck satellite. He has been a visiting scientist at UC Santa Barbara, Berkeley LBL and NASA/JPL. He has coauthored over 200 publications, is involved in several ongoing projects for CMB observations and enjoys doing science outreach.
Aniello MennellaAniello Mennella is Associate Professor at the Department of Physics of the University of Milan and his main field of research is observational cosmology. He followed the development of the Low-Frequency Instrument on board the Planck satellite since the design phase until the end of its operations. He is currently working in the Planck data analysis with particular reference to the control of systematic effects. He is also involved in the development of future CMB experiments. In particular he is member of the steering committees of the Large-Scale Polarization Explorer, a long-duration balloon-borne experiment, and of QUBIC, a bolometric interferometer for CMB observations from Antarctica.