Embed Size (px)
Citation preview
Working Paper/Document de travail 2013-39
The Financialization of Food?
by Valentina G. Bruno, Bahattin Büyükșahin and Michel A. Robe
2
Bank of Canada Working Paper 2013-39
November 2013
The Financialization of Food?
by
Valentina G. Bruno,1 Bahattin Büyükșahin2 and Michel A. Robe3
1Department of Finance Kogod School of Business at American University
Washinton, DC 20016 [email protected]
2International Economic Analysis Department
Bank of Canada Ottawa, Ontario, Canada K1A 0G9
3Department of Finance Kogod School of Business at American University
Washington, DC 20016 Corresponding author: [email protected]
Bank of Canada working papers are theoretical or empirical works-in-progress on subjects in economics and finance. The views expressed in this paper are those of the authors.
No responsibility for them should be attributed to the U.S. Commodity Futures Trading Commission, the Commissioners or staff at the Commission; the Bank of Canada or other Bank of Canada staff; or the
Canadian government.
ISSN 1701-9397 © 2013 Bank of Canada
ii
Acknowledgements
We are grateful to Scott Irwin, Georg Lehecka and Paul Peterson for their generous help with data on U.S. grain stocks and weather conditions, crop progress and condition reports, and meat cold storage. We also thank them, as well as Phil Garcia and Darrell Good, for extremely helpful discussions of price dynamics and institutional features in financial and physical food markets. We thank participants at seminars held at the Bank of Canada and the U.S. Commodity Futures Trading Commission (CFTC), at the 2013 Meeting of the American Agricultural and Applied Economics Association (AAEA), and especially our AAEA discussant Jim Moser, for insightful questions. We thank Jonathan Wallen and Casey Petroff for outstanding research assistance. Professor Bruno gratefully acknowledges financial support from American University in the form of a 2013 Faculty Research Support Grant. Professor Robe gratefully acknowledges the University of Illinois at Urbana-Champaign’s hospitality during the sabbatical leave when he wrote his contribution to the paper. Robe was also a consultant to the CFTC during that period. No CFTC compensation was received, and no CFTC resources or proprietary information were used, for this project. Errors and omissions, if any, are the authors’ sole responsibility.
iii
Abstract
Commodity-equity and cross-commodity return co-movements rose dramatically after the 2008 financial crisis. This development took place following what has been dubbed the “financialization” of commodity markets. We first document changes since 2000 in the intensity of speculative activity in grain and livestock futures. We then use a structural VAR model to establish the role of speculative activity in explaining the strength of co-movements between grain, livestock and equity returns. We find that speculative intensity does not in itself affect the extent to which grain markets move in sync with the stock market. Rather, pre-crisis, financial speculators’ futures positions facilitated the transmission of macroeconomic shocks into grain markets. Strikingly, in the post-crisis period, this transmission channel weakened to the point of statistical insignificance. The role of speculative activity is less evident in livestock markets, where only macroeconomic conditions have a statistically significant impact on return co-movements with equities.
JEL classification: Q11, Q13, G12, G13 Bank classification: International topics; Recent economic and financial developments
Résumé
Les corrélations entre les rendements des actions et des contrats sur matières premières agricoles, ainsi qu’entre les rendements de différents contrats sur divers produits agricoles, ont fortement augmenté après la crise financière de 2008. Cette hausse a eu lieu dans la foulée de ce qu’on a appelé la « financiarisation » des marchés des matières premières. Dans la présente étude, nous faisons d’abord le point sur l’évolution, depuis 2000, de l’intensité de l’activité spéculative sur les marchés à terme des grains et du bétail. Ensuite, à l’aide d’un modèle VAR structurel, nous examinons si la spéculation influence le degré de covariation des rendements entre les actions et les contrats sur les grains et le bétail. Nous montrons que l’intensité de cette activité n’a pas, en soi, d’incidence sur le degré avec lequel les marchés des grains et les marchés boursiers évoluent de manière parallèle. Au contraire, avant la crise, les positions à terme des spéculateurs financiers ont facilité la transmission des chocs macroéconomiques aux marchés des grains. Fait étonnant, dans l’après-crise, ce canal de transmission s’est affaibli au point de devenir négligeable sur le plan statistique. Nous observons que le rôle de l’activité spéculative est moins évident sur les marchés du bétail, où les conditions macroéconomiques sont le seul facteur dont l’influence sur la covariation des rendements des actions et des contrats sur le bétail est statistiquement significative.
Classification JEL : Q11, Q13, G12, G13 Classification de la Banque : Questions internationales; Évolution économique et financière récente
1
1. Introduction
In the past decade, the magnitude of financial traders’ positions in commodity futures
(or “paper”) markets has grown substantially – both in absolute terms and relative to the
positions of traditional market participants such as refineries, slaughterhouses, mills, metal
smelters, grain elevators, etc. Since the tripling of food prices in 2007–08, market
commentators and policy-makers alike have questioned whether food prices are still driven
mainly by physical supply and demand factors, or whether trading by financial institutions
(in particular, hedge funds) in commodity paper markets has become a major explanatory
factor in agricultural (“ag”) price fluctuations.
We approach this question through the lens of cross-market linkages. Historically,
food and other commodity markets (energy, industrial and precious metals) have been partly
isolated (or “segmented”) from one another and from financial markets (Bessembinder,
1992). A key difference between traditional commodity traders and financial institutions,
however, is that the latter – but not the former – typically trade in multiple asset markets. As
a result, the expansion of financial institutions in commodity markets (i.e., “financialization”)
may improve risk sharing in good times, lessening the relevance of idiosyncratic commodity
shocks to commodity risk premia (Brunetti and Reiffen, 2011; Hamilton and Wu, 2013) and
increasing the importance of common shocks. In bad times, the literature on limits to
arbitrage (Gromb and Vayanos, 2010) identifies various channels through which financial
institutions can in theory transmit shocks across different markets or asset classes. Finally,
insofar as trader performance at financial institutions is benchmarked against a commodity
index, Başak and Pavlova (2013) demonstrate that “financialization” should raise
“correlations amongst commodity futures (as well as) equity-commodity correlations.”
In short, the returns in more “financialized” livestock and grain futures can be
characterized by increases in the extent to which they co-move with one another and with
equity returns. At first blush, the dramatic increase in commodity-equity and cross-
commodity co-movements that started in autumn 2008 fits this intuition.
To investigate this hypothesis, we compute indices of speculative intensity for grain
and livestock markets. We use data on trader positions published by the U.S. Commodity
Futures Trading Commission (CFTC) for grain (corn, soybean, Kansas City and Chicago
2
wheat) and livestock (live and feeder cattle, lean hogs) futures markets. Büyükşahin and
Robe (2013), who give a broad view of commodity market financialization using measures
constructed instead from non-public trader-level position data, provide empirical evidence
that fluctuations in public speculative intensity indices may proxy for changes in the relative
importance of hedge funds and similar cross-market traders during the 2000–10 period.
We use a structural vector autoregression (SVAR) model to examine the role of
speculative intensity in grains or livestock markets in explaining the co-movements of these
markets with one another or with equities. Precisely, we ask whether dynamic conditional
ag/equity and grain/livestock return correlations (DCC) are affected by the makeup of the
commodity futures open interest after accounting for key market fundamentals: global
macroeconomic conditions, which drive current food demand; precautionary and speculative
demand, through changes in grain and meat inventory levels; supply, through indices of crop
progress and condition; and idiosyncratic shocks such as agricultural market stress caused by
mad cow and swine flu episodes. Because the DCC series all experience structural breaks
after the demise of Lehman Brothers and the onset of a massive financial crisis in September
2008, we analyze the pre- and post-Lehman periods separately.
For 2000–08, we identify a causal relationship from the intensity of speculative
activity to the strength of equity-grain linkages. However, we show that speculative intensity
does not in itself affect the extent to which grain markets move in sync with the stock market
– rather, pre-crisis, financial speculators’ futures positions simply facilitated the transmission
of economic shocks into grain markets. In the post-Lehman period, this transmission channel
is weaker – to the point of statistical insignificance. The role of speculative activity is even
weaker for livestock, where only macroeconomic conditions statistically significantly impact
returns’ co-movements with equities.
Taken together, our results suggest that, for grains as well as livestock, the intensity
of participation by financial speculators (including hedge funds) in paper markets is not the
main explanatory factor for ag and equity return co-movements. In that sense, our results cast
doubt on the popular claim that the past decade witnessed the “financialization of food.”
This paper is organized as follows. Section 2 discusses our contribution to the
literature. Section 3 presents evidence on correlations (DCC). Section 4 describes the futures
position data and speculative intensity patterns in food futures markets. Section 5 discusses
3
our SVAR analyses, linking return co-movements to market fundamentals, speculative
activity, financial market stress, and the interaction of these factors. Section 6 concludes.
2. Literature
Our paper contributes to a fast-growing literature on the role of financial institutions
in commodity futures markets. Closest are two sets of papers.1
Büyükşahin and Robe (2013) and Cheng, Kirilenko and Xiong (2012) investigate
links between financialization and cross-market linkages. Using non-public CFTC data from
2000–10, Büyükşahin and Robe show that, of all financial institutions, it is the aggregate
positions of hedge funds (especially funds active in both equity and commodity markets) that
help predict the strength of correlations between equity and commodity futures returns.2
Since that paper amalgamates different commodity groups, however, it does not
control for grain or livestock supply and demand fundamentals that are known to matter for
ag prices. Its econometric approach, furthermore, precludes inferences regarding causality. A
key result of the present paper is to show that speculative activity in ag markets in fact does
not drive co-movements between grain and livestock returns or between ag and equity
returns. Instead, speculative activity helps transmit macroeconomic shocks to grain markets –
with the result of stronger co-movements between different markets during economic
downturns.
Büyükşahin and Robe (2013) find a lower predictive power for aggregate hedge fund
positions in the 18 months after Lehman Brothers’ 2008 demise.3 Supporting their finding,
we find statistical evidence that financial speculators’ net futures positions helped transmit
macroeconomic shocks into grain markets before Lehman – but no such evidence thereafter.
We do so by using a structural VAR model that parsimoniously accounts for key market
1 Büyükşahin and Robe (2013) and Fattouh, Kilian and Mahadeva (2013) give fuller reviews of this literature. 2 In a companion paper, Büyükşahin and Robe (2011) carry out a similar study in the specific case of energy futures, where they can better control for oil market-specific demand and supply fundamentals. They find qualitatively similar results. 3 The findings of Cheng, Kirilenko and Xiong (2012), who use the same confidential CFTC data, suggest a possible explanation: in years after September 2008 (but not in prior years), financially-constrained commodity index traders and hedge funds reacted to financial stress by cutting their net long positions in commodity futures markets. This behavior is consistent with the findings of Acharya, Lochstoer and Ramadorai (2013) on limits to arbitrage in energy markets, and of Raman, Robe and Yadav (2012) on changes in liquidity provision under stress in the crude oil futures market.
4
factors all together and thus allows us to discuss ceteris paribus effects. An independent
contribution is the construction of a hand-collected dataset (described in the appendix) of
relevant market drivers.
The SVAR approach links our paper to a set of studies that tease out the role of
speculative activity on crude oil prices (Kilian and Murphy, 2013), cotton prices (Janzen,
Smith and Carter, 2013) and corn price volatility (McPhail, Du and Muhammad, 2012).
Kilian and Murphy (2013) model speculation as a phenomenon tied to precautionary
demand and physical inventories. Closer to our paper are McPhail, Du and Muhammad
(2012) and Janzen, Smith and Carter (2013). McPhail, Du and Muhammad capture paper
speculation through the same index we employ but, unlike us, do not model corn inventories
or supply. Janzen, Smith and Carter consider the incentive to accumulate inventories as a
phenomenon distinct from financial speculation and bear further similarity to our approach
by viewing financialization through the lens of cross-market linkages. We use a direct
measure of speculative activity, however. In contrast, Janzen, Smith and Carter draw on the
observation that oil is not a direct substitute in cotton production and consumption, and
identify structural shocks due to financial speculation using the co-movements of cotton
prices with crude oil. This strategy fits their focus on commodity index traders (CIT), a type
of financial traders whose activities might be associated with commodity-to-commodity
linkages but not with commodity-equity return co-movements (Aulerich, Irwin and Garcia,
2013; Irwin and Sanders, 2011, 2012; Tang and Xiong, 2012; Büyükşahin and Robe, 2013).
Our findings complement those three papers in that we find no evidence that financial
speculation per se plays a role in a key moment of the joint distribution of commodity return.
Instead, fundamental factors emerge as having the main role in cross-market linkages.
3. Market Linkages
Numerous papers provide evidence on the extent to which various commodities co-
move with one another or financial assets – see Büyükşahin and Robe (2013) for a review. In
this section, we build on that prior work. We estimate dynamic conditional correlations
(Engle, 2002) between the returns on two investable indices (one for grains, the other for
livestock) and between the returns on the main U.S. equity index and those two indices.
5
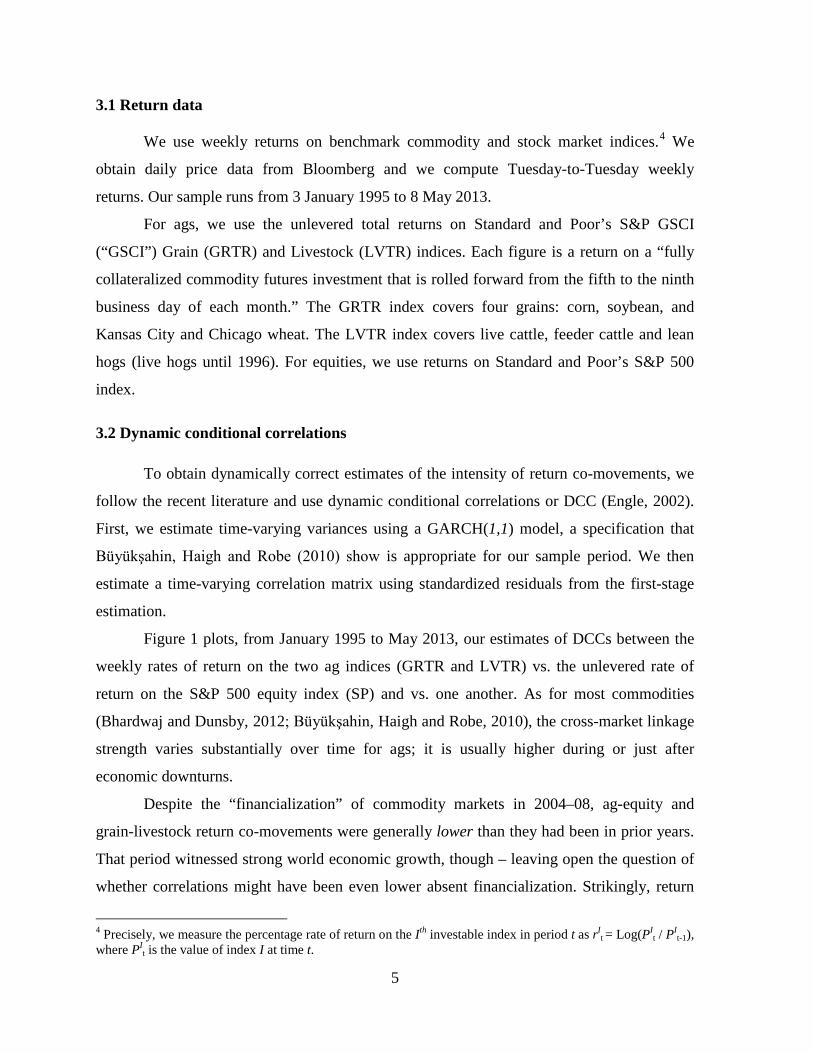
3.1 Return data
We use weekly returns on benchmark commodity and stock market indices.4 We
obtain daily price data from Bloomberg and we compute Tuesday-to-Tuesday weekly
returns. Our sample runs from 3 January 1995 to 8 May 2013.
For ags, we use the unlevered total returns on Standard and Poor’s S&P GSCI
(“GSCI”) Grain (GRTR) and Livestock (LVTR) indices. Each figure is a return on a “fully
collateralized commodity futures investment that is rolled forward from the fifth to the ninth
business day of each month.” The GRTR index covers four grains: corn, soybean, and
Kansas City and Chicago wheat. The LVTR index covers live cattle, feeder cattle and lean
hogs (live hogs until 1996). For equities, we use returns on Standard and Poor’s S&P 500
index.
3.2 Dynamic conditional correlations
To obtain dynamically correct estimates of the intensity of return co-movements, we
follow the recent literature and use dynamic conditional correlations or DCC (Engle, 2002).
First, we estimate time-varying variances using a GARCH(1,1) model, a specification that
Büyükşahin, Haigh and Robe (2010) show is appropriate for our sample period. We then
estimate a time-varying correlation matrix using standardized residuals from the first-stage
estimation.
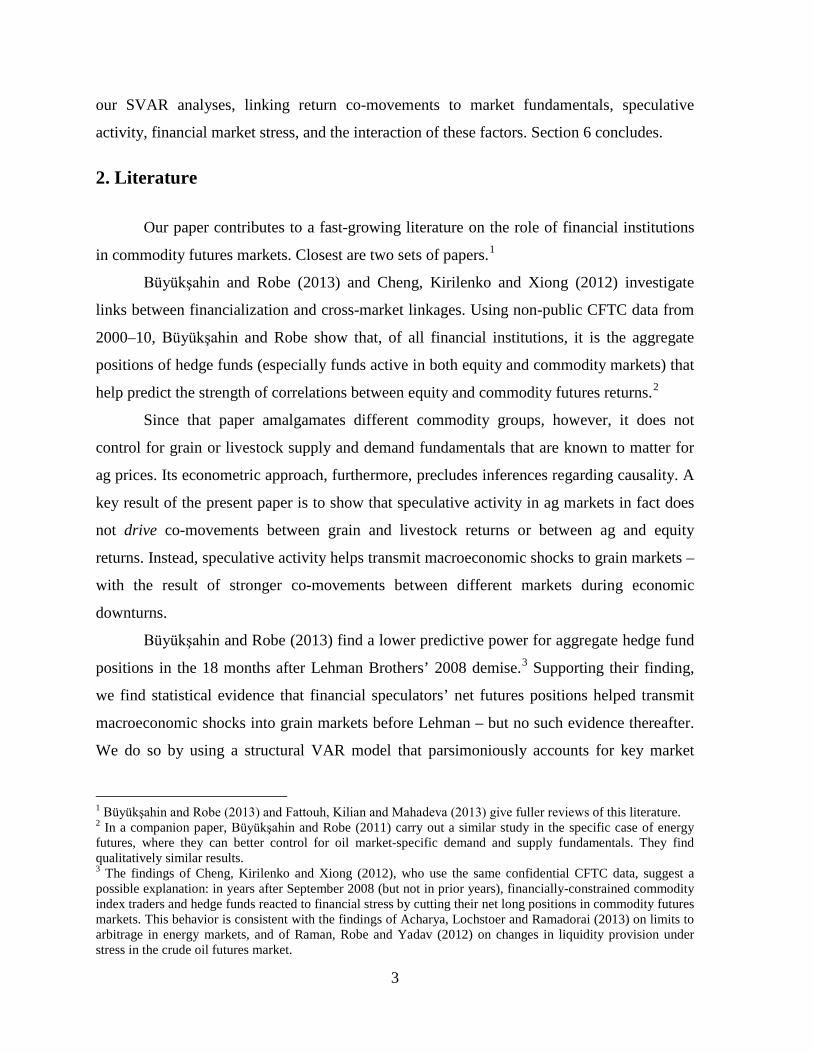
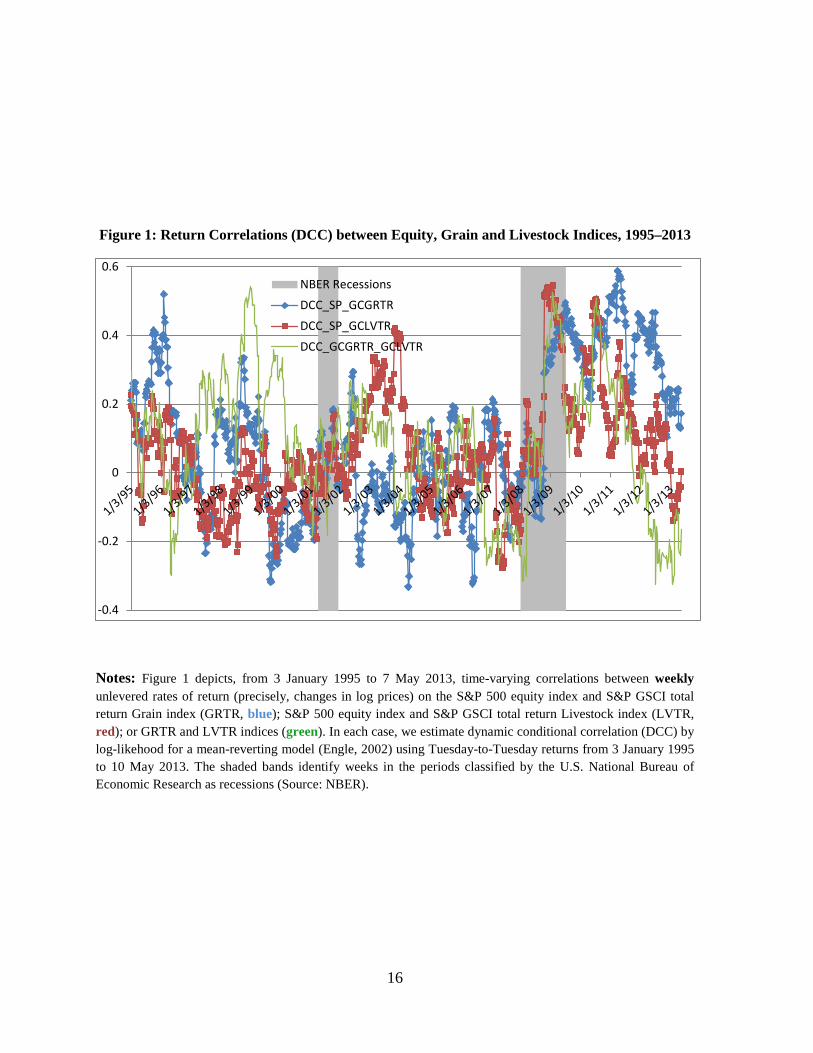
Figure 1 plots, from January 1995 to May 2013, our estimates of DCCs between the
weekly rates of return on the two ag indices (GRTR and LVTR) vs. the unlevered rate of
return on the S&P 500 equity index (SP) and vs. one another. As for most commodities
(Bhardwaj and Dunsby, 2012; Büyükşahin, Haigh and Robe, 2010), the cross-market linkage
strength varies substantially over time for ags; it is usually higher during or just after
economic downturns.
Despite the “financialization” of commodity markets in 2004–08, ag-equity and
grain-livestock return co-movements were generally lower than they had been in prior years.
That period witnessed strong world economic growth, though – leaving open the question of
whether correlations might have been even lower absent financialization. Strikingly, return
4 Precisely, we measure the percentage rate of return on the Ith investable index in period t as rI
t = Log(PIt / PI
t-1), where PI
t is the value of index I at time t.
6
co-movements rose quickly and massively after Lehman Brothers’ demise in September
2008. Ag-equity DCCs remained unusually high until late 2011 (livestock) or early 2012
(grains), but have since dropped to pre-crisis levels. These last two observations suggest the
possibility of structural breaks in autumn 2008 – a topic to which we will return in section 5.
4. Financial Speculation in Grain and Livestock Markets, 2000–13
Open interest in the ag futures markets included in the S&P GSCI commodity indices
has grown substantially in the past decade. In grain markets, open interest has risen several-
fold since 2004. In this section, we document changes in the intensity of speculative activity
amid this growth. In doing so, we rely on results in Büyükşahin and Robe (2013) suggesting
that Working’s (1960) T index may be used as a public-data substitute for measures of
financialization that they computed with non-public, trader-level futures position data.
4.1 Data
For every futures market boasting a high-enough level of trading activity, the CFTC’s
weekly Commitments of Traders (COT) reports break down the total open interest between
two (until 2009) or four (since 2009) categories of traders. We use this public information to
compute weekly measures of financial speculation in ag markets between 2000 and 2013.
COT reports classify large traders as either “commercial” or “non-commercial.”5 A
trading entity generally gets all of its futures and options positions in a given commodity
classified as “commercial” by filing a statement with the CFTC that it is commercially
“engaged in business activities hedged by the use of the futures or option markets” as defined
in CFTC regulations.6 The “non-commercial” group includes various types of mostly
financial traders such as hedge funds, mutual funds, floor brokers, etc.7
5 COT reports also provide data on the positions of non-reporting (i.e., small) traders. 6 To ensure that traders are classified accurately and consistently, the CFTC staff may exercise judgment in re-classifying a trader if it has additional information about the trader’s use of the markets. 7 Since 4 September 2009, COT reports split non-commercials between “managed money traders” (i.e., hedge funds) and “other non-commercial traders” with reportable positions. As of October 2013, however, the CFTC has not communicated any plan to make similarly detailed data available retroactively beyond 2006. We therefore rely on the legacy classification scheme to obtain a sufficiently long time series of position data for the VAR analyses in section 5.
7
4.2 Measuring the intensity of financial speculation
To measure the extent and growth of speculative activity in ag markets, we rely on
Working’s (1960) T index, which compares the activities of all “non-commercial”
commodity futures traders (typically called “speculators”) to the net demand for hedging
originating from “commercial” traders (also known as “hedgers”).
4.2.1 Measuring “excess” speculation
Working’s T index is predicated on the idea that, if long and short hedgers’ respective
positions in a given futures market were exactly balanced, then their positions would always
offset one another and speculators would not be needed in that market. In practice, of course,
long and short hedgers do not always wish to trade simultaneously or in the same quantity.
Hence, speculators must step in to fill the unmet hedging demand. Working’s T measures the
extent to which speculation exceeds the level required to offset any unbalanced hedging at
the market-clearing price (i.e., to satisfy hedgers’ net demand for hedging at that price).
For each commodity market in our sample, we use public COT data to compute
Working’s T every Tuesday from 2 January 2000 to 10 May 2013. This T index covers all
contract maturities. Formally, in the ith commodity market in week t:
𝑊𝑜𝑟𝑘𝑖𝑛𝑔′𝑠 𝑇𝑖,𝑡 ≡ 𝑇𝑖,𝑡 =
⎩⎪⎨
⎪⎧1 +
𝑆𝑆𝑖,𝑡𝐻𝐿𝑖,𝑡 + 𝐻𝑆𝑖,𝑡
𝑖𝑓 𝐻𝑆𝑖,𝑡 ≥ 𝐻𝐿𝑖,𝑡
1 + 𝑆𝐿𝑖,𝑡
𝐻𝐿𝑖,𝑡 + 𝐻𝑆𝑖,𝑡 𝑖𝑓 𝐻𝐿𝑖,𝑡 ≥ 𝐻𝑆𝑖,𝑡
(𝑖 = 1, … ,7),
where 𝑆𝑆𝑖,𝑡 ≥ 0 is the (absolute) magnitude of the short positions held in the aggregate by all
non-commercial traders (“Speculators Short”); 𝑆𝐿𝑖,𝑡 ≥ 0 is the (absolute) value of all non-
commercial long positions; 𝐻𝑆𝑖,𝑡 ≥ 0 stands for all commercial short positions (“Hedge
Short”); and 𝐻𝐿𝑖,𝑡 ≥ 0 stands for all long commercial positions.
We then average individual index values in the corn, soybean and wheat (cattle and
hogs) markets to provide an overall picture of financial activity in grain (livestock) markets:
𝑇𝑡 = �𝑤𝑖,𝑡𝑖
𝑇𝑖,𝑡,
8
where the weight 𝑤𝑖,𝑡 for commodity i in a given week t is based on the weight of the
commodity in the S&P GSCI index that year (Source: Standard and Poor’s), rescaled to
account for the fact that we focus on either four grain or three livestock markets (out of 24
S&P GSCI commodity markets).
4.2.2 Excess speculation in U.S. commodity futures markets, 2000–13
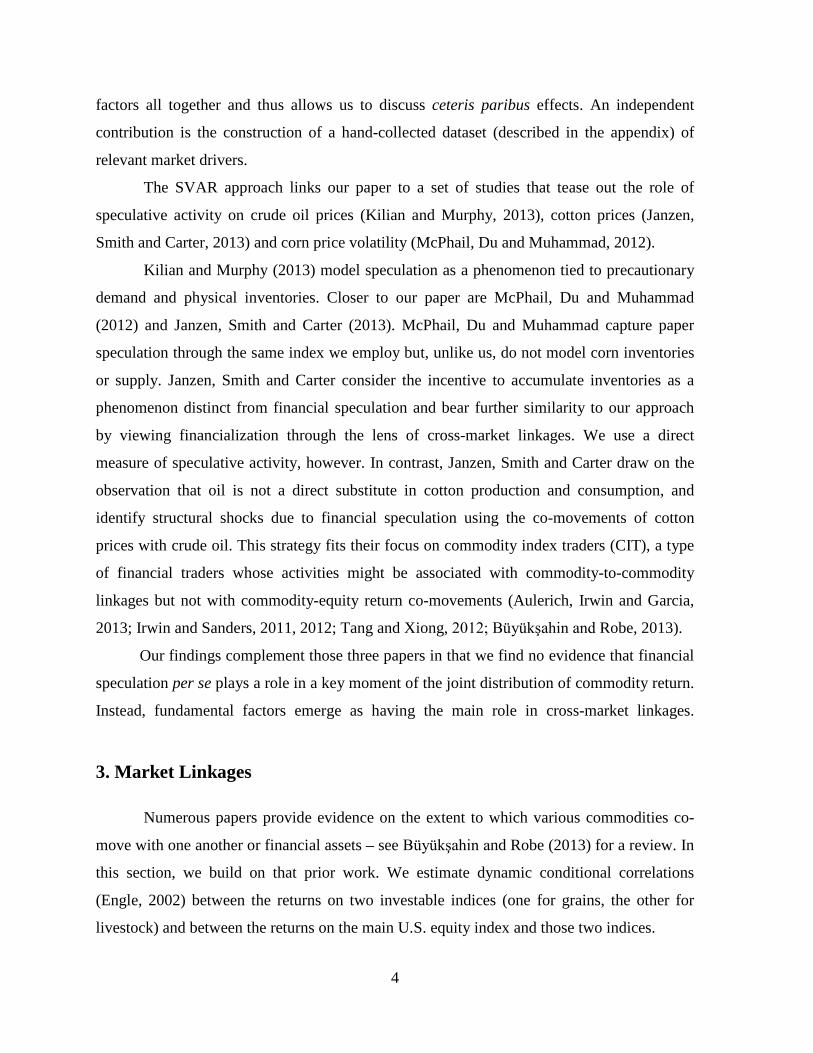
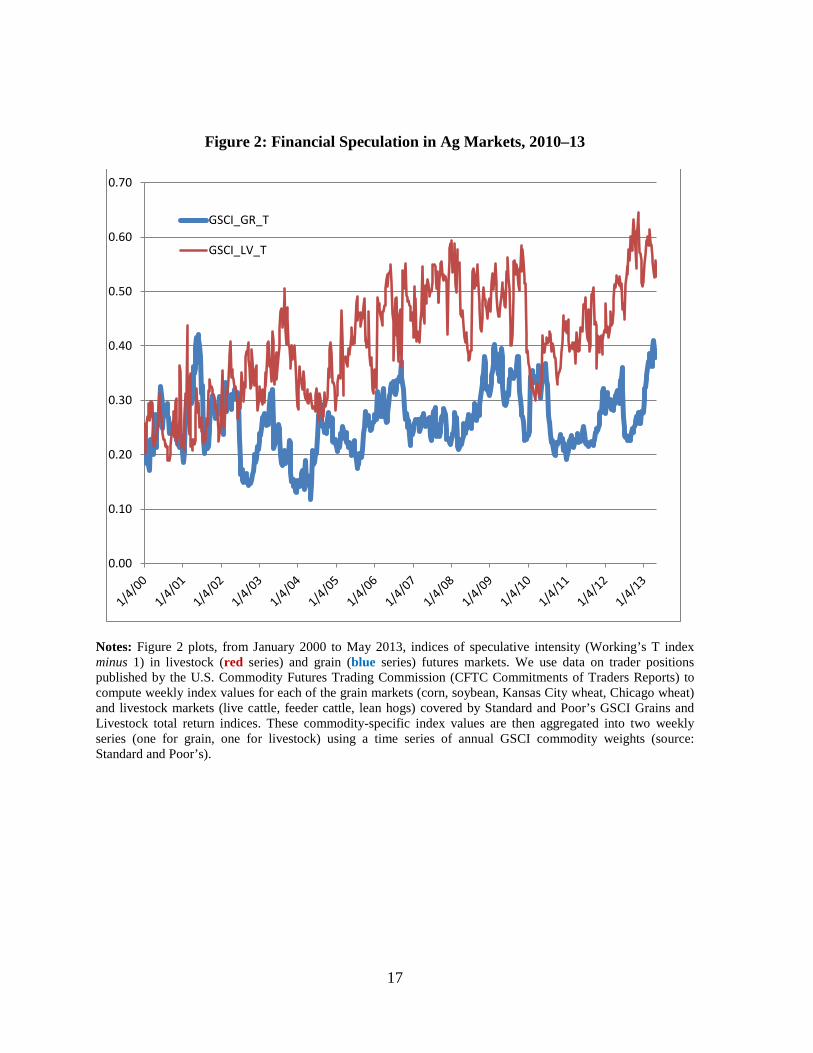
Figure 2 depicts, from 2000 to 2013, weighted-average speculative indices for grains
and for livestock. We net out 1 from the T index figures to facilitate the interpretation. The
minimum value is 0.12 (0.19) for grain (livestock); the maximum is 0.42 (0.69) for grain
(livestock). In other words, speculative positions in ag markets were, on average, 12% to 69%
greater than what was minimally necessary to meet net commercial hedging needs at the
market-clearing prices. Figure 2 identifies a substantial, long-term increase in the livestock T
index. The matching figure for grains doubled in 2004–08, yet for 2000–13 as a whole, the
grain T index did not experience any secular increase. Notably, both grain and livestock T
indices exhibit substantial volatility. Their patterns will be of particular interest in the
analysis below.
5. The Structural VAR Model
We propose a 4-variable SVAR model to jointly explain, and quantify empirically,
the relative importance of macroeconomic factors (demand), physical food market
fundamentals (supply, storage) and financial speculation (T) in explaining cross-market
return correlations (DCC).
The last two variables (T, DCC) have been discussed in earlier sections. We include a
proxy for the overall strength of consumption-linked demand, in line with evidence that
global economic growth is a key driver of commodity prices and that, in the past four
decades, “commodity booms were preceded by unusually high world economic growth,
especially in middle-income countries” (Carter, Rausser and Smith, 2011; see also Alquist
and Coibion, 2013). Specifically, we use the measure of cyclical fluctuations in global real
economic activity proposed by Kilian (2009). We denote it SHIP, because Kilian’s measure
is based on the cost of shipping dry freight (including grains) in bulk. This choice of world
demand proxy is similar to those made by, e.g., Kilian and Murphy (2013, oil); Janzen, Smith
9
and Carter (2013, cotton); and McPhail, Du and Muhammad (2012, corn). The series is
monthly; cubic splines yield weekly figures.
Grain supply is affected mostly by planting decisions (which, for most crops, are
made once a year) and by U.S. weather conditions (temperature and rain). Livestock supply
is indirectly affected by the same variables, in the specific case of corn. We take grain supply
into account through weather. Because weather is an exogenous variable, we treat it as such
in the SVAR (for this reason, the variable will not appear in the impulse response figures).
Lehecka (2012) shows that the impact of weather in grain markets can be captured by
a crop condition index computed from the U.S. Department of Agriculture (USDA) weekly
reports on crop progress and condition. We follow a similar approach and proxy each crop’s
supply situation through a weekly crop condition index. Ours is a cross-crop, mean-centered,
asymmetrically weighted average of the percentages of plots in very poor, poor, good or
excellent shape for each crop – see the appendix for full details.
We include inventories, in line with prior VAR studies of storable commodities (e.g.,
Kilian, 2009; Janzen, Smith and Carter, 2013). For grains, we build on work by Adjemian
(2012) showing that World Agricultural Supply and Demand Estimates (WASDE) monthly
forecasts of future grain storage levels contain new information.8,9 For livestock, we use beef
and pork stock levels taken from monthly USDA cold-storage reports. The appendix explains
how we construct each series.
For the data series {𝑦𝑡} consisting of the vector 𝑦𝑡 of the variables of interest, we
consider the system:
𝐴(𝐿)𝑦𝑡 = 𝜀𝑡,
where 𝐴(𝐿) is a matrix of polynomial in the lag operator L, and 𝜀𝑡 is a vector of
orthogonalized disturbances. For the four-variable VAR, we impose the Cholesky restrictions
by applying the following exclusion restrictions on contemporaneous responses in the matrix
A to fit a just-identified model: 8 We also conduct robustness analyses using, instead of WASDE-based figures, year-on-year changes in current storage levels (which we construct from quarterly USDA-National Agricultural Statistics Service (NASS) survey reports – see the appendix). 9 Depending on the month of the year when they are issued, crop forecasts contain information about expected grain supply and/or demand. We control for information about expected supply by including crop condition reports. Hence, to ensure that the storage series used only reflect grain usage forecasts, we “roll” (in a manner similar to the computation of roll returns) the monthly WASDE series for corn and soybean (wheat) from old crop to new crop reports in November (August) of each year.
10
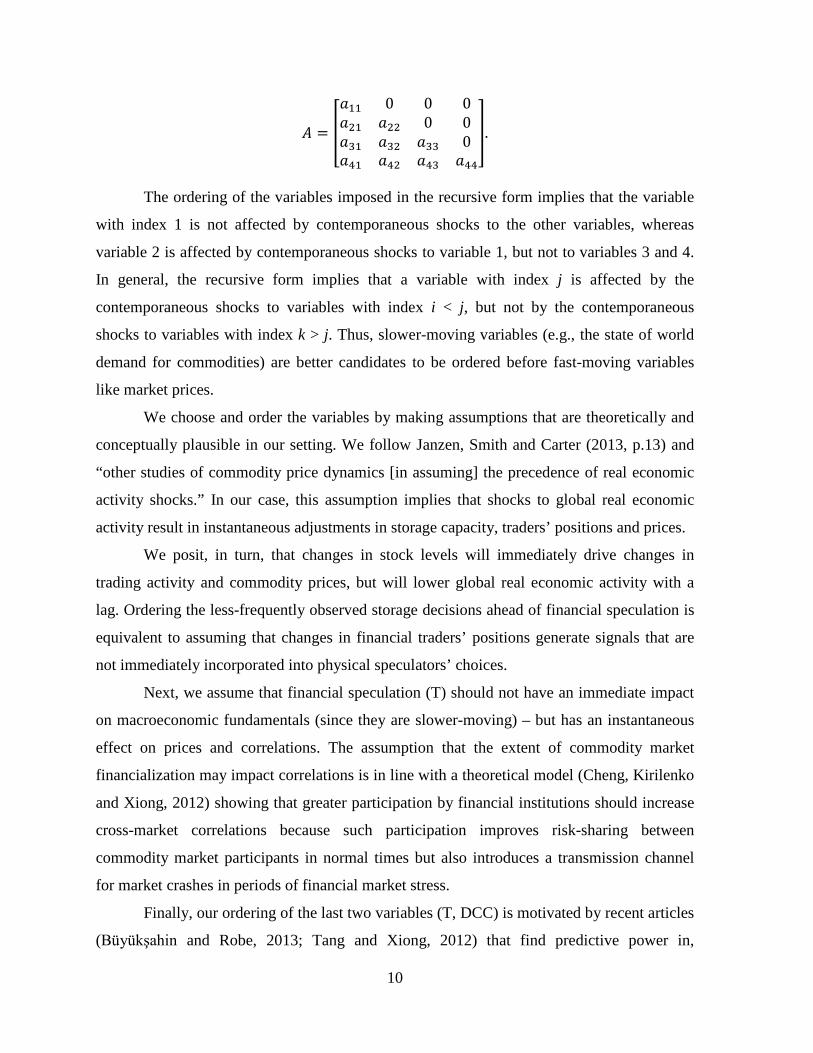
𝐴 = �
𝑎11 0 0 0𝑎21 𝑎22 0 0𝑎31 𝑎32 𝑎33 0𝑎41 𝑎42 𝑎43 𝑎44
�.
The ordering of the variables imposed in the recursive form implies that the variable
with index 1 is not affected by contemporaneous shocks to the other variables, whereas
variable 2 is affected by contemporaneous shocks to variable 1, but not to variables 3 and 4.
In general, the recursive form implies that a variable with index j is affected by the
contemporaneous shocks to variables with index i < j, but not by the contemporaneous
shocks to variables with index k > j. Thus, slower-moving variables (e.g., the state of world
demand for commodities) are better candidates to be ordered before fast-moving variables
like market prices.
We choose and order the variables by making assumptions that are theoretically and
conceptually plausible in our setting. We follow Janzen, Smith and Carter (2013, p.13) and
“other studies of commodity price dynamics [in assuming] the precedence of real economic
activity shocks.” In our case, this assumption implies that shocks to global real economic
activity result in instantaneous adjustments in storage capacity, traders’ positions and prices.
We posit, in turn, that changes in stock levels will immediately drive changes in
trading activity and commodity prices, but will lower global real economic activity with a
lag. Ordering the less-frequently observed storage decisions ahead of financial speculation is
equivalent to assuming that changes in financial traders’ positions generate signals that are
not immediately incorporated into physical speculators’ choices.
Next, we assume that financial speculation (T) should not have an immediate impact
on macroeconomic fundamentals (since they are slower-moving) – but has an instantaneous
effect on prices and correlations. The assumption that the extent of commodity market
financialization may impact correlations is in line with a theoretical model (Cheng, Kirilenko
and Xiong, 2012) showing that greater participation by financial institutions should increase
cross-market correlations because such participation improves risk-sharing between
commodity market participants in normal times but also introduces a transmission channel
for market crashes in periods of financial market stress.
Finally, our ordering of the last two variables (T, DCC) is motivated by recent articles
(Büyükşahin and Robe, 2013; Tang and Xiong, 2012) that find predictive power in,
11
respectively, the positions of hedge fund for equity-commodity linkages and of index traders
for cross-commodity linkages.
We select lag lengths using the Akaike information criteria (AIC), and we compute
bootstrapped confidence intervals based on 500 replications. Results are reported with 90%
confidence intervals.
Estimations are run for two sample periods separately: from 2 January 2000 to 16
September 2008, and from 16 September 2008 until the end of 2011. Zivot-Andrews unit
root tests detect a structural break in ag-equity correlations (DCC) in the immediate weeks
after the Lehman collapse. Our estimations are therefore for the periods before and after the
Lehman crash. We end the second subperiod in December 2011 because the plot of cross-
market correlations in Figure 1 suggests the possibility of the start of a second structural
break after 2011 (corresponding roughly with the end of the euro crisis).
For grains, we propose that the dynamic conditional grain/equity return correlations
(DCC Grains-S&P) are driven by shocks in (i) the macroeconomy (SHIP); (ii) inventories
(Grain Storage); and (iii) speculative activity (Grains T). We also use, as an exogenous
variable, our weekly weighted-average index of new-crop conditions for soybean, wheat and
corn. Pre-crisis estimations are run with eight lags, whilst post-crisis estimations are run with
five lags following the AIC.
For livestock, we assume that the dynamic conditional livestock/equity return
correlations (DCC Livestock-S&P) are driven by shocks to (i) macroeconomic conditions
(SHIP); (ii) storage conditions (Cold Storage); and (iii) speculative activity (Livestock T).
We also use two exogenous variables in the livestock model. One is our index of the new
corn crop’s condition, recognizing corn’s role in livestock production. The other is a dummy
that we set equal to 1 (and 0 otherwise) for the swine flu epidemic in 2009 (relevant to the
post-crisis analysis only) as well as for the first cases of mad cow disease in 2003–04
(relevant to the pre-crisis period only).10 Both post- and pre-Lehman estimations are run with
four lags, following the AIC.
10 We include demand dummies to account for exogenous shocks to demand for pork and beef. They cover two periods (23 December 2003 to 30 April 2004, and 18 April to 31 August 2009), to account for the first U.S. episodes of mad cow disease (bovine spongiform encephalopathy, or BSE) and swine flu (H1N1 virus). The time intervals are based on empirical evidence that the market impact lasted approximately four months – see, e.g., Attavanich, McCarl and Bessler (2011) for swine flu and Pozo and Schroeder (2012) for mad cow disease.
12
An analysis of the dynamic conditional grain/livestock return correlations (DCC
Livestock-Grains) is included in the appendix; it follows a similar methodology.
5.1 Results
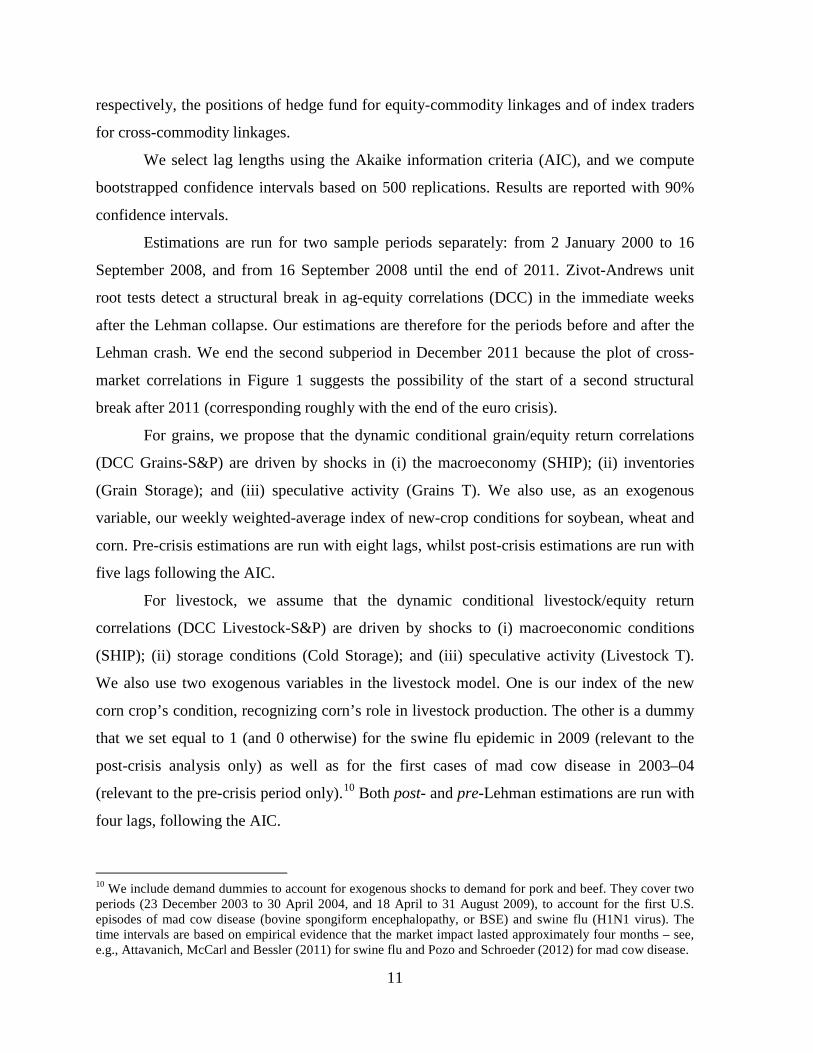
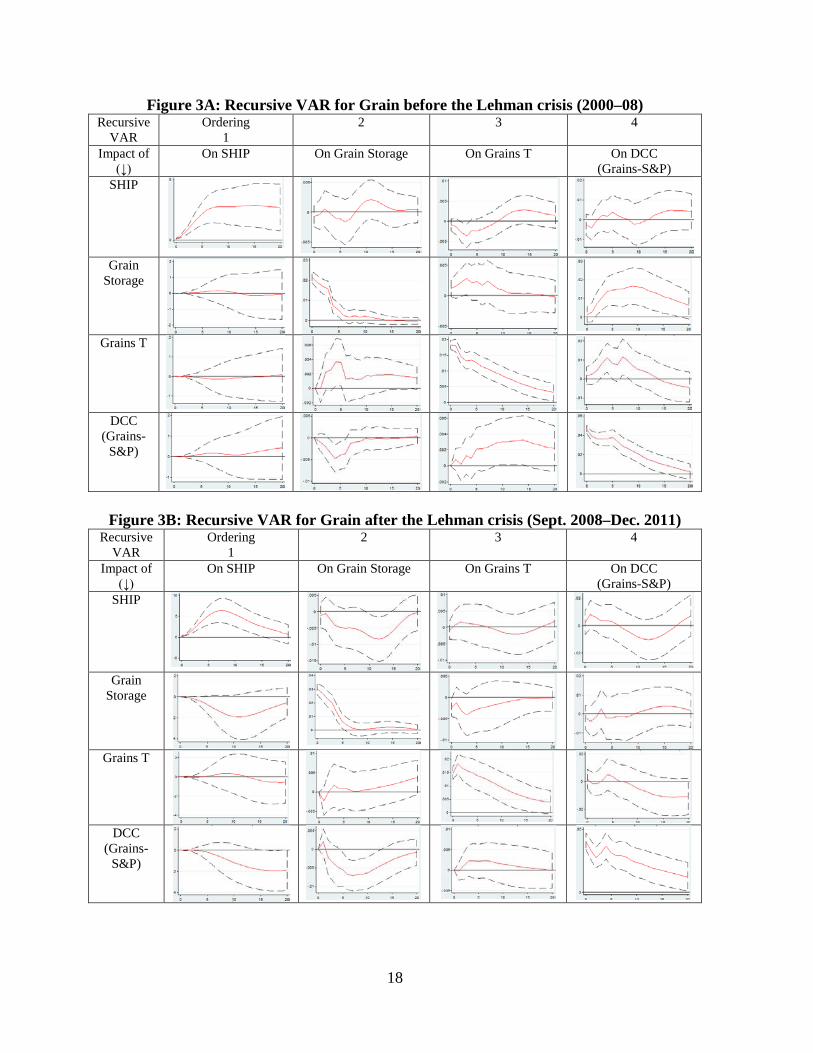
Figures 3 and 4 (Panels A and B) show the impulse-response functions from our four
variable recursive VAR with 90 percent confidence bands for grains and livestock futures
markets, respectively. In each figure, Panel A reports the pre-Lehman period results and
Panel B reports the post-Lehman results. Results are organized so that the rows of a matrix
indicate the variable whose shock we are following, while the columns of the same matrix
indicate the variable whose response we are tracking. Each chart within the panels gives the
impulse responses over 20 weeks to a one-standard-deviation shock to the variable identified
in the first column.
Figure 3 Panel A shows that an increase in speculative activity (Grains T) leads to an
increase in the dynamic conditional grain/equity return correlations (DCC Grains-S&P) in
weeks 3, 4, 7 and 8. The other panels reveal the mechanism through which such an effect
takes place. Deteriorating macroeconomic conditions (SHIP) lead to an increase in
speculative activity (Grains T) after 2 and 3 weeks, with a feedback effect seen in increased
food storage (Grain Storage) after 4 and 5 weeks. We interpret those results as evidence that
speculative intensity does not in itself affect the extent to which grain markets move in sync
with the stock market – rather, financial speculators’ futures positions simply facilitated the
transmission of the inital macroeconomic shock into grain markets.
Panel B of Figure 3 shows that in the post-Lehman period, this transmission channel
is weakened to the point of statistical insignificance. Macroeconomic conditions affect
storage decisions after 10 weeks, with an impact that remains significant until 14 weeks. We
do not, however, observe any significant impact on grain/equity return correlations, a result
that may be due to the period of high volatility and uncertainty in the financial markets.
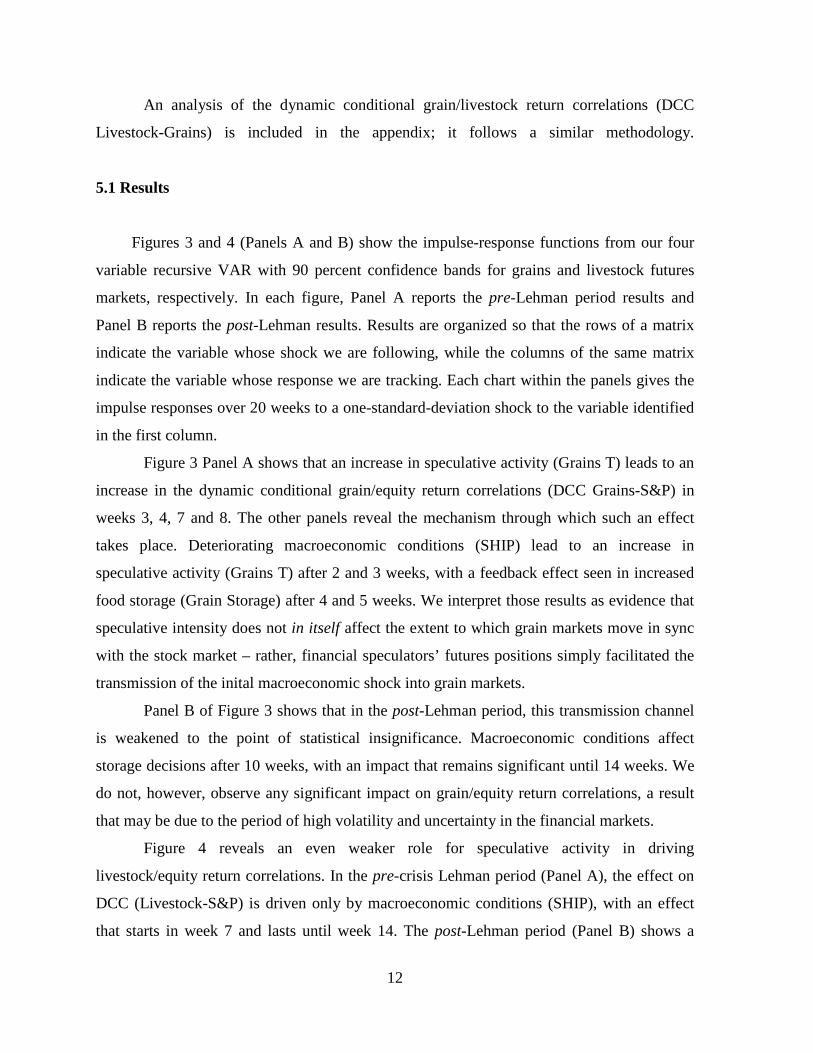
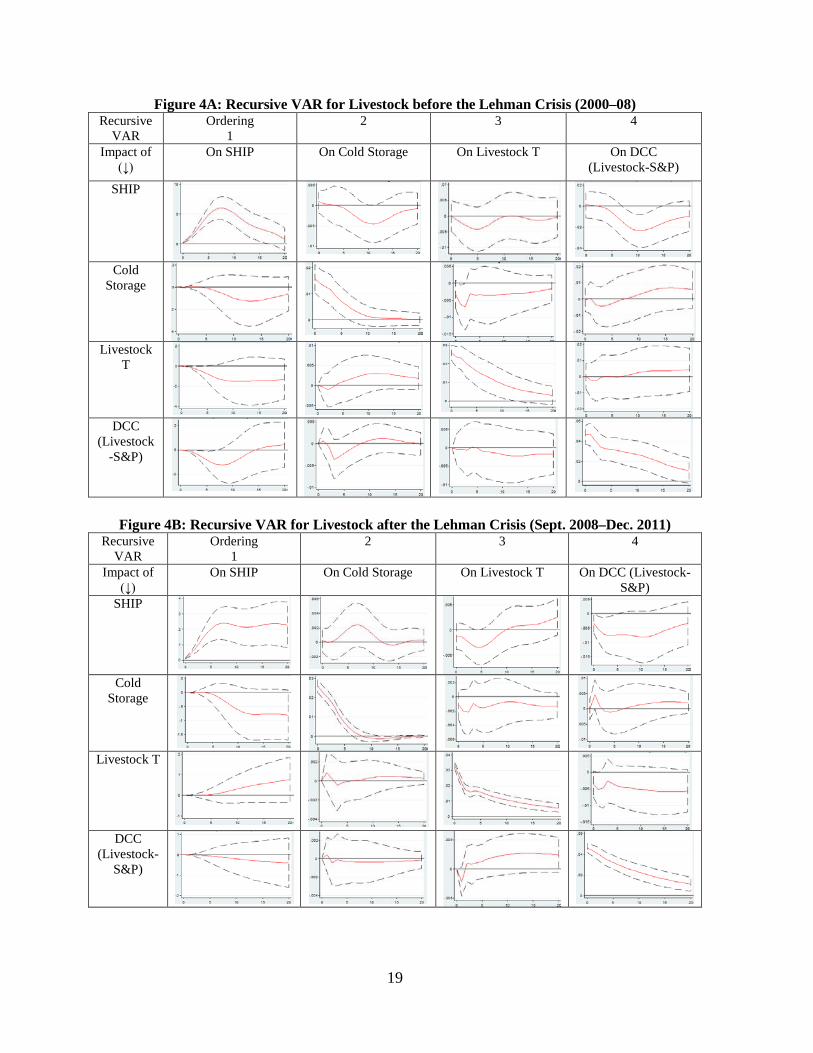
Figure 4 reveals an even weaker role for speculative activity in driving
livestock/equity return correlations. In the pre-crisis Lehman period (Panel A), the effect on
DCC (Livestock-S&P) is driven only by macroeconomic conditions (SHIP), with an effect
that starts in week 7 and lasts until week 14. The post-Lehman period (Panel B) shows a
13
similar pattern – although, here, macroeconomic conditions have a much faster (if less
durable) impact on DCC (Livestock-S&P) return correlations that starts in week 1 and lasts
until week 5. Whether pre- or post-Lehman, we find no evidence of a statistically significant
role for speculative activity (Livestock T) on livestock/equity return correlations.
Results from the grain/livestock return correlations (not reported, for space reasons,
but available upon request) bear strong similarities to the equity-commodity results. They
confirm the important role of macroeconomic fundamentals in driving return co-movements.
Taken together, our results show that, for grain as well as livestock markets, the
trading activities in commodity “paper markets” of financial institutions such as hedge funds
are not the main explanatory factor of cross-market linkages, thus casting doubts on the claim
that food markets have become “financialized.”
6. Conclusions
Commodity-equity and cross-commodity return co-movements rose sharply after the
2008 financial crisis. This development took place following what has been dubbed the
“financialization” of commodity markets. Using a dataset of trader positions in U.S. futures
markets, we first document changes since 2000 in the intensity of financial speculation in
grain and livestock futures. We then use a structural VAR model to establish whether
speculative activity can help explain the strength of co-movements between grain, livestock
and equity returns. Because the correlations all experience a structural break after September
2008, we analyze the pre- and post-crisis periods separately. In 2000–08, we identify a causal
relationship from the intensity of speculative activity to the strength of equity-grain linkages.
However, we find that speculative intensity does not in itself affect the extent to which grains
move in sync with equities – rather, pre-crisis, financial speculators’ futures positions helped
transmit macroeconomic shocks into grain markets. Strikingly, in the post-crisis period, this
transmission channel weakened to the point of statistical insignificance. The role of
speculative activity is even weaker in livestock markets, where only macroeconomic
conditions have an impact on return co-movements with equities.
14
References
Acharya, V.V., L.A. Lochstoer, and T. Ramadorai. 2013. “Limits to Arbitrage and Hedging: Evidence from Commodity Markets.” Journal of Financial Economics 109(2):441–465.
Adjemian, M.K. 2012. “Quantifying the WASDE Announcement Effect.” American Journal
of Agricultural Economics 94(1):238–256. Alquist, R. and O. Coibion. 2013. “The Comovement in Commodity Prices: Sources and
Implications.” Working Paper, University of Texas at Austin, May. Attavanich, W., B.A. McCarl, and D. Bessler. 2011. “The Effect of H1N1 (Swine Flu) Media
Coverage on Agricultural Commodity Markets.” Applied Economic Perspectives and Policy 33(2):241–259.
Aulerich, N.M., S.H. Irwin, and P. Garcia. 2013. “Bubbles, Food Prices, and Speculation:
Evidence from the CFTC’s Daily Large Trader Data Files.” NBER Working Paper No. 19065, May.
Başak, S. and A. Pavlova. 2013. “A Model of Financialization of Commodities.” Working
Paper, London Business School, March. Updated, May. Bessembinder, H. 1992. “Systematic Risk, Hedging Pressure, and Risk Premiums in Futures
Markets.” Review of Financial Studies 5(4):637–667. Bhardwaj, G. and A. Dunsby. 2012. “The Business Cycle and the Correlation between Stocks
and Commodities.” SSRN Working Paper No. 2005788. Brunetti, C. and D. Reiffen. 2011. “Commodity Index Trading and Hedging Costs.” Federal
Reserve Board Finance & Economics Discussion Series Paper 2011–57, August. Büyükşahin, B., M.S. Haigh, and M.A. Robe. 2010. “Commodities and Equities: Ever a
‘Market of One’?” Journal of Alternative Investments 12(3):75–95. Büyükşahin, B. and M.A. Robe. 2011. “Does Paper Oil Matter?” Working Paper, CFTC and
American University, July. ——. 2013. “Speculators, Commodities and Cross-Market Linkages.” Journal of International Money and Finance: In Press. Carter, C.A., G.C. Rausser, and A.D. Smith. 2011. “Commodity Booms and Busts.” Annual
Review of Resource Economics 3:87–118. Cheng, I., A. Kirilenko, and W. Xiong. 2012. “Convective Risk Flows in Commodity Futures
Markets.” NBER Working Paper No. 17921, March. Engle, R. 2002. “Dynamic Conditional Correlation: A Simple Class of Multivariate
Generalized Autoregressive Conditional Heteroskedasticity Models.” Journal of Business and Economic Statistics 20(3):339–350.
15
Fattouh, B., L. Kilian, and L. Mahadeva. 2013. “The Role of Speculation in Oil Markets: What Have We Learned So Far?” Energy Journal 34(3): In press.
Gromb, D. and D. Vayanos. 2010. “Limits of Arbitrage: The State of the Theory.” NBER
Working Paper No. 15821, March. Hamilton, J.D. and J.C. Wu. 2013. “Effects of Index-Fund Investing on Commodity Futures
Prices.” Working Paper, University of Chicago, October. Irwin, S.H. and D.R. Sanders. 2011. “Index Funds, Financialization, and Commodity Futures
Markets.” Applied Economic Perspectives and Policy 34:1–31. ——. 2012. “Testing the Masters Hypothesis in Commodity Futures Markets.” Energy
Economics 34(1):256–69. Janzen, J.P., A.D. Smith, and C.A. Carter. 2013. “Commodity Price Comovement and
Financial Speculation: The Case of Cotton.” Working Paper, University of California at Davis, March.
Kilian, L. 2009. “Not All Oil Price Shocks Are Alike: Disentangling Demand and Supply
Shocks in the Crude Oil Market.” American Economic Review 99(3):1053–1069. Kilian, L. and D. Murphy. 2013. “The Role of Inventories and Speculative Trading in the
Global Market for Crude Oil.” Journal of Applied Econometrics: In press. Lehecka, G.V. 2013. “The Reaction of Corn and Soybean Futures Markets to USDA Crop
Progress and Condition Information.” Paper presented at the Southern Agricultural Economics Association Annual (SAEA) Meeting, Orlando, FL.
McPhail, L.L., X. Du, and A. Muhammad. 2012. “Disentangling Corn Price Volatility: The
Role of Global Demand, Speculation, and Energy.” Journal of Agricultural and Applied Economics 44(3):401–410.
Pozo, V.F. and T.C. Schroeder. 2012. “Price and Volatility Spillover between Livestock and
Related Commodity Markets.” Paper presented at AAEA Annual Meeting, Seattle, Washington, August.
Raman, V., M.A. Robe, and P.K. Yadav. 2012. “Electronic Market Makers and Market
Fragility: Empirical Evidence.” Unpublished Working Paper, U.S. CFTC, December. Tang, K. and W. Xiong. 2012. “Index Investing and the Financialization of Commodities.”
Financial Analysts Journal 68 (6):54–74. Working, H. 1960. “Speculation on Hedging Markets.” Stanford University Food Research
Institute Studies 1: 185–220.
16
Figure 1: Return Correlations (DCC) between Equity, Grain and Livestock Indices, 1995–2013
Notes: Figure 1 depicts, from 3 January 1995 to 7 May 2013, time-varying correlations between weekly unlevered rates of return (precisely, changes in log prices) on the S&P 500 equity index and S&P GSCI total return Grain index (GRTR, blue); S&P 500 equity index and S&P GSCI total return Livestock index (LVTR, red); or GRTR and LVTR indices (green). In each case, we estimate dynamic conditional correlation (DCC) by log-likehood for a mean-reverting model (Engle, 2002) using Tuesday-to-Tuesday returns from 3 January 1995 to 10 May 2013. The shaded bands identify weeks in the periods classified by the U.S. National Bureau of Economic Research as recessions (Source: NBER).
-0.4
-0.2
0
0.2
0.4
0.6NBER RecessionsDCC_SP_GCGRTRDCC_SP_GCLVTRDCC_GCGRTR_GCLVTR
17
Figure 2: Financial Speculation in Ag Markets, 2010–13
Notes: Figure 2 plots, from January 2000 to May 2013, indices of speculative intensity (Working’s T index minus 1) in livestock (red series) and grain (blue series) futures markets. We use data on trader positions published by the U.S. Commodity Futures Trading Commission (CFTC Commitments of Traders Reports) to compute weekly index values for each of the grain markets (corn, soybean, Kansas City wheat, Chicago wheat) and livestock markets (live cattle, feeder cattle, lean hogs) covered by Standard and Poor’s GSCI Grains and Livestock total return indices. These commodity-specific index values are then aggregated into two weekly series (one for grain, one for livestock) using a time series of annual GSCI commodity weights (source: Standard and Poor’s).
0.00
0.10
0.20
0.30
0.40
0.50
0.60
0.70
GSCI_GR_T
GSCI_LV_T
18
Figure 3A: Recursive VAR for Grain before the Lehman crisis (2000–08) Recursive
VAR Ordering
1 2 3 4
Impact of (↓)
On SHIP On Grain Storage On Grains T On DCC (Grains-S&P)
SHIP
Grain
Storage
Grains T
DCC
(Grains-S&P)
Figure 3B: Recursive VAR for Grain after the Lehman crisis (Sept. 2008–Dec. 2011) Recursive
VAR Ordering
1 2 3 4
Impact of (↓)
On SHIP On Grain Storage On Grains T On DCC (Grains-S&P)
SHIP
Grain
Storage
Grains T
DCC
(Grains-S&P)
19
Figure 4A: Recursive VAR for Livestock before the Lehman Crisis (2000–08) Recursive
VAR Ordering
1 2 3 4
Impact of (↓)
On SHIP On Cold Storage On Livestock T On DCC (Livestock-S&P)
SHIP
Cold
Storage
Livestock
T
DCC
(Livestock-S&P)
Figure 4B: Recursive VAR for Livestock after the Lehman Crisis (Sept. 2008–Dec. 2011) Recursive
VAR Ordering
1 2 3 4
Impact of (↓)
On SHIP On Cold Storage On Livestock T On DCC (Livestock-S&P)
SHIP
Cold
Storage
Livestock T
DCC
(Livestock-S&P)
20
Appendix
This appendix consists of three parts. The first discusses how the dataset containing
the return series, DCC estimates, and fundamental and financial variables was constructed.
The second part provides references to justify our choices of time dummies covering the
initial episodes of mad cow disease and swine flu (H1N1). The third part summarizes our
analysis of the grain-livestock return co-movements, to which we merely allude in the paper
for brevity.
A. Data Construction
The construction of the DCC series is described in the main text. We focus on
Tuesday-to-Tuesday returns for two reasons. First, we seek to avoid “Monday” and “end-of-
the-week” effects. Second, it is Tuesday end-of-day futures and options positions that the
CFTC’s weekly Commitments of Traders Reports aggregate. When the Tuesday of a given
week is a holiday, we use the Wednesday immediately following the holiday. If the latter is
also a holiday, then we select the Monday prior to the Tuesday. For robustness, we also
computed Wednesday-to-Wednesday DCC estimates and verified visually that their time
patterns are qualitatively similar.
The SHIP variable, which captures world business cycles (Kilian, 2009), is described
in the main text. An updated monthly series (M1.1968-M3.2013) was obtained from the
website of the variable’s inventor, Lutz Kilian. We use cubic splines to obtain weekly values.
The variables that we construct to summarize crop condition reports, grain storage
levels, future grain stock forecasts and meat cold-storage levels are all based on USDA data.
With the exception of the crop condition reports, which are weekly, all the underlying data
are monthly or quarterly. In all cases, we therefore extract from the USDA’s website the date
and time of the relevant USDA announcements, and then create weekly series such that the
value taken by any of our variables on a given Tuesday matches the information that was
available to futures traders before futures markets closed that Tuesday.
Lehecka (2012) shows that USDA reports on the progress and condition of selected
crops in major producing states (which “represent direct assessments of the overall status of a
21
crop on a weekly basis throughout the growing season”) contain significant price-moving
information during “the relevant part of the year (i.e., when the new crop has been planted).”
He further shows that the price impact is attributable to the condition reports. Accordingly,
we update Georg Lehecka’s dataset of crop condition reports through May 2013 in order to
construct an index that captures, for each crop, its state of progress. On a given week, our
index for a crop is a weighted average of the percentages of very poor, poor, good and
excellent reports. We consider several linear and non-linear weighing schemes. For the
paper, we start with a quadratic weighing scheme that gives more importance to poor reports.
We then de-mean the resulting series. Mean-centering is all the more important given that the
report value is zero on weeks when there is nothing yet in the ground. Finally, we compute a
weighted average of these individual-grain indices using the annual GSCI weights for corn,
soybean, and wheat (properly rescaled to sum up to 1).
For meat cold storage, we use the USDA’s total figures for beef and pork (excluding
frozen hams). The USDA cold-storage reports are released several weeks after the time when
the stocks were actually measured. For the VAR analysis, we therefore time-shift (forward)
the stock series to ensure synchronicity with our other variables.
For grain storage, we construct two weekly variables for each grain. We also compute
weighted averages for all grains, using annual GSCI weights (properly rescaled to sum up to
100%).
1. We use quarterly USDA-NASS grain stock surveys to create weekly series of year-on-year
first differences in storage levels. Differencing takes care both (i) of the seasonality in
stock levels (we take extra care at quarter ends that comparable figures are being
differenced) and (ii) of a non-stationarity due to a secular increase in corn storage figures
after 2005 (likely due to the sharp increase in ethanol demand from that year onward).
2. We also use monthly WASDE September-stock forecasts. One difficulty is that the
information content of these monthly forecasts varies over the course of a year. Depending
on the month of the year when they are issued, crop forecasts contain information about
expected grain supply and/or demand. We already control for information about supply
via crop condition reports. Hence, to ensure that the storage series we use consistently
22
reflect grain usage forecasts, we “roll” the monthly WASDE series for corn and soybean
(wheat) from old crop to new crop reports in November (August) of each year. We use
weekly series of month-on-month differences in our econometric analyses: to that effect,
we take care that the change at the beginning of a “roll month” compares the “new crop”
figures that month with the “new crop” figures of the previous (pre-roll) month.
The construction of various Working T indices is detailed in the main text. The
position data used to construct the T series are published by the CFTC on Fridays based on
Tuesday data on the end-of-day positions of individual traders. When Tuesday is a holiday,
the CFTC uses the end-of-day positions of the following Wednesday. For the week of 11
September 2001, we used the figures for the prior Tuesday.
B. Shocks in the Livestock Space
We include demand dummies to account for exogenous shocks to demand for pork
and beef. They cover two periods (23 December 2003 to 30 April 2004, and 18 April to 31
August 2009) to account for the lasting impacts of the first U.S. episodes of mad cow disease
(bovine spongiform encephalopathy, or BSE) and swine flu (H1N1 virus). The time intervals
are based on empirical evidence that the market impact of those two events lasted
approximately four months in each case. In the main text (see footnote 10), we justify those
choices by referring to recent papers by Attavanich, McCarl and Bessler (2011) in the case of
swine flu and Pozo and Schroeder (2012) in the case of mad cow disease. We consulted a
number of additional papers, all of which also support our choice. Those papers are listed at
the end of this appendix.
C. VAR Analysis of Grain-Livestock (cross-commodity) Return DCC
For a cross-commodity analysis, we estimate dynamic conditional correlations
(Engle, 2002) between the returns on two investable ag indices: the total return S&P GSCI
indices for grains and for livestock. Figure 1 in the main text depicts in green the evolution of
that variable. It displays the same sharp rise in autumn 2008 as for the grain-equity and
livestock-equity DCC series.
23
For the structural VAR, we propose that the dynamic conditional grain/equity return
correlations (DCC Grains-Livestock) are driven by shocks in (i) macroeconomic conditions
(SHIP); (ii) storage capacity (Corn Storage); and (iii) speculative activity (Non-Energy T),
with this third variable computed as a weighted average of all non-energy commodities
included in the S&P GSCI index (properly rescaled to account for the fact that the weights do
not sum up to zero). Mad cow and swine flu dummies are included as exogenous variables,
as is the corn crop progress report. Pre-crisis estimations are run with seven lags, whilst post-
crisis estimations are run with five lags following the AIC.
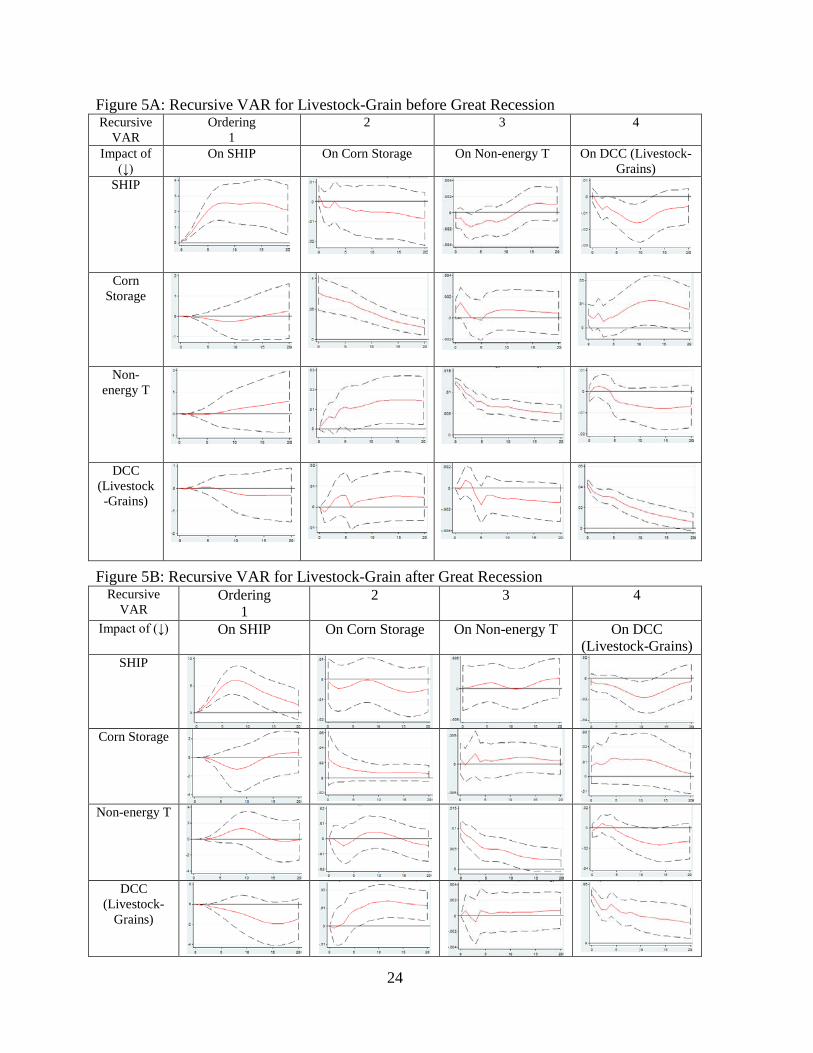
Figure 5 (Panels A and B) shows the impulse-response functions from our four
variable recursive VAR with 90 percent confidence bands. As with Figures 3 and 4 in the
main text, Panel A reports the pre-Lehman period results and Panel B reports the post-
Lehman results. Results are again organized so that the rows of a matrix indicate the variable
whose shock we are following, while the columns of the same matrix indicate the variable
whose response we are tracking. Each chart within the panels gives the impulse responses
over 20 weeks to a one-standard-deviation shock to the variable identified in the first column.
We see from Figure 5 (Panel A) that improvements in macroeconomic conditions
(SHIP) lead to a decrease in the dynamic conditional grain/livestock return correlations
(DCC Livestock-Grains) in week 2 and in weeks 4 to 12. A positive shock to SHIP also leads
to a decrease in financial speculation (Non-Energy T) in week 3, which in turn leads to a
persistent decrease in food storage (Corn Storage) starting in week 4, though that persistent
decrease carries no significant effect on correlations (DCC Livestock-Grains). Panel B of
Figure 5 shows that, in the post-Lehman period, a positive shock to SHIP leads to a decrease
in the dynamic conditional grain/livestock return correlations (DCC Livestock-Grains)
between weeks 7 and 12. We interpret those results as evidence that fundamentals matter the
most.
24
Figure 5A: Recursive VAR for Livestock-Grain before Great Recession Recursive
VAR Ordering
1 2 3 4
Impact of (↓)
On SHIP On Corn Storage On Non-energy T On DCC (Livestock-Grains)
SHIP
Corn Storage
Non-energy T
DCC (Livestock-Grains)
Figure 5B: Recursive VAR for Livestock-Grain after Great Recession Recursive
VAR Ordering
1 2 3 4
Impact of (↓) On SHIP On Corn Storage On Non-energy T On DCC (Livestock-Grains)
SHIP
Corn Storage
Non-energy T
DCC
(Livestock-Grains)
25
Appendix References and Bibliography
Adjemian, M.K. 2012. “Quantifying the WASDE Announcement Effect.” American Journal of Agricultural Economics 94(1):238-256.
Attavanich, W., B.A. McCarl, and D. Bessler. 2011. “The Effect of H1N1 (Swine Flu) Media
Coverage on Agricultural Commodity Markets.” Applied Economic Perspectives and Policy 33(2):241-259.
Boudoukh, J., M. Richardson, Y.J. Shen, and R.F. Whitelaw. 2004. “Do Asset Prices Reflect
Fundamentals? Freshly Squeezed Evidence from the OJ Market.” Journal of Financial Economics 83(2):397-412.
Brittain, L., P. Garcia, and S.H. Irwin. 2009. “Live and Feeder Cattle Options Markets:
Returns, Risk, and Volatility Forecasting.” Paper presented at NCCC-134 Conference on Applied Commodity Price Analysis, Forecasting, and Market Risk Management, St. Louis, Missouri, April.
Büyükşahin, B., M.S. Haigh, and M.A. Robe. 2010. “Commodities and Equities: Ever a
‘Market of One’?” Journal of Alternative Investments 12(3):75-95. Carter, C.A., G.C. Rausser, and A.D. Smith. 2012. “The Effect of Ethanol Production on
Corn Prices.” Working Paper, University of California at Davis, October. Centers for Disease Control and Prevention. 2010. The 2009 H1N1 Pandemic: Summary
Highlights, April 2009-April 2010. Atlanta, June. Coffey, B., J. Mintert, S. Fox, T. Schroeder, and L. Valentin. 2005. “The Economic Impact
of BSE on the U.S. Beef Industry: Product Value Losses, Regulatory Costs, and Consumer Reactions.” Dept. Agr. Econ. MF-2678, Kansas State University, April.
Deb, P., P.K. Trivedi, and P. Varangis. 1996. “The Excess Co-Movement of Commodity
Prices Reconsidered.” Journal of Applied Econometrics 11(3):275-291. Devadoss, S., D.W. Holland, L. Stodick, and J. Ghosh. 2006. “A General Equilibrium
Analysis of Foreign and Domestic Demand Shocks Arising from Mad Cow Disease in the United States.” Journal of Agricultural and Resource Economics 31(2):441-453.
Ding, Y., M. Veeman, and W. Adamowicz. 2009. “BSE and the Dynamics of Beef
Consumption: Influences of Habit and Trust.” Paper presented at AAEA & ACCI Joint Annual Meeting, Milwaukee, Wisconsin, July.
——. 2011. “Influence on Generalized Trust on Canadian Consumers’ Reactions to Three
Recurring BSE Cases.” Paper presented at AARES Annual Meeting, Melbourne, February.
Du, X. and L.L. McPhail. 2012. “Inside the Black Box: the Price Linkage and Transmission
between Energy and Agricultural Markets.” Energy Journal 33(2):171-194.
26
Engle, R. 2002. “Dynamic Conditional Correlation: A Simple Class of Multivariate
Generalized Autoregressive Conditional Heteroskedasticity Models.” Journal of Business and Economic Statistics 20(3):339–350.
Fattouh, B. and L. Mahadeva. 2013. “Causes and Implications of Shifts in Financial
Participation in Commodity Markets.” Working Paper, University of Oxford, February. Hyland, J.T. and K. Nelson. 2012. “Agriculture Investing: Market Fundamentals and
Opportunities.” Webcast, United States Commodity Funds LLC, June. Johnson, C.E. 2009. Determination that a Public Health Emergency Exists. Washington,
D.C.:U.S. Department of Health & Human Services, FLU.gov, April. Kilian, L. 2009. “Not All Oil Price Shocks Are Alike: Disentangling Demand and Supply
Shocks in the Crude Oil Market.” American Economic Review 99(3):1053–1069. Lehecka, G.V. 2013. “The Reaction of Corn and Soybean Futures Markets to USDA Crop
Progress and Condition Information.” Working Paper, University of Illinois, Urbana-Champaign, May.
Manera, M., M. Nicolini, and I. Vignati. 2013. “Financial Speculation in Energy and
Agriculture Futures Markets: A Multivariate GARCH Approach.” Energy Journal 34(3): In press.
Peñaranda, F. and A.R. Micola. 2011. “On the Drivers of Commodity Co-Movement:
Evidence from Biofuels.” Discussion Paper No. 695, Financial Markets Group, Universita Pompeu Frabra, December.
Pozo, V. and T.C. Schroeder. 2012. “Price and Volatility Spillover between Livestock and
Related Commodity Markets.” Paper presented at AAEA Annual Meeting, Seattle, Washington, August.
Sanders, D.R., S.H. Irwin, and R.P. Merrin. 2010. “The Adequacy of Speculation in
Agricultural Futures Markets: Too Much of a Good Thing?” Applied Economic Perspectives and Policy 32(1):77-94.
Schlenker, W. and S.B. Villas-Boas. 2008. “Consumer and Market Responses to Mad Cow
Disease.” Working Paper, Department of Agricultural and Resource Economics, University of California at Berkeley, June.
Singleton, K.J. 2013. “Investor Flows and the 2008 Boom/Bust in Oil Prices.” Working
Paper, Stanford Graduate School of Business, 2011. Management Science in press. Stoll, H.R. and R.E. Whaley. 2010. “Commodity Index Investing and Commodity Futures
Prices.” Journal of Applied Finance 1:7-46.
27
Thomsen, M.R., A. McKenzie, and G.J. Power. 2009. “Volatility Surface and Skewness in Live Cattle Futures Price Distributions with Application to North American BSE Announcements.” Paper presented at AAEA & ACCI Joint Annual Meeting, Milwaukee, Wisconsin, July.
Tse, Y. and J.C. Hackard. 2006. “Holy Mad Cow! Facts or (Mis)Perceptions: A Clinical
Study.” Journal of Futures Markets 26:315-346. United Nations, World Health Organization, Global Alert and Response. 2009. Influenza-like
illness in the United States and Mexico. Washington, D.C., April. U.S. Department of Agriculture. 2013. “Frequently Asked Questions on BSE (Bovine
Spongiform Encephalopathy or Mad Cow Disease.” Washington, D.C., March. U.S. Department of Agriculture, Animal and Plant Health Inspection Service. 2004.
Summary Report: Epidemiology Investigation of Washington State BSE Case. Washington, D.C., March.
U.S. Department of Agriculture, Animal and Plant Health Inspection Service. 2005. Texas
BSE Investigation – Final Epidemiology. Washington, D.C., August. U.S. Department of Agriculture, Animal and Plant Health Inspection Service. 2006. Alabama
BSE Investigation – Final Epidemiology Report. Washington, D.C., May.