Embed Size (px)
Citation preview
1
THE FINANCIAL STRUCTURE OF AUTOMOBILE CORPORATIONS IN THE 2000S:
TOWARDS A MORE “FINANCIALISED” PATTERN?1
Roberto Alexandre Zanchetta Borghi2
Fernando Sarti3
Marcos Antonio Macedo Cintra4
Abstract
Important changes in the economic system both in productive and financial
dimensions have been observed since the 1970s, pointing to a growing capital mobility
and a stronger presence of finance within the logic of non-financial corporations. This
paper aims to analyse this increasing role of finance in the dynamics of automobile
companies. Data from the annual financial statements of selected carmakers (Daimler,
Fiat, Ford, General Motors, Honda, Hyundai, Toyota and Volkswagen) between 2000
and 2009 are considered, in order to verify the occurrence of a “financialisation”
movement in this industry and possible differences among the groups in this process.
The financial dynamics are characterised under three perspectives, each one being
discussed in a specific section.
In the first section, companies’ asset and capital structure is highlighted. In the
second section, the participation of the financial segment in the corporate activities is
assessed due to the possibility of significant non-operating gains from these operations.
In the third section, the groups’ degree of financial exposure is examined, since it may
represent a higher financial fragility as part of companies’ cash flows is committed to
interest and dividend payments or buyback operations. From the analysis a clear
movement towards a more “financialised” pattern of the carmakers’ structure can be
observed, although there were notable differences among them according to the
corporate dependence upon activities from the financial segment and the degree of
fragility of their financial structures. Such differences contribute to the explanation of
1 The authors wish to thank the São Paulo Research Foundation (Fapesp) for the scholarship given to support the Master’s thesis of Roberto A. Z. Borghi supervised by Fernando Sarti, from which this paper was originated. 2 PhD Student in Development Studies at the University of Cambridge, United Kingdom, and MA in Economics at the University of Campinas (Unicamp), Brazil. Email: [email protected]. 3 Professor and Director of the Economics Institute of the University of Campinas (Unicamp), Brazil. Email: [email protected]. 4 Director of Economic Studies and Relations and International Policies (Dinte) of the Applied Economic Research Institute (Ipea), Brazil. Email: [email protected].
2
why some corporations, especially American companies, were more affected than others
during the recent international economic crisis, thus imposing a need for rethinking the
role of the financial dimension in corporate dynamics.
Keywords: automobile corporations; financial structure; “financialisation”; global
economic crisis; heterodox economics.
JEL Classification: F23; G32; L21; L62.
1. Introduction
Significant changes in the economic system both in productive and financial
dimension have been occurring since the 1970s and the 1980s. Productive modifications
involve a combination of different processes, such as the intensification of production
internationalisation and trade, a more intense competition at global level and an
increasing integration of productive structures of national economies. Financial changes
are related to the interaction of three phenomena, which are the expressive expansion of
international financial flows, a fiercer competition in the capital markets and a higher
integration of international financial systems5. These movements are reflected in the
adoption of a wide variety of financial management strategies by non-financial
corporations through the constant monitoring of net cash flows, merger and acquisition
operations (M&A) and the use of mechanisms, such as derivatives, to hedge against or
profit from interest and exchange rates fluctuations (Chesnais, 1994 and 1996;
Gonçalves et al., 1999).
According to Belluzzo (2005, p.228, authors’ translation), the global economy
after the end of the Bretton Woods regime in the 1970s was characterised by three
movements: “the financial and foreign exchange liberalisation; the changes in the
competition pattern; the modification in the institutional rules governing trade and
investment”. The first movement represented an expansion of liberalisation and
deregulation processes of financial and foreign exchange markets both at national and
international level. This resulted in an intensification of the “financialisation” process of
the economy6 through a higher degree of financial asset flows and stocks in the
composition of private income and wealth. As Coutinho & Belluzzo (1998, p.138,
5 As Chesnais (2005b, p.46, authors’ translation) stresses, the financial globalisation, or “mundialisation” in the author’s words, results from three processes: “the monetary and financial deregulation or liberalisation, the compartmentalisation of national financial markets and the disintermediation, i.e. the expansion of lending operations, previously reserved to the banks, to all sort of institutional investor”. 6 A broad definition of this concept can be found in Epstein (2005) and Palley (2007).
3
authors’ translation) state, economic agents “began to subordinate their spending,
investment and saving decisions to their expectations of the pace of their financial
enrichment”. This process was reinforced by the development of even more complex
financial innovations, such as securitisation and derivatives operations, and by the surge
of new agents, such as institutional investors (e.g. mutual funds, insurance companies
and pension funds)7. If, on the one hand, all these phenomena made high speculative
and patrimonial gains possible, on the other hand, they made the system much more
unstable and subject to systemic risks, given the high leverage degree and asset price
volatility8 (Tavares & Belluzzo, 2002, p.153).
The second movement, related to the changes in the global competition strategy
of large corporations, was characterised by a relocalisation of productive facilities and a
capital concentration and centralisation, both reflected in growing foreign direct
investment flows (FDI), especially of M&A operations. The strategy for creating global
productive networks contributed to change investment and trade flows. Simultaneously,
corporations adopted strategies to promote technological modernisation, including the
establishment of joint ventures, and also asset “financialisation”, aiming for a
combination of profitability and liquidity in their portfolios.
The third movement, in its turn, was caused by the pressure of the economic
agents in this new competitive environment on the institutional rules governing trade
and investment, so that national states could make trade and investment inflows and
outflows more flexible, thus moving them towards a global scale. In the context of
globalisation, it meant the promotion of trade and financial openness which resulted in a
higher or lower external vulnerability for the countries, depending on the degree that the
openness was conceived (Tavares & Belluzzo, 2002).
For the large corporation, all these movements represented a technological
change, a productive restructuring and an increasing presence of the quest for financial
appreciation into its dynamics9. The corporation’s logic of growth and survival became
dependent not only upon its productive activities, including technological progress and
investments, production and sales elsewhere, but also upon the financial possibilities of
7 These investors “adopt portfolio management strategies, reducing the average time of holding shares in accordance with more ‘immediate’ capital gains, internationalising their applications and feeding the growth of derivatives markets” (Braga, 1997, p.206, authors’ translation). 8 In Guttmann’s words (2008, pp.15-16, authors’ translation), “key innovations, although they gave to the general credit system flexibility and reaction capacity in relation to creditors’ and debtors’ needs, they also encouraged asset bubbles, risks underestimation and excessive leverage”. 9 See Chandler (1990), Braga (1997) and Gonçalves (2002).
4
resource application and funding. The widespread movement of the financial
globalisation process suppressed the existing barriers to capital mobility. In this sense,
as a result of a competitive dynamics10, companies entered much more intensively into
financial markets, either for raising funds or investing resources in profitable and liquid
assets. Therefore, finance became a strategic and decisive element within the
corporation’s logic11.
This tendency towards a higher importance of finance within the corporation
was also a consequence of the logic of maximising shareholder value12, i.e. managing
the company by aiming to increase its stock value and to distribute dividends to the
owners of the company’s shares, which were in most cases big institutional investors
with diversified and global portfolios. Short-term results became a major goal for
corporations, very often contrary to their long-term activities and gains13. As Guttmann
(2008, pp.12-14, authors’ translation) points out, “large increases of financial assets in
the portfolios of non-financial corporations [...] with financial income (interests,
dividends, capital gains) becoming in the same extent more important” were observed.
According to Lazonick & O’Sullivan (2000), there was a change in the
corporation’s strategic orientation from “retain and reinvest” to “downsize and
distribute”. The central strategy for retaining profits and reinvesting in the company’s
growth14, which predominated in the “Golden Age” of capitalism when finance mainly
played the role of supporting investment plans, has been modified from the 1980s
onwards. Since then, corporations have aimed to downsize their workforce, in order to
rationalise production and reduce costs, and to distribute dividends to shareholders,
besides using income to increase dividends or repurchasing shares to raise their prices.
In such strategies, a greater interpenetration between the functioning of financial
markets and the performance of big corporations was promoted.
10 Braga (1997, p.216, authors’ translation) emphasises this fact: “as a result imposed by competition and risk management, companies engage themselves in finance that does not only imply an adequate debt and liability structure (to immobilise capital), but at the same time build an adequate creditor/asset position to have mobility, flexibility, innovative agility and velocity in capturing profitable opportunities in the several national productive and financial markets”. 11 According to Chesnais (1995, p.11, authors’ translation), “the groups’ ‘financialisation’ degree has increased in a considerable manner. This refers more and more to financial groups, undoubtedly with industrial dominance, but also with a diversification to the financial services, besides an increasingly important activity as operators in the exchange market”. 12 Process initiated through the separation between the company’s property and control and intensified by the depth of the increasingly broad and liquid financial markets. 13 For more details about different features of the corporations’ “financialisation” process, see Aglietta & Rebérioux (2005), Borghi & Rocha (2010), Chesnais (1994, 2005a and 2005b), Coutinho & Belluzzo (1998), Crotty (2002), Farhi & Borghi (2009) and Plihon (2005). 14 About the company’s growth with a long-term perspective, see Penrose (1959).
5
From this background, this paper aims to analyse the increasing role of finance
in the dynamics of automobile corporations. Data from the financial statements of
selected carmakers (Daimler, Fiat, Ford, General Motors, Honda, Hyundai, Toyota and
Volkswagen) between 2000 and 200915 are taken, in order to verify the occurrence of a
“financialisation” movement in this industry and possible differences among the groups
in this process. The financial dynamics are characterised under three perspectives, each
one being discussed in a specific section. In the first section, companies’ asset and
capital structure is highlighted. In the second section, the participation of the financial
segment in the corporate activities is assessed due to the possibility of significant non-
operating gains from these operations. In the third section, the groups’ degree of
financial exposure is examined, since it may represent a higher financial fragility as part
of companies’ cash flows is committed to interest and dividend payments or buyback
operations. Some concluding remarks follow.
2. Asset and capital structure of automobile corporations
The analysis of the corporations’ assets and liabilities structures allows the
identification of their main resource applications and funding. It also provides features
to understand companies’ degree of capital immobilisation and financial exposure as it
makes possible a comparison between short- and long-term positions and the
dependence upon external resources to the enterprise.
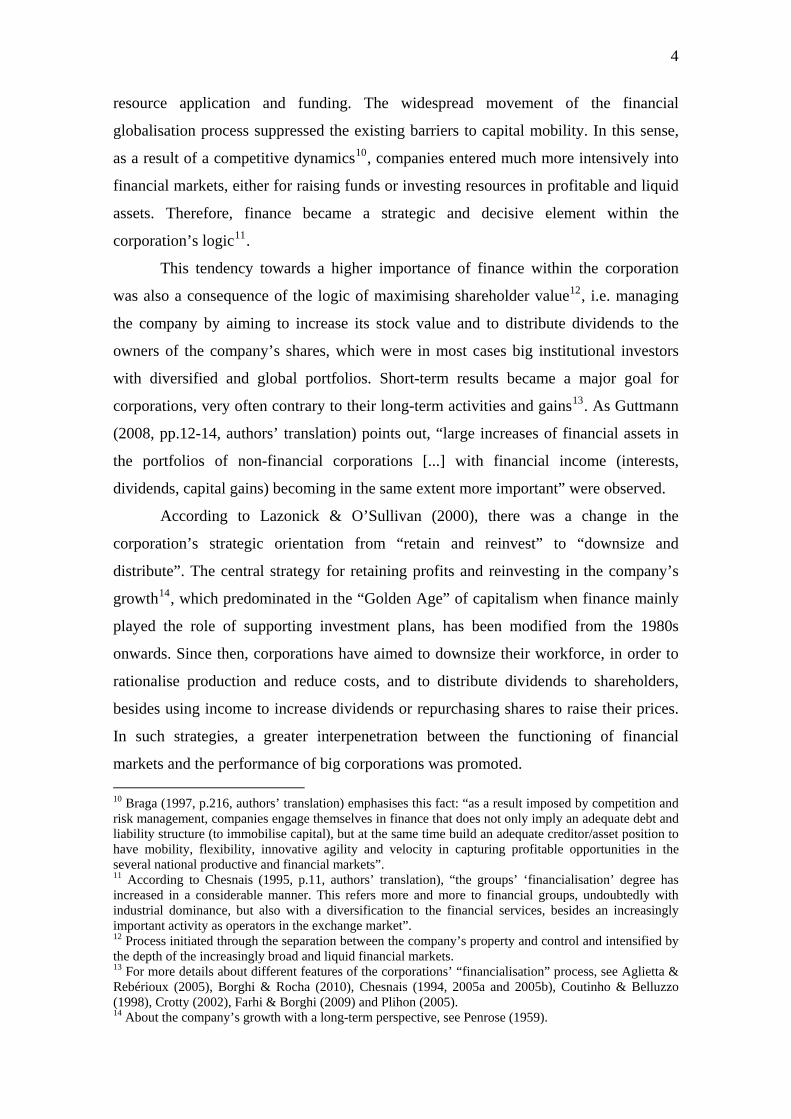
Chart 1 shows the evolution of companies’ size during the 2000s measured by
the amount of their assets. In the first half of the decade a predominance of the so-called
Big Three, the three giant American companies of the sector (General Motors, Ford and
DaimlerChrysler16), was observed. For instance, GM accumulated assets of almost US$
480 billion in 2004. Ford’s wealth surpassed US$ 300 billion in 2003.
15 The choice of these carmakers was based on their relevance within the industry in terms of world production and sales, as well as the diversity of their regions of origin (United States, Europe and Asia). The period, by its turn, was selected due to data availability for most of the companies. It may be emphasised that data for Honda and Toyota just begin in 2003. However, in order to avoid information losses, it was decided to use data from 2000 onwards for all other companies. Moreover, differently from other companies’ fiscal year, which ends in December 31st of each year, in the case of Japanese corporations fiscal year ends in March 31st of the referred year. All data were extracted from the annual financial statements released by the respective carmakers in their websites, listed after references at the end of this paper. A consolidated data set is presented in Borghi (2011). 16 The merger, one of the biggest in this sector, ended after the sale of Chrysler at US$ 7.4 billion for Cerberus Capital Management, which acquired 80.1% of its shares and operations in financial services in 2007. As a result, Daimler extricated itself from financial obligations related to retirement costs and pension funds (US$ 19 billion), one of the challenges faced by American carmakers (Valor Econômico, 2007). About the problems of this controversial merger, see Köhler (2009).
6
Chart 1 – Evolution of assets of selected carmakers, 2000-2009 (US$ million)
0
50,000
100,000
150,000
200,000
250,000
300,000
350,000
400,000
450,000
500,000
2000 2001 2002 2003 2004 2005 2006 2007 2008 2009
Daimler Fiat Ford GM Honda Hyundai Toyota Volksw agen
Source: authors’ calculations based on corporations’ balance sheet data. Notes: (1) From 2007 onwards data for Daimler refer only to the Daimler Group; in the period before, data refer to DaimlerChrysler. This explains the decrease in assets from 2006 to 2007. (2) Sale of the GM’s financial arm, the General Motors Acceptance Corporation (GMAC), in November 30, 2006, thus resulting in a sharp reduction of the company’s assets from 2005 to 2006. (3) GM’s restructuring process in 2009, releasing in that year just balance sheet data of the new company, from July 10, 2009 onwards.
However, productive and financial conditions that may have given rise to these
structures have progressively deteriorated as a result of the competitiveness loss and the
increasing financial fragility of American groups. The emergence of new competitors,
especially Japanese companies, has challenged the sector’s hegemonic pattern of
American carmakers. Driven by a new productive pattern – the Toyotism17 – and the
continuously concern about the development of greener technologies, such as
alternative means of propulsion and lower degree of pollution emission, and more
efficient vehicles with lower fuel consumption, Japanese carmakers could expand into
other markets, including the United States.
In addition to the fiercer competition in the domestic market, American
companies faced some difficulties in dealing with high labour and pension costs,
although their debts with retired workers also represented a funding source for them18.
17 See, for instance, Womack et al. (1990), Shimokawa (1996), Freyssenet & Lung (1999) and ECLAC (2004). 18 Total costs of the Big Three’s benefits model were estimated between US$ 90 billion and US$ 95 billion in 2007. In September 2007, a general strike in the GM’s facilities in the United States occurred. It was only solved after an agreement with the UAW trade union, establishing a partial transference of the company’s liabilities with the health plan of retired workers to an independent fund and the creation of a
7
Together with the increasing fragility of their financial structure, to be examined in this
and the following sections, such factors lead American and, in a lesser extent, European
carmakers to a productive restructuring process in the quest for cost reduction through
downsizing by firing workers, negotiating with the U.S. automotive trade union (the
United Auto Workers, UAW) to flexibilise contracts, relocating global production or
closing some facilities19. Hence, even before the recent international economic crisis, a
fragile situation of American corporations during the decade could be observed20.
Asian companies, such as Honda, Hyundai and, particularly, Toyota, registered a
great expansion of their assets in the period. Toyota’s total assets were around US$ 325
billion in 2008 when the company became the world major carmaker. Among the
European groups, different patterns were verified. Whereas Volkswagen showed an
increase in its assets, Fiat presented a decline in the early decade as a consequence of
some difficulties faced after the partnership with GM in 2000 regarding competitiveness
loss, sales decrease and high indebtedness degree21 (Chart 1).
Important patrimonial changes have occurred during the decade, thus reflecting
in the assets evolution and the following indicators. Due to the sale of its financial arm
at the end of 2006, GM reduced its assets in approximately US$ 290 billion from 2005
to 2006. By adopting downsizing strategies GM and Ford promoted asset shrinkage
through the sale of low-profitable brands as part of their restructuring plans and as a
program of resignation, in order to allow cost reduction. As White & McCracken (2007, authors’ translation) point, “Detroit’s problems are derived from a permanent reorganisation of the world automobile industry in the face of globalisation”, stressing “what has been increasingly clearer in recent years: that it is Toyota Motor Corp., not GM or the UAW, who establishes the parameters of labour cost in the American automobile industry”, since the difference between the cost of unionised operations in the U.S. and facilities of Toyota and other Asian and European carmakers without trade unions was about US$ 25 and US$ 30 per hour. 19 About labour and other challenges faced by American companies, see for instance Osang (2006a, 2006b and 2006c) and The Economist (2005a, 2005b, 2005c and 2006). For some strategies adopted by GM, Ford, Chrysler, Volkswagen and Renault in reaction to the rise of the Asian competitors, see Mackintosh (2006). 20 About this discussion, see Borghi (2007) and Andrade (2009). 21 See The Economist (2002) for the problems faced by Fiat and the partnership with GM, and The Economist (2005d) for the company’s recovering, which involved not only the end of the GM’s 20% stock ownership agreement – in 2000 GM invested US$ 2.4 billion and in 2005 it had to spend US$ 2 billion to undo the transaction –, but also the restructuring promoted by Marchionne when he became Fiat’s CEO. The restructuring plan consisted of launching new vehicles, using common platforms in producing vehicles from Alfa Romeo’s brand, sharing components with other brand of the group (Maserati) and establishing alliances with other corporations in order to reduce costs and take advantage of economies of scale. About the group reorganisation, see also Volpato (2009).
8
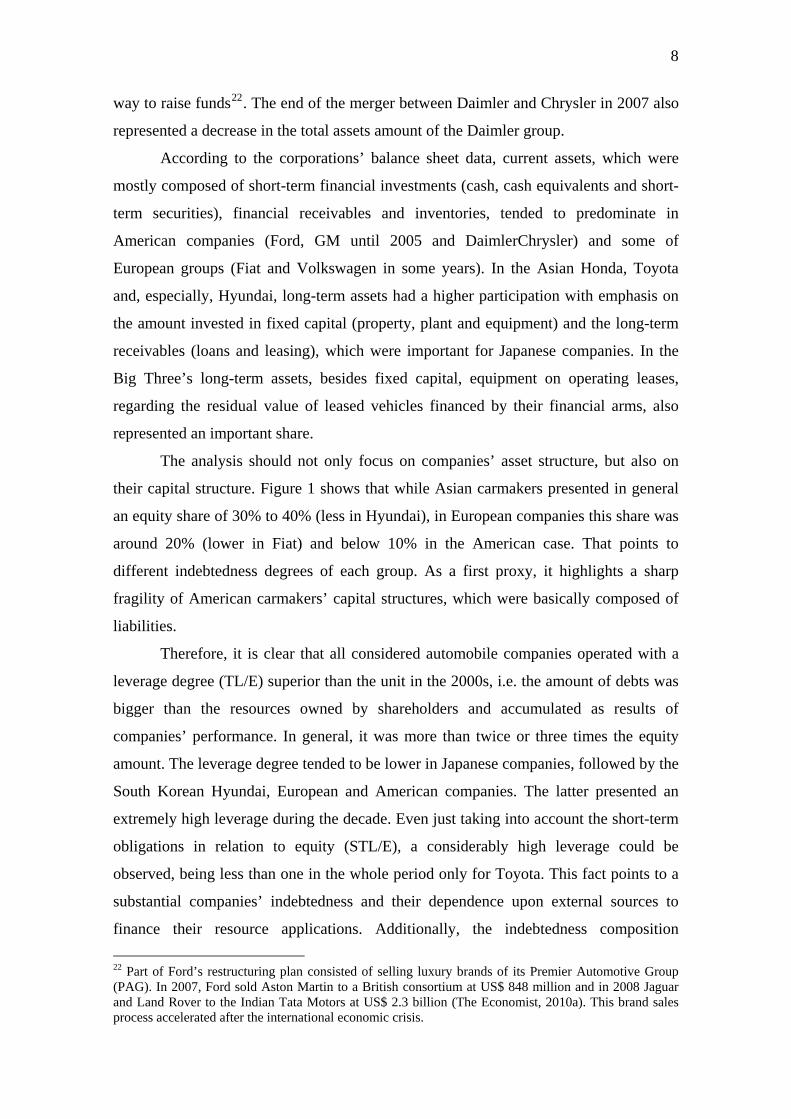
way to raise funds22. The end of the merger between Daimler and Chrysler in 2007 also
represented a decrease in the total assets amount of the Daimler group.
According to the corporations’ balance sheet data, current assets, which were
mostly composed of short-term financial investments (cash, cash equivalents and short-
term securities), financial receivables and inventories, tended to predominate in
American companies (Ford, GM until 2005 and DaimlerChrysler) and some of
European groups (Fiat and Volkswagen in some years). In the Asian Honda, Toyota
and, especially, Hyundai, long-term assets had a higher participation with emphasis on
the amount invested in fixed capital (property, plant and equipment) and the long-term
receivables (loans and leasing), which were important for Japanese companies. In the
Big Three’s long-term assets, besides fixed capital, equipment on operating leases,
regarding the residual value of leased vehicles financed by their financial arms, also
represented an important share.
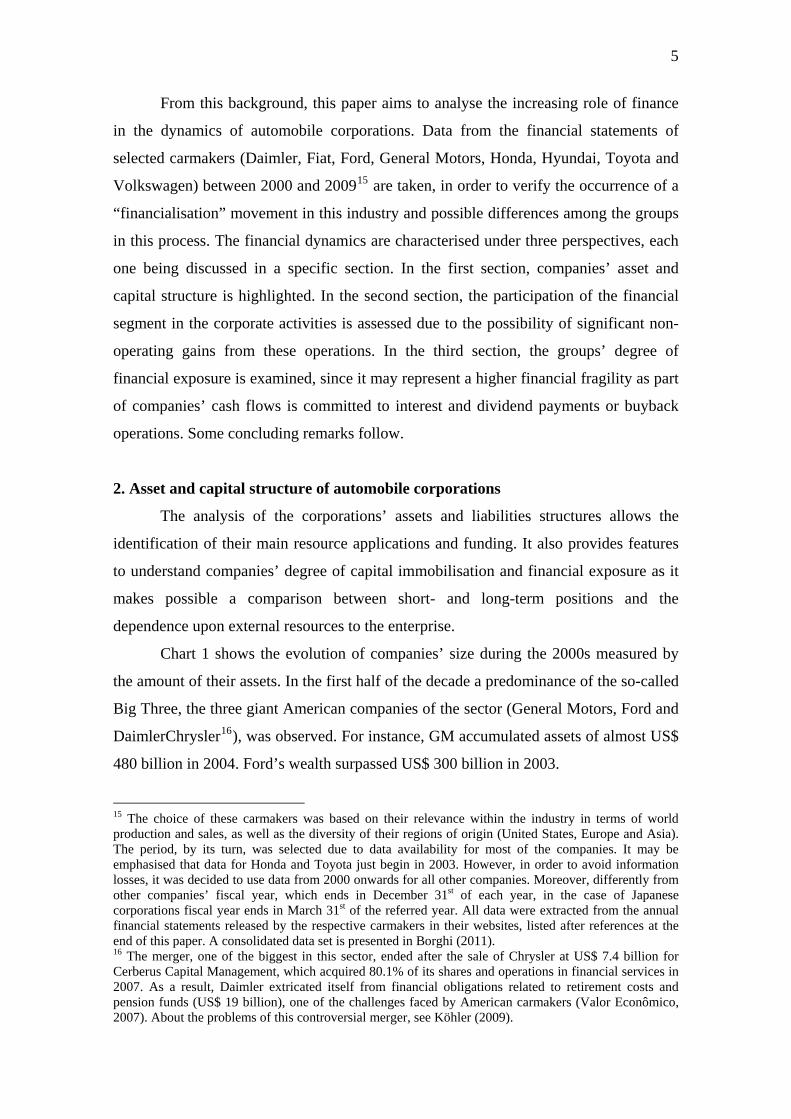
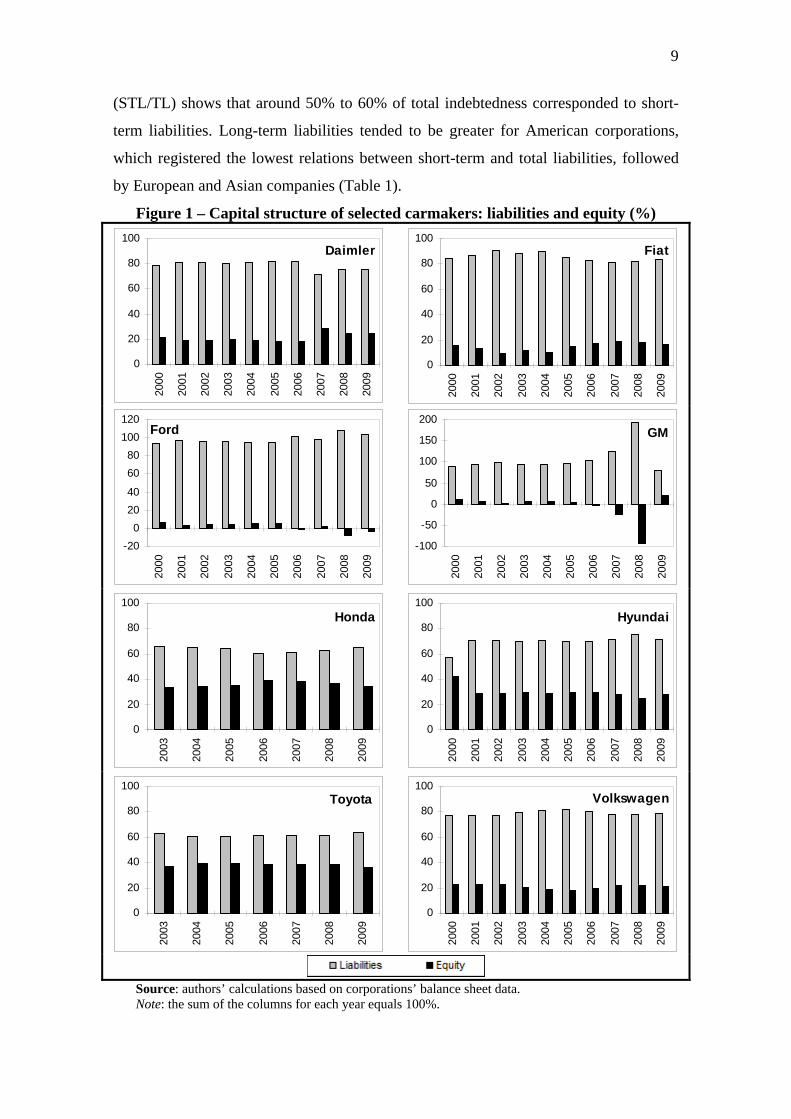
The analysis should not only focus on companies’ asset structure, but also on
their capital structure. Figure 1 shows that while Asian carmakers presented in general
an equity share of 30% to 40% (less in Hyundai), in European companies this share was
around 20% (lower in Fiat) and below 10% in the American case. That points to
different indebtedness degrees of each group. As a first proxy, it highlights a sharp
fragility of American carmakers’ capital structures, which were basically composed of
liabilities.
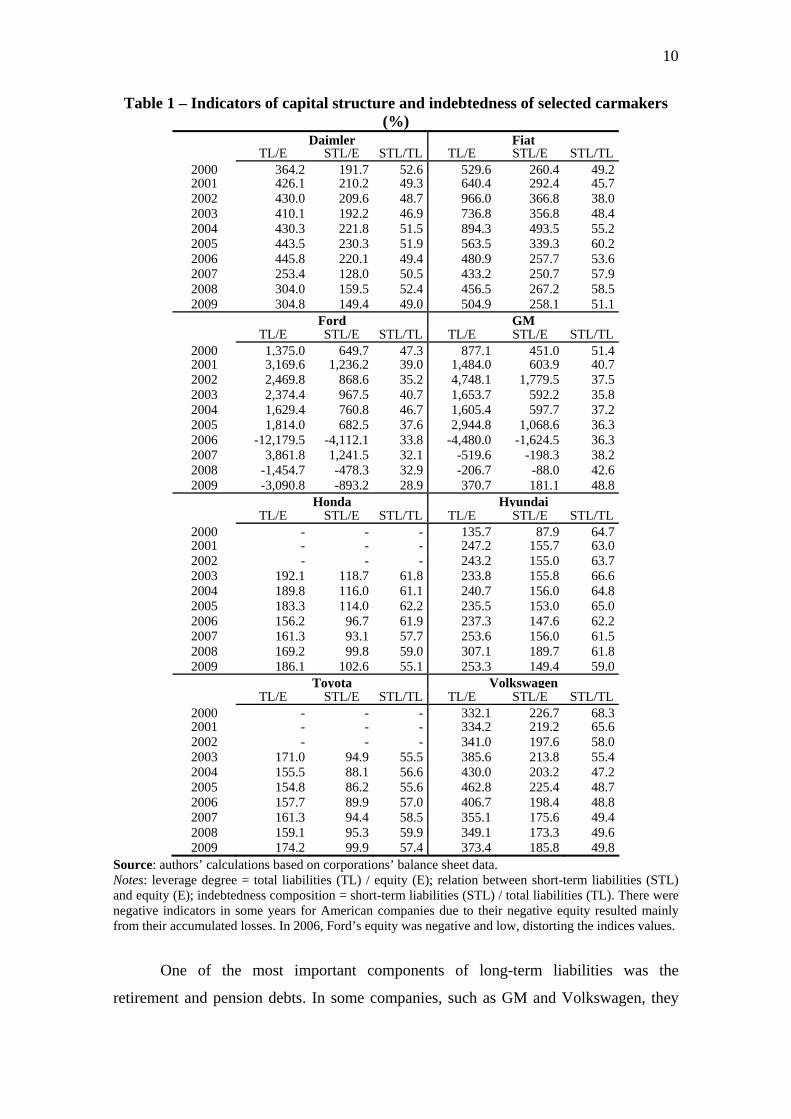
Therefore, it is clear that all considered automobile companies operated with a
leverage degree (TL/E) superior than the unit in the 2000s, i.e. the amount of debts was
bigger than the resources owned by shareholders and accumulated as results of
companies’ performance. In general, it was more than twice or three times the equity
amount. The leverage degree tended to be lower in Japanese companies, followed by the
South Korean Hyundai, European and American companies. The latter presented an
extremely high leverage during the decade. Even just taking into account the short-term
obligations in relation to equity (STL/E), a considerably high leverage could be
observed, being less than one in the whole period only for Toyota. This fact points to a
substantial companies’ indebtedness and their dependence upon external sources to
finance their resource applications. Additionally, the indebtedness composition
22 Part of Ford’s restructuring plan consisted of selling luxury brands of its Premier Automotive Group (PAG). In 2007, Ford sold Aston Martin to a British consortium at US$ 848 million and in 2008 Jaguar and Land Rover to the Indian Tata Motors at US$ 2.3 billion (The Economist, 2010a). This brand sales process accelerated after the international economic crisis.
9
(STL/TL) shows that around 50% to 60% of total indebtedness corresponded to short-
term liabilities. Long-term liabilities tended to be greater for American corporations,
which registered the lowest relations between short-term and total liabilities, followed
by European and Asian companies (Table 1).
Figure 1 – Capital structure of selected carmakers: liabilities and equity (%)
Daimler
0
20
40
60
80
100
2000
2001
2002
2003
2004
2005
2006
2007
2008
2009
Fiat
0
20
40
60
80
100
2000
2001
2002
2003
2004
2005
2006
2007
2008
2009
Ford
-20
0
20
40
60
80
100
120
2000
2001
2002
2003
2004
2005
2006
2007
2008
2009
GM
-100
-50
0
50
100
150
200
2000
2001
2002
2003
2004
2005
2006
2007
2008
2009
Honda
0
20
40
60
80
100
2003
2004
2005
2006
2007
2008
2009
Hyundai
0
20
40
60
80
100
2000
2001
2002
2003
2004
2005
2006
2007
2008
2009
Toyota
0
20
40
60
80
100
2003
2004
2005
2006
2007
2008
2009
Volkswagen
0
20
40
60
80
100
2000
2001
2002
2003
2004
2005
2006
2007
2008
2009
Source: authors’ calculations based on corporations’ balance sheet data. Note: the sum of the columns for each year equals 100%.
10
Table 1 – Indicators of capital structure and indebtedness of selected carmakers (%)
Daimler Fiat TL/E STL/E STL/TL TL/E STL/E STL/TL
2000 364.2 191.7 52.6 529.6 260.4 49.2 2001 426.1 210.2 49.3 640.4 292.4 45.7 2002 430.0 209.6 48.7 966.0 366.8 38.0 2003 410.1 192.2 46.9 736.8 356.8 48.4 2004 430.3 221.8 51.5 894.3 493.5 55.2 2005 443.5 230.3 51.9 563.5 339.3 60.2 2006 445.8 220.1 49.4 480.9 257.7 53.6 2007 253.4 128.0 50.5 433.2 250.7 57.9 2008 304.0 159.5 52.4 456.5 267.2 58.5 2009 304.8 149.4 49.0 504.9 258.1 51.1
Ford GM TL/E STL/E STL/TL TL/E STL/E STL/TL
2000 1,375.0 649.7 47.3 877.1 451.0 51.4 2001 3,169.6 1,236.2 39.0 1,484.0 603.9 40.7 2002 2,469.8 868.6 35.2 4,748.1 1,779.5 37.5 2003 2,374.4 967.5 40.7 1,653.7 592.2 35.8 2004 1,629.4 760.8 46.7 1,605.4 597.7 37.2 2005 1,814.0 682.5 37.6 2,944.8 1,068.6 36.3 2006 -12,179.5 -4,112.1 33.8 -4,480.0 -1,624.5 36.3 2007 3,861.8 1,241.5 32.1 -519.6 -198.3 38.2 2008 -1,454.7 -478.3 32.9 -206.7 -88.0 42.6 2009 -3,090.8 -893.2 28.9 370.7 181.1 48.8
Honda Hyundai TL/E STL/E STL/TL TL/E STL/E STL/TL
2000 - - - 135.7 87.9 64.7 2001 - - - 247.2 155.7 63.0 2002 - - - 243.2 155.0 63.7 2003 192.1 118.7 61.8 233.8 155.8 66.6 2004 189.8 116.0 61.1 240.7 156.0 64.8 2005 183.3 114.0 62.2 235.5 153.0 65.0 2006 156.2 96.7 61.9 237.3 147.6 62.2 2007 161.3 93.1 57.7 253.6 156.0 61.5 2008 169.2 99.8 59.0 307.1 189.7 61.8 2009 186.1 102.6 55.1 253.3 149.4 59.0
Toyota Volkswagen TL/E STL/E STL/TL TL/E STL/E STL/TL
2000 - - - 332.1 226.7 68.3 2001 - - - 334.2 219.2 65.6 2002 - - - 341.0 197.6 58.0 2003 171.0 94.9 55.5 385.6 213.8 55.4 2004 155.5 88.1 56.6 430.0 203.2 47.2 2005 154.8 86.2 55.6 462.8 225.4 48.7 2006 157.7 89.9 57.0 406.7 198.4 48.8 2007 161.3 94.4 58.5 355.1 175.6 49.4 2008 159.1 95.3 59.9 349.1 173.3 49.6 2009 174.2 99.9 57.4 373.4 185.8 49.8
Source: authors’ calculations based on corporations’ balance sheet data. Notes: leverage degree = total liabilities (TL) / equity (E); relation between short-term liabilities (STL) and equity (E); indebtedness composition = short-term liabilities (STL) / total liabilities (TL). There were negative indicators in some years for American companies due to their negative equity resulted mainly from their accumulated losses. In 2006, Ford’s equity was negative and low, distorting the indices values.
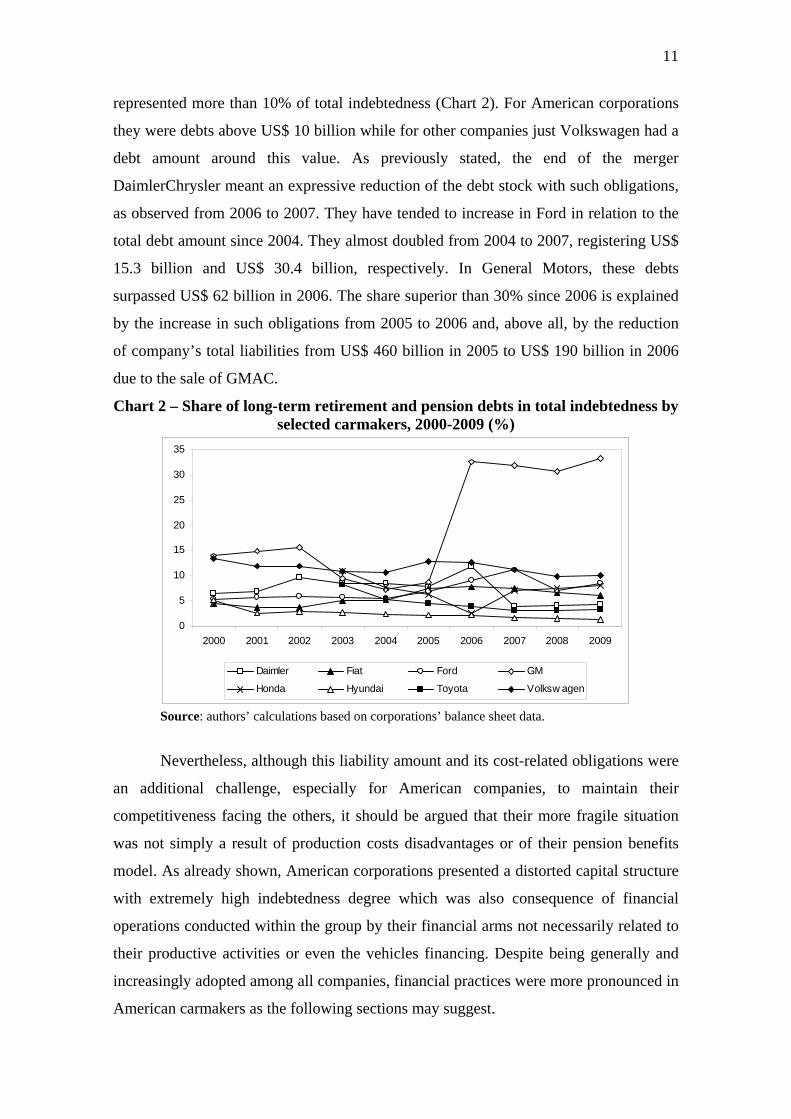
One of the most important components of long-term liabilities was the
retirement and pension debts. In some companies, such as GM and Volkswagen, they
11
represented more than 10% of total indebtedness (Chart 2). For American corporations
they were debts above US$ 10 billion while for other companies just Volkswagen had a
debt amount around this value. As previously stated, the end of the merger
DaimlerChrysler meant an expressive reduction of the debt stock with such obligations,
as observed from 2006 to 2007. They have tended to increase in Ford in relation to the
total debt amount since 2004. They almost doubled from 2004 to 2007, registering US$
15.3 billion and US$ 30.4 billion, respectively. In General Motors, these debts
surpassed US$ 62 billion in 2006. The share superior than 30% since 2006 is explained
by the increase in such obligations from 2005 to 2006 and, above all, by the reduction
of company’s total liabilities from US$ 460 billion in 2005 to US$ 190 billion in 2006
due to the sale of GMAC.
Chart 2 – Share of long-term retirement and pension debts in total indebtedness by selected carmakers, 2000-2009 (%)
0
5
10
15
20
25
30
35
2000 2001 2002 2003 2004 2005 2006 2007 2008 2009
Daimler Fiat Ford GM
Honda Hyundai Toyota Volksw agen
Source: authors’ calculations based on corporations’ balance sheet data.
Nevertheless, although this liability amount and its cost-related obligations were
an additional challenge, especially for American companies, to maintain their
competitiveness facing the others, it should be argued that their more fragile situation
was not simply a result of production costs disadvantages or of their pension benefits
model. As already shown, American corporations presented a distorted capital structure
with extremely high indebtedness degree which was also consequence of financial
operations conducted within the group by their financial arms not necessarily related to
their productive activities or even the vehicles financing. Despite being generally and
increasingly adopted among all companies, financial practices were more pronounced in
American carmakers as the following sections may suggest.
12
3. Participation of the financial segment in the corporate activities
The previous asset and capital structures resulted in part from the increasing
weight of the financial segment within the corporation. As vehicles were relatively
expensive goods, their diffusion and the middle-income population access to them
depended on credit supply. Carmakers’ financial subsidiaries or captive finance
companies23 were thus initially created as a way to ease the production spreading
through sales financing.
The General Motors Acceptance Corporation (GMAC) was founded in 1919 by
GM and in 1920 it expanded its operations to the United Kingdom. The consolidation of
the financial arm of its historical main competitor and contemporary, Ford, just
occurred in 1959 with the establishment of Ford Motor Credit Company. One year
before GMAC already registered 40 million financed vehicles. In 1964, Chrysler Credit
Corporation was set up and through an acquisition originated the Chrysler Financial
Corporation in 1967. Volkswagen’s bank appeared some years before, in 1949, as the
Volkswagen Finanzierungsgesellschaft mbH. In 1966, the leasing company,
Volkswagen Leasing GmbH, was created.
During the 1980s and in parallel to the streghtening of Japanese carmakers in the
United States, their financial subsidiaries were established: the American Honda
Finance Corporation in 1980 (although it just started car financing in 1986), the Toyota
Financial Services in 1983 (including credit and insurance companies) and the Hyundai
Motor Finance in 198924. As a comparative parameter for the degree of financial
activities development in the U.S., the case of GMAC may be mentioned. In 1985, it
registered for the first time earnings above US$ 1 billion and more than 100 million
financed vehicles, besides the diversification of its operations towards the real estate
mortgage segment with the creation of GMAC Mortgage25.
In recent years some patrimonial reorganisations occurred. In 1994, Volkswagen
Financial Services AG was created in Volkswagen group to manage the corporate
23 They are called in this way, because they are subsidiaries of a group from the productive sector whose purpose is to provide credit to consumers for the acquisition of goods produced by the corporation. 24 Information on carmakers’ financial arms was extracted from their websites, listed after references at the end of this paper. 25 As GMAC, Ford’s financial arm also started its diversification process not necessarily related to vehicles. In 1985, it acquired the First Nationwide Financial Corporation, a savings and loan institution sold in 1994. In 1987, it bought the U.S. Leasing International Inc. and, in 1989, the Associates Corporation of North America (at US$ 3.35 billion), which would become independent in 1998 and be acquired by Citigroup in 2000. In 1994, the financial arm bought Hertz, a rental car company, which was then sold in 2005 (Bordenave, 2000, pp.250-251; Mercer, 2009, p.187 and pp.199-200).
13
activities of the financial segment in Europe. In order to coordinate the worldwide
operations of all Toyota’s financial subsidiaries, the Toyota Financial Services
Corporation was established in 2000. Among American corporations, major changes
were verified in General Motors and Chrysler. In 2005, GMAC launched a new holding
to its mortgage operations, the Residential Capital LLC (ResCap). In the following year,
due to the downgrade of GM’s and GMAC’s bonds (a similar situation was faced by
Ford) by rating agencies to a situation of speculative grade (or junk status) and
consequent greater refinancing difficulties, the corporation decided to sell 51% of the
shares of its profitable financial arm to the Cerberus Capital Management. The attempt
was to reduce GMAC’s risk perception by investors and let it raise funds under more
favourable conditions in order to keep the vehicles financing26.
It is worth mentioning that Cerberus Capital Management has also become the
major shareholder of Chrysler Financial since 2007 after the end of the merger
DaimlerChrysler originated in 1998 and its acquisition of Chrysler group. During the
crisis, in the end of 2008, GMAC obtained a Federal Reserve’s (Fed) approval to
become a banking holding (Dash & Bajaj, 2008). In the following year, its financing
activities were extended to Chrysler’s products and the Ally Bank was established,
being the corporation called Ally Financial since 201027. Also in that year GM bought
the AmeriCredit, an important company in the segment of subprime loans to vehicle
acquisition, at US$ 3.5 billion (The Economist, 2010b).
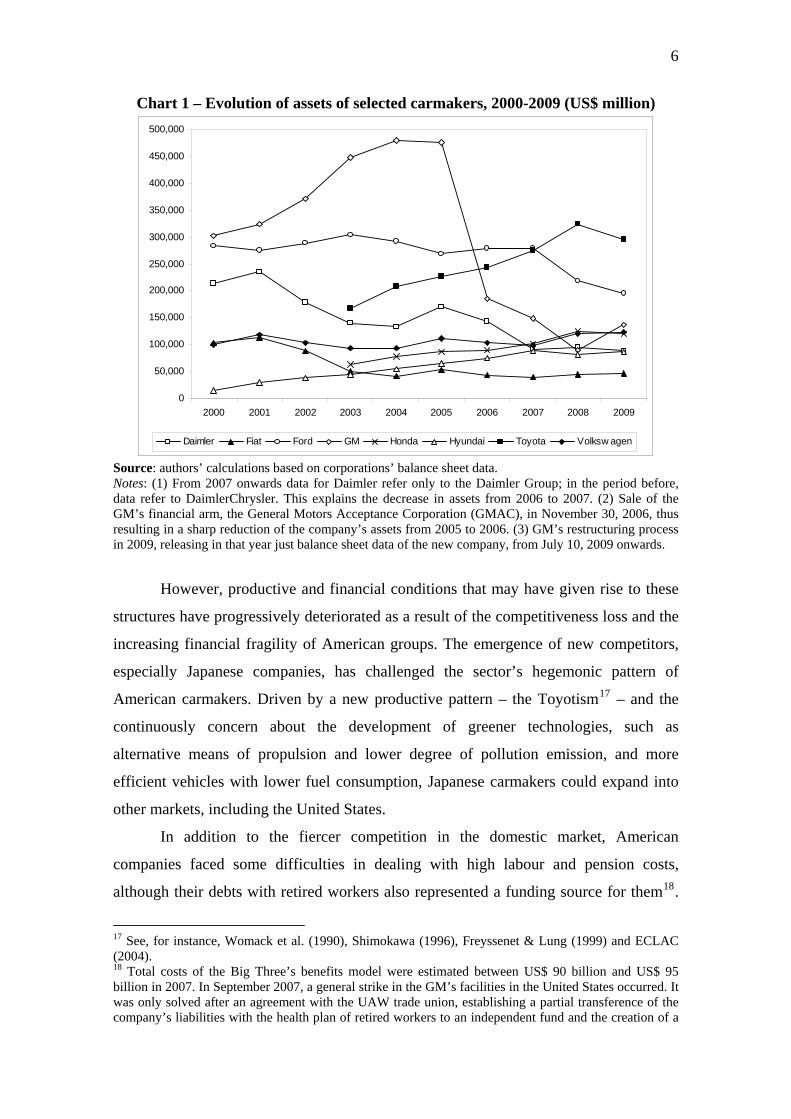
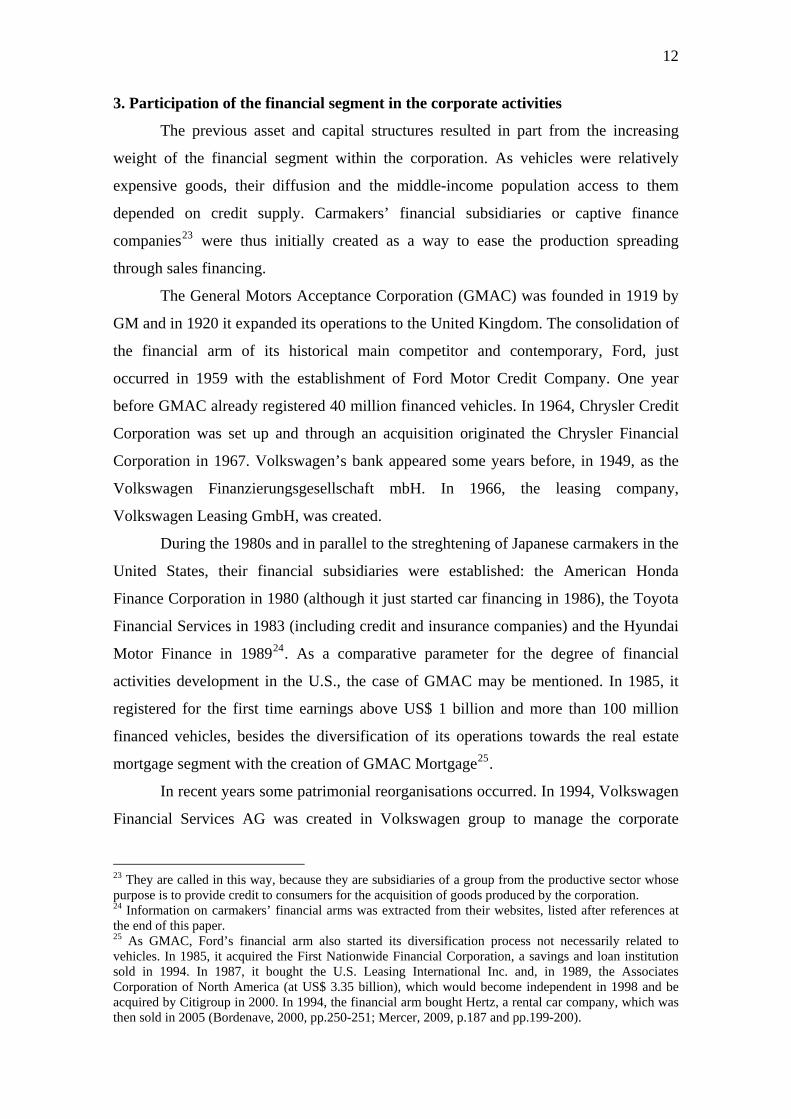
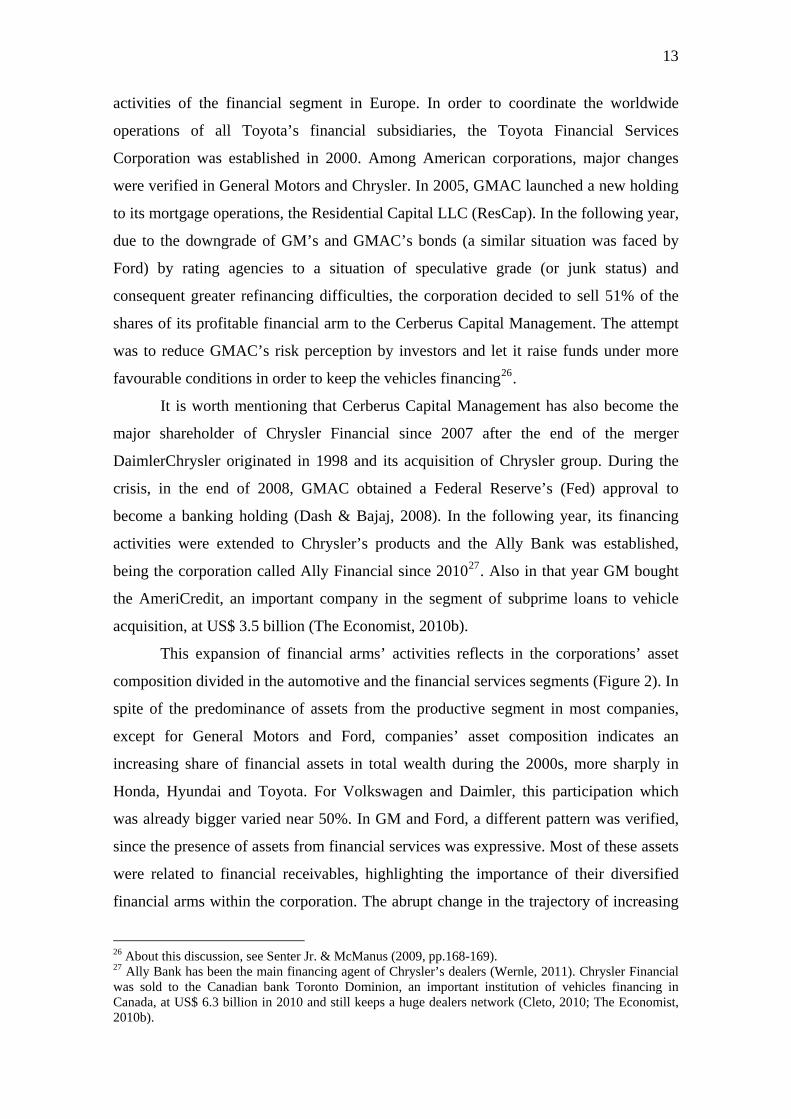
This expansion of financial arms’ activities reflects in the corporations’ asset
composition divided in the automotive and the financial services segments (Figure 2). In
spite of the predominance of assets from the productive segment in most companies,
except for General Motors and Ford, companies’ asset composition indicates an
increasing share of financial assets in total wealth during the 2000s, more sharply in
Honda, Hyundai and Toyota. For Volkswagen and Daimler, this participation which
was already bigger varied near 50%. In GM and Ford, a different pattern was verified,
since the presence of assets from financial services was expressive. Most of these assets
were related to financial receivables, highlighting the importance of their diversified
financial arms within the corporation. The abrupt change in the trajectory of increasing
26 About this discussion, see Senter Jr. & McManus (2009, pp.168-169). 27 Ally Bank has been the main financing agent of Chrysler’s dealers (Wernle, 2011). Chrysler Financial was sold to the Canadian bank Toronto Dominion, an important institution of vehicles financing in Canada, at US$ 6.3 billion in 2010 and still keeps a huge dealers network (Cleto, 2010; The Economist, 2010b).
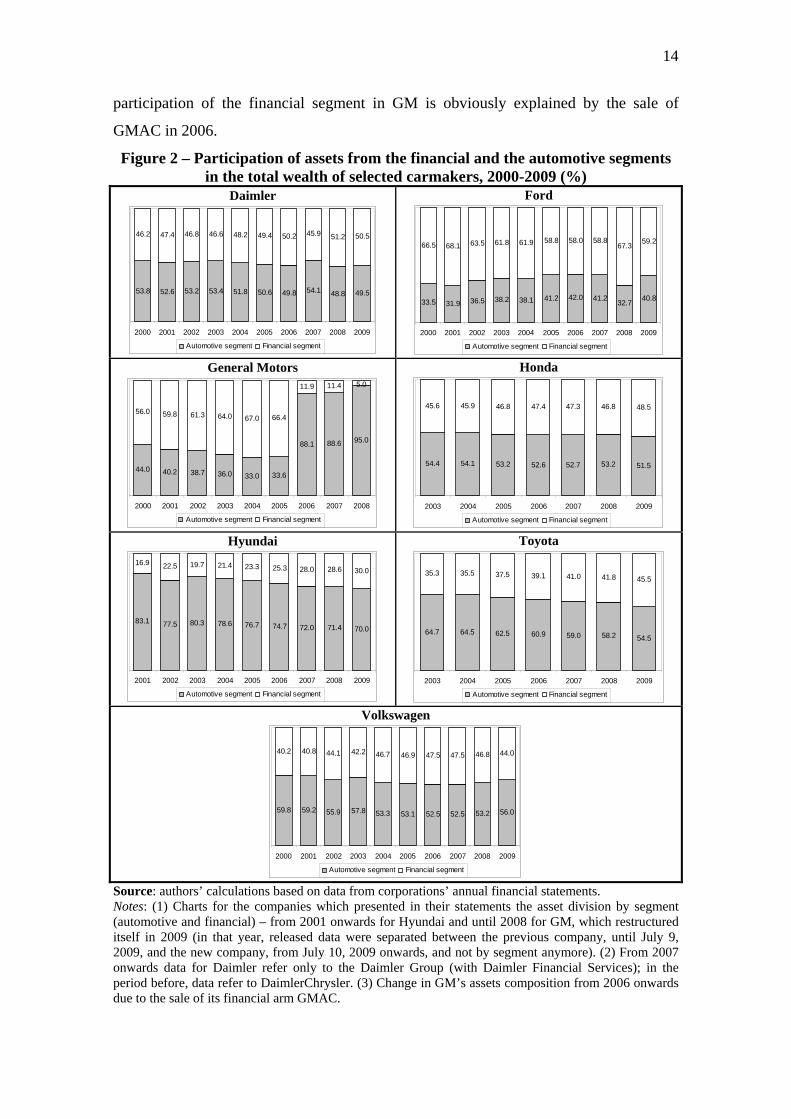
14
participation of the financial segment in GM is obviously explained by the sale of
GMAC in 2006.
Figure 2 – Participation of assets from the financial and the automotive segments in the total wealth of selected carmakers, 2000-2009 (%)
Daimler
53.8 52.6 53.2 53.4 51.8 50.6 49.8 54.1 48.8 49.5
46.2 47.4 46.8 46.6 48.2 49.4 50.2 45.9 51.2 50.5
2000 2001 2002 2003 2004 2005 2006 2007 2008 2009
Automotive segment Financial segment
Ford
33.5 31.9 36.5 38.2 38.1 41.2 42.0 41.232.7
40.8
66.5 68.1 63.5 61.8 61.9 58.8 58.0 58.867.3
59.2
2000 2001 2002 2003 2004 2005 2006 2007 2008 2009
Automotive segment Financial segment
General Motors
44.0 40.2 38.7 36.0 33.0 33.6
88.1 88.6 95.0
56.0 59.8 61.3 64.0 67.0 66.4
11.9 11.4 5.0
2000 2001 2002 2003 2004 2005 2006 2007 2008
Automotive segment Financial segment
Honda
54.4 54.1 53.2 52.6 52.7 53.2 51.5
45.6 45.9 46.8 47.4 47.3 46.8 48.5
2003 2004 2005 2006 2007 2008 2009
Automotive segment Financial segment
Hyundai
83.1 77.5 80.3 78.6 76.7 74.7 72.0 71.4 70.0
16.9 22.5 19.7 21.4 23.3 25.3 28.0 28.6 30.0
2001 2002 2003 2004 2005 2006 2007 2008 2009
Automotive segment Financial segment
Toyota
64.7 64.5 62.5 60.9 59.0 58.2 54.5
35.3 35.5 37.5 39.1 41.0 41.8 45.5
2003 2004 2005 2006 2007 2008 2009
Automotive segment Financial segment
Volkswagen
59.8 59.2 55.9 57.8 53.3 53.1 52.5 52.5 53.2 56.0
40.2 40.8 44.1 42.2 46.7 46.9 47.5 47.5 46.8 44.0
2000 2001 2002 2003 2004 2005 2006 2007 2008 2009
Automotive segment Financial segment
Source: authors’ calculations based on data from corporations’ annual financial statements. Notes: (1) Charts for the companies which presented in their statements the asset division by segment (automotive and financial) – from 2001 onwards for Hyundai and until 2008 for GM, which restructured itself in 2009 (in that year, released data were separated between the previous company, until July 9, 2009, and the new company, from July 10, 2009 onwards, and not by segment anymore). (2) From 2007 onwards data for Daimler refer only to the Daimler Group (with Daimler Financial Services); in the period before, data refer to DaimlerChrysler. (3) Change in GM’s assets composition from 2006 onwards due to the sale of its financial arm GMAC.
15
Although there is a general trend of intensification of assets from the financial
segment within corporations, the degree and rhythm of this trend vary among
companies. In some extent, lower barriers to capital and goods circulation under the
globalisation process and the consequent worldwide expansion of business activities in
the search both for producer and consumer markets may have reinforced this logic.
However, differences observed among companies point to the fact that corporations’
and governments’ decisions still matters, i.e. changes under globalisation has not simply
resulted in a flat world. Such differences are probably conditioned by the institutional
framework of corporations’ countries of origin and main markets as they may present
particular characteristics that may interact with the company’s behaviour. The trend
verified for American groups seems to be more restrained and later for the European28
and, especially, the Asian companies.
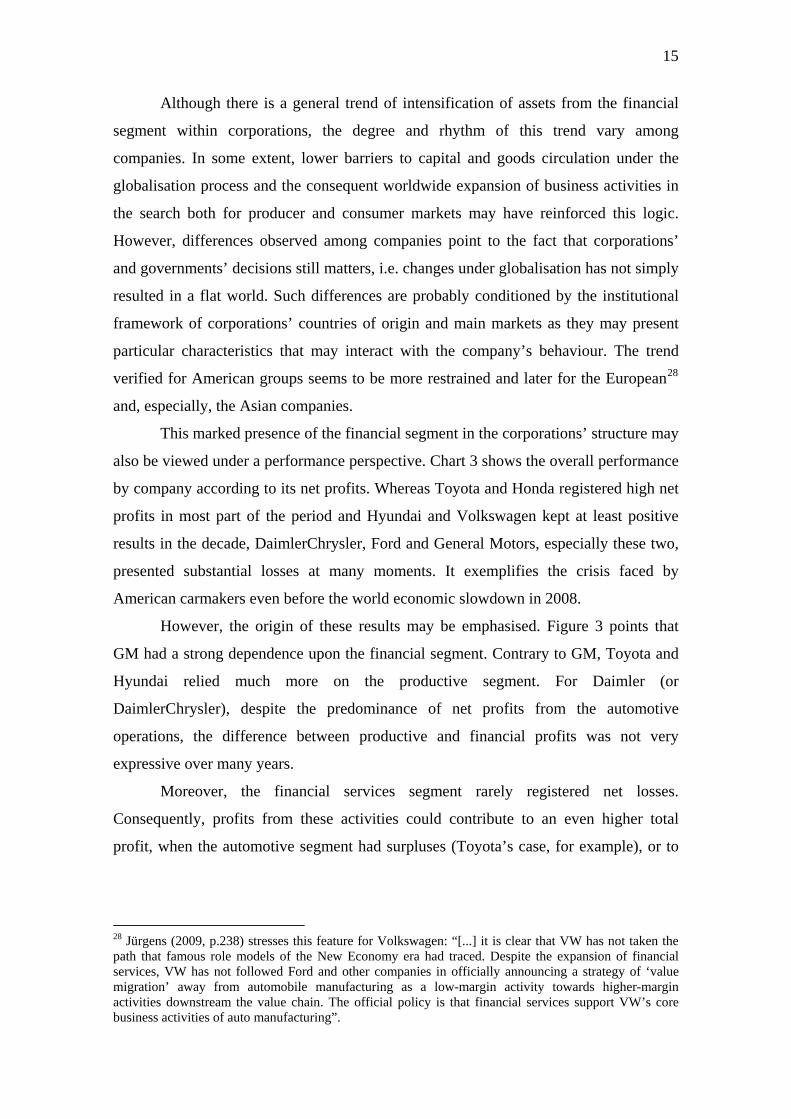
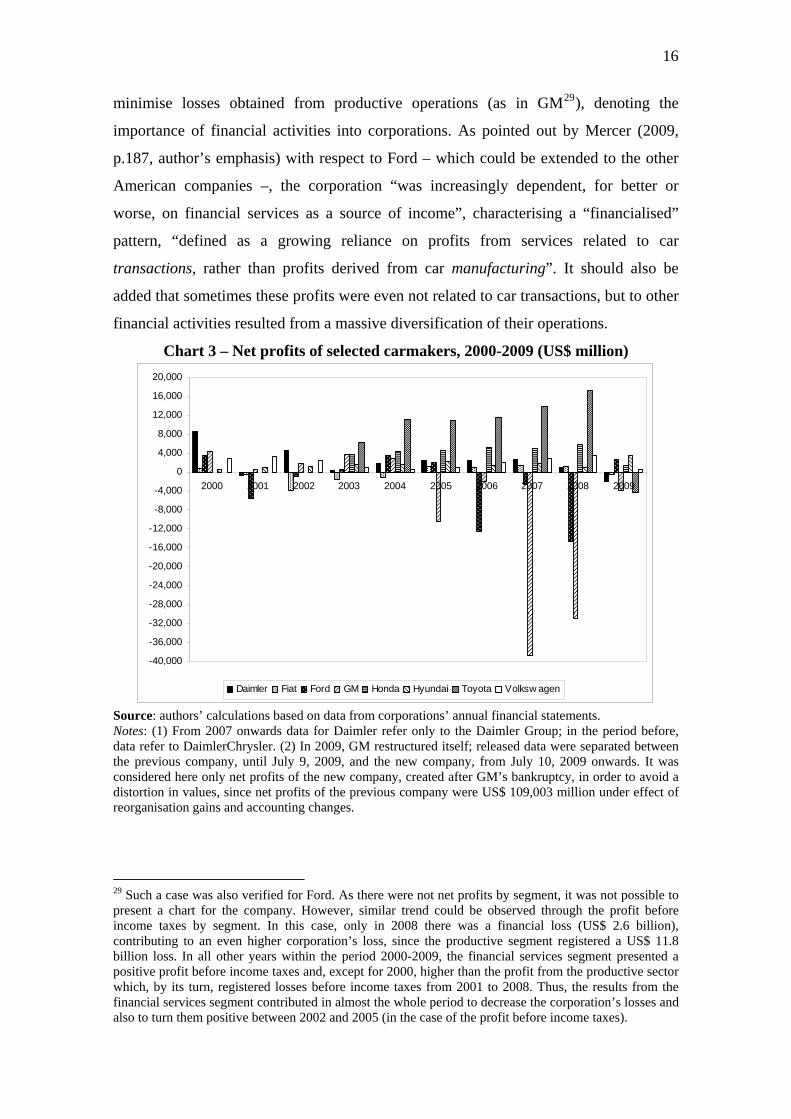
This marked presence of the financial segment in the corporations’ structure may
also be viewed under a performance perspective. Chart 3 shows the overall performance
by company according to its net profits. Whereas Toyota and Honda registered high net
profits in most part of the period and Hyundai and Volkswagen kept at least positive
results in the decade, DaimlerChrysler, Ford and General Motors, especially these two,
presented substantial losses at many moments. It exemplifies the crisis faced by
American carmakers even before the world economic slowdown in 2008.
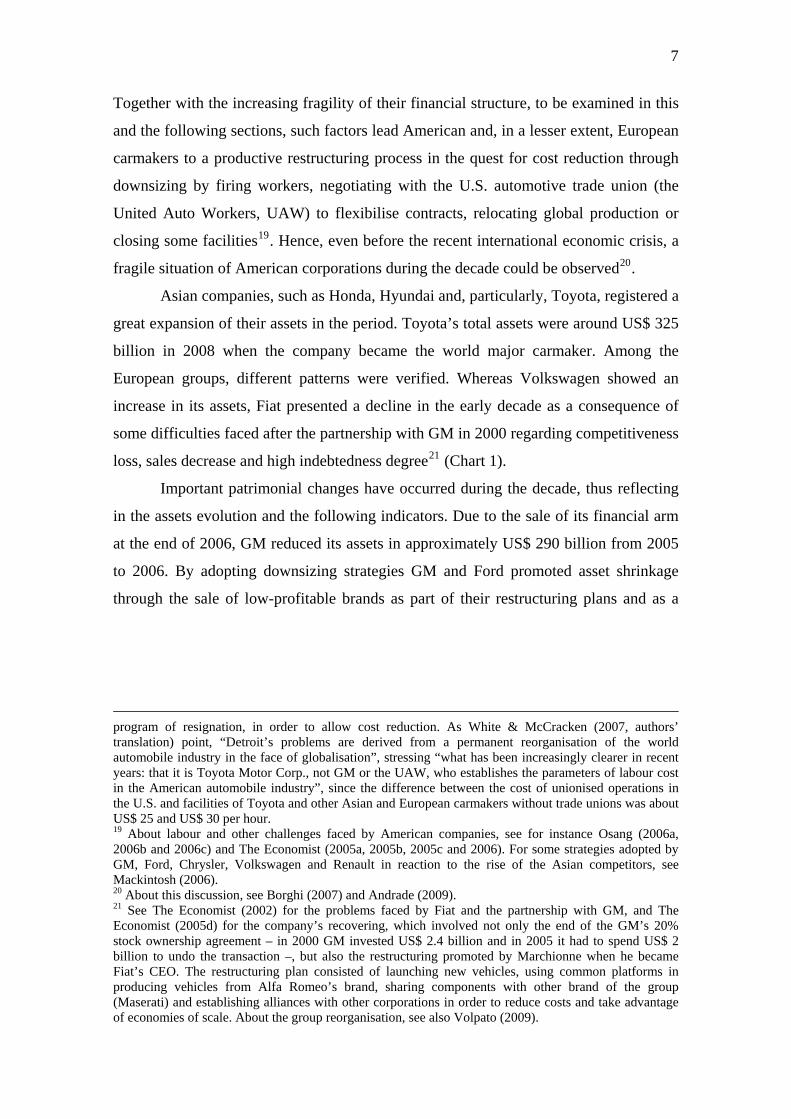
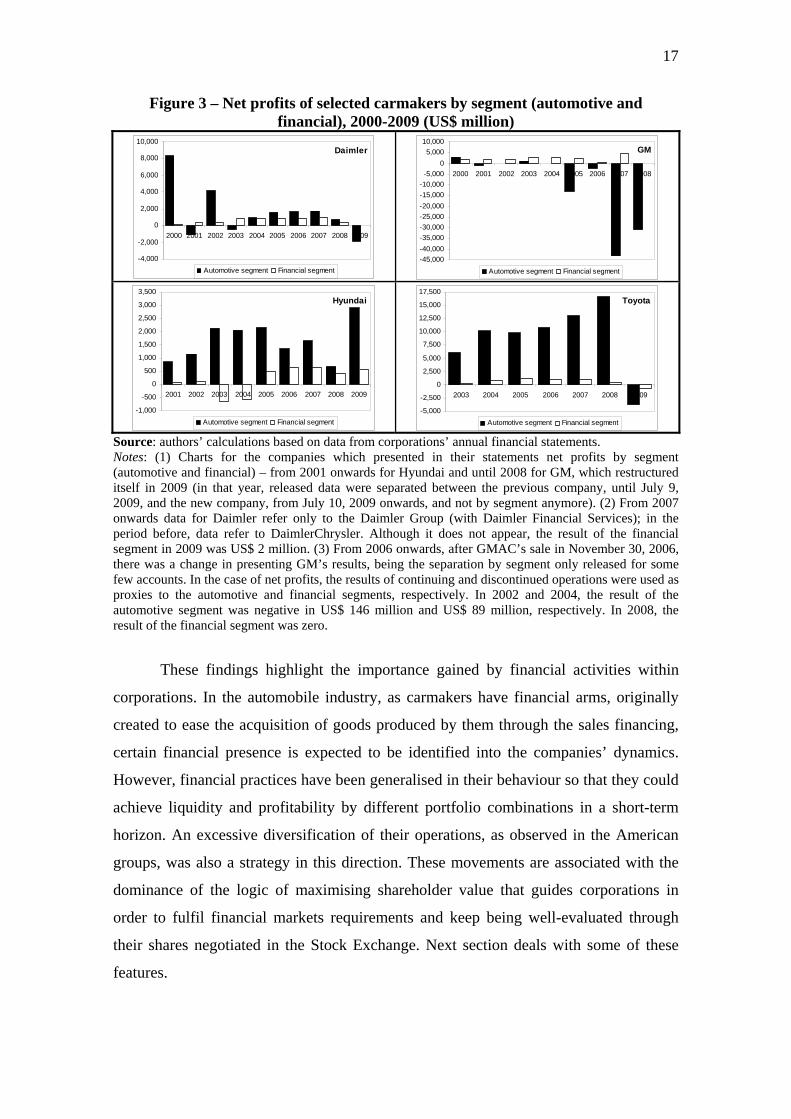
However, the origin of these results may be emphasised. Figure 3 points that
GM had a strong dependence upon the financial segment. Contrary to GM, Toyota and
Hyundai relied much more on the productive segment. For Daimler (or
DaimlerChrysler), despite the predominance of net profits from the automotive
operations, the difference between productive and financial profits was not very
expressive over many years.
Moreover, the financial services segment rarely registered net losses.
Consequently, profits from these activities could contribute to an even higher total
profit, when the automotive segment had surpluses (Toyota’s case, for example), or to
28 Jürgens (2009, p.238) stresses this feature for Volkswagen: “[...] it is clear that VW has not taken the path that famous role models of the New Economy era had traced. Despite the expansion of financial services, VW has not followed Ford and other companies in officially announcing a strategy of ‘value migration’ away from automobile manufacturing as a low-margin activity towards higher-margin activities downstream the value chain. The official policy is that financial services support VW’s core business activities of auto manufacturing”.
16
minimise losses obtained from productive operations (as in GM29), denoting the
importance of financial activities into corporations. As pointed out by Mercer (2009,
p.187, author’s emphasis) with respect to Ford – which could be extended to the other
American companies –, the corporation “was increasingly dependent, for better or
worse, on financial services as a source of income”, characterising a “financialised”
pattern, “defined as a growing reliance on profits from services related to car
transactions, rather than profits derived from car manufacturing”. It should also be
added that sometimes these profits were even not related to car transactions, but to other
financial activities resulted from a massive diversification of their operations.
Chart 3 – Net profits of selected carmakers, 2000-2009 (US$ million)
-40,000
-36,000
-32,000
-28,000
-24,000
-20,000
-16,000
-12,000
-8,000
-4,000
0
4,000
8,000
12,000
16,000
20,000
2000 2001 2002 2003 2004 2005 2006 2007 2008 2009
Daimler Fiat Ford GM Honda Hyundai Toyota Volksw agen
Source: authors’ calculations based on data from corporations’ annual financial statements. Notes: (1) From 2007 onwards data for Daimler refer only to the Daimler Group; in the period before, data refer to DaimlerChrysler. (2) In 2009, GM restructured itself; released data were separated between the previous company, until July 9, 2009, and the new company, from July 10, 2009 onwards. It was considered here only net profits of the new company, created after GM’s bankruptcy, in order to avoid a distortion in values, since net profits of the previous company were US$ 109,003 million under effect of reorganisation gains and accounting changes.
29 Such a case was also verified for Ford. As there were not net profits by segment, it was not possible to present a chart for the company. However, similar trend could be observed through the profit before income taxes by segment. In this case, only in 2008 there was a financial loss (US$ 2.6 billion), contributing to an even higher corporation’s loss, since the productive segment registered a US$ 11.8 billion loss. In all other years within the period 2000-2009, the financial services segment presented a positive profit before income taxes and, except for 2000, higher than the profit from the productive sector which, by its turn, registered losses before income taxes from 2001 to 2008. Thus, the results from the financial services segment contributed in almost the whole period to decrease the corporation’s losses and also to turn them positive between 2002 and 2005 (in the case of the profit before income taxes).
17
Figure 3 – Net profits of selected carmakers by segment (automotive and financial), 2000-2009 (US$ million)
Daimler
-4,000
-2,000
0
2,000
4,000
6,000
8,000
10,000
2000 2001 2002 2003 2004 2005 2006 2007 2008 2009
Automotive segment Financial segment
GM
-45,000
-40,000
-35,000
-30,000
-25,000
-20,000
-15,000
-10,000
-5,000
0
5,000
10,000
2000 2001 2002 2003 2004 2005 2006 2007 2008
Automotive segment Financial segment
Hyundai
-1,000
-500
0
500
1,000
1,500
2,000
2,500
3,000
3,500
2001 2002 2003 2004 2005 2006 2007 2008 2009
Automotive segment Financial segment
Toyota
-5,000
-2,500
0
2,500
5,000
7,500
10,000
12,500
15,000
17,500
2003 2004 2005 2006 2007 2008 2009
Automotive segment Financial segment
Source: authors’ calculations based on data from corporations’ annual financial statements. Notes: (1) Charts for the companies which presented in their statements net profits by segment (automotive and financial) – from 2001 onwards for Hyundai and until 2008 for GM, which restructured itself in 2009 (in that year, released data were separated between the previous company, until July 9, 2009, and the new company, from July 10, 2009 onwards, and not by segment anymore). (2) From 2007 onwards data for Daimler refer only to the Daimler Group (with Daimler Financial Services); in the period before, data refer to DaimlerChrysler. Although it does not appear, the result of the financial segment in 2009 was US$ 2 million. (3) From 2006 onwards, after GMAC’s sale in November 30, 2006, there was a change in presenting GM’s results, being the separation by segment only released for some few accounts. In the case of net profits, the results of continuing and discontinued operations were used as proxies to the automotive and financial segments, respectively. In 2002 and 2004, the result of the automotive segment was negative in US$ 146 million and US$ 89 million, respectively. In 2008, the result of the financial segment was zero.
These findings highlight the importance gained by financial activities within
corporations. In the automobile industry, as carmakers have financial arms, originally
created to ease the acquisition of goods produced by them through the sales financing,
certain financial presence is expected to be identified into the companies’ dynamics.
However, financial practices have been generalised in their behaviour so that they could
achieve liquidity and profitability by different portfolio combinations in a short-term
horizon. An excessive diversification of their operations, as observed in the American
groups, was also a strategy in this direction. These movements are associated with the
dominance of the logic of maximising shareholder value that guides corporations in
order to fulfil financial markets requirements and keep being well-evaluated through
their shares negotiated in the Stock Exchange. Next section deals with some of these
features.
18
4. Financial exposure and fragility of automobile corporations
The previous corporations’ financial framework is here complemented by an
examination of liquidity and solvency indicators as well as profitability measures and
companies’ cash flows committed to interest and dividend payments. Results may show,
on the one hand, the presence of the logic of financial appreciation within companies
and, on the other, differences between the set of corporations by highlighting features of
higher financial fragility in the American case.
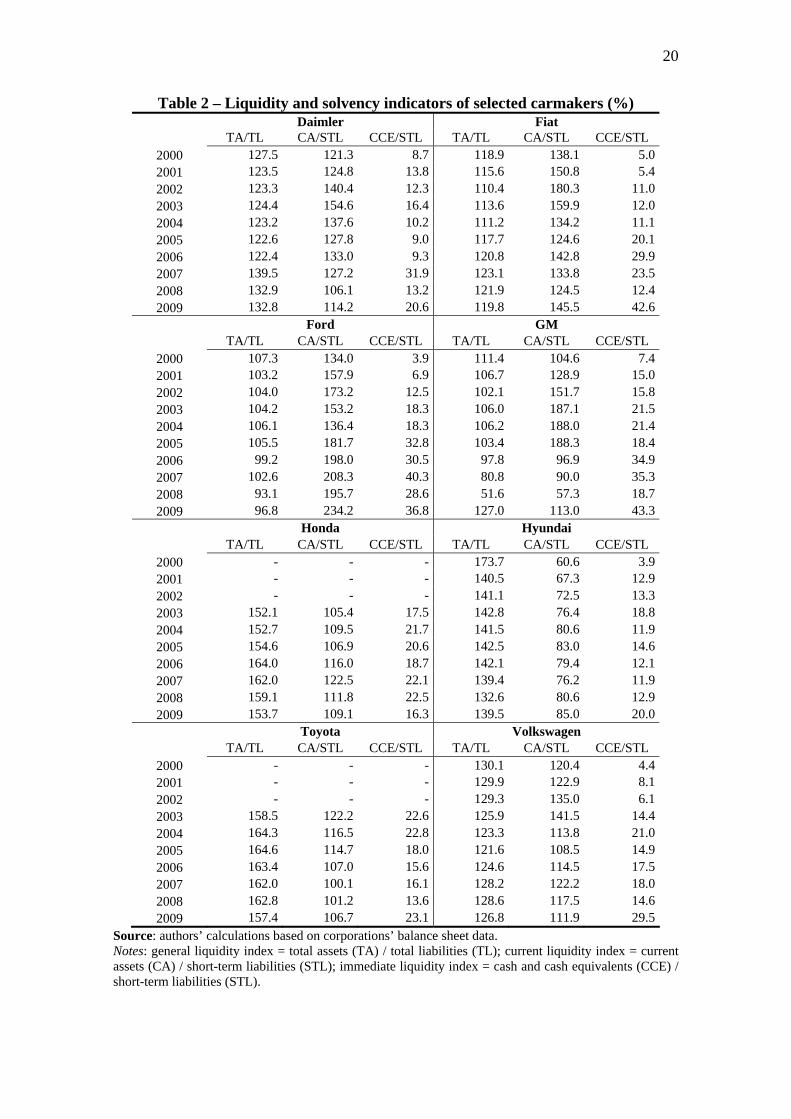
Liquidity and solvency indicators could be added to the analysis of asset and
capital structure. The general liquidity index (TA/TL) shows that Japanese companies,
followed by European and American groups, were in a lower risk position. In the latter,
a clear insolvency risk could be observed in some years as all short- and long-term
applications were inferior to the total liability amount. GM registered an even lower
index since the sale of GMAC, reaching 51.6% in 2008, when the international crisis
worsened. In 2009, the index however returned to a similar level to other companies
with lower financial exposure as a result of the company’s restructuring process
conducted under the U.S. government intervention (Table 2).
Another indicator for this assessment refers to the current liquidity index
(CA/STL). A first approximation would suggest a partially favourable situation for
American companies. Nevertheless, it should be noticed that GM and Ford presented a
current asset to total asset proportion much higher than the short-term liabilities to total
liabilities and equity proportion. This fact resulted in a high current liquidity index that,
however, could mean a source of balance sheet mismatches for future periods.
Moreover, these companies’ current assets were concentrated in financial receivables
which, by their uncertain nature from the financial services segment as loans to
financing vehicles sales, could not be realised whereas their short-term liabilities, liquid
and certain obligations within a year, were mainly composed of short-term notes, bonds
and borrowings. Again, there was an uncertain income flow against a certain cost flow
to be honoured which in Minsky’s terms (1986) could be the origin of balance sheet
imbalances and higher financial fragility for the corporation.
In other companies, such as the Japanese once mentioned, the current liquidity
index was just slightly above the unit. The amount of current assets was a little higher
than the liabilities due within a year. This feature is relevant in explaining their better
solvency capacity and the maintenance of a more stable relation with lower balance
sheet mismatches. Moreover, the asset and capital structure presented a different
19
composition. On the one hand, although financial receivables were also important to
Honda and Toyota, they only represented between 25% and 35% of the current assets,
not even close to the 60% and 70% share in Ford’s and GM’s cases. On the other hand,
short-term liabilities were more concentrated in debts with suppliers and commercial
papers. A more atypical case was Hyundai, whose short-term liabilities mainly based on
short-term borrowings were greater than its current assets dominated by inventories.
Despite not being a very favourable situation to the company, the relation between
current assets and liabilities was at least increasing.
The immediate liquidity indicator is also helpful to assess companies’ liquidity
position. In general, American corporations’ performance did not differ so much from
the rest. The index increase in some years was more a result of sharp decrease in short-
term liabilities than changes in cash and cash equivalents. For all companies the
indicator was around 10% to 20% in the 2000s (Table 2). If short-term securities were
added to cash and cash equivalents as a signal of corporation’s most liquid resources
which could be undone (converted into cash) to face due obligations, the index would
increase to a level between 20% and 30% with more deviation among companies. It
would increase more for American rather than Japanese companies given that the share
of short-term securities in total assets is higher in the former than in the latter
corporations.
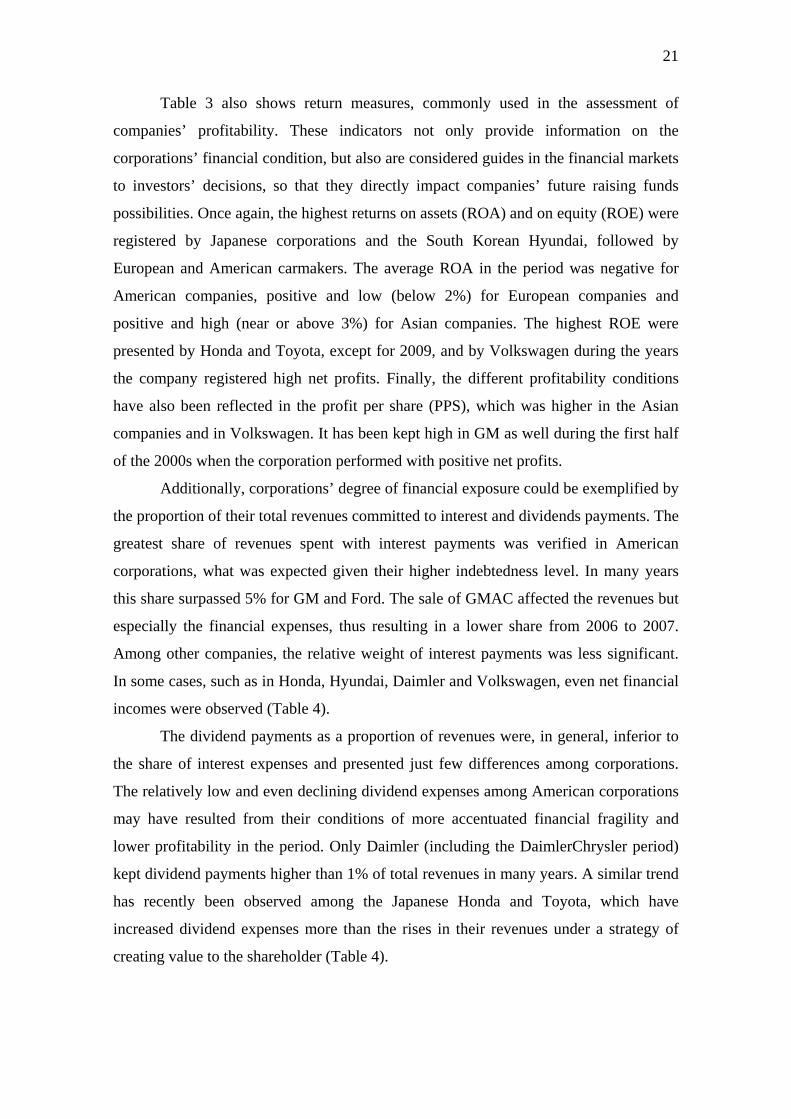
In addition to the liquidity and solvency indicators, the corporations’
performance analysis could be understood through the profitability indicators in order to
examine under another perspective their fragilities, especially higher in the American
case (Table 3). Except for Fiat in the first half of the decade and GM in 2008 which
presented negative gross profits, companies registered gross margin (GP/revenues)
above 15%. In some cases, however, there was a decline over the period, such as in the
American and Japanese companies. The net margin indicator (NP/revenues), which
complements the previous considerations on net profits evolution as it considers the
income after deducting all costs, showed a more severe situation for American
corporations. They registered negative net margins in many years and rarely superior to
2%. Daimler during the merger with Chrysler also did not present high results. Among
European companies, the best performance was achieved by Volkswagen and among all
companies Japanese results generally above 5% were remarkable.
20
Table 2 – Liquidity and solvency indicators of selected carmakers (%) Daimler Fiat TA/TL CA/STL CCE/STL TA/TL CA/STL CCE/STL
2000 127.5 121.3 8.7 118.9 138.1 5.02001 123.5 124.8 13.8 115.6 150.8 5.42002 123.3 140.4 12.3 110.4 180.3 11.02003 124.4 154.6 16.4 113.6 159.9 12.02004 123.2 137.6 10.2 111.2 134.2 11.12005 122.6 127.8 9.0 117.7 124.6 20.12006 122.4 133.0 9.3 120.8 142.8 29.92007 139.5 127.2 31.9 123.1 133.8 23.52008 132.9 106.1 13.2 121.9 124.5 12.42009 132.8 114.2 20.6 119.8 145.5 42.6
Ford GM TA/TL CA/STL CCE/STL TA/TL CA/STL CCE/STL
2000 107.3 134.0 3.9 111.4 104.6 7.42001 103.2 157.9 6.9 106.7 128.9 15.02002 104.0 173.2 12.5 102.1 151.7 15.82003 104.2 153.2 18.3 106.0 187.1 21.52004 106.1 136.4 18.3 106.2 188.0 21.42005 105.5 181.7 32.8 103.4 188.3 18.42006 99.2 198.0 30.5 97.8 96.9 34.92007 102.6 208.3 40.3 80.8 90.0 35.32008 93.1 195.7 28.6 51.6 57.3 18.72009 96.8 234.2 36.8 127.0 113.0 43.3
Honda Hyundai TA/TL CA/STL CCE/STL TA/TL CA/STL CCE/STL
2000 - - - 173.7 60.6 3.92001 - - - 140.5 67.3 12.92002 - - - 141.1 72.5 13.32003 152.1 105.4 17.5 142.8 76.4 18.82004 152.7 109.5 21.7 141.5 80.6 11.92005 154.6 106.9 20.6 142.5 83.0 14.62006 164.0 116.0 18.7 142.1 79.4 12.12007 162.0 122.5 22.1 139.4 76.2 11.92008 159.1 111.8 22.5 132.6 80.6 12.92009 153.7 109.1 16.3 139.5 85.0 20.0
Toyota Volkswagen TA/TL CA/STL CCE/STL TA/TL CA/STL CCE/STL
2000 - - - 130.1 120.4 4.42001 - - - 129.9 122.9 8.12002 - - - 129.3 135.0 6.12003 158.5 122.2 22.6 125.9 141.5 14.42004 164.3 116.5 22.8 123.3 113.8 21.02005 164.6 114.7 18.0 121.6 108.5 14.92006 163.4 107.0 15.6 124.6 114.5 17.52007 162.0 100.1 16.1 128.2 122.2 18.02008 162.8 101.2 13.6 128.6 117.5 14.62009 157.4 106.7 23.1 126.8 111.9 29.5
Source: authors’ calculations based on corporations’ balance sheet data. Notes: general liquidity index = total assets (TA) / total liabilities (TL); current liquidity index = current assets (CA) / short-term liabilities (STL); immediate liquidity index = cash and cash equivalents (CCE) / short-term liabilities (STL).
21
Table 3 also shows return measures, commonly used in the assessment of
companies’ profitability. These indicators not only provide information on the
corporations’ financial condition, but also are considered guides in the financial markets
to investors’ decisions, so that they directly impact companies’ future raising funds
possibilities. Once again, the highest returns on assets (ROA) and on equity (ROE) were
registered by Japanese corporations and the South Korean Hyundai, followed by
European and American carmakers. The average ROA in the period was negative for
American companies, positive and low (below 2%) for European companies and
positive and high (near or above 3%) for Asian companies. The highest ROE were
presented by Honda and Toyota, except for 2009, and by Volkswagen during the years
the company registered high net profits. Finally, the different profitability conditions
have also been reflected in the profit per share (PPS), which was higher in the Asian
companies and in Volkswagen. It has been kept high in GM as well during the first half
of the 2000s when the corporation performed with positive net profits.
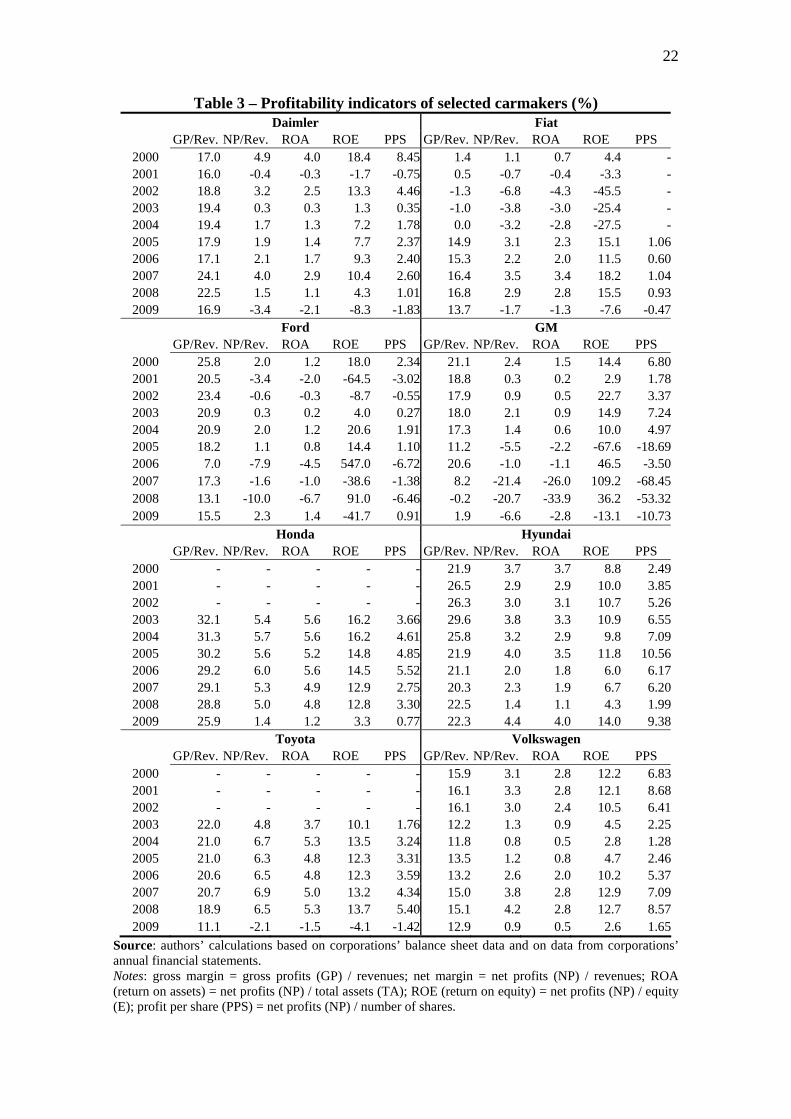
Additionally, corporations’ degree of financial exposure could be exemplified by
the proportion of their total revenues committed to interest and dividends payments. The
greatest share of revenues spent with interest payments was verified in American
corporations, what was expected given their higher indebtedness level. In many years
this share surpassed 5% for GM and Ford. The sale of GMAC affected the revenues but
especially the financial expenses, thus resulting in a lower share from 2006 to 2007.
Among other companies, the relative weight of interest payments was less significant.
In some cases, such as in Honda, Hyundai, Daimler and Volkswagen, even net financial
incomes were observed (Table 4).
The dividend payments as a proportion of revenues were, in general, inferior to
the share of interest expenses and presented just few differences among corporations.
The relatively low and even declining dividend expenses among American corporations
may have resulted from their conditions of more accentuated financial fragility and
lower profitability in the period. Only Daimler (including the DaimlerChrysler period)
kept dividend payments higher than 1% of total revenues in many years. A similar trend
has recently been observed among the Japanese Honda and Toyota, which have
increased dividend expenses more than the rises in their revenues under a strategy of
creating value to the shareholder (Table 4).
22
Table 3 – Profitability indicators of selected carmakers (%) Daimler Fiat GP/Rev. NP/Rev. ROA ROE PPS GP/Rev. NP/Rev. ROA ROE PPS
2000 17.0 4.9 4.0 18.4 8.45 1.4 1.1 0.7 4.4 -2001 16.0 -0.4 -0.3 -1.7 -0.75 0.5 -0.7 -0.4 -3.3 -2002 18.8 3.2 2.5 13.3 4.46 -1.3 -6.8 -4.3 -45.5 -2003 19.4 0.3 0.3 1.3 0.35 -1.0 -3.8 -3.0 -25.4 -2004 19.4 1.7 1.3 7.2 1.78 0.0 -3.2 -2.8 -27.5 -2005 17.9 1.9 1.4 7.7 2.37 14.9 3.1 2.3 15.1 1.062006 17.1 2.1 1.7 9.3 2.40 15.3 2.2 2.0 11.5 0.602007 24.1 4.0 2.9 10.4 2.60 16.4 3.5 3.4 18.2 1.042008 22.5 1.5 1.1 4.3 1.01 16.8 2.9 2.8 15.5 0.932009 16.9 -3.4 -2.1 -8.3 -1.83 13.7 -1.7 -1.3 -7.6 -0.47
Ford GM GP/Rev. NP/Rev. ROA ROE PPS GP/Rev. NP/Rev. ROA ROE PPS
2000 25.8 2.0 1.2 18.0 2.34 21.1 2.4 1.5 14.4 6.802001 20.5 -3.4 -2.0 -64.5 -3.02 18.8 0.3 0.2 2.9 1.782002 23.4 -0.6 -0.3 -8.7 -0.55 17.9 0.9 0.5 22.7 3.372003 20.9 0.3 0.2 4.0 0.27 18.0 2.1 0.9 14.9 7.242004 20.9 2.0 1.2 20.6 1.91 17.3 1.4 0.6 10.0 4.972005 18.2 1.1 0.8 14.4 1.10 11.2 -5.5 -2.2 -67.6 -18.692006 7.0 -7.9 -4.5 547.0 -6.72 20.6 -1.0 -1.1 46.5 -3.502007 17.3 -1.6 -1.0 -38.6 -1.38 8.2 -21.4 -26.0 109.2 -68.452008 13.1 -10.0 -6.7 91.0 -6.46 -0.2 -20.7 -33.9 36.2 -53.322009 15.5 2.3 1.4 -41.7 0.91 1.9 -6.6 -2.8 -13.1 -10.73
Honda Hyundai GP/Rev. NP/Rev. ROA ROE PPS GP/Rev. NP/Rev. ROA ROE PPS
2000 - - - - - 21.9 3.7 3.7 8.8 2.492001 - - - - - 26.5 2.9 2.9 10.0 3.852002 - - - - - 26.3 3.0 3.1 10.7 5.262003 32.1 5.4 5.6 16.2 3.66 29.6 3.8 3.3 10.9 6.552004 31.3 5.7 5.6 16.2 4.61 25.8 3.2 2.9 9.8 7.092005 30.2 5.6 5.2 14.8 4.85 21.9 4.0 3.5 11.8 10.562006 29.2 6.0 5.6 14.5 5.52 21.1 2.0 1.8 6.0 6.172007 29.1 5.3 4.9 12.9 2.75 20.3 2.3 1.9 6.7 6.202008 28.8 5.0 4.8 12.8 3.30 22.5 1.4 1.1 4.3 1.992009 25.9 1.4 1.2 3.3 0.77 22.3 4.4 4.0 14.0 9.38
Toyota Volkswagen GP/Rev. NP/Rev. ROA ROE PPS GP/Rev. NP/Rev. ROA ROE PPS
2000 - - - - - 15.9 3.1 2.8 12.2 6.832001 - - - - - 16.1 3.3 2.8 12.1 8.682002 - - - - - 16.1 3.0 2.4 10.5 6.412003 22.0 4.8 3.7 10.1 1.76 12.2 1.3 0.9 4.5 2.252004 21.0 6.7 5.3 13.5 3.24 11.8 0.8 0.5 2.8 1.282005 21.0 6.3 4.8 12.3 3.31 13.5 1.2 0.8 4.7 2.462006 20.6 6.5 4.8 12.3 3.59 13.2 2.6 2.0 10.2 5.372007 20.7 6.9 5.0 13.2 4.34 15.0 3.8 2.8 12.9 7.092008 18.9 6.5 5.3 13.7 5.40 15.1 4.2 2.8 12.7 8.572009 11.1 -2.1 -1.5 -4.1 -1.42 12.9 0.9 0.5 2.6 1.65
Source: authors’ calculations based on corporations’ balance sheet data and on data from corporations’ annual financial statements. Notes: gross margin = gross profits (GP) / revenues; net margin = net profits (NP) / revenues; ROA (return on assets) = net profits (NP) / total assets (TA); ROE (return on equity) = net profits (NP) / equity (E); profit per share (PPS) = net profits (NP) / number of shares.
23
Table 4 – Net financial incomes (or expenses) as a proportion of total revenues*, by carmaker, 2000-2009 (%)
Interests (% of total revenues) Daimler Fiat Ford GM Honda Hyundai Toyota Volkswagen
2000 0.1 -1.0 -5.5 -5.2 - 2.3 - -0.42001 0.1 -1.1 -6.2 -4.8 - 1.4 - -1.12002 1.5 -1.2 -5.4 -4.1 - 0.4 - -0.92003 -2.1 -1.9 -4.7 -5.1 -0.1 0.1 -0.2 -0.32004 -0.8 -1.3 -4.1 -6.2 0.0 0.0 -0.1 -0.62005 0.1 -1.8 -4.3 -8.2 0.0 -0.2 -0.1 -1.12006 0.4 -1.1 -5.5 -8.2 0.2 -0.4 -0.1 -0.22007 0.5 -1.0 -6.3 -1.7 0.3 -0.6 -0.2 0.42008 0.1 -1.6 -6.6 -1.7 0.3 -0.3 -0.2 0.22009 -1.0 -1.5 -5.8 -5.9 0.2 -1.0 -0.2 -0.6
Dividends (% of total revenues) Daimler Fiat Ford GM Honda Hyundai Toyota Volkswagen
2000 -1.5 -0.6 -1.6 -0.7 - -0.8 - -0.42001 -1.5 -0.6 -1.2 -0.7 - -0.4 - -0.52002 -0.7 -0.4 -0.5 -0.6 - -0.6 - -0.62003 -1.1 0.0 -0.4 -0.6 -0.4 -0.8 -0.7 -0.62004 -1.1 0.0 -0.4 -0.6 -0.4 -0.5 -0.8 -0.52005 -1.1 -0.1 -0.4 -0.6 -0.6 -0.7 -0.9 -0.42006 -1.0 0.0 -0.3 -0.3 -0.7 -0.6 -1.2 -0.42007 -1.6 -0.5 - -0.3 -1.3 -0.5 -1.4 -0.52008 -2.1 -0.9 - -0.2 -1.4 -0.5 -1.6 -0.6
2009 -0.8 -0.1 - -0.1 -1.5 -0.3 -2.1 -0.8
Source: authors’ calculations based on data from corporations’ annual financial statements (including cash flows). * Net financial incomes (or expenses) are represented by interest incomes or payments and by dividend payments, both as a proportion of corporation’s total revenues. Notes: (1) Results “0.0” refer to negative values with significative algarisms after the second decimal. Inexistent values for certain years are represented by “-”. (2) From 2007 onwards data for Daimler refer only to the Daimler Group; in the period before, data refer to DaimlerChrysler. (3) GM’s restructuring process in 2009. Both added results of the previous company, until July 9, 2009, and the new company, from July 10, 2009 onwards, were considered.
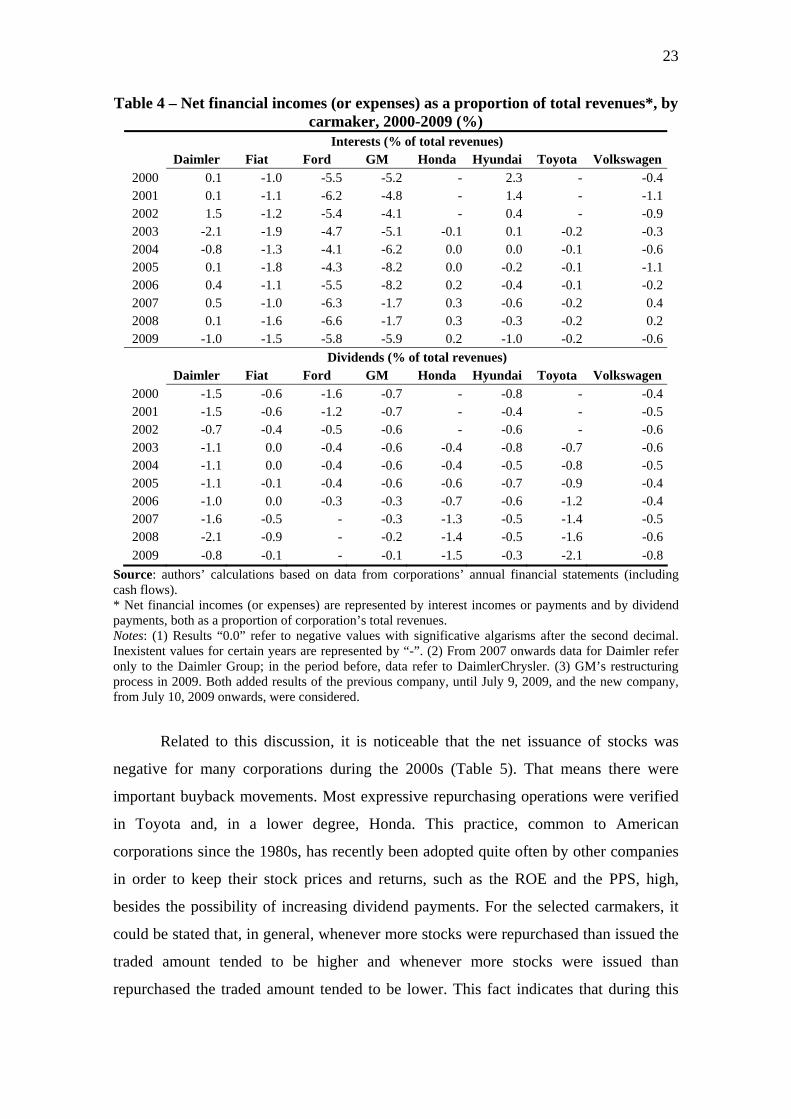
Related to this discussion, it is noticeable that the net issuance of stocks was
negative for many corporations during the 2000s (Table 5). That means there were
important buyback movements. Most expressive repurchasing operations were verified
in Toyota and, in a lower degree, Honda. This practice, common to American
corporations since the 1980s, has recently been adopted quite often by other companies
in order to keep their stock prices and returns, such as the ROE and the PPS, high,
besides the possibility of increasing dividend payments. For the selected carmakers, it
could be stated that, in general, whenever more stocks were repurchased than issued the
traded amount tended to be higher and whenever more stocks were issued than
repurchased the traded amount tended to be lower. This fact indicates that during this
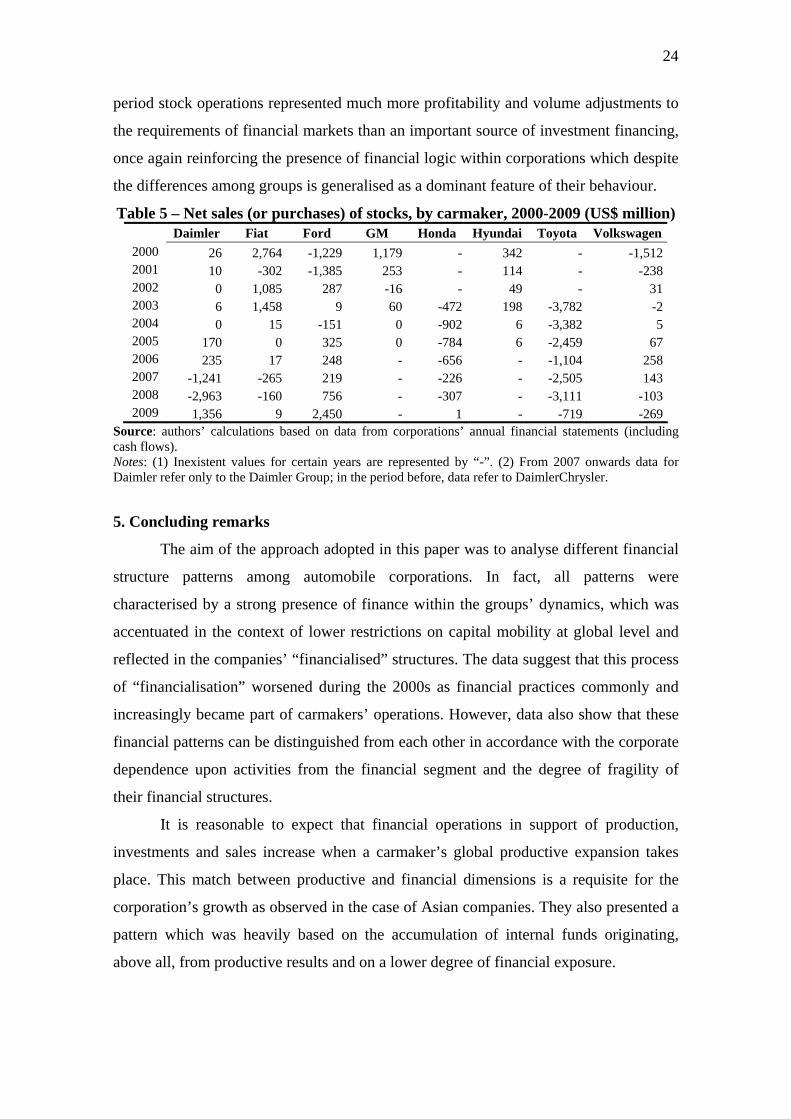
24
period stock operations represented much more profitability and volume adjustments to
the requirements of financial markets than an important source of investment financing,
once again reinforcing the presence of financial logic within corporations which despite
the differences among groups is generalised as a dominant feature of their behaviour.
Table 5 – Net sales (or purchases) of stocks, by carmaker, 2000-2009 (US$ million) Daimler Fiat Ford GM Honda Hyundai Toyota Volkswagen
2000 26 2,764 -1,229 1,179 - 342 - -1,5122001 10 -302 -1,385 253 - 114 - -2382002 0 1,085 287 -16 - 49 - 312003 6 1,458 9 60 -472 198 -3,782 -22004 0 15 -151 0 -902 6 -3,382 52005 170 0 325 0 -784 6 -2,459 672006 235 17 248 - -656 - -1,104 2582007 -1,241 -265 219 - -226 - -2,505 1432008 -2,963 -160 756 - -307 - -3,111 -1032009 1,356 9 2,450 - 1 - -719 -269
Source: authors’ calculations based on data from corporations’ annual financial statements (including cash flows). Notes: (1) Inexistent values for certain years are represented by “-”. (2) From 2007 onwards data for Daimler refer only to the Daimler Group; in the period before, data refer to DaimlerChrysler.
5. Concluding remarks
The aim of the approach adopted in this paper was to analyse different financial
structure patterns among automobile corporations. In fact, all patterns were
characterised by a strong presence of finance within the groups’ dynamics, which was
accentuated in the context of lower restrictions on capital mobility at global level and
reflected in the companies’ “financialised” structures. The data suggest that this process
of “financialisation” worsened during the 2000s as financial practices commonly and
increasingly became part of carmakers’ operations. However, data also show that these
financial patterns can be distinguished from each other in accordance with the corporate
dependence upon activities from the financial segment and the degree of fragility of
their financial structures.
It is reasonable to expect that financial operations in support of production,
investments and sales increase when a carmaker’s global productive expansion takes
place. This match between productive and financial dimensions is a requisite for the
corporation’s growth as observed in the case of Asian companies. They also presented a
pattern which was heavily based on the accumulation of internal funds originating,
above all, from productive results and on a lower degree of financial exposure.
25
The American corporations, on the contrary, registered an excessive dependence
upon financial activities. A clear mismatch between the financial and productive
segments within the corporations could be observed. In spite of continuing executing its
role in relation to production, finance acquired its own dynamic, reflected in its
autonomy from productive activities, a large importance in the company’s performance
and a diversification to areas not related to its core business, i.e. sales financing. The
American pattern was, moreover, marked by a high indebtedness and consequently a
high leverage degree not necessarily associated with the productive needs and by a
greater commitment of the group’s income to financial expenditures as well, thus
denoting more fragile financial structures.
A third and intermediate pattern between the American and the Asian structures
was identified in the European carmakers, an endogenously heterogeneous group.
Financial activities tended to show a significant weight. They played their
complementary and essential role in the corporation’s productive dynamics, but without
a growing or clear mismatch from their core business, except for specific moments.
Although it did not mean a particular strategy in this direction of “finance by itself”, it
could not be denied that European groups as well as other carmakers were deeply
embedded in a broader logic conducted by financial markets.
As the crisis showed, despite all companies being affected by the credit crunch
in late 2008, the previous different financial structure patterns resulted in much more
severe constraints for American corporations. Their higher financial fragility was
immediately translated into insolvency risk. It was not by chance that General Motors
and Chrysler received many bail-outs, especially from the U.S. government, in order to
maintain their activities, even at a lower level, and promote through state intervention a
restructuring process in 2009. Hence, the crisis developments suggest the need to
rethink the articulation pattern between finance and production within automobile
groups, especially of American carmakers, which means in broader terms to re-establish
the role played by the financial dimension in corporate dynamics.
References
AGLIETTA, Michel & REBÉRIOUX, Antoine. Corporate governance adrift: a critique of shareholder value. Cheltenham, U.K.: Edward Elgar, 2005.
ANDRADE, Cyro. “O tempo passou, ficou a pretensão”. Valor Econômico, São Paulo, April 3, 4 and 5, 2009.
26
BELLUZZO, Luiz Gonzaga. “O dólar e os desequilíbrios globais”. Revista de Economia Política, v. 25, n. 3, pp.224-232, Jul.-Sep. 2005.
BORDENAVE, Gérard. “La globalisation au cœur du changement organisationnel: crise et redressement de Ford Motor Company”. In: FREYSSENET, Michel; MAIR, Andrew; SHIMIZU, Koichi & VOLPATO, Giuseppe (Coord.). Quel modèle productif?: Trajectoires et modèles industriels des constructeurs automobiles mondiaux. Paris: La Découverte, 2000, pp.227-263.
BORGHI, Roberto Alexandre Zanchetta. A reestruturação produtiva e a dinâmica da indústria automobilística. BA in Economics. Campinas, Brazil: University of Campinas, 2007.
BORGHI, Roberto Alexandre Zanchetta. Economia financeira e economia produtiva: o padrão de financiamento da indústria automobilística. MA in Economics. Campinas, Brazil: University of Campinas, 2011.
BORGHI, Roberto Alexandre Zanchetta & ROCHA, Igor Lopes. “Non-financial corporations and maximizing shareholder value: an approach on macroeconomic instability in emerging economies”. Minsky Summer Conference, Levy Economics Institute of Bard College, Annandale-on-Hudson, NY, June 27-29, 2010.
BRAGA, José Carlos de Souza. “Financeirização global. O padrão sistêmico de riqueza do capitalismo contemporâneo”. In: TAVARES, Maria da Conceição & FIORI, José Luís (Orgs.). Poder e dinheiro: uma economia política da globalização. Petrópolis, Brazil: Vozes, 1997, pp.195-242.
CHANDLER, Alfred. Scale and scope: the dynamics of industrial capitalism. Cambridge/MA: Belknap; London: Harvard Univ., 1990.
CHESNAIS, François (1994). A mundialização do capital. Translated to Portuguese by Silvana Finzi Foá. São Paulo: Xamã, 1996.
__________. “A globalização e o curso do capitalismo de fim-de-século”. Revista Economia e Sociedade, University of Campinas, Campinas, Brazil, pp.1-30, Dec. 1995.
__________ (Coord.) (1996). A mundialização financeira: gênese, custos e riscos. São Paulo: Xamã, 1998.
__________. “Doze teses sobre a mundialização do capital”. In: FERREIRA, Carla & SCHERER, André Forti (Orgs.). O Brasil frente à ditadura do capital financeiro: reflexões e alternativas. Lajeado, Brazil: Univates, 2005, pp.17-31 (a).
__________. “O capital portador de juros: acumulação, internacionalização, efeitos econômicos e políticos”. In: CHESNAIS, François (Org.). A finança mundializada. São Paulo: Boitempo Editorial, 2005, pp.35-67 (b).
CLETO, Paula. “Grupo canadense paga US$ 6,3 bilhões por Chrysler Financial”. Valor Econômico, São Paulo, December 21, 2010.
27
COUTINHO, Luciano & BELLUZZO, Luiz Gonzaga. “‘Financeirização’ da riqueza, inflação de ativos e decisões de gasto em economias abertas”. Revista Economia e Sociedade, University of Campinas, Campinas, Brazil, pp.137-150, Dec. 1998.
CROTTY, James. “The effects of increased product market competition and changes in financial markets on the performance of nonfinancial corporations in the neoliberal era”. Political Economy Research Institute (PERI), Working Paper n. 44, University of Massachusetts Amherst, 2002.
DASH, Eric & BAJAJ, Vikas. “Fed approves GMAC request to become a bank”. The New York Times, December 24, 2008.
ECLAC. “Inversión y estrategias empresariales en la industria automotriz”. In: La inversión extranjera en América Latina y el Caribe, 2003. Santiago, Chile: ECLAC and United Nations, pp.103-137, May 2004.
ECONOMIST (The). “Under siege”. The Economist, Turin and Rome, October 17, 2002.
__________. “GM and Ford in need of a big overhaul”. The Economist, October 20, 2005 (a).
__________. “That sinking feeling”. The Economist, Detroit and London, November 17, 2005 (b).
__________. “Detroit’s wounded giant”. The Economist, November 17, 2005 (c).
__________. “Saving Fiat”. The Economist, December 1, 2005 (d).
__________. “Shrink to fit”. The Economist, Detroit and Los Angeles, January 5, 2006.
__________. “Epiphany in Dearborn”. The Economist, Dearborn/MI, December 9, 2010 (a).
__________. “Into the fast lane”. The Economist, New York, December 29, 2010 (b).
EPSTEIN, Gerald A. (Ed.). Financialization and the world economy. Northampton/MA: Edward Elgar Publishing, Inc., 2005.
FARHI, Maryse & BORGHI, Roberto Alexandre Zanchetta. “Operações com derivativos financeiros das corporações de economias emergentes”. Estudos Avançados, IEA/USP, São Paulo, v. 23, n. 66, pp.169-188, May-August 2009.
FREYSSENET, Michel & LUNG, Yannick. “Between globalization and regionalization: what is the future of the automobile industry?”. GERPISA International Network, October 1999.
GONÇALVES, Reinaldo. “A empresa transnacional”. In: HASENCLEVER, Lia & KUPFER, David (Orgs.). Economia Industrial: fundamentos teóricos e práticas no Brasil. Rio de Janeiro: Campus, 2002, pp.389-411.
28
GONÇALVES, Reinaldo; BAUMANN, Renato; CANUTO, Otaviano & PRADO, Luiz C. D. A Nova Economia Internacional: uma perspectiva brasileira. 3rd Edition. Rio de Janeiro: Campus, 1999.
GUTTMANN, Robert. “Uma introdução ao capitalismo dirigido pelas finanças”. Revista Novos Estudos, Cebrap, São Paulo, n. 82, pp.11-33, November 2008.
JÜRGENS, Ulrich. “The final chapter of the ‘VW model’? The VW trajectory, 1995-2005”. In: FREYSSENET, Michel (Ed.). The second automobile revolution: trajectories of the world carmakers in the 21st century. London: Palgrave Macmillan and Gerpisa, 2009, pp.225-245.
KÖHLER, Holm-Detlev. “From the marriage in heaven to the divorce on earth: the DaimlerChrysler trajectory since the merger”. In: FREYSSENET, Michel (Ed.). The second automobile revolution: trajectories of the world carmakers in the 21st century. London: Palgrave Macmillan and Gerpisa, 2009, pp.309-331.
LAZONICK, William & O’SULLIVAN, Mary. “Maximizing shareholder value: a new ideology for corporate governance”. Economy and Society, v. 29, n. 1, pp.13-35, February 2000.
MACKINTOSH, James. “Montadoras admitem que vão ‘mudar ou morrer’”. Financial Times, London, February 17, 2006.
MERCER, Glenn. “Ford, 1993-2007: losing its way?”. In: FREYSSENET, Michel (Ed.). The second automobile revolution: trajectories of the world carmakers in the 21st century. London: Palgrave Macmillan and Gerpisa, 2009, pp.185-205.
MINSKY, Hyman P. Stabilizing an unstable economy. New Haven and London: Yale University Press, 1986.
OSANG, Alexander. “A globalizada General Motors – Vá para o Leste, rapaz”. Der Spiegel, January 24, 2006 (a).
__________. “Os americanos não respeitam a força de nossos trabalhadores, diz alemão sobre a GM”. Der Spiegel, January 24, 2006 (b).
__________. “GM busca funcionários ‘flexíveis’ na Polônia, onde os salários são bem menores”. Der Spiegel, January 24, 2006 (c).
PALLEY, Thomas I. “Financialization: what it is and why it matters”. The Levy Economics Institute of Bard College, Working Paper n. 525, December 2007.
PENROSE, Edith Tilton (1959). The theory of the growth of the firm. Oxford: Basil Blackwell, 1980.
PLIHON, Dominique. “As grandes empresas fragilizadas pela finança”. In: CHESNAIS, François (Org.). A finança mundializada. São Paulo: Boitempo Editorial, 2005.
29
SENTER JR., Richard & MCMANUS, Walter. “General Motors in an age of corporate restructuring”. In: FREYSSENET, Michel (Ed.). The second automobile revolution: trajectories of the world carmakers in the 21st century. London: Palgrave Macmillan and Gerpisa, 2009, pp.165-184.
SHIMOKAWA, Koichi. Global sourcing, global product strategy in the world auto industry, and Japanese automakers’ global strategy. Hosei University, June 1996.
TAVARES, Maria da Conceição & BELLUZZO, Luiz Gonzaga de Mello. “Desenvolvimento no Brasil – relembrando um velho tema”. In: BIELSCHOWSKY, Ricardo & MUSSI, Carlos (Orgs.). Políticas para a retomada do crescimento – reflexões de economistas brasileiros. Brasília, Brazil: Ipea: ECLAC, 2002, pp.149-184.
VALOR ECONÔMICO. “Venda da Chrysler encerra união histórica”. Valor Econômico, São Paulo, May 15, 2007.
VOLPATO, Giuseppe. “Fiat Group Automobiles: an Arabian phoenix in the international auto industry”. In: FREYSSENET, Michel (Ed.). The second automobile revolution: trajectories of the world carmakers in the 21st century. London: Palgrave Macmillan and Gerpisa, 2009, pp.287-308.
WERNLE, Bradford. “Chrysler offers 0% for 72 months on most models”. Automotive News, Detroit, January 10, 2011.
WHITE, Joseph B. & MCCRACKEN, Jeffrey. “Acordo da GM com sindicato marca nova era para montadoras dos EUA”. The Wall Street Journal. In: Valor Econômico, September 27, 2007.
WOMACK, James P.; ROOS, Daniel & JONES, Daniel T. The machine that changed the world. New York: Rawson Associates, 1990.
Corporations’ websites (accessed in: November 12, 2010):
- Chrysler: http://www.chrysler.com/en/ & https://www.chryslerfinancial.com/home.do;
- Daimler: http://www.daimler.com/;
- Fiat: http://www.fiatgroup.com/;
- Ford: http://www.ford.com/ & http://www.fordcredit.com/index.jhtml;
- General Motors: http://www.gm.com/ & http://www.ally.com/;
- Honda: http://world.honda.com/ & https://www.hondafinancialservices.com/index.asp;
- Hyundai: http://worldwide.hyundai.com/ & https://www.hyundaimotorfinance.com/;
- Toyota: http://www.toyota-global.com/;
- Volkswagen: http://www.volkswagen.com/vwcms/master_public/virtualmaster/en2.html & http://www.vwfsag.de/content/sites/vwcorporate/vwfsag_de/en/home.html.