Embed Size (px)
Citation preview

The Financial Reporting Environment, Reporting Discretion, and Earnings Management: US GAAP vs. IFRS
Mark Evans Indiana University
Richard Houston University of Alabama
Michael Peters Villanova University
Jamie Pratt* Indiana University
October 2012
* Corresponding author. Kelley School of Business, 1309 E. 10th Street, Bloomington, Indiana 47405, email: [email protected]. We appreciate comments received from participants at the 2012 Midwest Summer Accounting Research Conference at the University of Minnesota and an Indiana University Brown Bag Workshop.

The Financial Reporting Environment, Reporting Discretion, and Earnings Management: US GAAP vs. IFRS
ABSTRACT
In this study we examine the effect of characteristics of the financial reporting environment on the level of financial reporting discretion perceived by managers and the likelihood and method of earnings management. We focus primarily on the effects of financial reporting standards (US GAAP vs. IFRS), while simultaneously considering other important characteristics of the reporting environment and how they interact with the standards—firm domicile, firm ownership, audit quality, firm size, and the direction of the earnings adjustment. Using a web-based case completed by 615 experienced financial officers from the US, Europe and Asia, we find that financial officers under IFRS perceive higher levels of reporting discretion than those under U.S. GAAP, and the perception of higher levels of reporting discretion leads to both a greater likelihood of earnings management and a preference for the use of accruals over real methods. While we generate no evidence that IFRS, compared to U.S. GAAP, leads to a greater likelihood of earnings management, we do observe that U.S. firms under U.S. GAAP show a strong preference for real activities over accruals methods, while all other firms (U.S. firms under IFRS and non-U.S. firms) are either indifferent between the two methods or prefer accruals. We also find that firms adjusting earnings upward strongly prefer real activities, while firms adjusting earnings downward are either indifferent (US GAAP users) or prefer accruals (IFRS users). These findings contribute to research concerning whether differences in financial reporting environments are associated with differences in the perception of allowable reporting discretion, and the inclination to manage earnings via real activities or accruals. They also suggest that adopting IFRS in the US may have little effect on the overall level of earnings management, but instead may encourage firms to substitute accruals for real activities when managing earnings. Keywords: Accounting standards; earnings management; regulation JEL Codes: M40; M41; M48

2
I. INTRODUCTION
In this study we examine the effect of characteristics of the financial reporting
environment on the level of financial reporting discretion perceived by managers and the
likelihood and method of earnings management. We focus primarily on the effects of financial
reporting standards (US GAAP vs. IFRS), while simultaneously considering other important
characteristics of the reporting environment and how they interact with the standards. These
characteristics include firm domicile (US vs. non-US), firm ownership (public vs. private), audit
quality (Big 4 vs. non-Big 4), firm size, and the direction of the earnings adjustment (upward vs.
downward).1
We collected data using a web-based exercise completed by 615 experienced financial
officers whose firms report under U.S. GAAP or IFRS and are domiciled in the U.S., Europe, or
Asia. Participants completed a short case in which they were asked to assume that their firms
were approaching year-end, and were provided with monetary values for both expected
unmanaged earnings (the firm’s best guess of what earnings would be if left unadjusted) and an
important benchmark. We then asked participants whether in this situation their entities would
use allowable reporting discretion to increase, decrease, or not adjust earnings and, if they
thought their entities would adjust earnings, by how much.2 We also asked participants to
indicate which methods (real vs. accruals) their entities would use to adjust earnings as well as
various questions about their entities (e.g., reporting system, auditors, size, ownership, and
benchmarks) and themselves (e.g., age, experience, and certification).
1 The direction of the earnings adjustment is not a characteristic of the reporting environment per se, but we argue later that the regulatory pressures controlling upward earnings management are quite different from those controlling downward earnings management. 2 Allowable reporting discretion is defined as the level of reporting discretion that the financial officer believes can be exercised either through operating, investing, or financing decisions (real activities) or accounting choices (accruals) without violating generally accepted accounting principles.
3
We report four primary findings: (1) compared to financial officers under US GAAP,
financial officers under IFRS perceived greater levels of allowable reporting discretion; (2)
greater levels of perceived allowable reporting discretion were associated with a greater
likelihood of earnings management and a preference for accruals methods over real activities; (3)
financial officers from US firms under US GAAP indicated that their firms preferred real
methods for earnings management, while non-US officers and those under IFRS (US and non-
US firms) indicated that their firms were either indifferent between real and accruals methods or
preferred accruals methods; and (4) compared to firms adjusting earnings upward, firms
adjusting earnings downward relied more heavily on accruals vis-à-vis real methods.
These results contribute to research concerning the effects of regulation on earnings
management (Leuz, Nanda, Wysocki 2003; Lang, Raedy, and Wilson 2006) and the use of real
vs. accruals methods (Ewert and Wagenhofer 2005), while identifying a possible consequence
associated with the adoption of IFRS in the U.S. (DeFond 2010; Pownall and Schipper 1999).
Our evidence suggests, for example, that adopting IFRS in the US would allow greater levels of
reporting discretion, but would not necessarily lead to more earnings management. Instead, it
may lead to differences in the methods used to manage earnings - more accruals and less real
activities. A related implication for standard-setters is that simply tightening accounting
standards may not lead to less earnings management; it may lead instead to less reliance on
accruals and more reliance on real activities.
We build on archival research that examines reporting discretion across different
domiciles and the value relevance of earnings across different accounting standards. Leuz et al.
(2003) and Lang et al. (2006), for example, show that firms located in highly regulated domiciles
are less likely to engage in earnings management by accruals; other studies show U.S. GAAP

4
earnings to be of higher quality than earnings determined using IFRS (Barth, Landsman, Lang,
and Williams 2012); and still others show that US GAAP and IFRS lead to comparable levels of
earnings quality (Gordon et al., 2010; Hughes and Sander 2008). This line of research examines
earnings management via accruals, and we extend it by studying both real and accruals methods,
allowing us to identify whether management reacts to different reporting environments by
changing the likelihood of earnings management and/or changing the method of earnings
management. In addition, these studies focus primarily on income-increasing adjustments. We
examine both earnings-increasing and earnings-decreasing adjustments, and find that real
activities are preferred when increasing earnings, while accruals methods are preferred when
decreasing earnings.
Our study also builds on existing research examining whether and how firms trade-off
real and accruals methods in response to changes in the level of regulation (Cohen et al., 2008;
Cohen and Zarowin 2010). This research focuses on U.S. firms under U.S. GAAP, and
considers regulatory changes created by SOX (Cohen et al., 2008). We also examine whether
and how firms tradeoff real and accruals methods in response to differences in the reporting
environment, but we focus on the effects of IFRS vs. US GAAP, and simultaneously consider the
main and interactive effects related to firm domicile, the direction of the earnings adjustment,
firm ownership, quality of auditor, and firm size – all of which represent important
characteristics of the reporting environment faced by the firm. Hail et al. (2010a, 2010b) note
that the effects of changes in accounting standards on earnings management may not be
predictable due to the variety of factors contributing to the level of regulation faced by the firm.
Our extension addresses this issue by simultaneously examining the effects of a number of
reporting environment characteristics, and we find that they interact in determining the
5
likelihood and method of earnings management. US firms under US GAAP, for example, appear
to prefer real activities, while all other firms (US firms under IFRS and non-US firms under both
US GAAP and IFRS) are either indifferent between real activities and accruals or prefer
accruals.
We base our method of data collection on Graham, Harvey, and Rajgopal (2005) by
asking experienced financial officers to complete a web-based exercise. We expand on Graham
et al. (2005) by including firms in non-U.S. settings, firms that report using IFRS, and asking
financial officers to respond to a case that includes manipulations of the setting designed to
induce firms to adjust earnings upward in one condition and downward in another. These
differences allow us to investigate whether many of the Graham et al. (2005) findings hold in
settings not included in their study. For example, Graham et al. (2005) find that U.S. managers
strongly prefer adjusting earnings via real activities over accruals. We replicate their results, but
extend them by showing that this conclusion may be limited to U.S. firms operating under U.S.
GAAP adjusting earnings upward. U.S. firms operating under IFRS, non-U.S. firms, and firms
adjusting earnings downward all exhibited a lower preference for real activities and, in some
cases, actually preferred accruals.
Our approach to data collection also allows us to avoid certain weaknesses inherent in
related archival studies. Dechow et al. (2010) notes, for example, that archival methods must
rely on indirect measures of earnings management, making it difficult to separate measures of
earnings management from measures of general performance. Key constructs such as
unmanaged earnings and the benchmarks most important to the firm must be measured
indirectly. DeFond (2010) argues further that this issue, a construct validity problem, may not

6
be resolvable with archival methods because actual performance measures are unobservable.3
Ewert and Wagenhofer (2005, 1115) point out that archival research often ignores adjustments
via real activities and that this exclusion likely affects the estimation of earnings management
and may overestimate the impact of various institutional safeguards to control it. Our design
circumvents these difficulties by clearly identifying unmanaged earnings, asking financial
officers to consider benchmarks important to their firms, and eliciting direct measures of the
direction, amount, and method of the earnings adjustments.4
In the next section we expand on the related literature, followed by the development of
the hypotheses. Subsequent sections describe the experimental design, results, and conclusions.
II. LITERATURE REVIEW
Earnings management occurs when management uses either its reporting discretion
(accruals) or its influence over operating, investing, or financing decisions (real activities) to
achieve a desired reporting outcome. The literature in this area is extensive and includes both
archival and experimental methods (e.g., see Healy and Wahlen 1999; Fields et al. 2001; Libby
and Seybert 2009). Three streams of research are particularly relevant to this study: (1)
differences in reporting quality between U.S. GAAP and IFRS; (2) the use of real and accruals
earnings management; and (3) the effects of principles vs. rules-based accounting.
3 Schipper (1989), Kasznik (1999), McNichols (2000), Dechow and Skinner (2000), Fields et al. (2001), Lev (2003), Schipper and Vincent (2003), Dechow et al. (2003), and Ayers et al. (2006) all discuss difficulties inherent in archival studies that attempt to infer various dimensions of reporting discretion and earnings management. Healy and Wahlen (1999) and Fields et al. (2001), for example, argue that an important limitation of archival studies is the difficulty of determining whether the measure of earnings management is attributable to operational or reporting decisions. 4 In the parlance of List (2011) and Harrison and List (2004), our study uses a “framed field experiment,” which mimics a lab experiment, except that it uses participants “drawn from the market of interest” (experienced financial officers) and conducts the study “in the natural environment of the subject” (participants make accounting and operating decisions in response to relevant expectations; List 2011, 4-5).

7
With regard to the first stream of literature, archival-based empirical research generally
shows that firms in countries using IFRS tend to engage in more earnings management than
firms in countries using U.S. GAAP. Barth et al. (2012) find that U.S. firms using U.S. GAAP
exhibit higher levels of accounting quality than non-U.S. firms using IFRS. Alford et al. (1993),
Land and Lang (2002), and Lang et al. (2003) generally show that U.S. firms using U.S. GAAP
engage in less earnings management than non-U.S. firms, and Lang et al. (2003) show further
that non-U.S. firms cross-listed in the U.S. practice less earnings management than non-U.S.
firms not cross-listed in the U.S.
In an attempt to separate the effects of differences in accounting standards from the
effects of differences in jurisdictions, Lang et al. (2006) and Bradshaw and Miller (2008)
compared measures of accounting quality of U.S. firms reporting under U.S. GAAP to that of
non-US firms required to file SEC Form 20-F reconciliations. These studies either found or
assumed that U.S. firms generally reported higher quality information, suggesting differences
across countries in how accounting standards are applied. Overall, this research area suggests
that earnings quality is greatest in U.S. firms operating under U.S. GAAP, followed by non-U.S.
firms cross-listed on U.S. exchanges, and non-U.S. firms operating under either IFRS or local
GAAP (Bradshaw and Miller 2008).5
The second stream of research—the use of real activities and accruals methods—can be
divided into two groups. The first group examines the relative preferences in general for real and
accruals earnings management. Graham et al. (2005) examine a wide range of issues, including
reporting discretion, and focus on U.S. managers, who primarily work for publicly-traded firms,
operate under U.S. GAAP, and adjust earnings upward. They find that this group prefers real
5 In contrast, in a working paper, Ahmed, Neel, and Wang (2012) find that accounting quality decreases after mandatory adoption of IFRS across 20 countries.

8
activities over accruals methods. Nelson et al. (2002) surveyed auditors and asked them to recall
client attempts to manage earnings. The auditors were more likely to recall clients’ use of
accruals over real activities. The authors recognize, however, that real earnings management is
unlikely to be a major concern for auditors because it involves no accounting manipulation.
In a review of the behavioral research in this area, Libby and Seybert (2009) note that
much evidence exists that management engages in both real and accruals methods, but none
documents conditions under which each method is preferred. However, a recent archival paper
(Zang 2012) identifies differential costs between real and accruals earnings management and
provides evidence that based on these costs firms tradeoff the use of real and accruals methods.
Another group of studies focuses on the use of real vs. accruals methods in response to
changes in the regulatory environment. Several papers suggest that tighter reporting standards
may cause firms to substitute real activities for accruals methods (Schipper 2003; Demski 2004;
and Ewert and Wagenhofer 2005). Additional research provides archival-based empirical
support for this form of substitution based on changes due to SOX regulations (Cohen et al.
2008) and in the presence of seasoned equity offerings (Cohen and Zarowin 2010). Two recent
working papers address real and accruals earnings management in an international setting.
Enomoto, Kimura, and Yamaguchi (2012) find that real activities are preferred over accruals
methods in countries where investor protection is strong; and Ipino and Parbonetti (2011) find a
decrease in accruals methods after mandatory IFRS adoption, but only in countries with strong
legal enforcement.
The third stream of research examines the impact of rules and principles-based
accounting systems on the audit function and financial reporting discretion. Trompeter (1994),
Hronsky and Houghton (2001), and Ng and Tan (2003), for example, show that auditors are

9
more likely to allow earnings management when transactions involve less precise accounting
standards. Mayhew et al. (2001) suggest that earnings management via accruals methods is more
likely under principles-based systems because it is easier to justify estimates to auditors when
standards are less precise. Hackenbrack and Nelson (1996) find that auditors also use the
imprecision in accounting standards to justify an accounting treatment consistent with their
incentives. Kadous and Mercer (2012) show that jurors return fewer verdicts for violations of
imprecise standards, and Backof, Bamber, and Carpenter (2011) find that under IFRS auditors
are more likely to agree with management earnings adjustments via accruals methods. These
findings generally support the argument that more discretionary, principles-based accounting
systems impose lower regulatory costs, yielding more earnings management via accruals
methods.6
Our study contributes to the research summarized above by directly documenting the
presumption that financial officers under IFRS perceive higher levels of allowable reporting
discretion than financial officers under U.S. GAAP. We are also the first to provide evidence
that adopting IFRS in the U.S. may not affect the overall likelihood of earnings management, but
instead may affect the mix of earnings management methods used. That is, firms may substitute
accruals for real activities when faced with the additional allowable reporting discretion
introduced by IFRS, a more principles-based accounting system. We also show that the
preference for accruals vs. real activities depends on an interaction between the system of
financial standards and the domicile of the firm. US firms under US GAAP prefer adjusting
earnings via real activities, while non-US firms and firms under IFRS (US and non-US) are
either indifferent or prefer accruals methods. Finally, we introduce to the literature the finding
6 In contrast, in a working paper, Folsom, Hribar, Mergenthaler, and Peterson (2012) provide evidence that accounting quality—as measured by informativeness, persistence, and predictive ability—increases in more principles-based GAAP standards.

10
that management’s preference for real vs. accruals methods depends on the direction of the
earnings adjustment – income-increasing adjustments rely primarily on real activities; income-
decreasing adjustments rely primarily on accruals methods.
III. THEORY AND HYPOTHESES
The financial reporting environment imposes constraints on management’s reporting
discretion, and the effectiveness of these constraints is determined by two dimensions. The
environment must first provide a means of identifying when a reporting violation has occurred
and, in the event that a violation is identified, the environment must include a significant
expected consequence to the violating firm. Leeway (or lack of guidance, monitoring, or
enforcement) in either of these two dimensions increases the extent to which management
perceives that it is allowed to use reporting discretion to achieve performance goals.
Each firm faces a unique reporting environment, and level of allowable reporting
discretion, determined by the characteristics of that environment. The set of reporting standards
under which a firm operates (U.S. GAAP or IFRS) represents one important element because it
provides a means for identifying when a reporting violation has occurred. Other important
elements of the reporting environment include firm domicile, firm ownership, auditor quality,
firm size, and even the direction of earnings adjustment because each influences the level of
allowable reporting discretion by affecting either the means of identifying a reporting violation
or the expected consequence.
We assume that management has incentives to use reporting discretion to adjust earnings
to achieve important benchmarks, and two kinds of discretion are available to do so: (1)
discretion over reporting decisions and (2) discretion over operating, investing, and financing

11
decisions. Earnings management via accruals methods is the use of reporting discretion to
achieve important benchmarks, and earnings management via real activities is the use of
discretion over operating, investing, and/or financing decisions to achieve important
benchmarks.
Firm management can respond to different levels of allowable reporting discretion by
changing its willingness to engage in earnings management and/or the mix of the methods used
to do so. In environments where allowable reporting discretion is relatively high, management
will be more willing to engage in earnings management and will prefer accruals over real
activities because accruals are precise and can be delayed until the end of the reporting period.
Adjustments via real activities must be implemented well in advance of year end, when
uncertainty exists with respect to both the effect on reported earnings of the chosen strategy and
the level of reported earnings if left unmanaged. Further, accruals do not directly disturb the
firm’s cash flows, while real activities typically do.
In reporting environments where allowable reporting discretion is relatively low,
management will practice earnings management less via accruals methods, relying more heavily
on real activities. The additional reporting regulations designed to restrict reporting discretion
force management to find a method other than accruals to achieve its reporting goals and
encourage the structuring of transactions around the “bright-line” standards. Consequently,
management will substitute real activities for accruals.7
A consensus exists that IFRS is more principles-based than U.S. GAAP (SEC 2003;
Dichev et al. 2012). Assuming that principles require greater use of management judgment than
rules, we predict that management of firms under IFRS perceives greater levels of allowable
7 These arguments are largely based on predictions from the model established by Ewert and Wagenhofer (2005), and Zang (2012) used many of these same arguments.

12
reporting discretion than management of firms under US GAAP. In addition, consistent with the
arguments articulated in this section, we predict that the likelihood of earnings management—
and the preference for accruals methods over real activities—is increasing in the level of
allowable reporting discretion perceived by management.
H1: Management of firms operating under IFRS perceives higher levels of allowable reporting discretion than management of firms operating under U.S. GAAP. H2: Firms whose management perceives higher levels of allowable reporting discretion are more likely to adjust earnings to meet benchmarks and tend to rely more heavily on accruals methods—and less heavily on real activities—than firms whose management perceives lower levels of allowable reporting discretion. H1 predicts that IFRS allows more reporting discretion than US GAAP, while H2
predicts that higher levels of reporting discretion lead to a greater likelihood of earnings
management and a preference for accruals methods over real activities. Consequently,
we predict that, compared to US GAAP, IFRS will lead to a greater likelihood of
earnings management and a preference for accruals over real activities.
H3: Firms operating under IFRS are more likely to adjust earnings to meet benchmarks and rely more heavily on accruals—and less heavily on real activities—than firms operating under U.S. GAAP.
IV. EXPERIMENTAL DESIGN
Participants
Participants consisted of 615 financial officers obtained from a business publication’s
(BP) research database, 191 (31 percent) of whom indicated that in the situation described in the

13
case their firm would adjust earnings.8 Table 1 reports descriptive statistics grouped by U.S.
GAAP and IFRS firms, and Table 2 reports descriptive statistics grouped by participants not
choosing to adjust earnings and participants choosing to adjust earnings. Panel A of Table 1
shows that 294 participants (48 percent) worked for U.S. firms and 321 (52 percent) worked for
non-U.S. firms (about evenly split between Europe and Asia).9 Both groups were dominated by
senior financial officers (almost 65 percent were CFOs, VPs or Directors of Finance).
Participants from both groups tended to be in their low to mid-forties; predominantly male (over
83 percent); have a professional accounting certification (almost 70 percent); and highly
experienced (about 20 years).
[Insert Tables 1 and 2 here]
Panel B of Table 1 shows that the firms varied from less than $100 million in sales (32
percent) to over $1 billion (21 percent); the reporting entity of about 61 percent was the firm as a
whole; over 76 percent were audited by a Big 4 auditor; and (not tabulated) manufacturing was
the industry most highly represented, followed by wholesale/retail, financial institutions, and
technology. Participants from the IFRS firms were younger (42 years vs. 44 years) and less
experienced (18 years vs. 21 years); and the IFRS firms tended to be smaller (46 percent with
<$100 million in sales vs. 24 percent for U.S. GAAP firms). Approximately 51 percent of the
firms were publicly-traded.
8 This percentage is similar to results in Burgstahler and Dichev (1997), who estimate the frequency with which firms use EM to avoid earnings decreases at 8-12 percent and to avoid losses at 30-44 percent, and Dichev et al. (2012), who find that CFOs believe about 20% of firms manage earnings in any given period. 9 European participants mostly were Northern European, with more than half from France, Germany, Spain, and the United Kingdom (other countries represented include Belgium, Denmark, Finland, Ireland, Switzerland, and Sweden). The data was collected after the mandatory adoption of IFRS by the European Union in 2005. About 80 percent of the Asian participants were from Hong Kong, India, the Philippines, and Singapore (other countries represented include China, Indonesia, Japan, and Malaysia). Most countries represented are in Leuz et al.’s (2010) analysis of reporting quality across domiciles; approximately 70 percent of the non-U.S. countries have environments that Leuz et al. classify into weaker regulatory clusters than that of the U.S.

14
Table 2 reveals no significant differences between participants who indicated that their
firms would adjust earnings and those who did not, except that those in the adjust earnings
sample were more (less) likely to be managers of profit centers (firms as a whole); and those
who chose to adjust earnings had less experience (18.3 years vs. 20.1 years). Sensitivity tests
reported later in the paper indicate that the differences identified above did not influence the
results.
Procedure
The experimental task involved a short case in which participants were asked to assume
that their firm was approaching year end, and they were provided with monetary values for both
expected unmanaged earnings and an important benchmark. We then asked participants whether
their entities would use allowable reporting discretion to increase or decrease earnings and, if so,
by how much. We also asked participants what methods (real and accruals) their entities would
use to adjust earnings, as well as various questions about their entity (e.g., reporting system,
auditors, size, ownership, important benchmarks) and themselves (i.e., demographics).
The case was designed to be completed on a web-based tool that allows researchers to
design studies and collect data. The case was extensively pilot-tested with current and former
financial officers, other academics, and representatives from the BP. We obtained participants
using an e-mail request sent by the BP. The request mentioned that we were investigating
legitimate tactics (operational and accounting) that companies use to influence reported earnings.
Participants were asked to click on a URL link to participate in the study and were told that, if
they participated, they would be eligible to receive one of four $250 American Express gift
cards. The e-mail message described the study as “a confidential survey,” and the request
reiterated that their identity would remain confidential. If respondents clicked on the link, they

15
were directed to the case.10 They saw the first page of a case titled “A Case for Financial
Officers,” and were told that the case consists of about 20 questions. A sample copy of the first
page of the case appears in Appendix A, which included a brief description of the situation
facing the financial officer.
The data used in this study is a subset of data gathered for other research purposes.11 In
total, requests in the U.S. were sent to 11,200 financial officers from two distribution lists. The
first included 1,200 financial officers who agreed to respond to a given number of annual
requests from the BP to respond to surveys. Based on feedback from the BP, we expected a 10-
20 percent response rate from this group; we received 150 total responses, representing a 12.5
percent response rate. An additional 10,000 requests were sent to the BP’s general e-mail
distribution list, for which the BP estimated a one percent response rate. We received 217
responses, a 2.2 percent response rate. These response rates compare to recent rates reported in
the accounting literature; for example, Nelson et al. (2002) report a response rate of 16 percent in
their survey of auditors from one Big 5 accounting firm, and Graham et al. (2005) report a
response rate of 8.4 percent in their survey of CFOs. In Europe (Asia), 6,262 (6,000) requests
were sent and we received 240 (324) responses, representing a 3.8 (5.4) percent response rate; in
both cases, these response rates were consistent with what BP representatives predicted.
Variable Measures
Reporting System. The reporting system (U.S. GAAP vs. IFRS) was measured by
asking the financial officers to respond to a question that asked: “Which set of financial reporting
10 We sent separate requests, each with its own URL link related to each of the versions of the case, to an equal number of financial officers for each URL in each geographic region (U.S., Europe, and Asia). 11 The case instrument contained twelve scenarios created by three variables: (1) expected unmanaged earnings was either above, equal to, or below the relevant benchmark; (2) dispersion around expected unmanaged earnings was either wide or narrow; and (3) the period of time prior to year-end was either one week or one month. The third variable was varied only within the U.S. sample. These variables appear in the tests associated with the likelihood of adjusting earnings reported later, but they are not the focus of this study and do not influence the results.

16
standards does your firm use?” Response choices included (1) Generally Accepted Accounting
Principles (U.S. GAAP); (2) International Financial Reporting Standards (IFRS); (3) Both U.S.
GAAP and IFRS; or (4) Other.12
Reporting Discretion. We measured the level of allowable reporting discretion
perceived by the financial officers by asking them to indicate the extent to which their reporting
entityt could use allowable reporting discretion to adjust earnings without violating generally
accepted accounting principles. They chose one of the following: Very little discretion (<1
percent of reported earnings); little discretion (1%- 2% of reported earnings); some discretion
(3% - 5% of reported earnings); Significant discretion (6% - 10% of reported earnings); or a
great deal of discretion (>10% of reported earnings).
Likelihood of Adjusting Earnings. We asked participants to indicate “without violating
GAAP, how would your reporting entity use allowable discretion to influence reported earnings.
This discretion could take the form of non-accounting decisions (e.g., operating, investing,
financing) or accounting choices (e.g., accounting estimates, assumptions, and/or methods).”
Participants responded by choosing “increase earnings,” “decrease earnings,” or “would not
change earnings.” The likelihood of adjusting earnings for a given group was determined by
dividing the number of participants in the group choosing to increase or decrease earnings by the
total number of group participants.
12 Ninety one of the 615 participants were from firms that reported using both U.S. GAAP and IFRS (29 U.S. and 62 non-U.S.). We classified the U.S. participants, who indicated that they use both U.S. GAAP and IFRS, as IFRS users based on the assumption that they are subsidiaries of parent companies located outside the U.S. We classified the non-U.S. participants, who indicated they use both U.S. GAAP and IFRS, as U.S. GAAP users based on the assumption that they are subsidiaries of parent companies located within the U.S. Consistent with this assumption, participants, who reported using both U.S. GAAP and IFRS, are significantly more likely to be a cost or profit center than those who report using either U.S. GAAP or IFRS (p < 0.01). Further, comparing the “U.S. GAAP and IFRS” users (n = 91) to the “U.S. GAAP or IFRS” users (n = 524) showed no other significant response differences. In tests reported later, we also exclude these participants, focusing only on US/US GAAP firms and non-US/IFRS firms. Results are similar to those reported from our main tests.

17
Method of Adjusting Earnings. We measured the relative preference for real activities
vs. accruals by asking the financial officers to respond to the following question: “How would
your reporting entity rely on the two forms of discretion to attain the increase (or decrease)
indicated in Question A1?” (11-point scale ranging from 1 = operating, investing, financing only
to 11 = accounting choices only).13
Other Important Characteristics of the Reporting Environment
In this section we discuss five firm-specific variables that may determine the level of
allowable discretion in the reporting environment (firm domicile, direction of earnings
adjustment, firm ownership, audit quality, and firm size). They are treated as control variables in
most of the tests reported later (Schipper 2005; Hail et al. 2010a).14
Firm Domicile: U.S. vs. Non-U.S. Much of the accounting literature concerned with
cross-national earnings management differences is based on the belief that the investor protection
environment is more effective in the U.S. than in non-U.S. settings (e.g., Leuz et al. 2010). A
long-standing tradition of conservative accounting exists in non-U.S. settings, and in some cases
regulators actually have encouraged earnings understatements (Joos and Lang 1994; Lamb et al.
1998; Garcia-Lara and Mora 2004). It appears, in general, that the cultural and business
environment operating in non-U.S. settings allows management more reporting discretion than is
allowed in the U.S. These arguments suggest that non-U.S. auditors are less concerned with
13 Respondents answered this question immediately after indicating the likelihoods that they would use in this situation a series of specific real and accrual methods. The answers to the questions related to the specific methods provided a validity check for the primary question used in the analysis. That is, those indicating a preference for real activities tended to attach greater likelihoods to the individual questions related to real methods, while those indicating a preference for accruals tended to attach greater likelihoods to the individual questions related to accruals methods. Additional analysis of these specific methods is provided later in the paper in Table 7. 14 Schipper (2005) recommends including regulatory environment factors as control variables, specifically arguing that domicile and ownership should be controlled for when evaluating reporting consequences between reporting regimes.

18
identifying reporting violations, and that the expected consequences are lower. Domicile was
determined directly from the respondent’s location, as separate requests were sent to addresses in
the U.S., Europe, and Asia.
Direction of Earnings Adjustment: Upward vs. Downward. Using discretion to adjust
earnings upward normally involves situations in which expected unmanaged earnings is below
the benchmark, and management is considering whether to increase earnings to avoid failing to
achieve the benchmark. Using discretion to adjust earnings downward normally involves a
situation where expected unmanaged earnings is above the benchmark, and management is
considering whether to decrease earnings to reduce the amount by which reported earnings
exceeds the benchmark. The cost to management of reporting earnings below the benchmark is
much higher than the cost of reporting earnings above the benchmark because under-
performance carries greater negative consequences for management than over-performance
(Beyer 2008; Healy and Wahlen 1999). The cost of losing one’s job, failing to receive a bonus,
and/or missing an analysts’ forecast, for example, are typically higher and more immediate than
the costs associated with setting a higher standard for next year’s performance.
These differential costs suggest that management has a stronger incentive to adjust
earnings upward in a weak year than to adjust earnings downward in a strong year. With this in
mind, auditors are more alert to and concerned with upward earnings adjustments. Similarly,
Barron et al. (2001) find that auditors are more likely to allow understatements than
overstatements, arguing that the auditor’s litigation exposure is higher for undiscovered
overstatements. Finally, conservatism is an important accounting measurement principle, which
may encourage auditors to more readily tolerate downward adjustments to earnings.
19
Together, these arguments suggest that the likelihood of identifying and acting on
potential reporting violations when management is adjusting earnings downward is lower than
when management is adjusting earnings upward. The direction of the earnings adjustment was
determined by noting whether management chose to increase or decrease earnings.15
Firm Ownership: Public vs. Private. Reporting regulations in the publicly-owned
environment allow less reporting discretion than in the privately-owned regulatory environment
because auditor monitoring is more thorough, SEC enforcement laws exist, and the threat and
expected consequences of litigation for both the auditor and management are larger. More
thorough auditor monitoring increases the likelihood of identifying reporting violations, and SEC
enforcement laws and litigation can lead to large negative consequences. The financial officers
indicated whether their firm was privately or publicly owned.
Audit Quality: Big 4 vs. Non-Big 4. The Big 4/non-Big 4 classification is often used as
a measure of audit quality, based on the premise that the additional resources available to Big 4
firms and their additional litigation and reputation exposure encourage stronger monitoring and
oversight of management’s reporting behavior. Big 4 auditors, therefore, are expected to allow
less reporting discretion than non-Big 4 auditors (Chi, Lisic, and Pevzner 2011). The financial
officers indicated whether their firm was audited by a Big 4 or non-Big 4 firm.
Firm Size. Managers in small firms are accountable for less capital owned by fewer
capital providers than are managers in large firms. Auditor monitoring is less thorough for small
firms because auditor litigation exposure is lower, thereby decreasing the likelihood of 15 Recall that the instrument included different scenarios of firm performance by the placement of the benchmark relative to expected unmanaged reported earnings: strong (unmanaged earnings > benchmark); average (unmanaged earnings = benchmark); and poor (unmanaged earnings < benchmark). We assumed that firms would adjust earnings toward the benchmark; consequently, we expected specific scenarios to induce upward and downward earnings adjustments. Of the 191 participants who chose to adjust earnings, 156 (82 percent) adjusted earnings toward the benchmark. Adjusting earnings away from the benchmark, however, was not considered unreasonable. Reasonable explanations for adjusting earnings away from the benchmark include “taking a bath” in the poor firm performance condition, and maximizing a bonus in the strong firm performance condition.

20
identifying and acting on reporting violations. The potential negative consequences for adjusting
earnings reported by small firms are less than in large firms because small-firm managers are
accountable to fewer capital providers for less capital. We measured firm size by asking the
financial officers to place their entities in one of the following categories based on annual sales:
<$100 million, $100 - $499 million, $500 million - $999 million, and >$1 billion.
Additional Questions16
Because we used the responses of financial officer as proxies for firm-level reporting
behavior, we assessed the extent to which each officer was involved in the firm’s discretionary
reporting decisions. Specifically, we asked participants to indicate “To what extent can financial
officers at your level influence the [earnings adjustment indicated earlier in the case]?” (1 = “No
influence” and 11 = “Significant influence”). The overall mean response of 8.24 (s.d. = 2.08)
significantly exceeds the scale midpoint (6.0), allowing us to conclude that the participants are
involved with their entities’ discretionary reporting decisions.
We also asked several additional questions about issues that may relate to discretionary
reporting, including (1) how discretionary accounting adjustments in a given period influence the
entity’s ability to use such discretion in future periods; (2) what is the likelihood that external
auditors would notice their discretionary adjustments; (3) if the external auditor noticed, what is
the likelihood that the auditor would raise questions about them; (4) how accurately can your
reporting entity predict reported earnings for the year; and (5) what is the importance of meeting
various benchmarks (e.g., analyst earnings forecasts, budgeted earnings, prior year’s earnings).
Few meaningful differences emerged between the U.S. GAAP and IFRS groups on these
questions. For both groups, over 84 percent believed that reported annual earnings could be 16 Appendix B includes summary statistics for responses to additional questions in graphical and/or tabular format.
21
predicted within five percent approximately one month prior to year end, and both groups
believed that using reporting discretion in the current period would have a moderate effect
(approximately 6.42 on an 11-point scale) on using discretion in future years.
In general, both groups believed that it was moderately unlikely (5.63 on an 11-point
scale) that the external auditor would notice their discretionary earnings adjustments, and neither
group believed that the external auditor was especially likely to “raise questions” about their
adjustment in the event that the auditor noticed them (6.11 on an 11-point scale). The
importance of the various benchmarks were largely the same across the two groups (budgeted
earnings was considered most important, followed by prior year’s earnings and employee bonus
threshold), but the financial officers under U.S. GAAP attributed greater importance to debt
covenants.17 Also, these results reveal that managers in our sample believe beating benchmarks
is important, in general, with 94% rating at least one benchmark at 5 (out of 7) in terms of
importance. In addition, 80% rate at least one benchmark at 6, and almost half rate at least one
benchmark at 7, or extremely important.
V. RESULTS
Univariate Tests
Univariate Pearson correlations among the primary variables are presented in Table 3.
Panel A reports results for the full sample. Most of the correlations are consistent with
expectations, and while many are significant, the size of the coefficients are not large enough to
present multicollinearity issues in the tests reported later in the paper. Specifically, firms
perceiving more reporting discretion are more likely to adjust earnings (ρ = 0.183), use IFRS (ρ
= -0.129), reside outside the U.S. (ρ = -0.100), be smaller and privately owned (ρ = -0.123 and -
17 This result is consistent with Dichev et al.’s (2012) finding that inside pressure to meet benchmarks is a significant factor in CFOs’ earnings management decisions.

22
0.103, respectively), and be audited by non-Big 4 firms (ρ = -0.119). In addition, firms under
U.S. GAAP tend to be larger (ρ = 0.166), and larger firms tend to be public (ρ = 0.327) and
audited by Big 4 auditors (ρ = 0.277). One somewhat surprising finding is that the inclination to
adjust earnings does not relate to the reporting system (ρ = -0.020) – that is, firms under IFRS
were neither more nor less likely to adjust earnings compared to firms under U.S. GAAP.
Panel B reports univariate correlation results for the sample of firms that indicated an
earnings adjustment. Results are generally consistent with Panel A and, as expected, the
preference for accruals (vis-à-vis real activities) is positively associated with higher levels of
perceived discretion (ρ = 0.156), and is higher for firms using IFRS (ρ = -0.153), non-U.S. firms
(ρ = -0.183), and firms adjusting earnings downward (ρ = -0.244).18
[Insert Table 3 here]
Hypotheses Tests
The tests of the hypotheses are contained in Tables 4, 5, and 6. Table 4 (Panel A) reports
the frequencies of the responses to the question asking respondents to indicate the level of
allowable discretionary influence over reported earnings, for all respondents and broken down by
US GAAP and IFRS. Both a Chi-square test (Chi-square = 10.83, p < 0.05) and a t-test
comparing the means across U.S. GAAP and IFRS (t = 3.21, p < 0.01) are significant, indicating
financial officers under IFRS perceive more reporting discretion than do financial officers under
U.S. GAAP.
[Insert Table 4 here]
Panel B of Table 4 reports results of multivariate analyses (via ordered logistic
regression) in which the dependent variable was a coding of 1 (very little discretion) – 5 (a great
18 The direction of the earnings adjustment is not correlated with any of the other variables. This result validates the random assignment of firm performance scenarios discussed in footnotes 15 and 21.

23
deal of discretion), and the variable of interest is the reporting system (GAAP).19 We also
control for other regulatory factors, including domicile (U.S.), firm ownership (Public), audit
quality (Big 4), and firm size (Size).
We first test whether the reporting system is associated with perceived discretion
excluding control variables other than size. These results show that financial officers under
IFRS perceive more reporting discretion than those under U.S. GAAP (coefficient = -0.424, one-
tailed p-value = 0.004). Column 2 includes all control variables expected to affect the level of
perceived discretion. The coefficient for the reporting system (GAAP) remains negative and
significant (coefficient = -0.390, one-tailed p-value =0.002). The only significant control
variable is Big 4 (coefficient = -0.479, two-tailed p-value = 0.015), indicating that firms with Big
4 auditors perceive less reporting discretion than firms with non-Big 4 auditors. All tests support
H1 - financial officers using IFRS perceive more discretionary influence over reported earnings
than those using U.S. GAAP.20
[Insert Table 5 here]
Table 5 reports the effects of the level of perceived allowable reporting discretion
(Discretion) and reporting system (GAAP) on the likelihood of adjusting earnings. In Panel A,
we first report evidence consistent with Table 2, showing that the reporting system and the
likelihood of adjusting earnings are unrelated (Chi-Square = 0.258, p-value = 0.611). In Panel B,
we control for firm size (Size), domicile (US), audit quality (Big 4), ownership (Public), the
direction of the earnings adjustment (Increase), timing, and uncertainty in unmanaged earnings.21
19 An OLS regression was also used and produced substantively the same results. 20 In unreported tests, we included interactions among GAAP and control variables. None of these interactions was significant and we, therefore, exclude from our reported results. 21 Recall that we introduced three scenarios to participants: performance (high, average, low), timing, (one month vs. one week), and uncertainty in unmanaged earnings (high vs. low). The performance manipulation was used to induce upward and downward earnings adjustments and therefore correlates highly with the direction of the earnings adjustment.

24
Only two of the variables are significant: Discretion and Performance. The significant
coefficient for Discretion (0.430, one-tailed p-value = <.0001) supports H2, showing that higher
levels of perceived allowable reporting discretion lead to a higher likelihood of adjusting
earnings independent of the method. The significant coefficient for Performance (-0.628, p-
value = 0.001) shows that participants are more likely to adjust earnings when unmanaged
earnings is below a relevant benchmark compared to when unmanaged earnings is above a
relevant benchmark. None of the other variables are significant; importantly, the reporting
system variable (GAAP) is not significant. Contrary to H3, IFRS does not appear to lead to a
greater likelihood of adjusting earnings compared to U.S. GAAP.22
[Insert Table 6 here]
In Table 6 the dependent measure is participant responses to the question: “How would
your reporting entity rely on the two forms of discretion to attain the increase (or decrease)
indicated in Question A1?” This measure uses an 11-point scale with mean values significantly
below (above) the scale midpoint of “6” indicating a preference for real (accruals) methods. The
primary independent measures are the perception of allowable reporting discretion (Discretion)
and reporting system (GAAP), and the control variables include firm size (Size), domicile (US),
ownership (Public), audit quality (Big 4), and the direction of the earnings adjustment (Increase).
Panel A reports results of a multivariate analyses using an ordered logistic regression.23
Column 1 excludes all control variables except Size and includes Discretion and GAAP as the
test variables. Discretion is positive and significant (coefficient = 0.306, one-tailed p-value =
0.028), and GAAP is negative and significant (coefficient = -0.499, one-tailed p-value = 0.034).
22 In unreported tests, we included interactions among GAAP and control variables. None of these interactions was significant and we, therefore, exclude from our reported results. In addition, we include Discretion and GAAP one at a time in the regression in unreported tests; results reveal that Discretion is positive and significant while GAAP is insignificant, consistent with reported results. 23 An OLS regression was also used and produced substantively the same results.

25
These preliminary results are consistent with firms perceiving more discretion and firms under
IFRS preferring accruals methods compared to firms under U.S. GAAP.
In column 2 we include control variables representing the reporting environment and their
interactions with the reporting system (GAAP). We include both the control variables and their
interaction with GAAP because these variables may have a direct effect on the preference for
real vs. accruals methods as well as an effect on the relationship between the reporting system
and the choice of method.
Results from this more fully specified model indicate that Discretion remains positive and
significant (coefficient = 0.301, two-tailed p-value = 0.037), while GAAP becomes insignificant.
The interaction between US and GAAP, however, is negative and highly significant (coefficient
= -1.863, two-tailed p-value = 0.005). This result indicates that the reporting environment in the
U.S., coupled with relatively tight reporting standards (U.S. GAAP), encourages U.S. firms to
prefer real over accruals methods. Other main effects significant in the regression are US
(coefficient = 0.897, two-tailed p-value = 0.095) and Increase (coefficient = -1.280, two-tailed p-
value = 0.002). These results indicate that, overall, U.S. firms prefer real methods and firms
adjusting earnings downward prefer accruals methods.
In columns 3 and 4, we provide additional evidence on the preference for real vs. accruals
methods among US firms using US GAAP by excluding from the sample US participants using
IFRS, non-US participants using US GAAP, and participants indicating they report under both
standards. We conduct analyses on this reduced sample for three reasons. First, Barth et al.
(2010) and others argue (and support empirically) that US firms using US GAAP have greater
accounting quality than non-US firms using IFRS. Therefore, we present results using only these
two groups of firms for greater comparability with these studies. Second, excluding US/IFRS

26
firms and non-US/GAAP firms eliminates many (but not all) of the firms which have voluntarily
chosen to apply GAAP or IFRS, thus, helping to mitigate concerns about self-selection into a
particular reporting regime. Third, interpretation of interactions in ordered logistic regressions is
problematic. Therefore, we eschew the need to interact US and GAAP, for example, at the
expense of the inability to discern whether the documented effect is due to reporting system or
domicile. Results are consistent with those reported in columns 1 and 2. Importantly, US/GAAP
exhibit a preference for real methods, relative to non-US/IFRS firms (coefficient = -0.744, p-
value = 0.035).
In Panel B, we examine more closely the interaction effects by separately examining
double-sorts based on GAAP/IFRS with domicile (Non-US vs. US), ownership (Private vs.
Public), audit quality (Non-Big 4 vs. Big 4), and the direction of the earnings adjustment
(Decrease vs. Increase). Note first that the significant US * GAAP interaction is driven by U.S.
firms under U.S. GAAP indicating a strong preference for real over accruals methods, while non-
U.S. firms under U.S. GAAP and IFRS and U.S. firms under IFRS indicate indifference between
real and accruals methods.
Particularly interesting is the result that U.S. firms under U.S. GAAP show a strong
preference for real over accruals methods (4.527 < 6.0), while U.S. firms under IFRS are
indifferent (6.0 = 6.0). We examined the sample of firms in the US/IFRS cell (n = 40) and those
within the cell that chose to adjust earnings (n = 14), and found that their profile differed from
the overall sample in only one way – they were more likely to be a profit or cost center. In the
overall sample 39% of the firms are profit or cost centers, compared to 67% in the US/IFRS cell.
This observation suggests that a relatively large percent of the US/IFRS firms may have been
subsidiaries of non-U.S firms under IFRS operating in the U.S. This group provides a natural

27
testing ground for the consequences associated with adopting an IFRS-like reporting system in
the U.S. That is, differences between these firms and U.S. firms under U.S. GAAP may offer
insights into how U.S. firms would respond to such a change. We found that, compared to U.S.
firms under U.S. GAAP, these firms were more inclined to substitute accruals for real methods.
Panel B of Table 6 also shows that firms choosing to adjust earnings downward were less
inclined to rely on real methods compared to firms choosing to adjust earnings upward, who
displayed a clear preference for real methods regardless of reporting system. At the other
extreme, firms under IFRS that adjusted earnings downward showed a clear preference for
accruals over real methods.
Additional Tests: Specific EM Methods
Table 7 provides additional detail about the specific methods used to adjust earnings
indicated by participants and serves two purposes - first, it provides descriptive evidence on the
specific methods preferred by firms to adjust earnings upward or downward; second, it provides
validation of the relative preference for real vs. accruals methods presented in Table 6. In Table
7 we compare preferences for two groups that the analyses thus far suggest are very different
with respect to their preferences for real vs. accruals methods - US firms under US GAAP
adjusting earnings upward (preference for real methods) and US and non-US firms under IFRS
adjusting earnings downward (preference for accruals methods).
[Insert Table 7 here]
Recall that these questions were answered by participants who indicated earlier in the
exercise that their firms would adjust earnings either upward or downward. The respondents
were asked the extent to which their firms would rely on each method listed in the first column,

28
entitled Specific Method. The description of the methods was slightly altered depending on
whether the respondent had indicated an upward or downward earnings adjustment. Column 2
indicates whether the method is considered real or accruals-based, and columns 3 and 4 provide
the mean response and (standard deviation) to each method as well as its ranking for the two
divergent groups.
The US/US GAAP group significantly prefers real over accruals methods (mean = 4.56 <
6.00), while the other group significantly prefers accruals over real methods (mean = 6.75 >
6.00). The most common methods used by the US/US GAAP group involve delaying spending
on operating items and delaying the start of new projects, both real methods. The most common
methods used by the other group involve adjusting accounting estimates, assumptions, or
methods and adjusting the timing of accounting charges, all accruals methods. Interestingly, the
third most common method used by this group is also the most common method used by US/US
GAAP group, suggesting that adjusting spending on operating items is perhaps the most common
way to adjust earnings.
Robustness Tests: US and US GAAP Interaction Analyses
In this section we discuss tests designed to evaluate the robustness of our result that firms
using US GAAP and operating in the US prefer to use real methods to adjust earnings rather than
accruals methods (Tables 6 and 7). Specifically, we address concerns that this result is driven by
variables correlated with domicile or accounting standards, but currently omitted from the
analysis. The first variable we consider is the legal and regulatory environment of the country
(Barth et al. 2012). If our result is driven by countries with common law origins and strict legal
enforcement, rather than simply being located in the US, then restricting the sample to such

29
“high regulatory” countries would make the US and US GAAP interaction result insignificant.
We follow Leuz [2010] and Leuz, Nanda, and Wysocki [2003] and identify five countries in our
sample with common law origins, strict regulator enforcement, and transparent accounting
practices: United States, United Kingdom, Hong Kong, Malaysia, and Singapore. Untabulated
results of analyses using this restricted sample are similar to those reported in Table 6, and the
inferences are identical. This evidence suggests that the U.S. regulatory environment is unique,
even among countries with strong regulatory environments.
The second variable we consider is managerial experience. Results from Table 2
indicate that managers of US GAAP firms are more experienced than managers of firms using
IFRS. If our result is driven by experienced managers, rather than US GAAP, then including
experience as an additional control should render our results on the US and US GAAP
interaction insignificant. Untabulated results of analyses including experience as an additional
control variable are similar to those reported in Table 6, and the inferences are identical.
Finally, we include identification as a profit center as an additional control variable in our
analyses. We include this variable because profit centers in our sample are more likely to report
under US GAAP than IFRS (Table 1). Additionally, Table 2 reveals that managers of profit
centers are more likely to adjust earnings than managers of whole firms. These observations
raise the possibility that the results reported in Table 6 may not be generalizable to the entire
population. However, after including identification as a profit center as an additional control
variable, the results on the US and US GAAP interaction are similar to those reported in Table 6,
and the inferences are identical.24
24 Additional untabulated results reveal that entities reporting as profit centers are larger, more likely to be public, and more likely to be audited by Big 4 auditors, when compared with entities reporting as whole firms. Accordingly, our results showing that US GAAP firms prefer real methods are stronger for a sample of only profit

30
In summary, results from these robustness tests indicate that the regulatory environment
in the U.S. appears to be distinct in that the preference for real methods is uniquely concentrated
in the US, and not in other countries with strong regulations. Also, the preference for real
methods in adjusting earnings by US firms using US GAAP is not driven by managerial
experience or profit center reporting.
VI. SUMMARY AND CONCLUSIONS
In this study we use a web-based case to examine the effect of characteristics of the
financial reporting environment on the level of financial reporting discretion perceived by
managers and the likelihood and method of earnings management. We find that financial
officers under IFRS perceive higher levels of allowable reporting discretion than those under
U.S. GAAP, and the perception of higher levels of allowable reporting discretion leads to both a
greater likelihood of earnings management and a preference for the use of accruals over real
methods. While we generated no evidence that IFRS, compared to U.S. GAAP, leads to a
greater likelihood of earnings management, we do observe that U.S. firms under U.S. GAAP
show a strong preference for real activities over accruals, while all other firms (U.S. firms under
IFRS and non-U.S. firms) are either indifferent between the two methods or prefer accruals. We
also find that firms adjusting earnings upward strongly prefer real methods. In the case of firms
adjusting earnings downward, the preference for real vs. accruals methods depends on whether
they use U.S. GAAP or IFRS - U.S. GAAP users are indifferent and IFRS users prefer accruals.
These findings suggest that differences in the level of allowable reporting discretion
defined by the reporting environments are associated with differences in the relative preference
centers (coefficient on US GAAP = -0.771, p-value = 0.04, one-tailed) versus a sample of only whole firms (coefficient on US GAAP = -0.628, p-value = 0.11, one-tailed).

31
for real activities vs. accruals. They indicate to policymakers that reporting environments that
restrict managerial reporting discretion may not necessarily lead to less earnings management,
but instead may encourage management to substitute real activities for accruals. That is,
tightening reporting standards and increasing regulations may not lead to less overall earnings
management, but rather less reliance on accruals and more reliance on real activities.
The conclusion that the heavily regulated U.S. reporting environment may be doing little
to discourage earnings management in total, changing only the way in which it is practiced, may
offer a new perspective on the benefits of reporting regulations. Under this view the primary
consequence associated with reporting regulations may be more real-based earnings adjustments
at the expense of accruals-based adjustments. Granted, real methods are not directly a form of
“cooking the books.” They are, however, often conscious choices by management to disrupt the
cash flows generated by the firm’s operating, investing, and/or financing decisions in the interest
of achieving a reporting target. Is this type of earnings management somehow preferred to the
use of accruals? Examining tradeoffs between these two forms of earnings management may be
a fruitful avenue for future research.
Our findings also suggest, on the other hand, that higher levels of reporting discretion
may not lead to more earnings management, but instead may allow managers to substitute the
use of accruals for real activities. U.S. policymakers, for example, may be interested in knowing
that a primary consequence of adopting a more “principles-based” system of reporting standards
(like IFRS) may be to encourage a shift from real activities to accruals when adjusting earnings
to meet benchmarks.
While the reporting system is certainly an important part of the financial reporting
environments, our study also finds that these environments are comprised of many elements. By

32
themselves reporting standards alone may not lead to predictable differences in the level or
nature of the earnings management practiced in the jurisdiction covered by the standards. In the
U.S., firms using U.S. GAAP exhibit stronger preferences for real activities than firms under
IFRS. Outside the U.S., however, reporting standards appear to have no effect on the method
preference. We find further that the effect on earnings management of certain characteristics of
the reporting environment may be additive. At one extreme U.S. firms under U.S. GAAP
adjusting earnings upward demonstrate a strong preference for real activities over accruals; at the
other extreme, firms under IFRS (U.S. and non-U.S.) adjusting earnings downward demonstrate
a strong preference for accruals over real activities.
Finally, our results have implications for the interpretation of prior findings in the related
literature. The current difference in the overall amount of earnings management practiced in
U.S. and non-U.S. settings may not be as large as suggested in the existing literature. It may be
that the more highly regulated U.S. business environment may be forcing U.S. managers to rely
more heavily on real activities that are more difficult for researchers to detect. For example, the
Barth et al. (2012) finding that U.S. firms using U.S. GAAP exhibit higher levels of accounting
quality may apply only to accruals, and U.S. firms may be substituting real activities for
accruals. In addition, our findings suggest that the Graham et al. (2005) finding that U.S.
managers prefer real activities over accruals may be limited to U.S. firms, operating under U.S.
GAAP, when adjusting earnings upward.

33
References
Ahmed, A., M. Neel, and D. Wang. 2012. Does Mandatory Adoption of IFRS Improve Accounting Quality? Preliminary Evidence. Working paper, Texas A&M University and University of Houston.
Alford, A., J. Jones, R. Leftwich, and M. Zmijewski, 1993. The Relative Information Content of
Accounting Disclosures in Different Countries. Journal of Accounting Research 31 (Supplement): 183-223.
Ayers, B. C., J. Jiang, and P. E. Yeung. 2006. Discretionary Accruals and Earnings Management:
An Analysis of Pseudo Earnings Targets. The Accounting Review 81 (3): 617-652. Backof, A., E.M. Bamber, and T. Carpenter. 2011. International Financial Reporting Standards
and Aggressive Reporting: An Investigation of Proposed Auditor Judgment Guidance. Working paper, University of Georgia.
Barron, O., J. Pratt, and J. Stice. 2001. Misstatement direction, litigation risk, and planned audit
investment. Journal of Accounting Research 39, 3: 449-462. Barth, M. E. W. Beaver, J. Hand, and W. Landsman. 2005. Accruals, accounting-based valuation
models, and the prediction of equity values. Journal of Accounting, Auditing & Finance 20: 311–345
Barth, M. E., W. R. Landsman, and M. H.Lang. 2008. International Accounting Standards and
Accounting Quality. Journal of Accounting Research 46 (June): 467-498. Barth, M. E., Landsman, W. R., Lang, M.H. and C. D. Williams. 2012. Are IFRS-Based and US
GAAP-Based Accounting Amounts Comparable? Journal of Accounting and Economics http://dx.doi.org/10.1016/j.jacceco.2012.03.001
Beyer, A. 2008. Financial analysts’ forecast revisions and managers’ reporting behavior.
Journal of Accounting and Economics 46, 2-3: 334-348. Bradshaw, M. T., and G. S. Miller. 2008. Will Harmonizing Accounting Standards Really
Harmonize Accounting? Evidence from Non-U.S. Firms Adopting US GAAP. Journal of Accounting, Auditing and Finance 23: 233-263.
Burgstahler, D., and I. Dichev. 1997. Earnings management to avoid earnings decreases and losses. Journal of Accounting and Economics 24, 1: 99-126.
Chi, W., L. Lisic, and M. Pevzner. 2011. Is Enhanced Audit Quality Associated with Greater
Real Earnings Management? Accounting Horizons 25, 2: 315-335. CEOs of the International Audit Network. 2008. Principles-Based Accounting Standards.
January. Also at http://www.iasplus.com/resource/0801principlesbased.pdf

34
Cohen, D., Dey, A., Lys, T., 2008. Real and accrual based earnings management in the Pre and Post Sarbanes Oxley periods. The Accounting Review 83: 757–787.
Cohen, D. A. and P. Zarowin. 2010. Accrual-based and real earnings management activities
around seasoned equity offerings. Journal of Accounting and Economics (50): 2-19 Dechow, P., R. Sloan, and A. Sweeney. 1995. Detecting Earnings Management. The Accounting
Review 70 (2): 193-225. Dechow, P. M. and D. J. Skinner. 2000. Earnings Management: Reconciling the Views of
Accounting Academics, Practitioners, and Regulators. Accounting Horizons (June): 235-50.
Dechow, P., W. Ge and C. Schrand. 2010. Understanding earnings quality: a review of the
proxies, their determinants and their consequences. Journal of Accounting and Economics 50, 2-3: 344-401.
Demski, J. S. 2004. Endogenous Expectations. The Accounting Review 79: 519-539. DeFelice, A. and M. G. Lamoreaux. 2010. The SEC’s IFRS Work Plan. Journal of Accountancy
(April): http://www.journalofaccountancy.com/Issues/2010/Apr/20102658.htm DeFond, Mark L. 2010. Earnings quality research: advances, challenges and future research.
Journal of Accounting and Economics 50, 2-3: 402-409. Dichev, I., J. Graham, C. Harvey, and S. Rajgopal. 2012. Earnings quality: evidence from the
field. Working paper, Duke University and Emory University. Enomoto, M., F. Kimura, and T. Yamaguchi. 2012. Accrual-Based and Real Earnings
Management: An International Comparison of Investor Protection. Working paper, Kobe University, Tohoku University, and Tohoku Gakuin University.
Ewert, R. and A. Wagenhofer. 2005. Economic Effects of Tightening Accounting Standards to
Restrict Earnings Management. The Accounting Review October: 1101-1124. Financial Accounting Foundation. 2009. Response to The Securities and Exchange
Commission’s (SEC) Roadmap for the Potential Use of Financial Statements Prepared In Accordance With International Financial Reporting Standards (IFRS) by U.S. Issuers. (March 11): Norwalk CT.
Fields, T. D., T. Z. Lys, and L.Vincent. 2001. Empirical Research on Accounting Choice.
Journal of Accounting and Economics 31(September): 255-307. Folsom, D., P. Hribar, R. Mergenthaler, and K. Peterson. 2012. Principles-Based Standards and
Earnings Attributes. Working paper, Lehigh University, University of Iowa, and University of Oregon.

35
Garcia-Lara, J. M., and A. Mora. 2004. Balance Sheet versus Earnings Conservatism in Europe.
European Accounting Review 13: 261-292. Gibbins, M. 2002. Discussion of: Evidence from auditors about managers and auditors’ earnings-
management decisions. The Accounting Review 77 (Supplement): 203-211. Gordon, E., B. Jorgensen, and C. Linthicum. 2010. Could IFRS replace US GAAP? A
comparison of earnings attributes and informativeness in the US market. Working paper, Temple University, University of Colorado, and UT-San Antonio.
Graham, G.R., C.R. Harvey, and S. Rajgopal. 2005. The Economic Implications of Corporate
Financial Reporting. Journal of Accounting and Economics 40: 3-73. Hackenbrack, K., and M. Nelson. 1996. Auditors’ Incentive-Compatible Application of
Professional Standards. The Accounting Review 71 (January): 43-60. Hail, L., C. Leuz, and P. Wysocki. 2010a. Global Accounting Convergence and the Potential
Adoption of IFRS by the United States (Part I): Conceptual Underpinnings and Economic Analysis. Accounting Horizons 24 (3): 355-394.
Hail, L., C. Leuz, and P. Wysocki. 2010b. Global Accounting Convergence and the Potential
Adoption of IFRS by the United States (Part II): Political Factors and Future Scenarios for U.S. Accounting Standards. Accounting Horizons 24 (4): 567-588.
Harrison, G. and J. List. 2004. Field Experiments. Journal of Economic Literature 42 (4): 1009-
55. Healy, P. M. and J. M. Wahlen. 1999. A Review of the Earnings Management Literature and its
Implications for Standard Setting. Accounting Horizons (December): 365-383. Hronsky, J. J. F., and K. A. Houghton. 2001. The meaning of a defined Accounting Concept:
Regulatory Changes and the Effect on Auditor Decision Making. Accounting, Organizations and Society 26 (2): 123-139.
Hughes, S. and J. Sander. 2008. The implications of IFRS adoption: the extent of convergence
and consistency between IFRS and US GAAP net income. Working paper, University of Vermont and Butler University.
Ipino, E. and A. Parbonetti. 2011. Mandatory IFRS Adoption: The Trade-off Between Accrual
and Real-Based Earnings Management. http://ssrn.com/abstract=2039711. Jones, H. 2012. “US Official ‘Optimistic’ on Global Accounting Move.” The Wall Street Journal
(February 20, 2012):1.

36
Joos, P. and M. Lang. 1994. The Effects of Accounting Diversity: Evidence from the European Union. Journal of Accounting Research 32 (Supplement): 141-168.
Kadous, K. and M. Mercer. 2012. Can reporting norms create a safe harbor? Jury verdicts
against auditors under precise and imprecise accounting standards. The Accounting Review 87, 2: 565-587.
Lamb, M., C. Nobes, and A. Roberts. 1998. International Variations in the Connections Between
Tax and Financial Reporting. Accounting and Business Research 28 (Summer): 173-188. Land, J., and M. Lang. 2002. Empirical Evidence on the Evolution of International Earnings. The
Accounting Review 77: 115-134. Lang, M., J. S. Raedy, and W. Wilson. 2006. Earnings Management and Cross-Listing: Are
Reconciled Earnings Comparable to U.S Earnings. Journal of Accounting and Economics 42 (October): 255-283.
Lang, M., J. Raedy and M. Yetman. 2003. How representative are Firms that are Cross Listed in
the United States? An Analysis of Accounting Quality, Journal of Accounting Research 41: 363–386.
Leuz, C. 2010. Different approaches to corporate reporting regulation: how jurisdictions differ
and why. Accounting and Business Research 40, 3: 229-256. Leuz, C., D. Nanda, and P. Wysocki. 2003. Investor protection and earnings management: an
international comparison. Journal of Financial Economics 69, 3: 505-527. Lev, B. 2003. Corporate Earnings: Facts and Fiction. Journal of Economic Perspectives (Spring):
27-50. Levitt, A. 1998. The Numbers Game. Remarks at NYU Center for Law and Business. The
Securities and Exchange Commission. Libby, R. and N. Seybert. 2009. Behavioral Studies of the Effects of Regulation on Earnings
Management and Accounting Choice. Accounting, Organizations, and Society: Essays for Anthony Hopwood (March).
List, J. 2011. Why Economists Should Conduct Field Experiments and 14 Tips for Pulling One
Off. Journal of Economic Perspectives 25 (3): 3-16. Maines, L. A., E. Bartov, P. Fairfield, D. E. Hirst, T. E. Iannaconi, R.Mallett, C. M. Schrand, D.
J. Skinner, and L. Vincent. 2003. Evaluating Concepts-Based vs. Rules-Based Approaches to Standard Setting. Accounting Horizons 17 (1): 73-89.
Mayhew, B. W., J. W. Schatzberg, and G. R. Sevcik. 2001. The Effect of Accounting
Uncertainty and Auditor Reputation on Auditor Objectivity. Auditing: A Journal of Practice & Theory 20 (2): 49-70.

37
Nelson, M. W., J. A. Elliott, and R. L. Tarpley. 2002. Evidence from Auditors about Managers’
and Auditors’ Earnings Management Decisions. The Accounting Review (Supplement): 175-202.
Ng, T. P., and H. Tan. 2003. Effects of Authoritative Guidance Availability and Audit
Committee Effectiveness on Auditors’ Judgments in an Auditor-Client Negotiation Context. The Accounting Review 78 (3): 801-818.
Pownall, G. and K. Schipper. 1999. Implications of Accounting Research for the SEC’s
Consideration of International Accounting Standards for U.S. Securities Offerings. Accounting Horizons. 13 (September): 259-280.
Schipper, K. 1989. Commentary on Earnings Management.Accounting Horizons (December):
91-102). Schipper K. 2003. Principle-Based Accounting Standards. Accounting Horizons 17 (1): 51-72. Schipper K. and L. Vincent. 2003. Earnings Quality. Accounting Horizons. (Supplement): 97-
110. Schipper, K. 2005. The Introduction of International Accounting Standards in Europe:
Implications for International Convergence. European Accounting Review 14: 101-126. SEC. 2003. Study Pursuant to Section 108d of the Sarbanes-Oxley Act of 2002 on the Adoption
by the United States Financial Reporting System of a Principles-Based Accounting System. (July 26). Washington D.C. Also at http://www.iasplus.com/resource/secprinciples.pdf.
SEC. 2007. Concept Release on Allowing U.S. Issuers To Prepare Financial Statements in
Accordance With International Financial Reporting Standards; Proposed Rule. (Tuesday, August 14). Washington D.C. Also at http://www.sec.gov/rules/concept/2007/33-8831fr.pdf.
SEC. 2008. Acceptance From Foreign Private Issuers of Financial Statements Prepared in
Accordance with International Financial Reporting Standards without Reconciliation to U.S. GAAP; Final Rule. (Friday, January 4). Federal Register. Washington D.C. Also at http://www.sec.gov/rules/final/2008/33-8879fr.pdf.
Trompeter, G. 1994. The Effect of Partner Compensation Schemes and Generally Accepted
Accounting Principles on Audit Partner Judgment. Auditing: A Journal of Practice & Theory 13: 56-71.
Zang, A. 2012. Evidence on the trade-off between real activities manipulation and accrual-
based activities earnings management. The Accounting Review 87, 2: 675-703.

38
APPENDIX A
First Screen of Survey Instrument
A CASE FOR FINANCIAL OFFICERS This survey consists of about 20 questions.
Timing It is (just over one month or one week) before the end of your reporting year.
Earnings Benchmark
Your reporting entity is aware that its most important earnings target or benchmark (e.g., analyst forecast, last year’s earnings, employee bonus threshold, budgeted earnings) is ($434 or $450 or $466) for the year.
Estimated Earnings Based on information from the financial reporting system, estimated reported earnings for your reporting entity for the year will fall somewhere between ($435 and $465 or $449 or $451), with any number in the range being equally likely.
A1. Without violating Generally Accepted Accounting Principles (GAAP), how would your reporting entity use allowable discretion to influence reported earnings? The discretion could take the form of non-accounting decisions (e.g., operating, investing, or financing) and/or accounting choices (e.g., accounting estimates, assumptions, or methods.
Increase earnings
Decrease earnings
Would not change earnings
A1a. By how much (in dollars)? If you indicated no change, please enter 0.
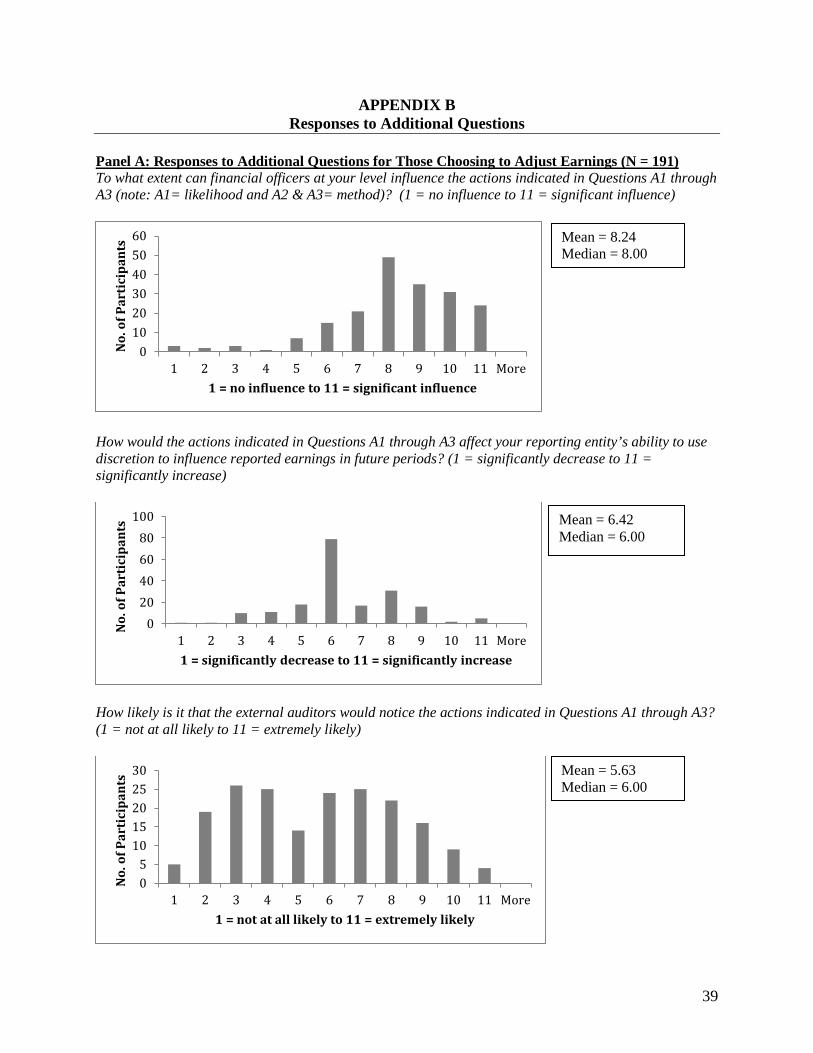
39
APPENDIX B Responses to Additional Questions
Panel A: Responses to Additional Questions for Those Choosing to Adjust Earnings (N = 191) To what extent can financial officers at your level influence the actions indicated in Questions A1 through A3 (note: A1= likelihood and A2 & A3= method)? (1 = no influence to 11 = significant influence)
How would the actions indicated in Questions A1 through A3 affect your reporting entity’s ability to use discretion to influence reported earnings in future periods? (1 = significantly decrease to 11 = significantly increase)
How likely is it that the external auditors would notice the actions indicated in Questions A1 through A3? (1 = not at all likely to 11 = extremely likely)
0102030405060
1 2 3 4 5 6 7 8 9 10 11 More
No.
of P
arti
cipa
nts
1 = no influence to 11 = significant influence
020406080
100
1 2 3 4 5 6 7 8 9 10 11 More
No.
of P
arti
cipa
nts
1 = significantly decrease to 11 = significantly increase
05
1015202530
1 2 3 4 5 6 7 8 9 10 11 More
No.
of P
arti
cipa
nts
1 = not at all likely to 11 = extremely likely
Mean = 8.24 Median = 8.00
Mean = 6.42 Median = 6.00
Mean = 5.63 Median = 6.00

40
APPENDIX B (continued) Responses to Additional Questions
Panel A (continued): Responses to Additional Questions for Those Choosing to Adjust Earnings (N = 191) If the external auditors noticed these actions, how likely is it that they would raise questions about them? (1 = not at all likely to 11 = extremely likely)
Panel B: Responses to Questions Regarding Important Benchmarks for the Full Sample (N = 615) With just over one month remaining in a typical reporting year, how accurately can your reporting entity predict reported earnings for the year? Response Very accurately (within +/- 1%) Somewhat accurately (within +/- 5%) Not very accurately (within +/- 10%) Not at all accurately (within +/- 20%)
N (%) 129 (21.0%) 390 (63.4%) 89 (14.5%) 7 (1.1%)
Please rate the importance to your reporting entity of meeting each of the following: (1 = not at all important to 7 = extremely important) Benchmark Mean Median % Ranking >= 5 Budgeted earnings 5.53 6.00 79.7% Prior year’s earnings 4.57 5.00 54.8% Bonus threshold 4.42 5.00 50.9% Debt covenant terms 4.33 5.00 52.8% Analyst earnings forecast 4.13 5.00 50.6% Industry-wide metric 3.86 4.00 38.2%
Sum % Participants choosing at least one benchmark >= 5 578 94.0% Participants choosing at least one benchmark >= 6 492 80.0% Participants choosing at least one benchmark = 7 301 48.9% This appendix depicts frequency analyses based on responses to six additional questions asked of participants choosing to adjust earnings (Panel A) and the full sample of participants (Panel B).
05
1015202530
1 2 3 4 5 6 7 8 9 10 11 More
No.
of P
arti
cipa
nts
1 = not at all likely to 11 = extremely likely
Mean = 6.11 Median = 6.00

41
TABLE 1 Participant and Entity Demographics: US GAAP vs. IFRS
Panel A: Participant Demographics US GAAP IFRS Total Domicile***a US 254 (65.3) 40 (17.7) 294 (47.8) Non-US 135 (34.7) 186 (82.3) 321 (52.2) Position a Senior Finance Executive (e.g., CFO, Director or VP of Finance)
243 (62.4) 154 (68.0) 397 (64.6)
Treasurer 5 (1.3) 3 (1.3) 8 (1.3) Controller/Chief Accounting Officer
105 (27.0) 57 (25.2) 162 (26.3)
Other 36 (9.3) 11 (4.9) 47 (7.6) Age*** b
44.48 (8.51)
42.43 (7.65)
43.73 (8.26)
Experience*** b
20.53 (7.62)
17.73 (7.36)
19.51 (7.64)
Gender a Male 324 (84.4) 180 (81.4) 504 (83.3) Female 60 (15.6) 41 (18.6) 101 (16.7) Professional Accounting Certification a
Yes 269 (70.2) 151 (68.3) 420 (69.5) No 114 (29.8) 70 (31.7) 184 (30.5)

42
TABLE 1 (continued) Panel B: Entity Characteristics US GAAP IFRS Total Size ***a $1 Billion or Greater
88 (22.6) 38 (16.8) 126 (20.5)
$500-999 Million 71 (18.3) 21 (9.3) 86 (14.0) $100-499 Million 141 (36.2) 64 (28.3) 205 (33.3) <$100 Million 95 (24.4) 103 (45.6) 198 (32.2) Public or Privatea Public 205 (52.7) 110 (48.7) 315 (51.2) Private 184 (47.3) 116 (51.3) 300 (48.8) Reporting Entity**a Firm as a Whole 235 (60.4) 140 (61.9) 375 (61.0) Profit Center 119 (30.6) 67 (29.6) 186 (30.2) Cost Center 31 (8.0) 11 (4.9) 42 (6.8) Other 3 (0.8) 8 (3.5) 11 (1.8) Auditora Big 4 288 (74.0) 183 (81.0) 471 (76.6) Non-Big 4 95 (24.4) 39 (17.3) 134 (21.8) Not audited 6 (1.5) 4 (1.8) 10 (1.6) This table presents descriptive statistics from a survey of individual participants and their firms for the full sample of 615 participants with required data. Non-US participants are from Europe or Asia. *** p < 0.01; ** p < 0.05; * p <0.10 based on Chi-squared test of difference between US GAAP and IFRS when based on frequencies, and t-test of differences between US GAAP and IFRS if based on means within cells (US GAAP vs. IFRS). All reported p-values are two-tailed.
a Number in tables represent raw number of participants (percentage of total within cell). b Numbers in tables represent means (standard deviations).

43
TABLE 2 Participant and Entity Demographics: Adjust Earnings (AE) vs. Did Not Adjust Earnings
(No AE) Panel A: Participant Demographics No AE AE Total Reporting Systema US GAAP 271 (63.9%) 118 (61.8%) 389 (63.3%) IFRS 153 (36.1%) 73 (38.2%) 226 (36.7%) Domicilea US 206 (48.6%) 88 (46.1%) 294 (47.8) Non-US 218 (51.4%) 103 (53.9%) 321 (52.2) Position a Senior Finance Executive (e.g., CFO, Director or VP of Finance)
273 (64.5%) 124 (64.9%) 397 (64.6)
Treasurer 6 (0.9%) 2 (1.1%) 8 (1.3) Controller/Chief Accounting Officer
111 (18.1%) 51 (26.7%) 162 (26.3)
Other 33 (5.4%) 14 (7.3%) 47 (7.6) Age* b
44.14 (8.42) 42.81 (7.84) 43.73 (8.26)
Experience*** b
20.06 (7.73) 18.28 (7.30) 19.51 (7.64)
Gender a Male 347 (83.2%) 157 (83.5%) 504 (83.3) Female 70 (16.8%) 31 (16.5%) 101 (16.7) Professional Accounting Certification a
Yes 291 (69.8%) 129 (69.0%) 420 (69.5) No 126 (30.2%) 58 (31.0%) 184 (30.5)

44
TABLE 2 (continued) Panel B: Entity Characteristics No AE AE Total Size a $1 Billion or Greater
84 (19.8%) 42 (22.0%) 126 (20.5)
$500-999 Million 59 (13.9%) 27 (14.1%) 86 (14.0) $100-499 Million 139 (32.8%) 66 (34.6%) 205 (33.3) <$100 Million 142 (33.5%) 56 (29.3%) 198 (32.2) Public or Privatea Public 213 (50.2%) 102 (53.4%) 315 (51.2) Private 211 (49.8%) 89 (46.6%) 300 (48.8) Reporting Entity*** a Firm as a Whole 273 (64.4%) 102 (53.7%) 375 (61.0) Profit Center 113 (26.7%) 73 (38.4%) 186 (30.2) Cost Center 32 (7.6%) 10 (5.3%) 42 (6.8) Other 6 (1.4%) 5 (2.6%) 11 (1.8) Auditora Big 4 323 (76.2%) 148 (77.5%) 471 (76.6) Non-Big 4 95 (22.4%) 39 (20.4%) 134 (21.8) Not audited 6 (1.4%) 4 (2.1%) 10 (1.6) This table presents descriptive statistics from a survey of individual participants and their firms for the full sample of 615 participants with required data. Non-US participants are from Europe or Asia. *** p < 0.01; ** p < 0.05; * p <0.10 based on Chi-squared test of differences between participants choosing to adjust earnings and participants choosing to leave earnings unchanged when based on frequencies and t-test of differences between participants choosing to adjust earnings and participants choosing to leave earnings unchanged if based on means within cells (EM = 0 vs. EM > 0). All reported p-values are two-tailed.
a Number in tables represent raw number of participants (percentage of total within cell). b Numbers in tables represent means (standard deviations).

45
TABLE 3 Pearson Correlations
Panel A: Full Sample AE Size Discretion GAAP US Public Big4 AE 1.00000 Size 0.03476 1.00000 0.3895 Discretion 0.18264 -0.12324 1.00000 <0.0001 0.0022
GAAP -0.02049 0.16639 -0.12854 1.00000 0.6120 <0.0001 0.0014
US -0.02327 0.28244 -0.10023 0.45939 1.00000 0.5647 <0.0001 0.0129 <0.0001
Public 0.02932 0.32704 -0.10313 0.03884 -0.01684 1.00000 0.4680 <0.0001 0.0105 0.3363 0.6769
Big4 0.01429 0.27666 -0.11868 -0.07898 -0.15498 0.39758 1.00000 0.7236 <0.0001 0.0032 0.0503 0.0001 <0.0001
Panel B: AE Sample Act/Acc Size Discr. GAAP US Public Big4 Increase Act/Acc 1.0000 Size -0.0221 1.0000 0.7618 Discretion 0.1575 -0.0646 1.0000 0.0295 0.3744
GAAP -0.1528 0.1819 -0.1046 1.0000 0.0348 0.0118 0.1499
US -0.1826 0.2824 -0.1032 0.4244 1.0000 0.0115 <0.0001 0.1555 <0.0001
Public -0.0760 0.2767 -0.0559 0.0213 0.0001 1.0000 0.2963 0.0001 0.4428 0.7703
Big4 -0.0189 0.2654 -0.1468 -0.1402 -0.1808 0.2755 1.0000 0.7961 0.0002 0.0428 0.0531 0.0123 0.0001
Increase -0.2441 0.0778 0.0649 0.1132 0.1079 0.0907 0.0802 1.0000 0.0007 0.2845 0.3721 0.1189 0.1374 0.2121 0.2700
This table reports univariate Pearson correlations for independent variables. Panel A reports results from the full sample (N = 615) and Panel B reports results from the sample indicating an earnings adjustment (N = 191). Size is coded 1 (small) to 5 (big); GAAP = 1 if firms uses GAAP, and 0 otherwise; US = 1 if the firm is domiciled in the US, and 0 otherwise; Public = 1 if the firm is public, and 0 otherwise; Big4 = 1 if the firm is audited by a Big 4 auditor, and 0 otherwise. AE = 1 if the firm chooses to adjust earnings and 0 otherwise, Increase = 1 if participants increased earnings and 0 otherwise, and Discretion is participants’ response to the question: “…to what extent can your reporting entity use allowable discretion to influence reported earnings (i.e., without violating GAAP)?”: 1 (very little) to 5 (a great deal). Correlation coefficients are presented with p-values below. Act/Acc represents responses to the question: “How would your reporting entity rely on the two forms of discretion to attain the increase (or decrease) indicated in Question A1?” (11-point scale ranging from 1 = operating, investing, financing only to 11 = accounting choices only).

46
TABLE 4 Discretionary Influence over Reported Earnings (Full Sample: N = 615)
Panel A: Univariate Analysis Question: All US GAAP IFRS ** Discretionary influence over reported earnings: Very little (<1% of reported earnings) Little (1%-2% of reported earnings) Some (3%-5% of reported earnings) Significant (6%-10% of reported earnings) A great deal (>10% of reported earnings)
129 (21.0%) 181 (29.4%) 238 (38.7%) 49 (8.0%) 18 (2.9%)
91 (23.4%)
123 (31.6%) 141 (36.2%) 25 (6.4%) 9 (2.3%)
38 (16.8%) 58 (25.7%) 97 (42.9%) 24 (10.6%)
9 (4.0%)
Mean 2.42 2.33 2.59+++ Standard deviation 1.00 0.98 1.02
** indicates significance at the p < 0.05 level based on a Chi-square test of differences in frequencies between GAAP and IFRS (Chi-square = 10.83). +++ indicates significance at the p < 0.01 level based on a t-test comparing difference in means for GAAP vs. IFRS. Panel B: Multivariate Analysis: DV: Discretionary Influence over Reported Earnings—(1) very little to (5) a great deal
Ordered Logistic (1) (2)
Size -0.162*** -0.075 0.014 0.309 GAAP -0.424+++ -0.390++ 0.004 0.020 US -- -0.183 -- 0.323 Public -- -0.171 -- 0.302 Big4 -- -0.479** -- 0.015 This table presents results of tests for Hypothesis 2 regarding participants’ perception of accounting discretion. Panel A presents a univariate analysis, while Panel B presents multivariate analysis using an ordered logistic regression and ordinary least squares regression. Dependent variable is participants’ response to the question: “…to what extent can your reporting entity use allowable discretion to influence reported earnings (i.e., without violating GAAP)?” Size is coded 1 (small) to 5 (big); GAAP = 1 if firms uses GAAP, and 0 otherwise; US = 1 if the firm is domiciled in the US, and 0 otherwise; Public = 1 if the firm is public, and 0 otherwise; Big4 = 1 if the firm is audited by a Big 4 auditor, and 0 otherwise. Two-tailed p-values are reported below coefficient estimates. ***, **, and * indicate significance of two-tailed tests at the 0.01, 0.05 and 0.10 levels. +++, ++, and + indicate significance of one-tailed tests at the 0.01, 0.05 and 0.10 levels. Values for intercepts are suppressed.

47
TABLE 5 Likelihood of Adjusting Earnings (AE): Multivariate Analysis
Panel A: Univariate Analysis of Accounting Standards and AE Likelihood
US GAAP IFRS Total AE Yes: N (%) 118 (30.3%) 73 (32.3%) 191 AE No: N (%) 271 (69.7%) 153 (67.7%) 424
Total 389 226 615 Chi-Square = 0.258, p-value = 0.611 Panel B: Multivariate Analysis of Discretion, Accounting Standards, and AE DV: Pr (AE > 0)
Logistic Model (1) (2)
Size 0.113 0.104 0.134 0.242 Discretion 0.418+++ 0.430+++ <0.001 <0.001 GAAP -0.028 0.069 0.881 0.753 US -- -0.039 -- 0.883 Public -- 0.107 -- 0.615 Big4 -- 0.036 -- 0.884 Performance -- -0.628*** -- 0.001 Timing -- 0.138 -- 0.598 Uncertainty -- -0.175 -- 0.335
See Table 1 for sample description and variable definitions. Performance = 1 if expected unmanaged earnings is equal to or greater than the relevant benchmark, and 0 otherwise. Uncertainty =1 if the range of expected unmanaged earnings is wide, and 0 otherwise. This table reports results for the likelihood of earnings management for the full sample of participants and absolute value of magnitude of earnings management for the sample of firms that chose to adjust earnings. Columns (1) and (2) report results from a logistic regression where the dependent variable is binary, and answers the following question: “Without violating GAAP, how would your reporting entity use allowable discretion to influence reported earnings?”. Choices included “increase”, “decrease”, and “would not change”. Increases and decreases are coded as 1, while no changes are coded as 0. Columns (3) and (4) report results from an ordered logistic regression where the dependent variable is the quintile-ranked value of the absolute value of the earnings adjustment. ***, **, and * indicate significance at the 0.01, 0.05 and 0.10 levels. +++, ++, and + indicate significance of one-tailed tests at the 0.01, 0.05 and 0.10 levels. Values for intercept are suppressed.

48
TABLE 6 Earnings Adjustment Method: Real vs. Accruals (AE Sample)
Panel A: Multivariate Analysis (ordered logistic regression) DV: Reliance on (1) real activities to (11) accruals
AE > 0 Sample
US/GAAP & non-US/IFRS
(1) (2) (3) (4) Size 0.009 0.107 0.044 0.065 0.942 0.428 0.768 0.682 Discretion 0.306++ 0.301++ 0.291+ 0.305+ 0.028 0.037 0.066 0.057 GAAP -0.499++ -1.195 -0.795++ -0.744++ 0.034 0.130 0.014 0.035 US -- 0.897* -- -- -- 0.095 -- -- US*GAAP -- -1.863*** -- -- -- 0.005 -- -- Public -- -0.565 -- -0.060 -- 0.171 -- 0.862 Public*GAAP -- 0.280 -- -- -- 0.634 -- -- Big4 -- -0.967 -- -0.093 -- 0.233 -- 0.814 Big4*GAAP -- 1.155 -- -- -- 0.215 -- -- Increase -- -1.280*** -- -0.680* -- 0.002 -- 0.057 Increase*GAAP -- 0.508 -- -- -- 0.419 -- --
N = 191 133 Panel B: Interaction Analyses: Mean of Earnings Adjustment Method (Number of Participants in Cell)
US GAAP IFRS Non-US 5.659 (44) 5.644 (59) US 4.527### (74) 6.000 (14) Private 5.056### (54) 6.029 (35) Public 4.859### (64) 5.421 (38) Non-Big 4 4.750## (32) 7.000 (11) Big 4 5.023### (86) 5.484# (62) Decrease 5.548 (31) 6.815^^^ (27) Increase 4.736### (87) 5.065### (46)

49
TABLE 6 (continued) Earnings Adjustment Method: Real vs. Accruals (AE Sample)
This table presents results of tests examining the relation between accounting standards and earnings adjustment method. Panel A reports results from an ordered logistic regression and OLS regression, which controls for other features of the regulatory environment. Panel B reports results of analyses of various interactions between accounting standards and regulatory variables. ***, **, and * [+++, ++, and +] indicates significance, two-tailed [one-tailed] different from zero at the 0.01, 0.05, and 0.10 levels. ### indicates significance less than the midpoint (6) of the range of EM methods. ^^^ indicates significance greater than the midpoint (6) of the range of earnings adjustment methods.

50
TABLE 7 Earnings Adjustment Method: Real vs. Accruals (Extended Analysis)
Specific Method
Real or Accruals
US/GAAP; Increasers Mean (s.d.)
Non-US/IFRS; Decreasers Mean (s.d.)
Accelerate (delay) sales efforts to induce customers to buy before year end.
Real 4.09 (2.31)
5 2.27 (1.80)
9
Accelerate (delay) processing orders or performing services.
Real 4.38 (2.45)
3 2.38 (1.77)
8
Delay (accelerate) spending on operating items (e.g. advertising, maintenance).
Real 5.38 (1.82)
1 3.83 (1.97)
3
Delay (accelerate) spending on research and development.
Real 3.91 (2.15)
6 3.04 (2.09)
5
Delay (accelerate) the start of new projects or acquisition of assets.
Real 4.53 (2.09)
2 3.21 (1.83)
4
Sell investments or assets this year to recognize a gain (loss).
Real 3.04 (1.80)
7 2.41 (2.17)
7
Early debt retirement to recognize a gain (loss).
Real 2.31 (1.46)
9 2.86 (2.17)
6
Adjust accounting estimates (e.g., reserves), assumptions, or methods.
Accruals 4.18 (2.00)
4 4.83 (1.93)
1
Adjust timing of an accounting charge (e.g., restructuring).
Accruals 2.96 (1.84)
8 4.00 (2.05)
2
Overall: 1 = OFI only to 11 =
accounting only -- 4.56
(2.33) -- 6.75
(2.29) --
N 55* 24*
This table presents means and standard deviations of responses to the detailed question: “In general, if your reporting entity were to use allowable discretion to increase or decrease reported earnings, how likely is it that it would use the following?”. Answers to this detailed question are not used in hypothesis testing, but are rather presented for descriptive purposes. The bottom row presents mean and standard deviation of responses to the summary question: “In general, how would your reporting entity rely on the two forms of discretion to increase or decrease reported earnings?”. The answer to this summary question is used as the dependent variable for results presented in Table 6. Results are presented for US/GAAP firms increasing earnings, and non-US/IFRS firms decreasing earnings. Means (standard deviations) and rankings are presented. * Not all participants answered the first, detailed question. The sample size reported is based on the maximum number of participants responding.